Evolution Mining Limited ABN 74 084 669 036 Sydney Office P +61 2 9696 2900 F +61 2 9696 2901 Level 24 175 Liverpool Street Sydney NSW 2022 www.evolutionmining.com.au ASX Announcement 13 August 2020 RED LAKE 11 MILLION OUNCE JORC CODE MINERAL RESOURCE Key Highlights ▪ Mineral Resource estimate of 48.1Mt grading 7.1g/t for 11.0Moz ▪ Potential to optimise a large, long-life mining operation ▪ Presents significant upside to Evolution’s initial Red Lake investment case Evolution Mining Limited (ASX: EVN) is pleased to announce the results of the 31 December 2019 Mineral Resource for the recently acquired Red Lake gold operation in Ontario, Canada. This new estimate incorporates Evolution’s estimation methodology and is reported in accordance with the JORC Code 2012 1 . The Red Lake Mineral Resource estimate is 48.08 million tonnes grading 7.10 grams per tonne for 11.0 million ounces gold 2 . Indicated and Inferred Mineral Resources are reported at 5.69 million ounces and 5.29 million ounces respectively. This is materially higher than what was estimated during the due diligence which provided justification to proceed with the acquisition of the operation. The estimate was completed over a five-month period whereby Evolution engaged Toronto-based mining consulting firm Roscoe Postle Associates Inc. (RPA) to undertake modelling work for the Red Lake and Campbell deposits. Mana Hill Consulting, a Brisbane based resource consulting firm, also assisted with revisions of the Cochenour and HG Young deposits. Key drivers in the substantial resource increase are related to evaluating each mineral deposit at a wider range of cut-off grades than considered by prior owners. This approach allows Evolution to unlock mineralised areas within the mine footprint that were never previously modelled due to not meeting the historically high cut-off grades. Evolution’s approach to lowering operating cost assumptions at Red Lake (benchmarked against the Company’s other underground operations as well as other similar scale operations) has enabled the inclusion of lower cut-off grades in this Mineral Resource update. Similar Mineral Resource increases were realised at Upper and Lower Red Lake, Lower Campbell and Cochenour as illustrated in Table 1. Work has commenced on the estimation of the Red Lake Ore Reserves which is planned to be released with Evolution’s Annual Group Mineral Resources and Ore Reserves Statement in the March 2021 quarter. Ore Reserves will be estimated using Evolution’s gold price assumption of A$1,450 per ounce. Commenting on the expanded Red Lake resources, Evolution Executive Chairman, Jake Klein, said: “This 11 million ounce Mineral Resource indicates that Red Lake has the potential to be the most transformative, value-creating opportunity in Evolution’s history. It is a great example of applying a different lens to an opportunity and emerging with completely different results. The next steps will be to complete a new Ore Reserve estimate which we expect will result in a material upgrade to reserves and will present us the opportunity to re- imagine the future of the operation. We are very excited about the potential at Red Lake.” For personal use only
Transcript
Evolution Mining Limited
ABN 74 084 669 036
Sydney Office P +61 2 9696 2900 F +61 2 9696 2901
Level 24 175 Liverpool Street Sydney NSW 2022
www.evolutionmining.com.au
ASX Announcement 13 August 2020
RED LAKE 11 MILLION OUNCE JORC CODE MINERAL RESOURCE
Key Highlights
▪ Mineral Resource estimate of 48.1Mt grading 7.1g/t for 11.0Moz ▪ Potential to optimise a large, long-life mining operation ▪ Presents significant upside to Evolution’s initial Red Lake investment case
Evolution Mining Limited (ASX: EVN) is pleased to announce the results of the 31 December 2019 Mineral Resource for the recently acquired Red Lake gold operation in Ontario, Canada. This new estimate incorporates Evolution’s estimation methodology and is reported in accordance with the JORC Code 20121.
The Red Lake Mineral Resource estimate is 48.08 million tonnes grading 7.10 grams per tonne for 11.0 million ounces gold2. Indicated and Inferred Mineral Resources are reported at 5.69 million ounces and 5.29 million ounces respectively. This is materially higher than what was estimated during the due diligence which provided justification to proceed with the acquisition of the operation. The estimate was completed over a five-month period whereby Evolution engaged Toronto-based mining consulting firm Roscoe Postle Associates Inc. (RPA) to undertake modelling work for the Red Lake and Campbell deposits. Mana Hill Consulting, a Brisbane based resource consulting firm, also assisted with revisions of the Cochenour and HG Young deposits.
Key drivers in the substantial resource increase are related to evaluating each mineral deposit at a wider range of cut-off grades than considered by prior owners. This approach allows Evolution to unlock mineralised areas within the mine footprint that were never previously modelled due to not meeting the historically high cut-off grades. Evolution’s approach to lowering operating cost assumptions at Red Lake (benchmarked against the Company’s other underground operations as well as other similar scale operations) has enabled the inclusion of lower cut-off grades in this Mineral Resource update. Similar Mineral Resource increases were realised at Upper and Lower Red Lake, Lower Campbell and Cochenour as illustrated in Table 1.
Work has commenced on the estimation of the Red Lake Ore Reserves which is planned to be released with Evolution’s Annual Group Mineral Resources and Ore Reserves Statement in the March 2021 quarter. Ore Reserves will be estimated using Evolution’s gold price assumption of A$1,450 per ounce.
Commenting on the expanded Red Lake resources, Evolution Executive Chairman, Jake Klein, said:
“This 11 million ounce Mineral Resource indicates that Red Lake has the potential to be the most transformative, value-creating opportunity in Evolution’s history. It is a great example of applying a different lens to an opportunity and emerging with completely different results. The next steps will be to complete a new Ore Reserve estimate which we expect will result in a material upgrade to reserves and will present us the opportunity to re-imagine the future of the operation. We are very excited about the potential at Red Lake.”
For
per
sona
l use
onl
y
Evolution Mining Limited 2
Mineral Resource Estimation
The new models incorporate over seven million metres of historic drilling, 85% of which was completed in the last 20 years (Figure 1). Resource modelling was based on a first principles approach where geological domains were wireframed utilising grade information from a database containing six million drill sample assay results. Resources have been reported for grade blocks classified as Inferred or better in wireframes constrained by mining shapes optimised at a cut-off grade of 3.3g/t gold except for Cochenour and HG Young, where 3g/t gold and 3.2g/t gold were applied respectively. Cut-off assumptions, summarised in Appendix 2, reflect Evolution’s plan to transform the Red Lake Operations which is expected to result in significant cost reductions. The underground mining shape optimiser (MSO) for Mineral Resources assumed a gold price of A$2,000/oz, consistent with Evolution’s Australian operations. Mining parameters assumed minimum mining widths ranging from 1.8 to 2.4 metres utilising mechanised mining methods. A two-metre buffer was created around all prior workings in the upper areas of the Red Lake and Campbell orebodies. Mineralisation within the buffer was excluded from the estimate. The geological modelling simplified the estimates into 19 individual models which have been reduced from 142 pre-existing separate block models. Each model carries inherent geological boundary dilution as a result of variation between block model and geological wireframe volumes.
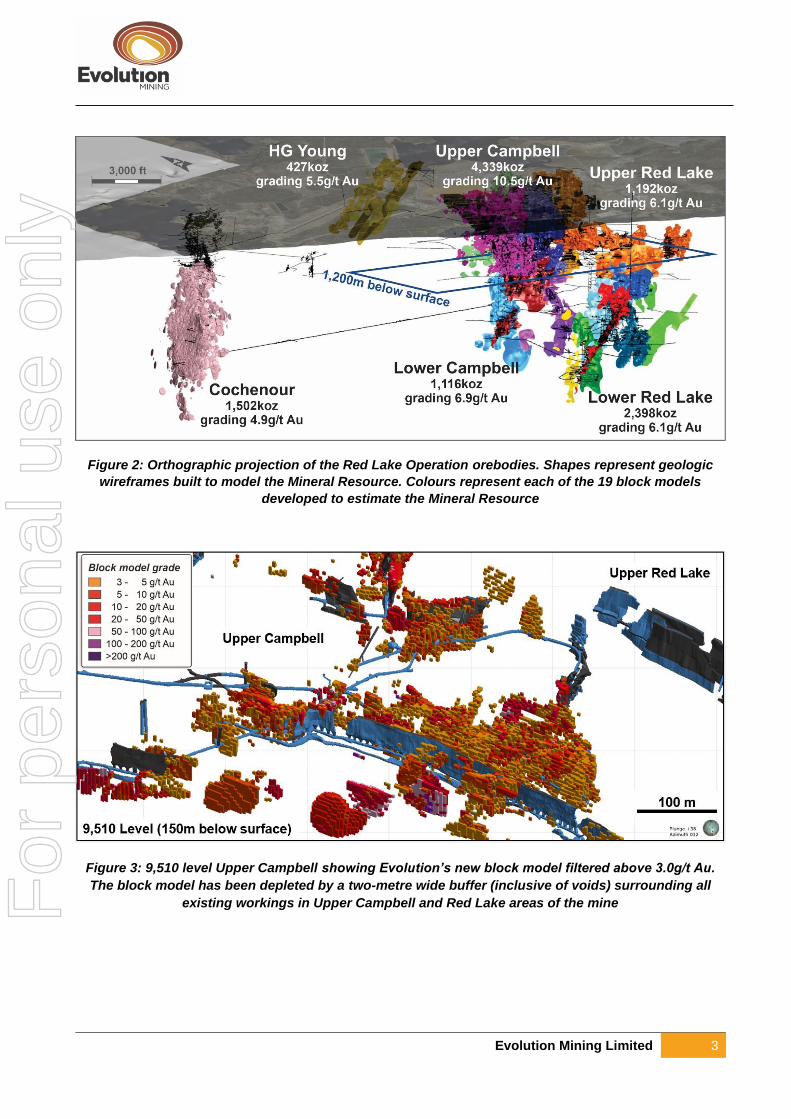
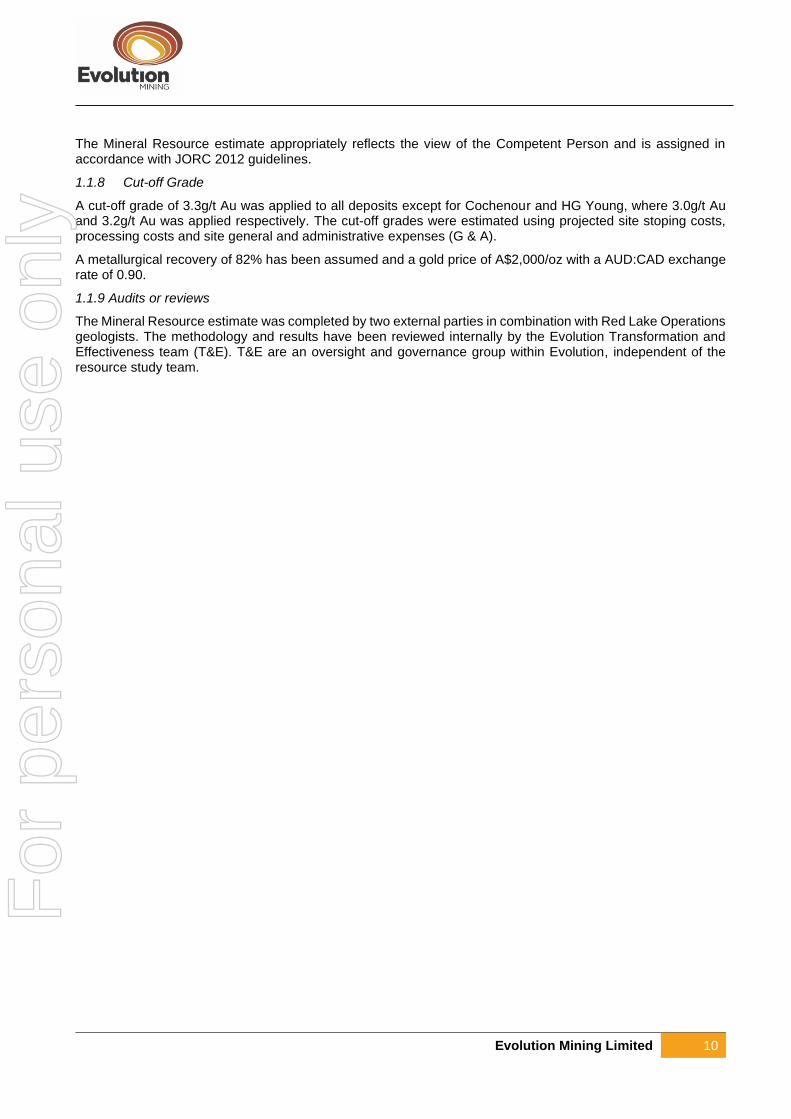
The revised Mineral Resource in the Upper Campbell area of the mine is estimated at 12.9 million tonnes grading 10.5 grams per tonne for 4.3 million ounces, representing a material addition to the overall Mineral Resource at Red Lake (see Figure 2). Mineralisation in Upper Campbell daylights at surface and is modelled to a depth of 1,200 metres below surface. Sixty-one percent of the Mineral Resource volume in Upper Campbell is classified as Indicated with an average drill hole spacing of six metres. Inferred material makes up 30% of the volume at an average drill spacing of 17 metres which leaves 9% of the resource unclassified. The Upper Campbell will be an area of immediate priority to determine the optimal way to most efficiently mine this very significant zone of high-grade mineralisation (see Figure 3).
Red Lake Gold Camp Exploration Potential
Red Lake is one of the largest, highest grade gold camps in North America with historical production of over 25 million ounces with head grades exceeding 20 grams per tonne. Evolution will spend US$50 million on exploration in the first three years with a planned drill program of over 100,000 metres per annum. The small footprint of Red Lake’s historic high-grade ore bodies enhances the potential for further discoveries across the operation.
Figure 1: Surface projection of the Red Lake Operation orebodies and underground workings with the
orthophoto transparency superimposed
For
per
sona
l use
onl
y
Evolution Mining Limited 3
Figure 2: Orthographic projection of the Red Lake Operation orebodies. Shapes represent geologic
wireframes built to model the Mineral Resource. Colours represent each of the 19 block models
developed to estimate the Mineral Resource
Figure 3: 9,510 level Upper Campbell showing Evolution’s new block model filtered above 3.0g/t Au.
The block model has been depleted by a two-metre wide buffer (inclusive of voids) surrounding all
existing workings in Upper Campbell and Red Lake areas of the mine
For
per
sona
l use
onl
y
Evolution Mining Limited 4
Table 1: Red Lake Mineral Resources Statement as at 31 December 2019
Total 22.76 7.77 5,687 25.33 6.49 5,287 48.08 7.10 10,974
Data is reported to significant figures to reflect appropriate precision and may not sum precisely due to rounding
Mineral Resources are reported inclusive of Ore Reserves. UG denotes underground. 1Red Lake Mineral Resources Competent Person is Dean Fredericksen
Commodity Price Assumptions
A gold price assumption of A$2,000 per ounce was used to estimate the Red Lake Mineral Resources. An AUD:CAD exchange rate assumption of 0.90 has also been used.
JORC 2012 and ASX Listing Rules Requirements
The Red Lake Mineral Resource statement included with this announcement has been prepared in accordance with the 2012 Edition of the “Australasian Code for reporting of Exploration Results, Mineral Resources and Ore Reserves” (the JORC Code 2012) and the ASX Listing Rules.
The Red Lake Mineral Resource summary is tabulated on the following pages. A material information summary is also provided for the Red Lake Mineral Resource pursuant to ASX Listing Rules 5.8 and 5.9 and the Assessment and Reporting Criteria in accordance with JORC Code 2012 requirements.
Approval
This release has been approved by the Evolution Board of Directors.
For further information please contact:
Investor Enquiries Media Contact
Bryan O’Hara Michael Vaughan Group Manager Investor Relations Media Relations Evolution Mining Limited Fivemark Partners
Tel: +61 (0)2 9696 2900 Tel: +61 (0)422 602 720
About Evolution Mining
Evolution Mining is a leading, growth-focused Australian gold miner. Evolution operates five wholly-owned mines – Cowal in New South Wales, Mt Carlton and Mt Rawdon in Queensland, Mungari in Western Australia, and Red Lake in Ontario, Canada. In addition, Evolution holds an economic interest in the Ernest Henry copper gold mine in Queensland.
For
per
sona
l use
onl
y
Evolution Mining Limited 5
Competent Persons Statement
The information in this statement that relates to the Red Lake Mineral Resources is based on information compiled by Dean Fredericksen who is a Competent Person employed on a full-time basis by Evolution Mining Limited and is a Member of the Australasian Institute of Mining and Metallurgy. Dean Fredericksen has sufficient experience that is relevant to the style of mineralisation and type of deposit under consideration and to the activity which he has undertaken to qualify as a Competent Person as defined in the 2012 Edition of the “Australasian Code for Reporting of Exploration Results, Mineral Resources and Ore Reserves”. Dean Fredericksen consents to the inclusion in this report of the matters based on his information in the form and context in which it appears.
Evolution employees acting as a Competent Person may hold equity in Evolution Mining Limited and may be entitled to participate in Evolution’s executive equity long-term incentive plan, details of which are included in Evolution’s annual Remuneration Report. Annual replacement of depleted Ore Reserves is one of the performance measures of Evolution’s long-term incentive plans.
Forward looking statements
This report prepared by Evolution Mining Limited (or “the Company”) include forward looking statements. Often, but not always, forward looking statements can generally be identified by the use of forward looking words such as “may”, “will”, “expect”, “intend”, “plan”, “estimate”, “anticipate”, “continue”, and “guidance”, or other similar words and may include, without limitation, statements regarding plans, strategies and objectives of management, anticipated production or construction commencement dates and expected costs or production outputs.
Forward looking statements inherently involve known and unknown risks, uncertainties and other factors that may cause the Company’s actual results, performance and achievements to differ materially from any future results, performance or achievements. Relevant factors may include, but are not limited to, changes in commodity prices, foreign exchange fluctuations and general economic conditions, increased costs and demand for production inputs, the speculative nature of exploration and project development, including the risks of obtaining necessary licenses and permits and diminishing quantities or grades of reserves, political and social risks, changes to the regulatory framework within which the Company operates or may in the future operate, environmental conditions including extreme weather conditions, recruitment and retention of personnel, industrial relations issues and litigation.
Forward looking statements are based on the Company and its management’s good faith assumptions relating to the financial, market, regulatory and other relevant environments that will exist and affect the Company’s business and operations in the future. The Company does not give any assurance that the assumptions on which forward looking statements are based will prove to be correct, or that the Company’s business or operations will not be affected in any material manner by these or other factors not foreseen or foreseeable by the Company or management or beyond the Company’s control.
Although the Company attempts and has attempted to identify factors that would cause actual actions, events or results to differ materially from those disclosed in forward looking statements, there may be other factors that could cause actual results, performance, achievements or events not to be as anticipated, estimated or intended, and many events are beyond the reasonable control of the Company. Accordingly, readers are cautioned not to place undue reliance on forward looking statements. Forward looking statements in these materials speak only at the date of issue. Subject to any continuing obligations under applicable law or any relevant stock exchange listing rules, in providing this information the Company does not undertake any obligation to publicly update or revise any of the forward-looking statements or to advise of any change in events, conditions or circumstances on which any such statement is based.
For
per
sona
l use
onl
y
Evolution Mining Limited 6
MATERIAL INFORMATION SUMMARY
Material Information Summaries are provided for the Red Lake Mineral Resource pursuant to ASX Listing Rules 5.8 and 5.9 and the Assessment and Reporting Criteria in accordance with JORC Code 2012 requirements. The Assessment and Reporting Criteria in accordance with JORC Code 2012 is presented in Appendix 2.
1. RED LAKE
Red Lake Mineral Resources
The 31 December 2019 Red Lake Mineral Resource estimate of 48.1Mt at 7.1g/t gold for 11.0Moz gold (inclusive of Ore Reserves). Resources are reported at a cut-off of 3.3g/t gold for Red Lake, 3.2g/t gold for HG Young and 3.0g/t gold for Cochenour.
Table 2: Red Lake Mineral Resources as at 31 December 2019
Total 22.76 7.77 5,687 25.33 6.49 5,287 48.08 7.10 10,974
Data is reported to significant figures to reflect appropriate precision and may not sum precisely due to rounding
Mineral Resources are reported inclusive of Ore Reserves. UG denotes underground. Red Lake Mineral Resources Competent Person is Dean Fredericksen
1.1 Red Lake Mineral Resources
1.1.1 Material Assumptions for Mineral Resources
The Red Lake Operation Mineral Resource estimate is defined by an underground mining shape optimiser using an A$2,000/oz gold price assumption. The underground resources have assumed conventional mechanised mining techniques and parameters typical of current Evolution underground operations. It is assumed that metallurgical recoveries from the various orebodies will remain in line with resources extracted and processed from adjacent areas in the mine.
1.1.2 Geology and Geological Interpretation
Red Lake Mines is hosted in the Red Lake greenstone belt comprising ~300 million years of geologic activity with multiple episodes of volcanism, sedimentation, plutonism and deformation that are Archean in age. This sequence is mainly tholeiitic basalt and locally, komatiitic basalt and is termed the Balmer Assemblage. The Balmer Assemblage also includes felsic, peridotitic and other mafic to lamprophyric intrusive rocks of various younger ages. The Red Lake/Campbell, Cochenour and HG Young deposits are hosted within significantly folded and sheared portions of the Balmer Assemblage.
Gold mineralisation, dated at between 2,723 and 2,712Ma, is hosted in a variety of rock types within the Red Lake Greenstone belt, although many of the productive zones occur as vein systems accompanying sulphide replacement within sheared mafic to komatiitic basalts.
For
per
sona
l use
onl
y
Evolution Mining Limited 7
Shear zones act as primary hydrothermal fluid corridors and host significant portions of the gold mineralisation in the area. Other significant mineralised structures occur within lower-strain areas of the stratigraphy, usually associated with brittle conjugate fracture systems adjacent to lithological boundaries possessing high competency contrasts.
It is common for zones to have multiple styles of mineralisation within the same host lithology. There are four common styles of mineralisation in the Red Lake-Campbell, HG Young and Cochenour deposits:
Gold appears as free milling gold, gold associated with sulphides, with magnetite as well as refractory, arsenopyrite-associated gold.
Gold mineralisation was first identified in the district in 1922 with production commencing at the Red Lake and Campbell mines in 1948 and 1949 respectively. Given approximately 70 years of mining, the deposit geometries and vein systems are well understood.
Orebodies are generally steep dipping -50 to -60 degrees although locally they are steeper, or flatter as they wrap around complex folded stratigraphy. Individual lenses of mineralisation vary considerably in thickness being mostly very narrow 0.3 – 1.0m but locally can contain multiple stacked lenses and our stockworks and disseminations in excess of 10m in width.
The Red Lake/Campbell system is approximately 3,000m along strike and has drilling over a vertical extent of 3,000m. The Cochenour mine as modelled in this report excludes the historically mined upper zones and commences approximately 750m below surface extending for 700m vertically and approximately 600m along strike.
Figure 4: Geological map of the Red Lake operations area
For
per
sona
l use
onl
y
Evolution Mining Limited 8
1.1.3 Sampling and Sub-sampling
The core is collected in wooden core trays and delivered to the site core processing facilities. It is washed and photographed. Prior to 2015 very little core was orientated. Post-2015 all drill core has been oriented to capture structural and other geological information. Following logging to a standardised geological legend it is sampled by cutting in half with diamond saws prior to submission to commercial laboratories for analysis.
Samples are crushed to minus 2mm and sub sampled to 0.25 kg prior to pulverising to 90% passing 75um. A sub-sample is then collected for assaying.
1.1.4 Sample Analysis Methods
A number of independent commercial laboratories have been utilised over the project life. These laboratories have all provided sample preparation and analytical services to industry standard procedures.
Assaying has been completed by fire assay on 30g subsamples with either gravimetric or AAS finish. The Red Lake database is stored in acQuire software and managed by site personnel. AcQuire was introduced in 2004 to replace an old database management platform. The system includes high quality validation processes with as much validated information as possible collected at the core facility and loaded directly to the database. Sample numbers are stored at the core facility and assays returned from the Laboratory are matched directly to the sample numbers which reduces any sample transposition errors.
QA/QC standards are submitted at the sampling stage and are used to monitor laboratory performance. Standard reference material is purchased from a variety of reputable sources and results monitored on a batch by batch basis with appropriate actions taken on non-compliant results. These practices were well established prior to the introduction of acQuire. QA/QC data from 1996 has been reviewed which gives confidence that industry leading practices have been in operation for much of the data collection for this project.
Evolution has undertaken appropriate due diligence of past and current practices to be comfortable that the data utilised to complete this estimate is of a quality that supports the Mineral Resource classifications used. The site also has a long history of production and reconciliation against Mineral Resource models that provides further confidence in the data to support the classifications adopted.
1.1.5 Drilling Techniques
Multiple contractors have been used over the project life. At the Red Lake Mine surface drilling is typically NQ (47.6 mm) in size. Underground core holes are typically BQ (36.5 mm) and AQTK (30.5 mm) sizes with a minor amount of NQ2 (50.5 mm) holes. Underground definition and delineation drilling are typically AQTK wire-line (30.5 mm).
In total some 7,147,000 metres of core drilling has been completed on the project. Of this 5,959,000 samples have been collected and assayed. The details are shown in Table 3. Much of this drilling has been undertaken in the past 20 years, post 2000. Annual drilling is summarised in Figure 5.
Table 3: Summary details of the drilling and sampling by resource areas
# drillholes Total metres # QAQC Samples # Samples
Campbell 13,130 2,245,010 90,323 2,040,778
Red Lake 14,344 1,951,492 84,151 1,918,201
Cochenour 18,201 2,184,481 44,470 1,220,255
HG Young 1,174 462,753 28,645 547,202
Rahill 705 303,810 8,762 232,982
Totals 47,554 7,147,546 256,351 5,959,418
For
per
sona
l use
onl
y
Evolution Mining Limited 9
Figure 5: Red Lake Operations diamond drilling statistics by year
1.1.6 Estimation Methodology
This estimate is based upon a complete revision of the wireframes for all deposit areas included in this Mineral Resource estimate. Wireframing has been completed in either Leapfrog and/or Datamine Studio 3D utilising a set of geological controls for each of the main structural elements. Compared to past estimates these wireframes are less controlled by gold grade, incorporate higher degrees of geological control and tend to include more lower grade mineralisation. Thus, they have greater continuity across strike and up and down dip. There are more than 50 main wireframe domains consisting of multiple mineralised structures with each being modelled independently. This approach has drastically reduced the number of wireframes and block models compared to prior estimates. A reduction in block models from 142 to 19 has been achieved.
Generally, where the mineralisation envelopes are more diffuse, the lower grade cut-off for these envelopes is in the range of 0.5 to 1.0g/t.
Estimation methods adopted the use of Ordinary Kriging into parent cell blocks that are 12ft (3.65m) along strike by 6ft (1.83m) across strike by 12 ft (3.65m) vertically. Assays have been composited to 3ft (0.91m) intervals prior to statistical analysis.
Top cuts or caps have been applied to each of the zones based on statistical analysis of the populations. The top cuts applied result in effective metal reduction relative to uncut estimates of between 5% and 25% depending on the areas being estimated.
Variable search orientations were applied to each search ellipse by utilising Dynamic Anisotropy functions using the wireframes as guides.
Validation of the estimates has been completed by direct block to composite comparisons as well as utilising swath plots comparing blocks to composites along strike and up and down dip. Further validation using a Gaussian Global change of support analysis has been completed in many of the models.
1.1.7 Resource Classification
The classifications have been made in accordance with the JORC 2012 guidelines and are based upon distance and qualitative criterion, with consideration for the number of holes used during interpolation, sampled/unsampled data, grade variations between holes, drill spacing, hole orientation, interpolation pass, and geological confidence.
0
100000
200000
300000
400000
500000
600000
1936
1938
1940
1942
1944
1946
1948
1950
1952
1954
1956
1958
1960
1962
1964
1966
1968
1970
1972
1974
1976
1978
1980
1982
1984
1986
1988
1990
1992
1994
1996
1998
2000
2002
2004
2006
2008
2010
2012
2014
2016
2018
2020
No D
ate
ME
TR
ES
For
per
sona
l use
onl
y
Evolution Mining Limited 10
The Mineral Resource estimate appropriately reflects the view of the Competent Person and is assigned in accordance with JORC 2012 guidelines.
1.1.8 Cut-off Grade
A cut-off grade of 3.3g/t Au was applied to all deposits except for Cochenour and HG Young, where 3.0g/t Au and 3.2g/t Au was applied respectively. The cut-off grades were estimated using projected site stoping costs, processing costs and site general and administrative expenses (G & A).
A metallurgical recovery of 82% has been assumed and a gold price of A$2,000/oz with a AUD:CAD exchange rate of 0.90.
1.1.9 Audits or reviews
The Mineral Resource estimate was completed by two external parties in combination with Red Lake Operations geologists. The methodology and results have been reviewed internally by the Evolution Transformation and Effectiveness team (T&E). T&E are an oversight and governance group within Evolution, independent of the resource study team.
For
per
sona
l use
onl
y
11
APPENDIX 1:
GROUP GOLD MINERAL RESOURCES DECEMBER 2019 UPDATED WITH 31 DECEMBER 2019 RED LAKE AND 30 APRIL 2020 COWAL MINERAL
Data is reported to significant figures to reflect appropriate precision and may not sum precisely due to rounding. Mineral Resources are reported inclusive of Ore Reserves. Mining depletion has not been accounted for between 31 December 2019 and 30 June 2020.
1 Includes stockpiles. 2 Ernest Henry Operation cut-off 0.9% CuEq. 3 Red Lake cut-off is 3.3g/t Au except for Cochenour (3.0g/t Au) and HG Young (3.2g/t Au) deposits
Group Gold Mineral Resources Competent Person (CP) Notes refer to 1. James Biggam; 2. Dean Frederickson; 3. Andrew Engelbrecht; 4. Tim Murphy; 5. Ben Coutts; 6. Colin Stelzer (Glencore); 7. Michael Andrew
This information is extracted from the ASX release entitled “Annual Mineral Resources and Ore Reserves Statement” released to the ASX on 12 February 2020, ASX release entitled “Cowal Maiden Underground Ore Reserve Supports Mine Development” released on 23 July 2020 and updated with the December 2019 Red Lake Mineral Resource (details within this announcement). This table excludes Cracow Mineral Resources following divestment as advised on 1 July 2020 in ASX release entitled “Completion of Cracow Gold Mine Divestment”. An improved understanding of the geological controls has indicated a potential reduction of approximately 75,000 ounces from the Life of Mine Plan as advised in the ASX release on 19 June 2020 entitled “Mt Carlton Update”. The Mt Carlton Mineral Resources and Ore Reserves will be updated in the Annual Mineral Resources and Ore Reserves Statement at December 2020 planned for release in February 2021. Evolution confirms that it is not aware of any other new information or data that materially affects other information included in that release and that all material assumptions and technical parameters underpinning the estimates continue to apply and have not materially changed. The Company confirms that the form and context in which the Competent Persons’ findings are presented have not been materially modified from the original market announcement.
For
per
sona
l use
onl
y
12
GROUP GOLD ORE RESERVES DECEMBER 2019 (EXCLUDING RED LAKE) UPDATED WITH APRIL 2020 COWAL ORE RESERVES
Total 53.98 0.67 1,161 236.22 0.81 6,172 290.10 0.79 7,332
Data is reported to significant figures to reflect appropriate precision and may not sum precisely due to rounding. Mining depletion has not been accounted for between 31 December 2019 and 30 June 2020. 1 Includes stockpiles 2 Ernest Henry Operation cut-off 0.9% CuEq
Group Gold Ore Reserve Competent Person (CP) Notes refer to 1. Ryan Kare; 2. Joshua Northfield; 3. Ken Larwood; 4. Mark Boon; 5. Anton Kruger; 6. Mike Corbett (Glencore)
This information is extracted from the ASX release entitled “Annual Mineral Resources and Ore Reserves Statement” released to the ASX on 12 February 2020 and ASX release entitled “Cowal Maiden
Underground Ore Reserve Supports Mine Development” released on 23 July 2020. This table excludes Cracow Ore Reserves following divestment as advised on 1 July 2020 in ASX release entitled
“Completion of Cracow Gold Mine Divestment.” An improved understanding of the geological controls has indicated a potential reduction of approximately 75,000 ounces from the Life of Mine Plan as advised
in the ASX release on 19 June 2020 entitled “Mt Carlton Update”. The Mt Carlton Mineral Resources and Ore Reserves will be updated in the Annual Mineral Resources and Ore Reserves Statement at
December 2020 planned for release in February 2021. Evolution confirms that it is not aware of any other new information or data that materially affects other information included in that release and that all
material assumptions and technical parameters underpinning the estimates continue to apply and have not materially changed. The Company confirms that the form and context in which the Competent
Persons’ findings are presented have not been materially modified from the original market announcement.
For
per
sona
l use
onl
y
13
GROUP COPPER MINERAL RESOURCES DECEMBER 2019 UPDATED WITH APRIL 2020 COWAL MINERAL RESOURCES
Group Ore Reserve Competent Person (CP) Notes refer to: 1. Anton Kruger; 2. Mike Corbett (Glencore). The following notes relate to the Copper Group tables. Data is reported to significant figures to reflect appropriate precision and may not sum precisely due to rounding Mineral Resources are reported inclusive of Ore Reserves. Evolution cut-off grades are reported in g/t gold. Mining depletion has not been accounted for between 31 December 2019 and 30 June 2020.
1 Includes stockpiles 2 Ernest Henry Operation cut-off 0.9% CuEq
This information is extracted from the ASX release entitled “Annual Mineral Resources and Ore Reserves Statement” released to the ASX on 12 February 2020 and ASX release entitled “Cowal Maiden Underground Ore Reserve Supports Mine Development” released on 23 July 2020. An improved understanding of the geological controls has indicated a potential reduction of approximately 75,000 ounces from the Life of Mine Plan as advised in the ASX release on 19 June 2020 entitled “Mt Carlton Update”. The Mt Carlton Mineral Resources and Ore Reserves will be updated in the Annual Mineral Resources and Ore Reserves Statement at December 2020 planned for release in February 2021Full details of the Ernest Henry Mineral Resources and Ore Reserves are provided in the report entitled “Glencore Resources and Reserves as at 31 December 2019” released 4 February 2020 and available to view at www.glencore.com. Evolution Mining has an economic interest earning rights to 100% of the revenue from future gold production and 30% of future copper and silver produced from an agreed life of mine area, and 49% of future gold, copper and silver produced from the Ernest Henry Resource outside the agreed area. Ernest Henry Reserve is reported here on the basis of economic interest and not the entire mine reserve. The above reported figures constitute 37.4% of the total Ernest Henry copper resource and 33.9 % of the total Ernest Henry copper reserve.
The Company confirms that it is not aware of any new information or data that materially affects the information included in the reports and that all material assumptions and parameters underpinning the estimates in the reports continue to apply and have not materially changed. The Company confirms that the form and context in which the Competent Persons’ findings are presented have not been materially modified from the reports.
For
per
sona
l use
onl
y
14
APPENDIX 2: JORC CODE 2012 ASSESMENT AND REPORTING CRITERIA
The following information is provided in accordance with Table 1 of Appendix 5A of the JORC Code 2012 - Section 1 (Sampling Techniques and Data), Section 2 (Reporting of Exploration Results) and Section 3 (Estimation and Reporting of Mineral Resources).
Red Lake Mineral Resources
JORC Code 2012 Edition – Table 1
Section 1 Sampling Techniques and Data
Criteria Commentary
Sampling techniques
Sampling of gold mineralisation at Red Lake Operation that constitutes this Mineral Resource estimate was undertaken using diamond core (surface and underground).
All drill samples were logged prior to sampling. Diamond drill core was sampled to lithological, alteration and mineralisation related contacts. Sampling was carried out according to Red Lake Operations protocols and QAQC procedures which comply with industry best practice. All drill-hole collars were surveyed using a total station theodolite or total GPS.
The sampling and assaying methods are appropriate for the orogenic mineralised system and are representative for the mineralisation style. The sampling and assaying suitability was validated using Red Lake Operations QAQC protocol and no instruments or tools requiring calibration were used as part of the sampling process.
Diamond drill core sample intervals were based on geology to ensure a representative sample, with lengths ranging from 0.15 to 1m. Diamond drilling was half core sampled. All diamond core samples were dried, crushed and pulverised (total preparation) to produce a 30g charge for fire assay of Au. A suite of multi elements are determined using four-acid digest with ICP/MS and/or an ICP/AES finish for some sample intervals.
Drilling techniques Drilling incorporated in the Mineral Resource estimate has been collected using diamond drill rigs. The core is extracted using a standard tube and core diameter is either AQTK (30.5mm) BQTK (40.7mm) or NQ2 (50.6mm) in size. Prior to 2015 very little exploration core was oriented. Post 2015, all exploration drill core is oriented using the Tru-Core device and a portion of critical Resource Definition and production drillcore is oriented. Face Samples (Chips) have been routinely collected during the history of mining on site for all deposits. They have not been utilised to estimate grades for this Mineral Resource.
Drill sample recovery
Percentage of drill core recovery is not recorded at this time on site. All core post 2015 is oriented and marked up at 1-metre intervals, intervals are compared to drillers depth.
It is reasonable to state that core recovery is very high in the Red Lake Operations project areas as the rocks are very competent and few, if any, of the mineralised zones present drilling issues where core recovery can be impacted.
Logging All logging is both qualitative and quantitative in nature recording features such as structural data, lithology, mineralogy, alteration, mineralisation types, vein density, colour etc. All holes are photographed wet. All diamond holes were logged entirely from collar to end of hole. All drill core once logged is digitally photographed. The photographs capture all data presented on the core.
Sub-sampling techniques and sample preparation
Diamond core drilled was half core sampled and the remaining half was retained. Core is cut to preserve the bottom of hole orientation line. In some instance core may be quarter cut and sent for analysis.
Sample preparation of diamond samples was undertaken by external laboratories according to the sample preparation and assaying protocol established to maximise the representation of the Red Lake Operations mineralisation. Laboratories performance was monitored as part of Red Lake Operations QAQC procedure. Laboratory inspections were undertaken to monitor the laboratories compliance to the Red Lake Operations sampling and sample preparation protocol.
The sample and size (1.5kg to 4kg) relative to the particle size (>90% passing 75um) of the material sampled is a commonly utilised practice for effective sample representation for gold deposits within the Orogenic Gold deposits of the Superior Craton Canada.
Quality control procedures adopted to maximise sample representation for all sub-sampling stages include the collection of field and laboratory duplicates and the insertion of certified reference material as assay standards (1 in 20) and the insertion of blank samples (1 in 20) or at the geologist’s discretion. Coarse blank material is routinely submitted for assay and is inserted into each mineralised zone where possible and always after a sample identified as having visible gold. The quality control performance was monitored as part of Red Lake Operations QAQC procedure.
For
per
sona
l use
onl
y
15
Criteria Commentary
The sample preparation has been conducted by commercial laboratories. All samples are oven dried (60°C), jaw crushed to 90% passing <2mm and riffle split to a maximum sample weight of 1kg as required. The primary sample is then pulverised in a one stage process, using a LM2 pulveriser, to a particle size of >90% passing 75um. Approximately 250g of the primary sample is extracted by spatula to a numbered paper pulp bag that is used for a 30g fire assay charge. The pulp is retained, and the bulk residue is disposed of after four months.
Measures taken to ensure sample representation include the collection of field duplicates during diamond core sampling drilling at the geologist’s discretion and within the ore zone. Duplicate samples for diamond core are collected during the sample preparation crushing and pulverisation stage. A comparison of the duplicate sample vs. the primary sample assay result was undertaken as part of Red Lake Operations QAQC protocol. It is considered that all sub-sampling and lab preparations are consistent with other laboratories in Canada and are satisfactory for the intended purpose. The sample sizes are considered appropriate and in line with industry standards.
Quality of assay data and laboratory tests
The sampling preparation and assaying protocol used at Red Lake Operations was developed to ensure the quality and suitability of the assaying and laboratory procedures relative to the mineralisation types. No geophysical tools or other remote sensing instruments were utilised for reporting or interpretation of gold mineralisation.
Fire assay is designed to measure the total gold within a sample. Fire assay has been confirmed as a suitable technique for orogenic type mineralisation. It has been extensively used throughout the North Western Ontario region. Screen fire assay have also been used to validate the fire assay techniques.
Quality control samples were routinely inserted into the sampling sequence and also inserted at the discretion of the geologist either inside or around the expected zones of mineralisation. The intent of the procedure for reviewing the performance of certified standard reference material is to examine for any erroneous results (a result outside of the expected statistically derived tolerance limits) and to validate if required; the acceptable levels of accuracy and precision for all stages of the sampling and analytical process. Typically, batches which fail quality control checks are re-analysed.
Verification of sampling and assaying
Independent internal or external verification of significant intercepts is not routinely completed. The quality control / quality assurance (QAQC) process ensures the intercepts are representative for the orogenic gold systems. Half core and sample pulps are retained at Red Lake Operations for two years if further verification is required.
The twinning of holes is not a common practice undertaken at Red Lake Operations. The face sample and drill hole data with the mill reconciliation data is of sufficient density to validate neighbouring samples. Data which is inconsistent with the known geology undergoes further verification to ensure its quality.
All sample and assay information are stored utilising the acQuire database software system. Data undergoes QAQC validation prior to being accepted and loaded into the database. Assay results are merged when received electronically from the laboratory. The geologist reviews the database checking for the correct merging of results and that all data has been received and entered. Any adjustments to this data are recorded permanently in the database. Historical paper records (where available) are retained in the exploration and mining offices.
No adjustments or calibrations have been made to the final assay data reported by the laboratory.
Location of data points
Drill hole collar positions are surveyed by the site-based survey department or contract surveyors (utilising a differential GPS or conventional surveying techniques, with reference to a known base station) with a precision of less than 0.2m variability.
All drill holes at Red Lake Operations have been surveyed for easting, northing and reduced level. Recent data is collected and stored in Red Lake Operations Mine Grid.
Topographic control was generated from aerial surveys and detailed Lidar surveys.
Data spacing and distribution
The nominal drill spacing in the Mineral Resource areas varies from close spaced <6m X 6m out to 30m X 30m.This spacing has largely been a result of prior drilling programs and the data density is considered to be very good for establishing this Mineral Resource estimate.
Data spacing and distribution is considered sufficient for establishing geological continuity and grade variability appropriate for classifying a Mineral Resource estimate.
Sample compositing has been applied and compositing methods will be discussed in latter sections.
Orientation of data in relation to geological structure
Mineralised zones in the Red Lake-Campbell deposit are distinguished first by spatial orientation relative to structural corridors and second by the style of mineralisation. It is common for mineralised zones to have multiple styles of mineralisation within the same host lithology.
There are four types of mineralisation in Red Lake-Campbell Deposit;
• Vein style gold mineralisation
For
per
sona
l use
onl
y
16
Criteria Commentary
• Vein and sulphide style gold mineralisation
• Disseminated sulphide style mineralisation locally referred to as replacement mineralisation
• Free gold mineralisation style
The relationship between the drilling orientation and the orientation of key mineralised structures at Red Lake is not considered to have introduced a sampling bias and is not considered to be material.
Resource Definition and exploration drilling is typically planned to intersect mineralised domains in an orientation that does not introduce sample bias. A small number of holes are drilled at sub-optimal orientations to test for alternate geological interpretations.
Sample security Chain of custody protocols to ensure the security of samples are followed. Prior to submission samples are retained on site and access to the samples is restricted. Collected samples are dropped off at the respective commercial laboratories in North Western Ontario. Access into the laboratory is restricted and movements of personnel and the samples are tracked under supervision of the laboratory staff. During some drill campaigns some samples are collected directly from site by the commercial laboratory. While various laboratories have been used, the chain of custody and sample security protocols have remained similar.
Audits or reviews Internal and External audits have been conducted in the past at Red Lake Operations over successive years from the early 2000s.
These audits documents have been reviewed by the Competent Person and have provided ongoing improvement recommendations but have not highlighted material risks to the integrity of the data.
Section 2 Reporting of Exploration Results
Criteria Commentary
Mineral tenement and land tenure status
Resource Definition drilling was undertaken on the following mining claims: Cochenour & Red Lake Claims: PAT-8059, PAT-8064, PAT-6850, PAT-6836, MLO-3508.
All mining claims are in good standing. Tenure consists of patents, subject to annual Mining Land Taxes issued in January. Title registered on land tenure is 100% owned.
There are currently no paying royalties. Of the five known royalties within the Mine Closure Plan, two are proximal to the current Cochenour workings, TVX (Kinross) and Inco (Vale), and one is proximal to the Red Lake workings (Hill). The shapes are recorded in Engineering work files for future reference and mine planning.
Historical sites have been rehabilitated and are monitored by the Environmental Dept.
Exploration done by other parties
Red Lake and Campbell were first staked during the Red Lake Gold Rush in 1926. Subsequently, there was a period of claim cancellations and re-staking of the area. Both mines opened in the late 1940s. Red Lake and Campbell Mine were combined in 2006 when Goldcorp purchased Campbell Mine.
The earliest known exploration on the Cochenour–Willans property was in 1925. Cochenour–Willans Gold Mines Ltd. was incorporated in 1936 and production began in 1939 at a rate of 136–181 t/d. Operations ran for 32 years, from 1939–1971. It was acquired by Goldcorp in 2008.
Aside from the Red Lake gold mines and Cochenour mine, Evolution also holds past producing operations that include the HG Young, Abino, McMarmac, Gold Eagle Mine, and McKenzie Red Lake mines.
Geology The mineralisation within the Red Lake Operations can be classified as an Archean greenstone belt-hosted gold deposit.
Red Lake Operations is hosted in the Red Lake greenstone belt within the Uchi Domain on the southern margin of the North Caribou Terrane of the Superior Province, Canada.
Red Lake Operations is underlain mainly by tholeiitic basalt and locally by komatiitic basalt of the Balmer Assemblage. The mine sequence also includes felsic, peridotitic and other mafic to lamprophyric intrusive rocks of various younger ages. Both Red Lake - Campbell and Cochenour deposits are hosted within significantly folded and sheared portions of the Balmer Assemblage. Shear zones act as primary hydrothermal fluid corridors and host significant portions of the gold mineralisation in the area. Other significant mineralised structures occur within lower-strain areas of the stratigraphy, usually associated with brittle conjugate fracture systems in close proximity to lithological boundaries possessing high competency contrasts.
For
per
sona
l use
onl
y
17
Criteria Commentary
Gold mineralisation is hosted in a variety of rock types within the Red Lake Greenstone belt, although the majority of the productive zones occur as vein systems accompanying sulphide replacement within sheared mafic to komatiitic basalts of the Balmer Assemblage.
Gold bearing zones in the Red Lake-Campbell and Cochenour deposit are distinguished first by spatial orientation relative to structural corridors and second by the style of mineralisation. It is common for zones to have multiple styles of mineralisation within the same host lithology. There are four styles of mineralisation common in the Red Lake-Campbell and Cochenour deposit; vein style, vein and sulphide style, disseminated sulphide (replacement) style and free gold style.
Drill hole Information
No Exploration Results have been reported in this release
Data aggregation methods
No Exploration Results have been reported in this release
Relationship between mineralisation widths and intercept lengths
No Exploration Results have been reported in this release
Diagrams No Exploration Results have been reported in this release
Balanced reporting No Exploration Results have been reported in this release
Other substantive exploration data
No Exploration Results have been reported in this release
Further work Further exploration, near mine exploration and Resource Definition work on the Red Lake Operations is planned for the remainder of FY21.
Drilling is planned to improve the confidence of the Mineral Resource estimate and to test for extensions to known mineralisation
Further refinements to the geological models are planned with the aim of ensuring the models appropriately reflect the geology and provide for confident mine planning
Section 3 Estimation and Reporting of Mineral Resources
Criteria Commentary
Database integrity The Red Lake database is stored within an acQuire SQL based system and is managed on site by appropriately experienced personnel. Management systems are in place to directly import data from the core logging and sampling and with digital matching of sample numbers and QA/QC data directly to digital files from the assay laboratories.
Merging of historical information from prior operating companies of projects that have become the current Red Lake Operation have been managed by the same competent database managers that maintain the current system.
At the cut-off date for this Mineral Resource estimate (31 December 2019) the database contained records for 47,554 drillholes for 7,147,000 metres of core drilling. Of this 5,959,000 samples have been collected and assayed.
Site visits The Competent Person is a full-time employee of Evolution Mining
The Competent Person has visited the site on three occasions during a 6-month period leading up to the compilation of this Mineral Resource estimate in the capacity of Exploration Advisor to Evolution Mining. Subsequently the Competent Person has assumed the role of Manager Geology and Planning at Red Lake Operations with responsibility for compiling this Mineral Resource estimate.
The visits included detailed reviews of the geology in underground outcrop and diamond drill core and detailed discussions with the site geological teams to understand the various mineral occurrences that comprise this Mineral Resource estimate.
For
per
sona
l use
onl
y
18
During the visit a review of the data collection and storage methodologies including QA/QC were undertaken. The Competent Person undertook visits to two of the current operating laboratories.
Geological interpretation
The geology of the Red Lake Operation including satellite deposits; Cochenour and HG Young that comprise this report is well known.
There is in excess of 70 years of mining in the Red Lake district and as such a vast amount of geological information has been collated for the deposits in this estimate. This information includes geological logging and assay information for over 45,000 drillholes comprising 7,100,000 metres of core. Mapping of development drives has been completed in detail and utilised to construct lithological and mineralisation models in 2D and 3D.
This geology information has formed the basis for controlling the development of wireframes to constrain the Mineral Resource estimate.
Wireframes were constructed using this information as the primary basis to constrain mineralisation. In prior estimates high grade cut-offs have been a primary control on the extent of the mineralisation domains both across and along strike.
Modelling for this estimate has focused more on structural and lithological controls as well and incorporating lower grade mineralisation adjacent to and along strike of high-grade intercepts to create more continuous mineralised lenses.
The Campbell and Red Lake deposits themselves comprise a significant number of mineralised structures or lenses that have been modelled and estimated separately. These lenses can each have differing mineralisation styles and grade distribution. This has been considered when establishing the wireframes used to constrain the estimates.
The Cochenour deposit has similar mineralisation styles to the Campbell/Red Lake deposits. However, mineralisation outside of the Main zone (UMZ) is less continuous and better represented by a lower grade envelope at a cut-off of 0.5 g/t Au. Shells have been constructed using Leapfrog models at 0.5 g/t to form the basis of the outer low-grade halos where geological confidence is lacking.
HG Young mineralisation also has similar styles as Campbell/Red Lake and has been modelled using wireframes that constrain readily interpretable vein and mineralisation arrays. There is further opportunity to capture additional mineralisation in the HG Young Mineral Resource by adopting other modelling methodologies that will be incorporated into future estimates.
Dimensions The approximate dimensions of the Red Lake Operations Mineral Resource deposits are:
• Red Lake deposit: 3,000m strike, 3,000m vertical extent, 750m across strike of mineralisation package
• Cochenour deposit: 600 m strike, 700m vertical extent, 250m across strike of mineralisation package
• HG Young (HGY) deposit: 400m strike, 750m vertical extent, 150m across strike of mineralisation package
Estimation and modelling techniques
A conventional block modelling approach was adopted with wireframes generated in Leapfrog Geo, and block models completed in Datamine Studio RM and Micromine.
The general workflow adopted for all deposits is very similar and involved;
• fixed length compositing to 3ft
• indicator estimation at a range of cut-off grades to enable the application of a grade capping and high-grade restrictions for the estimate
• data analysis to determine appropriate grade caps for applying to the composite
• interpolation using Ordinary Kriging (OK)
• classification of blocks as Indicated and Inferred Mineral Resources using distance based and qualitative criterion.
For this Mineral Resource estimate the following units of measure were applicable;
• Drill hole information, wireframes, mined-out, and blocks are in feet.
• Densities are measured in tonnes per cubic metre, block densities are assigned as tonnes per cubic foot.
• Gold grades are expressed as grams per metric tonne.
• Mineral Resource estimates are reported as metric tonnes, grams per metric tonne, and troy ounces.
Block dimensions (X, Y and Z) for all zones except the High-Grade Zone (HGZ) were 12ft x 6 ft x 12 ft. The blocks are oriented 45 degrees to approximate the strike of the mineralised structures. Blocks were sub celled, with parent cell estimation.
Given the very skewed populations and abundance of extreme values in the dataset non-conventional approaches for grade capping were applied. The aim is to limit the overestimation of high grades into lower grade blocks.
• Probability thresholds were estimated for blocks at grades that represented low, medium and high-grade domains for each of the structures. This enables capping to be applied for each of these domains.
• For Cochenour and HG Young top cut grades were restricted in the distance that they
For
per
sona
l use
onl
y
19
could be applied in the estimate.
Metal reduction due to capping or top cutting results in between 5% and 25% metal reduction depending on the zone being estimated.
Spatial data analysis or variography was completed using Snowden’s Supervisor, or, in the case of Cochenour and HG Young, Isatis.
Interpolation strategies were applied to suit the data for each zone with the aim of keeping the estimates relatively local, honouring the drilling data without excessive smoothing that could result in smearing of high grades.
Variable search orientations were applied to each of the search ellipse by utilising Dynamic Aniosotropy functions in the estimation software.
Check estimates were completed using Inverse Distance and nearest neighbor methods to ensure repeatability and validity on a local and global scale.
Analysis using Global Change of Support (Gaussian) methods was completed in local areas to check the quality of the estimates.
Estimates were validated using industry standard techniques and were peer reviewed at each step in the process by site and external groups and prior to finalisation.
The estimates are for gold only. Other elements whilst of significance to optimising processing and blend strategies are not considered to be material to the overall Mineral Resource estimate.
Moisture All estimates of tonnages are reported on a dry basis.
Cut-off parameters The cut-off grades applied to the deposit areas are as follows
o Cochenour – 3.0 g/t o Red Lake – 3.3 g/t o HG Young – 3.2 g/t
The cut-off grades were estimated using projected site stoping costs, processing costs and site G & A.
A metallurgical recovery of 82% has been assumed and a gold price of A$2,000/oz with a CAD:AUD exchange rate of 0.9.
Mining factors or assumptions
The Mineral Resource estimate has been reported within Mining Shape Optimiser objects (MSOs) calculated in Deswik software. These shapes assume a minimum mining width in the range of 1.8 to 2.4 m with a minimum footwall and hangingwall slope of 50 degrees.
The minimum strike of the panels is 5.0m and a vertical extent ranging from 15 – 26m.
No external dilution has been applied to the shapes however internal dilution has been applied where required (no estimated grade or sub Inferred Mineral Resource blocks) at 0.0 g/t.
All Mineral Resources have been depleted by prior mining. The prior mining is represented by detailed surveys completed over the life of the project. These surveys are represented by 3D models which have been used to flag blocks as mined or not.
In the upper levels of the Campbell Mine, which has the most extensive existing workings, a 2.0m skin has been applied to the outer limits of the workings and all material inside this skin has also been flagged as mined out.
Metallurgical factors or assumptions
Two process plants operate at Red Lake Operations. The Campbell and Red Lake plants are both operational and able to treat the ore within this Mineral Resource estimate.
Both plants have been optimised to process the ore from all active deposits with gold recoveries in excess of 90%.
Ongoing metallurgical studies indicate that the 82% applied to the calculation of a cut-off grade is likely to be very conservative.
Environmental factors or assumptions
Red Lake Operations has a long history of mining operations and has in place all permits and approvals to continue operations. There are approvals in place to establish an underground operation at HG Young which is the only Mineral Resource that is not currently being mined.
A site Environmental team monitors ongoing compliance with approvals and maintains the site in good standing with regulators.
Bulk density Bulk density measurements have been made using a site-based water immersion method.
The measurements are stored in the site acQuire database on a dry density basis
Analysis was made of the bulk density by lithology and mineralised domains. Whilst there is some variation by lithology the main mineralised domains have very similar bulk densities. They range from 2.90 t/m3 to 3.0 t/m3.
Classification Classification of the Mineral Resource estimate was completed by Evolution Mining in conjunction with the respective consultants that were involved in the reports.
For
per
sona
l use
onl
y
20
The classifications have been made in accordance with the JORC 2012 guidelines and are based upon distance and qualitative criterion, with consideration for the number of holes used during interpolation, sampled/unsampled data, grade variations between holes, drill spacing, hole orientation, interpolation pass, and geological confidence.
Audits or reviews The Mineral Resource estimate was completed by two external parties in combination with Red Lake Operations geologists. The methodology and results have been reviewed internally by the Evolution Transformation and Effectiveness team (T&E). T&E are an oversight and governance group within Evolution, independent of the resource study team.
Discussion of relative accuracy/ confidence
The relative accuracy of the Mineral Resource estimate is in accordance with the guidelines of the 2012 JORC Code.
The site has maintained an ongoing register of production reconciliations with varied short-term performance. However, over longer periods, the reconciliations are very good and well within industry targets. It is expected that reconciliation will continue to confirm that the new Mineral Resources are suitable global estimates to be used as the basis to estimate Ore Reserves.
The Competent Person is comfortable that these estimates are classified in accordance with the JORC 2012 guidelines and will be suitable for appropriate conversion to Ore Reserves where applicable and will form the basis of ongoing Mine Planning at Red Lake Operations.