36
FY2015 FULL YEAR RESULTS PRESENTATION 17 AUGUST 2015 www.industriareit.com.au ASX CODE: IDR For personal use only
FY2015 FULL YEAR RESULTS PRESENTATION
17 AUGUST 2015
www.industriareit.com.au ASX CODE: IDR
For
per
sona
l use
onl
y

2
Contents
■ Highlights
■ Financial Results
■ Portfolio Performance
■ Capital Management
■ Outlook
■ Appendices
- Detailed Property Portfolio
- Financial Information
For
per
sona
l use
onl
y

3
HIGHLIGHTS
For
per
sona
l use
onl
y

4
Industria REIT Highlights
Over 18,800 sqm leasing transactions in FY2015 and over 10,7001 sqm post balance date for a total of 29,557 sqm
Sold 53 Brandl St (BTP) at a premium to book value
FY2015 Distribution of 16.2 cents per Security
Occupancy (by area)
WALE (years by area)
Significantly reduced lease expiry in FY2016 and FY2017
92.0%
94.2% 94.4%
Occupancy
4.8
5.1
5.3
Wale30 June 2015
31 July 2015 completed
31 July 2015 completed and subject to documentation and approvals
1. As at 31 July 2015. Includes certain transactions subject to documentation and
approvals (refer Slide 13 for details)
For
per
sona
l use
onl
y

5
Industria key metrics
Portfolio value $400 million
161,228 square metres of Net Lettable Area across 17 assets
Weighted average portfolio cap rate 8.13%
Occupancy 94.4%1
Weighted average lease expiry (WALE) 5.3 years1
NTA per Security $2.02 (or $2.05 excluding MTM of interest rate swaps)
Gearing 33.4%2
FY2016 Distribution guidance 15.0 to 15.8 cents per Security3 subject to market conditions and no unforeseen events
1. By area, as at 31 July 2015. Includes certain transactions subject to documentation and approvals (refer Slide 13 for details). Occupancy 92.0% and WALE 4.8 years (by area)
respectively as at 30 June 2015 2. Debt less cash divided by the value of the Portfolio 3. Refer Slide 26 for further details
For
per
sona
l use
onl
y

6
FY2015 Results Summary
Distribution of 16.20 cents per Security Distribution of 16.20 cents per Security declared for FY2015 (consistent with February 2015 guidance) Distributable earnings of $20.3 million Tax deferred component of 45.5%
Recent leasing success in challenging market conditions Active asset management in challenging market conditions (particularly Brisbane) 29,557 sqm of space has been leased since 1 July 20141 18,839 sqm of space was leased or renewed by existing tenants in FY15
A further 10,718 sqm of space was leased or renewed by existing tenants post balance date1
Property portfolio metrics improved despite challenging market conditions WALE of 4.8 years by Net Lettable Area increasing to 5.3 years1 post balance date Occupancy of 92.0% increasing to 94.4% post balance date1
Net Tangible Assets per Security increased to $2.02 as at 30 June 2015 or $2.05 excluding derivatives Weighted average cap rate of 8.13% firming from 8.29% as at 30 June 2014 Reduced lease expiry in FY16 to 0.5%3 of portfolio from 5.7% as at 30 June 2015
Reduced lease expiry in FY17 to 9.7%3 of portfolio from 12.1% as at 30 June 2015
53 Brandl Street, BTP sold above its book value
1
2
3
1. As at 31 July 2015. Includes certain transactions subject to documentation and approvals (refer Slide 13 for details)
Distribution of 16.2 cps together with improved occupancy and WALE
For
per
sona
l use
onl
y

7
FY2015 Results Summary (cont’d)
Capital structure maintained, capital actively managed Maintained Gearing1 at lower end of target range (30-40%): 33.4% as at 30 June 2015 Weighted average debt term of 3.4 years Weighted average all-in cost of the debt 4.4% p.a. Implemented on market Security buy-back purchasing 1.5 million Securities below NTA in FY2015
Distribution guidance FY2016 distribution guidance of 15.0 to 15.8 cents per Security Low end of distribution range assumes:
no further new leasing other than transactions which have been completed as at 17 August 2015; current market conditions continue; and no unforseen events occur, including tenant defaults
This represents a forecast FY2016 cash distribution yield of 8.1% to 8.5%1
4
5
Consistent capital management approach
1. Debt less cash divided by value of Portfolio 2. Based on price of $1.85 per Security as at 12 August 2015
For
per
sona
l use
onl
y
8
FINANCIAL RESULTS
For
per
sona
l use
onl
y

9
Income and distributions
$000s (unless otherwise stated) Actual
October 2013
IPO Forecast FY2015 FY15
Statutory net profit 22,772 23,800
Distributable Earnings 20,313 21,300
Distributions 20,131 20,900
Securities on issue (millions) 123.5 125.0
Statutory Earnings per Security (cents) 18.2 19.0
Distribution per Security (cents) 16.20 16.721
Payout ratio (%) 99% 98%
Tax deferred component of Distribution 45.5% 49.0%
■ IDR distributed 16.20 cents per Security in FY2015 in line with guidance in February 2015
■ As previously advised net rental income is lower than IPO forecast principally due to longer than forecast vacancy periods particularly in Brisbane; FY2015 Distributions per Security were 3.1% lower than Oct 2013 IPO forecasts
■ Note: portfolio for FY2015 differs to IPO portfolio (88 Brandl Street – IDR now owns 100%2, 53 Brandl Street – sold in FY15)
1. Revised guidance provided in February 2015 of 16.20 to 16.72 cents per Security 2. IDR owned a 50% interest in the property at IPO
For
per
sona
l use
onl
y

10
Balance sheet
$000s (unless otherwise stated) Actual Actual FY15 FY14 Change
Investment properties 399,883 403,971 ▼
Total assets 406,356 410,219 ▼
Total liabilities 156,518 160,095 ▼
Net tangible assets 249,838 250,124 ▼
Securities on issue (millions) 123.5 125.0 ▼
Net Tangible Assets per Security $2.02 $2.00 ▲ Net Tangible Assets per Security (Excluding derivatives liability) $2.05 $2.01 ▲
Gearing1 33.4% 33.4% -
■ Gearing 33.4% within target range of 30% - 40%
■ 53 Brandl Street, BTP sold above book value
■ Improved NTA per security to $2.05 from $2.01 as at FY2014, excluding derivatives
1. Debt less cash divided by value of Portfolio
For
per
sona
l use
onl
y

11
PORTFOLIO PERFORMANCE
For
per
sona
l use
onl
y

12
Industria REIT portfolio overview1
1. As at 31 July 2015. Includes certain transactions subject to documentation and approvals (refer Slide 13 for details)
Business Park Industrial
Adelaide, South Australia Sector Industrial
Investment properties 1 Value ($ million) 12.8
Weighted avg. cap rate 10.00% Occupancy (by area) 100%
WALE (years by area) 2.5
17 INVESTMENT PROPERTIES
$400m PORTFOLIO
VALUE
8.13% WEIGHTED
AVERAGE CAP RATE
94.4% OCCUPANCY
5.3 years WALE BY AREA
161,228 sqm
NLA
Melbourne, Victoria Sector Industrial
Investment properties 5 Value ($ million) 83.95
Weighted avg. cap rate 8.02% Occupancy (by area) 100%
WALE (years by area) 6.3
Sydney, New South Wales Sector Business Park
Investment properties 2 Value ($ million) 132.6
Weighted avg. cap rate 7.60% Occupancy (by area) 91.0%
WALE (years by area) 5.3
Brisbane, Queensland Sector Business Park
Investment properties 9 Value ($ million) 170.5
Weighted avg. cap rate 8.47% Occupancy (by area) 82.9%
WALE (years by area) 3.9 37 Brandl Street, BTP
Building C, 1 Homebush Day Drive
140 Sharps Road, Tullamarine 5 Butler Boulevard, Adelaide Airport
Portfolio overview as at 31 July 2015
For
per
sona
l use
onl
y
13
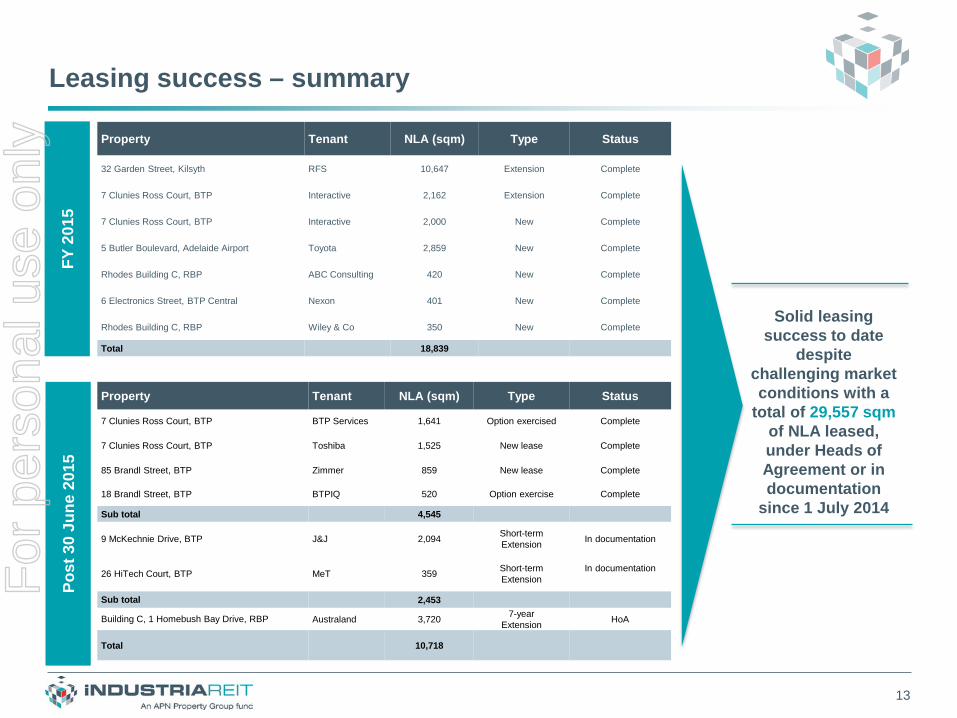
Leasing success – summary
Property Tenant NLA (sqm) Type Status
32 Garden Street, Kilsyth RFS 10,647 Extension Complete
7 Clunies Ross Court, BTP Interactive 2,162 Extension Complete
7 Clunies Ross Court, BTP Interactive 2,000 New Complete
5 Butler Boulevard, Adelaide Airport Toyota 2,859 New Complete
Rhodes Building C, RBP ABC Consulting 420 New Complete
6 Electronics Street, BTP Central Nexon 401 New Complete
Rhodes Building C, RBP Wiley & Co 350 New Complete
Total 18,839
Solid leasing success to date
despite challenging market conditions with a
total of 29,557 sqm of NLA leased, under Heads of Agreement or in documentation
since 1 July 2014
FY 2
015
Post
30
June
201
5
Property Tenant NLA (sqm) Type Status
7 Clunies Ross Court, BTP BTP Services 1,641 Option exercised Complete
7 Clunies Ross Court, BTP Toshiba 1,525 New lease Complete
85 Brandl Street, BTP Zimmer 859 New lease Complete
18 Brandl Street, BTP BTPIQ 520 Option exercise Complete
Sub total 4,545
9 McKechnie Drive, BTP J&J 2,094 Short-term Extension
In documentation
26 HiTech Court, BTP MeT 359 Short-term Extension
In documentation
Sub total 2,453
Building C, 1 Homebush Bay Drive, RBP Australand 3,720 7-year Extension HoA
Total 10,718
For
per
sona
l use
onl
y
14
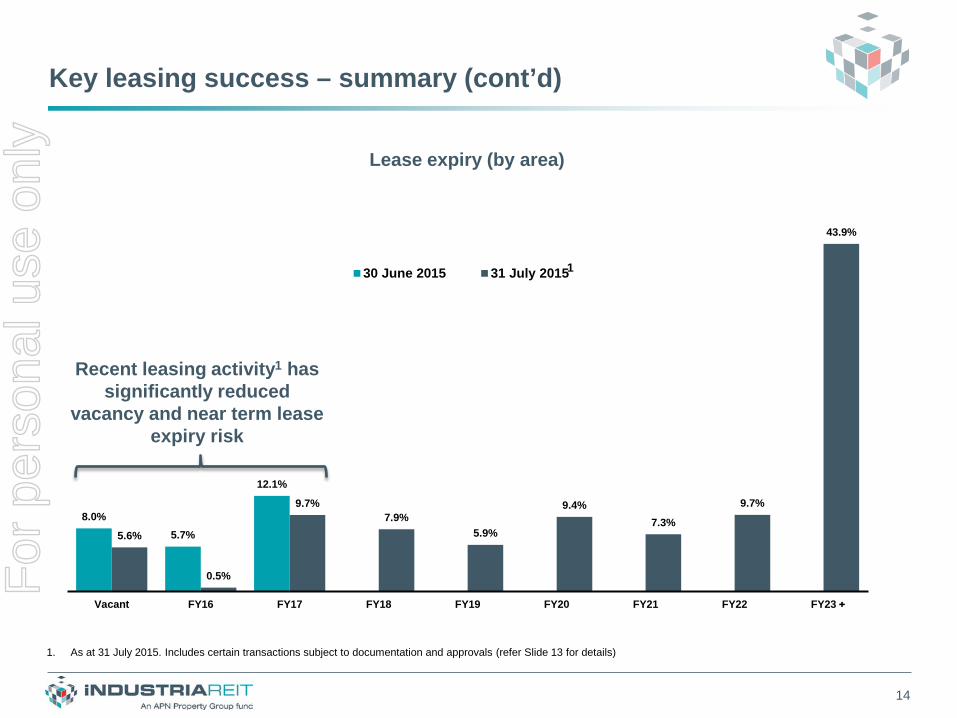
8.0% 5.7%
12.1%
5.6%
0.5%
9.7% 7.9%
5.9%
9.4% 7.3%
9.7%
43.9%
Vacant FY16 FY17 FY18 FY19 FY20 FY21 FY22 FY23
30 June 2015 31 July 2015
Key leasing success – summary (cont’d)
Lease expiry (by area)
Recent leasing activity1 has significantly reduced
vacancy and near term lease expiry risk
1. As at 31 July 2015. Includes certain transactions subject to documentation and approvals (refer Slide 13 for details)
1
For
per
sona
l use
onl
y

15
VIC 21.0%
QLD 42.6%
NSW 33.2%
SA 3.2%
Listed 23.2%
Multi National 43.5%
Govt 9.5%
Private 23.8%
Fixed 76.2%
Fixed & CPI 9.1%
CPI 14.7%
Portfolio summary
Components of Industria’s income stream
Tenant diversification (top 10 tenants by income) Geographic diversification (by value)
Rental review profile Tenant Diversification (by income)
Link Market Services
QLD Motorways
Australand
Mitre 10
AAE Retail
RFS
NAB
QLD Health
Dempsey Group
Interactive
15.1%
5.3%
5.1%
4.7%
4.6%
4.2%
4.1%
3.6%
3.5%
2.7%
For
per
sona
l use
onl
y
16
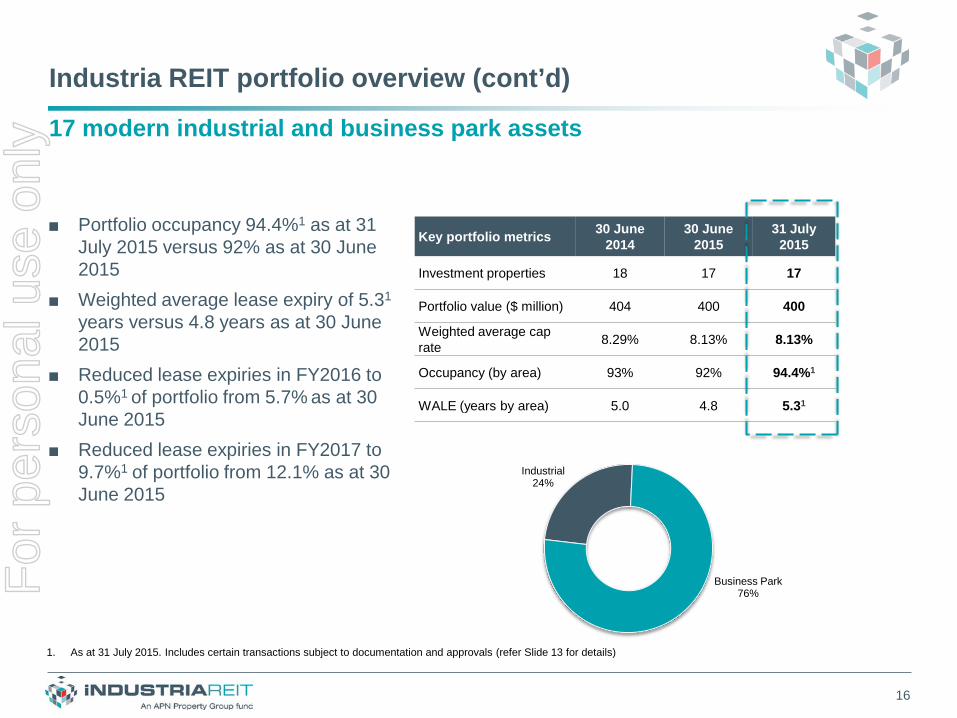
Industria REIT portfolio overview (cont’d)
17 modern industrial and business park assets
Key portfolio metrics 30 June 2014
30 June 2015
31 July 2015
Investment properties 18 17 17
Portfolio value ($ million) 404 400 400
Weighted average cap rate 8.29% 8.13% 8.13%
Occupancy (by area) 93% 92% 94.4%1
WALE (years by area) 5.0 4.8 5.31
■ Portfolio occupancy 94.4%1 as at 31 July 2015 versus 92% as at 30 June 2015
■ Weighted average lease expiry of 5.31 years versus 4.8 years as at 30 June 2015
■ Reduced lease expiries in FY2016 to 0.5%1 of portfolio from 5.7% as at 30 June 2015
■ Reduced lease expiries in FY2017 to 9.7%1 of portfolio from 12.1% as at 30 June 2015
Industrial 24%
Business Park 76%
1. As at 31 July 2015. Includes certain transactions subject to documentation and approvals (refer Slide 13 for details)
For
per
sona
l use
onl
y

17
Portfolio and management strategy – overview
Industria’s portfolio continues to be actively managed
Tran
sact
ions
Le
asin
g
Objective Strategy Achievements
■ Maintain high tenant retention
■ Reduce vacancies
■ Enhance portfolio WALE
■ Continue to explore recycling initiatives
■ Maximise short and long term value for IDR investors
■ Continue to nurture existing tenant relationships
■ Initiate tailored marketing campaigns to attract new tenants
■ Leasing transactions totalling 29,557 1 sqm of space
■ Portfolio WALE increased to 5.3 1 years
■ Reduce portfolio exposure to Brisbane suburban office market
■ Recycle assets to further change geographic and sector weightings in the portfolio where opportunities exist
■ Sale of 53 Brandl Street above its book value
1 Including leases subject to documentation and approvals
For
per
sona
l use
onl
y

18
CAPITAL MANAGEMENT
For
per
sona
l use
onl
y

19
Active capital management approach
1. Debt less cash, divided by the value of the Portfolio
Interest Rate Hedging Profile ■ Gearing1 of 33.4%
■ Target gearing range of 30% to 40%
■ Multiple lenders (ANZ and NAB) – staggered debt expiries
■ Facility limit: $155m – drawn: $135.6m
■ Facilities extended and repriced, reduced interest margins and line fee costs, effective February 2015
■ Weighted average all-in cost of debt of 4.4%
■ Weighted average debt expiry 3.4 years
■ Hedging profile consistent with stated policy
■ Weighted average duration of hedges 2.4 years
■ Approximately 1.5 million Securities bought back below NTA
Gearing level maintained, debt terms improved, buy back undertaken
Gea
ring
Deb
t In
tere
st R
ate
H
edgi
ng
$100m
$90m
$65m
$35m
$10m
0.00%
1.00%
2.00%
3.00%
4.00%
5.00%
6.00%
7.00%
$0m
$20m
$40m
$60m
$80m
$100m
$120m
FY16 FY17 FY18 FY19 FY20
A$Million hedged
Average hedged rate (excluding margin and line fees)
Buy
-bac
k For
per
sona
l use
onl
y

20
Capital Management and Distribution Policy
■ IDR has moved to Funds From Operations (FFO) for determining distributable profit from 1 July 2015
■ FFO will be determined by adjusting statutory net profit (under AIFRS) for:
□ Deferred tax
□ Straight lining of rental income
□ Rent free periods and amortised lease incentives
□ Property valuation adjustments
□ Mark to market adjustments for derivatives
□ Other non-cash items such as amortisation of debt establishment fees
■ This will allow investors and analysts to benchmark IDR’s performance on a more widely used basis amongst AREITs
■ Distributions will be based on a payout ratio of between 95% and 100% of FFO for FY2016
■ The payout ratio will be set with consideration to ongoing maintenance capital expenditure requirements as part of ongoing capital management
Reporting Funds From Operations (FFO)
For
per
sona
l use
onl
y
21
OUTLOOK
For
per
sona
l use
onl
y

22
Market outlook – Transaction activity
Property investor interest remains firm ■ Investment volumes remain strong as international investors remain active in the market ■ Investment yields expected to continue firming for modern well located assets
■ The sale of 53 Brandl Street, BTP was completed in December 2014, capitalising on a strong transaction market
■ Recycling initiatives continue to be explored, with the objective of reducing the portfolio’s exposure to the suburban office market in Brisbane
■ These initiatives, including any decision to buy or sell a particular property, will be pursued with the objective of maximising value for IDR’s investors
■ In seeking to maximise value for IDR’s investors, due consideration will be given to occupancy, weighted average lease expiry and future cash flow growth potential when considering any acquisition or divestment opportunity
For
per
sona
l use
onl
y
23
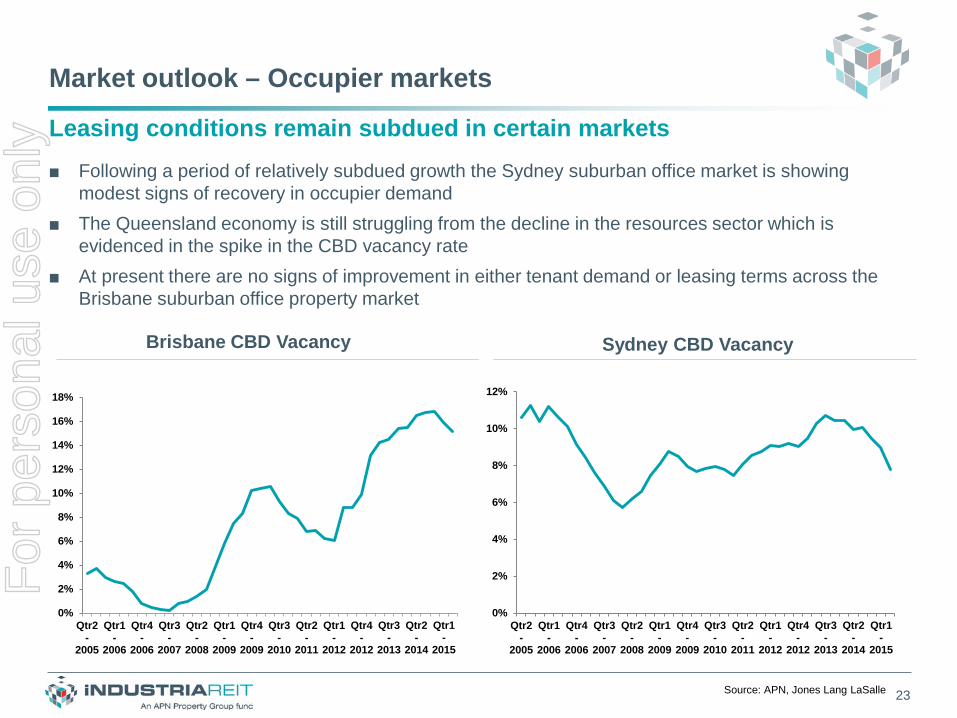
Market outlook – Occupier markets
Leasing conditions remain subdued in certain markets ■ Following a period of relatively subdued growth the Sydney suburban office market is showing
modest signs of recovery in occupier demand ■ The Queensland economy is still struggling from the decline in the resources sector which is
evidenced in the spike in the CBD vacancy rate ■ At present there are no signs of improvement in either tenant demand or leasing terms across the
Brisbane suburban office property market
Sydney CBD Vacancy Brisbane CBD Vacancy
0%
2%
4%
6%
8%
10%
12%
14%
16%
18%
Qtr2-
2005
Qtr1-
2006
Qtr4-
2006
Qtr3-
2007
Qtr2-
2008
Qtr1-
2009
Qtr4-
2009
Qtr3-
2010
Qtr2-
2011
Qtr1-
2012
Qtr4-
2012
Qtr3-
2013
Qtr2-
2014
Qtr1-
2015
0%
2%
4%
6%
8%
10%
12%
Qtr2-
2005
Qtr1-
2006
Qtr4-
2006
Qtr3-
2007
Qtr2-
2008
Qtr1-
2009
Qtr4-
2009
Qtr3-
2010
Qtr2-
2011
Qtr1-
2012
Qtr4-
2012
Qtr3-
2013
Qtr2-
2014
Qtr1-
2015
Source: APN, Jones Lang LaSalle
For
per
sona
l use
onl
y

24
Outlook – Industria REIT
Industria remains focussed on its objective of delivering stable cash returns with the potential for income and capital growth ■ A quality portfolio of workspace assets underpins Industria REIT
□ Focus on industrial and business park assets that provide tenants with modern, cost effective and practical spaces to meet their business needs
■ Leases to a diversified tenant base providing a secure and growing income stream □ Rental income underpinned by high occupancy and long leases to reputable tenants
□ Majority of income growth derived from fixed and / or CPI-linked rental increase
□ Continue to focus on asset management initiatives and leasing objectives whilst pursuing acquisition and divestment opportunities
For
per
sona
l use
onl
y

25
Outlook – Objective Le
asin
g Po
rtfo
lio
Opt
imis
atio
n C
apita
l M
anag
emen
t
■ Maintain high level of leasing activity
■ Retain WALE profile
■ Maintain and improve occupancy and cash flows
■ Continue to implement asset recycling strategy
■ Maximise occupancy level
■ Maintain and enhance portfolio value
■ Remain within stated gearing range of 30% - 40%
■ Enhance debt expiry profile
■ Continue to actively manage capital where appropriate
Value to Security
holders over short and long term
Industria’s objective of delivering stable cash income is unchanged
For
per
sona
l use
onl
y

26
FY2016 Distribution per Security guidance
Forecast FY2016 Distribution yield in excess of 8.0%
■ Consistent with our view of the market, FY2016 distribution guidance is 15.0 to 15.8 cents per Security
■ Low end of distribution range assumes: □ no leasing activity other than transactions which have been completed as at 17 August 2015; □ current market conditions continue; and □ no unforeseen events occur, including tenant defaults
■ Based on price per Security of $1.85 as at 12 August 2015 this represents a forecast cash Distribution yield of 8.1% to 8.5%
1. Based on Security price of $1.85 at 12 August 2015
For
per
sona
l use
onl
y

27
Attractive comparative yield and metrics
Source: APN, Bloomberg and company announcements/estimates based on unit prices as at market close on 12 August 2015
AREIT FY2016 Forecast Distribution Yields1 AREIT Premium to NTA1
1. Based on Security price of $1.85 as at 12 August 2015 (refer Slide 26 for details on Distribution guidance)
2.7%
4.
0%
5.1%
5.
2%
5.3%
5.
4%
5.6%
5.
6%
5.8%
5.
8%
6.0%
6.
1%
6.2%
6.
5%
6.6%
7.
0%
7.1%
7.
3%
7.3%
7.
6%
7.6%
7.
8% 8.1%
8.
1%
8.3%
8.
5%
8.9%
WFD
GM
GG
PTB
WP
GH
CIO
FSC
GD
XSM
GR
AB
PSC
PSG
PN
SRG
OZ
FET
CQ
RH
PIA
RF
GM
FC
MW
AJD AN
IID
RG
DI
TOF
TIX
CM
A
-8%
-7
%
-2%
6%
7%
8%
10
%
11%
13
%
14%
14
%
16%
18
%
19%
21
%
28%
28
%
33%
40%
40
%
41%
50%
50
%
56%
67%
71
%
98%
IDR
GD
ITO
FC
MA
TIX
MG
RIO
FG
MF
AN
IA
JDSG
PD
XSG
PTC
QR
SCP
AB
PSC
GH
PIFE
TA
RF
GO
ZB
WP
GH
CW
FDN
SRC
MW
GM
GFor
per
sona
l use
onl
y

28
APPENDICES
For
per
sona
l use
onl
y

29
Detailed Property Portfolio APPENDIX A
For
per
sona
l use
onl
y

30
Portfolio details as at 30 June 2015
Property State Ownership Sector Valuation ($m)
Cap Rate
NLA (sqm)
Occupancy (by area)
WALE (by area)
NPI ($m)
34 Australis Drive, Derrimut VIC 100% Industrial 21.7 7.75% 25,243 100% 7.43 yrs 1.783
80-96 South Park Drive, Dandenong South VIC 100% Industrial 18.7 8.25% 20,245 100% 2.48 yrs 1.621
89 West Park Drive. Derrimut VIC 100% Industrial 15.8 7.75% 17,024 100% 7.16 yrs 1.335
32-40 Garden Street, Kilsyth VIC 100% Industrial 14.8 7.75% 10,647 100% 9.48 yrs 1.481
5 Butler Boulevard, Adelaide Airport SA 100% Industrial 12.8 10.00% 12,257 100% 1.64 yrs 1.370
140 Sharps Rd, Tullamarine VIC 100% Industrial 13.1 8.75% 10,508 100% 7.26 yrs 1.468 7 Clunies Ross Court and 17–19 McKechnie Drive, BTP QLD 100% Bus Park 37.2 8.50% 8,937 59% 3.68 yrs 1.470
BTP Central, BTP QLD 100% Bus Park 39.7 7.78% 7,783 81% 3.55 yrs 2.897 8 Clunies Ross Court and 9 McKechnie Drive, BTP QLD 100% Bus Park 23.5 8.75% 5,681 81% 1.66 yrs 2.293
7 Brandl Street, BTP QLD 100% Bus Park 22.2 8.50% 5,264 88% 4.79 yrs 1.785
37 Brandl Street, BTP QLD 100% Bus Park 13.7 8.75% 3,329 100% 2.28 yrs 1.289
18 Brandl Street, BTP QLD 100% Bus Park 11.8 9.00% 4,174 47% 0.97 yrs 0.637
88 Brandl Street, BTP QLD 100% Bus Park 14.0 8.88% 3,283 100% 1.82 yrs 1.066
85 Brandl Street, BTP QLD 100% Bus Park 5.0 9.25% 1,627 0% 0.00 yrs -0.023
Building A, Rhodes NSW 100% Bus Park 81.0 7.50% 14,644 100% 5.74 yrs 6.147
Building C, 1 Rhodes NSW 100% Bus Park 51.6 7.75% 10,582 79% 2.04 yrs 2.816
Land (Lot 3 Brandl Street) QLD 100% Bus Park 1.0 N/A - - - -
Land (45 and 45B BTP Central) QLD 100% Bus Park 2.5 N/A - - - -
53 Brandl Street, BTP QLD Nil (sold) Bus Park - - - - - 0.209
Total 400 8.13% 161,228 92.0% 4.8 yrs 29.644
For
per
sona
l use
onl
y

31
Financial Information APPENDIX B
For
per
sona
l use
onl
y

32
Balance sheet
30 June 2015 $’000s
Assets Cash and cash equivalents 1,873 Trade and other receivables 3,992 Other current assets 519
Total current assets 6,384 Investment properties 399,883 Other assets 89
Total non-current assets 399,972 Total assets 406,356 Liabilities
Trade payables and other provisions (6,600) Derivative instruments (1,216) Distribution payable (9,681)
Total current liabilities (17,497) Trade and other payables (180) Deferred tax liability (2,303) Derivative instruments (1,869) Long-term borrowings (134,669)
Total non-current liabilities (139,021) Total liabilities (156,518) Net assets 249,838
Number of Securities (millions) 123.5 NTA per Security ($) 2.02 F
or p
erso
nal u
se o
nly

33
Profit & Loss Actual
FY2015 October
2013 IPO Forecast
$’000 $’000 Income
Net rental income (including straight lining adjustments) 29,644 32,200 Share of equity accounted profit - 600
Total revenue from continuing operations 29,644 32,800 Expenses
Trust management fees (2,219) (2,200) Recurring trust costs (591) (600)
Total expenses (2,810) (2,800) Net operating income (EBIT) 26,834 30,000
Net gain in fair value adjustments on investment properties 3,257 - Gains on disposal of investment properties 668 - Unrealised loss on mark to market of interest rate swaps (1,776) - Net interest expense (6,215) (6,200)
Net income before tax 22,768 23,800 Income tax – current (74) - Income tax – deferred 78 -
Net profit after tax 22,772 23,800
For
per
sona
l use
onl
y

34
Distribution reconciliation
Actual October 2013 IPO
FY2015 Forecast
$’000 $’000
Comprehensive income / Statutory profit 22,772 23,800
Adjust for:
Straight lining adjustments included in rental revenue (1,223) (2,700)
Deferred tax (78) -
Amortised borrowing costs 323 200
FV gain on investment properties (3,257) -
FV loss on mark to market of derivatives 1,776 -
Distributable Earnings 20,313 21,300
Distribution 20,131 20,900
Distribution per Security (cents) 16.20 16.72
Payout ratio (Distribution / Distributable Earnings) 99% 98%
Distributable Earnings 20,313
Add back amortised lease incentives 985
FFO Distributable Earnings 21,298
Payout ratio (Distribution / FFO Distributable Earnings) 94.5%
From 1 July 2015 Industria REIT has adopted a new definition for reporting earnings. Industria REIT will report and guide to FFO from FY2016 and beyond. Below is an illustrative reconciliation of FY2015 FFO.
For
per
sona
l use
onl
y
35
Disclaimer
This presentation was prepared by APN Funds Management Limited (ABN 60 080 674 479) (the "Responsible Entity") in respect of Industria REIT (ARSN 125 862 875) (“IDR") and by Industria Company No 1 Limited (ACN 010 794 957). Information contained in this presentation is current as at 17 August 2015. This presentation is provided for information purposes only and has been prepared without taking account of any particular reader’s financial situation, objectives or needs. Nothing contained in this presentation constitutes investment, legal, tax or other advice. Accordingly, readers should, before acting on any information in this presentation, consider its appropriateness, having regard to their objectives, financial situation and needs, and seek the assistance of their financial or other licensed professional adviser before making any investment decision. This presentation does not constitute an offer, invitation, solicitation or recommendation with respect to the subscription for, purchase or sale of any security, nor does it form the basis of any contract or commitment.
Except as required by law, no representation or warranty, express or implied, is made as to the fairness, accuracy or completeness of the information, opinions and conclusions, or as to the reasonableness of any assumption, contained in this presentation. By reading this presentation and to the extent permitted by law, the reader releases the Responsible Entity and its affiliates, and any of their respective directors, officers, employees, representatives or advisers from any liability (including, without limitation, in respect of direct, indirect or consequential loss or damage or loss or damage arising by negligence) arising in relation to any reader relying on anything contained in or omitted from this presentation.
The forward looking statements included in this presentation involve subjective judgment and analysis and are subject to significant uncertainties, risks and contingencies, many of which are outside the control of, and are unknown to, the Responsible Entity. In particular, they speak only as of the date of these materials, they assume the success of IDR's business strategies, and they are subject to significant regulatory, business, competitive and economic uncertainties and risks. Actual future events may vary materially from forward looking statements and the assumptions on which those statements are based. Given these uncertainties, readers are cautioned not to place reliance on such forward looking statements. Past performance is not a reliable indicator of future performance.
The Responsible Entity, or persons associated with it, may have an interest in the securities mentioned in this presentation, and may earn fees as a result of transactions described in this presentation or transactions in securities in IDR.
For
per
sona
l use
onl
y

36
Industria REIT Level 30,101 Collins Street, Melbourne, Vic 3000 industriareit.com.au
Laurence Parisi Fund Manager Ph: (03) 8656 1000 [email protected]
For
per
sona
l use
onl
y


