108
ANNUAL REPORT 2015 For personal use only

ANNUAL REPORT
2015916CRN2876_JB_Hi-Fi_Annual_Report_2015 - 1 - Cover_v1.indd 2 11/08/2015 12:05:48 PM
For
per
sona
l use
onl
y

Financial Summary
JB Hi-Fi Limited ABN 80 093 220 136
Sales $3.65b
NPAT(ii) $136.5m Stores
EBIT $200.9m
FINANCIAL PERFORMANCE2011
Normalised(i)2011
Statutory2012
Statutory2013
Statutory2014
Statutory2015
Statutory Growth
Sales $2.96b $2.96b $3.13b $3.31b $3.48b $3.65b 4.8%
EBIT $196.0m $162.6m $161.5m $177.8m $191.1m $200.9m 5.1%
NPAT(ii) $134.4m $109.7m $104.6m $116.4m $128.4m $136.5m 6.4%
Earnings per share 124.7cps 101.8cps 105.9cps 117.7cps 128.4cps 137.9cps 7.4%
Total dividend - fully franked 77.0cps 77.0cps 65.0cps 72.0cps 84.0cps 90.0cps 7.1%
2011 2012 2013 2014 2015
(i) Excludes the Clive Anthonys restructuring charge ($24.7m post tax) announced in March 2011(ii) Profi t attributable to the owners of JB Hi-Fi Limited, excludes non-controlling interests
2011 2012 2013 2014 2015
$3.31b
$177.8m
$2.96b
$3.13b $196.0m(i)
$161.5m
$3.48b
$191.1m
$162.6m
$3.65b
$200.9m
2011 2012 2013 2014 2015
$116.4m
$104.6m
$134.4m(i)
$109.7m
$128.4m
$136.5m
2011 2012 2013 2014 2015
177
157168
182187
916CRN2876_JB_Hi-Fi_Annual_Report_2015 - 2 - Inside Cover (Colour)_v4.indd 2 1/09/2015 5:55:41 PM
For
per
sona
l use
onl
y

1
Dear fellow shareholder,
It’s pleasing to record that the year ended 30 June 2015 was a
record year for JB Hi-Fi Limited with sales, profi ts and dividends
all up on the prior year. This result was driven by improved
gross margins, our continued emphasis on customer service
and ongoing cost control.
Overview
JB Hi-Fi Limited achieved sales of $3.65 billion in FY15, with
total sales growth of 4.8% and comparable sales growth of
2.9%. Of particular note was how our sales and earnings
momentum grew through the fi nancial year. Trading in June was
particularly strong, as we cycled a soft trading period in the prior
year and enjoyed the benefi ts of solid sales growth assisted by
the small business tax incentives.
Net profi t after tax was up 6.4% to $136.5m, earnings per share
was up 7.4% to 137.9 cents per share and the total dividend for
FY15 was up 7.1% on the prior year to 90.0 cents per share.
Gross margin improved 16 basis points to 21.9%
(FY14: 21.7%) driven by a combination of sales mix and
improved buying terms.
Total operating costs were in line with our expectations as
we maintained our low CODB through continued focus on
productivity and minimising indirect expenditure. Our low cost
of doing business, at 15.3%, continues to be a competitive
advantage and remains lower than our major listed competitors.
Store wages remained well controlled during FY15 as we
invested in our HOME store rollout and continued to deliver the
high standard of customer service that JB Hi-Fi is known for.
The balance sheet continues to grow in strength with relatively
low fi nancial and operating leverage, evidenced by our solid
fi xed charges cover of 3.4 times, gearing of 0.6 and interest
cover of 33.9 times. In June 2015, the Group renewed its term
debt facility of $200.0 million until June 2018.
JB Hi-Fi is a discount retailer with the ability to consistently offer
everyday low prices through the scale of our operations, high
stock turnover and low cost of doing business. We offer one of
the largest ranges of home entertainment, consumer electronic
and home appliances at discounted prices, positioned to appeal
to all customers.
JB Hi-Fi has the ability to bring brands to life and create
engagement in categories, both in store and out of store.
We have the reputation for taking the deal, price leadership,
distinctive brand personality and a low cost operating model
which underpins our competitive pricing.
JB Hi-Fi is constantly innovating to ensure that it remains
current and relevant to its customers. We have a culture of
embracing change, which is seen as a “natural” part of the
business. Our stores have relatively high sales per square metre,
when compared to many local competitors and comparable
international businesses. They are located in high foot traffi c
precincts which allow both convenient access for customers
and maximise impulse traffi c.
Our motivated, passionate and knowledgeable staff members
continue to be one of our most important assets. A busy and
enjoyable working environment means that JB Hi-Fi continues
to attract and retain high calibre staff.
In Store
We had 187 stores in Australia and New Zealand at 30 June 2015,
with fi ve new stores opened during the year. During FY16 we
expect to open six new stores and we maintain our stated target
of 214 stores across Australia and New Zealand.
As at 30 June 2015 we had 43 JB Hi-Fi HOME stores, with
four new JB Hi-Fi HOME stores opened and 17 JB Hi-Fi stores
converted to JB Hi-Fi HOME during FY15. The Company is
currently targeting a total of 75 JB Hi-Fi HOME stores across
Australia and New Zealand. Each new JB Hi-Fi HOME store
contributes to growing our customer awareness, market
share and supplier support. This, combined with our ongoing
investment in store wages, staff training and supply chain,
places us in a good position as we continue with our expansion.
In addition to our HOME store roll-out, we are currently introducing
small appliances into existing JB Hi-Fi stores. We see the rollout
of small appliances to our existing store network as a natural
progression of our proven home appliances strategy. These stores
will have their layout reconfi gured and will remain branded as
JB Hi-Fi. We believe that small appliances are particularly suited
to our shopping centre locations and they have been added to
four JB Hi-Fi stores to date, with pleasing results. 14 additional
JB Hi-Fi stores will range small appliances by November 2015.
The home appliances market in Australia is circa $4.6 billion,
larger than many of the other categories JB Hi-Fi operates in,
and presents a signifi cant opportunity for us as we leverage the
strength and trust in the JB Hi-Fi brand. By leveraging our strong
heritage in innovation and technology, we see our continued
expansion into home appliances and ultimately the connected
home as a signifi cant opportunity for JB Hi-Fi in the future.
Chairman’s and Chief Executive Offi cer’s Report
For
per
sona
l use
onl
y

2
We continue to both review our existing store portfolio and to
apply stringent store selection criteria to potential new sites to
ensure that they offer JB Hi-Fi a high level of foot traffi c and
convenient access for customers. This considered approach
to our existing and new store locations means stores should
continue to deliver comfortably in excess of their cost of capital.
Total Stores: 187*
2
35
9
2
51
50
5
14
19
* As at 30 June 2015
Out of Store
Online sales continue to grow, up 16.9% in FY15, and
represent approximately 2.4% of total sales (FY14: 2.2%).
Unique visitors to JB Hi-Fi’s websites during FY15 averaged
1.2 million per week.
We recently rebranded our commercial and education solutions
offer as JB Hi-Fi Solutions, in line with our plan to provide an
integrated offer of both products and services to business,
government and education clients across Australia. JB Hi-Fi
Solutions is a key driver of our future growth and we enter FY16
with an aggressive recruitment plan as we expand our product
and service offer. JB Hi-Fi Solutions remains on track to deliver
on its longer term aspirational sales target of approximately
$500 million per annum, through both organic growth and
strategic acquisitions.
We continue to develop our low cost, fi t-for-purpose supply
chain and logistics solution, with facilities now operating in
Melbourne, Sydney, Brisbane, Perth and Auckland. In other
states and regional centres where stand-alone facilities are
not currently economic, the HOME rollout allows for expanded
back-of-house storage areas.
Executive Appointments
In August 2015 we announced the appointments of Kevin
Ramsdale as Marketing Director and Simon Page as Chief
Information Offi cer. Both Kevin and Simon are proven executives
and highly regarded in their respective fi elds. Kevin has a strong
track record of driving commercial performance in customer
focused businesses and Simon has consistently delivered high
quality technology solutions. Kevin and Simon will commence
with JB Hi-Fi during September 2015 and we are delighted to
have them join the JB Hi-Fi team.
Board Changes
In August 2015 we announced the intention of James King to
retire as a non-executive director following JB Hi-Fi’s AGM on
29 October 2015 and the appointment of Wai Tang as a
non-executive Director with effect from 14 September 2015.
James joined the Board in May 2004 and was Chairman of the
Company between May 2006 and September 2007. James has
made a signifi cant contribution to JB Hi-Fi and his experience,
expertise and advice have been of great value to the business
as it has gone from strength to strength over the past 11 years.
The Board thanks James for his valuable service and
contribution to JB Hi-Fi.
Wai has extensive experience in managing retail businesses
and in supply chain and operations management. She has
performed senior executive roles as Operations Director for
Just Group and as CEO of the Peter Alexander sleepwear
business. Prior to joining Just Group she was General Manager
of Business Development for Pacifi c Brands. Wai was the
founder of the Happy Lab gourmet confectionary business and
is currently also a non-executive director of Federation Centres,
Kikki K and the Melbourne Festival. Her past board positions
include non-executive directorships with Specialty Fashion
Group and the Melbourne Fashion Festival.
The Board is delighted to welcome Wai to the Board. Wai brings
a wealth of retail industry experience at both a senior executive
and board level, and we look forward to working with her.
Board and Management Approach
The Board recognises the importance of governance,
environmental and social matters to our shareholders,
suppliers and customers and continually reviews and monitors
developments in corporate governance which are relevant to
JB Hi-Fi. The Board is committed to ensuring that JB Hi-Fi’s
business is conducted ethically and in accordance with high
standards of corporate governance.
The relationship between the Board and management is strong
and remains engaging and constructive. It continues to be an
integral part of the Board’s strategy to encourage innovation and
diversifi cation with new products, technology, merchandising
formats, advertising and property locations in a controlled and
responsible manner. This approach provides opportunities to
increase revenue, margin and productivity.
The Board fi rmly believes that equity participation through
JB Hi-Fi’s employee option plan maintains a strong alignment with
shareholders and is a critical tool in attracting new management,
retaining existing management and rewarding performance.
JB Hi-Fi’s workplace giving program, established in 2008 and
known as Helping Hands, enables JB Hi-Fi directors, executives
and employees to donate to registered charitable organisations.
JB Hi-Fi matches dollar for dollar regular employee contributions
through its payroll system, effectively doubling the fi nancial benefi t
CHAIRMAN’S AND CHIEF EXECUTIVE OFFICER’S REPORT (continued)
For
per
sona
l use
onl
y

3
to our community partners. Workplace giving programs have
proved to be a very effective way for employers and employees to
join together to support the community. Through the combined
giving of JB Hi-Fi and its employees, we believe we make a
real difference to the charities in the program. In FY15 almost
$1.7 million was raised and, since its inception, JB Hi-Fi and its
employees are proud to have raised more than $7.4 million.
The Helping Hands program has driven the placement of
“Change for Change” boxes in all stores across Australia
from September 2010 and in New Zealand since May 2012.
All donations collected are shared evenly amongst JB Hi-Fi’s
charity partners. In FY15 over $50,000 has been collected in
Australia and, since inception, the program has raised over
$430,000. In New Zealand approximately $20,000 has been
collected since boxes were fi rst introduced into stores.
JB Hi-Fi promotes environmental sustainability and is committed
to reducing the impact that its business has on the environment.
Capital Management
JB Hi-Fi regularly reviews all aspects of its capital structure
with a focus on maximising returns to shareholders. Continued
solid earnings growth and prudent management of our balance
sheet, including relatively low gearing, enables us to consider
various capital management initiatives.
In September 2014 we completed an on-market share
buy-back of 0.3 million ordinary shares at a cost of $5.0 million
in order to offset the dilutionary impact of shares issued to
employees under JB Hi-Fi’s share option plans.
On 10 August 2015 we announced that we would continue
with our on-market buy-back program with a buy-back of
a maximum of 0.8 million ordinary shares to commence in
September 2015.
The Board has declared a fi nal dividend of 31.0 cents per share
fully franked (FY14: 29.0 cents per share), bringing the total
dividend for FY15 to 90 cents per share, up 7.1% on the prior
year. The Board believes that our dividend payout ratio of 65%
appropriately balances the distribution of profi t to shareholders
and the reinvestment of earnings for future growth.
77.065.0
72.0
84.090.0
Total Dividend up 7.1%
Dividends (cps)
FY11 FY12 FY13 FY14 FY15
Outlook
With an aggressive store investment program and an expanded
JB Hi-Fi Solutions offer, we are well positioned to drive sales
and earnings growth in FY16.
Our store investment program in FY16 includes the ongoing
rollout of JB Hi-Fi HOME, the continued rollout of small
appliances to a number of existing stores, and upgrades to a
number of our existing stores. We expect JB Hi-Fi Solutions to
also be a key driver of our future growth and we enter FY16 with
an aggressive recruitment plan as we expand our product and
service offer.
In FY16 we expect:
to open six new stores;
to convert 16 existing stores to JB Hi-Fi HOME; and
total sales to be circa $3.85 billion.
The key success drivers of JB Hi-Fi continue to be having the
biggest range and the lowest prices, supported by talented and
enthusiastic staff. Your Board and management team remain
committed to maintaining this.
We look forward to another exciting and successful year in FY16.
Greg Richards Richard Murray
Chairman Chief Executive Offi cer
Melbourne,
21 August 2015
For
per
sona
l use
onl
y

4JB Hi-Fi Limited ABN 80 093 220 136
Page
Governance, environmental and social statements 5
Directors’ report 15
Operating and fi nancial review 20
Remuneration report 28
Auditor’s independence declaration 59
Independent auditor’s report 60
Directors’ declaration 62
Statement of profi t or loss 63
Statement of profi t or loss and other comprehensive income 64
Balance sheet 65
Statement of changes in equity 66
Statement of cash fl ows 67
Notes to the fi nancial statements 68
Additional securities exchange information 103
Annual Reportfor the fi nancial year ended 30 June 2015
4
For
per
sona
l use
onl
y

5
GOVERNANCE, ENVIRONMENTAL AND SOCIAL STATEMENTS
JB Hi-Fi Limited (“the Company” or “JB Hi-Fi”) recognises the importance of Governance, Environmental and Social matters to
our shareholders, suppliers and customers. The Board continually reviews and monitors developments in corporate governance
which are relevant to the Group (being the consolidated entity consisting of the Company and the entities it controls).
CORPORATE GOVERNANCE STATEMENT
The directors and management of JB Hi-Fi are committed to ensuring that the Company’s business is conducted ethically and in
accordance with high standards of corporate governance.
The Board believes that JB Hi-Fi’s policies and practices comply in all material respects with the 3rd edition of the ASX Corporate
Governance Council Principles and Recommendations (the “ASX Recommendations”). The Board believes that, during the 2015
fi nancial year, it has been compliant with the spirit of the principles contained in the ASX Recommendations.
This Corporate Governance Statement has been approved by the Board and is effective as at 10 August 2015.
THE BOARD
Role
The primary role of the Board is to protect and enhance long-term shareholder value. The Board is accountable to shareholders
for the performance of the Company and it directs and monitors the business and affairs of the Company on behalf of
shareholders.
The Board’s responsibilities include the corporate governance of the Company, overseeing the business and affairs of the
Company, communicating with the Company’s shareholders and the community, evaluating the performance of executives,
ensuring that appropriate procedures are in place so that the Company’s business is conducted in an honest, open and ethical
manner and the establishment of a formal and transparent procedure for the selection, appointment and review of directors.
The Chief Executive Offi cer, who is accountable to the Board, is responsible for managing, directing and promoting the profi table
operation and development of JB Hi-Fi.
A copy of the Board Charter can be found on the Company’s website at www.jbhifi .com.au via the “Investors” and “Governance”
sections.
Composition / Selection and appointment of directors
The Board seeks to ensure that the combination of its members provides an appropriate range of experience, skills, diversity,
knowledge and perspective to enable it to carry out its obligations and responsibilities.
The Board believes that having a range of different skills, backgrounds, experience and gender ensures a diversity of viewpoints
which facilitate effective governance and decision making.
The Company believes that skills and experience in the areas listed below are desirable for its Board to perform its role effectively.
The Board considers that its current composition possesses an effective blend of these skills and experience which enables it
and its Committees to effectively govern the business, operate effectively and add value in the context of the Company’s strategy.
• Executive/Management experience
• Retail knowledge and expertise
• Operational Management expertise and experience
• Financial expertise and qualifi cations
• Property expertise
• Mergers & Acquisitions expertise and experience
• Governance expertise and experience
• Other board experience
• Experience in setting executive remuneration
• Risk Management expertise and experience
GOVERNANCE, ENVIRONMENTAL AND SOCIAL STATEMENTS
5
For
per
sona
l use
onl
y

6
JB Hi-Fi maintains a majority of non-executive directors on its Board. The Board currently comprises six directors, being fi ve
non-executive directors, including the Chairman, and one executive director, being the Chief Executive Offi cer. The Company
has written agreements with each director setting out the terms of his/her appointment. Apart from the Chief Executive Offi cer,
directors are subject to shareholder re-election by rotation at least every three years. The Company provides shareholders with
all material information in its possession relevant to the election or re-election of a director.
A copy of the Company’s Board Composition & Succession Policy, which includes the procedure for the selection and
appointment of directors, can be found on the Company’s website at www.jbhifi .com.au via the “Investors” and “Governance”
sections. The Board will undertake appropriate checks before appointing any person or putting forward to shareholders a
candidate for election as a director.
Details of the directors as at the date of this report, including further information about their experience, expertise and term of
offi ce, are set out in the Directors’ Report.
Independence
JB Hi-Fi considers that each of its directors (including the Chairman) is independent with the exception of Richard Murray, the
Chief Executive Offi cer.
The Board regards directors as independent directors if they: do not have a material relationship with the Company other than
solely as a result of being a director; are independent of management; and do not have any business or other relationship that
could compromise the independent exercise of their judgement and their ability to act in the best interests of the Company.
The independence of each director is considered on a case-by-case basis.
Gary Levin and James King have each been non-executive directors of the Company for over 10 years and have a deep
understanding of the Company and its business. The Board has considered their independence, including in view of their length
of tenure as directors of the Company. The Board is of the opinion that, notwithstanding their length of service, both Gary and
James remain independent and continue to provide valuable input to the Board. The Board does not believe that either director
has formed associations with management (or other stakeholders) that might interfere with, or compromise, their respective
abilities to exercise independent, unfettered judgement or act in the best interests of the Company.
Richard Uechtritz was Chief Executive Offi cer of the Company between July 2000 and May 2010 and a consultant to the
Company from May 2010 to November 2013. Given the nature of the consultancy arrangements (and that Richard was not
provided with remuneration for that role but was, instead, allowed to retain options granted to him whilst he was CEO) and the
passage of time, the Board is of the opinion that Richard is an independent director, and that neither these previous roles, nor his
relationship with current management, compromises his ability to exercise independent, unfettered judgement or act in the best
interests of the Company.
Beth Laughton is a non-executive director and member of the audit, compliance & risk management committee of GPT Funds
Management Limited, the responsible entity for the GPT Wholesale Offi ce Fund and GPT Wholesale Shopping Centre Fund. The
GPT Wholesale Shopping Centre Fund has ownership interests in 11 shopping centres in which the Company currently leases
stores. The Board is of the opinion that Beth is an independent director on the basis that individual leasing arrangements at both
the Company and GPT are generally determined at a managerial level rather than Board level. In addition, the Company’s internal
protocols provide that Beth would be excluded from any discussion and decision making where any confl ict of interest arises
between Beth’s role as a director of the Company and her role as a director of GPT Funds Management Limited.
Confl ict of Interest
If a confl ict of interest arises, the director concerned does not receive the relevant Board papers, is not present at the meeting
whilst the item is considered and takes no part in decision-making. Directors must keep the Board advised, on an ongoing basis,
of any interests that could potentially confl ict with those of the Company. Directors are required to promptly disclose to the Board
interests in contracts, other directorships or offi ces held, possible related party transactions and any other material personal
interests in a matter relating to the Company’s affairs.
Board meetings
The Board meets regularly, dependent on business requirements. Prior to any meeting, the directors receive all necessary Board
papers. As well as holding regular Board meetings, the Board also meets to comprehensively review business plans and the
strategy of the Group.
GOVERNANCE, ENVIRONMENTAL AND SOCIAL STATEMENTS (continued)
For
per
sona
l use
onl
y

7
Access to information and independent advice
Each director has the right of access to all relevant Company information and to the Company’s executives. Subject to prior
consultation with the Chairman, each director may seek independent professional advice at the Company’s expense.
Professional Development of Directors
The Company recognises the need for its directors to develop and maintain the skills and knowledge needed to perform their
roles as directors effectively. The Company provides the directors with briefi ngs and advice on developments in both the law
and current practice in areas relevant to the Company and their role as directors (including, for example, corporate governance,
accounting and remuneration). The Company does this using both the Company’s external advisors (including the Company’s
auditors and legal and remuneration advisors) and management (including the Chief Financial Offi cer and the Company Secretary
& General Counsel). Individual directors also take advantage of professional development opportunities provided by third parties
such as the Australian Institute of Company Directors and major accounting and legal fi rms.
The Company has an induction program for new directors.
BOARD COMMITTEES
Details of the Committees established by the Board are set out below.
Audit and Risk Management Committee
The Board has established an Audit and Risk Management Committee.
The Audit and Risk Management Committee is charged primarily with assisting the Board in its:
• oversight of the reliability and integrity of the Company’s fi nancial management, fi nancial reporting and disclosure, and
related non-fi nancial reporting and disclosure practices;
• oversight of the independence, performance, appointment and removal of the external auditor; and
• review of the Company’s policies on risk oversight and management, and in discharging its responsibility to satisfy itself that
an adequate and sound system of risk management and internal control has been implemented to manage the material risks
affecting the Company’s business, including compliance with all applicable laws.
A copy of the Audit and Risk Management Committee Charter can be found on the Company’s website at www.jbhifi .com.au
via the “Investors” and “Governance” sections.
During the 2015 fi nancial year, the Audit and Risk Management Committee comprised the following non-executive directors,
all of whom were independent with relevant fi nancial, commercial and risk management experience, including an independent
chairman who is not the Chairman of the Board:
• Beth Laughton: Ongoing member and Chair of Committee;
• James King: Ongoing member of Committee; and
• Gary Levin: Ongoing member of Committee.
Details of the background and experience of each of these non-executive directors are outlined in the Directors’ Report.
The Audit and Risk Management Committee meets regularly. Details of the meetings held and members’ attendance during
the 2015 fi nancial year are listed in the Directors’ Report. Directors who are not members of the Audit and Risk Management
Committee may attend any Audit and Risk Management Committee meeting.
Remuneration Committee
The Board has established a Remuneration Committee.
The Remuneration Committee is charged primarily with reviewing and making recommendations to the Board regarding the
remuneration of executive offi cers and non-executive directors, and the policies for remuneration and compensation programs of
the Company generally.
A copy of the Remuneration Committee Charter can be found on the Company’s website at www.jbhifi .com.au via the “Investors”
and “Governance” sections.
For
per
sona
l use
onl
y
8
During the 2015 fi nancial year, the Remuneration Committee comprised the following directors, each of whom are considered by
the Company to be independent:
• Greg Richards: Ongoing member and Chair of Committee;
• Gary Levin: Ongoing member of Committee; and
• James King: Ongoing member of Committee.
The Remuneration Committee meets as required. Details of the meetings held and members’ attendance during the 2015
fi nancial year are listed in the Directors’ Report. Directors who are not members of the Remuneration Committee may attend a
Remuneration Committee meeting at the invitation of the Chairman when considered appropriate.
Nominations Committee
The Board has decided not to establish a Nominations Committee. Rather the Board itself is responsible for:
• Board succession planning and ensuring that the Board has the appropriate balance of skills, knowledge, experience,
independence and diversity to enable it to discharge its duties and responsibilities effectively (including the process for
recruiting new directors);
• induction programs for new directors;
• establishing formal and transparent procedures for the selection and appointment of new directors to the Board;
• selecting, appointing and regularly evaluating the performance of, and planning for the succession of, the Chief Executive
Offi cer; and
• developing and instituting internal procedures for evaluating Board performance and the performance of individual directors
and Board Committees.
A copy of the Board Charter and the Board Composition & Succession Policy can be found on the Company’s website at
www.jbhifi .com.au via the “Investors” and “Governance” sections.
COMPANY SECRETARY
The Company Secretary is accountable directly to the Board, through the Chair, on all matters to do with the proper functioning
of the Board.
CODE OF CONDUCT
JB Hi-Fi acknowledges the need for directors, executives and employees to observe the highest ethical standards of corporate
behaviour. JB Hi-Fi has adopted a Code of Conduct to provide directors, executives and employees with guidance on what the
Company deems to be acceptable behaviour. The key elements of the Code are:
As a company: (a) respecting every employee’s dignity, rights and freedoms; (b) providing a working environment that is safe,
challenging and rewarding; (c) recognising the achievements of each of our employees; (d) respecting customers’, suppliers’ and
employees’ personal and sensitive information; (e) reinforcing JB Hi-Fi’s commitment to the highest standards in business and
professional ethics; and (f) obeying the law.
As employees: (a) treating customers, the public and fellow employees with honesty, courtesy and respect; (b) respecting and
safeguarding the property of customers, JB Hi-Fi and fellow workers; (c) maintaining confi dentiality of all customers’, JB Hi-Fi’s
and other parties’ information gained through our work; (d) performing our duties, as best we can, taking into account our skills,
experience, qualifi cations and position; (e) doing our jobs in a safe, responsible and effective manner; (f) ensuring our personal
business and fi nancial interests do not confl ict with our duty to JB Hi-Fi; (g) working within JB Hi-Fi’s policies and rules; and
(h) obeying the law.
The Company has developed appropriate policies and guidelines to assist employees in applying the Code in practice. A copy
of the Code of Conduct can be found on the Company’s website at www.jbhifi .com.au via the “Investors” and “Governance”
sections.
GOVERNANCE, ENVIRONMENTAL AND SOCIAL STATEMENTS (continued)
For
per
sona
l use
onl
y

9
DIVERSITY
JB Hi-Fi recognises the importance of diversity and values the competitive advantage that is gained from a diverse range of skills,
backgrounds, experience and gender at all levels of the organisation. The Company has a Diversity Policy which is available on
the Company’s website at www.jbhifi .com.au via the “Investors” and “Governance” sections.
The Diversity Policy states that JB Hi-Fi appreciates that the different perspectives arising from diversity encourage an innovative,
responsive, productive and competitive business and create value for our customers and shareholders. JB Hi-Fi’s objective is
that Board appointments, employment and advancement decisions are based on merit, qualifi cations and competence, and that
employment opportunities shall not be infl uenced, affected or limited by discrimination. JB Hi-Fi believes that no barrier should
therefore exist that prevents this from occurring.
Gender diversity
As at 30 June 2015 the proportion of women engaged by JB Hi-Fi was as follows:
• Board: 17% being 1 of 6 directors (2014: 14%)
• Senior Management/Executive (excluding the executive director/CEO): 8% being 2 of 24 employees (2014: 4%). For these
purposes, Senior Management/Executive means:
• the 4 executives listed on page 30 of this Report who were employed on 30 June 2015, excluding the executive
director; and
• the 19 next most senior managers of the Company, each of whom reports to one of these executives or the executive
director.
• Group: 39% being 2,883 of 7,320 employees (2014: 39%).
In March 2012 the Board set measurable objectives in relation to gender diversity. These diversity objectives and progress
towards achieving them are set out in the table below:
Objective set in March 2012 June 2015 June 2014 June 2013 June 2012
To improve the percentage of female to male commissioned
store sales staff over each of the next 3 years22% 21% 21% 21%
To improve the percentage of female to male store managers
over the next 3 years10% 10% 11% 11%
To improve the percentage of female to male regional/area
managers over the next 3 years9% 0% 0% 0%
To increase the percentage of female senior managers over
the next 3 years8% 4% 5% 9.5%
At the time of setting the objectives the Board noted that one of the challenges faced by the Group in terms of diversity was
the relatively low level of turnover in positions such as regional/area management and senior management roles, with the vast
majority of these positions being occupied by long serving employees of the Group. The existence of stable senior and
regional/area management teams, in the context of a historically male-dominated consumer electronics industry, has posed
challenges for achieving change in the short-term.
Noting the challenges set out above, since setting these objectives the Company has taken the following actions:
• developed systems to enable regular reporting and assessment of progress towards the adopted gender diversity
objectives;
• regularly reviewed employee pay to consider whether any gender based disparity exists;
• developed part time and fl exible work practices, with specifi c focus on return to work from maternity leave;
• reorganised the managerial structure within stores, aimed at achieving greater female representation at management level
over the medium term;
• ensured that female participation in leadership development programs is at least equivalent to the proportion of female
employees at that level in the organisation; and
• appointed its fi rst two female area managers.
For
per
sona
l use
onl
y

10
The Company is currently undertaking a review of its gender diversity objectives and the plans for achieving them and has
recently engaged a diversity consultant to assist with this process. The Company will report further on progress in this area in the
2016 Annual Report.
SHAREHOLDINGS OF DIRECTORS AND EMPLOYEES
Directors’ current shareholdings are detailed in the Directors’ Report and are updated by notifi cation to the ASX as required. The
Board has approved and adopted a Securities Trading Policy setting out the rules and procedures applying to directors, offi cers
and employees dealing in securities.
Subject to certain specifi c and limited exceptions, directors and key employees may only trade in JB Hi-Fi shares, and any other
JB Hi-Fi securities, during designated Trading Windows. These four week Trading Windows follow the release of JB Hi-Fi’s Final
Results (August/September), Interim Results (February/March) and the Annual General Meeting (October/November). Directors
and executives are required to obtain the Chairman’s consent in advance of any such trading and any transaction conducted by
directors in shares of the Company is notifi ed to the ASX.
A copy of the Securities Trading Policy can be found on the Company’s website at www.jbhifi .com.au via the “Investors” and
“Governance” sections.
INTEGRITY OF REPORTING
The Company has put in place controls designed to ensure the integrity of its fi nancial reporting and that the Company complies
with all regulatory requirements relevant to this reporting.
In accordance with the Corporations Act and the ASX Recommendations, the Chief Executive Offi cer and Chief Financial Offi cer
have stated in writing to the Board that, in their opinion:
(a) the fi nancial records of the consolidated entity (consisting of the Company and the entities it controlled for the fi nancial
year ended 30 June 2015) for the fi nancial year have been properly maintained in accordance with section 286 of the
Corporations Act;
(b) the fi nancial statements for the fi nancial year and the notes required by the accounting standards give a true and fair view of
the consolidated entity’s fi nancial position and performance, and comply with the accounting standards;
(c) the statements in (a) and (b) above are founded on a sound system of risk management and internal control which is
operating effectively; and
(d) subsequent to 30 June 2015, no changes or other matters have arisen that would have a material effect on the operation of
the risk management and internal control systems of the Group.
The Company’s fi nancial statements are subject to an annual audit by an independent, professional auditor who also reviews the
Company’s half yearly fi nancial statements. The Audit and Risk Management Committee oversees this process on behalf of the
Board. Deloitte has been the Company’s external auditor since 2002. The audit engagement partner is rotated every fi ve years.
Information on procedures for the selection and appointment of the external auditor and for the rotation of external audit
engagement partners can be found in the Charter of the Audit and Risk Management Committee on the Company’s website at
www.jbhifi .com.au via the “Investors” and “Governance” sections.
CONTINUOUS DISCLOSURE
The Company seeks to provide relevant and timely information to its shareholders and is committed to fulfi lling its continuous
disclosure obligations.
The Board has approved a Continuous Disclosure Policy to ensure that the procedures for identifying and disclosing material
price sensitive information in accordance with the Corporations Act and ASX Listing Rules are clearly articulated. This policy sets
out the obligations of employees in respect of such information. The Chief Executive Offi cer, in consultation with the Chairman
where appropriate, is responsible for communication with the ASX.
A copy of the Continuous Disclosure Policy can be found on the Company’s website at www.jbhifi .com.au via the “Investors” and
“Governance” sections.
GOVERNANCE, ENVIRONMENTAL AND SOCIAL STATEMENTS (continued)
For
per
sona
l use
onl
y

11
SHAREHOLDER COMMUNICATIONS
The Company’s website www.jbhifi .com.au contains an overview of the Company’s business and its history (“Consumer Matters”
section), and an “Investors” section which includes the following information for shareholders:
• all market announcements and related documents, which are posted immediately after release to the ASX;
• details relating to the Company’s directors and executives;
• Board and Board Committee charters and other corporate governance documents;
• a calendar of forthcoming key dates such as the date of results releases and the Company’s AGM;
• a summary of the Company’s dividend policy and its dividend payment history; and
• details of how investors can contact the Company and its share registry.
Shareholders can elect to receive communications from the Company’s share registry electronically which also gives
shareholders the opportunity to manage their account details and holdings electronically. Shareholders are also able to send
communications to the Company and receive responses to these communications electronically.
A copy of the Company’s Shareholder Communication Policy can be found on the Company’s website at www.jbhifi .com.au via
the “Investors” and “Governance” sections.
The Company has an investor relations program which involves regular meetings with signifi cant current and potential investors,
and with analysts and the fi nancial media.
The Company holds its Annual General Meeting in Melbourne, to which all shareholders are invited. Shareholders who are unable
to attend can appoint a proxy to attend and vote or, alternatively, can vote electronically in advance of the Meeting. The Company
ensures that the external auditor attends its Annual General Meeting and is available to answer shareholder questions about the
conduct of the audit and the preparation and content of the auditor’s report.
RISK IDENTIFICATION AND MANAGEMENT
JB Hi-Fi’s policy is to consider the balance of risk and reward, as far as practicable, in order to optimise the returns gained from
its business activities and to meet the expectations of its shareholders.
The Board has delegated to the Audit and Risk Management Committee responsibility for overseeing the implementation of
policies and procedures aimed at ensuring that the Company conducts its operations in a manner that adequately manages risk
to protect its people, the environment and the Company’s assets and reputation. Risk identifi cation and management is also a
key focus of the executive and management teams.
The Company does not have an internal audit function but has a dedicated risk management team led by the Group Risk &
Assurance Manager. The Group Risk & Assurance Manager is a member of the Company’s senior management team and has
direct access to the Chair of the Audit and Risk Management Committee, and attends all meetings of the Committee at which
risk management is considered. The Company’s risk management team has designed an effective risk management framework
in line with ISO 31000 which enables management to identify and manage risk appropriately. This risk framework is reviewed and
revised with input from senior management and the Audit and Risk Management Committee and is approved by the Board on an
annual basis. The risk management framework was last reviewed and revised by the Committee and approved by the Board in
January 2015.
A copy of the Company’s Risk Management Policy can be found on the Company’s website at www.jbhifi .com.au via the
“Investors” and “Governance” sections.
For
per
sona
l use
onl
y

12
ECONOMIC, ENVIRONMENTAL & SOCIAL SUSTAINABILITY RISKS
Economic sustainability risks
Economic sustainability risks are risks to the Group’s ability to continue operating at its current level of economic production over
the long term.
The Group is exposed to a number of economic sustainability risks, which have a real possibility of substantively impacting on the
Group’s ability to create or preserve value for its shareholders over the short, medium or long term. These economic sustainability
risks (together with JB Hi-Fi’s strategies for managing these risks) are discussed in the “Business Strategies and Prospects”
section of the Operating and Financial Review commencing on page 24.
Environmental sustainability risks
Environmental sustainability risks are risks to the Group’s ability to continue operating in a manner that does not compromise the
health of the ecosystems in which it operates over the long term.
The Group does not believe that it is exposed to any environmental sustainability risks which have a real possibility of substantively
impacting on the Group’s ability to create or preserve value for its shareholders over the short, medium or long term.
Notwithstanding this, environmental sustainability is important to the Group and, accordingly, the Group has implemented
several initiatives to minimise the impact of its operations on the environment. These initiatives are discussed in the Environmental
Statement on page 13 and include participation in the Carbon Disclosure Project, the Australian Packaging Covenant and various
recycling initiatives related to the products the Company sells.
Social sustainability risks
Social sustainability risks are risks to the Group’s ability to continue operating in a manner that meets accepted social norms and
needs over the long term.
The Group does not believe that it is exposed to any social sustainability risks which have a real possibility of substantively
impacting on the Group’s ability to create or preserve value for its shareholders over the short, medium or long term.
Notwithstanding this, the Group prides itself on conducting its business in a socially responsible manner and believes that it is
important to give back to the community. The Group’s initiatives in this regard are discussed in the Social Statement on page 14,
the most signifi cant of which is its Helping Hands workplace giving program.
BOARD AND EXECUTIVE PERFORMANCE
JB Hi-Fi monitors and evaluates the performance of its Board, Board Committees, individual directors, and executives in order
to fairly review, and actively encourage enhanced, Board and management effectiveness. A description of the process for the
evaluation of the Board, its Committees, individual directors and executives can be found on the Company’s website at
www.jbhifi .com.au via the “Investors” and “Governance” sections. Evaluation of the Board, Board Committees, individual
directors and executives has been conducted in respect of the 2015 fi nancial year.
DIRECTORS’ FEES AND EXECUTIVE REMUNERATION
Directors’ fees
The details of remuneration paid to each non-executive director during the fi nancial year and the principles behind the setting of
such remuneration are included in the Remuneration Report.
Executive remuneration
The amount of remuneration, both monetary and non-monetary, for the executives who had authority and responsibility for
planning, directing and controlling the activities of the Company during the fi nancial year, and the principles behind the setting of
such remuneration, are included in the Remuneration Report.
GOVERNANCE, ENVIRONMENTAL AND SOCIAL STATEMENTS (continued)
For
per
sona
l use
onl
y
13
ENVIRONMENTAL STATEMENT
JB Hi-Fi promotes environmental sustainability. JB Hi-Fi’s Code of Conduct, which can be found on the Company’s website at
www.jbhifi .com.au via the “Investors” and “Governance” sections, states:
“All employees are responsible for maintaining and protecting the environment. Employees should, therefore, always consider the
impact of their activities on the environment and the local community, including the way in which waste is disposed, chemicals
are used and stored, and natural resources utilised”.
The Group is committed to reducing the impact its business has on the Australian and New Zealand environments, and has
implemented several initiatives to help achieve this, as outlined below.
Carbon Disclosure Project
JB Hi-Fi responds annually to the Carbon Disclosure Project (“CDP”). The CDP is a not-for-profi t organisation that collates and
reports company environmental actions to external users such as investors and other corporations. JB Hi-Fi has systems in
place to ensure it is reporting and monitoring energy consumption and greenhouse gas emissions. In addition, JB Hi-Fi seeks to
identify opportunities and implement solutions to reduce energy consumption and greenhouse gas emissions whilst maintaining
its low cost of doing business.
JB Hi-Fi has provided its 2015 response to the CDP, but has not yet received a 2015 CDP score. In 2014, JB Hi-Fi received a CDP
score of 73E (2013: 63E), which represents the Company’s best CDP score since it began reporting in 2009.
Smarter Choice Program
JB Hi-Fi participates in the Smarter Choice program in conjunction with the Victorian and New South Wales State Governments.
This program educates our employees on how to best advise customers about the energy effi ciency of products. This has been
positively supported by Company employees with engagement targets being achieved.
Australian Packaging Covenant
JB Hi-Fi is a signatory to the Australian Packaging Covenant. This is a voluntary program involving both Government and industry
to ensure the environmental impact from packaging is reduced, measured and understood. Each signatory to the Australian
Packaging Covenant is required to have an action plan which sets out what the signatory proposes to do to contribute to the
Australian Packaging Covenant’s objectives and goals. JB Hi-Fi reports annually to the Australian Packaging Covenant Council
and signatories to the Australian Packaging Covenant are given a rating (out of 5) on their performance against their action plan
annually. JB Hi-Fi’s rating for FY2015 is not yet available (FY2014: 3.0, FY2013: 2.8).
Mobile Phone Recycling and Re-use
Mobile Muster is an initiative of the Australian Mobile Telecommunications Association introduced to facilitate mobile phone
recycling. Since 2010, JB Hi-Fi has implemented this voluntary initiative to facilitate the return of used mobile phones by
customers. JB Hi-Fi also runs a mobile phone trade-in program which has the benefi t of reducing the number of mobile phones
entering landfi ll.
Cartridges 4 Planet Ark
JB Hi-Fi launched Cartridges 4 Planet Ark in stores in 2010. This program enables consumers to drop used printer cartridges at
JB Hi-Fi stores, where they are collected and returned for recycling and remanufacturing, ensuring landfi ll is avoided. In FY2015,
approximately 33,000 cartridges were recycled through this program. Since the commencement of the program almost 100,000
cartridges have been recycled.
Store Recycling Initiatives
All stores have paper and cardboard recycling bins and certain stores also recycle old appliances.
Support Offi ce
The JB Hi-Fi Support Offi ce is located in an environmentally friendly “fi ve star energy rated” offi ce building.
For
per
sona
l use
onl
y

14
SOCIAL STATEMENT
JB Hi-Fi recognises the importance of social responsibility to our shareholders, employees, suppliers and customers. As one of
Australia’s and New Zealand’s leading retailers JB Hi-Fi is committed to understanding how JB Hi-Fi can work with its employees,
customers and suppliers to ensure that it gives back to the community.
JB Hi-Fi’s Workplace Giving Program – “Helping Hands”
Workplace giving programs have proved to be a very effective way for employers and employees to join together to support the
community.
Established in 2008, Helping Hands is JB Hi-Fi’s workplace giving program. Through this program, JB Hi-Fi directors, executives
and employees are able to donate to registered charitable organisations. JB Hi-Fi matches dollar for dollar regular employee
contributions through its payroll system, effectively doubling the fi nancial benefi t to our community partners. JB Hi-Fi works
with The Australian Charities Fund (“ACF”) in Australia to develop and maintain the program and, in doing so, contributes to the
Company’s vision of seeing signifi cant social impact through employers and community organisations working together. Through
the combined giving of the Company and its employees, JB Hi-Fi believes it makes a real difference to the charities in the
program.
Helping Hands – Australia
The Helping Hands program in Australia involves over 4,100 employees (approximately 60% of total JB Hi-Fi Australia employees)
each making weekly contributions. This year almost $1,650,000 has been raised and, since its inception, the Company and its
employees are proud to have raised more than $7,250,000.
The current charity partners to which contributions are made are Bush Heritage Australia, ReachOut.com, Medicins Sans
Frontieres (Doctors Without Borders), Sunrise Children’s Village (Cambodia), The Song Room, RedKite, Fred Hollows Foundation,
Oxfam and the Australian Animal Welfare League.
Helping Hands – New Zealand
The Helping Hands program was launched in New Zealand in May 2012 and involves over 160 employees (approximately 32%
of JB Hi-Fi New Zealand employees) making weekly contributions. This year approximately $55,000 was raised and since its
inception almost $150,000 has been raised. The current charity partners in New Zealand are ShelterBox, Kenzies Gift, Forest and
Bird, Youthline and Plunket.
“Change for Change” – Donation Boxes in our Stores
The Helping Hands program has driven the placement of “Change for Change” boxes in all stores across Australia and New
Zealand. These boxes have been placed at point of sale locations to encourage donations from our customers. All donations
collected are shared evenly amongst the Company’s charity partners. This year over $50,000 has been collected in Australia and,
since inception, the program has raised over $430,000. In New Zealand approximately $20,000 has been collected since boxes
were fi rst introduced into stores.
“Employer Leadership Group” – Founding Partner
In addition to its contribution through Helping Hands, the Company is a founding partner of the Australian Charities Fund’s
“Employer Leadership Group” (“ELG”) that was formed in October 2010 to generate awareness of the benefi ts of workplace giving
programs across the leadership of Australian businesses. The goal of ACF is to achieve one million Australians giving to charity
through their place of work by 2020. Members of the ELG have demonstrated best practice in engaging with their employees
around community issues and are committed to leading the growth of the sector alongside the ACF. As a founding partner,
JB Hi-Fi seeks to play its part in encouraging workplace giving as a low cost and highly effi cient way of generating funds for the
charitable sector and the Company’s CEO, Richard Murray, is Chairman of the ELG. In addition to the Helping Hands and Change
for Change contributions detailed above, JB Hi-Fi donated $25,000 per annum to the ACF over each of the three years from 2012
to 2014. In 2015 the Company renewed its support for the ACF and increased its annual commitment to $50,000 per annum for
each of the three years from 2015 to 2017.
GOVERNANCE, ENVIRONMENTAL AND SOCIAL STATEMENTS (continued)
For
per
sona
l use
onl
y

15
DIRECTORS’ REPORT
The directors of JB Hi-Fi Limited (the “Company”) submit herewith the annual fi nancial report of the consolidated entity consisting
of the Company and the entities it controlled (the “Group”) for the fi nancial year ended 30 June 2015. In order to comply with the
provisions of the Corporations Act 2001, the Directors report as follows:
The names and particulars of the directors of the Company during or since the end of the fi nancial year are:
Name Particulars
Mr Greg RichardsChairman
Non-Executive Director
B.Ec (Hons)
Greg was appointed to the Board in December 2007 and was appointed Chairman of the
Board in June 2012. Greg is a member and Chairman of the Remuneration Committee and
was Chairman of the Audit and Risk Management Committee from February 2010 until
May 2012. Prior to 2006, Greg had over 25 years’ experience in the investment banking
industry. Most recently he was with Goldman Sachs JBWere for over 19 years where he was
an equity partner for 17 years, working primarily in equity capital markets. Greg is currently a
consultant to Onsite Rental Group.
Mr James KingNon-Executive Director
B.Comm, FAICD
James has over 30 years’ board and management experience with major companies in
Australia and internationally. He was previously with Fosters Group Limited as Managing
Director Carlton & United Breweries and Managing Director Fosters Asia. Prior to joining
Fosters, he spent six years in Hong Kong as President of Kraft Foods (Asia Pacifi c). He is
currently a non-executive director of Navitas Ltd and Pacifi c Brands Ltd. James is also a
past Chairman of Juvenile Diabetes Research Foundation (Victoria) and a member of the
Council of Xavier College. James is a Fellow of the Australian Institute of Company Directors.
James was appointed to the Board in May 2004 and was Chairman from March 2006 until
September 2007. James is a member of the Audit and Risk Management Committee and
the Remuneration Committee.
Ms Beth LaughtonNon-Executive Director
B.Ec, FAICD, FCA
After qualifying as a Chartered Accountant, Beth spent over 25 years in corporate fi nance,
providing mergers and acquisition advice and arranging equity funding for companies in a
range of industries including specialty retail. For 12 years her primary focus was on information
technology, telecommunications and entertainment. She is also a member of the Board of
GPT Funds Management Limited and of its Audit, Compliance & Risk Management Committee
and of the Defence SA Advisory Board and its Audit & Risk Management Committee. Beth was
a non-executive director and Chairman of the Audit Committee of Sydney Ferries from 2004
to 2010, a non-executive director of Port Adelaide Maritime Corporation from 2006 to 2007,
a non-executive director and member of the Audit Committee of the ASX listed Australand
Property Group companies between May 2012 and October 2014, and Chair of the Audit
Committee and a Non-Executive Director of CRC Care Pty Ltd from March 2012 to
December 2014. Beth was appointed to the JB Hi-Fi Board in May 2011 and became
Chairman of the Audit & Risk Management Committee on 1 June 2012.
Mr Gary LevinNon-Executive Director
B.Comm, LLB
Gary has over 30 years’ experience on the boards of public and private companies in the
retail, investment and renewable energy fi elds in both executive and non-executive roles.
He is currently on the board of Baby Bunting Group Ltd and a number of private investment
companies. Gary holds a Bachelor of Commerce and Bachelor of Laws from the University
of New South Wales and is a member of the New South Wales Bar Association and the
Australian Institute of Company Directors. Gary has been a director of JB Hi-Fi since listing in
2003 and for the 3 years prior to that, and is also a member of the Remuneration Committee
and the Audit and Risk Management Committee.
Mr Richard UechtritzNon-Executive Director
Richard has over 30 years’ experience in retailing. He was co-founder of Australia’s two
leading photo chains, Rabbit Photo and Smiths Kodak Express. He was also a director of
Kodak (Australasia) Pty Ltd. Richard led the management buy-in of JB Hi-Fi in July 2000
and was CEO and Managing Director until his resignation from these positions in May 2010.
Richard re-joined the Board in April 2011 as a non-executive director. He is also a
non-executive director of Seven Group Holdings Limited.
DIRECTORS’ REPORT
For
per
sona
l use
onl
y

16
Mr Richard MurrayChief Executive Offi cer and
Executive Director
B.Comm, Grad.Dip.
Applied Finance & Investment, CA
Richard became Chief Executive Offi cer on 1 July 2014 having been appointed to the Board
in June 2012. Richard has over 20 years’ experience in retail and fi nance. He joined JB Hi-Fi
as CFO in 2003 and took the business through the IPO process. Prior to this Richard worked
with Deloitte for 10 years. He is currently Chairman of the Australian Charities Fund Employee
Leadership Group, which aims to encourage Australian businesses to set up workplace giving
programs.
Each of the aforementioned directors held offi ce for the whole fi nancial year and since the end of the fi nancial year.
Company Secretary Particulars
Mr Doug SmithBA (Hons). Admitted to legal
practice in Victoria & in England
& Wales.
Doug was appointed Company Secretary in June 2012. Doug joined JB Hi-Fi as General
Counsel in September 2010 and has over 20 years’ legal experience in-house and in private
practice.
Directorships of other listed companies
Directorships of other listed companies held by directors in the 3 years immediately before the end of the fi nancial year are as
follows:
Name Company Period of Directorship
James King Navitas Limited Since November 2004
Pacifi c Brands Limited Since September 2009
Trust Company Limited February 2007 to December 2013
Beth Laughton Australand Holdings Limited, Australand Property Limited,
Australand Investments Pty Ltd
May 2012 – October 2014
Richard Uechtritz Seven Group Holdings Limited Since June 2010
Principal activity
The Group’s principal activity in the course of the fi nancial year was the retailing of home consumer products. The Group offers
a wide range of leading brands with particular focus on consumer electronics, software including music, games and movies,
whitegoods and appliances.
There have been no signifi cant changes in the principal activity of the Group during the fi nancial year.
Operating and Financial Review
The Operating and Financial Review, which forms part of this Directors’ Report, is presented separately on pages 20 to 27.
Changes in state of affairs
Capital Management
Between 8 September 2014 and 12 September 2014 the Company purchased 291,364 shares pursuant to an on-market
buy-back in order to offset the dilutionary impact of shares issued in August and September 2014 pursuant to the exercise of
employee share options. The cost to the Company of purchasing these shares was $4,970,000. The highest price paid by the
Company was $17.20 and the lowest price paid by the Company was $16.96.
Subsequent events
On 10 August 2015, the Company announced that it would conduct an on-market buy-back in order to offset the dilutionary
impact of shares issued pursuant to the exercise of employee share options between the date of the previous buy-back and
4 September 2015. The maximum number of shares that will be purchased is 776,610 and the buy-back is scheduled to
commence in September 2015.
There have been no other matters or circumstances occurring subsequent to the end of the fi nancial year, that have signifi cantly
affected, or may signifi cantly affect, the operations of the Group, the results of those operations, or the state of affairs of the
Group in future fi nancial years.
DIRECTORS’ REPORT (continued)
For
per
sona
l use
onl
y

17
Future developments
Information regarding likely developments in the operations of the Group in future fi nancial years is set out in the Operating and
Financial Review and elsewhere in the Annual Report.
Environmental regulations
The Group is not involved in any activities that have a marked infl uence on the environment within its area of operation. As such,
the directors are not aware of any material issues affecting the Group or its compliance with the relevant environmental agencies
or regulatory authorities.
Dividends
In respect of the fi nancial year ended 30 June 2014, as detailed in the Directors’ Report for that fi nancial year, an interim dividend
of 55.0 cents per share and a fi nal dividend of 29.0 cents per share, both franked to 100% at the 30% corporate income tax rate,
were paid to the holders of fully paid ordinary shares on 28 February 2014 and 5 September 2014 respectively.
In respect of the fi nancial year ended 30 June 2015, an interim dividend of 59.0 cents per share was paid to the holders of fully
paid ordinary shares on 27 February 2015 and the directors have declared the payment of a fi nal dividend of 31.0 cents per
share, to be paid to the holders of fully paid ordinary shares on 11 September 2015. Both dividends are franked to 100% at the
30% corporate income tax rate. The total dividend for the fi nancial year of 90.0 cents per share represents a payout ratio of just
over 65% of the full year earnings.
Indemnifi cation of offi cers and auditors
The Company indemnifi es current and former directors and offi cers for any loss arising from any claim by reason of any wrongful
act committed by them in their capacity as a director or offi cer (subject to certain exclusions as required by law). During the
fi nancial year, the Company has paid premiums in respect of contracts insuring the directors and offi cers against any liability
of this nature. In accordance with normal commercial practices, under the terms of the insurance contracts the nature of the
liabilities insured against and the amount of the premiums paid are confi dential. The Company has not otherwise, during or since
the end of the fi nancial year, except to the extent permitted by law, indemnifi ed or agreed to indemnify an offi cer or auditor of the
Company or of any related body corporate against a liability incurred as such by an offi cer or auditor.
Directors’ meetings
The following table sets out the number of directors’ meetings (including meetings of Committees of directors) held during the
2015 fi nancial year and the number of meetings attended by the members of the Board or the relevant Committee. During the
fi nancial year, 13 Board meetings, 6 Remuneration Committee meetings and 6 Audit and Risk Management Committee meetings
were held.
Board of Directors Remuneration CommitteeAudit and Risk Management
Committee
Directors Held Attended Held Attended Held Attended
G. Richards 13 13 6 6 – –
J. King 13 13 6 6 6 6
B. Laughton 13 13 – – 6 6
G. Levin 13 13 6 6 6 6
R. Uechtritz 13 13 – – – –
R. Murray 13 13 – – – –
For
per
sona
l use
onl
y

18
Directors’ shareholdings
The following table sets out each director’s relevant interest in shares, debentures, and rights or options in shares or debentures
of the Company, or a related body corporate, as at the date of this Report.
Fully paid ordinary shares Executive share options
Directors Direct number Indirect number Total Direct number Indirect number Total
G. Richards 3,000 20,000 23,000 – – –
J. King 32,258 – 32,258 – – –
B. Laughton 500 – 500 – – –
G. Levin 30,000 – 30,000 – – –
R. Uechtritz 10,000 – 10,000 – – –
R. Murray(i) 100,000 2,000 102,000 446,782 – 446,782
(i) Excludes any options that may be granted by the Board in August 2015. The issue of any such options to R. Murray, the executive director of
the Company, is also subject to shareholder approval at the Company’s Annual General Meeting in October 2015.
Remuneration Report
The Remuneration Report, which forms part of this Directors’ Report, is presented separately on pages 28 to 58.
Proceedings on behalf of the Company
The directors are not aware of any persons applying for leave under s.237 of the Corporations Act 2001 to bring, or intervene in,
proceedings on behalf of the Company.
Non-audit services
For a Group of the size and complexity of JB Hi-Fi, it can be in the interests of the Group to engage the services of its auditor
to assist in a range of related projects. The directors are aware of the issues relating to auditor independence and have in place
policies and procedures to address actual, potential and perceived confl icts in relation to the provision of non-audit related
services by the Company’s auditor.
In FY2015 the Company engaged its auditor to assist with the implementation of a customer relationship management tool for
its commercial business. As disclosed in note 8 to the fi nancial statements, the fee for this work was $511,507. The directors are
satisfi ed that the provision of these non-audit services during the year by the auditor (or by another person or fi rm on the auditor’s
behalf) is compatible with the general standard of independence for auditors imposed by the Corporations Act 2001.
Based on advice received from the Audit and Risk Management Committee, the directors are of the opinion that these services
as disclosed in note 8 to the fi nancial statements do not compromise the auditor’s independence, for the following reasons:
• all non-audit services have been reviewed and approved to ensure that they do not impact the integrity and objectivity of the
auditor; and
• none of the services undermine the general principles relating to auditor independence as set out in the Code of Conduct
APES 110 Code of Ethics for Professional Accountants issued by the Australian Professional & Ethical Standards Board,
including reviewing or auditing the auditor’s own work, acting in a management or decision-making capacity for the
Company, acting as advocate for the Company or jointly sharing economic risks and rewards.
DIRECTORS’ REPORT (continued)
For
per
sona
l use
onl
y

19
Auditor’s independence declaration
The auditor’s independence declaration is included on page 59 of the Annual Report.
Rounding off of amounts
The Company is a company of the kind referred to in ASIC Class Order 98/100, dated 10 July 1998, and in accordance with
that Class Order amounts in the Directors’ Report and fi nancial report are rounded off to the nearest thousand dollars, unless
otherwise indicated.
Signed in accordance with a resolution of the directors made pursuant to s.298(2) of the Corporations Act 2001.
On behalf of the directors
Greg Richards Richard Murray
Chairman Chief Executive Offi cer
Melbourne
10 August 2015
For
per
sona
l use
onl
y

20
OPERATING AND FINANCIAL REVIEW
OVERVIEW OF OPERATIONS
The Group sells the following products in Australia and New Zealand:
• consumer electronics including televisions, audio equipment, computers and cameras;
• software (CDs, DVDs, Blu-ray discs and games);
• whitegoods, cooking products and small appliances;
• telecommunications products and services;
• musical instruments; and
• digital content (music, books and video).
The Group also provides information technology and consulting services.
The Group holds signifi cant market-share in many of its product categories.
The Group’s sales are primarily from its branded retail store network. Sales are also generated from the Group’s branded online
stores, its commercial and education solutions offer and its JB Hi-Fi Now digital content platform. Further detail is set out below.
As at 30 June 2015 the Group operated the following sales channels:
• “JB Hi-Fi” – 144 physical stores and an online store;
• “JB Hi-Fi Home” – 43 physical stores;
• “JB Hi-Fi Now” – online digital content platform; and
• “JB Hi-Fi Commercial & Education” (since renamed “JB Hi-Fi Solutions”) – selling products and services to the commercial,
government and education sectors, including insurance replacements.
FINANCIAL PERFORMANCE – HIGHLIGHTS
FY15 FY14 Mvt
Total Sales $3,652.1m $3,483.8m +4.8%
Gross Margin 21.86% 21.70% +16 bps
Cost of Doing Business (“CODB”) 15.25% 15.19% +6 bps
Earnings Before Interest and Tax (“EBIT”) $200.9m $191.1m +5.1%
EBIT Margin 5.50% 5.49% +1.5 bps
Net Profi t After Tax (“NPAT”)1 $136.5m $128.4m +6.4%
Earnings per share (“EPS”) 137.9 cps 128.4 cps +7.4%
Total dividend - fully franked2 90.0 cps 84.0 cps +7.1%
1 Profi t attributable to owners of JB Hi-Fi Limited.
2 The fi nal FY2015 dividend is 31.0 cents per share, to be paid on 11 September 2015 (record date 28 August 2015). The full
year dividend of 90.0 cents per share represents a payout ratio of just over 65% of FY2015 earnings.
SALES PERFORMANCE
Total sales were up 4.8% to $3,652.1 million (2014: $3,483.8 million) and comparable sales growth was 2.9% (Australia: 3.1%,
New Zealand: -4.5%). Sales gained momentum through FY2015, with positive comparable sales of 7.4% in the second half of
FY2015.
Signifi cant factors in the sales performance were as follows:
Australia
• Sales grew by 5.0% to $3,456.0 million with comparable sales up 3.1%, primarily as a result of the rollout of JB Hi-Fi Home
branded stores, the opening of new stores, the maturing of stores opened in previous years, and the growth of JB Hi-Fi
Solutions and the Group’s online operations.
OPERATING AND FINANCIAL REVIEW
For
per
sona
l use
onl
y

21
• In the second half of FY2015, total sales were up 9.4% and comparable sales growth was 7.8%.
• By value, sales were split between hardware and services at 83.3% and software at 16.7% (FY2014: 81.3%/18.7%).
Hardware and services is defi ned as all sales excluding the music, movies and games software categories.
• Hardware and services sales were up 8.1% for the fi nancial year with comparable sales up 6.2%, driven by growth across
Telecommunications, Fitness, Accessories, Computers, IT and Home appliance categories; offset by softness in the Visual
market.
• Software sales (music, movies and games) were -8.2% and, on a comparable basis, -9.7%.
New Zealand
• Total sales were down 0.1% to NZ$211.1 million and comparable sales growth was -4.5%.
• In the second half of FY2015, total sales grew by 5.1% and comparable sales growth was -2.1%.
GROSS MARGIN
Gross margin was 21.86% for the period, up 16 bps from the previous fi nancial year.
Signifi cant factors in the gross margin performance were as follows:
• in Australia, the gross margin in FY2015 increased by 15 bps to 22.07%, driven primarily by a combination of sales mix and
improved buying terms.
• in New Zealand, gross margin increased by 13 bps to 18.16% due to improved buying terms.
COST OF DOING BUSINESS
Cost of doing business (“CODB”) was 15.25% for the period, up 6 bps from cost of doing business of 15.19% in the previous
fi nancial year. Despite the increase, JB Hi-Fi still has the lowest CODB of the major listed retailers in Australia. The Group
maintains its low CODB through continued focus on productivity.
Signifi cant factors in the CODB performance were as follows:
• in Australia, CODB increased by 2 bps to 15.20%. Store wages remain well controlled, as the Group continued to invest in
the JB Hi-Fi Home store rollout. Total operating costs were in line with internal expectations.
• in New Zealand, CODB increased by 82 bps to 16.21%, driven primarily by reduced operating leverage.
EARNINGS
EBIT was up 5.1% to $200.9 million from EBIT of $191.1 million in the previous fi nancial year and the resulting EBIT margin was
5.50%, up 1.5 bps from EBIT margin of 5.49% in the previous fi nancial year. This was a pleasing result with sales and earnings
momentum growing through the fi nancial year. Trading in June was particularly strong as the Group cycled a soft trading period
in the prior year and enjoyed the benefi ts of solid sales growth assisted by the small business tax incentive.
Signifi cant factors in EBIT performance were as follows:
• In Australia, EBIT was up 5.9% to $199.4 million and EBIT margin was up 5 bps from 5.72% in the previous fi nancial year to
5.77%.
• In New Zealand, EBIT was down 49.5% to NZ$1.6 million and EBIT margin was down 73 bps from 1.47% in the previous
fi nancial year to 0.74%.
Net profi t after tax was up 6.4% to $136.5 million. Earnings per share were up 7.4% from 128.4 cps to 137.9 cps.
Net interest expense in FY2015 was down 36.3% to $5.4 million, driven primarily by lower debt levels and improved working
capital fl ows.
The effective tax rate in FY2015 was 30.2%, up from 29.7% in FY2014, driven primarily by a reduction in the number of employee
share options exercised during FY2015 (333,956 in FY2015, compared to 1,438,091 in FY2014).
For
per
sona
l use
onl
y

22
CAPITAL MANAGEMENT AND DIVIDENDS
The Group regularly considers all aspects of its capital structure with a focus on maximising returns to shareholders. Continued
solid earnings growth and prudent management of the Group’s balance sheet, including relatively low gearing, enables the Group
to consider various capital management initiatives.
Between 8 September 2014 and 12 September 2014, the Company undertook an on-market buy-back of 291,364 ordinary
shares (representing approximately 0.3% of the total issued share capital of the Company) at a cost of $4,970,000. This buy-back
was conducted in order to offset the dilutionary impact of the ordinary shares issued to employees under the Company’s share
option plans during August and September 2014. The highest price paid by the Company for shares as part of the on-market
buy-back was $17.20 on 8 September 2014, and the lowest price paid by the Company for shares as part of the on-market
buy-back was $16.96 on 10 September 2014.
On 10 August 2015 the Group announced its intention to neutralise the impact of ordinary shares issued under the Company’s
employee share option plans between the date of the previous buy-back and 4 September 2015. This will be done via an
on-market buy-back of ordinary shares, to commence in September 2015. Further detail is provided in the “Subsequent Events”
section of the Directors’ Report.
The total dividend for the 2015 fi nancial year of 90.0 cents per share represents a payout ratio of just over 65% of the full
year earnings. The Board currently believes a 65% dividend payout ratio appropriately balances the distribution of profi t to
shareholders and reinvestment for future growth. The fi nal dividend for the 2015 fi nancial year of 31.0 cents per share fully franked
will be paid on 11 September 2015 with a record date of 28 August 2015.
FINANCIAL POSITION
The capital structure of the Group has remained stable during the period.
• In June 2015, the Group renewed its term debt facility of $200.0 million until June 2018. The Group’s overdraft facilities of
$80.0 million and NZ$10.0 million are renewable annually. The Group also has an additional seasonal bank overdraft facility
of $50.0 million in February to April and in November each year.
• At the end of the fi nancial year the Group had total interest bearing liabilities of $140.0 million.
• Net debt decreased from $136.2 million to $90.3 million, in line with internal expectations.
• The fi nancial covenants included in the Group’s fi nancing facilities are the leverage and fi xed charges cover ratios.
• During the fi nancial year 333,956 ordinary shares were issued to employees under the Company’s share option plans.
Between 8 September 2014 and 12 September 2014, the Company undertook an on-market buy-back of 291,364 ordinary
shares to neutralise the impact of shares issued in August and September 2014. Further detail is set out above.
INVESTMENTS FOR FUTURE PERFORMANCE
Net cash outfl ow on investing activities was $44.4 million, up from $38.2 million in the prior year. Investing activities comprised
Capital expenditure and Acquisitions as set out below.
Capital expenditure
Investments of $42.5 million were made during the fi nancial year in capital expenditure projects, an increase of $6.6 million from
$35.9 million during the previous fi nancial year. These projects primarily consisted of new store openings, JB Hi-Fi Home store
conversions, store relocations and upgrades, and online and digital projects.
Acquisitions
During the 2015 fi nancial year, the Group paid the fi nal tranche of $2.4 million of the consideration for its acquisition of the fi nal
49% interest in the Network Neighborhood business (which was subsequently renamed JB Hi-Fi Education Solutions).
These investing activities are anticipated to contribute towards earnings growth in the 2016 fi nancial year and beyond.
OPERATING AND FINANCIAL REVIEW (continued)
For
per
sona
l use
onl
y

23
WORKING CAPITAL
Inventory levels were in line with internal expectations. Total inventory on hand increased from the previous fi nancial year by
$20.2 million, driven primarily by the Company’s investment in inventory for new stores and JB Hi-Fi Home, as well as an increase
in inventory in existing stores. This increase was partially offset by the transition to a consignment stock model with certain
suppliers. Inventory turnover was 6.1 times (FY2014: 6.2 times).
After adjusting prior year (FY2014) creditor days for year-end timing differences (opening payables position adjusted for
30 June 2013 falling on a weekend), creditor days increased 0.3 days on the previous fi nancial year to 40.2 days. Total creditors
increased by $22.6 million to $325.6 million.
Financial and operating leverage remains low and is evidenced by solid fi xed charges cover of 3.4 times (FY2014: 3.3 times) and
interest cover of 33.9 times (FY2014: 21.6 times). The Company’s gearing ratio is 0.6 (FY2014: 0.8).
STORES
The Group’s sales are primarily from its branded retail store network, located both in stand-alone destination sites and shopping
centre locations. As at 30 June 2015, the Group had 187 physical stores (Australia: 173, New Zealand: 14).
The store movements during FY2015 and the store locations as at 30 June 2015 are set out below.
FY14
FY15
Opened Converted Total
Australia
JB Hi-Fi 147 1 (15) 133
JB Hi-Fi HOME 22 3 15 40
169 4 – 173
New Zealand
JB Hi-Fi 13 – (2) 11
JB Hi-Fi HOME – 1 2 3
13 1 14
TOTAL 182 5 – 187
Store type:
JB Hi-Fi 160 1 (17) 144
JB Hi-Fi HOME 22 4 17 43
182 5 – 187
Store format:
Shopping centres 99 2 21 103
Other 83 3 (2)1 84
182 5 – 187
1/1
22/13
7/2
2/0
44/7
39/11
3/2
11/3
15/4
JB HI-FI (144)/HOME (43)
1 Relocations
ONLINE AND DIGITAL
The Group continues to leverage the benefi ts of its strong online and digital presence combined with its bricks and mortar
locations. The Group’s goal is to create a “seamless customer experience” whereby its online and digital sites, combined with
its physical locations, provide customers with a choice as to how they wish to shop with JB Hi-Fi. In FY2015, online sales grew
16.9% on the previous fi nancial year to $87.7 million or approximately 2.4% of sales (FY2014: 2.2%). Unique visitations to
JB Hi-Fi’s websites averaged 1.2 million per week during FY2015.
JB HI-FI SOLUTIONS (PREVIOUSLY JB HI-FI COMMERCIAL AND EDUCATION)
The Group has recently rebranded its commercial and education solutions offer as JB Hi-Fi Solutions, in line with its plan to
provide an integrated offer of both products and services to business, government and education clients across Australia.
JB Hi-Fi Solutions consists of four divisions (Business Products division, Education division, Insurance Services division and
Business Telco division). JB Hi-Fi Solutions remains on track to deliver on its longer term aspirational sales target of approximately
$500m per annum, through both organic growth and strategic acquisitions.
For
per
sona
l use
onl
y

24
JB HI-FI HOME
JB Hi-Fi Home represents a signifi cant sales growth opportunity as JB Hi-Fi grows its share of the circa $4.6 billion per annum
home appliance market. The Group’s JB Hi-Fi Home branded stores leverage the strength and trust in the JB Hi-Fi brand and
offer a full range of JB Hi-Fi traditional categories with the addition of whitegoods, cooking and small appliances. JB Hi-Fi sees
the introduction of these product categories as a logical extension to its current entertainment categories.
A JB Hi-Fi Home store requires approximately 400 square metres of additional fl oor space (compared to a standard JB Hi-Fi
store) with the total JB Hi-Fi Home store size being approximately 1,750 square metres. The Company targets incremental sales
per store of approximately $3 million in the fi rst year post conversion, increasing to approximately $5 million over the medium term
as the JB Hi-Fi Home store rollout achieves scale.
As at 30 June 2015, the Group had 43 JB Hi-Fi Home branded stores, including 3 in New Zealand. During FY2015, the Group
converted 17 existing stores to JB Hi-Fi Home branded stores and opened 4 new JB Hi-Fi Home branded stores. The Company
anticipates opening 5 new JB Hi-Fi Home stores and converting 16 additional existing stores to the JB Hi-Fi Home brand in
FY2016, with 64 JB Hi-Fi Home stores expected by the end of FY2016. The Company’s current target of 75 JB Hi-Fi Home stores
should be reached during FY2017.
In addition to the JB Hi-Fi Home roll-out, the Group is also introducing small appliances into existing JB Hi-Fi stores. These stores
will have their layout reconfi gured but will not be rebranded to JB Hi-Fi Home. This store format is suited to JB Hi-Fi stores that
are located within shopping centres, or where a JB Hi-Fi Home store is or will be located within that JB Hi-Fi store’s catchment
area. The capital investment for this phase is small relative to a JB Hi-Fi Home conversion. Small appliances have been added to
4 JB Hi-Fi stores to date, with pleasing results and the Group anticipates having 14 additional existing JB Hi-Fi stores with a small
appliances offer by November 2015. In the long term the Group expects most stores to carry home appliances, with the range
(i.e. small appliances or full JB Hi-Fi Home offer) tailored to suit each specifi c store.
SUPPLY CHAIN
The Group continues to develop its low-cost, fi t-for-purpose supply chain and logistics solution. Facilities are operating in
Melbourne, Sydney, Perth, Brisbane and Auckland whilst, in other states and regional centres where stand-alone facilities are not
currently economic, the JB Hi-Fi Home rollout allows for expanded back-of-house storage areas.
BUSINESS STRATEGIES AND PROSPECTS
The following factors are considered important in understanding the strategy of the Group and the main opportunities and threats
that may have a signifi cant effect on its results and its prospects for future years. These factors are listed regardless of whether
they were signifi cant in FY2015.
Competitive advantages
The Group believes that it has the following fundamental competitive advantages:
• one of Australia’s and New Zealand’s largest ranges of home entertainment, consumer electronics products, whitegoods
and small appliances at discounted prices, positioned to appeal to all customers.
• positioned as a discount retailer with the ability to consistently offer everyday low prices. The Group is able to do this through
the scale of its operations, high stock turnover and low cost of doing business.
• reputation for taking the deal and price leadership.
• distinctive brand personality.
• low cost operating model which underpins the Group’s competitive pricing. The Group is innovative in driving costs down
and maintaining the lowest cost of doing business of any major listed Australian retailer.
• motivated, passionate, loyal and knowledgeable staff. The busy and enjoyable working environment means that the Group
continues to attract and retain high calibre staff.
• high levels of customer service.
• the model is constantly innovating to ensure that it remains current and relevant to its customers. The Group has a culture of
embracing change, which is seen as a “natural” part of the business.
OPERATING AND FINANCIAL REVIEW (continued)
For
per
sona
l use
onl
y

25
• ability to enter and grow new markets.
• stores located in high foot traffi c precincts which allow both convenient access for customers and maximise impulse traffi c.
• stores have relatively high sales per square metre when compared to many local competitors and comparable international
businesses.
• high energy, engaging and entertaining retail format with constantly evolving merchandising. JB Hi-Fi has the ability to bring
brands to life and create engagement in product categories.
• high level of loyalty and trust from customers – 3rd in the 2015 Corporate Reputation Index released by AMR and the
Reputation Institute (1st in 2014, 3rd in 2012 and 2013).
• established and successful online platform with sales growing approximately 16.9% from the previous fi nancial year and
accounting for approximately 2.4% of FY2015 sales.
• established digital content platforms, allowing the Group to evolve with its customers.
Business risks
There are a number of factors, both specifi c to JB Hi-Fi and of a general nature, which may threaten both the future operating
and fi nancial performance of the Group and the outcome of an investment in JB Hi-Fi. There can be no guarantee that JB Hi-Fi
will achieve its stated objectives or that forward looking statements will be realised. The operating and fi nancial performance of
JB Hi-Fi is infl uenced by a variety of general economic and business conditions, including levels of consumer spending, infl ation,
interest and exchange rates, access to debt and capital markets, and government fi scal, monetary and regulatory policies.
A prolonged deterioration in general economic conditions, including an increase in interest rates or a decrease in consumer and
business demand, may have an adverse impact on the Group’s business or fi nancial condition. The specifi c material business
risks faced by the Group, and how the Group manages these risks, are set out below.
• Competition – The markets in which JB Hi-Fi operates remain highly competitive. The Group believes that the competitive
advantages set out above and the plans for growth set out below will allow it to maintain its market leading position.
• A loss or erosion of JB Hi-Fi’s reputation – A decline in the high level of loyalty and trust that JB Hi-Fi enjoys with
its customers could compromise its market leading position and adversely affect JB Hi-Fi’s operating and fi nancial
performance. This could occur as a result of a wide range of factors or events, including:
– a loss or erosion of JB Hi-Fi’s reputation for price leadership and high levels of customer service. The Group seeks
to mitigate this risk through careful monitoring of its competitors’ pricing and market share data, senior management
monitoring of customer complaints, and use of customer service and engagement analytics;
– a major information security breach of JB Hi-Fi’s IT systems. The Group seeks to mitigate this risk through investment
in IT security measures;
– a major workplace health and safety incident or customer injury occurring in a JB Hi-Fi store. The Group seeks to
mitigate this risk through having appropriate occupational health and safety procedures in place for all of its sites; or
– a signifi cant breach of regulatory or legislative requirements. The Group seeks to mitigate this risk through appropriate
staff training on key regulatory and legislative requirements relevant to its business, as well as making legal and
regulatory compliance a key focus of the management team.
• Consumer discretionary spending and changes in consumer demands – the Group is exposed to consumer spending
cycles and changes in consumer demands. The Group maintains its relevance using its strong market position supported
by its everyday low price proposition. The Group’s stores, which are both in convenient and high traffi c locations, seek to
maximise both destination and impulse sales. The Group also closely monitors changes in the economic environment,
consumer demand and new products and is able to respond quickly to such changes.
• Online competition taking sales from JB Hi-Fi stores – JB Hi-Fi seeks to provide customers with a quality online offer, while
leveraging the benefi ts of its physical stores. The Group continues to innovate both in-store and online in order to give
customers the choice as to how to transact with JB Hi-Fi. The Group’s market leadership drives signifi cant buying power
which enables the Group to compete successfully with online players as does its low cost of doing business. JB Hi-Fi also
believes that the existence of its store network will continue to provide confi dence in after-sales service and support to its
online customers.
For
per
sona
l use
onl
y

26
• Digitisation of physical software leading to a fall in traditional software sales – the Group will maintain a software presence
in store while seeking to leverage upon its software heritage to maximise digital sales. JB Hi-Fi will maintain an in-store
presence while the category is still providing solid returns.
• Failure to maintain key supplier relationships – a failure to maintain key supplier relationships could adversely impact on
the Group’s operating and fi nancial performance. However, the Group has signifi cant supplier management processes to
mitigate this risk and, whilst at any one time certain products and suppliers are more important than others, the large and
diverse range of products stocked by JB Hi-Fi means that reliance on any one supplier or product is less than for some
smaller competitors. In addition, JB Hi-Fi has a proven record of expansion into new product categories and introducing
new brands, rather than remaining reliant on those products and brands which were successful in previous years. This is
refl ected in the fact that, despite a decline in software sales in recent fi nancial years, the Group has achieved positive total
sales growth. Hardware and services sales as a percentage of total sales increased from 74.8% of total sales in FY2011 to
83.4% in FY2015 as a result of the expansion into new product categories and the introduction of new brands.
• Increasing cost of doing business – certain costs of doing business are outside of the Group’s control. For example the
Group’s cost of doing business is impacted by the annual Fair Work Award wage reviews (which have resulted in increases
totalling 16.2% over the past 5 years to 30 June 2015). However, the increasing scale of the Group’s operations continues to
deliver cost reductions which mean that higher wage costs can be offset to some extent by cost reductions in other areas.
• Price defl ation – this has always been a feature of consumer electronics retail but has mostly been mitigated by increased
volumes, technological advancements and, more recently, a weakening of the Australian dollar.
• Leasing arrangements – the ability to identify suitable sites and negotiate suitable leasing terms for new and existing stores
is key to the Group’s ongoing growth and profi tability. The Group believes that it will continue to be able to do this as it has
done successfully to date.
• Loss of, or inability to attract and retain, key staff – the Group’s ability to attract and retain talented staff is critical to its
operating and fi nancial performance. In recognition of this, succession planning and executive/senior management team
composition is a key focus for the Board and executive team.
• IT systems – the Group’s increasing reliance on IT systems means that outages and disruptions could have a detrimental
impact on its operating and fi nancial performance, and any failure to maintain and upgrade its IT systems over time has the
potential to inhibit the achievement of the Group’s business initiatives. To mitigate the business interruption risk, the Group
has documented disaster recovery processes (including off-site IT back-up infrastructure) and has undertaken disaster
recovery testing. The Group also continues to invest and develop its IT resources and capabilities.
• Changes in regulatory environment – changes in the regulatory environment in which the Group operates may increase
compliance costs, and even (in extreme cases) affect the ability of the Group to sell certain types of products and services
or conduct certain activities. Whilst such changes are outside the control of the Group, the Group monitors proposed
changes in the regulatory environment so that it can assess the impact of such changes and develop appropriate response
strategies where possible.
• Finance - inability to access fi nancing facilities. The Company has recently renewed its fi nancing facilities and further detail is
set out on page 22.
Strategies to drive growth
The Group believes that the following strategies/factors will continue to drive growth in sales and earnings:
• continued roll-out of JB Hi-Fi stores in Australia and New Zealand with a pipeline of new properties. The Group anticipates
opening 6 new stores in the 2016 fi nancial year and, subject to ongoing review, maintains its stated target of 214 stores in
Australia and New Zealand. Shorter lease terms will be considered where appropriate to provide fl exibility.
• the roll-out of JB Hi-Fi Home branded stores leverages the strength of the JB Hi-Fi brand and provides a signifi cant growth
opportunity. The Group anticipates that 5 new JB Hi-Fi Home stores will be opened and approximately 16 existing JB Hi-Fi
branded stores will be converted to this format in FY2016 (3 already converted in July 2015), in addition to the 43 stores as at
30 June 2015. The Group’s current target of 75 JB Hi-Fi Home stores should be reached during FY2017. In addition to the
JB Hi-Fi Home roll-out, the Group is also introducing small appliances into existing JB Hi-Fi stores.
• store roll-out program continues to deliver in excess of its cost of capital.
OPERATING AND FINANCIAL REVIEW (continued)
For
per
sona
l use
onl
y

27
• proactive management of store portfolio with continuation of the Group’s disciplined approach to selecting new stores based
on high foot traffi c and closure of underperforming or sub-scale existing stores.
• continued growth opportunities in many categories and in market share, both in physical stores and online.
• continued technological innovation and the launch of new products and updated models will continue to drive new and
replacement sales.
• continued development of the JB Hi-Fi online site, aimed at enhancing the user experience across multiple platforms
(e.g. computer, tablet & phone) to drive continued growth in online sales.
• expansion of the online product range and depth beyond that which is practical in store.
• signifi cant opportunities to grow JB Hi-Fi Solutions and expand into new markets.
• improved supply chain and logistics system to support the Group’s expansion.
• maintenance of the Group’s competitive advantages and continued mitigation of the business risks faced by the Group
detailed on pages 25 to 26.
TRADING OUTLOOK – as at 10 August 2015
July 2015 sales update:
• total consolidated sales growth in July 2015 was 7.6% (July 2014: - 3.2%); and
• consolidated comparable sales growth in July 2015 was 5.7% (July 2014: -5.5%).
The sales result in July 2015 was a solid start to FY2016 as the Group cycled a soft trading period in the prior fi nancial year. Key
growth categories included Computers, Telco, IT and Home Appliances, whilst the Visual category continued to be a challenge.
In Australia, the Group expects to open 5 new JB Hi-Fi Home stores in FY2016 and to convert 13 existing stores to JB Hi-Fi
Home. In New Zealand, the Group expects to open 1 new JB Hi-Fi store and convert a further 3 existing stores to JB Hi-Fi Home
stores in FY2016.
The Group expects total sales in FY2016 to be circa $3.85 billion.
For
per
sona
l use
onl
y
28
REMUNERATION REPORT (audited)
Contents
• Summary (page 28)
• Executive Remuneration for FY2015 (page 30)
• Executive Remuneration Packages – Key Changes for FY2016 (page 38)
• Non-Executive Director Remuneration (page 39)
• Other Information (page 40)
• Key Management Personnel Compensation (page 41)
• Key Management Personnel Equity/Options (page 45)
• Share Options (page 51)
SUMMARY
Remuneration Overview
The Board recognises that the performance of the Group depends on the quality and motivation of its people, including both
the executives (being those persons listed as executives on page 30) and the approximately 7,000 employees of the Group
across Australia and New Zealand. The Company’s remuneration strategy seeks to appropriately reward, incentivise and
retain key employees. The Board aims to achieve this by setting competitive remuneration packages that include a mix of fi xed
remuneration and short and long-term incentives (“packages”).
Snapshot – FY2015 Remuneration
The Board notes that the 2015 fi nancial year has been a successful year for the Company, with management having delivered
record revenue (increased by 4.8%), EBIT (increased by 5.1%) and EPS (increased by 7.4%). Over the period the Company’s share
price increased almost 6.5% from $18.30 on 30 June 2014 to $19.48 on 30 June 2015. Notwithstanding this performance, total
executive remuneration has decreased from FY2014 as shown by the graph on page 36 and the table on page 41.
• Remuneration Packages: Richard Murray was appointed as CEO on 1 July 2014 with Nick Wells appointed CFO at this
time. Remuneration packages for Richard and Nick were signifi cantly lower than the packages for their predecessors in
these roles.
• Fixed Pay: Fixed remuneration packages for the four executives who had been in their role for more than a year increased
by between 3.0% and 5.0% from FY2014 to FY2015.
• Short-term incentive: The Company’s short term incentive plan rewards performance against both fi nancial and
non-fi nancial measures. Between 63% - 71% of the available short term incentive (“STI”) was paid to each executive
compared to FY2014 for which between 81% - 85% was paid.
• Long-term incentives: As was the case in 2013 and 2014, no options issued to executives in previous years vested in FY2015.
• Fees for Non-Executive Directors: Following a benchmarking analysis and remuneration recommendation, the fees
for non-executive directors were increased in FY2015 for the fi rst time since October 2010, in order to ensure that the
remuneration levels remained competitive and that the Company is able to continue to attract and retain high calibre directors.
2016 Executive Remuneration Packages – Key Changes
In setting FY2016 executive remuneration packages, the Company has decided to make a number of signifi cant changes. These are:
• the introduction of deferred STI - To further enhance alignment with shareholder interests, the Company will introduce a
component of deferred short term incentive for all executives. Executives will receive 90% of the FY2016 STI to which they
are entitled in cash and the remaining 10% in shares which will be subject to a restriction on sale/disposal for 1 year after
issue. It is the Company’s intention to review the percentage of STI that will be subject to deferral with a view to increasing
the deferred component in the next few years. The achievement of STI will continue to be subject to Group and individual
performance targets;
REMUNERATION REPORT
For
per
sona
l use
onl
y

29
• making all long-term incentives (“LTI”) subject to both service and performance based conditions - Retention based LTI
grants were made to executives in FY15 in the context of the CEO transition and to recognise the lack of vesting under
the LTI, notwithstanding strong company performance. With the Company now through the CEO transition period, the
Company no longer considers retention based grants to be necessary and all of the FY2016 LTI grant will be subject to both
performance and service based conditions;
• the LTI award will consist entirely of zero exercise price options (“Zepos”) - LTI grants previously comprised a combination
of traditional options (with an exercise price) and Zepos. Given the fl uctuation of the Company’s share price over recent
years (which has largely been infl uenced by external factors beyond the control of the executives), there is a risk that even
where performance conditions are met, the exercise price under the traditional options will not exceed the market price
and therefore hold no value for executives, notwithstanding the delivery of strong company performance. Accordingly, the
Company no longer considers traditional options to be an appropriate instrument to give effect to its objectives of rewarding
and motivating executives; and
• changes to the vesting schedule for LTIs – 2016 LTIs will require compound EPS growth of between 4% - 8% (FY2015: 5%-10%),
with 50% vesting if 5% EPS growth is achieved (FY2015: 70% vesting at 5% EPS growth).
Further detail is provided on page 38 of this Report.
For
per
sona
l use
onl
y

30
EXECUTIVE REMUNERATION FOR FY2015
Details of executive key management personnel
The following persons acted as executive directors and executives of the Company during and since the end of the fi nancial year
and are considered members of key management personnel:
Executive Director
Richard Murray Chief Executive Offi cer
Executives
Cameron Trainor Merchandise Director
Peter Green Operations Director
Nick Wells Chief Financial Offi cer
Tim Carter Online & Commercial Director (from 8 September 2014)
Scott Browning Marketing Director (until 17 February 2015)
George Papadopoulos Technology Director (until 17 February 2015)
Group executive remuneration policy – 2015 fi nancial year
The Board believes that executive remuneration should be fair and reasonable, structured effectively to attract, motivate, retain
and reward valued executives, and designed to produce value for shareholders.
The Remuneration Committee reviews the remuneration packages of all executives on an annual basis and makes
recommendations to the Board. Remuneration packages are reviewed with due regard to performance and data on remuneration
paid by comparable companies. Where appropriate, the Remuneration Committee may receive expert independent advice
regarding remuneration levels required to attract, retain and compensate executives given the nature of their work and
responsibilities. Details of the remuneration recommendations received by the Company from its remuneration advisor are set out
on page 40.
• In setting the 2015 fi nancial year remuneration packages, the Board and the Remuneration Committee considered a number
of factors, including market practice and benchmarking analysis comparing the newly appointed CEO’s and CFO’s executive
remuneration levels with comparator groups of companies. The Committee also obtained a remuneration recommendation
regarding the incoming CEO’s remuneration package. The Committee recognises that, at the time of setting executive
remuneration for a particular year, information from comparator companies in relation to that year’s remuneration (as
opposed to previous years’ remuneration) is not available. The Company sets remuneration packages for the executives
taking these factors into account.
• Remuneration packages for Richard Murray (CEO) and Nick Wells (CFO) were signifi cantly lower than the packages for their
predecessors in these roles, recognising that these executives were new to their roles and allowing scope for increases
as the executives gain experience and perform in these roles. A similar approach was adopted in setting a remuneration
package for Tim Carter who joined the company as Online & Commercial Director in September 2014.
• Fixed remuneration packages for individual executives who had been in their role for more than a year (Cameron Trainor,
Scott Browning, Peter Green and George Papadopoulos) increased by between 3.0% and 5.0% from FY2014 to FY2015.
The Board determined that the increases for executives were appropriate in view of its need to regularly review and consider
levels of remuneration in the light of the market, to take account of the changing scope of roles and responsibilities as the
business grows, and in order to appropriately reward, incentivise and retain these key employees.
• The Remuneration Committee also considers current market conventions with regard to the splits between fi xed, short-term
and long-term incentive elements. The mix of remuneration for the new CEO was more heavily geared towards LTI, with a
lower proportion of fi xed remuneration and STI, than his predecessor. The splits for FY2015 (excluding the One-Off Retention
Zepos described on page 34) were as follows:
REMUNERATION REPORT (continued)
For
per
sona
l use
onl
y

31
Executive Fixed STI LTI Total
R. Murray 40% 30% 30% 100%
C. Trainor 47% 34% 19% 100%
P. Green 51% 30% 19% 100%
N. Wells 46% 25% 29% 100%
T. Carter 50% 23% 27% 100%
S. Browning 47% 34% 19% 100%
G. Papadopoulos 51% 30% 19% 100%
Further details on each of the key elements of executive remuneration for the 2015 fi nancial year are set out below.
Fixed Remuneration
Fixed remuneration is paid by way of base salary, motor vehicle allowances and superannuation. No elements of fi xed
remuneration are dependent on performance conditions.
Short-term Incentive
The annual STI plan for FY2015 took the form of a cash bonus subject to fi nancial and non-fi nancial performance conditions. The
structure of the STI plan for the 2015 fi nancial year was generally consistent with that for the 2014 fi nancial year and is comprised
of the following elements.
Quantitative Bonus – Group EBIT performance
The Group quantitative element of executives’ STIs in FY2015 was based on the following criteria:
• if FY2015 statutory EBIT was more than FY2014 statutory EBIT then the STI would apply. No part of the STI would be paid if
FY2015 statutory EBIT was the same as, or less than, FY2014 statutory EBIT;
• if FY2015 statutory EBIT was equal to, or exceeded, 110% of FY2014 statutory EBIT then 100% of this element would be
paid; and
• payment of STIs between these two benchmarks would be on a linear basis.
Annual growth in EBIT is considered by the Company to be the most relevant measure of the Group’s fi nancial performance, as
it is a key input in driving and growing long term shareholder value and is directly infl uenced by the performance of the executive
team.
Given FY2015 statutory EBIT was 105.1% of FY2014 statutory EBIT, 51% of the available Quantitative Bonus (Group EBIT
performance) was paid to executives for FY2015.
For
per
sona
l use
onl
y
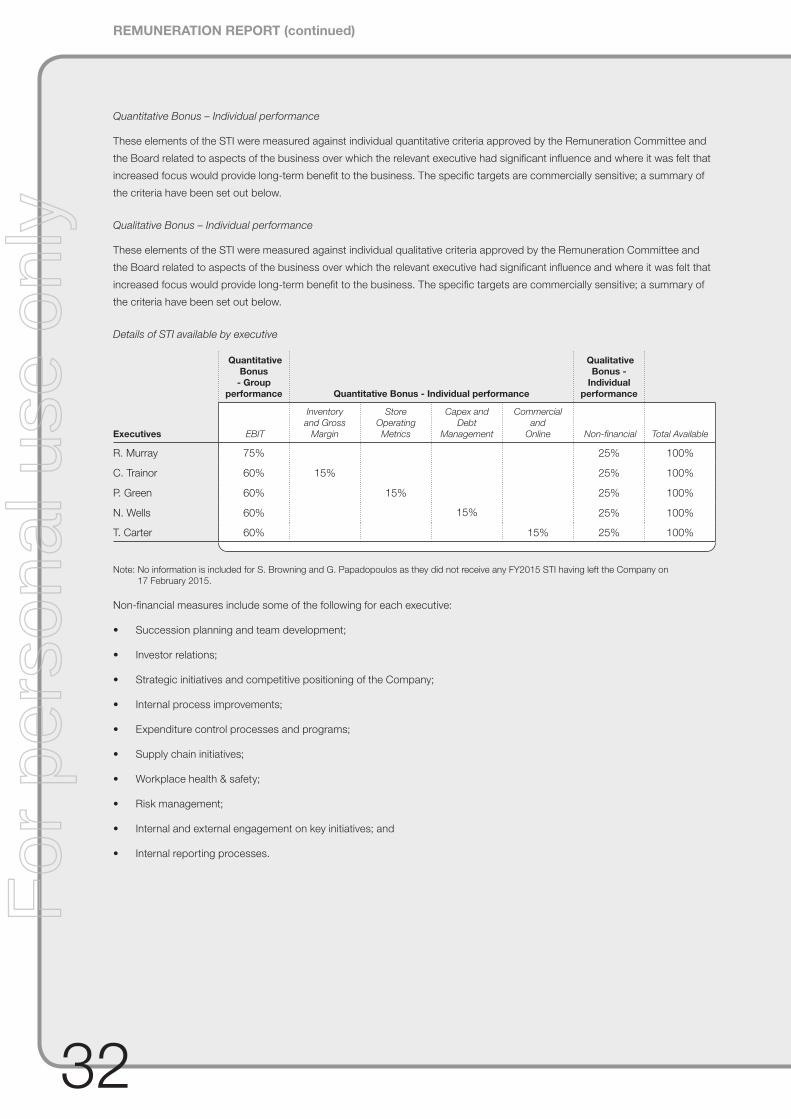
32
Quantitative Bonus – Individual performance
These elements of the STI were measured against individual quantitative criteria approved by the Remuneration Committee and
the Board related to aspects of the business over which the relevant executive had signifi cant infl uence and where it was felt that
increased focus would provide long-term benefi t to the business. The specifi c targets are commercially sensitive; a summary of
the criteria have been set out below.
Qualitative Bonus – Individual performance
These elements of the STI were measured against individual qualitative criteria approved by the Remuneration Committee and
the Board related to aspects of the business over which the relevant executive had signifi cant infl uence and where it was felt that
increased focus would provide long-term benefi t to the business. The specifi c targets are commercially sensitive; a summary of
the criteria have been set out below.
Details of STI available by executive
Quantitative Bonus
- Group performance Quantitative Bonus - Individual performance
Qualitative Bonus -
Individual performance
Executives EBIT
Inventory
and Gross
Margin
Store
Operating
Metrics
Capex and
Debt
Management
Commercial
and
Online Non-fi nancial Total Available
R. Murray 75% 25% 100%
C. Trainor 60% 15% 25% 100%
P. Green 60% 15% 25% 100%
N. Wells 60% 15% 25% 100%
T. Carter 60% 15% 25% 100%
Note: No information is included for S. Browning and G. Papadopoulos as they did not receive any FY2015 STI having left the Company on
17 February 2015.
Non-fi nancial measures include some of the following for each executive:
• Succession planning and team development;
• Investor relations;
• Strategic initiatives and competitive positioning of the Company;
• Internal process improvements;
• Expenditure control processes and programs;
• Supply chain initiatives;
• Workplace health & safety;
• Risk management;
• Internal and external engagement on key initiatives; and
• Internal reporting processes.
REMUNERATION REPORT (continued)
For
per
sona
l use
onl
y

33
Details of STI paid per executive
Each executive’s performance has been measured against the applicable targets. The resulting percentage of STI actually paid of
each element for the 2015 fi nancial year is detailed in the following table:
Quantitative Bonus
- Group performance Quantitative Bonus - Individual performance
Qualitative Bonus -
Individual performance
Executives EBIT
Inventory
and Gross
Margin
Store
Operating
Metrics
Capex and
Debt
Management
Commercial
and
Online Non-fi nancial Total Paid
R. Murray 51% 100% 63%
C. Trainor 51% 100% 100% 71%
P. Green 51% 100% 100% 71%
N. Wells 51% 100% 100% 71%
T. Carter 51% 100% 100% 71%
Note: No information is included for S. Browning and G. Papadopoulos as they did not receive any FY2015 STI having left the Company on
17 February 2015.
Long-Term Incentive (“LTI”) Plan
As with 2012, 2013 and 2014, no options granted to executives (whilst they were executives of the Company) vested in FY2015,
as the performance hurdles were not satisfi ed. The only options held by executives which vested during FY2015 were 11,333
options held by Nick Wells and 5,000 options held by George Papadopoulos, in each case issued prior to these persons
becoming executives.
Form of 2015 Executive LTIs
Executive LTIs for FY2015 only were made up of the following elements:
• Performance and Service Based LTI (80% of available LTI excluding the One-Off Retention Zepos referenced below) – these
were split equally between:
– share options with exercise prices based upon the Company’s share price following the release of its results for the
2014 fi nancial year, EPS based performance hurdles, and a service based vesting condition (“Standard Options”); and
– share options with zero exercise prices, EPS based performance hurdles, and a service based vesting condition
(“Standard Zepos”).
The service based vesting condition provides that one third of these Standard Options and Standard Zepos will vest on each
of the 3rd, 4th and 5th anniversary of issue provided that all other vesting conditions are satisfi ed. The Company believes
that this vesting period appropriately aligns the LTIs with longer term performance. The exercise price for Standard Options
is the closing volume weighted average share price of the Company’s shares over the 5 trading days following and including
the date of release of the Company’s 30 June 2014 full year results, being $17.72, except in respect of those Standard
Options issued to Tim Carter (who joined the Company in September 2014) for which the exercise price for Standard
Options is the closing volume weighted average share price of the Company’s shares over the 5 trading days following and
including 27 November 2014, being $15.58. Details of the EPS based performance hurdles are set out below.
• 2015 Service Based LTI (20% of available LTI excluding the One-Off Retention Zepos referenced below) – share options
with zero exercise prices, service based vesting conditions but no performance hurdles (“Standard Retention Zepos”).
One third of these Standard Retention Zepos will vest on each of the 3rd, 4th and 5th anniversary of issue if the relevant
executive is still employed by the Company at that time, or if the Company terminates the executive’s employment before
that date other than for cause (in which case the options will vest on the anniversaries referred to above). The Board and
Remuneration Committee believe that the purpose of LTI is to both reward and retain executives and, notwithstanding the
strong performance of the Company taking account of market conditions, no options granted to executives, whilst they were
executives, had vested in FY2012 – FY2014 (inclusive). Accordingly, to guard against the risk of executives not attributing any
value to the LTI element of their package and to give effect to this dual purpose of reward and retention, the Board believed
that for FY2015 only it was appropriate to grant a relatively small proportion of share options which are subject only to a
service condition and therefore solely focused on retention of executives.
For
per
sona
l use
onl
y

34
LTI Performance Hurdles
The EPS performance hurdles referred to above require compound annual EPS growth from the statutory 2014 EPS base of
128.4 cents per share. 70% of these options vest upon achievement of 5% compound annual EPS growth and the remaining
30% vest upon achievement of 10% compound annual EPS growth. Where compound annual EPS growth is between 5% and
10%, up to 30% will vest on a linear basis. At the time of issue the Company believed that compound annual EPS growth hurdles
of 5% to 10% were aligned with the earnings outlook of the Group, taking account of consensus forecasts. These EPS growth
hurdles are consistent with EPS growth hurdles applying to executive share options issued in FY2013 and FY2014.
The following table illustrates the EPS targets for options issued in FY2015 with 5% and 10% compound annual EPS growth:
Year FY2017 FY2018 FY2019
EPS hurdle - 5% compound growth 148.6 156.1 163.9
Required increase in EPS from FY2014 EPS 16% 22% 28%
EPS hurdle - 10% compound growth 170.9 188.0 206.8
Required increase in EPS from FY2014 EPS 33% 46% 61%
EPS hurdles are tested each year; to the extent a hurdle is not achieved in one year the hurdle is compounded and reassessed in
each subsequent year, until the earlier of the hurdle being achieved or the option expiring.
The Company believes that retesting is appropriate as the retesting is done against a cumulative EPS fi gure. This means that, if
the target is missed in one period, it is compounded and retested in the next period. The table below provides an example of EPS
compounding for the purpose of hurdle retesting, based on an option granted in August 2014, due to vest in August 2017 and
expire in August 2020, assessed against an EPS hurdle of 10%.
Year FY2014 FY2015 FY2016 FY2017 FY2018 FY2019 FY2020
EPS Grant Base
EPS = 128.4
n/a n/a Test –
Required EPS
= 170.9
Retest –
Required EPS
= 188.0
Retest –
Required EPS
= 206.8
n/a
One-Off Grant of Retention Zepos
In addition to the LTI elements described above some, but not all, executives also received an additional one-off grant of options
with a zero exercise price and a service condition but no performance hurdles (“One-Off Retention Zepos”). This one-off issue
of additional share options with a zero exercise price was made in July 2014 to each of the executives at that time
(Cameron Trainor, Scott Browning, Peter Green and George Papadopoulos) other than the new CEO (Richard Murray) and new
CFO (Nick Wells), and was aimed at retention of these executives following the CEO transition in July 2014. These options are
therefore subject to a service condition only (i.e. there is no performance condition) and will vest if the relevant executive remains
employed by the Company on the second anniversary of issue (1 July 2016). The options will lapse upon the earlier exit of the
executive for any reason (unless the Board decides otherwise) and accordingly these options granted to Scott Browning and
George Papadopoulos lapsed on their exit from the Company in February 2015. The values of the one-off grants were as follows:
Cameron Trainor $399,989; Peter Green $199,986; Scott Browning $199,986; and George Papadopoulos $199,986.
Further Information on LTIs
The issue of options for the 2015 fi nancial year to Richard Murray, the executive director of the Company, was approved by
shareholders at the Company’s Annual General Meeting in October 2014.
Further details of the terms of these options, including service and share price conditions are included under the heading “Group
share option plans” on page 51.
Changes made to the Executive LTI structure for FY2016, including reverting to a policy whereby all long-term incentives issued to
executives are subject to appropriate performance conditions are set out on page 38.
REMUNERATION REPORT (continued)
For
per
sona
l use
onl
y
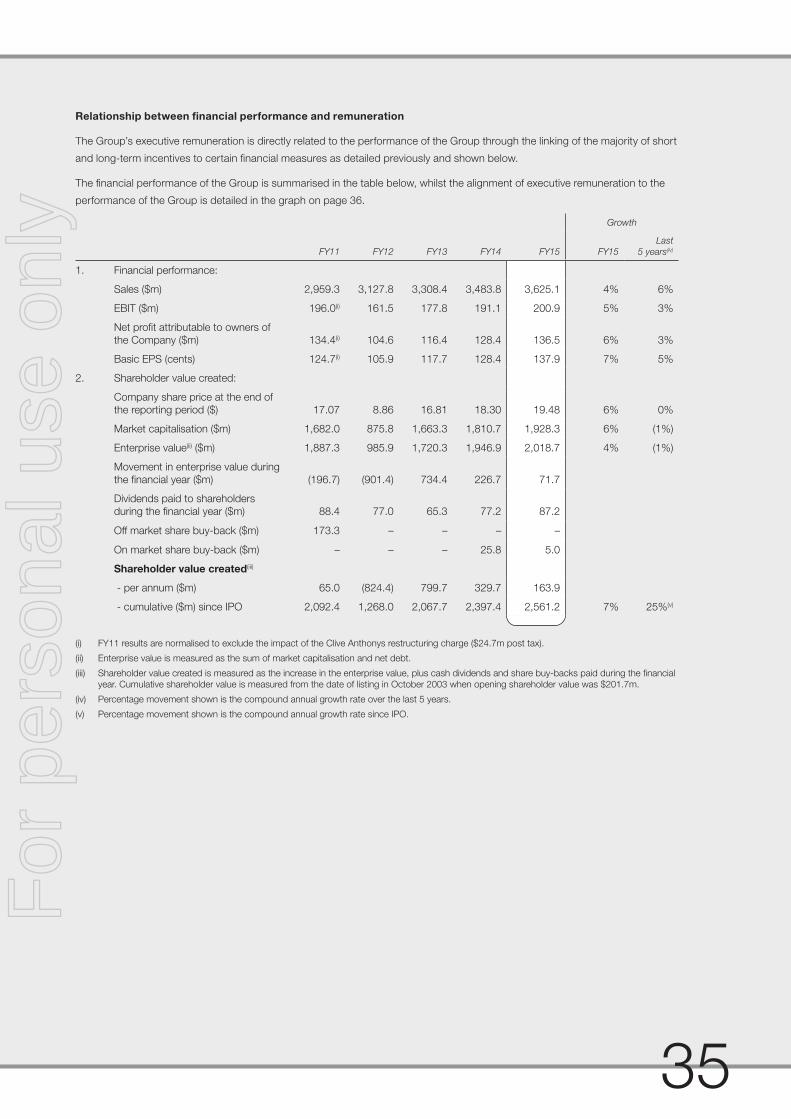
35
Relationship between fi nancial performance and remuneration
The Group’s executive remuneration is directly related to the performance of the Group through the linking of the majority of short
and long-term incentives to certain fi nancial measures as detailed previously and shown below.
The fi nancial performance of the Group is summarised in the table below, whilst the alignment of executive remuneration to the
performance of the Group is detailed in the graph on page 36.
Growth
FY11 FY12 FY13 FY14 FY15 FY15
Last
5 years(iv)
1. Financial performance:
Sales ($m) 2,959.3 3,127.8 3,308.4 3,483.8 3,625.1 4% 6%
EBIT ($m) 196.0(i) 161.5 177.8 191.1 200.9 5% 3%
Net profi t attributable to owners of
the Company ($m) 134.4(i) 104.6 116.4 128.4 136.5 6% 3%
Basic EPS (cents) 124.7(i) 105.9 117.7 128.4 137.9 7% 5%
2. Shareholder value created:
Company share price at the end of
the reporting period ($) 17.07 8.86 16.81 18.30 19.48 6% 0%
Market capitalisation ($m) 1,682.0 875.8 1,663.3 1,810.7 1,928.3 6% (1%)
Enterprise value(ii) ($m) 1,887.3 985.9 1,720.3 1,946.9 2,018.7 4% (1%)
Movement in enterprise value during
the fi nancial year ($m) (196.7) (901.4) 734.4 226.7 71.7
Dividends paid to shareholders
during the fi nancial year ($m) 88.4 77.0 65.3 77.2 87.2
Off market share buy-back ($m) 173.3 – – – –
On market share buy-back ($m) – – – 25.8 5.0
Shareholder value created(iii)
- per annum ($m) 65.0 (824.4) 799.7 329.7 163.9
- cumulative ($m) since IPO 2,092.4 1,268.0 2,067.7 2,397.4 2,561.2 7% 25%(v)
(i) FY11 results are normalised to exclude the impact of the Clive Anthonys restructuring charge ($24.7m post tax).
(ii) Enterprise value is measured as the sum of market capitalisation and net debt.
(iii) Shareholder value created is measured as the increase in the enterprise value, plus cash dividends and share buy-backs paid during the fi nancial
year. Cumulative shareholder value is measured from the date of listing in October 2003 when opening shareholder value was $201.7m.
(iv) Percentage movement shown is the compound annual growth rate over the last 5 years.
(v) Percentage movement shown is the compound annual growth rate since IPO.
For
per
sona
l use
onl
y

36
The graph below shows the relationship between total executive remuneration and EPS over the past 5 years. Whilst EPS has
increased from FY2014 to FY2015:
• total executive remuneration decreased in FY2015, largely as a result of lower remuneration packages for executives new
to their role compared to their predecessors and the departure of two executives in February 2015 (which was only partially
offset by the recruitment of a new executive in September 2014);
• Short Term Incentive earned by executives for FY2015 decreased compared to FY2014. This was as a result of the current
executives each receiving between 63%-71% of their available STI rather than between 81% - 85% as received in FY2014,
and as a result of the departure of two executives in February 2015 which was only partially offset by the recruitment of a
new executive in September 2014; and
• although only a very small proportion of options granted to executives actually vested in FY2015 (being options granted
before the holders became executives) the expense incurred by the Company in relation to executive LTIs in 2015 (as shown
in the graph) has increased from 2014 primarily: (i) because the growth in the Company’s EPS over the past 4 fi nancial years
has increased the likelihood of options vesting in the future; and (ii) as a result of the grant of the One-Off Retention Zepos
to certain executives as detailed on page 34. This increase has been partially offset by the departure of two executives
compared to the recruitment of only one executive.
Executive remuneration and EPS over the last 5 fi nancial years:
-
20
40
60
80
100
120
140
160
-
1,000,000
2,000,000
3,000,000
4,000,000
5,000,000
6,000,000
7,000,000
8,000,000
9,000,000
10,000,000
2011
EP
S (cents
per
share
)
Rem
unera
tio
n $
LTI
STI
Fixed
EPS
2012 2013 2014 2015
Notes
1. 2011 EPS is normalised to exclude the impact of the Clive Anthonys restructuring charge.
2. 2012 LTI expense is the 2012 period LTI expense only, excluding any prior period write-backs.
3. An additional executive, George Papadopoulos, joined the executive team mid-way through FY2012 and FY2013 is the fi rst year which includes
a full year of Mr Papadopoulos’ remuneration. An additional executive, Tim Carter, joined the executive team in September 2014 and FY2015
therefore only includes 10 months of Mr Carter’s remuneration.
4. 2014 excludes the one-off payment made to Terry Smart in relation to his departure from the Company on 30 June 2014 as detailed on page 43.
2014 LTI expense shown includes Mr Smart’s full LTI expense for FY2014 assuming he had not retired and the expense had not been written back.
5. Scott Browning and George Papadopoulos left the Company on 17 February 2015 and FY2015 therefore only includes 7.5 months of
Mr Browning’s and Mr Papadopoulos’ fi xed remuneration and excludes one-off payments made in relation to their departures detailed on page 42.
2015 LTI expense includes the expense that would have been recognised for Scott Browning and George Papadopoulos for the 7.5 months until
they left the Company in February 2015 without any write-back of this expense.
6. LTI expense shown is the accounting expense recognised in the fi nancial year (except to the extent set out in Notes 2, 4 and 5 above).
REMUNERATION REPORT (continued)
For
per
sona
l use
onl
y

37
The effectiveness of the executives’ performance related remuneration in driving performance is refl ected in the long term growth
of the share price of the Company. The following graph plots the JB Hi-Fi closing share price and the ASX 200 on a daily basis
between listing on the ASX and 1 August 2015. The JB Hi-Fi closing share price compound annual growth rate between listing
and 31 July 2015 is 22.9%, whilst the ASX 200 compound annual growth rate over the same period is 4.7%.
$0.00
$5.00
$10.00
$15.00
$20.00
$25.00
Sh
are
Pri
ce
JB Hi-Fi Share Price ASX 200 (rebased against JBH share price)
Oct-
03
Oct-
04
Feb
-04
Jun-0
4
Oct-
05
Feb
-05
Jun-0
5
Feb
-06
Jun-0
6
Oct-
06
Oct-
07
Feb
-07
Jun-0
7
Oct-
08
Feb
-08
Jun-0
8
Feb
-09
Jun-0
9
Oct-
09
Oct-
10
Feb
-10
Jun-1
0
Oct-
11
Feb
-11
Jun-1
1
Feb
-12
Jun-1
2
Oct-
12
Oct-
13
Feb
-13
Jun-1
3
Oct-
14
Feb
-14
Jun-1
4
Feb
-15
Jun-1
5
Key terms of executive employment agreements
The remuneration and other terms of employment for each of the executives are set out in individual Company employment
agreements. None of the executives are subject to a fi xed term of employment; all of the agreements are open-ended.
Name Notice Periods/Termination Payment/Non-compete
Richard Murray 12 months’ notice (or payment in lieu)
12 months’ post termination non-compete and non-solicitation restriction
Cameron Trainor 9 months’ notice (or payment in lieu) if terminated by the Company
4 months’ notice if terminated by the executive
9 months’ post termination non-compete and non-solicitation restriction
Peter Green, Nick Wells, Tim Carter 6 months’ notice (or payment in lieu)
6 months’ post termination non-compete and non-solicitation restriction
Each executive may be terminated immediately for serious misconduct.
In no instance would a payment in lieu of notice exceed the termination payments limits set out in the Corporations Act 2001.
Each of the executive service contracts other than the contract for Cameron Trainor (which was entered into in 2009, several
years before the current contracts for each of the other executives) contains contractual entitlements for the Company to
clawback incentive remuneration in the event of fraud, dishonesty, or material misstatements in, or omissions from, the
Company’s fi nancial statements or misstatements concerning the satisfaction of a performance condition.For
per
sona
l use
onl
y

38
EXECUTIVE REMUNERATION PACKAGES – KEY CHANGES FOR FY2016
The Remuneration Committee and the Board regularly review the Company’s remuneration practices to ensure that they remain
fi t for purpose, appropriate for the Company’s operating environment, aligned with evolving market trends and shareholder
expectations and continue to reward, incentivise and retain key employees. As a result of its recent review, the Company has
decided to make a number of changes to the remuneration framework for FY2016.
Remuneration Packages
The Company has obtained remuneration recommendations in respect of the FY2016 Executive Remuneration Packages for the
CEO, CFO and the Merchandise Director. Packages for the other executives are then set by reference to the packages for these
executives.
Restructure of Executive STIs for FY2016
The Company will introduce a component of deferred short term incentive. Executives will receive 90% of the FY2016 STI to
which they are entitled in cash and the remaining 10% in shares which will be subject to a restriction on sale/disposal for one
year after issue. The shares will be forfeited by the executive if the executive’s employment is terminated for cause during the
restriction period. The achievement of STI will continue to be subject to group and individual performance targets.
It is the Company’s intention to review the percentage of STI that will be subject to deferral with a view to increasing the deferred
component over the next few years.
Restructure of Executive LTIs for FY2016
All FY2016 LTI for Executives will be subject to both performance hurdles and a service based vesting condition. Retention based
grants were made to executives in FY2015 in the context of the CEO transition and to recognise the lack of vesting under the
LTI, notwithstanding strong company performance. With the Company now through the CEO transition period, the Company no
longer considers retention based grants to be necessary.
The performance hurdles will require compound annual EPS growth (from FY2015 EPS of 137.9 cps) of between 4% and 8% per
annum as follows:
Compound annualEPS growth achieved Portion of grant vesting
4% 40%
5% 50%
8% 100%
Where compound annual EPS growth is between 4% to 5%, up to 10% will vest on a linear basis.
Where compound annual EPS growth is between 5% to 8%, the remaining 50% will vest on a linear basis.
The Board considers this equity performance linked remuneration structure is effective in aligning the long-term interests of
executives and shareholders and, when setting the performance hurdles, the Board considered both consensus forecasts and
the earnings outlook for the Group.
As with recent years, the service based vesting condition provides that these options will vest a third each on the third, fourth and
fi fth anniversary of grant date provided that all other vesting conditions are satisfi ed.
For FY2016, the LTI award will consist entirely of Zero Exercise Price Options (Zepos). LTI grants previously comprised a
combination of traditional options (with an exercise price) and Zepos. Given the fl uctuation of the Company’s share price over
recent years (which has largely been infl uenced by external factors beyond the control of the executives), there is a risk that even
where performance conditions are met, the exercise price under the traditional options will not exceed the market price and
therefore the options hold no value for executives, notwithstanding the delivery of strong company performance. Accordingly, the
Company no longer considers traditional options to be an appropriate instrument to give effect to its objectives of rewarding and
motivating executives.
REMUNERATION REPORT (continued)
For
per
sona
l use
onl
y

39
NON-EXECUTIVE DIRECTOR REMUNERATION
FY2015 Non-Executive Director Remuneration
The following persons acted as non-executive directors of the Company during and since the end of the fi nancial year and are
considered members of key management personnel:
Greg Richards Non-executive Director, Chairman of the Board and Remuneration Committee
James King Non-executive Director, Member of the Audit and Risk Management Committee and the Remuneration
Committee
Beth Laughton Non-executive Director, Chairman of the Audit and Risk Management Committee
Gary Levin Non-executive Director, Member of the Audit and Risk Management Committee and the Remuneration
Committee
Richard Uechtritz Non-executive Director
The overriding objective of the JB Hi-Fi remuneration policies with regard to non-executive directors is to ensure the Company
is able to attract and retain non-executive directors with the skills and experience to ensure the Board is able to discharge its
oversight and governance responsibilities in an effective and diligent manner. The Board also believes that remuneration for
non-executive directors should refl ect the time commitment and responsibilities of the role.
The remuneration packages for non-executive directors for FY2015 and FY2014 are set out below. Following the consideration
of benchmarking data and a remuneration recommendation provided by its remuneration consultants, the Board resolved to
increase remuneration for its non-executive directors for FY2015 in order to ensure that both the remuneration levels remained
competitive and that the Company is able to continue to attract and retain high calibre directors. The increases shown in this
table were the fi rst increases since October 2010 with the result that the previous fees were relatively low compared to those paid
by comparable companies. Non-executive director remuneration remains within the amount determined by the Company in its
Annual General Meeting on 12 October 2011 being $1,250,000.
Role
Fees
2015
$
Fees
2014
$
Chairman $270,000 $240,000
Non-executive director $130,000 $120,000
Additional Committee Fees
Remuneration Committee Chairman $20,000 $0
Audit and Risk Management Committee Chairman $28,000 $25,000
Audit and Risk Management Committee member $14,000 $10,000
Remuneration Committee member $12,000 $10,000
Superannuation contributions are made by the Company on behalf of non-executive directors in line with statutory requirements
and are included in the remuneration package amount. It is the policy of the Company not to pay lump sum retirement benefi ts to
non-executive directors.
It is the policy of the Company to not have any elements of non-executive director remuneration at risk. Specifi cally, non-executive
directors do not receive any bonus payments and are not entitled to participate in any Company share option plans.
FY2016 Non-Executive Director Remuneration
Non-executive directors’ fees will remain at the current level for the 2016 fi nancial year. The Remuneration Committee will
continue to review remuneration for non-executive directors on an annual basis in order to ensure that the objectives set out
above in respect of non-executive directors’ remuneration are met.
For
per
sona
l use
onl
y

40
OTHER INFORMATION
Board Policy with regard to executives limiting their exposure to risk in relation to equity options
The Company’s Securities Trading Policy prohibits directors, executives, senior management and other specifi ed employees from
altering the economic benefi t or risk derived by them in relation to any unvested equity options that they hold. The Policy also
requires directors and executives to obtain prior written approval from the chairman before altering the economic benefi t or risk
derived by them in relation to any shares or options in JB Hi-Fi held by them. Each year directors and executives are required to
sign a declaration that they are in compliance with all elements of the JB Hi-Fi Securities Trading Policy. These declarations have
been received in relation to the 2015 fi nancial year from all directors and executives.
Remuneration Recommendations
3 Degrees Consulting was engaged by the Chairman of the Remuneration Committee to provide independent governance,
legal and remuneration related advice in relation to key management personnel matters. In the 2015 fi nancial year, 3 Degrees
Consulting provided remuneration recommendations as defi ned in the Corporations Act 2001 in relation to the FY2016
remuneration packages for the CEO, CFO and Merchandise Director and was paid $18,000 (excluding GST) for these services.
3 Degrees Consulting provided formal declarations confi rming that its recommendations were made free from undue infl uence
by the member or members of the key management personnel to whom the recommendations related and, in view of this
declaration and the process adopted in the engagement of 3 Degrees Consulting and receipt of its recommendations, the Board
is satisfi ed that each of the recommendations were free of undue infl uence by such persons.
In addition to the above, 3 Degrees Consulting was engaged to provide other governance, legal, remuneration and board
succession related services and was paid a total of $140,300 (excluding GST) in the 2015 fi nancial year for these services.
REMUNERATION REPORT (continued)
For
per
sona
l use
onl
y

41
KEY MANAGEMENT PERSONNEL COMPENSATION
Key management personnel for FY2015 include the non-executive directors and the seven identifi ed executives. Tim Carter joined
the Company as Online & Commercial Director on 8 September 2014 and Scott Browning and George Papadopoulos left the
Company on 17 February 2015. All other executives held their roles for the whole of FY2015. The aggregate compensation of the
key management personnel of the Group for FY2015 is set out below:
Consolidated
2015
$
2014
$
Short-term employee benefi ts
Salary and fees 4,332,490 5,374,486
Bonus 1,406,286 2,849,072
Other 1,172,386 1,463,085
6,911,162 9,686,643
Post-employment benefi ts
Superannuation 265,636 229,611
265,636 229,611
Share based payments
Current period expense 1,253,128 978,369
Prior periods expense write-back (393,573) (114,959)
859,555 863,410
8,036,353 10,779,664
For
per
sona
l use
onl
y

42
The compensation for each member of the key management personnel of the Group is set out below:
Short-term employee benefi ts
Post-
employ-
ment
benefi ts Share based payments(ii)
Salary &
fees Bonus(ii) Other(iii)
Total
short-term
employee
benefi ts
Super-
annuation
Current
period
expense(i)
Prior
periods
expense
write-back(i)
Total
Share based
payments Total
2015 $ $ $ $ $ $ $ $ $
Non-executive directors
G. Richards 269,033 – – 269,033 20,967 – – – 290,000
J. King 142,466 – – 142,466 13,534 – – – 156,000
B. Laughton 144,292 – – 144,292 13,708 – – – 158,000
G. Levin 127,660 – – 127,660 28,340 – – – 156,000
R. Uechtritz 118,721 – – 118,721 11,279 – – – 130,000
802,172 – – 802,172 87,828 – – – 890,000
Executives
R. Murray 1,041,813 523,144 28,187 1,593,144 30,000 381,122 – 381,122 2,004,266
S. Browning 390,478 – 614,105 1,004,583 16,058 – (221,402) (221,402)(iv) 799,239
C. Trainor 754,985 411,856 33,000 1,199,841 35,000 479,860 – 479,860 1,714,701
P. Green 487,752 223,734 20,000 731,486 30,000 257,085 – 257,085 1,018,571
G. Papadopoulos 314,251 – 440,940 755,191 16,058 5,981 (172,171) (166,190)(iv) 605,059
N. Wells 278,539 123,776 20,000 422,315 26,461 98,185 – 98,185 546,961
T. Carter 262,500 123,776 16,154 402,430 24,231 30,895 – 30,895 457,556
3,530,318 1,406,286 1,172,386 6,108,990 177,808 1,253,128 (393,573) 859,555 7,146,353
4,332,490 1,406,286 1,172,386 6,911,162 265,636 1,253,128 (393,573) 859,555 8,036,353
(i) In accordance with Accounting Standards, remuneration includes the amortisation of the fair value of options issued under the Group share
option plans that are expected to vest, less any write-back on options lapsed or expected to lapse as a result of actual or expected performance
against non-market hurdles (“Option Accounting Value”). The fair value of options is measured at grant date in accordance with the relevant
accounting standard and progressively allocated to profi t and loss over the vesting period of the option. The amount included in remuneration
above may not be indicative of the benefi t (if any) that key management personnel may ultimately realise should the equity instruments vest.
(ii) Performance based.
(iii) For S. Browning, the amount in the “Other” column comprises $596,000 paid in relation to his departure on 17 February 2015 and in return for
an 11 month restraint, and a $18,105 car allowance. For G. Papadopoulos, the amount in the “Other column comprises $424,882 paid in relation
to his departure on 17 February 2015 and in return for a 9 month restraint, and a $16,058 car allowance. For all other executives, the amount
shown is comprised entirely of car allowances.
(iv) Share based payment expense has been impacted by the lapse of all unvested options held by S. Browning and G. Papadopoulos at the time of
their departure.
REMUNERATION REPORT (continued)
For
per
sona
l use
onl
y

43
Performance based
Short-term employee benefi ts Share based payments
Maximum Potential STI Actual STI Maximum Potential LTI Actual LTI(i)
Bonus Bonus Options Options
2015 $
% of total
potential
remuneration $
% of total
actual
remuneration $
% of total
potential
remuneration $
% of total
actual
remuneration
Executives
R. Murray 825,000 35% 523,144 26% 409,131 18% 381,122 19%
S. Browning(ii) 467,772 32% – 0% 337,015 23% (221,402) (28%)
C. Trainor 582,301 30% 411,856 24% 507,702 27% 479,860 28%
P. Green 316,325 28% 223,734 22% 271,333 24% 257,085 25%
G. Papadopoulos(ii) 317,208 28% – 0% 286,830 25% (166,190) (27%)
N. Wells 175,000 29% 123,776 23% 98,185 16% 98,185 18%
T. Carter 175,000 30% 123,776 27% 30,895 5% 30,895 7%
2,858,606 31% 1,406,286 20% 1,941,091 21% 859,555 12%
(i) Actual LTI is equal to the sum of the current period share based payments expense and the prior periods write-back.
(ii) S. Browning and G. Papadopoulos left the Company on 17 February 2015. The maximum potential STI and LTI disclosed is their full 12 month
package.
Short-term employee benefi ts
Post-
employ-
ment
benefi ts Share based payments(ii)
Salary &
fees Bonus(ii) Other(iii)
Total
short-term
employee
benefi ts
Super-
annuation
Current
period
expense(i)
Prior periods
expense
write-back(i)
Total Share
based
payments Total
2014 $ $ $ $ $ $ $ $ $
Non-executive directors
G. Richards 219,680 – – 219,680 20,320 – – – 240,000
J. King 128,146 – – 128,146 11,854 – – – 140,000
B. Laughton 132,723 – – 132,723 12,277 – – – 145,000
G. Levin 115,000 – – 115,000 25,000 – – – 140,000
R. Uechtritz 109,840 – – 109,840 10,160 – – – 120,000
705,389 – – 705,389 79,611 – – – 785,000
Executives
T. Smart 1,662,859 991,526 1,328,711 3,983,096 25,000 216,328 (114,959) 101,369(iv) 4,109,465
R. Murray 745,828 481,218 28,187 1,255,233 25,000 181,477 – 181,477 1,461,710
S. Browning 588,675 386,570 28,187 1,003,432 25,000 145,781 – 145,781 1,174,213
C. Trainor 741,015 481,218 33,000 1,255,233 25,000 192,922 – 192,922 1,473,155
P. Green 467,145 256,434 20,000 743,579 25,000 105,239 – 105,239 873,818
G. Papadopoulos 463,575 252,106 25,000 740,681 25,000 136,622 – 136,622 902,303
4,669,097 2,849,072 1,463,085 8,981,254 150,000 978,369 (114,959) 863,410 9,994,664
5,374,486 2,849,072 1,463,085 9,686,643 229,611 978,369 (114,959) 863,410 10,779,664
(i) In accordance with Accounting Standards, remuneration includes the amortisation of the fair value of options issued under the Group share
option plans that are expected to vest, less any write-back on options lapsed or expected to lapse as a result of actual or expected performance
against non-market hurdles (“Option Accounting Value”). The fair value of options is measured at grant date in accordance with the relevant
accounting standard and progressively allocated to profi t and loss over the vesting period of the option. The amount included in remuneration
above may not be indicative of the benefi t (if any) that key management personnel may ultimately realise should the equity instruments vest.
(ii) Performance based.
(iii) For T. Smart, the amount in the “Other” column comprises the $1,295,000 one-off payment on retirement and a $33,711 car allowance. For all
other executives, the amount shown is comprised entirely of car allowances.
(iv) Share based payment expense has been impacted by the lapse of certain options and retention of other options upon T. Smart’s retirement.
For
per
sona
l use
onl
y

44
Performance based
Short-term employee benefi ts Share based payments
Maximum Potential STI Actual STI Maximum Potential LTI Actual LTI(i)
Bonus Bonus Options Options
2014 $
% of total
potential
remuneration $
% of total
actual
remuneration $
% of total
potential
remuneration $
% of total
actual
remuneration
Executives
T. Smart 1,218,092 35% 991,526 24% 578,048 16% 101,369 2%
R. Murray 565,341 35% 481,218 33% 262,222 16% 181,477 12%
S. Browning 454,148 35% 386,570 33% 210,662 16% 145,781 12%
C. Trainor 565,341 34% 481,218 33% 305,719 18% 192,922 13%
P. Green 301,262 31% 256,434 29% 154,746 16% 105,239 12%
G. Papadopoulos 302,103 31% 252,106 28% 173,630 18% 136,622 15%
3,406,287 34% 2,849,072 29% 1,685,027 17% 863,410 9%
(i) Actual LTI is equal to the sum of the current period share based payments expense and the prior periods write-back.
All bonuses are paid in the fi nancial year following the year in which they were earned, for example the 2015 fi nancial year
bonuses are paid in August 2015 (the 2016 fi nancial year), except for Terry Smart’s 2014 fi nancial year bonus, of which 79% was
paid upon his retirement in June 2014 with the balance paid in August 2014.
REMUNERATION REPORT (continued)
For
per
sona
l use
onl
y

45
KEY MANAGEMENT PERSONNEL EQUITY/OPTIONS
Fully paid ordinary shares of JB Hi-Fi Limited
2015(i)(ii)
Balance at
1 July 2014
No.
Granted as
compensation
No.
Received on
exercise of options
No.
Net other change
No.
Balance at
30 June 2015
No.
Balance held
nominally
No.
G. Richards 23,000 – – – 23,000 3,000
J. King 32,258 – – – 32,258 32,258
B. Laughton 500 – – – 500 –
G. Levin 30,000 – – – 30,000 –
R. Uechtritz 10,000 – – – 10,000 –
R. Murray 102,000 – – – 102,000 –
C. Trainor 1,000 – – (1,000) – –
P. Green 13 – – – 13 –
N. Wells – – 11,333 (11,333) – –
T. Carter – – – – – –
198,771 – 11,333 (12,333) 197,771 35,258
(i) S. Browning left the Company on 17 February 2015. During the period to 17 February 2015, S. Browning had no transactions with ordinary
shares. At the date he left the Company, S. Browning held 41,258 ordinary shares.
(ii) G. Papadopoulos left the Company on 17 February 2015. During the period to 17 February 2015, G. Papadopoulos received 13,818 ordinary
shares on exercise of options and disposed of 13,818 ordinary shares. At the date he left the Company, G. Papadopoulos held no ordinary
shares.
2014
Balance at
1 July 2013
No.
Granted as
compensation
No.
Received on
exercise of options
No.
Net other change
No.
Balance at
30 June 2014
No.
Balance held
nominally
No.
G. Richards 23,000 – – – 23,000 3,000
J. King 32,258 – – – 32,258 32,258
B. Laughton 500 – – – 500 –
G. Levin 30,000 – – – 30,000 –
R. Uechtritz – – 58,219 (48,219) 10,000 –
T. Smart 1,001,031 – 129,240 (171,031) 959,240 –
R. Murray 118,250 – 41,477 (57,727) 102,000 –
S. Browning 161,536 – 41,258 (161,536) 41,258 –
C. Trainor 2,000 – – (1,000) 1,000 1,000
P. Green 13 – 28,333 (28,333) 13 –
G. Papadopoulos – – 13,819 (13,819) – –
1,368,588 – 312,346 (481,665) 1,199,269 36,258
For
per
sona
l use
onl
y

46
Share options of JB Hi-Fi Limited
2015(i)(ii)
Balance at
1 July 2014
No.
Granted as
compensation(iii)
No.
Exercised
No.
Net other
change(iv)
No.
Balance at
30 June 2015
No.
Balance vested
at
30 June 2015
No.
Options vested
during year
No.
R. Murray 311,640 135,142 – – 446,782 – –
C. Trainor 410,346 77,248 – (78,844) 408,750 – –
P. Green 189,132 44,480 – – 233,612 – –
N. Wells 35,116 32,760 (11,333) – 56,543 – 11,333
T. Carter – 41,364 – – 41,364 – –
946,234 330,994 (11,333) (78,844) 1,187,051 – 11,333
(i) S. Browning left the Company on 17 February 2015. During the period to 17 February 2015, S. Browning was granted 54,978 options and did
not exercise any options. At the date of his departure, S. Browning held 305,353 unvested options, all of which lapsed on his departure.
(ii) G. Papadopoulos left the Company on 17 February 2015. During the period to 17 February 2015, G. Papadopoulos was granted 44,571 options
and exercised 5,000 options. At the date of his departure, G Papadopoulos held 8,818 vested options that he retained and 221,920 unvested
options which lapsed on his departure.
(iii) Excludes any options that may be granted by the Board in August 2015. The issue of any such options to R. Murray, executive director of the
Company, is also subject to shareholder approval at the Company’s Annual General Meeting in October 2015.
(iv) Options shown as lapsed during the fi nancial year lapsed as they were not exercised prior to expiry.
2014
Balance at
1 July 2013
No.
Granted as
compensation(ii)
No.
Exercised
No.
Net other
change(iii)
No.
Balance at
30 June 2014
No.
Balance vested
at
30 June 2014
No.
Options vested
during year
No.
R. Uechtritz(i) 248,507 – (58,219) (190,288) – – –
T. Smart 829,983 103,883 (129,240) (697,950) 106,676 – –
R. Murray 361,597 48,214 (41,477) (56,694) 311,640 – –
S. Browning 309,160 38,731 (41,258) (56,258) 250,375 – –
C. Trainor 359,067 51,279 – – 410,346 – –
P. Green 188,682 28,783 (28,333) – 189,132 – –
G. Papadopoulos 176,121 28,864 (13,819) – 191,166 8,818 22,637
2,473,117 299,754 (312,346) (1,001,190) 1,459,335 8,818 22,637
(i) Options were held in respect of R. Uechtritz’s role as a consultant to the Group which were granted whilst he was CEO of the Group. The
consultancy agreement ended in November 2013.
(ii) Excludes options issued to S. Browning, C. Trainor, P. Green and G. Papadopoulos in July 2014 and any options that were granted by the Board
in August 2014. The issue of any such options to R. Murray, executive director of the Company, was also subject to shareholder approval at the
Company’s Annual General Meeting in October 2014.
(iii) For T. Smart, 587,176 options lapsed on T. Smart’s retirement. All other options lapsed during the fi nancial year as they were not exercised prior
to expiry.
All employee and executive share options issued to employees and executives during the fi nancial year were made in accordance
with the provisions of the Company’s share option plans.
During the fi nancial year 16,333 options (2014: 312,346) were exercised by key management personnel. The weighted average
exercise price for these options was $14.50 (2014: $14.01) per ordinary share in JB Hi-Fi Limited.
REMUNERATION REPORT (continued)
For
per
sona
l use
onl
y

47
Value of key management personnel options granted, exercised and lapsed during the fi nancial year
The following table summarises the value of options granted and exercised during the fi nancial year to the key management personnel:
2015
Value of options granted –
at the grant date(i)
Value of options exercised –
at the exercise date
$ $
R. Murray 824,775 –
S. Browning 464,360 –
C. Trainor 729,097 –
P. Green 400,272 –
G. Papadopoulos 400,832 11,291
N. Wells 199,943 65,801
T. Carter 199,952 –
3,219,231 77,092
(i) The value of options granted during the period is recognised in remuneration over the vesting period of the option, in accordance with Australian
equivalents to International Financial Reporting Standards.
The value of options granted and exercised during the year is calculated based on the following:
• fair value of the option at grant date multiplied by the number of options granted; and
• fair value of the option at the time it is exercised multiplied by the number of options exercised.
For
per
sona
l use
onl
y
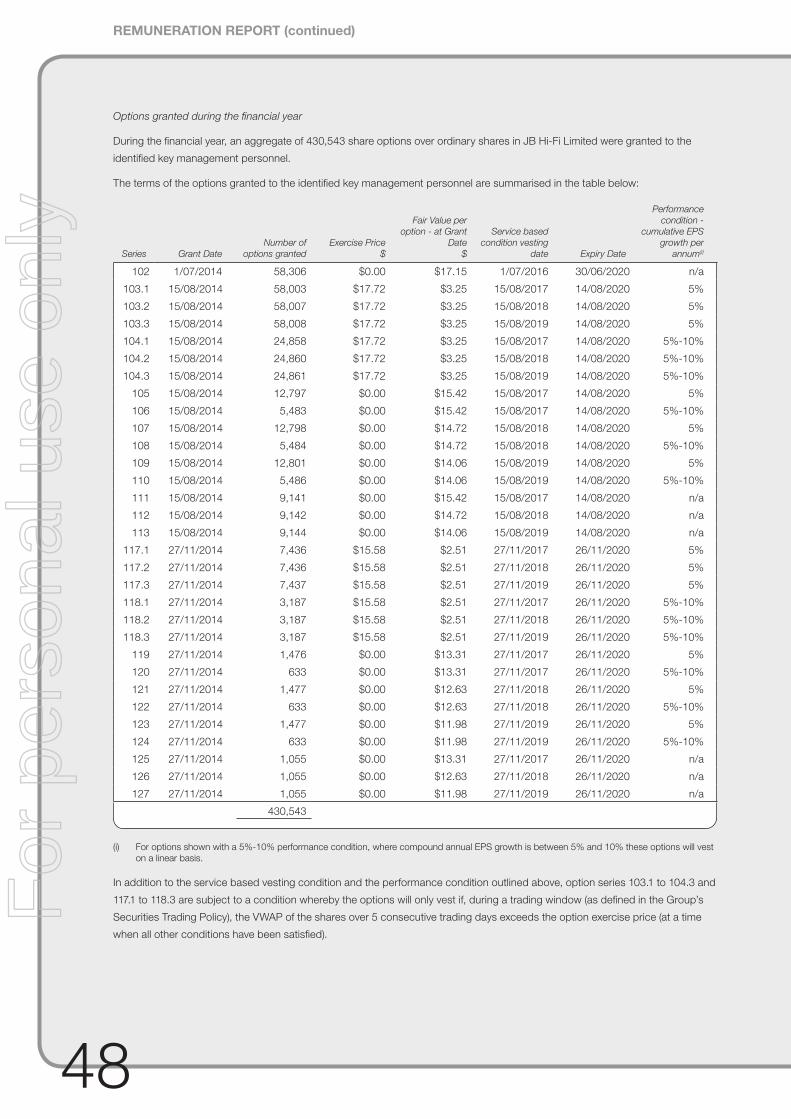
48
Options granted during the fi nancial year
During the fi nancial year, an aggregate of 430,543 share options over ordinary shares in JB Hi-Fi Limited were granted to the
identifi ed key management personnel.
The terms of the options granted to the identifi ed key management personnel are summarised in the table below:
Series Grant Date
Number of
options granted
Exercise Price
$
Fair Value per
option - at Grant
Date
$
Service based
condition vesting
date Expiry Date
Performance
condition -
cumulative EPS
growth per
annum(i)
102 1/07/2014 58,306 $0.00 $17.15 1/07/2016 30/06/2020 n/a
103.1 15/08/2014 58,003 $17.72 $3.25 15/08/2017 14/08/2020 5%
103.2 15/08/2014 58,007 $17.72 $3.25 15/08/2018 14/08/2020 5%
103.3 15/08/2014 58,008 $17.72 $3.25 15/08/2019 14/08/2020 5%
104.1 15/08/2014 24,858 $17.72 $3.25 15/08/2017 14/08/2020 5%-10%
104.2 15/08/2014 24,860 $17.72 $3.25 15/08/2018 14/08/2020 5%-10%
104.3 15/08/2014 24,861 $17.72 $3.25 15/08/2019 14/08/2020 5%-10%
105 15/08/2014 12,797 $0.00 $15.42 15/08/2017 14/08/2020 5%
106 15/08/2014 5,483 $0.00 $15.42 15/08/2017 14/08/2020 5%-10%
107 15/08/2014 12,798 $0.00 $14.72 15/08/2018 14/08/2020 5%
108 15/08/2014 5,484 $0.00 $14.72 15/08/2018 14/08/2020 5%-10%
109 15/08/2014 12,801 $0.00 $14.06 15/08/2019 14/08/2020 5%
110 15/08/2014 5,486 $0.00 $14.06 15/08/2019 14/08/2020 5%-10%
111 15/08/2014 9,141 $0.00 $15.42 15/08/2017 14/08/2020 n/a
112 15/08/2014 9,142 $0.00 $14.72 15/08/2018 14/08/2020 n/a
113 15/08/2014 9,144 $0.00 $14.06 15/08/2019 14/08/2020 n/a
117.1 27/11/2014 7,436 $15.58 $2.51 27/11/2017 26/11/2020 5%
117.2 27/11/2014 7,436 $15.58 $2.51 27/11/2018 26/11/2020 5%
117.3 27/11/2014 7,437 $15.58 $2.51 27/11/2019 26/11/2020 5%
118.1 27/11/2014 3,187 $15.58 $2.51 27/11/2017 26/11/2020 5%-10%
118.2 27/11/2014 3,187 $15.58 $2.51 27/11/2018 26/11/2020 5%-10%
118.3 27/11/2014 3,187 $15.58 $2.51 27/11/2019 26/11/2020 5%-10%
119 27/11/2014 1,476 $0.00 $13.31 27/11/2017 26/11/2020 5%
120 27/11/2014 633 $0.00 $13.31 27/11/2017 26/11/2020 5%-10%
121 27/11/2014 1,477 $0.00 $12.63 27/11/2018 26/11/2020 5%
122 27/11/2014 633 $0.00 $12.63 27/11/2018 26/11/2020 5%-10%
123 27/11/2014 1,477 $0.00 $11.98 27/11/2019 26/11/2020 5%
124 27/11/2014 633 $0.00 $11.98 27/11/2019 26/11/2020 5%-10%
125 27/11/2014 1,055 $0.00 $13.31 27/11/2017 26/11/2020 n/a
126 27/11/2014 1,055 $0.00 $12.63 27/11/2018 26/11/2020 n/a
127 27/11/2014 1,055 $0.00 $11.98 27/11/2019 26/11/2020 n/a
430,543
(i) For options shown with a 5%-10% performance condition, where compound annual EPS growth is between 5% and 10% these options will vest
on a linear basis.
In addition to the service based vesting condition and the performance condition outlined above, option series 103.1 to 104.3 and
117.1 to 118.3 are subject to a condition whereby the options will only vest if, during a trading window (as defi ned in the Group’s
Securities Trading Policy), the VWAP of the shares over 5 consecutive trading days exceeds the option exercise price (at a time
when all other conditions have been satisfi ed).
REMUNERATION REPORT (continued)
For
per
sona
l use
onl
y

49
The number of options granted to the identifi ed key management personnel by series is set out in the table below:
Number of options granted
Series R. Murray S. Browning C. Trainor P. Green G. Papadopoulos N. Wells T. Carter Total
102 - 11,661 23,323 11,661 11,661 – – 58,306
103.1 23,691 7,594 9,453 5,753 5,769 5,743 – 58,003
103.2 23,692 7,594 9,454 5,754 5,770 5,743 – 58,007
103.3 23,692 7,594 9,454 5,754 5,770 5,744 – 58,008
104.1 10,154 3,254 4,051 2,466 2,472 2,461 – 24,858
104.2 10,154 3,254 4,052 2,466 2,473 2,461 – 24,860
104.3 10,154 3,255 4,052 2,466 2,473 2,461 – 24,861
105 5,227 1,675 2,086 1,269 1,273 1,267 – 12,797
106 2,240 718 893 544 545 543 – 5,483
107 5,227 1,676 2,086 1,269 1,273 1,267 – 12,798
108 2,240 718 894 544 545 543 – 5,484
109 5,228 1,676 2,086 1,270 1,273 1,268 – 12,801
110 2,241 718 894 544 546 543 – 5,486
111 3,734 1,197 1,490 906 909 905 – 9,141
112 3,734 1,197 1,490 907 909 905 – 9,142
113 3,734 1,197 1,490 907 910 906 – 9,144
117.1 – – – – – – 7,436 7,436
117.2 – – – – – – 7,436 7,436
117.3 – – – – – – 7,437 7,437
118.1 – – – – – – 3,187 3,187
118.2 – – – – – – 3,187 3,187
118.3 – – – – – – 3,187 3,187
119 – – – – – – 1,476 1,476
120 – – – – – – 633 633
121 – – – – – – 1,477 1,477
122 – – – – – – 633 633
123 – – – – – – 1,477 1,477
124 – – – – – – 633 633
125 – – – – – – 1,055 1,055
126 – – – – – – 1,055 1,055
127 – – – – – – 1,055 1,055
135,142 54,978 77,248 44,480 44,571 32,760 41,364 430,543
Options exercised during the fi nancial year
The following table details the options exercised during the fi nancial year by key management personnel.
Series
Number
of options
exercised Exercise date
Number of
shares issued
Exercise price
$
Share price at
exercise date
$
Performance
condition –
cumulative
EPS growth
per annum
Performance
condition –
achieved
G. Papadopoulos 67.2 5,000 11/02/2015 5,000 $14.95 $17.21 n/a(i) n/a
5,000 5,000
N. Wells 67.2 8,333 21/08/2014 8,333 $14.95 $16.80 n/a(i) n/a
77 3,000 21/08/2014 3,000 $0.00 $16.80 n/a(i) n/a
11,333 11,333
16,333 16,333
(i) Options did not contain a performance condition as they were issued prior to G. Papadopoulos and N. Wells becoming executives.
No options issued to R. Murray, S. Browning, P. Green, C. Trainor and T. Carter were exercised during the fi nancial year.
For
per
sona
l use
onl
y

50
Options lapsed during the fi nancial year
The options issued to the identifi ed key management personnel that lapsed during the fi nancial year are set out below.
Number of options lapsedFinancial Year
Issued S. Browning(i) C. Trainor G. Papadopoulos(i) Total
2010 – 78,844 – 78,844
2011 33,265 – 8,818 42,083
2012 59,062 – 55,000 114,062
2013 119,317 – 84,667 203,984
2014 38,731 – 28,864 67,595
2015 54,978 – 44,571 99,549
305,353 78,844 221,920 606,117
(i) S. Browning and G. Papadopoulos options lapsed on their departure from JB Hi-Fi.
No options issued to T. Smart, R. Murray, P. Green, N. Wells and T. Carter lapsed during the fi nancial year.
Value of key management personnel options granted, exercised and lapsed since the end of the fi nancial year
No options have been issued to key management personal, and no options issued to key management personnel have been
exercised or lapsed, since the end of the fi nancial year.
REMUNERATION REPORT (continued)
For
per
sona
l use
onl
y

51
SHARE OPTIONS
Group share option plans
The Group has share ownership-based remuneration schemes for executives and non-executive management (excluding
non-executive directors). In accordance with the provisions of these schemes, executives and non-executive managers within
the Group are granted options to purchase parcels of ordinary shares at various exercise prices or to acquire shares at a zero
exercise price. The options issued since July 2004 have the following features:
• no issue price is payable on the issue of an option;
• for all options issued prior to 1 July 2012 and some of the options issued to executives during the 2013, 2014 and 2015
fi nancial years, an exercise price is payable on the exercise of an option. This exercise price is usually calculated as being the
closing volume weighted average share price (VWAP) of JB Hi-Fi Limited shares over the 5 trading days post and including
the date of release of the Group’s full year results, immediately prior to the grant of the option. This price may be calculated
by reference to another date, for example where a grant of options occurs other than following the release of results as a
result of an executive or non-executive manager joining the Group or being promoted within the Group. For options issued
since 1 July 2009 that have an exercise price payable on exercise of the option, a share price condition provides that options
will only vest if, during a trading window (as defi ned in the Group’s Securities Trading Policy), the VWAP of the shares over
5 consecutive trading days exceeds the option exercise price (at a time when all other conditions have been satisfi ed);
• for some of the options issued between 1 July 2012 and 30 June 2015, a zero exercise price;
• for executives only, the majority of options are subject to performance conditions based on EPS growth. To date, options
issued have been subject to performance hurdles which require compound annual earnings per share growth of between
5% and 20% per annum;
• service based conditions - the options issued to executives since 1 July 2012 vest a third each on the third, fourth and fi fth
anniversary of the grant date provided that the executive remains employed at that time. For all options issued prior to
1 July 2012 and options issued to non-executive management since that date, options vest a third each on the second, third
and fourth anniversary of grant date provided that the executive or non-executive manager remains employed at that time;
• all conditions must be satisfi ed for an option to vest;
• to the extent that a performance condition is not achieved in one year, the hurdle is compounded and reassessed in each
subsequent year, until the earlier of the condition being satisfi ed or the option expiring;
• all options issued prior to 1 July 2012 and options issued to non-executive management during the 2013, 2014 and 2015
fi nancial years generally expire fi ve years after they are issued. Options issued to executives during the 2013, 2014 and
2015 fi nancial years generally expire six years after they are issued. All unvested options generally expire immediately upon
termination of employment although, depending upon the terms of issue, the Company may have discretion to allow the
options to continue or waive vesting conditions in certain circumstances. Upon termination of employment, vested options
either expire upon termination, 30 days after termination or continue in force depending upon the circumstances of the
employee’s exit and the terms of issue;
• each option entitles the holder to one ordinary share in JB Hi-Fi Limited;
• holders of options do not have the right, under the options, to dividends or to participate in any share issue or interest issue
of JB Hi-Fi Limited or of any other body corporate or registered scheme;
• upon a change of control of the Company all vested and unvested options will automatically lapse unless the Company
determines otherwise; and
• other conditions including, amongst other things, treatment of the options in the event of a capital reorganisation.
As detailed on page 34, in July 2014 the Company made a one-off issue of share options with a zero exercise price to each of
the executives at that time (Cameron Trainor, Scott Browning, Peter Green and George Papadopoulos) other than the new CEO
(Richard Murray) and new CFO (Nick Wells). This one-off issue of additional share options with a zero exercise price was aimed at
retention of these executives following the CEO transition in July 2014. These options are subject to a service condition only and
will vest if the relevant executive remains employed by the Company on 30 June 2016. The options will lapse upon the earlier exit
of the executive for any reason (unless the Board decides otherwise) and, accordingly, the options granted to Scott Browning and
George Papadopoulos lapsed as result of their departure from the Company on 17 February 2015.
For
per
sona
l use
onl
y

52
Shares under option
Details of interests under option at the date of this report are:
Option
series
Number
of shares
under
option Class of share
Grant date
(GD)
Share Price
at GD
$ Expiry date
Exercise
price
$
Expected
volatility
Dividend
yield at GD
Risk-free
interest rate
at GD
Fair value
at GD
$
60 68,331 Ordinary 13/08/2010 $20.30 13/08/2015 $19.75 45.43% 3.3% 4.74% $6.03
61 29,285 Ordinary 13/08/2010 $20.30 13/08/2015 $19.75 45.43% 3.3% 4.74% $6.03
62 224,992 Ordinary 13/08/2010 $20.30 13/08/2015 $19.75 45.43% 3.3% 4.74% $6.03
66 32,322 Ordinary 2/06/2011 $16.75 1/06/2016 $17.03 43.02% 4.5% 5.05% $4.64
67 184,992 Ordinary 12/08/2011 $15.90 12/08/2016 $14.95 41.54% 5.1% 3.95% $3.60
68 129,423 Ordinary 12/08/2011 $15.90 12/08/2016 $14.95 41.54% 5.1% 3.95% $3.60
69 55,467 Ordinary 12/08/2011 $15.90 12/08/2016 $14.95 41.54% 5.1% 3.95% $3.60
72 5,000 Ordinary 27/09/2011 $15.05 27/09/2016 $14.73 41.13% 5.2% 3.78% $3.47
73 10,000 Ordinary 29/11/2011 $15.37 29/11/2016 $15.30 40.10% 5.0% 3.38% $3.50
78 102,676 Ordinary 17/08/2012 $9.75 16/08/2017 $0.00 30.00% 6.7% 2.99% $8.03
79 99,640 Ordinary 17/08/2012 $9.75 16/08/2017 $0.00 39.68% 6.7% 2.99% $7.53
80 295,217 Ordinary 17/08/2012 $9.75 16/08/2018 $9.75 40.37% 6.7% 2.99% $2.04
81 126,522 Ordinary 17/08/2012 $9.75 16/08/2018 $9.75 40.37% 6.7% 2.99% $2.04
82 22,274 Ordinary 17/08/2012 $9.75 16/08/2018 $0.00 30.00% 6.7% 2.99% $8.03
83 9,546 Ordinary 17/08/2012 $9.75 16/08/2018 $0.00 30.00% 6.7% 2.99% $8.03
84 12,113 Ordinary 17/08/2012 $9.75 16/08/2018 $0.00 39.68% 6.7% 2.99% $7.53
85 5,191 Ordinary 17/08/2012 $9.75 16/08/2018 $0.00 39.68% 6.7% 2.99% $7.53
86 12,114 Ordinary 17/08/2012 $9.75 16/08/2018 $0.00 41.19% 6.7% 2.99% $7.06
87 5,191 Ordinary 17/08/2012 $9.75 16/08/2018 $0.00 41.19% 6.7% 2.99% $7.06
89 3,000 Ordinary 6/11/2012 $9.99 5/11/2017 $0.00 29.30% 6.4% 2.78% $8.39
90 3,000 Ordinary 6/11/2012 $9.99 5/11/2017 $0.00 37.10% 6.4% 2.78% $7.88
91 61,518 Ordinary 16/08/2013 $18.66 15/08/2018 $0.00 34.69% 3.8% 3.25% $17.57
92 60,036 Ordinary 16/08/2013 $18.66 15/08/2018 $0.00 32.08% 3.8% 3.25% $16.92
93 60,050 Ordinary 16/08/2013 $18.66 15/08/2018 $0.00 30.88% 3.8% 3.25% $16.30
94 69,832 Ordinary 16/08/2013 $18.66 15/08/2019 $18.93 32.55% 3.8% 3.25% $4.16
95 29,928 Ordinary 16/08/2013 $18.66 15/08/2019 $18.93 32.55% 3.8% 3.25% $4.16
96 6,654 Ordinary 16/08/2013 $18.66 15/08/2019 $0.00 32.08% 3.8% 3.25% $16.92
97 2,852 Ordinary 16/08/2013 $18.66 15/08/2019 $0.00 32.08% 3.8% 3.25% $16.92
98 6,654 Ordinary 16/08/2013 $18.66 15/08/2019 $0.00 30.88% 3.8% 3.25% $16.30
99 2,852 Ordinary 16/08/2013 $18.66 15/08/2019 $0.00 30.88% 3.8% 3.25% $16.30
100 6,653 Ordinary 16/08/2013 $18.66 15/08/2019 $0.00 38.50% 3.8% 3.25% $15.70
101 2,851 Ordinary 16/08/2013 $18.66 15/08/2019 $0.00 38.50% 3.8% 3.25% $15.70
102 34,984 Ordinary 1/07/2014 $18.44 30/06/2020 $0.00 31.61% 4.2% 2.99% $17.15
103 133,927 Ordinary 15/08/2014 $17.66 14/08/2020 $17.72 30.74% 4.7% 2.90% $3.25
104 57,398 Ordinary 15/08/2014 $17.66 14/08/2020 $17.72 30.74% 4.7% 2.90% $3.25
105 9,849 Ordinary 15/08/2014 $17.66 14/08/2020 $0.00 33.18% 4.7% 2.90% $15.42
106 4,220 Ordinary 15/08/2014 $17.66 14/08/2020 $0.00 33.18% 4.7% 2.90% $15.42
107 9,849 Ordinary 15/08/2014 $17.66 14/08/2020 $0.00 31.56% 4.7% 2.90% $14.72
108 4,221 Ordinary 15/08/2014 $17.66 14/08/2020 $0.00 31.56% 4.7% 2.90% $14.72
109 9,852 Ordinary 15/08/2014 $17.66 14/08/2020 $0.00 30.71% 4.7% 2.90% $14.06
110 4,222 Ordinary 15/08/2014 $17.66 14/08/2020 $0.00 30.71% 4.7% 2.90% $14.06
111 7,035 Ordinary 15/08/2014 $17.66 14/08/2020 $0.00 33.18% 4.7% 2.90% $15.42
REMUNERATION REPORT (continued)
For
per
sona
l use
onl
y

53
Shares under option (continued)
Option
series
Number
of shares
under
option Class of share
Grant date
(GD)
Share Price
at GD
$ Expiry date
Exercise
price
$
Expected
volatility
Dividend
yield at GD
Risk-free
interest rate
at GD
Fair value
at GD
$
112 7,036 Ordinary 15/08/2014 $17.66 14/08/2020 $0.00 31.56% 4.7% 2.90% $14.72
113 7,037 Ordinary 15/08/2014 $17.66 14/08/2020 $0.00 30.71% 4.7% 2.90% $14.06
114 63,398 Ordinary 15/08/2014 $17.66 14/08/2019 $0.00 31.64% 4.7% 2.90% $16.15
115 63,426 Ordinary 15/08/2014 $17.66 14/08/2019 $0.00 33.18% 4.7% 2.90% $15.42
116 63,436 Ordinary 15/08/2014 $17.66 14/08/2019 $0.00 31.56% 4.7% 2.90% $14.72
117 22,309 Ordinary 27/11/2014 $15.56 26/11/2020 $15.58 30.94% 5.4% 2.63% $2.51
118 9,561 Ordinary 27/11/2014 $15.56 26/11/2020 $15.58 30.94% 5.4% 2.63% $2.51
119 1,476 Ordinary 27/11/2014 $15.56 26/11/2020 $0.00 32.51% 5.4% 2.63% $13.31
120 633 Ordinary 27/11/2014 $15.56 26/11/2020 $0.00 32.51% 5.4% 2.63% $13.31
121 1,477 Ordinary 27/11/2014 $15.56 26/11/2020 $0.00 31.91% 5.4% 2.63% $12.63
122 633 Ordinary 27/11/2014 $15.56 26/11/2020 $0.00 31.91% 5.4% 2.63% $12.63
123 1,477 Ordinary 27/11/2014 $15.56 26/11/2020 $0.00 30.31% 5.4% 2.63% $11.98
124 633 Ordinary 27/11/2014 $15.56 26/11/2020 $0.00 30.31% 5.4% 2.63% $11.98
125 1,055 Ordinary 27/11/2014 $15.56 26/11/2020 $0.00 32.51% 5.4% 2.63% $13.31
126 1,055 Ordinary 27/11/2014 $15.56 26/11/2020 $0.00 31.91% 5.4% 2.63% $12.63
127 1,055 Ordinary 27/11/2014 $15.56 26/11/2020 $0.00 30.31% 5.4% 2.63% $11.98
2,267,430
As at 10 August 2015, 142,427 options are vested and exercisable. In addition up to 554,588 additional options will vest and
become exercisable in August 2015, subject to the satisfaction of the relevant service, performance and share price vesting
conditions.
The weighted average fair value of the share options granted during the fi nancial year is $10.09 (2014: $10.91). Options were
valued using the Black-Scholes option pricing model, which takes into account the exercise price, the term of the option, the
expected exercise date based on prior years’ experience, the share price at grant date, the expected price volatility of the
underlying share, the expected dividend yield and the risk-free interest rate.
For
per
sona
l use
onl
y

54
The following tables include all share options granted under the Group share option plans that were exercised during and since
the end of the current fi nancial year and during the previous fi nancial year. All shares were issued by JB Hi-Fi Limited.
2015
Option
Series Grant date Exercise date
Number
exercised
Number of
shares issued
Class of
shares
Amount paid
per share
$
Amount
unpaid per
share
$
Share price at
exercise date
$
65 1/12/2010 14/05/2015 8,818 8,818 Ordinary $18.75 – $21.06
66 2/06/2011 11/02/2015 10,774 10,774 Ordinary $17.03 – $17.21
67 12/08/2011 13/08/2014 2,834 2,834 Ordinary $14.95 – $17.63
67 12/08/2011 19/08/2014 52,164 52,164 Ordinary $14.95 – $17.07
67 12/08/2011 20/08/2014 61,163 61,163 Ordinary $14.95 – $16.72
67 12/08/2011 21/08/2014 16,832 16,832 Ordinary $14.95 – $16.80
67 12/08/2011 22/08/2014 10,666 10,666 Ordinary $14.95 – $17.07
67 12/08/2011 28/08/2014 2,833 2,833 Ordinary $14.95 – $16.89
67 12/08/2011 11/02/2015 5,000 5,000 Ordinary $14.95 – $17.21
67 12/08/2011 20/02/2015 5,000 5,000 Ordinary $14.95 – $17.23
73 29/11/2011 11/02/2015 10,000 10,000 Ordinary $15.30 – $17.21
76 31/07/2012 19/08/2014 32,520 32,520 Ordinary $8.74 – $17.07
76 31/07/2012 15/07/2015 32,520 32,520 Ordinary $8.74 – $20.03
77 17/08/2012 19/08/2014 47,510 47,510 Ordinary $0.00 – $17.07
77 17/08/2012 20/08/2014 34,505 34,505 Ordinary $0.00 – $16.72
77 17/08/2012 21/08/2014 11,335 11,335 Ordinary $0.00 – $16.80
77 17/08/2012 22/08/2014 17,335 17,335 Ordinary $0.00 – $17.07
77 17/08/2012 28/08/2014 1,667 1,667 Ordinary $0.00 – $16.89
78 17/08/2012 15/07/2015 3,000 3,000 Ordinary $0.00 – $20.03
88 6/11/2012 7/11/2014 3,000 3,000 Ordinary $0.00 – $16.17
91 16/08/2013 15/07/2015 1,483 1,483 Ordinary $0.00 – $20.03
370,959 370,959
REMUNERATION REPORT (continued)
For
per
sona
l use
onl
y
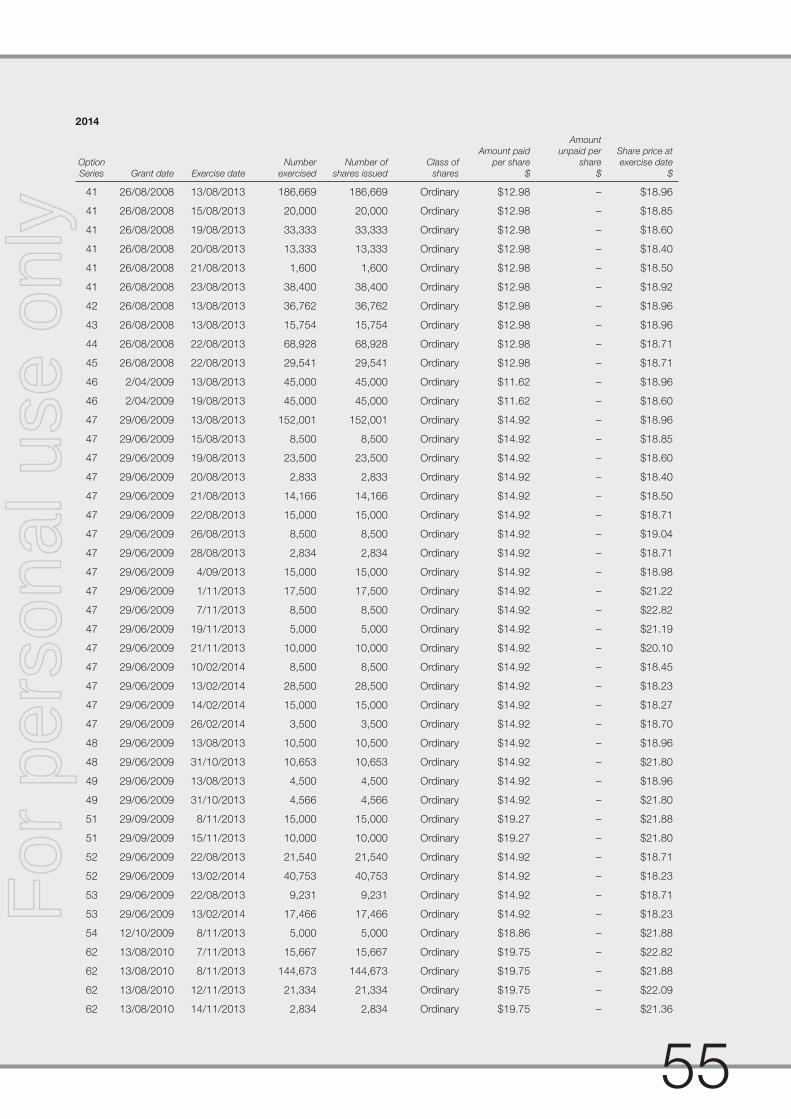
55
2014
Option
Series Grant date Exercise date
Number
exercised
Number of
shares issued
Class of
shares
Amount paid
per share
$
Amount
unpaid per
share
$
Share price at
exercise date
$
41 26/08/2008 13/08/2013 186,669 186,669 Ordinary $12.98 – $18.96
41 26/08/2008 15/08/2013 20,000 20,000 Ordinary $12.98 – $18.85
41 26/08/2008 19/08/2013 33,333 33,333 Ordinary $12.98 – $18.60
41 26/08/2008 20/08/2013 13,333 13,333 Ordinary $12.98 – $18.40
41 26/08/2008 21/08/2013 1,600 1,600 Ordinary $12.98 – $18.50
41 26/08/2008 23/08/2013 38,400 38,400 Ordinary $12.98 – $18.92
42 26/08/2008 13/08/2013 36,762 36,762 Ordinary $12.98 – $18.96
43 26/08/2008 13/08/2013 15,754 15,754 Ordinary $12.98 – $18.96
44 26/08/2008 22/08/2013 68,928 68,928 Ordinary $12.98 – $18.71
45 26/08/2008 22/08/2013 29,541 29,541 Ordinary $12.98 – $18.71
46 2/04/2009 13/08/2013 45,000 45,000 Ordinary $11.62 – $18.96
46 2/04/2009 19/08/2013 45,000 45,000 Ordinary $11.62 – $18.60
47 29/06/2009 13/08/2013 152,001 152,001 Ordinary $14.92 – $18.96
47 29/06/2009 15/08/2013 8,500 8,500 Ordinary $14.92 – $18.85
47 29/06/2009 19/08/2013 23,500 23,500 Ordinary $14.92 – $18.60
47 29/06/2009 20/08/2013 2,833 2,833 Ordinary $14.92 – $18.40
47 29/06/2009 21/08/2013 14,166 14,166 Ordinary $14.92 – $18.50
47 29/06/2009 22/08/2013 15,000 15,000 Ordinary $14.92 – $18.71
47 29/06/2009 26/08/2013 8,500 8,500 Ordinary $14.92 – $19.04
47 29/06/2009 28/08/2013 2,834 2,834 Ordinary $14.92 – $18.71
47 29/06/2009 4/09/2013 15,000 15,000 Ordinary $14.92 – $18.98
47 29/06/2009 1/11/2013 17,500 17,500 Ordinary $14.92 – $21.22
47 29/06/2009 7/11/2013 8,500 8,500 Ordinary $14.92 – $22.82
47 29/06/2009 19/11/2013 5,000 5,000 Ordinary $14.92 – $21.19
47 29/06/2009 21/11/2013 10,000 10,000 Ordinary $14.92 – $20.10
47 29/06/2009 10/02/2014 8,500 8,500 Ordinary $14.92 – $18.45
47 29/06/2009 13/02/2014 28,500 28,500 Ordinary $14.92 – $18.23
47 29/06/2009 14/02/2014 15,000 15,000 Ordinary $14.92 – $18.27
47 29/06/2009 26/02/2014 3,500 3,500 Ordinary $14.92 – $18.70
48 29/06/2009 13/08/2013 10,500 10,500 Ordinary $14.92 – $18.96
48 29/06/2009 31/10/2013 10,653 10,653 Ordinary $14.92 – $21.80
49 29/06/2009 13/08/2013 4,500 4,500 Ordinary $14.92 – $18.96
49 29/06/2009 31/10/2013 4,566 4,566 Ordinary $14.92 – $21.80
51 29/09/2009 8/11/2013 15,000 15,000 Ordinary $19.27 – $21.88
51 29/09/2009 15/11/2013 10,000 10,000 Ordinary $19.27 – $21.80
52 29/06/2009 22/08/2013 21,540 21,540 Ordinary $14.92 – $18.71
52 29/06/2009 13/02/2014 40,753 40,753 Ordinary $14.92 – $18.23
53 29/06/2009 22/08/2013 9,231 9,231 Ordinary $14.92 – $18.71
53 29/06/2009 13/02/2014 17,466 17,466 Ordinary $14.92 – $18.23
54 12/10/2009 8/11/2013 5,000 5,000 Ordinary $18.86 – $21.88
62 13/08/2010 7/11/2013 15,667 15,667 Ordinary $19.75 – $22.82
62 13/08/2010 8/11/2013 144,673 144,673 Ordinary $19.75 – $21.88
62 13/08/2010 12/11/2013 21,334 21,334 Ordinary $19.75 – $22.09
62 13/08/2010 14/11/2013 2,834 2,834 Ordinary $19.75 – $21.36
For
per
sona
l use
onl
y

56
2014 (continued)
Option
Series Grant date Exercise date
Number
exercised
Number of
shares issued
Class of
shares
Amount paid
per share
$
Amount
unpaid per
share
$
Share price at
exercise date
$
62 13/08/2010 18/11/2013 5,667 5,667 Ordinary $19.75 – $21.49
62 13/08/2010 25/11/2013 2,834 2,834 Ordinary $19.75 – $20.07
62 13/08/2010 26/11/2013 15,667 15,667 Ordinary $19.75 – $20.20
65 1/12/2010 1/11/2013 8,819 8,819 Ordinary $18.75 – $21.22
66 2/06/2011 20/08/2013 10,774 10,774 Ordinary $17.03 – $18.40
66 2/06/2011 21/08/2013 10,774 10,774 Ordinary $17.03 – $18.50
67 12/08/2011 20/08/2013 33,003 33,003 Ordinary $14.95 – $18.40
67 12/08/2011 21/08/2013 65,176 65,176 Ordinary $14.95 – $18.50
67 12/08/2011 22/08/2013 7,834 7,834 Ordinary $14.95 – $18.71
67 12/08/2011 23/08/2013 5,000 5,000 Ordinary $14.95 – $18.92
67 12/08/2011 26/08/2013 2,834 2,834 Ordinary $14.95 – $19.04
67 12/08/2011 28/08/2013 2,834 2,834 Ordinary $14.95 – $18.71
67 12/08/2011 4/09/2013 10,000 10,000 Ordinary $14.95 – $18.98
67 12/08/2011 16/10/2013 2,834 2,834 Ordinary $14.95 – $20.86
67 12/08/2011 1/11/2013 16,502 16,502 Ordinary $14.95 – $21.22
67 12/08/2011 12/11/2013 5,000 5,000 Ordinary $14.95 – $22.09
67 12/08/2011 14/11/2013 2,834 2,834 Ordinary $14.95 – $21.36
67 12/08/2011 18/11/2013 2,834 2,834 Ordinary $14.95 – $21.49
67 12/08/2011 19/11/2013 5,000 5,000 Ordinary $14.95 – $21.19
72 27/09/2011 8/11/2013 5,000 5,000 Ordinary $14.73 – $21.88
73 29/11/2011 14/02/2014 10,000 10,000 Ordinary $15.30 – $18.27
1,438,091 1,438,091
REMUNERATION REPORT (continued)
For
per
sona
l use
onl
y

57
Long-term incentives subject to performance conditions
Certain executives have been issued with options under the Group share option plans as part of the Company’s long-term
incentive program. Details of the features and conditions of such options are included in the section of this report entitled
“Group share option plans”. The following table details the options outstanding at the date of this report which feature
performance hurdles:
Option
Series Grant Date Performance Hurdle(i) Date for testing
Relevant Financial
Year
Exercise Price
$ Expiry Date
Vested
Nil
Not vested (performance hurdle achieved but time based service condition not achieved)
80 17/08/2012 5% 17/08/2015 2015 $9.75 16/08/2018
82 17/08/2012 5% 17/08/2015 2015 $0.00 16/08/2018
Not vested (performance hurdle partially achieved but time based service condition not achieved)
81 17/08/2012 5%-10% 17/08/2015 2015 $9.75 16/08/2018
83 17/08/2012 5%-10% 17/08/2015 2015 $0.00 16/08/2018
Not vested (time based service condition achieved but performance hurdle not achieved)
60 13/08/2010 10% 13/08/2012 2012 $19.75 13/08/2015
60 13/08/2010 10% 13/08/2013 2013 $19.75 13/08/2015
60 13/08/2010 10% 13/08/2014 2014 $19.75 13/08/2015
61 13/08/2010 15% 13/08/2012 2012 $19.75 13/08/2015
61 13/08/2010 15% 13/08/2013 2013 $19.75 13/08/2015
61 13/08/2010 15% 13/08/2014 2014 $19.75 13/08/2015
68 12/08/2011 10% 12/08/2013 2013 $14.95 12/08/2016
68 12/08/2011 10% 12/08/2014 2014 $14.95 12/08/2016
69 12/08/2011 15% 12/08/2013 2013 $14.95 12/08/2016
69 12/08/2011 15% 12/08/2014 2014 $14.95 12/08/2016
Not vested (time based service condition and performance hurdle not achieved)
68 12/08/2011 5%-10% 12/08/2015 2015 $14.95 12/08/2016
69 12/08/2011 15% 12/08/2015 2015 $14.95 12/08/2016
80 17/08/2012 5% 17/08/2016 2016 $9.75 16/08/2018
80 17/08/2012 5% 17/08/2017 2017 $9.75 16/08/2018
81 17/08/2012 5%-10% 17/08/2016 2016 $9.75 16/08/2018
81 17/08/2012 5%-10% 17/08/2017 2017 $9.75 16/08/2018
84 17/08/2012 5% 17/08/2016 2016 $0.00 16/08/2018
85 17/08/2012 5%-10% 17/08/2016 2016 $0.00 16/08/2018
86 17/08/2012 5% 17/08/2017 2017 $0.00 16/08/2018
87 17/08/2012 5%-10% 17/08/2017 2017 $0.00 16/08/2018
94 16/08/2013 5% 16/08/2016 2016 $18.93 15/08/2019
94 16/08/2013 5% 16/08/2017 2017 $18.93 15/08/2019
94 16/08/2013 5% 16/08/2018 2018 $18.93 15/08/2019
95 16/08/2013 5%-10% 16/08/2016 2016 $18.93 15/08/2019
95 16/08/2013 5%-10% 16/08/2017 2017 $18.93 15/08/2019
95 16/08/2013 5%-10% 16/08/2018 2018 $18.93 15/08/2019
96 16/08/2013 5% 16/08/2016 2016 $0.00 15/08/2019
97 16/08/2013 5%-10% 16/08/2016 2016 $0.00 15/08/2019
98 16/08/2013 5% 16/08/2017 2017 $0.00 15/08/2019
99 16/08/2013 5%-10% 16/08/2017 2017 $0.00 15/08/2019
100 16/08/2013 5% 16/08/2018 2018 $0.00 15/08/2019
For
per
sona
l use
onl
y

58
Long-term incentives subject to performance conditions (continued)
Option
Series Grant Date Performance Hurdle(i) Date for testing
Relevant Financial
Year
Exercise Price
$ Expiry Date
Not vested (time based service condition and performance hurdle not achieved) continued
101 16/08/2013 5%-10% 16/08/2018 2018 $0.00 15/08/2019
103 15/08/2014 5% 15/08/2017 2017 $17.72 14/08/2020
103 15/08/2014 5% 15/08/2018 2018 $17.72 14/08/2020
103 15/08/2014 5% 15/08/2019 2019 $17.72 14/08/2020
104 15/08/2014 5%-10% 15/08/2017 2017 $17.72 14/08/2020
104 15/08/2014 5%-10% 15/08/2018 2018 $17.72 14/08/2020
104 15/08/2014 5%-10% 15/08/2019 2019 $17.72 14/08/2020
105 15/08/2014 5% 15/08/2017 2017 $0.00 14/08/2020
106 15/08/2014 5%-10% 15/08/2017 2017 $0.00 14/08/2020
107 15/08/2014 5% 15/08/2018 2018 $0.00 14/08/2020
108 15/08/2014 5%-10% 15/08/2018 2018 $0.00 14/08/2020
109 15/08/2014 5% 15/08/2019 2019 $0.00 14/08/2020
110 15/08/2014 5%-10% 15/08/2019 2019 $0.00 14/08/2020
117 27/11/2014 5% 27/11/2017 2017 $15.58 26/11/2020
117 27/11/2014 5% 27/11/2018 2018 $15.58 26/11/2020
117 27/11/2014 5% 27/11/2019 2019 $15.58 26/11/2020
118 27/11/2014 5%-10% 27/11/2017 2017 $15.58 26/11/2020
118 27/11/2014 5%-10% 27/11/2018 2018 $15.58 26/11/2020
118 27/11/2014 5%-10% 27/11/2019 2019 $15.58 26/11/2020
119 27/11/2014 5% 27/11/2017 2017 $0.00 26/11/2020
120 27/11/2014 5%-10% 27/11/2017 2017 $0.00 26/11/2020
121 27/11/2014 5% 27/11/2018 2018 $0.00 26/11/2020
122 27/11/2014 5%-10% 27/11/2018 2018 $0.00 26/11/2020
123 27/11/2014 5% 27/11/2019 2019 $0.00 26/11/2020
124 27/11/2014 5%-10% 27/11/2019 2019 $0.00 26/11/2020
(i) For options shown with a 5%-10% performance hurdle, where compound annual EPS growth is between 5% and 10% these options will vest on
a linear basis.
REMUNERATION REPORT (continued)
For
per
sona
l use
onl
y

59
Deloitte Touche Tohmatsu
ABN 74 490 121 060
550 Bourke Street
Melbourne VIC 3000
GPO Box 78
Melbourne VIC 3001 Australia
DX 111
Tel: +61 (0) 3 9671 7000
Fax: +61 (0) 3 9671 7001
www.deloitte.com.au
Board of Directors
JB Hi-Fi Limited
Level 4, Offi ce Tower 2
Chadstone Shopping Centre
1341 Dandenong Road
Chadstone VIC 3148
10 August 2015
Dear Board Members
JB Hi-Fi Limited
In accordance with section 307C of the Corporations Act 2001, I am pleased to provide the following declaration of independence
to the directors of JB Hi-Fi Limited.
As lead audit partner for the audit of the fi nancial statements of JB Hi-Fi Limited for the year ended 30 June 2015, I declare that to
the best of my knowledge and belief, there have been no contraventions of:
(i) the auditor independence requirements of the Corporations Act 2001 in relation to the audit; and
(ii) any applicable code of professional conduct in relation to the audit.
Yours sincerely
DELOITTE TOUCHE TOHMATSU
Andrew Reid
Partner
Chartered Accountants
Liability limited by a scheme approved under Professional Standards Legislation.
Member of Deloitte Touche Tohmatsu Limited.
AUDITOR’S INDEPENDENCE DECLARATION
For
per
sona
l use
onl
y

60
Deloitte Touche Tohmatsu
ABN 74 490 121 060
550 Bourke Street
Melbourne VIC 3000
GPO Box 78
Melbourne VIC 3001 Australia
DX 111
Tel: +61 (0) 3 9671 7000
Fax: +61 (0) 3 9671 7001
www.deloitte.com.au
INDEPENDENT AUDITOR’S REPORT TO THE MEMBERS OF JB HI-FI LIMITED
Report on the Financial Report
We have audited the accompanying fi nancial report of JB Hi-Fi Limited (the company), which comprises the balance sheet as at
30 June 2015, the statement of profi t or loss, the statement of profi t or loss and other comprehensive income, the statement of
cash fl ows and the statement of changes in equity for the year ended on that date, notes comprising a summary of signifi cant
accounting policies and other explanatory information, and the directors’ declaration of the consolidated entity, comprising the
company and the entities it controlled at the year’s end or from time to time during the fi nancial year as set out on pages 62 to 102.
Directors’ Responsibility for the Financial Report
The directors of the company are responsible for the preparation of the fi nancial report that gives a true and fair view in accordance
with Australian Accounting Standards and the Corporations Act 2001 and for such internal control as the directors determine is
necessary to enable the preparation of the fi nancial report that gives a true and fair view and is free from material misstatement,
whether due to fraud or error. In Note 1, the directors also state, in accordance with Accounting Standard AASB 101 Presentation
of Financial Statements, that the consolidated fi nancial statements comply with International Financial Reporting Standards.
Auditor’s Responsibility
Our responsibility is to express an opinion on the fi nancial report based on our audit. We conducted our audit in accordance
with Australian Auditing Standards. Those standards require that we comply with relevant ethical requirements relating to audit
engagements and plan and perform the audit to obtain reasonable assurance whether the fi nancial report is free from material
misstatement.
An audit involves performing procedures to obtain audit evidence about the amounts and disclosures in the fi nancial report. The
procedures selected depend on the auditor’s judgement, including the assessment of the risks of material misstatement of the
fi nancial report, whether due to fraud or error. In making those risk assessments, the auditor considers internal control, relevant to
the entity’s preparation of the fi nancial report that gives a true and fair view, in order to design audit procedures that are appropriate
in the circumstances, but not for the purpose of expressing an opinion on the effectiveness of the entity’s internal control. An audit
also includes evaluating the appropriateness of accounting policies used and the reasonableness of accounting estimates made by
the directors, as well as evaluating the overall presentation of the fi nancial report.
We believe that the audit evidence we have obtained is suffi cient and appropriate to provide a basis for our audit opinion.
Auditor’s Independence Declaration
In conducting our audit, we have complied with the independence requirements of the Corporations Act 2001. We confi rm that the
independence declaration required by the Corporations Act 2001, which has been given to the directors of JB Hi-Fi Limited, would
be in the same terms if given to the directors as at the time of this auditor’s report.
Liability limited by a scheme approved under Professional Standards Legislation.
Member of Deloitte Touche Tohmatsu Limited.
INDEPENDENT AUDITOR’S REPORT
For
per
sona
l use
onl
y

61
Opinion
In our opinion:
(a) the fi nancial report of JB Hi-Fi Limited is in accordance with the Corporations Act 2001, including:
(i) giving a true and fair view of the consolidated entity’s fi nancial position as at 30 June 2015 and of its performance for the
year ended on that date; and
(ii) complying with Australian Accounting Standards and the Corporations Regulations 2001; and
(b) the consolidated fi nancial statements also comply with International Financial Reporting Standards as disclosed in Note 1.
Report on the Remuneration Report
We have audited the Remuneration Report included in pages 28 to 58 of the directors’ report for the year ended 30 June 2015.
The directors of the company are responsible for the preparation and presentation of the Remuneration Report in accordance with
section 300A of the Corporations Act 2001. Our responsibility is to express an opinion on the Remuneration Report, based on our
audit conducted in accordance with Australian Auditing Standards.
Opinion
In our opinion the Remuneration Report of JB Hi-Fi Limited for the year ended 30 June 2015, complies with section 300A of the
Corporations Act 2001.
DELOITTE TOUCHE TOHMATSU
Andrew Reid
Partner
Chartered Accountants
Melbourne
10 August 2015
For
per
sona
l use
onl
y

62
DIRECTORS’ DECLARATION
The directors declare that:
(a) in the directors’ opinion, there are reasonable grounds to believe that the Company will be able to pay its debts as and when
they become due and payable;
(b) the attached fi nancial statements are in compliance with International Financial Reporting Standards, as stated in note 1 to the
fi nancial statements;
(c) in the directors’ opinion, the attached fi nancial statements and notes thereto are in accordance with the Corporations Act
2001, including compliance with accounting standards and giving a true and fair view of the fi nancial position and performance
of the consolidated entity; and
(d) the directors have been given the declarations required by s.295A of the Corporations Act 2001.
At the date of this declaration, the Company is within the class of companies affected by ASIC Class Order 98/1418. The nature of
the deed of cross guarantee is such that each company which is party to the deed guarantees to each creditor payment in full of
any debt in accordance with the deed of cross guarantee.
In the directors’ opinion, there are reasonable grounds to believe that the Company and the companies to which the ASIC Class
Order applies, as detailed in note 27 to the fi nancial statements will, as a group, be able to meet any obligations or liabilities to which
they are, or may become, subject by virtue of the deed of cross guarantee.
Signed in accordance with a resolution of the directors made pursuant to s.295(5) of the Corporations Act 2001.
On behalf of the Directors
Greg Richards Richard Murray
Chairman Chief Executive Offi cer
Melbourne
10 August 2015
DIRECTORS’ DECLARATION
For
per
sona
l use
onl
y

63
Consolidated
Notes
2015
$’000
2014
$’000
Revenue 3 3,652,136 3,483,775
Cost of sales (2,853,883) (2,727,794)
Gross profi t 798,253 755,981
Other income 631 520
Sales and marketing expenses (374,084) (355,694)
Occupancy expenses (160,216) (148,969)
Administration expenses (27,711) (27,600)
Other expenses (35,414) (32,716)
Finance costs 4 (5,927) (8,845)
Profi t before tax 195,532 182,677
Income tax expense 5 (59,021) (54,230)
Profi t for the year 136,511 128,447
Attributable to:
Owners of the Company 136,511 128,359
Non-controlling interests – 88
136,511 128,447
Cents Cents
Earnings per share
Basic (cents per share) 23 137.91 128.39
Diluted (cents per share) 23 136.46 126.89
STATEMENT OF PROFIT OR LOSSfor the fi nancial year ended 30 June 2015
The above statement of profi t or loss should be read in conjunction with the accompanying notes.
For
per
sona
l use
onl
y

64
Consolidated
2015
$’000
2014
$’000
Profi t for the year 136,511 128,447
Other comprehensive income
Items that may be reclassifi ed subsequently to profi t or loss
Changes in the fair value of cash fl ow hedges (net of tax) 1 576
Exchange differences on translation of foreign operations (2,509) 4,728
Other comprehensive income for the year (net of tax) (2,508) 5,304
Total comprehensive income for the year 134,003 133,751
Total comprehensive income is attributable to:
Owners of the Company 134,003 133,663
Non-controlling interests – 88
134,003 133,751
The above statement of profi t or loss and other comprehensive income should be read in conjunction with the accompanying notes.
STATEMENT OF PROFIT OR LOSS AND OTHER COMPREHENSIVE INCOMEfor the fi nancial year ended 30 June 2015
For
per
sona
l use
onl
y

65
Consolidated
Notes
2015
$’000
2014
$’000
ASSETS
Current assets
Cash and cash equivalents 49,131 43,445
Trade and other receivables 9 81,480 70,745
Inventories 10 478,871 458,625
Other current assets 11 7,416 5,332
Total current assets 616,898 578,147
Non-current assets
Plant and equipment 12 176,208 181,564
Deferred tax assets 13 17,363 14,909
Intangible assets 14 84,541 85,218
Other fi nancial assets 3 3
Total non-current assets 278,115 281,694
Total assets 895,013 859,841
LIABILITIES
Current liabilities
Trade and other payables 15 325,604 302,979
Provisions 16 40,585 36,840
Other current liabilities 17 4,566 4,111
Current tax liabilities 9,474 8,184
Other fi nancial liabilities 107 79
Total current liabilities 380,336 352,193
Non-current liabilities
Borrowings 18 139,461 179,653
Provisions 19 6,073 8,699
Other non-current liabilities 20 25,664 24,638
Other fi nancial liabilities – 25
Total non-current liabilities 171,198 213,015
Total liabilities 551,534 565,208
Net assets 343,479 294,633
EQUITY
Contributed equity 21 56,521 58,383
Reserves 22 17,636 16,265
Retained earnings 269,322 219,985
Total equity 343,479 294,633
The above balance sheet should be read in conjunction with the accompanying notes.
BALANCE SHEETas at 30 June 2015
For
per
sona
l use
onl
y

66
Att
rib
utab
le t
o o
wne
rs o
fJB
Hi-
Fi L
imit
ed
Co
nso
lidat
edN
ote
s
Contr
ibute
d
eq
uity
$’0
00
Eq
uity
sett
led
benefi t
s
reserv
e
$’0
00
Fore
ign
curr
ency
transla
tion
reserv
e
$’0
00
Hed
gin
g
reserv
e
- in
tere
st
rate
sw
ap
s
$’0
00
Hed
gin
g
reserv
e
- net
investm
ent
$’0
00
Co
mm
on
co
ntr
ol
reserv
e
$’0
00
Reta
ined
earn
ing
s
$’0
00
To
tal
$’0
00
No
n-
co
ntr
olling
inte
rests
$’0
00
To
tal
eq
uity
$’0
00
Bal
ance
at
1 Ju
ly 2
013
62,7
74
13,9
22
(1,1
38)
(647)
850
(1,2
25)
168,8
09
243,3
45
483
243,8
28
Pro
fi t for
the y
ear
––
––
––
128,3
59
128,3
59
88
128,4
47
Cash fl o
w h
ed
ges (net
of ta
x)
––
–576
––
–576
–576
Exchange d
iffere
nce o
n t
ransla
tion o
f fo
reig
n
op
era
tions
––
4,7
28
––
––
4,7
28
–4,7
28
Tota
l co
mp
rehe
nsiv
e in
com
e fo
r th
e ye
ar–
–4,7
28
576
––
128,3
59
133,6
63
88
133,7
51
Issue o
f share
s u
nd
er
share
op
tion p
lans
21
21,5
23
––
––
––
21,5
23
–21,5
23
Share
buy-b
ack
21
(25,8
30)
––
––
––
(25,8
30)
–(2
5,8
30)
Share
issue a
nd
buy-b
ack c
osts
(net
of ta
x)
21
(84)
––
––
––
(84)
–(8
4)
Div
idend
s p
rovid
ed
for
or
paid
24
––
––
––
(77,1
83)
(77,1
83)
–(7
7,1
83)
Acq
uis
itio
n o
f non-c
ontr
olling inte
rests
––
––
–(4
,829)
–(4
,829)
(571)
(5,4
00)
Share
-based
paym
ents
- e
xp
ense
–3,5
92
––
––
–3,5
92
–3,5
92
Share
-based
paym
ents
- incom
e t
ax
–436
––
––
–436
–436
Bal
ance
at
30 J
une
2014
58,3
83
17,9
50
3,5
90
(71)
850
(6,0
54)
219,9
85
294,6
33
–294,6
33
Bal
ance
at
1 Ju
ly 2
014
58,3
83
17,9
50
3,5
90
(71)
850
(6,0
54)
219,9
85
294,6
33
–294,6
33
Pro
fi t for
the y
ear
––
––
––
136,5
11
136,5
11
–136,5
11
Cash fl o
w h
ed
ges (net
of ta
x)
––
–1
––
–1
–1
Exchange d
iffere
nce o
n t
ransla
tion o
f fo
reig
n
op
era
tions
––
(2,5
09)
––
––
(2,5
09)
–(2
,509)
Tota
l co
mp
rehe
nsiv
e in
com
e fo
r th
e ye
ar–
–(2
,509)
1–
–136,5
11
134,0
03
–134,0
03
Issue o
f share
s u
nd
er
share
op
tion p
lans
21
3,1
25
––
––
––
3,1
25
–3,1
25
Share
buy-b
ack
21
(4,9
70)
––
––
––
(4,9
70)
–(4
,970)
Share
issue a
nd
buy-b
ack c
osts
(net
of ta
x)
21
(17)
––
––
––
(17)
–(1
7)
Div
idend
s p
rovid
ed
for
or
paid
24
––
––
––
(87,1
74)
(87,1
74)
–(8
7,1
74)
Share
-based
paym
ents
- e
xp
ense
–3,5
08
––
––
–3,5
08
–3,5
08
Share
-based
paym
ents
- incom
e t
ax
–371
––
––
–371
–371
Bal
ance
at
30 J
une
2015
56,5
21
21,8
29
1,0
81
(70)
850
(6,0
54)
269,3
22
343,4
79
–343,4
79
The a
bove s
tate
ment
of changes in e
quity s
hould
be r
ead
in c
onju
nction w
ith t
he a
ccom
panyin
g n
ote
s.
STATEMENT OF CHANGES IN EQUITYfor the fi nancial year ended 30 June 2015
For
per
sona
l use
onl
y

67
Consolidated
Notes
2015
$’000
2014
$’000
Cash fl ows from operating activities
Receipts from customers 4,012,130 3,832,979
Payments to suppliers and employees (3,767,211) (3,723,982)
Interest and bill discounts received 552 402
Interest and other fi nance costs paid (5,689) (7,496)
Income taxes paid (59,886) (60,577)
Net cash infl ow from operating activities 32 179,896 41,326
Cash fl ows from investing activities
Acquisition of non-controlling interests (2,400) (3,000)
Payments for plant and equipment 12 (42,466) (35,914)
Proceeds from sale of plant and equipment 496 674
Net cash (outfl ow) from investing activities (44,370) (38,240)
Cash fl ows from fi nancing activities
Proceeds from issues of equity securities 21 3,125 21,523
Proceeds / (repayment) of borrowings (40,113) 54,063
Payments for debt issue costs (484) (64)
Payment for shares bought back 21 (4,970) (25,830)
Share issue and buy-back costs (24) (118)
Dividends paid to owners of the Company 24 (87,174) (77,183)
Net cash (outfl ow) from fi nancing activities (129,640) (27,609)
Net increase / (decrease) in cash and cash equivalents 5,886 (24,523)
Cash and cash equivalents at the beginning of the fi nancial year 43,445 67,368
Effects of exchange rate changes on cash and cash equivalents (200) 600
Cash and cash equivalents at end of year 49,131 43,445
The above statement of cash fl ows should be read in conjunction with the accompanying notes.
STATEMENT OF CASH FLOWSfor the fi nancial year ended 30 June 2015
For
per
sona
l use
onl
y

68
Contents of the notes to the fi nancial statements
Page
1 Summary of signifi cant accounting policies ........................................................................................................................69
2 Critical accounting estimates and judgements ...................................................................................................................78
3 Revenue ............................................................................................................................................................................79
4 Expenses ...........................................................................................................................................................................79
5 Income tax expense ...........................................................................................................................................................80
6 Key management personnel disclosures ............................................................................................................................81
7 Share-based payments ......................................................................................................................................................81
8 Remuneration of auditors ...................................................................................................................................................82
9 Current assets - Trade and other receivables .....................................................................................................................83
10 Current assets - Inventories ...............................................................................................................................................84
11 Current assets - Other current assets ................................................................................................................................84
12 Non-current assets - Plant and equipment .........................................................................................................................84
13 Non-current assets - Deferred tax assets ...........................................................................................................................85
14 Non-current assets - Intangible assets ...............................................................................................................................85
15 Current liabilities - Trade and other payables ......................................................................................................................86
16 Current liabilities - Provisions ..............................................................................................................................................86
17 Current liabilities - Other current liabilities ...........................................................................................................................87
18 Non-current liabilities - Borrowings .....................................................................................................................................87
19 Non-current liabilities - Provisions.......................................................................................................................................87
20 Non-current liabilities - Other non-current liabilities .............................................................................................................87
21 Contributed equity .............................................................................................................................................................88
22 Reserves............................................................................................................................................................................89
23 Earnings per share .............................................................................................................................................................90
24 Dividends ...........................................................................................................................................................................91
25 Commitments ....................................................................................................................................................................91
26 Subsidiaries .......................................................................................................................................................................92
27 Deed of cross guarantee ....................................................................................................................................................93
28 Segment information ..........................................................................................................................................................95
29 Parent entity fi nancial information .......................................................................................................................................97
30 Related party transactions .................................................................................................................................................97
31 Events occurring after the reporting period .........................................................................................................................97
32 Notes to the cash fl ow statement .......................................................................................................................................98
33 Financial risk management .................................................................................................................................................98
34 Directory ..........................................................................................................................................................................102
NOTES TO THE FINANCIAL STATEMENTSfor the fi nancial year ended 30 June 2015
For
per
sona
l use
onl
y

69
1 SUMMARY OF SIGNIFICANT ACCOUNTING POLICIES
The principal accounting policies adopted in the preparation of these fi nancial statements are set out below. These policies have
been consistently applied to all the years presented, unless otherwise stated. The fi nancial statements are for the consolidated entity
consisting of JB Hi-Fi Limited and its subsidiaries. For the purposes of preparing the consolidated fi nancial statements the Company
is a for-profi t entity.
(a) Basis of preparation
These general purpose fi nancial statements have been prepared in accordance with Australian Accounting Standards and
interpretations issued by the Australian Accounting Standards Board and the Corporations Act 2001.
(i) Compliance with IFRS
The consolidated fi nancial statements of JB Hi-Fi Limited also comply with International Financial Reporting Standards (IFRS) as
issued by the International Accounting Standards Board (IASB).
(ii) Historical cost convention
These fi nancial statements have been prepared under the historical cost convention, except for fi nancial assets and liabilities
(including derivative instruments), and certain classes of plant and equipment measured at fair value.
(iii) Critical accounting estimates
The preparation of fi nancial statements requires the use of certain critical accounting estimates. It also requires management
to exercise its judgement in the process of applying the Company’s accounting policies. The areas involving a higher degree of
judgement or complexity, or areas where assumptions and estimates are signifi cant to the fi nancial statements are disclosed in
note 2.
The fi nancial statements were authorised for issue by the directors on 10 August 2015.
(b) Rounding off of amounts
The Company is of a kind referred to in Class Order 98/100, issued by the Australian Securities and Investments Commission,
relating to the ‘rounding off’ of amounts in the fi nancial statements. Amounts in the fi nancial statements have been rounded off in
accordance with that Class Order to the nearest thousand dollars, or in certain cases, the nearest dollar.
(c) Principles of consolidation
(i) Subsidiaries
The consolidated fi nancial statements incorporate the assets and liabilities of all subsidiaries of JB Hi-Fi Limited (‘Company’ or
‘parent entity’) as at 30 June 2015 and the results of all subsidiaries for the year then ended. JB Hi-Fi Limited and its subsidiaries
together are referred to in this fi nancial report as the Company, the Group or the consolidated entity.
Subsidiaries are all entities (including structured entities) which are controlled by the Company. Control is achieved when the
Company:
• has power over the investee;
• is exposed, or has rights, to variable returns from its involvement with the investee; and
• has the ability to use its power to affect its returns.
The Company reassesses whether or not it controls an investee if facts and circumstances indicate that there are changes to one or
more of the three elements of control listed above.
Subsidiaries are fully consolidated from the date on which control is transferred to the Group. They are de-consolidated from the
date that control ceases.
For
per
sona
l use
onl
y

70
NOTES TO THE FINANCIAL STATEMENTS (continued)for the fi nancial year ended 30 June 2015
1 SUMMARY OF SIGNIFICANT ACCOUNTING POLICIES (continued)
(c) Principles of consolidation (continued)
(i) Subsidiaries (continued)
Intercompany transactions, balances and unrealised gains on transactions between Group companies are eliminated. Unrealised
losses are also eliminated unless the transaction provides evidence of the impairment of the asset transferred. Accounting policies of
subsidiaries have been changed where necessary to ensure consistency with the policies adopted by the Company.
Non-controlling interests in the results and equity of subsidiaries are shown separately in the consolidated statement of profi t or loss,
statement of profi t or loss and other comprehensive income, statement of changes in equity and balance sheet respectively.
Investments in subsidiaries are accounted for at cost, less any impairment, in the separate fi nancial statements of JB Hi-Fi Limited.
(ii) Employee Share Trust
The Company has formed a trust to administer the Company’s share options plans. This trust is consolidated, as the substance of
the relationship is that the trust is controlled by the Company.
(iii) Changes in ownership interests
The Company treats transactions with non-controlling interests that do not result in a loss of control as transactions with equity
owners of the Company. A change in ownership interest results in an adjustment between the carrying amounts of the controlling
and non-controlling interests to refl ect their relative interests in the subsidiary. Any difference between the amount of the adjustment
to non-controlling interests and any consideration paid or received is recognised in a separate reserve within equity attributable to
owners of JB Hi-Fi Limited (the common control reserve).
(d) Borrowings
Borrowings are initially recognised at fair value, net of transaction costs incurred. Borrowings are subsequently measured at
amortised cost.
Borrowings are classifi ed as current liabilities unless the Company has an unconditional right to defer settlement of the liability for at
least 12 months after the reporting date, and intends to do so.
(e) Borrowing costs
Borrowing costs incurred for the construction of any qualifying asset are capitalised during the period of time that is required to
complete and prepare the asset for its intended use or sale. Other borrowing costs are expensed.
(f) Cash and cash equivalents
For the purpose of presentation in the statement of cash fl ows, cash and cash equivalents includes cash on hand, deposits held
at call with fi nancial institutions, other short-term, highly liquid investments with original maturities of three months or less that are
readily convertible to known amounts of cash and which are subject to an insignifi cant risk of changes in value, and bank overdrafts.
Bank overdrafts are shown within borrowings in current liabilities in the balance sheet.
(g) Contributed equity
Incremental costs directly attributable to the issue of new shares are shown in equity as a deduction, net of tax, from the proceeds.
If the entity reacquires its own equity instruments, for example, as the result of a share buy-back, those instruments are deducted
from equity and the associated shares are cancelled. No gain or loss is recognised in the profi t or loss and the consideration paid,
including any directly attributable incremental costs (net of income taxes), is recognised directly in equity.For
per
sona
l use
onl
y

71
1 SUMMARY OF SIGNIFICANT ACCOUNTING POLICIES (continued)
(h) Derivatives and hedging activities
Derivatives are initially recognised at fair value on the date a derivative contract is entered into and are subsequently remeasured to
their fair value at the end of each reporting period. The accounting for subsequent changes in fair value depends on whether the
derivative is designated as a hedging instrument, and if so, the nature of the item being hedged. The Company designates certain
derivatives as either:
• hedges of a particular risk associated with the cash fl ows of recognised assets and liabilities and highly probable forecast
transactions (cash fl ow hedges); or
• hedges of a net investment in a foreign operation (net investment hedges).
The Company documents at the inception of the hedging transaction the relationship between hedging instruments and hedged
items, as well as its risk management objective and strategy for undertaking various hedge transactions. The Company also
documents its assessment, both at hedge inception and on an ongoing basis, of whether the derivatives that are used in hedging
transactions have been and will continue to be highly effective in offsetting changes in fair values or cash fl ows of hedged items.
The fair values of various derivative fi nancial instruments used for hedging purposes are disclosed in note 33. Movements in the
hedging reserve in shareholder’s equity are shown in the Statement of changes in equity.
(i) Cash fl ow hedge
The effective portion of changes in the fair value of derivatives that are designated and qualify as cash fl ow hedges is recognised in
other comprehensive income and accumulated in reserves in equity. The gain or loss relating to the ineffective portion is recognised
immediately in profi t or loss within other income or other expenses.
Amounts accumulated in equity are reclassifi ed to profi t or loss in the periods when the hedged item affects profi t or loss. The gain
or loss relating to the effective portion of interest rate swaps hedging variable rate borrowings is recognised in profi t or loss within
‘fi nance costs’.
When a hedging instrument expires or is sold or terminated, or when a hedge no longer meets the criteria for hedge accounting, any
cumulative gain or loss existing in equity at that time remains in equity and is recognised when the forecast transaction is ultimately
recognised in profi t or loss. When a forecast transaction is no longer expected to occur, the cumulative gain or loss that was
reported in equity is immediately reclassifi ed to profi t or loss.
(ii) Net investment hedges
Hedges of net investments in foreign operations are accounted for similarly to cash fl ow hedges.
Any gain or loss on the hedging instrument relating to the effective portion of the hedge is recognised in other comprehensive
income and accumulated in reserves in equity. The gain or loss relating to the ineffective portion is recognised immediately in profi t
or loss within other income or other expenses.
Gains and losses accumulated in equity are reclassifi ed to profi t or loss when the foreign operation is partially disposed of or sold.
(i) Dividends
Provision is made for the amount of any dividend declared, being appropriately authorised and no longer at the discretion of the
entity, on or before the end of the reporting period but not distributed at the end of the reporting period.
(j) Employee benefi ts
Liabilities for wages and salaries, including non-monetary benefi ts, are recognised in respect of employees’ services up to the end
of the reporting period and are measured at the amounts expected to be paid when the liabilities are settled. The liability for annual
leave is recognised in the provision for employee benefi ts. All other short-term employee benefi t obligations are presented
as payables.
For
per
sona
l use
onl
y

72
NOTES TO THE FINANCIAL STATEMENTS (continued)for the fi nancial year ended 30 June 2015
1 SUMMARY OF SIGNIFICANT ACCOUNTING POLICIES (continued)
(j) Employee benefi ts (continued)
The liability for long service leave is recognised in the provision for employee benefi ts and measured as the present value of
expected future payments to be made in respect of services provided by employees, up to the end of the reporting period.
Consideration is given to expected future wage and salary levels, experience of employee departures and periods of service.
Expected future payments are discounted using the Australian corporate bond discount rate curve as published by Milliman with
terms to maturity and currency that match, as closely as possible, the estimated future cash outfl ows.
Contributions to defi ned contribution superannuation plans are expensed when employees have rendered services entitling them
to the contributions.
(k) Foreign currency translation
(i) Functional and presentation currency
Items included in the fi nancial statements of each of the Company’s entities are measured using the currency of the primary
economic environment in which the entity operates (‘the functional currency’). The fi nancial statements are presented in Australian
dollars, which is JB Hi-Fi Limited’s functional and presentation currency.
(ii) Transactions and balances
Foreign currency transactions are translated into the functional currency using the exchange rates prevailing at the dates of the
transactions. Foreign exchange gains and losses resulting from the settlement of such transactions and from the translation at year
end exchange rates of monetary assets and liabilities denominated in foreign currencies are recognised in profi t or loss, except
when they are deferred in equity as qualifying cash fl ow hedges and qualifying net investment hedges, or are attributable to part of
the net investment in a foreign operation.
(iii) Group companies
The results and fi nancial position of foreign operations (none of which has the currency of a hyperinfl ationary economy) that have
a functional currency different from the presentation currency are translated into the presentation currency as follows:
• assets and liabilities presented are translated at the closing rate at the date of that balance sheet;
• income and expenses are translated at average exchange rates (unless this is not a reasonable approximation of the
cumulative effect of the rates prevailing on the transaction dates, in which case income and expenses are translated at the
dates of the transactions); and
• all resulting exchange differences are recognised in other comprehensive income.
On consolidation, exchange differences arising from the translation of any net investment in foreign entities, and of borrowings and
other fi nancial instruments designated as hedges of such investments, are recognised in other comprehensive income. When a
foreign operation is sold or any borrowings forming part of the net investment are repaid, the associated exchange differences are
reclassifi ed to profi t or loss, as part of the gain or loss on sale.
Goodwill and fair value adjustments arising on the acquisition of a foreign operation are treated as assets and liabilities of the foreign
operation and translated at the closing rate.
(l) Goods and Services Tax (GST)
Revenues, expenses and assets are recognised net of the amount of associated GST, unless the GST incurred is not recoverable
from the taxation authority. In this case it is recognised as part of the cost of acquisition of the asset or as part of the expense.
Receivables and payables are stated inclusive of the amount of GST receivable or payable. The net amount of GST recoverable
from, or payable to, the taxation authority is included with other receivables or payables in the balance sheet.
Cash fl ows are presented on a gross basis. The GST components of cash fl ows arising from investing or fi nancing activities which
are recoverable from, or payable, to the taxation authority, are presented as operating cash fl ows.
For
per
sona
l use
onl
y
73
1 SUMMARY OF SIGNIFICANT ACCOUNTING POLICIES (continued)
(m) Impairment of assets
Goodwill and intangible assets that have an indefi nite useful life are not subject to amortisation and are tested annually for
impairment, or more frequently if events or changes in circumstances indicate that they might be impaired. Other assets are
tested for impairment whenever events or changes in circumstances indicate that the carrying amount may not be recoverable.
An impairment loss is recognised for the amount by which the asset’s carrying amount exceeds its recoverable amount. The
recoverable amount is the higher of an asset’s fair value less costs to sell and value in use. For the purposes of assessing
impairment, assets are grouped at the lowest levels for which there are separately identifi able cash infl ows which are largely
independent of the cash infl ows from other assets or groups of assets (cash-generating units). Non-fi nancial assets other than
goodwill that suffered an impairment are reviewed for possible reversal of the impairment at the end of each reporting period.
(n) Income tax
Current tax
Current tax is calculated by reference to the amount of income taxes payable or recoverable in respect of the taxable profi t or tax
loss for the period. It is calculated using tax rates and tax laws that have been enacted or substantively enacted by reporting date.
Current tax for current and prior periods is recognised as a liability (or asset) to the extent that it is unpaid (or refundable).
Deferred tax
Deferred tax is accounted for using the balance sheet liability method. Temporary differences are differences between the tax base
of an asset or liability and its carrying amount in the balance sheet. The tax base of an asset or liability is the amount attributed to
that asset or liability for tax purposes.
In principle, deferred tax liabilities are recognised for all taxable temporary differences. Deferred tax assets are recognised to the
extent that it is probable that suffi cient taxable amounts will be available against which deductible temporary differences or unused
tax losses and tax offsets can be utilised. However, deferred tax assets and liabilities are not recognised if the temporary differences
giving rise to them arise from the initial recognition of assets and liabilities (other than as a result of a business combination) which
affects neither taxable income nor accounting profi t. Furthermore, a deferred tax liability is not recognised in relation to taxable
temporary differences arising from the initial recognition of goodwill.
Deferred tax liabilities are recognised for taxable temporary differences associated with investments in subsidiaries, except where
the Group is able to control the reversal of the temporary differences and it is probable that the temporary differences will not reverse
in the foreseeable future. Deferred tax assets arising from deductible temporary differences associated with these investments and
interests are only recognised to the extent that it is probable that there will be suffi cient taxable profi ts against which to utilise the
benefi ts of the temporary difference and they are expected to reverse in the foreseeable future.
Deferred tax assets and liabilities are offset when they relate to income taxes levied by the same taxation authority and the Group
intends to settle its current tax assets and liabilities on a net basis.
Current and deferred tax for the period
Current and deferred tax is recognised as an expense or income in the statement of profi t or loss, except when it relates to items
credited or debited directly to equity, in which case the deferred tax is also recognised directly in equity, or where it arises from the
initial accounting for a business combination, it is taken into account in the determination of goodwill.
Tax consolidation
The Company and all its wholly owned Australian resident entities are part of a tax consolidated group under Australian taxation law.
JB Hi-Fi Limited is the head entity in the tax consolidated group. Tax expense/income, deferred tax liabilities and deferred tax assets
arising from temporary differences of the members of the tax consolidated group are recognised in the separate fi nancial statements
of the members of the tax consolidated group using the ‘separate taxpayer within group’ approach by reference to the carrying
amounts in the separate fi nancial statements of each entity and the tax values applying under tax consolidation. Current tax liabilities
and assets and deferred tax assets arising from unused tax losses and relevant tax credits of the members of the tax consolidated
group are recognised by the Company (as head entity in the tax consolidated group).
For
per
sona
l use
onl
y

74
NOTES TO THE FINANCIAL STATEMENTS (continued)for the fi nancial year ended 30 June 2015
1 SUMMARY OF SIGNIFICANT ACCOUNTING POLICIES (continued)
(n) Income tax (continued)
Tax consolidation (continued)
Due to the existence of a tax funding arrangement between the entities in the tax consolidated group, amounts are recognised
as payable to, or receivable by, the Company and each member of the tax consolidated group in relation to the tax contribution
amounts paid or payable between the parent entity and the other members of the tax consolidated group in accordance with the
arrangement. Further information about the tax funding arrangement is disclosed in note 5.
Where the tax contribution amount recognised by each member of the tax consolidated group for a particular period is different to
the aggregate of the current tax liability or asset and any deferred tax asset arising from unused tax losses and tax credits in respect
of that period, the difference is recognised as a contribution from (or distribution to) equity participants.
(o) Intangible assets
(i) Goodwill
Goodwill represents the excess of the cost of an acquisition over the fair value of the Company’s share of the net identifi able assets
of the acquired business/associate at the date of acquisition. Goodwill on acquisitions of associates is included in investments in
associates. Goodwill is not amortised. Instead, goodwill is tested for impairment annually, or more frequently if events or changes in
circumstances indicate that it might be impaired, and is carried at cost less accumulated impairment losses. Gains and losses on
the disposal of an entity include the carrying amount of goodwill relating to the entity sold.
For the purposes of impairment testing, goodwill is allocated to each of the Group’s cash-generating units (‘CGUs’), or groups of CGUs,
expected to benefi t from the synergies of the business combination. CGUs (or groups of CGUs) to which goodwill has been allocated
are tested for impairment annually, or more frequently if events or changes in circumstances indicate that goodwill might be impaired.
If the recoverable amount of the CGU (or groups of CGUs) is less than the carrying amount of the CGU (or groups of CGUs), the
impairment loss is allocated fi rst to reduce the carrying amount of any goodwill allocated to the CGU (or groups of CGUs) and
then to the other assets in the CGU (or groups of CGUs) pro rata on the basis of the carrying amount of each asset in the CGU (or
groups of CGUs). An impairment loss recognised for goodwill is recognised immediately in profi t or loss and is not reversed in a
subsequent period.
On disposal of an operation within a CGU, the attributable amount of goodwill is included in the determination of the profi t or loss on
disposal of the operation.
(ii) Other intangible assets
The following other intangibles assets are recognised by the Group:
• Brand names and trademarks
• Rights to profi t share
• Location premiums
The Group gave due consideration to the technical and commercial life of the above listed intangibles assets to determine their
useful life and have assessed them to have an indefi nite life and therefore they are not amortised. Each period, the useful life of
these assets are reviewed to determine whether events and circumstances continue to support an indefi nite useful life assessment
for the assets. Such assets are tested for impairment in accordance with the policy stated in note 1(m).
(p) Inventories
Inventories are stated at the lower of cost and net realisable value. Costs are assigned to individual items of inventory on the basis of
weighted average costs. Costs of inventories are determined after deducting rebates and discounts. Net realisable value represents
the estimated selling price less all estimated costs necessary to make the sale.
(q) Investments and other fi nancial assets
Loans and receivables are carried at amortised cost using the effective interest method.
Investments in subsidiaries are measured at cost in the Company fi nancial statements.
For
per
sona
l use
onl
y

75
1 SUMMARY OF SIGNIFICANT ACCOUNTING POLICIES (continued)
(r) Leases
Leases are classifi ed as fi nance leases whenever the terms of the lease transfer substantially all the risks and rewards of ownership
of the leased asset to the lessee. All other leases are classifi ed as operating leases.
Operating leases
Leases in which a signifi cant portion of the risks and rewards of ownership are not transferred to the Company as lessee are
classifi ed as operating leases (note 25). Payments made under operating leases (net of any incentives received from the lessor) are
charged to the statement of profi t or loss on a straight line basis over the period of the lease.
Lease incentives
In the event that lease incentives (for example rent free periods and upfront capital contributions) are received to enter into operating
leases, such incentives are recognised as a liability. The aggregate benefi ts of incentives are recognised as a reduction of rental
expense on a straight line basis.
(s) Plant and equipment
Plant and equipment, leasehold improvements, and equipment under fi nance leases are stated at cost less accumulated
depreciation and impairment (if any). Cost includes expenditure that is directly attributable to the acquisition of the item. In the event
that settlement of all or part of the purchase consideration is deferred, cost is determined by discounting the amounts payable in the
future to their present value as at the date of acquisition.
Depreciation is provided on plant and equipment and leasehold improvements. Depreciation is calculated on a straight line basis
so as to write off the net cost of each asset over its expected useful life to its estimated residual value. The estimated useful lives,
residual values and depreciation method are reviewed at the end of each annual reporting period, with the effect of any changes
recognised on a prospective basis.
The following estimated useful lives are used in the calculation of depreciation:
• Leasehold improvements 1 to 15 years
• Plant and equipment 1.5 to 15 years
An item of plant and equipment is derecognised upon disposal or when no future economic benefi ts are expected to arise from the
continued use of the asset. Any gain or loss arising on the disposal or retirement of an item of plant and equipment is determined as
the difference between the sales proceeds and the carrying amount of the asset, and is recognised in the profi t or loss.
(t) Provisions
Provisions are recognised when the Group has a present obligation (legal or constructive) as a result of a past event, it is probable
that the Group will be required to settle the obligation, and a reliable estimate can be made of the amount of the obligation.
The amount recognised as a provision is the best estimate of the consideration required to settle the present obligation at reporting
date, taking into account the risks and uncertainties surrounding the obligation. Where a provision is measured using the cash fl ows
estimated to settle the present obligation, its carrying amount is the present value of those cash fl ows.
When some or all of the economic benefi ts required to settle a provision are expected to be recovered from a third party, the
receivable is recognised as an asset if it is virtually certain that reimbursement will be received and the amount of the receivable can
be measured reliably.
(u) Revenue recognition
Revenue is measured at the fair value of the consideration received or receivable. Amounts disclosed as revenue are net of returns,
trade allowances, rebates and amounts collected on behalf of third parties.
The Group recognises revenue when the amount of revenue can be reliably measured, it is probable that future economic benefi ts
will fl ow to the entity and specifi c criteria have been met for each of the Group’s activities as described below. The Group bases
its estimates on historical results, taking into consideration the type of customer, the type of transaction and the specifi cs of each
arrangement.
For
per
sona
l use
onl
y

76
NOTES TO THE FINANCIAL STATEMENTS (continued)for the fi nancial year ended 30 June 2015
1 SUMMARY OF SIGNIFICANT ACCOUNTING POLICIES (continued)
(u) Revenue recognition (continued)
Revenue is recognised for the major business activities as follows:
(i) Sale of goods
Revenue from the sale of goods is recognised when the Group has transferred to the buyer the signifi cant risks and rewards of
ownership of the goods. Risks and rewards are considered passed to the buyer at the point of sale if the goods are taken by the
customer at that time, or on delivery of the goods to the customer.
(ii) Subscriptions
Revenue from the sale of subscription services is recognised on a straight line basis over the period of the subscription, from the
date of activation until expiry, refl ecting the period over which the services are supplied.
(iii) Commissions
When the Group acts in the capacity of an agent rather than as the principal in a transaction, the revenue recognised is the net
amount of commission made by the Group.
(iv) Rendering of services
Revenue from a contract to provide services is recognised by reference to the stage of completion of the contract. Revenue from
time and material contracts is recognised at the contractual rates as labour hours are delivered and direct expenses are incurred.
(v) Interest income
Interest revenue is accrued on a time basis, by reference to the principal outstanding and at the effective interest rate applicable,
which is the rate that exactly discounts estimated future cash receipts through the expected life of the fi nancial asset to that asset’s
net carrying amount.
(vi) Dividends
Dividends are recognised as revenue when the right to receive payment is established.
(v) Segment reporting
Operating segments are reported in a manner consistent with the internal reporting provided to the chief operating decision maker.
The chief operating decision maker has been identifi ed as the Chief Executive Offi cer.
(w) Share-based payments
Equity settled share based payments with employees are measured at the fair value of the equity instrument at grant date. Fair value
is measured by use of the Black-Scholes model. The expected life used in the model has been adjusted, based on management’s
best estimate, for the effects of non transferability, exercise restrictions and behavioural considerations.
The fair value determined at the grant date of the equity-settled share based payments is expensed on a straight line basis over the
vesting period, based on the Group’s estimate of shares that will eventually vest, with a corresponding increase in equity.
At each reporting date, the Group revises its estimate of the number of equity instruments expected to vest. The impact of the
revision of the original estimates, if any, is recognised in profi t or loss such that the cumulative expense refl ects the revised estimate,
with a corresponding adjustment to the equity-settled benefi ts reserve.
(x) Trade and other payables
These amounts represent liabilities for goods and services provided to the Group prior to the end of fi nancial year which are
unpaid. Trade and other payables are stated at amortised cost. The amounts are unsecured and are usually settled within 45 days
of recognition.
For
per
sona
l use
onl
y

77
1 SUMMARY OF SIGNIFICANT ACCOUNTING POLICIES (continued)
(y) Trade receivables
Trade receivables are recognised at amortised cost less provision for impairment.
Collectability of trade receivables is reviewed on an ongoing basis. Debts which are known to be uncollectible are written off by
reducing the carrying amount directly. An allowance account (provision for impairment of trade receivables) is used when there is
objective evidence that the Group will not be able to collect all amounts due according to the original terms of the receivables.
The amount of the impairment allowance is the difference between the asset’s carrying amount and the present value of estimated
future cash fl ows, discounted at the original effective interest rate.
The amount of the impairment loss is recognised in profi t or loss within other expenses. When a trade receivable for which an
impairment allowance had been recognised becomes uncollectible in a subsequent period, it is written off against the allowance
account. Subsequent recoveries of amounts previously written off are credited against other expenses in profi t or loss.
(z) New accounting standards and interpretations
In the current year, the Group has adopted all of the following new and revised Standards and Interpretations issued by the Australian
Accounting Standards Board (the AASB) that are relevant to its operations and effective for the current annual reporting period:
(i) AASB 1031 Materiality, and AASB 2014-1 Amendments to Australian Accounting Standards (Part C - Materiality)
(ii) AASB 2012-3 Amendments to Australian Accounting Standards - Offsetting Financial Assets and Financial Liabilities
(Amendments to AASB 132)
(iii) AASB 2013-3 Amendments to AASB 136 - Recoverable Amount Disclosures for Non-Financial Assets
(iv) AASB 2013-4 Amendments to Australian Accounting Standards - Novation of Derivatives and Continuation of Hedge Accounting
(v) AASB 2013-9 Amendments to Australian Accounting Standards - Conceptual Framework, Materiality and Financial Instruments
(Part B)
(vi) AASB 2014-1 Amendments to Australian Accounting Standards (Part A - Annual Improvements 2010-2012 and 2011-13 Cycles)
The adoption of these new and revised Standards and Interpretations did not have any material fi nancial impact on the amounts
recognised and the disclosures presented in the fi nancial statements of the Group.
At the date of authorisation of the fi nancial report, the following relevant Standards and Interpretations were issued but not yet effective:
(i) AASB 9 Financial Instruments, AASB 2009-11 Amendments to Australian Accounting Standards arising from AASB9,
AASB 2010-7 Amendments to Australian Accounting Standards arising from AASB 9 (December 2010), AASB 2012-6
Amendments to Australian Accounting Standards - Mandatory Effective Date of AASB 9 and Transition Disclosures,
AASB 2013-9 Amendments to Australian Accounting Standards - Conceptual Framework, Materiality and Financial Instruments
(Part C - Financial Instruments), AASB 2014-1 Amendments to Australian Standards, AASB 2014-7 Amendments to Australian
Accounting Standards arising from AASB 9 (December 2014), and AASB 2014-8 Amendments to Australian Accounting
Standards arising from AASB 9 (December 2014) (effective 1 January 2018)
(ii) AASB 15 Revenue from Contracts with Customers, and AASB 2014-15 Amendments to Australian Accounting Standards
arising from AASB 15 (effective 1 January 2017)
(iii) AASB 2014-4 Amendments to Australian Accounting Standards - Clarifi cation of Acceptable Methods of Depreciation and
Amortisation (effective 1 January 2016)
(iv) AASB 2015-1 Amendments to Australian Accounting Standards - Annual Improvements to Australian Accounting Standards
2012-2014 Cycle (effective 1 January 2016)
(v) AASB 2015-2 Amendments to Australian Accounting Standards - Disclosure Initiative: Amendments to AASB 101
(effective 1 January 2016)
(vi) AASB 2015-3 Amendments to Australian Accounting Standards arising from the Withdrawal of AASB 1031 Materiality
(effective 1 July 2015)
It is anticipated that the adoption of these Standards and Interpretations in future periods will have no material fi nancial impact on
the fi nancial statements of the Group.
For
per
sona
l use
onl
y

78
NOTES TO THE FINANCIAL STATEMENTS (continued)for the fi nancial year ended 30 June 2015
2 CRITICAL ACCOUNTING ESTIMATES AND JUDGEMENTS
Estimates and judgements are continually evaluated and are based on historical experience and other factors, including
expectations of future events that may have a fi nancial impact on the Company and that are believed to be reasonable under the
circumstances.
(a) Critical accounting estimates and assumptions
The Company makes estimates and assumptions concerning the future. The resulting accounting estimates will, by defi nition,
seldom equal the related actual results. The estimates and assumptions that have a signifi cant risk of causing a material adjustment
to the carrying amounts of assets and liabilities within the next fi nancial year are discussed below.
Impairment of goodwill and other intangible assets
The Company tests annually whether goodwill and any other intangible assets have suffered any impairment, in accordance with the
accounting policy stated in note 1(o). The recoverable amounts of cash-generating units have been determined based on
value-in-use calculations. These calculations require the use of assumptions. Refer to note 14 for details of these assumptions and
the potential impact of changes to the assumptions.
Inventories
The net realisable value of inventories is the estimated selling price in the ordinary course of business less estimated costs to
sell. The key assumptions require the use of management judgement and are reviewed annually. These key assumptions are the
variables affecting the expected selling price. Any reassessment of the selling price in a particular year will affect the cost of
goods sold.
Employee benefi ts
Management judgement is applied in determining the following key assumptions used in the calculation of long service leave at
balance date:
• future increases in wages and salaries;
• future on cost rates; and
• experience of employee departures and period of service.
Share based payments expense
At each reporting date the Company estimates the number of equity instruments expected to vest in accordance with the
accounting policy stated in note 1(w). The number of equity instruments that are expected to vest is based on management’s
assessment of the likelihood of the vesting conditions attached to the equity instruments being satisfi ed. The key vesting conditions
that are assessed are earnings per share targets and required service periods. The impact of any revision in the number of equity
instruments that are expected to vest is recognised as an adjustment to the share based payments expense in the reporting period
that the revision is made.
For
per
sona
l use
onl
y

79
Consolidated
2015
$’000
2014
$’000
3 REVENUE
Sale of goods and services 3,652,136 3,483,775
4 EXPENSES
Profi t before income tax includes the following specifi c expenses:
Depreciation
Depreciation - Plant and equipment 22,987 21,869
Depreciation - Leasehold improvements 16,137 13,661
39,124 35,530
Impairment
Impairment - Plant and equipment 1,119 –
Total depreciation and impairment 40,243 35,530
Finance costs
Interest on loans 5,446 7,537
Fair value loss on interest swaps designated as cash fl ow hedges - transfer from equity 111 937
Other interest expense 370 371
5,927 8,845
Rental expense relating to operating leases
Minimum lease payments 94,672 87,114
Employee benefi ts expenses
Defi ned contribution superannuation expense 27,910 25,793
Share-based payments - expense 3,508 3,592
Other employee benefi ts 337,923 322,030
369,341 351,415
For
per
sona
l use
onl
y
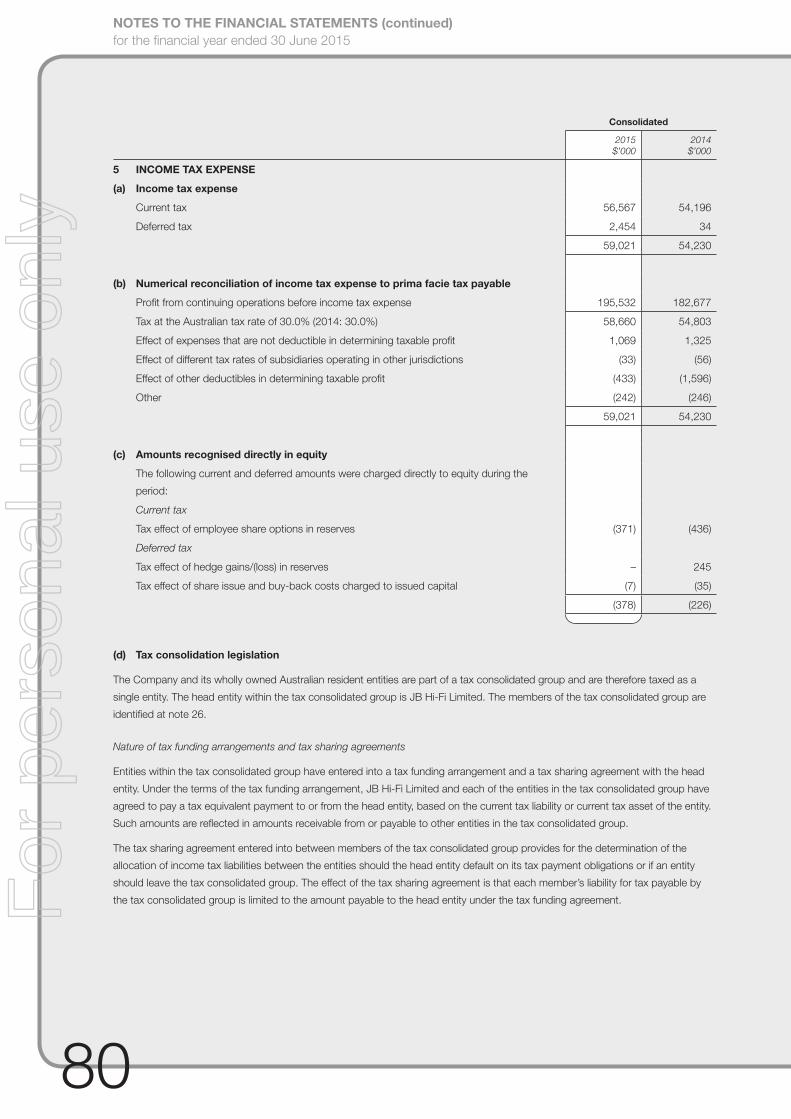
80
NOTES TO THE FINANCIAL STATEMENTS (continued)for the fi nancial year ended 30 June 2015
Consolidated
2015
$’000
2014
$’000
5 INCOME TAX EXPENSE
(a) Income tax expense
Current tax 56,567 54,196
Deferred tax 2,454 34
59,021 54,230
(b) Numerical reconciliation of income tax expense to prima facie tax payable
Profi t from continuing operations before income tax expense 195,532 182,677
Tax at the Australian tax rate of 30.0% (2014: 30.0%) 58,660 54,803
Effect of expenses that are not deductible in determining taxable profi t 1,069 1,325
Effect of different tax rates of subsidiaries operating in other jurisdictions (33) (56)
Effect of other deductibles in determining taxable profi t (433) (1,596)
Other (242) (246)
59,021 54,230
(c) Amounts recognised directly in equity
The following current and deferred amounts were charged directly to equity during the
period:
Current tax
Tax effect of employee share options in reserves (371) (436)
Deferred tax
Tax effect of hedge gains/(loss) in reserves – 245
Tax effect of share issue and buy-back costs charged to issued capital (7) (35)
(378) (226)
(d) Tax consolidation legislation
The Company and its wholly owned Australian resident entities are part of a tax consolidated group and are therefore taxed as a
single entity. The head entity within the tax consolidated group is JB Hi-Fi Limited. The members of the tax consolidated group are
identifi ed at note 26.
Nature of tax funding arrangements and tax sharing agreements
Entities within the tax consolidated group have entered into a tax funding arrangement and a tax sharing agreement with the head
entity. Under the terms of the tax funding arrangement, JB Hi-Fi Limited and each of the entities in the tax consolidated group have
agreed to pay a tax equivalent payment to or from the head entity, based on the current tax liability or current tax asset of the entity.
Such amounts are refl ected in amounts receivable from or payable to other entities in the tax consolidated group.
The tax sharing agreement entered into between members of the tax consolidated group provides for the determination of the
allocation of income tax liabilities between the entities should the head entity default on its tax payment obligations or if an entity
should leave the tax consolidated group. The effect of the tax sharing agreement is that each member’s liability for tax payable by
the tax consolidated group is limited to the amount payable to the head entity under the tax funding agreement.For
per
sona
l use
onl
y

81
5 INCOME TAX EXPENSE (continued)
(d) Tax consolidation legislation (continued)
Investments within tax consolidated groups
JB Hi-Fi calculates deferred taxes in relation to investments within the tax consolidated group using the ‘change in tax status’ view.
Under this view, an entity leaving the tax-consolidated group would be considered a voluntary change in tax status, i.e. the entity no
longer is taxed as part of the tax-consolidated group, but is taxed either as a stand-alone taxpayer, or alternatively as part of another
tax-consolidated group (with different reset tax values).
This view results in no deferred tax being recognised until such time as an entity leaves the tax-consolidated group. Whilst the
entity was a member of the group, the investment would be considered to have no tax consequences because all transactions and
balances between entities in the tax-consolidated group are ignored for tax purposes. This approach is consistent with the option of
treating the pre-implementation effects of tax consolidation as a change in tax status.
Consolidated
2015
$
2014
$
6 KEY MANAGEMENT PERSONNEL DISCLOSURES
The aggregate compensation of the key management personnel of the Group is set out
below: -
Short-term employee benefi ts 6,911,162 9,686,643
Post-employment benefi ts 265,636 229,611
Share-based payments expense 859,555 863,410
8,036,353 10,779,664
Detailed remuneration disclosures are provided in the remuneration report on pages 28 to 58.
7 SHARE-BASED PAYMENTS
(a) Group share option plans
The Group has an ownership based remuneration scheme for executives (excluding non-executive directors) and non-executive
management. In accordance with the provisions of the scheme, executives and non-executive managers within the Group are
granted options to purchase parcels of ordinary shares at various issue prices including zero exercise prices. The options vest as
follows, providing that performance and share price conditions, where they exist, are met:
• options issued to non-executive managers - a third each on the second, third and fourth anniversary of issue;
• options issued to executives prior to 1 July 2012 - a third each on the second, third and fourth anniversary of issue;
• options issued to executives from 1 July 2012 - a third each on the third, fourth and fi fth anniversary of issue; and
• options issued to executives on 1 July 2014 - on the second anniversary of issue.
The options expire within fi ve years of their issue, except for executive options issued from 1 July 2012 which expire within six years
of their issue, or generally one month after the executive’s or non-executive manager’s resignation, whichever is earlier, however the
Company may exercise its discretion to allow options to continue in certain circumstances.
All options issued to executives under the Group’s long term incentive program until 30 June 2014 include performance hurdles
requiring compound annual EPS growth of between 5% and 20%, with options issued to executives during the year ended
30 June 2015 having an EPS growth performance hurdle of between 5% and 10%, or no performance hurdles.For
per
sona
l use
onl
y

82
NOTES TO THE FINANCIAL STATEMENTS (continued)for the fi nancial year ended 30 June 2015
7 SHARE-BASED PAYMENTS (continued)
(a) Group share option plans (continued)
The following reconciles the outstanding share options granted under the Group’s share option plans at the beginning and end of
the fi nancial year:
Balance at
start of
the year
Number
Granted
during
the year
Number
Exercised/
lapsed
during
the year
Number
Balance
at end of
the year
Number
Vested and
exercisable
at end of
the year
Number
2015
Outstanding Share Options with an exercise price 2,099,952 280,467 (785,872) 1,594,547 132,944
Outstanding Zero Exercise Price Options 693,263 360,296 (244,488) 809,071 –
2,793,215 640,763 (1,030,360) 2,403,618 132,944
Weighted average exercise price of those with
an exercise price $14.72 $17.48 $15.03 $15.05 $18.48
2014
Outstanding Share Options with an exercise price 4,320,367 236,383 (2,456,798) 2,099,952 134,163
Outstanding Zero Exercise Price Options 497,218 271,592 (75,547) 693,263 –
4,817,585 507,975 (2,532,345) 2,793,215 134,163
Weighted average exercise price of those with
an exercise price $14.57 $18.93 $14.86 $14.72 $18.98
The weighted average remaining contractual life of share options outstanding at the end of the period was 954 days
(2014: 1,050 days).
Fair value of options granted
The weighted average fair value of options granted during the year ended 30 June 2015 was $10.09 (2014: $10.91). The fair value
at grant date is determined using a Black-Scholes option pricing model that takes into account the exercise price, the term of the
option, the expected exercise date based on prior years’ experience, the share price at grant date, the expected price volatility of
the underlying share, the expected dividend yield and the risk-free interest rate.
The expected price volatility for options granted during the year ended 30 June 2015 is based on the daily closing share price for
the 4.44 years preceding the issue of the series, to allow for the effects of early exercise based on prior years’ experience, with
the exception of zero exercise price options which are based on the vesting date of the series as these options are expected to be
exercised as soon as they vest.
Detailed share option disclosures for all options series granted and exercised during the year are provided in the remuneration report
on pages 28 to 58.
Consolidated
2015
$
2014
$
8 REMUNERATION OF AUDITORS
Audit and other services
Audit and review of group fi nancial statements 323,500 314,000
Audit and review of subsidiary fi nancial statements 29,000 28,250
IT services(i) 511,507 –
Total remuneration for audit and other services 864,007 342,250
(i) During the year ended 30 June 2015, Deloitte was engaged by the Group to assist with the implementation of a Customer Relationship
Management tool for it’s Commercial business.
The auditor of the Group is Deloitte Touche Tohmatsu.
For
per
sona
l use
onl
y

83
Consolidated
2015
$’000
2014
$’000
9 CURRENT ASSETS - TRADE AND OTHER RECEIVABLES
Trade receivables 28,113 24,071
Allowance for doubtful debts (431) (449)
27,682 23,622
Non-trade receivables 53,798 47,123
81,480 70,745
(a) Terms and conditions
Trade receivables
The average credit period on account sales of goods is 30 days. No interest is charged on trade receivables. An allowance
has been made for estimated irrecoverable amounts arising from a review of individual debtors. Credit insurance is carried for
commercial debtor accounts.
Non-trade receivables
Non-trade receivables principally represent rebates receivable from suppliers for purchases of inventories. No amount is
considered irrecoverable from suppliers and therefore no allowance has been made.
Consolidated
2015
$’000
2014
$’000
(b) Ageing of trade receivables
Not past due 25,511 21,407
Past due but not impaired:
0 - 30 days 1,830 1,541
31 - 60 days 341 660
61 - 90 days – 14
91+ days – –
27,682 23,622
(c) Movements in allowance for doubtful debts
Balance at the beginning of the year 449 331
Provision for impairment recognised during the year 111 120
Receivables written off during the year as uncollectable (129) (2)
431 449
(d) Ageing of impaired trade receivables
0 - 31 days – –
31 - 60 days – 8
61 - 90 days 260 239
91+ days 171 202
431 449
The Group has not impaired all debts that are past due at the reporting date as the Group considers the majority of these
amounts to be recoverable.
The Group does not hold any collateral over trade receivables with the exception of retention of title for certain customers.
For
per
sona
l use
onl
y
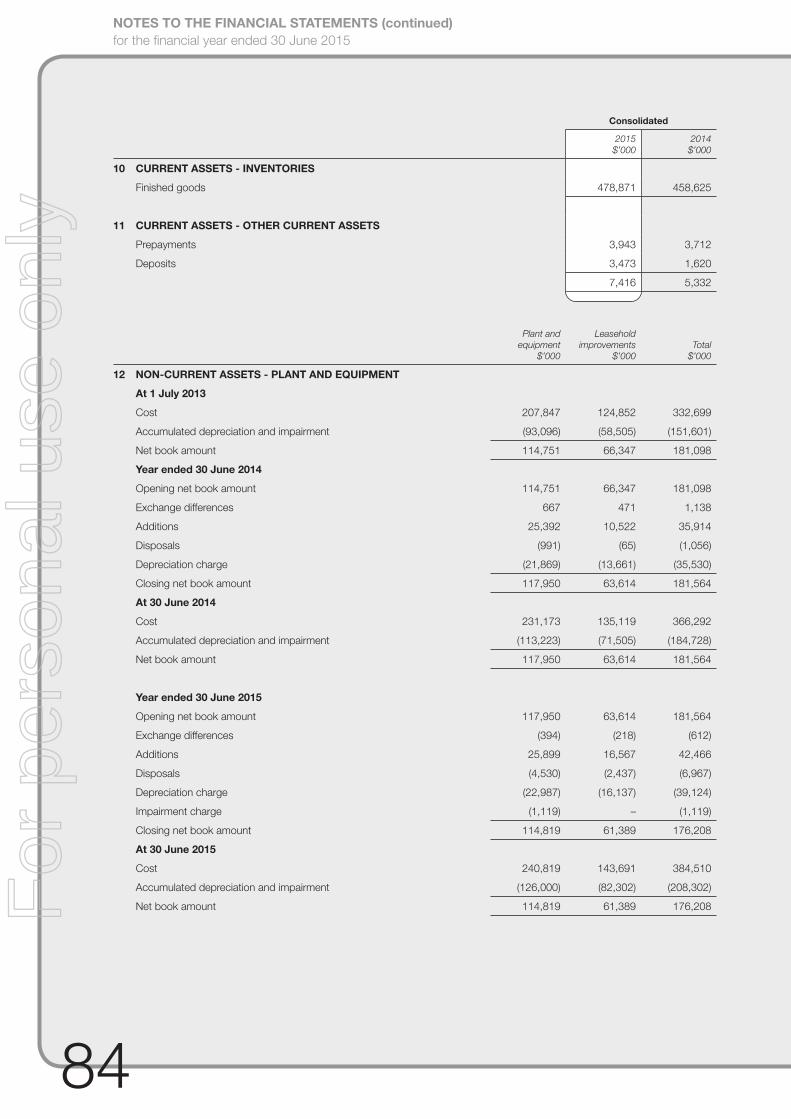
84
NOTES TO THE FINANCIAL STATEMENTS (continued)for the fi nancial year ended 30 June 2015
Consolidated
2015
$’000
2014
$’000
10 CURRENT ASSETS - INVENTORIES
Finished goods 478,871 458,625
11 CURRENT ASSETS - OTHER CURRENT ASSETS
Prepayments 3,943 3,712
Deposits 3,473 1,620
7,416 5,332
Plant and
equipment
$’000
Leasehold
improvements
$’000
Total
$’000
12 NON-CURRENT ASSETS - PLANT AND EQUIPMENT
At 1 July 2013
Cost 207,847 124,852 332,699
Accumulated depreciation and impairment (93,096) (58,505) (151,601)
Net book amount 114,751 66,347 181,098
Year ended 30 June 2014
Opening net book amount 114,751 66,347 181,098
Exchange differences 667 471 1,138
Additions 25,392 10,522 35,914
Disposals (991) (65) (1,056)
Depreciation charge (21,869) (13,661) (35,530)
Closing net book amount 117,950 63,614 181,564
At 30 June 2014
Cost 231,173 135,119 366,292
Accumulated depreciation and impairment (113,223) (71,505) (184,728)
Net book amount 117,950 63,614 181,564
Year ended 30 June 2015
Opening net book amount 117,950 63,614 181,564
Exchange differences (394) (218) (612)
Additions 25,899 16,567 42,466
Disposals (4,530) (2,437) (6,967)
Depreciation charge (22,987) (16,137) (39,124)
Impairment charge (1,119) – (1,119)
Closing net book amount 114,819 61,389 176,208
At 30 June 2015
Cost 240,819 143,691 384,510
Accumulated depreciation and impairment (126,000) (82,302) (208,302)
Net book amount 114,819 61,389 176,208For
per
sona
l use
onl
y

85
Consolidated
2015
$’000
2014
$’000
13 NON-CURRENT ASSETS - DEFERRED TAX ASSETS
The balance comprises temporary differences attributable to:
Deferred tax assets
Tax losses 1,002 1,597
Provisions 21,359 20,529
Trade and other receivables 127 132
Inventories 2,841 2,592
Trade and other payables 804 810
Cash fl ow hedges 31 32
26,164 25,692
Deferred tax liabilities
Trade and other receivables (1,493) (1,899)
Plant and equipment (7,308) (8,884)
(8,801) (10,783)
Net deferred tax assets 17,363 14,909
Movements -Consolidated
Tax Losses
$’000
Provisions
$’000
Trade
and other
receivables
$’000
Inventories
$’000
Trade
and other
payables
$’000
Plant and
equipment
$’000
Cash fl ow
hedges
$’000
Total
$’000
At 1 July 2013 2,284 19,641 (2,613) 2,440 654 (7,856) 289 14,839
Charged to income (687) 888 846 152 156 (1,028) (293) 34
Charged to equity – – – – – – 36 36
At 30 June 2014 1,597 20,529 (1,767) 2,592 810 (8,884) 32 14,909
At 1 July 2014 1,597 20,529 (1,767) 2,592 810 (8,884) 32 14,909
Charged to income (595) 830 401 249 (6) 1,576 (1) 2,454
Charged to equity – – – – – – – –
At 30 June 2015 1,002 21,359 (1,366) 2,841 804 (7,308) 31 17,363
Goodwill
$’000
Brandnames
$’000
Location
premiums
$’000
Rights to
profi t share
$’000
Total
$’000
14 NON-CURRENT ASSETS - INTANGIBLE ASSETS
Year ended 30 June 2014
Opening net book amount 34,688 43,094 2,388 3,542 83,712
Adjustment on fi nalisation of fair value of identifi able
net assets 165 – – – 165
Exchange differences 1,341 – – – 1,341
Closing net book amount 36,194 43,094 2,388 3,542 85,218
Year ended 30 June 2015
Opening net book amount 36,194 43,094 2,388 3,542 85,218
Exchange differences (677) – – – (677)
Closing net book amount 35,517 43,094 2,388 3,542 84,541
For
per
sona
l use
onl
y

86
NOTES TO THE FINANCIAL STATEMENTS (continued)for the fi nancial year ended 30 June 2015
14 NON-CURRENT ASSETS - INTANGIBLE ASSETS (continued)
Brand names, location premiums and rights to profi t share are assessed as having indefi nite useful lives and relate to the Australian
cash generating unit. This assessment refl ects management’s intention to continue to utilise these intangible assets into the
foreseeable future.
The recoverable amount of these intangible assets has been determined based on value in use calculations using the same
methodology as detailed below.
(a) Impairment tests for goodwill
Goodwill is allocated to the following cash generating units (CGUs) or groups of CGUs for impairment testing purposes. The carrying
amount of the goodwill allocated to CGUs (or groups of CGUs) is as follows:
Consolidated
2015
$’000
2014
$’000
JB Hi-Fi Australia 13,724 13,724
Impact Records (store acquisition) 1,727 1,727
JB Hi-Fi New Zealand 13,669 14,346
JB Solutions division (Commercial) 6,397 6,397
35,517 36,194
The recoverable amount of each CGU (or group of CGUs) has been determined based on value in use calculations which use cash
fl ow projections from fi nancial budgets approved by management covering a fi ve year period, using a discount rate of 11.0% for
JB Hi-Fi Australia, Impact Records and JB Solutions division (2014: 11.0%) and 11.5% for JB Hi-Fi New Zealand (2014: 11.5%).
The cash fl ows beyond the budget period have been extrapolated using a steady 2% long term growth rate (2014: 2%) which is
consistent with the projected long term average growth rate for the consumer products market.
The key assumptions used in the value in use calculations include sales growth, cost of doing business (CODB) effi ciencies and the
discount rate. The assumptions regarding sales growth and CODB effi ciencies are based on past experience and the Company’s
forecast operating and fi nancial performance for each CGU (or group of CGUs). The discount rate is derived from the Group’s
weighted average cost of capital, adjusted for varying risk profi les.
Consolidated
2015
$’000
2014
$’000
15 CURRENT LIABILITIES - TRADE AND OTHER PAYABLES
Trade payables 253,712 244,436
Goods and services tax (GST) payable 18,293 15,858
Other creditors and accruals 11,972 13,429
Deferred income 41,627 29,256
325,604 302,979
16 CURRENT LIABILITIES - PROVISIONS
Employee benefi ts 38,750 35,208
Lease provision(i) 1,835 1,632
40,585 36,840
(i) The lease provision includes the Group’s best estimate of the amount required to return the Group’s leased premises to their original condition,
taking into account due consideration of the Group’s past history of vacating stores and the Group’s best estimate of onerous lease obligations.
For
per
sona
l use
onl
y

87
Consolidated
2015
$’000
2014
$’000
17 CURRENT LIABILITIES - OTHER CURRENT LIABILITIES
Lease accrual 1,836 1,777
Lease incentive 2,730 2,334
4,566 4,111
18 NON-CURRENT LIABILITIES - BORROWINGS
Unsecured
Bank loans 139,461 179,653
The terms of certain fi nancing arrangements of the Group contain fi nancial covenants that require maintenance of the following ratios:
• fi xed charge cover ratio (the sum of earnings before interest, tax, depreciation and amortisation excluding any loss/gain on
disposal of plant and equipment, operating lease expense, rent expense and share based payments expense divided by the
sum of net interest expense plus operating lease expense plus rent expense) - not less than 1.75:1; and
• gearing ratio (outstanding net debt divided by earnings before interest, tax, depreciation and amortisation excluding any loss/gain
on disposal of plant and equipment, fi xed rent expense and share based payments expense) - not greater than 3.25:1.
The Group monitors compliance with its fi nancial covenants on a monthly basis and reports compliance on a semi-annual basis to
the banks. The Group has complied with all such requirements during the current and previous year.
Consolidated
2015
$’000
2014
$’000
19 NON-CURRENT LIABILITIES - PROVISIONS
Employee benefi ts 4,323 4,162
Lease provision(i) 1,750 4,537
6,073 8,699
(i) The lease provision includes the Group’s best estimate of the amount required to return the Group’s leased premises to their original condition,
taking into account due consideration of the Group’s past history of vacating stores and the Group’s best estimate of onerous lease obligations.
(a) Movement in provisions
Movements in each class of provision during the fi nancial year, other than employee benefi ts, are set out below:
Consolidated - 2015
Lease
provision(i)
$’000
Carrying amount at start of year 6,169
Additional provisions recognised 2,890
Amounts used during the year (5,474)
Carrying amount at end of year 3,585
(i) Movement schedule is for the total lease provision, including the current provision (note 16) and the non-current provision (note 19).
Consolidated
2015
$’000
2014
$’000
20 NON-CURRENT LIABILITIES - OTHER NON-CURRENT LIABILITIES
Lease accrual 12,472 13,186
Lease incentive 13,192 11,452
25,664 24,638
For
per
sona
l use
onl
y

88
NOTES TO THE FINANCIAL STATEMENTS (continued)for the fi nancial year ended 30 June 2015
Parent entity Parent entity
2015
Shares
2014
Shares
2015
$’000
2014
$’000
21 CONTRIBUTED EQUITY
(a) Share capital
Ordinary shares - fully paid 98,989,901 98,947,309 56,521 58,383
Changes to the then Corporations Law abolished the authorised capital and par value concept in relation to share capital from
1 July 1998. Therefore, the Company does not have a limited amount of authorised capital and issued shares do not have a
par value.
(b) Movements in ordinary share capital
Date Details
Number of
shares $’000
1 July 2013 Opening balance 98,947,309 62,774
Issue of shares under the share option plans 1,438,091 21,523
Share issue costs (net of tax) – (66)
Share buy-back (1,438,091) (25,830)
Share buy-back costs (net of tax) – (18)
30 June 2014 Closing balance 98,947,309 58,383
1 July 2014 Opening balance 98,947,309 58,383
Issue of shares under the share option plans 333,956 3,125
Share issue costs (net of tax) – (17)
Share buy-back (291,364) (4,970)
30 June 2015 Closing balance 98,989,901 56,521
Fully paid ordinary shares carry one vote per share and carry the right to dividends.
(c) Share options
In accordance with the provisions of the Company’s share option plans, as at 30 June 2015, executives and non-executive
management have options over 2,403,618 ordinary shares (of which 2,270,674 were unvested), in aggregate, with various
expiry dates.
As at 30 June 2014 executives and non-executive management had options over 2,798,881 ordinary shares (of which 2,663,051
were unvested), in aggregate, with various expiry dates.
Share options granted under the Company’s share option plans carry no rights to dividends and no voting rights.
(d) Capital management
The Board reviews the capital structure on an ongoing basis. The Group’s objective is to maintain an optimal capital structure which
seeks to reduce the cost of capital and to ensure the Group has access to adequate capital to sustain the future development of
the business.
In order to maintain or adjust the capital structure, the Group may adjust the level of dividends paid to shareholders, return capital to
shareholders, buy back shares, issue new shares or sell assets to reduce debt.
As part of its capital management program, the Group monitors the return on invested capital and the gearing ratio. The Group
defi nes return on invested capital as earnings before interest and tax (EBIT) divided by the sum of total equity plus net debt and
gearing as term debt excluding capitalised borrowing costs, plus bank overdrafts and hire purchase liabilities, divided by earnings
before interest, taxation, depreciation and amortisation (EBITDA).
The Board has adopted a policy of monitoring the dividend payout ratio and targeting a payout ratio of approximately 65% of net
profi t after tax as it seeks to strike a balance between shareholder returns and ensuring adequate capital is retained for the growth
of the business so as to maximise long term shareholder returns.
There were no changes in the Group’s approach to capital management during the year.
For
per
sona
l use
onl
y

89
21 CONTRIBUTED EQUITY (continued)
(d) Capital management (continued)
The Group’s return on invested capital and gearing ratios as at 30 June 2015 and 30 June 2014 were as follows:
Consolidated
2015
$’000
2014
$’000
Return on invested capital
Profi t before tax 195,532 182,677
Net fi nance costs 5,375 8,443
EBIT 200,907 191,120
Borrowings 139,461 179,653
Cash and cash equivalents (49,131) (43,445)
Net debt 90,330 136,208
Total equity 343,479 294,633
Invested capital 433,809 430,841
Return on invested capital 46.3% 44.4%
Gearing
Term debt 140,000 180,000
EBIT 200,907 191,120
Depreciation and amortisation 39,124 35,530
EBITDA 240,031 226,650
Gearing 0.58 0.79
22 RESERVES
Equity-settled benefi ts 21,829 17,950
Common control reserve (6,054) (6,054)
Hedging reserve - interest rate swaps (70) (71)
Hedging reserve - net investment 850 850
Foreign currency translation reserve 1,081 3,590
17,636 16,265
(a) Nature and purpose of reserves
(i) Equity-settled benefi ts
The equity-settled benefi ts reserve arises on the grant of share options to executives and non-executive management under the
Company’s share option plans. Further information about share based payments is in note 7 to the fi nancial statements.
(ii) Common control reserve
The common control reserve represents the excess of the purchase consideration over the balance of a non-controlling interest at
the date a change in ownership of a subsidiary occurs.
(iii) Hedging reserve - interest rate swaps
The hedging reserve - interest rate swaps, represents hedging gains and losses recognised on the effective portion of cash fl ow
hedges with respect to the Group’s interest rate swaps, as described in note 1(h). The cumulative deferred gain or loss on the
interest rate swaps is recognised in the profi t or loss when the hedged transaction impacts the profi t or loss.
For
per
sona
l use
onl
y

90
NOTES TO THE FINANCIAL STATEMENTS (continued)for the fi nancial year ended 30 June 2015
22 RESERVES (continued)
(a) Nature and purpose of reserves (continued)
(iv) Hedging reserve - net investment
The hedging reserve - net investment, represents hedging gains and losses recognised on the effective portion of foreign currency
loans in previous periods designated as net investment hedges. The gains and losses deferred in the hedging reserve net
investment are recognised in the profi t or loss when the foreign operation is disposed.
(v) Foreign currency translation
Exchange differences relating to the translation of the Group’s foreign controlled entities from their functional currencies into
Australian dollars are brought to account directly to the foreign currency translation reserve, as described in note 1(k).
Consolidated
2015
Cents
2014
Cents
23 EARNINGS PER SHARE
Basic (cents per share) 137.91 128.39
Diluted (cents per share) 136.46 126.89
Consolidated
2015
$’000
2014
$’000
(a) Reconciliation of earnings used in calculating earnings per share
Basic earnings per share
Profi t for the year attributable to owners of the Company 136,511 128,359
Diluted earnings per share
Profi t for the year attributable to owners of the Company 136,511 128,359
Consolidated
2015
Number
‘000
2014
Number
‘000
(b) Weighted average number of shares used as the denominator
Weighted average number of ordinary shares used as the denominator in calculating basic
earnings per share 98,982 99,975
Adjustments for calculation of diluted earnings per share:
Options 1,055 1,186
Weighted average number of ordinary and potential ordinary shares used as the denominator in
calculating diluted earnings per share 100,037 101,161
(c) Information concerning the classifi cation of securities
Options
Options granted under the Company’s share option plans are considered to be potential ordinary shares and have been included
in the determination of diluted earnings per share to the extent to which they are dilutive (1,055,452 options are considered
dilutive (2014: 1,186,484), 1,273,774 are considered anti-dilutive (2014: 1,560,673)). The options have not been included in the
determination of basic earnings per share. Details relating to the options are set out in note 7.
For
per
sona
l use
onl
y

91
2015 2014
Cents
per share $’000
Cents
per share $’000
24 DIVIDENDS
Recognised amounts
Final Dividend - previous fi nancial year 29.00 28,778 22.00 21,973
Interim Dividend - current fi nancial year 59.00 58,396 55.00 55,210
88.00 87,174 77.00 77,183
Unrecognised amounts
Final Dividend - current fi nancial year 31.00 30,687 29.00 28,778
In respect of the fi nancial year ended 30 June 2015, the directors have recommended the payment of a fi nal dividend of 31.0 cents
per share. The record date is 28 August 2015.
All dividends declared and subsequently paid by the Company are franked to 100% at the 30% corporate income tax rate.
Consolidated
2015
$’000
2014
$’000
(a) Franking account balance
Franking credits available for subsequent reporting periods based on a tax rate of 30.0%
(2014: 30.0%) 133,964 111,111
The above amounts represent the balance of the franking account as at the end of the fi nancial year, adjusted for franking credits
that will arise from the payment of the amount of the provision for income tax.
The impact on the franking account of the dividend recommended by the directors since year end, but not recognised as a liability
at year end, will be a reduction in the franking account of $13,152 thousand (2014: $12,298 thousand).
25 COMMITMENTS
(a) Non-cancellable operating leases
Operating leases relate to stores with lease terms of between fi ve to fi fteen years, with, in some cases, an option to extend.
Operating lease contracts generally contain market review clauses in the event that the Group exercises its option to renew. The
Group does not have an option to purchase the leased asset at the expiry of the lease period.
Consolidated
2015
$’000
2014
$’000
Commitments for minimum lease payments in relation to non-cancellable operating leases are
payable as follows:
Within one year 76,979 72,361
Later than one year but not later than fi ve years 214,263 214,621
Later than fi ve years 72,237 71,249
363,479 358,231
For
per
sona
l use
onl
y
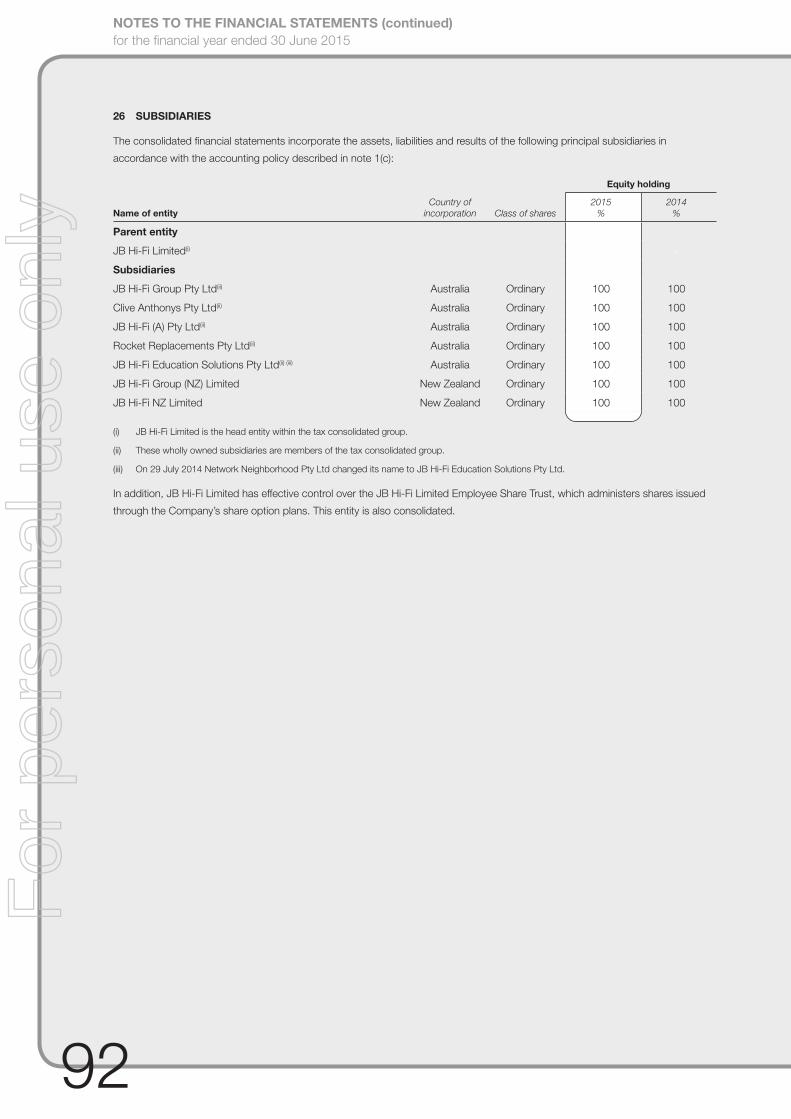
92
NOTES TO THE FINANCIAL STATEMENTS (continued)for the fi nancial year ended 30 June 2015
26 SUBSIDIARIES
The consolidated fi nancial statements incorporate the assets, liabilities and results of the following principal subsidiaries in
accordance with the accounting policy described in note 1(c):
Name of entityCountry of
incorporation Class of shares
Equity holding
2015
%
2014
%
Parent entity
JB Hi-Fi Limited(i) - -
Subsidiaries
JB Hi-Fi Group Pty Ltd(ii) Australia Ordinary 100 100
Clive Anthonys Pty Ltd(ii) Australia Ordinary 100 100
JB Hi-Fi (A) Pty Ltd(ii) Australia Ordinary 100 100
Rocket Replacements Pty Ltd(ii) Australia Ordinary 100 100
JB Hi-Fi Education Solutions Pty Ltd(ii) (iii) Australia Ordinary 100 100
JB Hi-Fi Group (NZ) Limited New Zealand Ordinary 100 100
JB Hi-Fi NZ Limited New Zealand Ordinary 100 100
(i) JB Hi-Fi Limited is the head entity within the tax consolidated group.
(ii) These wholly owned subsidiaries are members of the tax consolidated group.
(iii) On 29 July 2014 Network Neighborhood Pty Ltd changed its name to JB Hi-Fi Education Solutions Pty Ltd.
In addition, JB Hi-Fi Limited has effective control over the JB Hi-Fi Limited Employee Share Trust, which administers shares issued
through the Company’s share option plans. This entity is also consolidated.
For
per
sona
l use
onl
y

93
27 DEED OF CROSS GUARANTEE
JB Hi-Fi Limited, JB Hi-Fi Group Pty Ltd, JB Hi-Fi (A) Pty Ltd, Clive Anthonys Pty Ltd and JB Hi-Fi Education Solutions Pty Ltd
(formerly Network Neighborhood Pty Ltd) are parties to a deed of cross guarantee under which each Company guarantees to each
creditor payment in full of any debt in accordance with the deed of cross guarantee. By entering into the deed, the subsidiaries who
are party to the deed have been relieved from the requirement to prepare and lodge an audited fi nancial report under Class Order
98/1418 (as amended).
The consolidated statement of profi t or loss, statement of profi t or loss and other comprehensive income and balance sheet of the
entities party to the deed of cross guarantee are provided as follows:
2015
$’000
2014
$’000
(a) Consolidated statement of profi t or loss, statement of profi t or loss and other
comprehensive income
Statement of profi t or loss
Revenue 3,456,016 3,292,848
Cost of sales (2,693,370) (2,571,287)
Gross profi t 762,646 721,561
Other income 486 423
Sales and marketing expenses (353,667) (336,515)
Occupancy expenses (149,883) (139,536)
Administration expenses (26,183) (26,149)
Finance costs (5,921) (8,736)
Other expenses (33,530) (31,155)
Profi t before income tax 193,948 179,893
Income tax expense (58,593) (53,463)
Profi t for the year 135,355 126,430
Statement of profi t or loss and other comprehensive income
Profi t for the year 135,355 126,430
Other comprehensive income
Items that may be reclassifi ed to profi t or loss
Changes in the fair value of cash fl ow hedges (net of tax) 1 576
Other comprehensive income for the year (net of tax) 1 576
Total comprehensive income for the year 135,356 127,006
For
per
sona
l use
onl
y
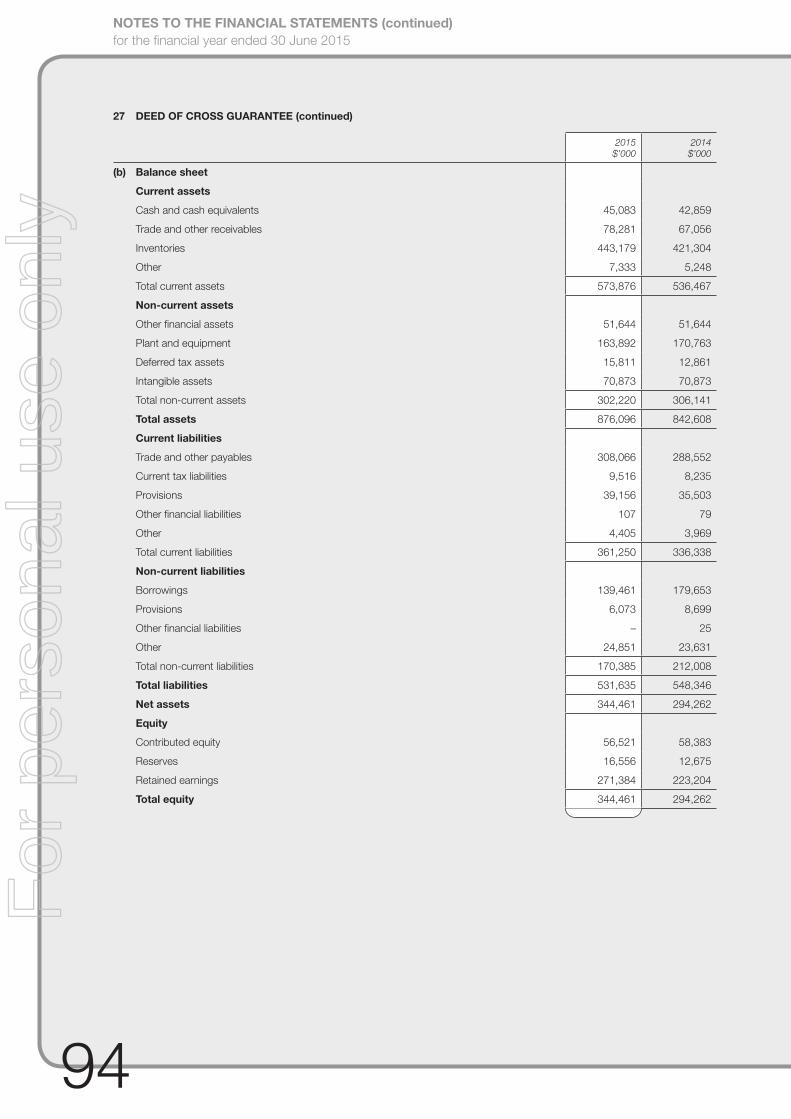
94
NOTES TO THE FINANCIAL STATEMENTS (continued)for the fi nancial year ended 30 June 2015
27 DEED OF CROSS GUARANTEE (continued)
2015
$’000
2014
$’000
(b) Balance sheet
Current assets
Cash and cash equivalents 45,083 42,859
Trade and other receivables 78,281 67,056
Inventories 443,179 421,304
Other 7,333 5,248
Total current assets 573,876 536,467
Non-current assets
Other fi nancial assets 51,644 51,644
Plant and equipment 163,892 170,763
Deferred tax assets 15,811 12,861
Intangible assets 70,873 70,873
Total non-current assets 302,220 306,141
Total assets 876,096 842,608
Current liabilities
Trade and other payables 308,066 288,552
Current tax liabilities 9,516 8,235
Provisions 39,156 35,503
Other fi nancial liabilities 107 79
Other 4,405 3,969
Total current liabilities 361,250 336,338
Non-current liabilities
Borrowings 139,461 179,653
Provisions 6,073 8,699
Other fi nancial liabilities – 25
Other 24,851 23,631
Total non-current liabilities 170,385 212,008
Total liabilities 531,635 548,346
Net assets 344,461 294,262
Equity
Contributed equity 56,521 58,383
Reserves 16,556 12,675
Retained earnings 271,384 223,204
Total equity 344,461 294,262
For
per
sona
l use
onl
y
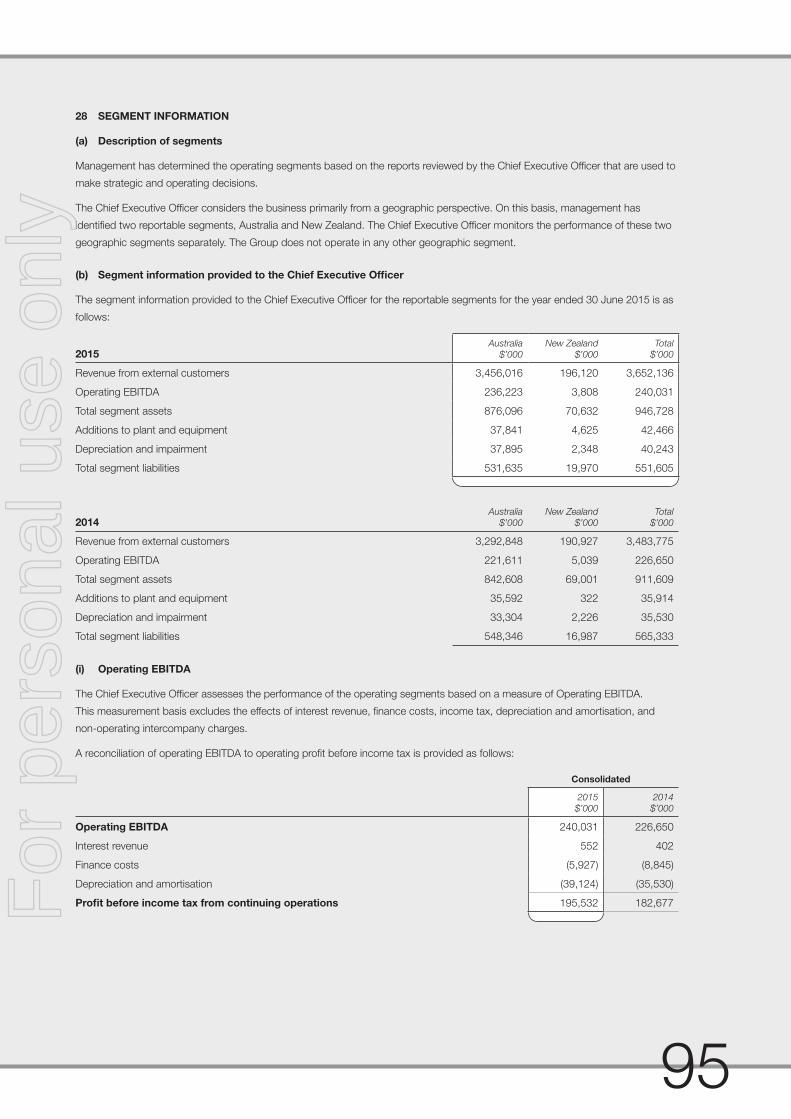
95
28 SEGMENT INFORMATION
(a) Description of segments
Management has determined the operating segments based on the reports reviewed by the Chief Executive Offi cer that are used to
make strategic and operating decisions.
The Chief Executive Offi cer considers the business primarily from a geographic perspective. On this basis, management has
identifi ed two reportable segments, Australia and New Zealand. The Chief Executive Offi cer monitors the performance of these two
geographic segments separately. The Group does not operate in any other geographic segment.
(b) Segment information provided to the Chief Executive Offi cer
The segment information provided to the Chief Executive Offi cer for the reportable segments for the year ended 30 June 2015 is as
follows:
2015Australia
$’000
New Zealand
$’000
Total
$’000
Revenue from external customers 3,456,016 196,120 3,652,136
Operating EBITDA 236,223 3,808 240,031
Total segment assets 876,096 70,632 946,728
Additions to plant and equipment 37,841 4,625 42,466
Depreciation and impairment 37,895 2,348 40,243
Total segment liabilities 531,635 19,970 551,605
2014Australia
$’000
New Zealand
$’000
Total
$’000
Revenue from external customers 3,292,848 190,927 3,483,775
Operating EBITDA 221,611 5,039 226,650
Total segment assets 842,608 69,001 911,609
Additions to plant and equipment 35,592 322 35,914
Depreciation and impairment 33,304 2,226 35,530
Total segment liabilities 548,346 16,987 565,333
(i) Operating EBITDA
The Chief Executive Offi cer assesses the performance of the operating segments based on a measure of Operating EBITDA.
This measurement basis excludes the effects of interest revenue, fi nance costs, income tax, depreciation and amortisation, and
non-operating intercompany charges.
A reconciliation of operating EBITDA to operating profi t before income tax is provided as follows:
Consolidated
2015
$’000
2014
$’000
Operating EBITDA 240,031 226,650
Interest revenue 552 402
Finance costs (5,927) (8,845)
Depreciation and amortisation (39,124) (35,530)
Profi t before income tax from continuing operations 195,532 182,677
For
per
sona
l use
onl
y

96
NOTES TO THE FINANCIAL STATEMENTS (continued)for the fi nancial year ended 30 June 2015
28 SEGMENT INFORMATION (continued)
(b) Segment information provided to the Chief Executive Offi cer (continued)
(ii) Segment assets
The amounts provided to the Chief Executive Offi cer with respect to total assets are measured in a manner consistent with that of
the fi nancial statements. These assets are allocated based on the operations of the segment and the physical location of the asset.
Reportable segments’ assets are reconciled to total assets as follows:
Consolidated
2015
$’000
2014
$’000
Segment assets 946,728 911,609
Intersegment eliminations (51,715) (51,768)
Total assets as per the balance sheet 895,013 859,841
(iii) Segment liabilities
The amounts provided to the Chief Executive Offi cer with respect to total liabilities are measured in a manner consistent with that of
the fi nancial statements. These liabilities are allocated based on the operations of the segment.
Reportable segments’ liabilities are reconciled to total liabilities as follows:
Consolidated
2015
$’000
2014
$’000
Segment liabilities 551,605 565,333
Intersegment eliminations (71) (125)
Total liabilities as per the balance sheet 551,534 565,208
(c) Product information
The Group operates in one product and services segment, being the sale of consumer electronics products and services, including
televisions, audio equipment, computers, cameras, telecommunications products and services, software, musical instruments,
whitegoods, cooking products, small appliances, digital content and information technology and consulting services.
For
per
sona
l use
onl
y

97
Parent Entity
2015
$’000
2014
$’000
29 PARENT ENTITY FINANCIAL INFORMATION
Assets
Current assets 344 4,331
Non-current assets 90,487 85,912
Total assets 90,831 90,243
Liabilities
Current liabilities 10,496 10,154
Non-current liabilities 20 –
Total liabilities 10,516 10,154
- -
Shareholders’ equity
Contributed equity 56,521 58,383
Reserves 21,829 17,950
Retained earnings 1,965 3,754
80,315 80,087
Profi t for the year 85,385 77,309
Total comprehensive income 85,385 77,309
30 RELATED PARTY TRANSACTIONS
(a) Parent entity
The parent entity of the Group is JB Hi-Fi Limited, a listed public company, incorporated in Australia.
(b) Equity interests in related parties
Details of the percentage of ordinary shares held in subsidiaries are disclosed in note 26.
(c) Key management personnel
Disclosures relating to key management personnel are set out in the Directors’ report.
(d) Terms and conditions of transactions with related parties other than key management personnel or entities related
to them
Sales to, and purchases from, related parties for goods and services are made in arm’s length transactions at normal prices and on
normal commercial terms.
31 EVENTS OCCURRING AFTER THE REPORTING PERIOD
On 10 August 2015, the Company announced that it would conduct an on-market buy-back in order to offset the dilutionary
impact of shares to be issued pursuant to the exercise of employee share options between the date of the previous buy-back,
completed on 12 September 2014, and 4 September 2015. The maximum number of shares that will be purchased is 776,610
and the buy-back is scheduled to commence in September 2015.
There have been no matters or circumstances occurring subsequent to the end of the fi nancial year end, that have signifi cantly
affected, or may signifi cantly affect, the operations of the Group, the results of those operations or the state of affairs of the Group
or economic entity in future fi nancial years.
For
per
sona
l use
onl
y

98
NOTES TO THE FINANCIAL STATEMENTS (continued)for the fi nancial year ended 30 June 2015
32 NOTES TO THE CASH FLOW STATEMENT
(a) Reconciliation of cash and cash equivalents
For the purposes of the cash fl ow statement, cash and cash equivalents includes cash on hand and in banks, net of outstanding
bank overdrafts. Cash and cash equivalents at the end of the fi nancial year as shown in the cash fl ow statement is reconciled to the
related items in the balance sheet as follows:
Consolidated
2015
$’000
2014
$’000
Cash and cash equivalents 49,131 43,445
Bank overdrafts – –
Balances per statement of cash fl ows 49,131 43,445
(b) Reconciliation of net cash infl ow from operating activities to profi t
Profi t for the year 136,511 128,447
Depreciation and amortisation 39,124 35,530
Impairment of plant and equipment 1,119 –
Non-cash employee benefi ts expense - share-based payments 3,508 3,592
Net loss on sale of non-current assets 997 382
Fair value adjustment to derivatives 111 937
Change in operating assets and liabilities net of effects from acquisition of businesses:
(Increase) decrease in inventories (22,011) (29,580)
(Increase) decrease in current receivables (10,836) (6,169)
(Increase) decrease in other current assets (2,097) 723
(Increase) decrease in deferred tax assests (2,454) 637
(Decrease) increase in current payables 25,892 (88,212)
(Decrease) increase in current provisions 3,817 155
(Decrease) increase in other current liabilities 491 175
(Decrease) increase in non-current provisions 2,847 (716)
(Decrease) increase in other non-current liabilities 1,279 2,162
(Decrease) increase in current tax liabilities 1,598 (6,737)
Net cash infl ow from operating activities 179,896 41,326
33 FINANCIAL RISK MANAGEMENT
The Group’s activities expose it to a variety of fi nancial risks, including market risk (foreign currency and interest rate risk), liquidity
risk and credit risk.
The Group seeks to minimise the effects of these risks, by using various fi nancial instruments, including derivative fi nancial
instruments. The Group does not enter into or trade fi nancial instruments, including derivative fi nancial instruments, for speculative
purposes. The use of fi nancial derivatives is governed by the Group’s policies approved by the Board of directors, which provide
written principles on the use of fi nancial derivatives.
There have been no changes to the Group’s exposure to fi nancial risks or the manner in which it manages and measures these risks
from the previous period.For
per
sona
l use
onl
y
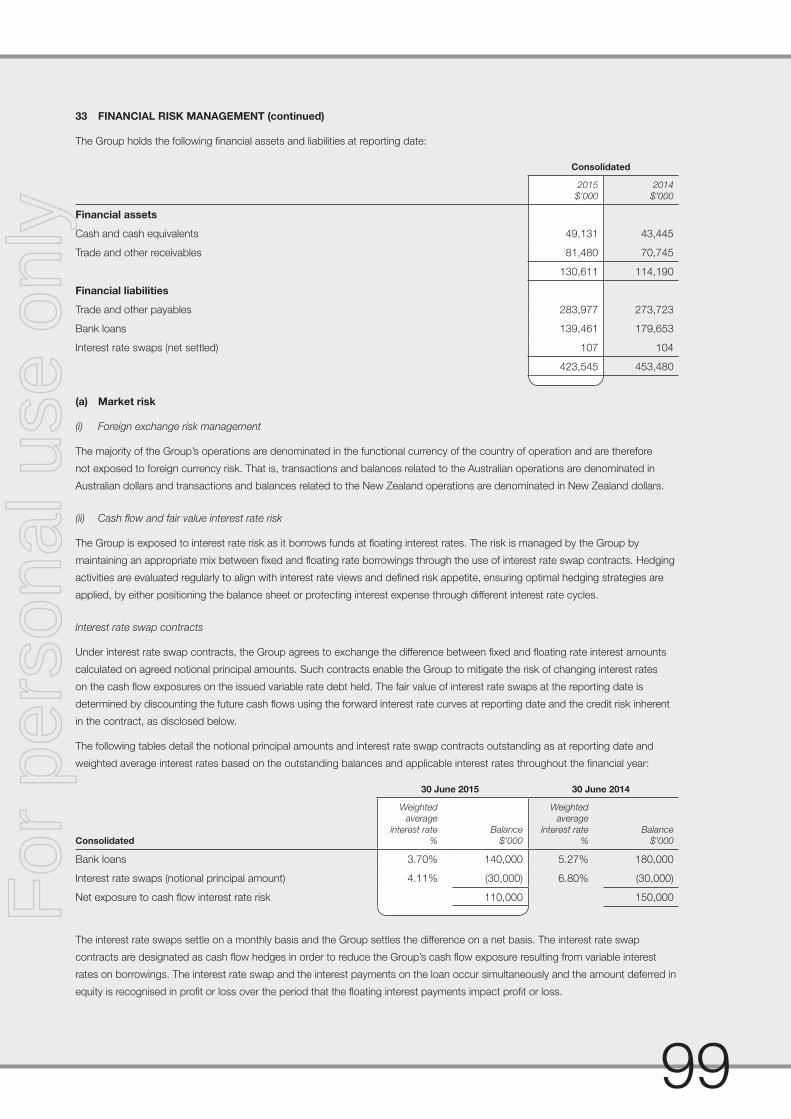
99
33 FINANCIAL RISK MANAGEMENT (continued)
The Group holds the following fi nancial assets and liabilities at reporting date:
Consolidated
2015
$’000
2014
$’000
Financial assets
Cash and cash equivalents 49,131 43,445
Trade and other receivables 81,480 70,745
130,611 114,190
Financial liabilities
Trade and other payables 283,977 273,723
Bank loans 139,461 179,653
Interest rate swaps (net settled) 107 104
423,545 453,480
(a) Market risk
(i) Foreign exchange risk management
The majority of the Group’s operations are denominated in the functional currency of the country of operation and are therefore
not exposed to foreign currency risk. That is, transactions and balances related to the Australian operations are denominated in
Australian dollars and transactions and balances related to the New Zealand operations are denominated in New Zealand dollars.
(ii) Cash fl ow and fair value interest rate risk
The Group is exposed to interest rate risk as it borrows funds at fl oating interest rates. The risk is managed by the Group by
maintaining an appropriate mix between fi xed and fl oating rate borrowings through the use of interest rate swap contracts. Hedging
activities are evaluated regularly to align with interest rate views and defi ned risk appetite, ensuring optimal hedging strategies are
applied, by either positioning the balance sheet or protecting interest expense through different interest rate cycles.
Interest rate swap contracts
Under interest rate swap contracts, the Group agrees to exchange the difference between fi xed and fl oating rate interest amounts
calculated on agreed notional principal amounts. Such contracts enable the Group to mitigate the risk of changing interest rates
on the cash fl ow exposures on the issued variable rate debt held. The fair value of interest rate swaps at the reporting date is
determined by discounting the future cash fl ows using the forward interest rate curves at reporting date and the credit risk inherent
in the contract, as disclosed below.
The following tables detail the notional principal amounts and interest rate swap contracts outstanding as at reporting date and
weighted average interest rates based on the outstanding balances and applicable interest rates throughout the fi nancial year:
30 June 2015 30 June 2014
Consolidated
Weighted
average
interest rate
%
Balance
$’000
Weighted
average
interest rate
%
Balance
$’000
Bank loans 3.70% 140,000 5.27% 180,000
Interest rate swaps (notional principal amount) 4.11% (30,000) 6.80% (30,000)
Net exposure to cash fl ow interest rate risk 110,000 150,000
The interest rate swaps settle on a monthly basis and the Group settles the difference on a net basis. The interest rate swap
contracts are designated as cash fl ow hedges in order to reduce the Group’s cash fl ow exposure resulting from variable interest
rates on borrowings. The interest rate swap and the interest payments on the loan occur simultaneously and the amount deferred in
equity is recognised in profi t or loss over the period that the fl oating interest payments impact profi t or loss.
For
per
sona
l use
onl
y

100
NOTES TO THE FINANCIAL STATEMENTS (continued)for the fi nancial year ended 30 June 2015
33 FINANCIAL RISK MANAGEMENT (continued)
(a) Market risk (continued)
(iii) Summarised sensitivity analysis
The following table summarises the sensitivity of the Group’s fi nancial assets and fi nancial liabilities to interest rate risk.
The Group is using a sensitivity of 50 basis points as management considers this to be reasonable having regard to historic
movements in interest rates.
A positive number represents an increase in profi t or equity and a negative number a decrease in profi t or equity.
Interest rate risk
-50 bps +50 bps
Consolidated
Carrying
amount
$’000
Profi t
$’000
Other equity
$’000
Profi t
$’000
Other equity
$’000
At 30 June 2015
Financial liabilities
Interest rate swaps 107 (98) (40) 98 40
Borrowings 139,461 182 – (182) –
Total increase/(decrease) 84 (40) (84) 40
Interest rate risk
-50 bps +50 bps
Consolidated
Carrying
amount
$’000
Profi t
$’000
Other equity
$’000
Profi t
$’000
Other equity
$’000
At 30 June 2014
Financial liabilities
Interest rate swaps 104 (255) (145) 255 145
Borrowings 179,653 326 – (326) –
Total increase/(decrease) 71 (145) (71) 145
(b) Liquidity risk
Ultimate responsibility for liquidity risk management rests with the board of directors, who assess the Group’s short, medium and
long term funding and liquidity management requirements. The Group manages liquidity risk by maintaining adequate reserves,
banking facilities and reserve borrowing facilities and by continuously monitoring forecast and actual cash fl ows.
Financing arrangements
The Group had access to the following undrawn borrowing facilities at the end of the reporting period:
Consolidated
2015
$’000
2014
$’000
Unsecured bank overdraft facility:
amount used – –
amount unused 88,854 89,293
88,854 89,293
Unsecured indemnity guarantees:
amount used 522 601
amount unused 78 1,099
600 1,700
Unsecured bank loan facilities (term debt):
amount used(i) 140,000 180,000
amount unused 60,000 20,000
200,000 200,000
Headroom in total borrowing facilities (excluding security indemnity guarantees) 148,854 109,293
(i) Face value of term debt (excluding capitalised borrowing costs).
For
per
sona
l use
onl
y

101
33 FINANCIAL RISK MANAGEMENT (continued)
(b) Liquidity risk (continued)
Maturities of fi nancial assets and fi nancial liabilities
The following tables detail the Group’s remaining contractual maturity for its fi nancial assets and liabilities. The tables have been
drawn up based on the undiscounted cash fl ows of fi nancial liabilities based on the earliest date on which the Group can be
required to pay. The table includes both principal and estimated interest cash fl ows.
Cash fl ows for fi nancial assets and liabilities without fi xed amount or timing are based on the conditions existing at the reporting
date.
Less than
6 months 6 - 12 months
Between
1 and 2 years
Between
2 and 5 years Over 5 years Total
Weighted
average
effective
interest rate
2015 $’000 $’000 $’000 $’000 $’000 $’000 %
Financial Assets
Cash and cash equivalents 49,131 – – – – 49,131 1.96%
Trade and other receivables 81,480 – – – – 81,480 –
130,611 – – – – 130,611 1.96%
Financial liabilities
Trade and other payables 283,977 – – – – 283,977 –
Bank loans 2,588 2,588 5,175 145,175 – 155,526 3.70%
Interest rate swaps (net settled) 107 – – – – 107 –
286,672 2,588 5,175 145,175 – 439,610 3.70%
Less than
6 months 6 - 12 months
Between
1 and 2 years
Between
2 and 5 years Over 5 years Total
Weighted
average
effective
interest rate
2014 $’000 $’000 $’000 $’000 $’000 $’000 %
Financial assets
Cash and cash equivalents 43,445 – – – – 43,445 2.13%
Trade and other receivables 70,745 – – – – 70,745 –
114,190 – – – – 114,190
Financial liabilities
Trade and other payables 273,723 – – – – 273,723 –
Bank loans 4,740 4,740 189,480 – – 198,960 5.27%
Interest rate swaps (net settled) 46 35 26 – – 107 –
278,509 4,775 189,506 – – 472,790
(c) Credit risk management
Credit risk refers to the risk that a counterparty will default on its contractual obligations resulting in fi nancial loss to the Group. The
Group has endeavoured to minimise its credit risk by dealing with creditworthy counterparties. The Group’s exposure and the credit
ratings of its counterparties are continuously monitored and the aggregate value of transactions concluded is spread amongst
approved counterparties.
The Group does not have any signifi cant credit risk exposure to any single counterparty or any group of counterparties having
similar characteristics.
The carrying amount of fi nancial assets recorded in the fi nancial statements, net of any allowance for impairment, represents the
Group’s maximum exposure to credit risk.
For
per
sona
l use
onl
y
102
NOTES TO THE FINANCIAL STATEMENTS (continued)for the fi nancial year ended 30 June 2015
33 FINANCIAL RISK MANAGEMENT (continued)
(d) Fair value of fi nancial instruments
The only fi nancial liabilities or fi nancial assets carried at fair value is the interest rate swap. The interest rate swap is considered to
be Level 2 fi nancial instruments because, unlike Level 1 fi nancial instruments, it’s measurement is derived from inputs other than
quoted prices that are observable for the assets or liabilities, either directly (as prices) or indirectly (derived from prices). There have
been no transfers between levels 1, 2 and 3 for recurring fair value measurements during the fi nancial year. The interest rate swap’s
fair value has been obtained from third party valuations derived from discounted cash fl ow forecasts of forward interest rates
(from observable yield curves at the end of the reporting period) and contract interest rates.
The carrying amount of other fi nancial assets and fi nancial liabilities recorded in the fi nancial statements approximate their fair values.
34 DIRECTORY
Registered offi ce / principal place of business
JB Hi-Fi Limited
Level 4, Offi ce Tower 2
Chadstone Place
Chadstone Shopping Centre
1341 Dandenong Road
Chadstone VIC 3148
Phone: +61 3 8530 7333
For
per
sona
l use
onl
y

103
The shareholder information set out below was applicable as at 3 August 2015.
A. Distribution of equity securities
Analysis of numbers of equity security holders by size of holding:
Ordinary shares
Holding Total Holders Units % Issued Capital
1 - 1,000 14,848 5,865,124 5.92
1,001 - 5,000 5,109 10,643,134 10.75
5,001 - 10,000 440 3,117,057 3.15
10,001 - 100,000 249 5,788,016 5.84
100,001 and over 27 73,613,573 74.34
20,673 99,026,904 100.00
There were 321 holders of less than a marketable parcel of ordinary shares.
B. Equity security holders
Twenty largest quoted equity security holders
The names of the twenty largest holders of quoted equity securities are listed below:
Ordinary shares
Name Number held
% of issued
shares
1. HSBC CUSTODY NOMINEES (AUSTRALIA) LIMITED 16,659,347 16.82
2. J P MORGAN NOMINEES AUSTRALIA LIMITED 16,573,835 16.74
3. NATIONAL NOMINEES LIMITED 16,250,345 16.41
4. CITICORP NOMINEES PTY LIMITED 11,480,604 11.59
5. BNP PARIBAS NOMS PTY LTD <DRP> 4,423,180 4.47
6. AMP LIFE LIMITED 955,431 0.96
7. WARBONT NOMINEES PTY LTD <UNPAID ENTREPOT A/C> 774,091 0.78
8. CITICORP NOMINEES PTY LIMITED <COLONIAL FIRST STATE INV A/C> 764,374 0.77
9. HSBC CUSTODY NOMINEES (AUSTRALIA) LIMITED <NT-COMNWLTH SUPER CORP A/C> 585,604 0.59
10. BOND STREET CUSTODIANS LIMITED <COCKEJ - F01832 A/C> 566,310 0.57
11. NAVIGATOR AUSTRALIA LTD <SMA ANTARES INV DV BUILD A/C> 545,783 0.55
12. SHAWVILLE PTY LTD 500,160 0.51
13. RBC INVESTOR SERVICES AUSTRALIA NOMINEES PTY LIMITED <BKCUST A/C> 431,603 0.44
14. BNP PARIBAS NOMINEES PTY LTD <AGENCY LENDING DRP A/C> 398,123 0.40
15. SBN NOMINEES PTY LIMITED <10004 ACCOUNT> 378,000 0.38
16. UBS WEALTH MANAGEMENT AUSTRALIA NOMINEES PTY LTD 320,355 0.32
17. HSBC CUSTODY NOMINEES (AUSTRALIA) LIMITED - A/C 3 278,385 0.28
18. NATIONAL NOMINEES LIMITED <N A/C> 241,599 0.24
19. THE AUSTRALIAN NATIONAL UNIVERSITY 236,040 0.24
20. NATIONAL NOMINEES LIMITED <DB A/C> 222,830 0.23
72,585,999 73.29
ADDITIONAL SECURITIES EXCHANGE INFORMATION
For
per
sona
l use
onl
y

104
C. Substantial holders
Substantial holders in the Company are set out below:
Ordinary sharesNumber
held
Voting Power
%
UBS Group AG and its related bodies corporate 7,560,432 7.63
National Australia Bank Limited 5,240,853 5.29
Legg Mason Asset Management Australia Limited 5,203,548 5.25
Vinva Investment Management 5,135,152 5.19
Australian Super Pty Ltd 5,006,074 5.06
Number
on issue
Number
of holders
D. Unquoted equity securities
Employee share options issued under the Company’s share option plans 2,267,430 85
ADDITIONAL SECURITIES EXCHANGE INFORMATION (continued)
For
per
sona
l use
onl
y
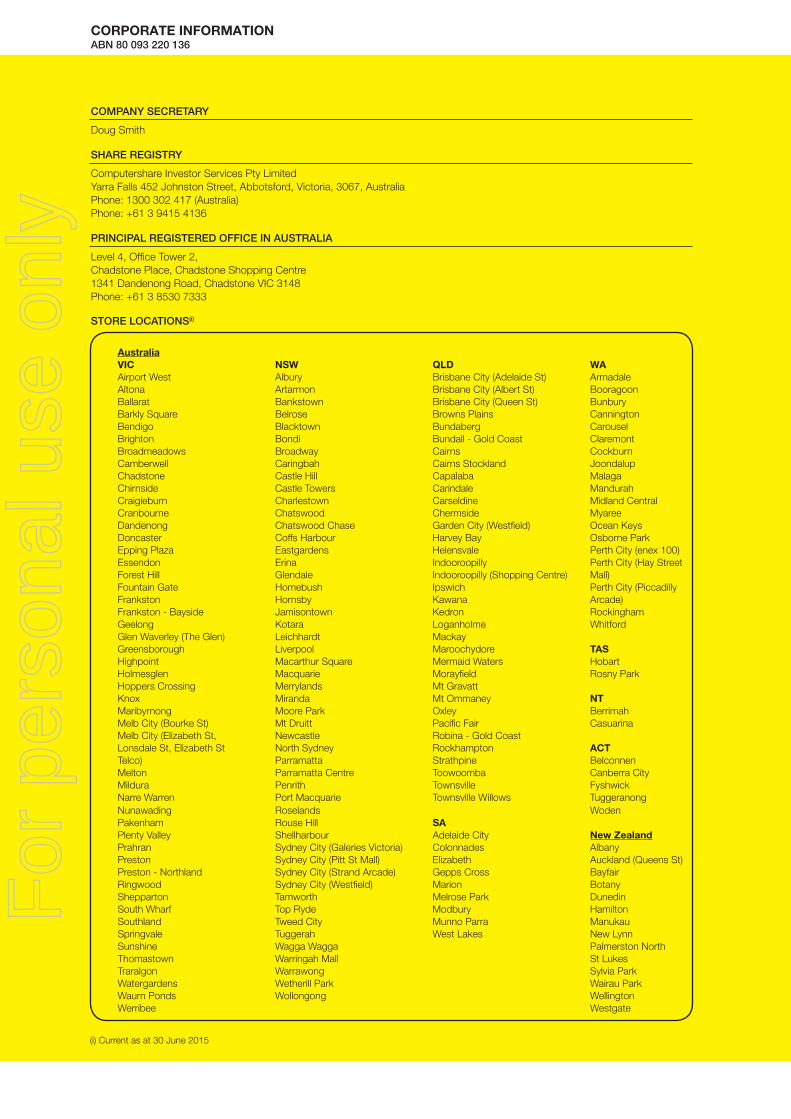
COMPANY SECRETARY
Doug Smith
SHARE REGISTRY
Computershare Investor Services Pty Limited
Yarra Falls 452 Johnston Street, Abbotsford, Victoria, 3067, Australia
Phone: 1300 302 417 (Australia)
Phone: +61 3 9415 4136
PRINCIPAL REGISTERED OFFICE IN AUSTRALIA
Level 4, Offi ce Tower 2,
Chadstone Place, Chadstone Shopping Centre
1341 Dandenong Road, Chadstone VIC 3148
Phone: +61 3 8530 7333
STORE LOCATIONS(i)
CORPORATE INFORMATIONABN 80 093 220 136
AustraliaVIC NSW QLD WAAirport West Albury Brisbane City (Adelaide St) Armadale
Altona Artarmon Brisbane City (Albert St) Booragoon
Ballarat Bankstown Brisbane City (Queen St) Bunbury
Barkly Square Belrose Browns Plains Cannington
Bendigo Blacktown Bundaberg Carousel
Brighton Bondi Bundall - Gold Coast Claremont
Broadmeadows Broadway Cairns Cockburn
Camberwell Caringbah Cairns Stockland Joondalup
Chadstone Castle Hill Capalaba Malaga
Chirnside Castle Towers Carindale Mandurah
Craigieburn Charlestown Carseldine Midland Central
Cranbourne Chatswood Chermside Myaree
Dandenong Chatswood Chase Garden City (Westfi eld) Ocean Keys
Doncaster Coffs Harbour Harvey Bay Osborne Park
Epping Plaza Eastgardens Helensvale Perth City (enex 100)
Essendon Erina Indooroopilly Perth City (Hay Street
Forest Hill Glendale Indooroopilly (Shopping Centre) Mall)
Fountain Gate Homebush Ipswich Perth City (Piccadilly
Frankston Hornsby Kawana Arcade)
Frankston - Bayside Jamisontown Kedron Rockingham
Geelong Kotara Loganholme Whitford
Glen Waverley (The Glen) Leichhardt Mackay
Greensborough Liverpool Maroochydore TASHighpoint Macarthur Square Mermaid Waters Hobart
Holmesglen Macquarie Morayfi eld Rosny Park
Hoppers Crossing Merrylands Mt Gravatt
Knox Miranda Mt Ommaney NTMaribyrnong Moore Park Oxley Berrimah
Melb City (Bourke St) Mt Druitt Pacifi c Fair Casuarina
Melb City (Elizabeth St, Newcastle Robina - Gold Coast
Lonsdale St, Elizabeth St North Sydney Rockhampton ACTTelco) Parramatta Strathpine Belconnen
Melton Parramatta Centre Toowoomba Canberra City
Mildura Penrith Townsville Fyshwick
Narre Warren Port Macquarie Townsville Willows Tuggeranong
Nunawading Roselands Woden
Pakenham Rouse Hill SAPlenty Valley Shellharbour Adelaide City New ZealandPrahran Sydney City (Galeries Victoria) Colonnades Albany
Preston Sydney City (Pitt St Mall) Elizabeth Auckland (Queens St)
Preston - Northland Sydney City (Strand Arcade) Gepps Cross Bayfair
Ringwood Sydney City (Westfi eld) Marion Botany
Shepparton Tamworth Melrose Park Dunedin
South Wharf Top Ryde Modbury Hamilton
Southland Tweed City Munno Parra Manukau
Springvale Tuggerah West Lakes New Lynn
Sunshine Wagga Wagga Palmerston North
Thomastown Warringah Mall St Lukes
Traralgon Warrawong Sylvia Park
Watergardens Wetherill Park Wairau Park
Waurn Ponds Wollongong Wellington
Werribee Westgate
(i) Current as at 30 June 2015
916CRN2876_JB_Hi-Fi_Annual_Report_2015 - 2 - Inside Cover (Colour)_v4.indd 2 1/09/2015 5:55:41 PM
For
per
sona
l use
onl
y

jbhifi .com.au
916CRN2876_JB_Hi-Fi_Annual_Report_2015 - 1 - Cover_v1.indd 2 11/08/2015 12:05:48 PM
For
per
sona
l use
onl
y


