68
2015 ANNUAL REPORT For personal use only

2 0 1 5 A n n u A l R e p o R t
For
per
sona
l use
onl
y
Corporate InformatIon
aBn 97 000 764 867this annual report covers both prime Media Group limited (“the Company”) as an individual entity and the consolidated entity comprising prime Media Group limited and its subsidiaries (“the Group”). the Group’s functional and presentation currency is AuD ($).
name poSItIon Date appoInteD Date reSIGneD/retIreD
DirectorsJohn Kenneth Hartigan Chairman 15 May 2014 –
Michael Stanley Siddle 17 April 1985 –
Alexander Andrew Hamill 2 october 2003 –
Ian Richard neal 6 June 2008 –
peter John Macourt 1 September 2014 –
Cass o’Connor 21 April 2015 –
Michael Hastings Hill 4 August 2015 –
Ian Craig Audsley Chief executive officer 24 June 2010 –
peter John evans FCA 27 March 1991 20 november 2014
Ian patrick Grier AM 6 June 2008 20 november 2014
Company Secretaryemma McDonald 27 February 2012 –
reGIStereD offICe363 Antill Street Watson ACt 2602 ph: 02 6242 3700
Share reGISterlink Market Services limited level 12 680 George Street Sydney nSW 2000
ContentS
1 CHAIRMAn’S RepoRt
2 CHIeF eXeCutIVe oFFICeR’S RepoRt
4 DIReCtoRS’ RepoRt
19 FInAnCIAl StAteMentS
BankAustralia and new Zealand Banking Group limited (AnZ) 8/20 Martin place Sydney nSW 2000
auDItorSernst & Young 680 George Street Sydney nSW 2000
prime Media Group limited share are listed on the Australian Securities exchange (listing Code pRt).
For
per
sona
l use
onl
y

On behalf of the directors of PRIME Media Group I am pleased to present the Annual Report for the 2015 financial year.
the 2015 financial year was marked by the 50th anniversary of prime’s broadcast in the new england and north West region of new South Wales. the celebration in tamworth was a timely reminder of the enduring relationship that pRIMe is privileged to have with regional Australia, its viewers and our advertisers.
2015 will also be remembered as the fifth year in a row that prime was the preferred regional advertiser in our markets, lifting both audience share and revenue share to new highs, which is a remarkable result in what was a turbulent year for advertising markets in our broadcast areas.
I am pleased to report that pRIMe was able to maintain its full year dividend at 6.8 cents per share fully franked, delivering a yield of 9.8% at 30 June 2015. encouragingly, pRIMe was also able to reduce its net interest bearing debt by $28 million on the back of another year of strong operating cashflow and the sale of surplus assets. pRIMe is optimally positioned for what the future brings.
It is well known that our industry is facing structural headwinds. In response to that, pRIMe has continued to play a significant role in the national debate about regulatory reform. notably, ‘Save our Voices’, to which former Deputy prime Minister tim Fischer has pledged his support, has brought to the forefront the concerns of many media companies operating in regional Australia.
the campaign message is simple: vibrant local media is essential to ensure regional issues get the attention they deserve and regional voices are heard. the Board and management will continue to advocate for legislative reform to remove archaic regulations that will continue to challenge our industry.
Finally, I would like to offer my sincere thanks to our longest serving director, Michael Siddle, who is retiring after 30 years of remarkable dedication to the company. We wish him well for the future. pRIMe also welcomed to the Board during the year, three very talented and experienced non-executive directors, peter Macourt, Cass o’Connor and Mike Hill. We are delighted that they have joined our Board and look forward to their contributions to the company.
John Hartigan CHAIRMAN
CHAIRMAN’S REPORT
1Prime media GrouP AnnuAl REPORt 2015
For
per
sona
l use
onl
y

TV Revenue and Audience Growth
36.7% 36.8%
Revenue Share 1 Audience Share 2
20152014201320122011
37.4%
39.1%
39.5%
40.2%40.0%
40.8%
41.7%
42.2%
proGrammInGSeven network programming continues to resonate strongly with regional Australia, delivering year on year growth for pRIMe and further entrenching our position as the partner of choice for advertisers seeking to reach regional Australian audiences.
Seven’s recent renewal of free to air television rights for the AFl, olympic Games and Australian Swimming will provide pRIMe with a strong sports schedule that will underpin performance over the next 3-4 years. the 2016 financial year will, however, continue to see industry change, as our regional broadcasting competitors seek to renegotiate their affiliation agreements. In october 2013 pRIMe renegotiated and extended its program arrangements with the Seven network until June 2019 and will avoid being caught in a three way contest for programming.
reVenue Share & CoSt ControL DrIVeS earnInGS In a ChaLLenGInG marketthe 2015 financial year delivered mixed results for pRIMe. our television business continued to grow its audience share in regional markets, delivering a 1.7 share point gain to take a 41.7 audience share, while concurrently growing our total advertising revenue share by 1.3 points to achieve a 42.2 share. pRIMe’s national sales team delivered the industry’s best national revenue share performance achieving 46.2% of national revenue in our markets.
once again our Western Australian business delivered the biggest audience of any television channel in Australia with a 52.9 share of audience.
the strong revenue share performance supported our top line during a period when television advertising spend in pRIMe’s markets contracted by almost 4%. Advertiser activity was subdued in a number of markets because of soft economic conditions and weakening consumer sentiment, which was particularly evident in markets where employment and spending has been affected by the down turn in the mining sector.
In response to the soft advertising conditions management continued its program to reduce expenses and optimise earnings. the program delivered a $4.3 million or 7.4% reduction in expenses year on year and contributed to a 3.2% improvement in earnings before interest, tax and depreciation of $66.9 million. the 2015 financial result also benefited from the sale of surplus property in Wagga Wagga, at a profit of $1.1 million.
pRIMe is well-positioned, compared to other traditional media companies, to meet the challenges of a soft and disrupted advertising market, having focused its efforts on reducing its net interest bearing debt and improving shareholder returns over the past four financial years. this financial year, prime’s television business generated $57.9 million in operating cashflows, enabling the Company to reduce its net debt to $78.9 million and lower its gearing to 31.2%.
CHIEF EXECUTIVE OFFICER’S REPORT
1 KpMG industry data 1 July 2014 to 30 June 2015.
2 Regional tAM All people 0600–2359 1 July 2014 to 30 June 2015.
2
For
per
sona
l use
onl
y

meDIa reform pRIMe is advocating changes to existing media ownership and control laws that allow unlicensed and unregulated competitors to operate in its licenced tV markets, while restricting the options available to pRIMe and its industry peers.
pRIMe has been a leading voice in the efforts to remove three key pieces of broadcasting regulation: the audience reach rule that prevents a television licensee from reaching more than 75% of the total Australian audience; the repeal of the 2 out of 3 rule that prevents a media company from owning tV, radio and newspapers in one market; and a reduction in licence fees, which are significantly higher than those paid elsewhere in the world. Removal of these outdated regulations will enable regional television companies, like pRIMe, to reorganise themselves in the most economically efficient manner.
the Company will continue to pursue regulatory change that benefits its industry, regional audiences, advertisers and ultimately our shareholders.
Shareholders can apprise themselves of the issues in detail by visiting the industry website www.saveourvoices.com.au.
Ian Audsley CHIEF EXECUTIVE OFFICER
hIGhLIGhtS
$258.8mREVEnuE
$66.9mEBItDA
$33.4mCORE nEt PROFIt AFtER tAX^
6.8¢ per shareFull YEAR DIVIDEnD
^ excludes non-core specif ic i tems.
3Prime media GrouP AnnuAl REPORt 2015
For
per
sona
l use
onl
y

Your directors submit their report for the year ended 30 June 2015.
DIreCtorSthe names and details of the Company’s directors in office during the financial year and until the date of this report are set out below. Directors were in office for this entire period unless otherwise stated.
nameS, quaLIfICatIonS, experIenCe anD SpeCIaL reSponSIBILItIeS
John k. hartIGan
non-executive Chairman (appointed 15 may 2014)
Mr Hartigan headed news Corporation’s Australian operations as Chairman and Chief executive officer of news limited (now known as news Corp Australia). He was also a director of FoXtel and chairman of Australian news Channel, which owns and operates Sky news. He has worked in advisory positions for the American Australian Association and the nSW export and Investment Advisory Board. Mr Hartigan is a trustee of the Sydney Cricket and Sports Ground trust, is Chairman of Destination nSW and is a director of the Australian paralympic Committee.
mIChaeL S. SIDDLe
non-executive Director (appointed 17 april 1985)
Mr Siddle has been a director of the Company since 1985 and was a member of the Audit and Risk Committee until 4 August 2015. He is also Chairman of Ramsay Health Care limited and a trustee of the paul Ramsay Foundation.
aLexanDer a. hamILL
non-executive Director (appointed 2 october 2003)
Mr Hamill has worked in marketing and advertising in Australia and globally for over 45 years. Mr Hamill was the media director of the Australian olympic team in Sydney, Athens and Beijing. Mr Hamill is a member of the Remuneration and nomination Committee.
Ian r. neaL
non-executive Director (appointed 6 June 2008)
Mr neal is a Chair for the executive Connection and consults on business strategy and implementation from a perspective of maximising shareholder value. Mr neal was co-founder and managing director of nanyang Ventures pty limited from 1993 to 2004. Mr neal’s professional background is in financial markets, commencing as an equities analyst and moving to various banking positions until establishing nanyang Ventures. Mr neal is a life member of the Financial Services Institute of Australia, a previous national president of the Securities Institute of Australia and was a member of the first Corporate Governance Council which established the Corporate Governance Guidelines. Mr neal is Chairman of the Remuneration and nomination Committee and a member of the Audit and Risk Committee.
peter J. maCourt
non-executive Director (appointed 1 September 2014)
Mr Macourt is currently Chairman of SKY network television limited and Virtus Health limited. He is also a former director and chief operating officer of news limited and a former director of FoXtel and Independent newspapers limited. Mr Macourt is Chairman of the Audit and Risk Committee and was a member of the Remuneration and nomination Committee until 4 August 2015.
DIReCtoRS’rePort
4
For
per
sona
l use
onl
y
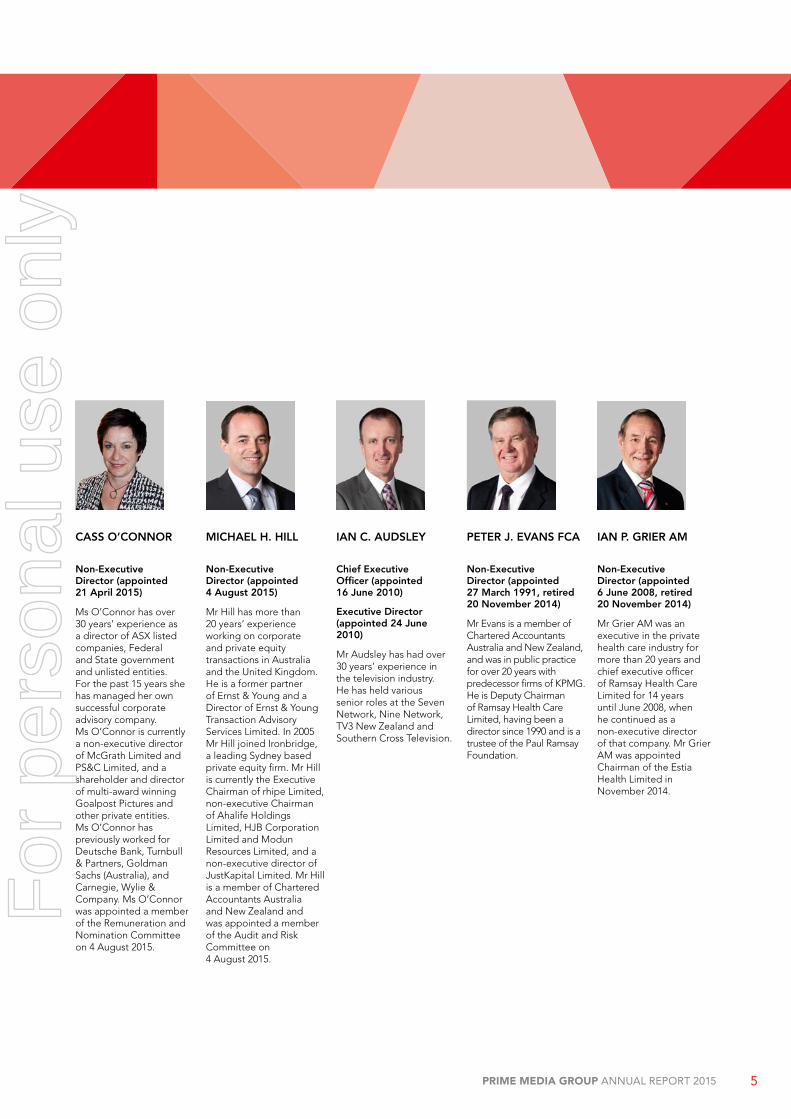
CaSS o’Connor
non-executive Director (appointed 21 april 2015)
Ms o’Connor has over 30 years’ experience as a director of ASX listed companies, Federal and State government and unlisted entities. For the past 15 years she has managed her own successful corporate advisory company. Ms o’Connor is currently a non-executive director of McGrath limited and pS&C limited, and a shareholder and director of multi-award winning Goalpost pictures and other private entities. Ms o’Connor has previously worked for Deutsche Bank, turnbull & partners, Goldman Sachs (Australia), and Carnegie, Wylie & Company. Ms o’Connor was appointed a member of the Remuneration and nomination Committee on 4 August 2015.
mIChaeL h. hILL
non-executive Director (appointed 4 august 2015)
Mr Hill has more than 20 years’ experience working on corporate and private equity transactions in Australia and the united Kingdom. He is a former partner of ernst & Young and a Director of ernst & Young transaction Advisory Services limited. In 2005 Mr Hill joined Ironbridge, a leading Sydney based private equity firm. Mr Hill is currently the executive Chairman of rhipe limited, non-executive Chairman of Ahalife Holdings limited, HJB Corporation limited and Modun Resources limited, and a non-executive director of JustKapital limited. Mr Hill is a member of Chartered Accountants Australia and new Zealand and was appointed a member of the Audit and Risk Committee on 4 August 2015.
Ian C. auDSLey
Chief executive officer (appointed 16 June 2010)
executive Director (appointed 24 June 2010)
Mr Audsley has had over 30 years’ experience in the television industry. He has held various senior roles at the Seven network, nine network, tV3 new Zealand and Southern Cross television.
peter J. eVanS fCa
non-executive Director (appointed 27 march 1991, retired 20 november 2014)
Mr evans is a member of Chartered Accountants Australia and new Zealand, and was in public practice for over 20 years with predecessor firms of KpMG. He is Deputy Chairman of Ramsay Health Care limited, having been a director since 1990 and is a trustee of the paul Ramsay Foundation.
Ian p. GrIer am
non-executive Director (appointed 6 June 2008, retired 20 november 2014)
Mr Grier AM was an executive in the private health care industry for more than 20 years and chief executive officer of Ramsay Health Care limited for 14 years until June 2008, when he continued as a non-executive director of that company. Mr Grier AM was appointed Chairman of the estia Health limited in november 2014.
5Prime media GrouP AnnuAl REPORt 2015
For
per
sona
l use
onl
y
Directors’ report
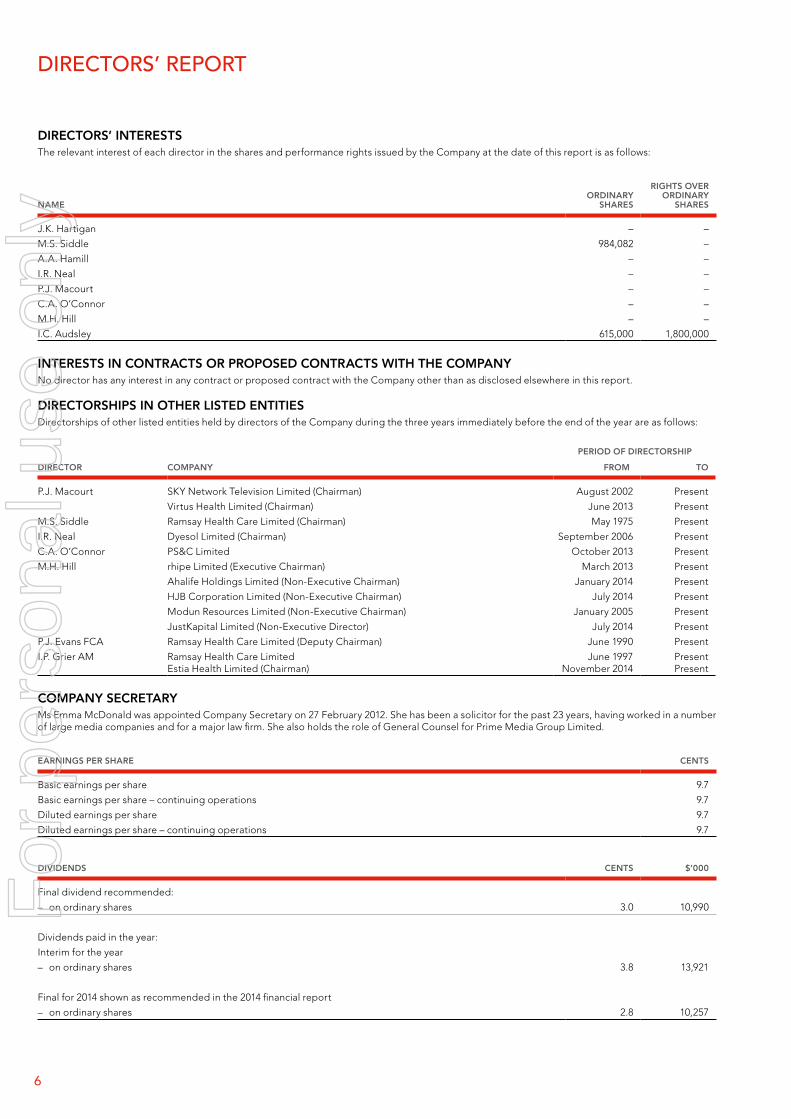
DIRECTORS’ INTERESTSThe relevant interest of each director in the shares and performance rights issued by the Company at the date of this report is as follows:
NAMEORDINARY
SHARES
RIGHTS OVER ORDINARY
SHARES
J.K. Hartigan – –
M.S. Siddle 984,082 –
A.A. Hamill – –
I.R. Neal – –
P.J. Macourt – –
C.A. O’Connor – –
M.H. Hill – –
I.C. Audsley 615,000 1,800,000
INTERESTS IN CONTRACTS OR PROPOSED CONTRACTS WITH THE COMPANYNo director has any interest in any contract or proposed contract with the Company other than as disclosed elsewhere in this report.
DIRECTORSHIPS IN OTHER LISTED ENTITIESDirectorships of other listed entities held by directors of the Company during the three years immediately before the end of the year are as follows:
DIRECTOR COMPANY
PERIOD Of DIRECTORSHIP
fROM TO
P.J. Macourt SKY Network Television Limited (Chairman) August 2002 Present
Virtus Health Limited (Chairman) June 2013 Present
M.S. Siddle Ramsay Health Care Limited (Chairman) May 1975 Present
I.R. Neal Dyesol Limited (Chairman) September 2006 Present
C.A. O’Connor PS&C Limited October 2013 Present
M.H. Hill rhipe Limited (Executive Chairman) March 2013 Present
Ahalife Holdings Limited (Non-Executive Chairman) January 2014 Present
HJB Corporation Limited (Non-Executive Chairman) July 2014 Present
Modun Resources Limited (Non-Executive Chairman) January 2005 Present
JustKapital Limited (Non-Executive Director) July 2014 Present
P.J. Evans FCA Ramsay Health Care Limited (Deputy Chairman) June 1990 Present
I.P. Grier AM Ramsay Health Care LimitedEstia Health Limited (Chairman)
June 1997November 2014
PresentPresent
COMPANY SECRETARYMs Emma McDonald was appointed Company Secretary on 27 February 2012. She has been a solicitor for the past 23 years, having worked in a number of large media companies and for a major law firm. She also holds the role of General Counsel for Prime Media Group Limited.
EARNINGS PER SHARE CENTS
Basic earnings per share 9.7
Basic earnings per share – continuing operations 9.7
Diluted earnings per share 9.7
Diluted earnings per share – continuing operations 9.7
DIVIDENDS CENTS $’000
Final dividend recommended:
– on ordinary shares 3.0 10,990
Dividends paid in the year:
Interim for the year
– on ordinary shares 3.8 13,921
Final for 2014 shown as recommended in the 2014 financial report
– on ordinary shares 2.8 10,257
6
For
per
sona
l use
onl
y

Directors’ report
PRINCIPAL ACTIVITIESThe principal activities of Prime Media Group Limited during the year were the provision of free to air commercial television broadcasting services in the following regional areas (excluding capital cities):
• Northern New South Wales and the Gold Coast;• Southern New South Wales and the Australian Capital Territory;• Victoria and Mildura; and• Western Australia.
The majority of the Group’s television programming is supplied through an affiliation agreement with the Seven Network and broadcast in regional areas under the PRIME7 brand on the east coast and the GWN7 brand in regional Western Australia.
OPERATING AND fINANCIAL REVIEW
CONSOLIDATED RESuLTS fROM CONTINuING OPERATIONS AND DISCONTINuED OPERATIONSThe Group’s consolidated net profit after tax from continuing and discontinued operations attributable to the members of Prime Media Group Limited for the year ended 30 June 2015 of $35,621,000 (2014: $33,852,000) represents an increase of $1,769,000 or 5.2% on the previous corresponding period.
STATuTORY RESuLTS fROM CONTINuING OPERATIONS The Company’s statutory consolidated net profit after tax from continuing operations attributable to the members of Prime Media Group Limited for the year ended 30 June 2015 was $35,621,000 (2014: $31,188,000), which represents an increase of $4,433,000 or 14.2% on the previous corresponding period. The following non-core items increased the Company’s statutory net profit after tax by $2,208,000:
• Gain on sale of surplus property at Wagga Wagga, New South Wales of $1,157,000;
• Non-cash revenue of $1,501,000 to recognise broadcast equipment received under a Federal Government program to restack digital television services and cease television broadcasting in the digital dividend band (694- 820 MHz). The program was completed in the current reporting period.
Revenue from continuing operations of $258,813,000 was down 0.6% or $1,464,000 compared to the previous corresponding period. The Group derives its primary source of revenue from the sale of television advertising. During the reporting period, the Company improved its revenue share in the combined aggregated market of Northern New South Wales, Southern New South Wales and Victoria by 1.3 share points. As a result, revenue from television advertising fell by only 0.7% despite the market falling by 3.9% on the previous corresponding period.
The Group’s gross profit margin from continuing operations was 46.4% compared to 47.0% in the previous corresponding period. The decline in gross profit margin was largely due to increases in program affiliation costs and other sales related costs.
The Group’s total operating expenses of $53,038,000 were $4,257,000 or 7.4% down on the previous corresponding period, mainly due to a reduction in broadcast and transmission expenses. Employee costs of $38,823,000, represents an increase of $42,000 or 0.1% on the previous corresponding period.
Finance costs of $4,987,000 were 23.3% less than the previous corresponding reporting period, largely due to lower average debt levels.
DISCONTINuED OPERATIONS There were no discontinued operations in the current year. In the previous corresponding period, the Group completed the sale of its radio business on 30 August 2013, which resulted in a gain on sale from radio operations of $2,302,000. Revenue from discontinued radio operations for the two month period to the date of sale was $3,499,000, resulting in a net profit after tax of $362,000.
CORE NET PROfIT AfTER TAxCore net profit after tax and before specific items was $33,468,000 (2014: $33,395,000), representing an increase of $73,000 or 0.2% on the previous corresponding period. The prior year result included the Group’s Radio operations for a 2 month period. The Group’s final dividend has been declared based on the core net profit after tax as follows:
2015$’000
2014$’000
Reported profit after tax from continuing operations 35,621 31,188
Reported profit after tax from discontinued operations – 2,664
35,621 33,852
Digital Restack Program Revenue (non-cash) (1,501) –
Gain on sale of surplus assets (1,157) (2,302)
Redundancies 78 626
Derecognise deferred tax asset carried for New Zealand tax losses – 1,296
Depreciation of decommissioning costs – 604
Fair value change in receivable – deferred contingent consideration – (493)
Income tax expense/(benefit) related to specific items 427 (188)
Core net profit after tax from continuing and discontinued operations, and before specific items 33,468 33,395
SHAREHOLDER RETuRNSThe Company’s total shareholder return has fallen during the reporting period notwithstanding that most other financial measures improved in the current year. The closing share price at 30 June 2015 was $0.69 (2014: $1.05).
2015 2014
Core Earnings Per Share (cents per share)* 9.1 9.1
Statutory Earnings Per Share (cents per share) 9.7 9.2
Core Return on Assets (ROA) %* 11.0 10.5
Statutory Return on Assets (ROA) % 11.7 10.7
Weighted Average Cost of Capital (pre-tax) (%) 10.95 10.96
Core Return on Equity (ROE) (%)*^ 19.2 20.6
Statutory Return on Equity (ROE) (%) 20.5 20.9
Net Debt / Net Debt + Equity Ratio (%) 31.2 39.7
Share price ($) 0.69 1.05
Dividends per share (cents) 6.8 6.8
Total Shareholder Return (%) (27.8) 10.7
* These returns have been calculated using core net profit after tax as set out at Note 9(d) of this report.
^ Equity has been normalised for the impact of items disclosed as specific items.
7Prime media GrouP AnnuAl RepoRt 2015
For
per
sona
l use
onl
y

Directors’ report
OPERATING AND fINANCIAL REVIEW (CONTINuED)
STATEMENT Of fINANCIAL POSITION AND CASH fLOWDuring the reporting period, the Group’s operating cash flows increased by $15,409,000 to $57,970,000. The increase in operating cash flows was primarily due to improved management of working capital and reductions in income tax and borrowing costs. The reduction in income tax was due to a one-off deduction for program rights acquired in the previous corresponding period. The reduction in borrowing costs was due to lower average interest bearing debt for the year.
Net cash flows used in investing activities of $4,544,000 (2014 (from) $8,807,000) related to capital expenditure, mainly for broadcast and computer equipment totalling $5,839,000. Net cashflows from investing activities included the proceeds from the sale of surplus property in Wagga Wagga, New South Wales.
A further $605,000 was used to fund Prime’s interest in associates, being ventures with WIN Corporation to broadcast the TEN television signal in Mildura and regional Western Australia.
CAPITAL STRuCTuREThe Company’s secured bank loan facility with the ANZ decreased to $88,064,000 as at 30 June 2015 (2014: $118,727,000). The Group continues to comfortably operate within the terms of its debt facility with the ANZ, which matures March 2018.
2015$’000
2014$’000
Interest-bearing loan and finance lease contracts 88,736 119,645
Cash and short term deposits (9,837) (12,722)
Net debt 78,899 106,923
Total equity 173,876 162,240
Total capital employed 252,775 269,163
Gearing 31.2% 39.7%
The profile of the Group’s debt finance is as follows:
2015$’000
2014$’000
Current
Obligations under finance leases 270 246
270 246
Non-current
Obligations under finance leases 402 672
Secured bank loan facility 88,064 118,727
88,466 119,399
Total interest bearing liabilities 88,736 119,645
RISK MANAGEMENTThe Group’s approach to risk management is addressed in the Corporate Governance Statement, which is available on the Company’s website www.primemedia.com.au. The Board is responsible for ensuring that risks, and also opportunities, are identified on a timely basis and that the Group’s objectives and activities are aligned with the risks and opportunities identified by the Board.
The Board has a number of mechanisms in place to ensure that management’s objectives and activities are aligned with the risks identified by the Board. These include the following:
• Board approval of strategic plans, which encompass the Group’s vision, mission and strategy statements, designed to meet stakeholders’ needs and manage business risk; and
• implementation of Board approved operating plans and budgets and Board monitoring of progress against these budgets, including monitoring of financial and non-financial Key Performance Indicators (‘KPIs’).
As part of its risk management framework, the Company has identified the following key risks that may affect the Group’s financial performance:
• fluctuations in consumer demand that impact advertising revenues, which the Company manages by ensuring it continues to maintain a strong advertising sales team and strong relationships with advertisers and agencies;
• change to the operating, market or regulatory environment as a result of changes in government media policy, which the Company seeks to manage by engaging with policy-makers and stakeholders to ensure that the interests of the Company and its security holders are represented; and
• impact of new media technologies, which the Company monitors to assess and manage its risk.
SIGNIfICANT CHANGES IN THE STATE Of AffAIRSThere were no significant changes in the Group’s state of affairs.
SIGNIfICANT EVENTS AfTER THE BALANCE DATEOn 28 July 2015, the Company announced that it had begun broadcasting the Victorian Racing.com racing network to the viewing areas of regional Northern New South Wales, Gold Coast, Southern New South Wales, the Australian Capital Territory, Victoria and Western Australia on Channel 68.
LIKELY DEVELOPMENTS AND ExPECTED RESuLTSThe Board and Executive consider that the future performance of the Group will be influenced by the outlook for television advertising in regional Australia and changes in media technologies that may result in new entrants accessing advertising markets and consumers in regions where the Group holds licences to broadcast free-to-air television. The Company is of the view that changes in legislation specific to the media industry are required to optimise returns to shareholders.
8
For
per
sona
l use
onl
y

Directors’ report
PERfORMANCE RIGHTS (EQuITY)
uNISSuED SHARESAt the date of this report there were 4,527,438 (2014: 3,976,000) unissued ordinary shares under the Prime Media Group Limited Performance Rights Plan that are yet to vest. Refer to Note 27 of the financial statements for further information.
Performance rights holders do not have any right, by virtue of the performance right, to participate in any share issue of the Company or any related body corporate.
SHARES ISSuED OR ACQuIRED AS A RESuLT Of THE ExERCISE Of PERfORMANCE RIGHTSDuring the financial year, 966,000 ordinary shares were acquired on market by the Trustee of the Prime Media Group Limited Performance Rights Plan as a result of the vesting and exercise of rights under the Plan.
INDEMNIfICATION AND INSuRANCE Of DIRECTORS AND OffICERSIn accordance with the Corporations Act 2001, the directors disclose that the Company has a Directors’ and Officers’ Liability policy covering each of the directors and certain executive officers for liabilities incurred in the performance of their duties and as specifically allowed under the Corporations Act 2001. During the year, the Company paid premiums totalling $107,850 (2014: $107,500) in relation to the Directors’ and Officers’ Liability policy. The terms of the policy specifically prohibit the disclosure of any other details relating to the policy. The Company has also executed a deed of access, indemnity and insurance with Directors and Officers in their capacity for the Company, its subsidiaries and related parties.
INDEMNIfICATION Of AuDITORSTo the extent permitted by law, the Company has agreed to indemnify its auditors, Ernst & Young, as part of the terms of its audit engagement agreement against claims by third parties arising from the audit (for an unspecified amount). No payment has been made to indemnify Ernst & Young during or since the financial year.
DIRECTORS’ MEETINGS AND COMMITTEE MEMBERSHIPThe number of meetings of directors, including meetings of committees of directors, held during the year and the numbers of meetings attended by each Director were as follows:
BOARD MEETINGS
AuDIT AND RISK
COMMITTEE MEETING
STRATEGYCOMMITTEE
REMuNERATION AND NOMINATION
COMMITTEE MEETING
Number of meetings held: 8 3 5 4
Number of meetings attended:
J.K. Hartigan^ 8 – 5 –
M.S. Siddle^^ 7 1 – –
A.A. Hamill 7 – – 1
I.R. Neal 8 3 4 4
P.J. Macourt (Appointed 1 Sept 2014)* 6 2 5 3
C.A. O’Connor (Appointed 21 April 2015)* 2 – 1 –
I.C. Audsley 8 – 5 –
P.J. Evans FCA (Retired 20 Nov 2014)* 5 1 – 1
I.P. Grier AM (Retired 20 Nov 2014)* 5 1 – 1
* indicates maximum number of meetings the director was eligible to attend during the period.^ attended the Remuneration and Nomination Committee meetings held on 21 August 2014 and 10 April 2015.
^^ attended the Remuneration and Nomination Committee meeting held on 20 February 2015.
9Prime media GrouP AnnuAl RepoRt 2015
For
per
sona
l use
onl
y

Directors’ report
REMuNERATION REPORT (AuDITED)The Board is pleased to present the Remuneration Report for the year ended 30 June 2015 which outlines the remuneration arrangements of the Company and the Group in accordance with the requirements of the Corporations Act 2001 (the Act) and its regulations. This information has been audited as required by section 308(3C) of the Act.
The Remuneration Report is presented under the following sections:
1. Introduction2. Remuneration governance3. Executive remuneration arrangements4. Executive remuneration outcomes for 2015 (including link to
performance) 5. Executive contracts6. Non-executive directors’ remuneration arrangements
(including statutory remuneration disclosures)7. Additional statutory disclosures8. Corporate Governance
1. INTRODuCTIONThe Remuneration Report details the remuneration arrangements for key management personnel (KMP) who are defined as those persons having authority and responsibility for planning, directing and controlling the major activities of the Group, directly or indirectly, including any director (whether executive or otherwise).
For the purposes of this report, the term ‘executive’ includes the Chief Executive Officer (CEO), executive directors, senior executives, and secretaries of the Company and the Group.
Details of Key Management Personnel of the Company and Group are set out below:
DirectorsJ.K. Hartigan Chairman (non-executive)
M.S. Siddle Deputy Chairman (non-executive)
A.A. Hamill Director (non-executive)
I.R. Neal Director (non-executive)
P.J. Macourt Director (non-executive appointed 1 September 2014)
C.A. O’Connor Director (non-executive appointed 21 April 2015)
I.C. Audsley Director (Chief Executive Officer)
P.J. Evans FCA Director (non-executive retired 20 November 2014)
I.P. Grier AM Director (non-executive retired 20 November 2014)
executivesD. Walker Group General Manager Sales and Marketing
J. Palisi Chief Financial Officer (CFO)
S. Wood Group General Manager Operations
E. McDonald General Counsel and Company Secretary
A. Hogarth General Manager Network Sales
As previously reported, Mr Michael Hill was appointed as a non-executive director after the reporting date and before the date the financial report was authorised for issue.
2. REMuNERATION GOVERNANCE
REMuNERATION AND NOMINATION COMMITTEEThe Board has appointed a Remuneration and Nomination Committee consisting of three independent non-executive directors (NEDs) to, amongst various responsibilities, review and make recommendations to the Board regarding the Group’s:
• executive management remuneration and incentives;• executive management performance against agreed performance
targets; and• the remuneration framework for directors.
The Remuneration and Nomination Committee meets throughout the year. The CEO and Company Secretary have attended certain Remuneration and Nomination Committee meetings by invitation, where management input is required. The CEO and Company Secretary are not present during any discussions relating to their own remuneration arrangements. Further information on the Remuneration and Nomination Committee’s role, responsibilities and membership is available at www.primemedia.com.au.
REMuNERATION CONSuLTANTSTo ensure the Board is fully informed when making decisions, the Remuneration and Nomination Committee has formalised policies that govern arrangements to engage independent remuneration consultants to provide independent advice and, where required, to make remuneration recommendations, free from the undue influence by members of the KMP.
Godfrey Remuneration Group (GRG) was engaged during the reporting period to provide advice on various remuneration issues and to value rights issued under the Prime Media Group Performance Rights Plan. The Committee is satisfied that the advice received from GRG is free from undue influence from members of the KMP. GRG’s fees in the current reporting period totalled $9,350 (2014: $30,000).
CRA Plan Managers Pty Limited also provided remuneration services to the Group in the previous corresponding period and received fees totaling $5,732.
10
For
per
sona
l use
onl
y

Directors’ report
3. ExECuTIVE REMuNERATION ARRANGEMENTS
REMuNERATION PRINCIPLES AND STRATEGYThe Company’s executive remuneration strategy aims to attract, motivate and retain high performing individuals and align the interests of executives and shareholders.
To this end, key objectives of the Company’s reward framework are to ensure that remuneration practices:
• are aligned to the Group’s business strategy;• offer competitive remuneration benchmarked against the external market;• provide strong linkage between individual and Group performance and rewards; and• align the interest of executives and shareholders.
REMuNERATION COMPONENT VEHICLE PuRPOSE LINK TO PERfORMANCE
Fixed remuneration • Represented by total employment cost (TEC);
• Comprises base salary, superannuation contributions and other discretionary and non-discretionary benefits.
• To provide competitive fixed remuneration set with reference to role, market and experience.
• Company and individual performance are considered during the annual review process.
STI component • Paid in cash. • Rewards executives for their contribution to achievement of Group and business unit outcomes, as well as individual Key Performance Indicators (KPIs).
• EBITDA;• Core NPAT; • Divisional financial performance;• Operational performance;• Power ratio; and• Risk management including
commitment to Work Health Safety.
LTI component • Awards are made in the form of performance rights.
• Rewards executives for their contribution to the creation of shareholder value over the longer term.
• Performance rights are subject to achieving core EPS and power ratio targets.
APPROACH TO SETTING REMuNERATIONThe Group aims to reward executives with a level and mix of remuneration commensurate with their position and responsibilities within the Group and aligned with market practice.
The Remuneration and Nomination Committee reviews TEC annually against the median of its direct industry peers and other Australian listed entities of a similar size and complexity. KMP remuneration is benchmarked against industry peers and remuneration levels reviewed having regard for market data, insights into remuneration trends, the performance of the Company and individual, and the broader economic environment.
DETAIL Of INCENTIVE PLANS
short term incentives (sti)The Group operates an annual STI program that is available to key management personnel and awards a cash bonus subject to attainment of clearly defined Group, business unit and individual measures.
The actual STI payments awarded to each executive depend on the extent to which specific targets set at the beginning of the financial year are met. The targets consist of a number of KPIs covering financial and non-financial, corporate and individual measures of performance. A summary of the measures and weightings is set out below:
PERfORMANCE MEASuRES
GROuP AND DIVISIONAL fINANCIAL PERfORMANCE MEASuRES:• Core NPAT• Group EBITDA• Expense management
GROuP AND DIVISIONAL fINANCIAL PERfORMANCE MEASuRES:• Power Ratio• Revenue Yield• Revenue generation
NON-fINANCIAL MEASuRES:• Strategic• Risk Management including
commitment to Work Health Safety
• Business Development and Growth Initiatives
CEO 60% – 40%
Other functional executives 0–70% 0–75% 0–70%
On an annual basis, after consideration of performance against KPIs, the Remuneration and Nomination Committee, in line with their responsibilities, determine the amount, if any, of the STI paid to each executive. This process usually occurs within three months after the reporting date. Payments made are delivered as a cash bonus in the following reporting period.
Long term incentives (Lti)LTI awards to executives are made annually under the Prime Media Group Limited Performance Rights Plan. The cumulative allocations represent less than 1.5% of the undiluted capital of the Group with a maximum income cost of $3,001,163 (2014: $2,718,142). The performance rights are available over a 36 month vesting period subject to continuing service and achieving the following targets:
• 60% of the rights will be subject to achievement of annual core earnings per share (EPS) targets; and • 40% of the rights will be subject to achievement of annual power ratio targets (revenue share: audience share).
The exercise price of the performance rights is nil. The rights will lapse 30 days after vesting date.
11Prime media GrouP AnnuAl RepoRt 2015
For
per
sona
l use
onl
y

Directors’ report
4. ExECuTIVE REMuNERATION OuTCOMES fOR 2015 (INCLuDING LINK TO PERfORMANCE)
COMPANY PERfORMANCE AND ITS LINK TO SHORT TERM INCENTIVES The financial performance measures driving STI payment outcomes are:
• core NPAT (defined as NPAT before specific non-core items); and• a power ratio greater than 1. The power ratio is a measure of the
Group’s share of revenue to the Group’s share of audience. A power ratio greater than 1 indicates that the Group is performing ahead of its audience share.
The following chart shows the Group’s core NPAT ($million) for the 5 year period ended 30 June 2015. Core NPAT is defined as statutory net profit after tax and before non-core items.
core NpAt ($ million)(Including discounted operations)
2011 2012 2013 20152014
$26.8
$33.2$35.4
$33.4
Core NPAT ($ million)including discounted operations
$33.5
sti Awards 2014 and 2015 Financial YearsFor the 2014 financial year, 100% of the STI cash bonus pool of $1,086,246 as previously accrued in that period vested to key management personnel and was paid in the 2015 financial year.
The Remuneration and Nomination Committee will consider the STI payments for the 2015 financial year in the first quarter of the 2016 financial year. The maximum STI cash bonus available for the 2015 financial year is $1,307,033. STI payments have been accrued at 100% of the maximum cash bonus available for the 2015 financial year based on individual executive’s actual performance against KPIs. Any adjustments between the actual amounts to be paid as determined by the Remuneration and Nomination Committee and the amounts accrued will be adjusted in the 2016 financial year. The minimum amount of the STI cash bonus, assuming that no executives meet their respective KPIs for the 2015 financial year, is nil.
COMPANY PERfORMANCE AND ITS LINK TO LONG TERM INCENTIVES The Company has adopted the following performance measures for the vesting of LTI performance rights:
• core EPS (defined as statutory EPS before specific non-core items); and• maintenance or growth of the power ratio greater than 1.
The following chart shows the Company’s core EPS over the 5 year period from 1 July 2010 to 30 June 2015. Core EPS is defined as statutory EPS before non-core items.
earnings per share(Cents per share)
2011 2012 2013 20152014
7.37.4 7.69.1 9.7 9.2 9.1 9.7 9.1
5.5
Fully Diluted EPS
Fully Diluted EPS (before non-core items)
Earnings Per Share (Cents per share)Lti awards During the financial year, 966,000 ordinary shares were acquired on market by the Trustee of the Prime Media Group Limited Performance Rights Plan as a result of the vesting and exercise of rights under the Plan. The LTI remuneration for each KMP is set out in within Table 1 and 2 of this section.
12
For
per
sona
l use
onl
y

Dir
ec
tor
s’ r
epo
rt
RE
Mu
NE
RA
TIO
N O
f K
EY
MA
NA
GE
ME
NT
PE
RSO
NN
EL
Of
THE
CO
MPA
NY
AN
D T
HE
GR
Ou
P
tab
le 1
: rem
uner
atio
n fo
r th
e ye
ar e
nded
30
June
201
5
SHO
RT-
TER
M B
EN
EfI
TS
PO
ST
EM
PLO
YM
EN
TLO
NG
-TE
RM
B
EN
EfI
TS
EQ
uIT
Y S
ET
TLE
D
SHA
RE
BA
SED
PA
YM
EN
TS
TOTA
LP
ER
fOR
MA
NC
E
RE
LATE
D
SALA
RY
& f
EE
S fO
R P
AR
EN
T E
NTI
TY
¹$
CA
SH B
ON
uS
$
NO
N-C
ASH
B
EN
EfI
TS
²$
SuP
ER
-A
NN
uA
TIO
N$
OTH
ER
LO
NG
TE
RM
BE
NE
fITS
³$
$$
%
No
n-e
xecu
tive
dir
ecto
rs
J.K
Har
tigan
(Cha
irm
an)
183,
06
6–
–17
,391
––
20
0,4
570.
0%
M.S
Sid
dle
94
,495
––
8,9
77–
–10
3,47
20.
0%
A.A
Ham
ill95
,00
0–
––
20,
00
0–
115,
00
00.
0%
I.R N
eal
95,0
00
––
––
–95
,00
00.
0%
P.J
Mac
our
t71
,74
3–
–6,
816
––
78,5
590.
0%
C.A
O’C
onn
or
16,3
51–
–1,
553
––
17,9
04
0.0
%
P.J
Eva
ns F
CA
3
4,6
42
––
3,2
91–
–37
,933
0.0
%
I.P G
rier
AM
34
,64
2–
–3,
291
––
37,9
330.
0%
Tota
l no
n-e
xecu
tive
dir
ecto
rs62
4,9
39–
–41
,319
20,
00
0–
68
6,25
80.
0%
Exe
cuti
ve d
irec
tors
I. A
udsl
ey81
8,2
99
50
0,0
00
–18
,78
39,
30
041
1,4
321,
757,
814
51.9
%
Key
man
age
men
t p
erso
nnel
D. W
alke
r4
40,
703
288,
533
5,67
318
,78
35,
993
170,
05
492
9,73
949
.3%
S. W
oo
d37
0,13
011
5,0
00
–18
,78
34
,64
015
0,67
46
59,2
274
0.3%
E. M
cDo
nald
376,
575
110,
00
0–
18,7
83
2,7
1312
2,3
29
63
0,4
00
36.9
%
J. P
alis
i33
0,5
4114
3,5
00
–18
,78
34
,46
514
3,11
56
40,
40
44
4.8
%
A. H
og
arth
294
,09
915
0,0
00
–18
,78
37,
64
681
,951
552
,479
42
.0%
Tota
l exe
cuti
ve K
MP
2,6
30,
347
1,
307
,033
5,
673
112
,698
3
4,7
57
1,07
9,55
5 5,
170,
06
3
Tota
l3,
255,
286
1,3
07,0
33
5,67
3 15
4,0
17
54
,757
1,
079,
555
5,8
56,3
21
¹ T
he a
mo
unts
dis
clo
sed
und
er t
his
cate
go
ry in
clud
e th
e in
crea
se in
ann
ual l
eave
acc
rued
for e
ach
KM
P d
urin
g t
he y
ear b
y vi
rtue
of t
heir
serv
ice.
² G
ross
ed u
p R
epo
rtab
le V
alue
.³
The
am
oun
ts d
iscl
ose
d u
nder
thi
s ca
teg
ory
rep
rese
nts
amo
unts
tha
t acc
rued
to
each
KM
P d
urin
g t
he y
ear b
y vi
rtue
of t
heir
serv
ice
and
do
not r
epre
sent
pay
men
ts m
ade.
13Prime media GrouP AnnuAl RepoRt 2015
For
per
sona
l use
onl
y
Dir
ec
tor
s’ r
epo
rt
4.
Ex
EC
uTI
VE
RE
Mu
NE
RA
TIO
N O
uTC
OM
ES
fOR
201
5 (IN
CLu
DIN
G L
INK
TO
PE
RfO
RM
AN
CE
) (C
ON
TIN
uED
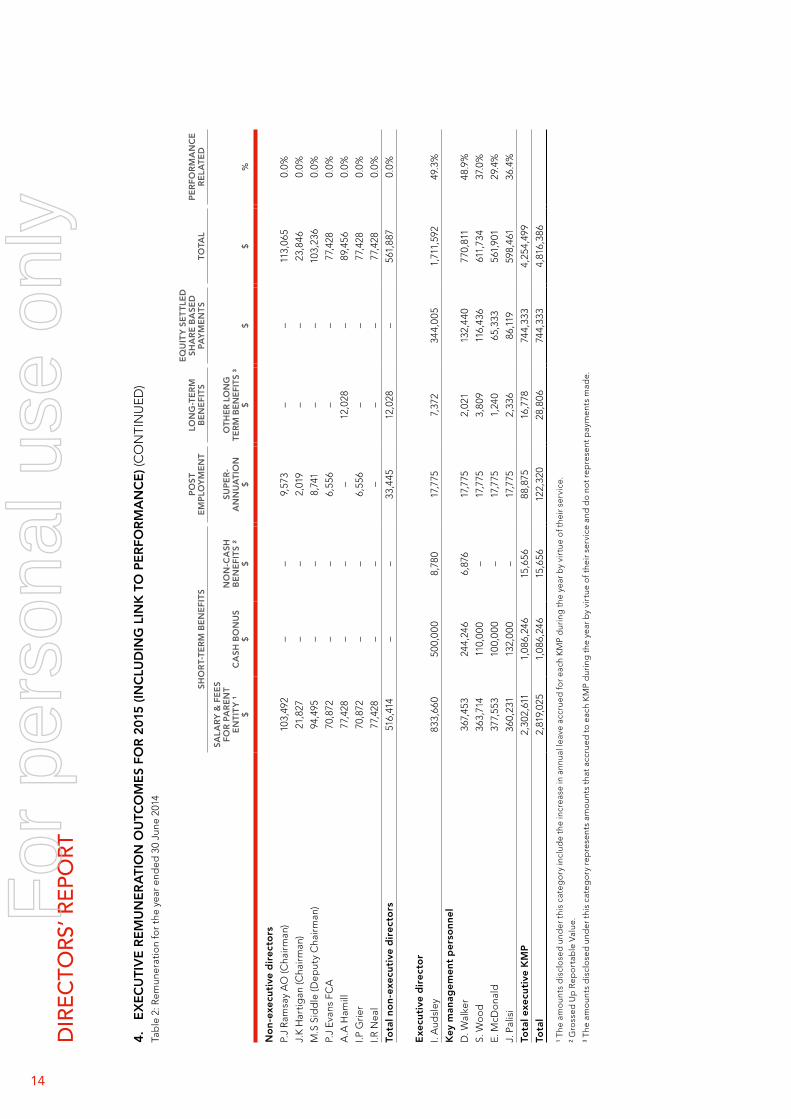
) Ta
ble
2: R
emun
erat
ion
for t
he y
ear e
nded
30
June
201
4
SHO
RT-
TER
M B
EN
EfI
TS
PO
ST
EM
PLO
YM
EN
TLO
NG
-TE
RM
B
EN
EfI
TS
EQ
uIT
Y S
ET
TLE
D
SHA
RE
BA
SED
PA
YM
EN
TS
TOTA
LP
ER
fOR
MA
NC
E
RE
LATE
D
SALA
RY
& f
EE
S fO
R P
AR
EN
T E
NTI
TY
¹$
CA
SH B
ON
uS
$
NO
N-C
ASH
B
EN
EfI
TS
²$
SuP
ER
-A
NN
uA
TIO
N$
OTH
ER
LO
NG
TE
RM
BE
NE
fITS
³$
$$
%
No
n-e
xecu
tive
dir
ecto
rs
P.J
Ram
say
AO
(Cha
irm
an)
103,
492
––
9,57
3–
–11
3,06
50.
0%
J.K
Har
tigan
(Cha
irm
an)
21,8
27–
–2,
019
––
23,8
460.
0%
M.S
Sid
dle
(Dep
uty
Cha
irm
an)
94,4
95–
–8,
741
––
103,
236
0.0%
P.J
Eva
ns F
CA
70,8
72–
–6,
556
––
77,4
280.
0%
A.A
Ham
ill77
,428
––
–12
,028
–89
,456
0.0%
I.P G
rier
70,8
72–
–6,
556
––
77,4
280.
0%
I.R N
eal
77,4
28–
––
––
77,4
280.
0%
Tota
l no
n-e
xecu
tive
dir
ecto
rs51
6,41
4–
–33
,445
12,0
28–
561,
887
0.0%
Exe
cuti
ve d
irec
tor
I. A
udsl
ey83
3,66
050
0,00
08,
780
17,7
757,
372
344,
005
1,71
1,59
249
.3%
Key
man
age
men
t p
erso
nnel
D. W
alke
r36
7,45
324
4,24
66,
876
17,7
752,
021
132,
440
770,
811
48.9
%
S. W
oo
d36
3,71
411
0,00
0–
17,7
753,
809
116,
436
611,
734
37.0
%
E. M
cDo
nald
377,
553
100,
000
–17
,775
1,24
065
,333
561,
901
29.4
%
J. P
alis
i36
0,23
113
2,00
0–
17,7
752,
336
86,1
1959
8,46
136
.4%
Tota
l exe
cuti
ve K
MP
2,30
2,61
11,
086,
246
15,6
5688
,875
16,7
7874
4,33
34,
254,
499
Tota
l2,
819,
025
1,08
6,24
615
,656
122,
320
28,8
0674
4,33
34,
816,
386
¹ The
am
oun
ts d
iscl
ose
d u
nder
thi
s ca
teg
ory
incl
ude
the
incr
ease
in a
nnua
l lea
ve a
ccru
ed fo
r eac
h K
MP
dur
ing
the
yea
r by
virt
ue o
f the
ir se
rvic
e.² G
ross
ed u
p R
epo
rtab
le V
alue
.
³ The
am
oun
ts d
iscl
ose
d u
nder
thi
s ca
teg
ory
rep
rese
nts
amo
unts
tha
t acc
rued
to
each
KM
P d
urin
g t
he y
ear b
y vi
rtue
of t
heir
serv
ice
and
do
not r
epre
sent
pay
men
ts m
ade.
14
For
per
sona
l use
onl
y

Directors’ report
Table 3: Prime Media Group Limited Performance Rights Plan
GRANTED TERMS AND CONDITIONS fOR EACH GRANT VESTED
2015 NuMBER GRANT DATE
fAIR VALuE PER PERfORMANCE
RIGHT AT GRANT DATE
ExERCISE PRICE PER
PERfORMANCE RIGHT ExPIRY DATE
fIRST ExERCISE DATE
LAST ExERCISE DATE NuMBER
Director
I. Audsley 600,000 20/11/2014 $0.6590 $0.00 20/12/2017 20/11/2017 20/12/2017 –
I. Audsley – 23/11/2011 – – – – – 615,000
Executive
S. Wood 200,000 27/8/2014 $0.8100 $0.00 26/9/2017 27/8/2017 26/9/2017 –
S. Wood – 30/9/2011 – – – – – 167,000
D. Walker 217,438 27/8/2014 $0.8100 $0.00 26/9/2017 27/8/2017 26/9/2017 –
D. Walker – 30/9/2011 – – – – – 184,000
J. Palisi 200,000 27/8/2014 $0.8100 $0.00 26/9/2017 27/8/2017 26/9/2017 –
E. McDonald 200,000 27/8/2014 $0.8100 $0.00 26/9/2017 27/8/2017 26/9/2017 –
A. Hogarth 100,000 27/8/2014 $0.8100 $0.00 26/9/2017 27/8/2017 26/9/2017 –
Total 1,517,438 966,000
GRANTED TERMS AND CONDITIONS fOR EACH GRANT VESTED
2014 NuMBER GRANT DATE
fAIR VALuE PER PERfORMANCE
RIGHT AT GRANT DATE
ExERCISE PRICE PER
PERfORMANCE RIGHT ExPIRY DATE
fIRST ExERCISE DATE
LAST ExERCISE DATE NuMBER
Director
I. Audsley 500,000 19/11/2013 $0.8410 $0.00 19/12/2016 19/11/2016 19/12/2016 –
Executive
S. Wood 200,000 19/11/2013 $0.8410 $0.00 19/12/2016 19/11/2016 19/12/2016 –
D. Walker 230,000 19/11/2013 $0.8410 $0.00 19/12/2016 19/11/2016 19/12/2016 –
J. Palisi 200,000 19/11/2013 $0.8410 $0.00 19/12/2016 19/11/2016 19/12/2016 –
E. McDonald 200,000 19/11/2013 $0.8410 $0.00 19/12/2016 19/11/2016 19/12/2016 –
Total 1,330,000 $0.8410 $0.00 – –
Table 4: Value of performance rights granted, exercised, lapsed or cancelled during the year
VALuE Of PERfORMANCE RIGHTS GRANTED
DuRING THE YEAR^$
VALuE Of PERfORMANCE RIGHTS
ExERCISED DuRING THE YEAR*
$
VALuE Of PERfORMANCE RIGHTS LAPSED
DuRING THE YEAR$
VALuE Of PERfORMANCE RIGHTS
CANCELLED DuRING THE YEAR$
I. Audsley 395,400 533,998 – –
D. Walker 176,342 184,920 – –
S. Wood 162,200 167,835 – –
J. Palisi 162,200 – – –
E. McDonald 162,200 – – –
A. Hogarth 81,100 – – –
Total 1,139,442 886,753 – –
^ Determined at the time of grant per AASB 2.
* Determined at the time of exercise.
For details on the valuation of the performance rights, including models and assumptions used, please refer to Note 27. There were no alterations to the terms and conditions of performance rights granted as remuneration since their grant date. The maximum grant payable assuming that all service and performance criteria were met, was equal to the number of rights granted multiplied by the fair value at the grant date. The minimum payable assuming that service and performance criteria were not met was nil.
15Prime media GrouP AnnuAl RepoRt 2015
For
per
sona
l use
onl
y

Directors’ report
5. ExECuTIVE CONTRACTSRemuneration arrangements for KMP are formalised in employment agreements. Details of these contracts are provided below:
CHIEf ExECuTIVE OffICER (CEO)During the reporting period, Mr Audsley, was employed under a rolling contract as follows:
• The CEO receives total fixed remuneration of $800,000 per annum;• The CEO’s maximum STI opportunity is 65% of annual TEC;• The CEO is eligible to participate in the Prime Media Group Limited Performance Rights Plan on terms determined by the Board, subject to prior
shareholder approval, as required;• The CEO is entitled to 6 weeks annual leave;• The CEO may resign from his position and terminate his contract by giving 12 months written notice. The Company may elect to provide 12 months
payment in lieu of the notice period, or a combination of notice and payment in lieu of notice. Payment in lieu of notice will be based on fixed remuneration;
• The CEO’s employment may be terminated by the Company providing 12 months written notice. The Company may elect to provide 12 months payment in lieu of the notice period, or a combination of notice and payment in lieu of notice. Payment in lieu of notice will be based on fixed remuneration and any short term incentive amounts for the prior year;
• The CEO’s employment contract may be terminated by the Company at any time without notice if serious misconduct has occurred. Where termination with cause occurs the CEO is only entitled to that portion of his remuneration contract that is fixed, and only to the date of termination; and
• The Company or the CEO may terminate the contract within 12 months of the Company ceasing to be listed on the official list of the Australian Securities Exchange (ASX) or a material diminution in the CEO’s functions, status or duties. In these circumstances, the Company must provide 12 months written notice or 12 months payment in lieu of notice, or a combination thereof.
OTHER KEY MANAGEMENT PERSONNELDuring the reporting period, Mr Walker, Group General Manager Sales and Marketing, was employed on a fixed term contract that commenced on 1 July 2014. The Group General Manager Sales and Marketing’s employment may be terminated by the Company at any time without notice if serious misconduct has occurred. Where termination with cause occurs Mr Walker is only entitled to that portion of his remuneration contract that is fixed, and only to the date of termination.
Mr Hogarth, General Manager Network Sales, is employed under a rolling contract with no fixed term. Mr Hogarth’s employment may be terminated by either party providing 12 months written notice or payment in lieu of notice (based on the fixed component of his remuneration and at the discretion of the Company). The Company may terminate the contract for performance by (at its discretion) giving 6 months written notice or 3 months written notice where the Company has advised the executive of his failure to perform. In this case the Company has the discretion to make a payment in lieu of notice or the unexpired portion of the notice period. The Company may terminate immediately for serious misconduct. Where termination with cause occurs Mr Hogarth is only entitled to that portion of remuneration that is fixed and accrued up to the date of termination.
All other KMPs are employed under rolling contracts with no fixed term. Each KMP’s employment may be terminated by either party providing 6 months written notice or payment in lieu of notice (based on the fixed component of the executive’s remuneration and at the discretion of the Company). The Company may terminate the contract for performance by (at its discretion) giving 6 months written notice or 3 months written notice where the Company has advised the executive of their failure to perform. In this case the Company has the discretion to make a payment in lieu of notice or the unexpired portion of the notice period. The Company may terminate immediately for serious misconduct. Where termination with cause occurs the KMP is only entitled to that portion of remuneration that is fixed and accrued up to the date of termination.
6. NON-ExECuTIVE DIRECTORS’ REMuNERATION (INCLuDING STATuTORY REMuNERATION DISCLOSuRES)
REMuNERATION POLICYThe Board seeks to aggregate remuneration at the level that provides the Company with the ability to attract and retain directors of the highest calibre, whilst incurring a cost that is acceptable to shareholders.
The amount of the aggregate remuneration sought to be approved by shareholders and the fee structure is reviewed annually against fees paid to NEDs of comparable companies. The Board also considers advice from external consultants when undertaking the annual review process. The aggregate fees paid to NEDs in the current financial year were $686,258.
NED fees in the 2016 financial year are estimated to be $659,000, which is less than the determination made at the Annual General Meeting held in November 2007 when shareholders approved an aggregate fee pool of $750,000 per annum (excluding superannuation and retirement benefits arising from the Directors’ remuneration plan).
STRuCTuREThe remuneration of NEDs consists of directors’ fees, consisting of a fixed annual fee. One NED is currently entitled to benefits under the Directors’ Retirement Plan, approved by shareholders in November 1997. These fees are summarised in Table 1 and 2 under section 4 above. The Directors’ Retirement Plan was discontinued in the 2008 financial year for all directors appointed after that date.
16
For
per
sona
l use
onl
y

Directors’ report
7. ADDITIONAL STATuTORY DISCLOSuRES
AuDITOR INDEPENDENCE AND NON-AuDIT SERVICESThe Directors have received and are satisfied with the ‘Audit Independence Declaration’ provided by the Company’s external auditors, Ernst & Young, which is included on page 18.
NON-AuDIT SERVICES The following non-audit services were provided by the Group’s auditor, Ernst & Young. The directors are satisfied that the provision of the non-audit services is compatible with the general standard of independence for auditors imposed by the Corporations Act 2001. The nature and scope of each type of non-audit service provided means that the auditor’s independence was not compromised.
Ernst & Young received or are due to receive the following amounts for the provision of non-audit services:
$
Income tax return & goods and services tax compliance services 46,700
Advisory services 13,190
Total 59,890
8. CORPORATE GOVERNANCEIn recognising the need for the highest standards of corporate behaviour and accountability, the directors of Prime Media Group Limited support and have, unless otherwise disclosed in the corporate governance statement, adhered to the principles of corporate governance. The Company’s corporate governance statement is available on the Company website www.primemedia.com.au.
Signed in accordance with a resolution of the directors.
P. J MacourtDirector
Sydney, 26 August 2015
17Prime media GrouP AnnuAl RepoRt 2015
For
per
sona
l use
onl
y

AuDitor’s iNDepeNDeNce DecLArAtioN
Ernst & Young 680 George Street Sydney NSW 2000 Australia GPO Box 2646 Sydney NSW 2001
Tel: +61 2 9248 5555 Fax: +61 2 9248 5959 ey.com/au
Auditor’s Independence Declaration to the Directors of Prime Media Group Limited
In relation to our review of the financial report of Prime Media Group Ltd for the financial year ended 30 June 2015, to the best of my knowledge and belief, there have been no contraventions of the auditor independence requirements of the Corporations Act 2001 or any applicable code of professional conduct.
Ernst & Young
Christopher George Partner 26 August 2015
A member firm of Ernst & Young Global Limited Liability limited by a scheme approved under Professional Standards Legislation
18
For
per
sona
l use
onl
y

Notes to the FiNANciAL stAtemeNtsFor the YeAr eNDeD 30 JuNe 2015
fINANCIAL STATEMENTS CONTENTSCONSOLIDATED STATEMENT OF PROFIT OR LOSS AND OTHER COMPREHENSIVE INCOME 20
CONSOLIDATED STATEMENT OF FINANCIAL POSITION 21
CONSOLIDATED STATEMENT OF CHANGES IN EQuITY 22
CONSOLIDATED STATEMENT OF CASH FLOWS 23
NOTES TO THE fINANCIAL STATEMENTS1 CORPORATE INFORMATION 24
2 SuMMARY OF SIGNIFICANT ACCOuNTING POLICIES 24
3 SIGNIFICANT ACCOuNTING JuDGEMENTS, ESTIMATES AND ASSuMPTIONS 32
4 FINANCIAL RISK MANAGEMENT OBJECTIVES AND POLICIES 33
5 INCOME AND EXPENSES 35
6 INCOME TAX 36
7 OPERATING SEGMENTS 38
8 DISCOuNTED OPERATIONS 39
9 EARNINGS PER SHARE 40
10 DIVIDENDS PAID AND PROPOSED 41
11 CASH AND SHORT-TERM DEPOSITS 42
12 TRADE AND OTHER RECEIVABLES 43
13 OTHER ASSETS 43
14 INVESTMENTS IN ASSOCIATES 44
15 INVESTMENTS IN SuBSIDIARIES 45
16 INVESTMENTS – AVAILABLE-FOR-SALE FINANCIAL ASSETS 46
17 PROPERTY, PLANT AND EQuIPMENT 47
18 INTANGIBLE ASSETS AND GOODWILL 48
19 TRADE AND OTHER PAYABLES 50
20 INTEREST-BEARING LOANS AND BORROWINGS 50
21 PROVISIONS 51
22 CONTRIBuTED EQuITY 52
23 RETAINED EARNINGS AND RESERVES 53
24 COMMITMENTS 54
25 CONTINGENT LIABILITIES 55
26 EMPLOYEE BENEFIT LIABILITY 55
27 SHARE BASED PAYMENTS 56
28 SuBSEQuENT EVENTS 57
29 AuDITOR’S REMuNERATION 57
30 RELATED PARTY DISCLOSuRES 57
31 PARENT ENTITY INFORMATION 59
DIRECTORS’ DECLARATION 60
INDEPENDENT AuDIT REPORT 61
ASX ADDITIONAL INFORMATION 63
19Prime media GrouP AnnuAl RepoRt 2015
For
per
sona
l use
onl
y

coNsoLiDAteD stAtemeNt oF proFit or Loss AND other compreheNsive iNcomeFor the YeAr eNDeD 30 JuNe 2015
CONSOLIDATED
NOTES2015
$’0002014
$’000
CONTINuING OPERATIONS
Revenue and other income
Revenue from services 5(a) 253,233 256,342
Interest income 5(a) 245 290
Other income 5(a) 5,335 3,645
Total revenue and other income 258,813 260,277
Cost of sales (138,665) (137,918)
Gross profit 120,148 122,359
Broadcasting and transmission expenses (37,564) (41,651)
Sales, marketing and administration expenses (14,599) (14,811)
Depreciation and amortisation expenses (11,351) (11,979)
Operating Profit 56,634 53,918
Finance costs 5(b) (4,987) (6,499)
Share of associate losses 14(b) (875) (833)
Profit from continuing operations before income tax 50,772 46,586
Income tax expense 6 (15,151) (15,398)
Profit for the year from continuing operations 35,621 31,188
DISCONTINuED OPERATIONS
Profit after tax for the year from discontinued operations 8(b) – 2,664
Profit for the year 35,621 33,852
Other comprehensive income
Other comprehensive income for the year, net of tax – –
Total comprehensive income for the year, net of tax 35,621 33,852
Profit attributable to:
Owners of the Parent 35,621 33,852
35,621 33,852
Total comprehensive income attributable to:
Owners of the Parent 35,621 33,852
35,621 33,852
Basic Earnings per share (cents per share)
– profit for the year 9 9.7 9.2
– profit from continuing operations 9 9.7 8.5
Diluted Earnings per share (cents per share)
– profit for the year 9 9.7 9.2
– profit from continuing operations 9 9.7 8.5
20
For
per
sona
l use
onl
y
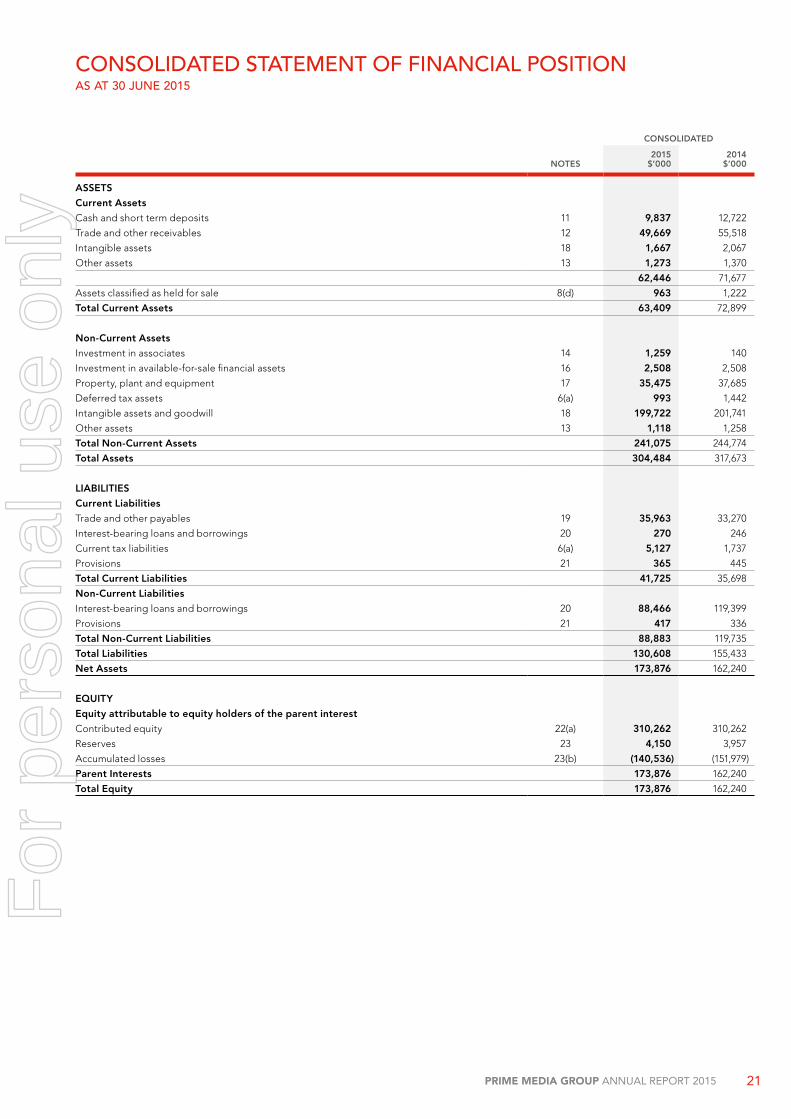
coNsoLiDAteD stAtemeNt oF FiNANciAL positioNAs At 30 JuNe 2015
NOTES
CONSOLIDATED
2015$’000
2014$’000
ASSETS
Current Assets
Cash and short term deposits 11 9,837 12,722
Trade and other receivables 12 49,669 55,518
Intangible assets 18 1,667 2,067
Other assets 13 1,273 1,370
62,446 71,677
Assets classified as held for sale 8(d) 963 1,222
Total Current Assets 63,409 72,899
Non-Current Assets
Investment in associates 14 1,259 140
Investment in available-for-sale financial assets 16 2,508 2,508
Property, plant and equipment 17 35,475 37,685
Deferred tax assets 6(a) 993 1,442
Intangible assets and goodwill 18 199,722 201,741
Other assets 13 1,118 1,258
Total Non-Current Assets 241,075 244,774
Total Assets 304,484 317,673
LIABILITIES
Current Liabilities
Trade and other payables 19 35,963 33,270
Interest-bearing loans and borrowings 20 270 246
Current tax liabilities 6(a) 5,127 1,737
Provisions 21 365 445
Total Current Liabilities 41,725 35,698
Non-Current Liabilities
Interest-bearing loans and borrowings 20 88,466 119,399
Provisions 21 417 336
Total Non-Current Liabilities 88,883 119,735
Total Liabilities 130,608 155,433
Net Assets 173,876 162,240
EQuITY
Equity attributable to equity holders of the parent interest
Contributed equity 22(a) 310,262 310,262
Reserves 23 4,150 3,957
Accumulated losses 23(b) (140,536) (151,979)
Parent Interests 173,876 162,240
Total Equity 173,876 162,240
21Prime media GrouP AnnuAl RepoRt 2015
For
per
sona
l use
onl
y

coNsoLiDAteD stAtemeNt oF chANges iN equitYAs At 30 JuNe 2015
ISSuED CAPITAL
$’000
ACCuMuLATED LOSSES
$’000
EMPLOYEE BENEfITS RESERVE
$’000
GENERAL RESERVE
$’000
TOTAL PARENT ENTITY
INTEREST $’000
At 1 July 2014 310,262 (151,979) 3,957 – 162,240
Profit for the period 35,621 – – 35,621
Other comprehensive income – – – – –
Total comprehensive income and expense for the period – 35,621 – – 35,621
Transactions with equity holders in their capacity as equity holders: –
Exercise of performance rights – – (887) – (887)
Share based payments – – 1,080 – 1,080
Dividends on ordinary shares – (24,178) – – (24,178)
At 30 June 2015 310,262 (140,536) 4,150 – 173,876
ISSuED CAPITAL
$’000
ACCuMuLATED LOSSES
$’000
EMPLOYEE BENEfITS RESERVE
$’000
GENERAL RESERVE
$’000
TOTAL PARENT ENTITY
INTEREST $’000
At 1 July 2013 310,262 (156,801) 3,207 (2,288) 154,380
Profit for the period – 33,852 – – 33,852
Other comprehensive income – – – – –
Total comprehensive income and expense for the period – 33,852 – – 33,852
Transactions with equity holders in their capacity as equity holders:
Share based payments – – 750 – 750
Reclassification – (2,288) – 2,288 –
Dividends on ordinary shares – (26,742) – – (26,742)
At 30 June 2014 310,262 (151,979) 3,957 – 162,240
22
For
per
sona
l use
onl
y

coNsoLiDAteD stAtemeNt oF cAsh FLowsFor the YeAr eNDeD 30 JuNe 2015
NOTES
CONSOLIDATED
2015$’000
2014$’000
OPERATING ACTIVITIES
Receipts from customers (inclusive of GST) 285,877 291,743
Payments to suppliers and employees (inclusive of GST) (211,910) (226,407)
Interest received 245 305
Borrowing costs paid (4,779) (6,839)
Income tax refunds received 457 –
Income tax paid (11,920) (16,241)
NET CASH fLOWS fROM OPERATING ACTIVITIES 11 57,970 42,561
INVESTING ACTIVITIES
Proceeds from sale of property, plant and equipment 1,900 –
Purchase of property, plant & equipment and intangible assets (5,839) (4,795)
Proceeds from sale of financial assets – 24,395
Proceeds from sale of business operations – deferred contingent consideration – 330
Purchase of program rights – (10,000)
Loan funds to related entities (605) (1,123)
NET CASH fLOWS (uSED IN)/fROM INVESTING ACTIVITIES (4,544) 8,807
fINANCING ACTIVITIES
Proceeds from borrowings 118,000 93,525
Repayments of borrowings (149,000) (115,525)
Finance lease liability payments (246) (230)
Share based payments – performance rights exercised (887) –
Dividends paid (24,178) (26,742)
NET CASH fLOWS uSED IN fINANCING ACTIVITIES (56,311) (48,972)
NET (DECREASE)/INCREASE IN CASH AND CASH EQuIVALENTS (2,885) 2,396
Cash and cash equivalents at beginning of period 12,722 10,326
CASH AND CASH EQuIVALENTS AT END Of PERIOD 11 9,837 12,722
23Prime media GrouP AnnuAl RepoRt 2015
For
per
sona
l use
onl
y

Notes to the FiNANciAL stAtemeNtsFor the YeAr eNDeD 30 JuNe 2015
1. CORPORATE INfORMATIONThe consolidated financial report of Prime Media Group Limited (the “Company”) for the year ended 30 June 2015 was authorised for issue in accordance with a resolution of the directors on 26 August 2015.
Prime Media Group Limited is a company limited by shares incorporated in Australia whose shares are publicly traded on the Australian Securities Exchange.
The nature of the operations and principal activities of the Group are described in the Directors’ Report.
2. SuMMARY Of SIGNIfICANT ACCOuNTING POLICIES
TABLE Of CONTENTS(A) Basis of preparation(B) Compliance with Australian Accounting Standards
and International Financial Reporting Standards(C) Changes in accounting policy, disclosures, standards
and interpretations(D) Basis of consolidation(E) Business combinations and goodwill(F) Investments in associates(G) Current versus non-current classification(H) Revenue recognition(I) Government grants(J) Taxes(K) Non-current assets held for sale and discontinued operations(L) Property, plant and equipment(M) Leases(N) Borrowing costs(O) Intangible assets(P) Financial Instruments – initial recognition and subsequent
measurement(Q) Impairment of non-financial assets (R) Cash and short term deposits(S) Provisions(T) Share-based payments (u) Contributed equity
(A) BASIS Of PREPARATIONThe financial report is a general-purpose financial report, which has been prepared in accordance with the requirements of the Corporations Act 2001, Australian Accounting Standards and other authoritative pronouncements from the Australian Accounting Standards Board. The financial report has been prepared on a historical cost basis, except for available-for-sale investments that have been measured at fair value.
The financial report is presented in Australian dollars and all values are rounded to the nearest thousand dollars ($’000) unless otherwise stated.
The consolidated financial statements provide comparative information in respect of the previous period.
(B) COMPLIANCE WITH AuSTRALIAN ACCOuNTING STANDARDS AND INTERNATIONAL fINANCIAL REPORTING STANDARDS
The financial report complies with Australian Accounting Standards and International Financial Reporting Standards (IFRS) as issued by the International Accounting Standards Board.
(C) CHANGES IN ACCOuNTING POLICIES, DISCLOSuRES, STANDARDS AND INTERPRETATIONS
The accounting policies adopted are consistent with those of the previous financial year.
24
For
per
sona
l use
onl
y

Notes to the FiNANciAL stAtemeNtsFor the YeAr eNDeD 30 JuNe 2015
(C) CHANGES IN ACCOuNTING POLICIES, DISCLOSuRES, STANDARDS AND INTERPRETATIONS (CONTINuED)The following Australian Accounting Standards and Interpretations that have recently been issued or amended, but are not yet effective. The changes have had no material effect on the financial statements of the Group.
REfERENCE TITLE
APPLICATION DATE Of STANDARD
APPLICATION DATE fOR GROuP
AASB 2012-3 Amendments to Australian Accounting Standards - Offsetting Financial Assets and Financial Liabilities
1 January 2014 1 July 2014
AASB 9/IFRS 9 Financial Instruments 1 January 2018 1 July 2018
AASB 2013-3 Amendments to AASB 136 – Recoverable Amount Disclosures for Non-Financial Assets
1 January 2014 1 July 2014
AASB 2013-4 Amendments to Australian Accounting Standards – Novation of Derivatives and Continuation of Hedge Accounting [AASB 139]
1 January 2014 1 July 2014
AASB 2013-9 Amendments to Australian Accounting Standards – Conceptual Framework, Materiality and Financial Instruments
1 January 2014 1 July 2014
AASB 2014-1 Part A -Annual Improvements 2010–2012 Cycle
Amendments to Australian Accounting Standards - Part A Annual Improvements to IFRSs 2010–2012 Cycle
1 July 2014 1 July 2014
AASB 2014-1 Part A -Annual Improvements 2011–2013 Cycle
Amendments to Australian Accounting Standards - Part A Annual Improvements to IFRSs 2011–2013 Cycle
1 July 2014 1 July 2014
AASB 1031 Materiality 1 January 2014 1 July 2014
AASB 2014-4 Clarification of Acceptable Methods of Depreciation and Amortisation (Amendments to AASB 116 and AASB 138)
1 January 2016 1 July 2016
AASB 15 Revenue from Contracts with Customers 1 January 2017 1 April 2017 Note A
AASB 2015-1 Amendments to Australian Accounting Standards – Annual Improvements to Australian Accounting Standards 2012-2014 cycle
1 January 2016 1 April 2016
AASB 2015-2 Amendments to Australian Accounting Standards – Disclosure Initiative: Amendments to AASB 101
1 January 2016 1 April 2016
AASB 2015-3 Amendments to Australian Accounting Standards arising from the Withdrawal of AASB 1031 Materiality
1 January 2015 1 April 2016
(D) BASIS Of CONSOLIDATIONThe consolidated financial statements comprise the financial statements of Prime Media Group Limited and its subsidiaries (as outlined in Note 30) as at and for the year ended 30 June 2015. Interests in associates are equity accounted and are not part of the consolidated Group (see Note 14).
Control is achieved when the Group is exposed, or has rights, to variable returns from its involvement with the investee and has the ability to affect those returns through its power over the investee. The Group controls an investee if and only if the Group has:
• power over the investee (i.e.: existing rights that give it the current ability to direct the relevant activities of the investee);• exposure, or rights, to variable returns from its involvement with the trustee;• the ability to use its power over the investee to affect its returns.
Generally, there is a presumption that a majority of voting rights results in control. To support this presumption, and when the Group has less than a majority of the voting or similar rights of an investee, the Group considers all relevant facts and circumstances in assessing whether it has power over an investee including:
• the contractual arrangement(s) with the other vote holders of the investee;• rights arising from other contractual arrangements; and• the Group’s voting rights and potential voting rights.
The Group re-assesses whether or not it controls an investee if facts and circumstances indicate that there are changes to one or more of the three elements of control. Consolidation of a subsidiary begins when the Group obtains control over the subsidiary and ceases when the Group loses control of the subsidiary. Assets, liabilities, income and expenses of a subsidiary acquired or disposed of during the year are included in the consolidated financial statements from the date the Group gains control until the date the Group ceases to control the subsidiary.
Profit or loss and each component of other comprehensive income are attributed to the equity holders of the parent of the Group and to the non-controlling interests, even if this results in the non-controlling interests having a deficit balance. All intra group assets and liabilities, equity, income expenses and cash flows relating to transactions between members of the Group are eliminated in full on consolidation.
A change in the ownership interest of a subsidiary that does not result in a loss of control, is accounted for as an equity transaction.
If the Group loses control over a subsidiary, it derecognises the related assets (including goodwill), liabilities, non-controlling interest and any other component of equity while any resultant gain or loss is recognised in profit or loss. Any investment retained is recognised at fair value.
25Prime media GrouP AnnuAl RepoRt 2015
For
per
sona
l use
onl
y

Notes to the FiNANciAL stAtemeNtsFor the YeAr eNDeD 30 JuNe 2015
(E) BuSINESS COMBINATIONS AND GOODWILLBusiness combinations are accounted for using the acquisition method. The cost of acquisition is measured as the aggregate of the consideration transferred, measured at acquisition date fair value and the amount of any non-controlling interest in the acquiree. For each business combination, the Group elects whether it measures the non-controlling interest in the acquiree either at fair value or at the proportionate share of the acquiree’s identifiable net assets. Acquisition costs incurred are expensed and included in administrative expenses.
When the Group acquires a business, it assesses the financial assets and liabilities assumed for appropriate classification and designation in accordance with the contractual terms, economic conditions and pertinent conditions as at the acquisition date.
If the business combination is achieved in stages, any previously held equity interest is remeasured at its acquisition date fair value and any resulting gain or loss is recognised in profit or loss.
Any contingent consideration to be transferred by the acquirer will be recognised at fair value at the acquisition date. Contingent consideration classified as an asset or liability that is a financial instrument and within the scope of AASB 139 Financial Instruments: Recognition and Measurement, is measured at fair value with changes in fair value recognised in profit or loss or as a change in other comprehensive income. If the contingent consideration is not within the scope of AASB 139, it is measured in accordance with the appropriate Australian Accounting Standard. Contingent consideration that is reclassified as equity is not re-measured and subsequent settlement is accounted for within equity.
Goodwill is initially measured at cost, being the excess of the aggregate of the consideration transferred and the amount recognised for any non-controlling interests, and any previous interest held, over the net identifiable assets acquired and liabilities assumed. If the fair value of the net assets acquired is in excess of the aggregate consideration transferred, the Group re-assesses whether it has correctly identified all of the assets acquired and all of the liabilities assumed and reviews the procedures used to measure the amounts to be recognised at the acquisition date. If the re-assessment still results in an excess of the fair value of net assets acquired over the aggregate consideration transferred, then the gain is recognised in profit or loss.
After initial recognition, goodwill is measured at cost less any accumulated impairment losses. For the purpose of impairment testing, goodwill acquired in a business combination is, from the acquisition date, allocated to each of the Group’s cash-generating units that are expected to benefit from the combination, irrespective of whether other assets or liabilities of the acquired are assigned to those units.
Where goodwill forms part of a cash-generating unit and part of the operation within that unit is disposed of, the goodwill associated with the operation disposed of is included in the carrying amount of the operation when determining the gain or loss on disposal of the operation. Goodwill disposed of in this circumstance is measured based on the relative values of the operation disposed of and the portion of the cash-generating unit retained.
(f) INVESTMENTS IN ASSOCIATESThe Group’s investments in its associates are accounted for using the equity method. An associate is an entity over which the Group has significant influence. Significant influence is the power to participate in the financial and operating policy decisions of the investee.
under the equity method, the investment in an associate is initially recognised at cost. The carrying amount of the investment is adjusted to recognise changes in the Group’s share of net assets of the associate since the acquisition date. Goodwill relating to an associate is included in the carrying amount of the investment and is neither amortised nor individually tested for impairment.
The statement of profit or loss reflects the Group’s share of the results of operations of the associate. When there has been a change recognised directly in the equity of the associate, the Group recognises its share of any changes, when applicable, in the statement of changes in equity. unrealised gains and losses resulting from transactions between the Group and the associate are eliminated to the extent of the interest in the associate.
The aggregate of the Group’s share of profit or loss of an associate is shown on the face of the statement of profit or loss outside operating profit or loss after tax and non-controlling interests in the subsidiaries of the associate. The financial statements of the associates are prepared for the same reporting period as the Group. When necessary, adjustments are made to bring the accounting policies in line with those of the Group.
After application of the equity method, the Group determines whether it is necessary to recognise an additional impairment loss on the Group’s investment in its associate. At each reporting date, the Group determines whether there is any objective evidence that the investment in the associate is impaired. If this is the case the Group calculates the amount of impairment as the difference between the recoverable amount of the associate and its carrying value and recognises the amount in the “share of associate losses” in the statement of profit or loss.
(G) CuRRENT VERSuS NON-CuRRENT CLASSIfICATION
The Group presents assets and liabilities in the statement of financial position based on current and non-current classification. An asset is current when it is:
• Expected to be realised or intended to be sold or consumed in the normal operating cycle;
• Held primarily for the purpose of trading;• Expected to be realised within 12 months after the reporting date; or• Cash or cash equivalent unless restricted from being exchanged or
used to settle a liability for at least 12 months after the reporting date.
All other assets are classified as non-current. A liability is current when:
• It is expected to be settled in the normal operating cycle;• It is held primarily for the purpose of trading;• It is due to be settled within 12 months after the reporting date; or• There is no unconditional right to defer the settlement of the liability
for at least 12 months after the reporting period.
The Group classifies all other liabilities as non-current. Deferred tax assets and liabilities are classified as non-current assets and liabilities.
(H) REVENuE RECOGNITIONRevenue is recognised to the extent it is probable that the economic benefits will flow to the Group and the revenue can be reliably measured, regardless of when the payment is being made. Revenue is measured at the fair value of the consideration received or receivable, taking into account contractually defined terms of payment and excluding taxes or duty. The specific recognition criteria described below must also be met before revenue is recognised:
ADVERTISING REVENuEBroadcasting operations derive revenue primarily from the sale of commercial advertising time to national, regional and local advertisers. Revenue is recognised when the commercial advertisements are broadcast.
COMMERCIAL ADVERTISING PRODuCTION REVENuERevenue is recognised when the production is complete and the customer invoiced.
RENDERING Of SERVICESRevenue from the provision of production facilities is brought to account after services have been rendered and the fee is receivable.
SALES REPRESENTATION REVENuESales representation revenue is brought to account as the service is provided.
INTEREST INCOMEFor all financial instruments measured at amortised cost and interest-bearing financial assets classified as available-for-sale, interest income or expense is recorded using the effective interest rate, which is the rate that exactly discounts the estimated future cash payments or receipts over the expected life of the financial instrument or a shorter period, where appropriate, to the net carrying amount of the financial asset or liability. Interest income is included in finance income in the statement of profit or loss.
2. SuMMARY Of SIGNIfICANT ACCOuNTING POLICIES (CONTINuED)
26
For
per
sona
l use
onl
y

Notes to the FiNANciAL stAtemeNtsFor the YeAr eNDeD 30 JuNe 2015
DIVIDENDSDividend revenue is recognised when the Group’s right to receive the payment is established.
RENTAL INCOMERental income is derived from the sub-letting of the Group’s property, plant and equipment. This rental income is recognised on a straight-line basis over the lease terms and is included in revenue in the statement of profit or loss due to its operating nature.
(I) GOVERNMENT GRANTSGovernment grants are recognised where there is reasonable assurance that the grant will be received and all attached conditions have been complied with. When the grant relates to an expense item, it is recognised as income on a systematic basis over the periods that the related costs, for which it is intended to compensate, are expensed.
When the grant relates to an asset, it is recognised as income in equal amounts over the expected useful life of the related asset. When the Group receives grants of non-monetary assets, the assets and the grant are recorded at nominal amounts and released to profit or loss over the expected useful life in a pattern of consumption of the benefit of the underlying asset by equal annual instalments.
(J) TAxES
(i) CuRRENT INCOME TAxCurrent tax assets and liabilities for the current period are measured at the amount expected to be recovered from or paid to the taxation authorities. The tax rates and tax laws used to compute the amount are those that are enacted or substantively enacted at the reporting date.
Current income tax relating to items recognised directly in equity is recognised in equity and not in the statement of profit or loss. Management periodically evaluates positions taken in the tax returns with respect to situations in which applicable tax regulations are subject to interpretation and establishes provisions where appropriate.
(ii) DEfERRED INCOME TAxDeferred tax is provided using the liability method on temporary differences between the tax bases of assets and liabilities and their carrying amounts for financial reporting purposes at the reporting date.
Deferred income tax liabilities are recognised for all taxable temporary differences except:
• when the deferred tax liability arises from the initial recognition of goodwill or of an asset or liability in a transaction that is not a business combination and that, at the time of the transaction, affects neither the accounting profit nor taxable profit or loss.
• in respect of taxable temporary differences associated with investments in subsidiaries, associates and interests in joint ventures, when the timing of the reversal of the temporary differences can be controlled and it is probable that the temporary differences will not reverse in the foreseeable future.
Deferred tax assets are recognised for all deductible temporary differences, the carry forward of unused tax credits and any unused tax losses. Deferred tax assets are recognised to the extent that it is probable that taxable profit will be available against which the deductible temporary differences, and the carry forward of unused tax credits and unused tax losses can be utilised, except:
• when the deferred tax asset relating to the deductible temporary difference arises from the initial recognition of an asset or liability in a transaction that is not a business combination and, at the time of the transaction, affects neither the accounting profit nor taxable profit or loss.
• in respect of deductible temporary differences associated with investments in subsidiaries, associates and interests in joint ventures, deferred tax assets are recognised only to the extent that it is probable that the temporary differences will reverse in the foreseeable future and taxable profit will be available against which the temporary differences can be utilised.
The carrying value of deferred tax assets is reviewed at each reporting date and reduced to the extent that it is no longer probable that sufficient taxable profit will be available to allow all or part of the deferred tax asset to be utilised.
Deferred tax assets and liabilities are measured at the tax rates that are expected to apply in the year when the asset is realised or the liability settled, based on tax rates (and tax laws) that have been enacted or substantively enacted at the reporting date. Deferred tax assets and deferred tax liabilities are offset if a legally enforceable right exists to set off current tax assets against current income tax liabilities and the deferred taxes relate to the same taxable entity and the same taxation authority.
Information regarding the Group’s consolidated tax group is disclosed at Note 6.
GOODS AND SERVICES TAx (GST)Revenues, expenses and assets are recognised net of the amount of GST. The net amount of GST recoverable from, or payable to, the taxation authority is included as part of receivables or payables in the statement of financial position. Commitments and contingencies are disclosed net of the amount of GST recoverable from, or favourable to, the taxation authority. Cash flows are included in the statement of cash flows on a gross basis and the GST component of the cash flows arising from investing and financing activities, which is recoverable from, or payable to, the taxation authority is classified as part of operating cash flows.
(K) NON-CuRRENT ASSETS HELD fOR SALE AND DISCONTINuED OPERATIONS
The Group classifies non-current assets and disposal groups as held for sale if their carrying amounts will be recovered principally through a sale transaction rather than through continuing use. Non-current assets and disposal groups classified as held for sale are measured at the lower of their carrying amount and fair value less costs to sell. Costs to sell are the incremental costs directly attributable to the sale, excluding the finance costs and income tax expense. The criteria for held for sale classification is regarded as met only when the sale is highly probable and the asset or disposal group is available for immediate sale in its present condition. Management must be committed to the sale within one year from the date of classification.
Property, plant and equipment and intangible assets are not depreciated or amortised once classified as held for sale. Assets and liabilities classified as held for sale are presented separately as current items in the statement of financial position.
Discontinued operations are excluded from the results of continuing operations and are presented as a single amount as profit or loss after tax from discontinued operations in the statement of comprehensive income.
27Prime media GrouP AnnuAl RepoRt 2015
For
per
sona
l use
onl
y

Notes to the FiNANciAL stAtemeNtsFor the YeAr eNDeD 30 JuNe 2015
(L) PROPERTY, PLANT AND EQuIPMENTPlant and equipment is stated at cost, net of accumulated depreciation and accumulated impairment losses, if any. Such cost includes the cost of replacing part of the property, plant and equipment if the recognition criteria are met. When significant parts of property, plant and equipment are required to be replaced at intervals, the Group recognises such parts as individual assets with specific useful lives and depreciates them accordingly. All other repairs and maintenance are recognised in profit or loss as incurred. The present value of the expected cost for the decommissioning of an asset after its use is included in the cost of the respective asset if the recognition criteria for a provision are met. Refer to significant accounting judgements, estimates and assumptions (Note 3) and provisions (Note 21) for further information about the recorded decommissioning provision.
Land and buildings are measured at cost less accumulated depreciation on buildings.
Depreciation is calculated on a straight-line basis on all property, plant and equipment, other than freehold and leasehold land, over the estimated useful life of the assets as follows:
MAJOR DEPRECIATION PERIODS ARE:
– Land:Not
depreciated
– Freehold buildings: 40 years
– Leasehold improvements: The lease term
– Plant and equipment: 3 to 15 years
– Plant and equipment under lease: 5 to 15 years
– Motor vehicles: 6 years
An item of property, plant and equipment and any significant part initially recognised is derecognised upon disposal or when no future economic benefits are expected from its use or disposal. Any gain or loss arising on de-recognition of the asset (calculated as the difference between the net disposal proceeds and the carrying amount of the asset) is included in the statement of profit or loss when the asset is derecognised.
The residual values, useful lives and methods of depreciation of property, plant and equipment are reviewed at each financial year end and adjusted prospectively, if appropriate.
(M) LEASESThe determination of whether an arrangement is, or contains a lease is based on the substance of the arrangement at inception of the lease. The arrangement is, or contains, a lease if fulfilment of the arrangement is dependent on the use of a specific asset or assets or the arrangement conveys a right to use the asset, even if that right is not explicitly specified in an arrangement.
(i) GROuP AS A LESSEE A lease is classified at the inception date as a finance lease or an operating lease. A lease that transfers substantially all the risks and rewards incidental to ownership to the Group is classified as a finance lease. An operating lease is a lease other than a finance lease.
Finance leases are capitalised at the commencement of the lease at the inception date fair value of the leased property or, if lower, at the present value of the minimum lease payments. Lease payments are apportioned between finance charges and reduction of lease liability so as to achieve a constant rate of interest on the remaining balance of the liability. Finance charges are recognised in finance costs in the statement of profit or loss.
A leased asset is depreciated over the useful life of the asset. However, if there is no reasonable certainty that the Group will obtain ownership by the end of the lease term, the asset is depreciated over the shorter of the estimated useful life of the asset and the lease term.
Operating lease payments are recognised as an operating expense in the statement of profit or loss on a straight-line basis over the lease term.
(ii) GROuP AS A LESSORLeases in which the Group does not transfer substantially all the risks and benefits of ownership of the leased asset are classified as operating leases. Initial direct costs incurred in negotiating an operating lease are added to the carrying amount of the leased asset and recognised as an expense over the lease term on the same basis as rental income. Contingent rents are recognised as revenue in the period in which they are earned.
(N) BORROWING COSTSBorrowing costs directly attributable to the acquisition, construction or production of an asset that necessarily takes a substantial period of time to get ready for its intended use or sale are capitalised as part of the cost of the asset. All other borrowing costs are expensed in the periods in which they occur. Borrowing costs consist of interest and other costs that an entity incurs in connection with the borrowing of funds.
(O) INTANGIBLE ASSETSIntangible assets acquired separately are measured on initial recognition at cost. The cost of intangible assets acquired in a business combination is their fair value at the date of acquisition. Following initial recognition, intangible assets are carried at cost less any accumulated amortisation and accumulated impairment losses.
The useful lives of intangible assets are either finite or indefinite.
Intangible assets with finite lives are amortised over the useful economic life and assessed for impairment whenever there is an indication that the intangible asset may be impaired. The amortisation period and the amortisation method for an intangible asset with a finite useful life are reviewed at least at the end of each reporting period. Changes in the expected useful life or the expected pattern of consumption of future economic benefits embodied in the asset are accounted for by changing the amortisation period or method, as appropriate, and are treated as changes in accounting estimates. The amortisation expense on intangible assets with finite lives is recognised in the statement of profit or loss in the expense category consistent with the function of the intangible assets.
Intangible assets with indefinite useful lives are not amortised, but are tested for impairment annually either individually or at the cash-generating unit level. The assessment of indefinite life is reviewed annually to determine whether the indefinite life continues to be supportable. If not, the change in the useful life from indefinite to finite is accounted for on a prospective basis.
Gains or losses arising from de-recognition of an intangible asset are measured as the difference between the net disposal proceeds and the carrying amount of the asset and are recognised in the statement of profit or loss when the asset is derecognised.
BuSINESS SOfTWARE, DEVELOPMENT AND WEBSITESBusiness software, development and website costs are capitalised based on management’s judgement that key milestones for the developments have been achieved. In determining the amounts to be capitalised, management makes assumptions regarding the future cash to be generated from the asset, discount rates to be applied and the expected period of benefits.
TELEVISION BROADCAST LICENCES, ACQuIRED BOTH SEPARATELY AND AS PART Of A BuSINESS COMBINATIONTelevision broadcast licences consist of the right to broadcast television to specific market areas. The licences are subject to renewal by the Australian Communications and Media Authority (ACMA). The directors have no reason to believe the licences will not be renewed at the end of their legal terms and have not identified any factor that would affect their useful life. Therefore, the television licences are deemed to have indefinite useful lives.
2. SuMMARY Of SIGNIfICANT ACCOuNTING POLICIES (CONTINuED)
28
For
per
sona
l use
onl
y

Notes to the FiNANciAL stAtemeNtsFor the YeAr eNDeD 30 JuNe 2015
PROGRAM RIGHTSConsists of television program rights arising from the Company’s affiliation with the Seven Network.
A summary of the policies applied to the Group’s intangible assets is as follows:
TELEVISION BROADCAST LICENCESBuSINESS SOfTWARE, DEVELOPMENT, WEBSITES, PROGRAM RIGHTS AND INfRASTRuCTuRE ACCESS LICENCE
useful lives: Indefinite Finite
Amortisation method used: Not amortised or revalued Amortised on a straight-line basis over the period of the expected future benefit
Internally generated or acquired: Acquired Internally generated / Acquired
(P) fINANCIAL INSTRuMENTS – INITIAL RECOGNITION AND SuBSEQuENT MEASuREMENT
A financial instrument is any contract that gives rise to a financial asset of one entity and a financial liability or equity instrument of another entity.
(i) fINANCIAL ASSETS
initial recognition and measurementFinancial assets are classified, at initial recognition, as financial assets at fair value through profit or loss, loans and receivables, held to maturity investments, available-for-sale assets, or as derivatives designated as hedging instruments in an effective hedge, as appropriate.
All financial assets are recognised initially at fair value plus, in the case of financial assets not subsequently measured at fair value through profit or loss, transaction costs that are attributable to the acquisition of the financial asset.
Purchases or sales of financial assets that require delivery of the assets within the period established by regulation or convention in the market place are recognised on the trade date being the date that the Group commits to purchase or sell the asset.
subsequent measurementThe subsequent measurement of financial assets depends on their classification as described below:
Financial assets at fair value through profit or lossFinancial assets at fair value through profit or loss include financial assets held for trading and financial assets designated upon initial recognition at fair value through profit or loss. Financial assets are classified as held for trading if they are acquired for the purpose of selling or repurchasing in the near term. Derivatives, including separated embedded derivatives are also classified as held for trading unless they are designated as effective hedging instruments as defined by AASB139.
The Group has not designated any financial assets at fair value through profit or loss. Financial assets at fair value through profit and loss are carried in the statement of financial position at fair value with net changes in fair value presented as finance costs (negative net changes in fair value) or finance income (positive net changes in fair value) in the statement of profit or loss.
Loans and receivablesLoans and receivables are non-derivative financial assets with fixed or determinable payments that are not quoted in an active market. After initial measurement, such assets are subsequently measured at amortised cost using the effective interest method, less impairment. Amortised cost is calculated by taking into account any discount or premium on acquisition and fees or costs that are an integral part of the effective interest rate. The effective interest rate amortisation is included in finance income in the statement of profit or loss. The losses arising from impairment are recognised in the statement of profit or loss in finance costs for loans.
This category generally applies to trade and other receivables. For more information on receivables, refer to Note 12.
Available-for-sale financial investmentsAvailable-for-sale financial investments include equity investments and debt securities. Equity investments classified as available-for-sale are those that are neither classified as held for trading nor designated at fair value through profit or loss. Debt securities in this category are those that are intended to be held for an indefinite period of time and that may be sold in response to needs for liquidity or response to changes in the market conditions.
After initial measurement, available-for-sale financial investments are subsequently measured at fair value with unrealised gains or losses recognised as other comprehensive income in reserves until the investment is derecognised, at which time the cumulative gain or loss is recognised in other operating income, or the investment is determined to be impaired, when the cumulative loss is reclassified from reserves to the statement of profit or loss in finance costs. Interest earned whilst holding available-for-sale financial investments is reported as interest income using the effective interest rate method.
The Group evaluates whether the ability and intention to sell its available-for-sale financial assets in the near term is still appropriate. When, in rare circumstances, the Group is unable to trade these financial assets due to inactive markets and management’s intention to do so significantly changes in the foreseeable future, the Group may elect to reclassify these financial assets if management has the ability and intention to hold the assets for the foreseeable future or until maturity.
For a financial asset reclassified from the available-for-sale category, the fair value carrying amount at the date of reclassification becomes its new amortised cost and any previous gain or loss on the asset that has been recognised in equity is amortised to profit or loss over the remaining life of the investment using the effective interest rate. Any difference between the new amortised cost and the maturity amount is also amortised over the remaining life of the asset using the effective interest rate. If the asset is subsequently determined to be impaired, then the amount recorded in equity is reclassified to the statement of profit or loss.
DerecognitionA financial asset (or, where applicable, a part of a financial asset or part of a group of similar financial assets) is derecognised when:
• the rights to receive cash flows from the asset have expired;• the Group has transferred its rights to receive cash flows from the
asset or has assumed an obligation to pay the received cash flows in full without material delay to a third party under a ‘pass through’ arrangement; and either the Group has transferred substantially all the risks and rewards of the asset, or the Group has neither transferred nor retained substantially all the risks and rewards of the asset, but has transferred control of the asset.
When the Group has transferred its rights to receive cash flows from an asset or has entered into a pass-through arrangement, it evaluates if and to what extent it has retained the risks and rewards of ownership.
When it has neither transferred nor retained substantially all the risks and rewards of the asset, nor transferred control of the asset, the asset is recognised to the extent of the Group’s continuing involvement in the asset. In that case, the Group also recognises an associated liability. The transferred asset and the associated liability are measured on a basis that reflects the rights and obligations that the Group has retained. Continuing involvement that takes the form of a guarantee over the transferred asset is measured at the lower of the original carrying amount of the asset and the maximum amount of consideration received that the Group could be required to repay.
29Prime media GrouP AnnuAl RepoRt 2015
For
per
sona
l use
onl
y

Notes to the FiNANciAL stAtemeNtsFor the YeAr eNDeD 30 JuNe 2015
(P) fINANCIAL INSTRuMENTS – INITIAL RECOGNITION AND SuBSEQuENT MEASuREMENT (CONTINuED)
(ii) IMPAIRMENT Of fINANCIAL ASSETSThe Group assesses, at each reporting date, whether there is objective evidence that a financial asset or group of financial assets is impaired.
A financial asset or group of financial assets is deemed to be impaired if there is objective evidence of impairment, as a result of one or more events that has occurred after the initial recognition of the asset (an incurred ‘loss event’), and that loss event has an impact on the estimated future cash flows of the financial asset or the group of financial assets that can be reliably estimated. Evidence of impairment may include indications that the debtors or a group of debtors is experiencing significant financial difficulty, default or delinquency in interest or principal payments, the probability that they will enter bankruptcy or other financial reorganisation and observable data indicating that there is a measurable decrease in the estimated future cash flows, such as changes in arrears or economic conditions that correlate with defaults.
Financial assets carried at amortised costFor financial assets carried at amortised cost, the Group first assesses whether objective evidence of impairment exists individually for financial assets that are individually significant, and collectively for financial assets that are not individually significant. If the Group determines that no objective evidence of impairment exists for an individually assessed financial asset, whether significant or not, it includes the asset in a group of financial assets with similar credit risk characteristics and collectively assesses them for impairment. Assets that are individually assessed for impairment and for which an impairment loss is, or continues to be, recognised are not included in a collective assessment of impairment.
The amount of any impairment loss identified is measured as the difference between the asset’s carrying amount and the present value of estimated future cash flows (excluding future expected credit losses that have not yet been incurred). The present value of the estimated future cash flows is discounted at the financial asset’s original effective interest rate. The carrying amount of the asset is reduced through the use of an allowance account and the amount of the loss is recognised in the statement of profit or loss. Interest income (recorded as finance income in the statement of profit or loss) continues to be accrued on the reduced carrying amount and is accrued using the rate of interest used to discount the future cash flows for the purpose of measuring the impairment loss. The interest income is recorded as part of finance income in the statement of profit or loss. Loans together with the associated allowance are written off when there is no realistic prospect of future recovery and all collateral has been realised or has been transferred to the Group. If, in a subsequent year, the amount of the estimated impairment loss increases or decreases because of an event occurring after the impairment was recognised, the previously recognised impairment loss is increased or reduced by adjusting the allowance account. If a future write-off is later recovered, the recovery is credited to finance costs in the statement of profit or loss.
Available-for-sale financial investmentsFor available-for-sale financial investments, the Group assesses at each reporting date whether there is objective evidence that an investment or a group of investments is impaired.
In the case of equity investments classified as available-for-sale, objective evidence would include a significant or prolonged decline in the fair value of the investment below its cost. ‘Significant’ is evaluated against the original cost of the investment and ‘prolonged’ against the period in which the fair value has been below its original cost. When there is evidence of impairment, the cumulative loss which is measured as the difference between the acquisition cost and the current fair value, less any impairment loss on that investment previously recognised in the statement of profit or loss, is removed from other comprehensive income and recognised in the statement of profit or loss. Impairment losses on equity investments are not reversed through the statement of profit or loss; increases in their fair value after impairment are recognised directly in other comprehensive income.
(iii) fINANCIAL LIABILITIES
initial recognition and measurementFinancial liabilities are classified, at initial recognition, as financial liabilities at fair value through profit or loss, loans and borrowings, payables, or as derivatives designated as hedging instruments in an effective hedge, as appropriate. All financial liabilities are recognised initially at fair value and, in the case of loans and borrowings, net of directly attributable transaction costs. The Group’s financial liabilities include trade and other payables, loans and borrowings.
subsequent measurementThe measurement of financial liabilities depends on their classification, as described below.
Financial liabilities at fair value through profit or lossFinancial liabilities at fair value through profit or loss include financial liabilities held for trading and financial liabilities designated upon initial recognition as at fair value through profit or loss. Financial liabilities are classified as held for trading if they are incurred for the purpose or repurchasing in the near term. This category includes derivative financial instruments entered into by the Group that are not designated as hedging instruments in hedge relationships as defined by AASB 139.
Gains or losses on liabilities held for trading are recognised in the statement of profit or loss.
Financial liabilities designated upon initial recognition at fair value through profit and loss are designated at the initial date of recognition, and only if the criteria in AASB 139 are satisfied. The Group has not designated any financial liability as at fair value through profit or loss.
Loans and borrowingsAfter initial recognition, interest-bearing loans and borrowings are subsequently measured at amortised cost using the effective interest method. Gains and losses are recognised in the statement of profit or loss when the liabilities are derecognised as well as through the effective interest rate amortisation process.
Amortised cost is calculated by taking into account any discount or premium on acquisition and fees or costs that are an integral part of the effective interest rate. The effective interest rate amortisation is included in finance costs in the statement of profit or loss.
This category generally applies to interest-bearing loans and borrowings. For more information, refer Note 20.
DerecognitionA financial liability is derecognised when the obligation under the liability is discharged or cancelled, or expires. When an existing financial liability is replaced by another from the same lender on substantially different terms, or the terms of an existing liability are substantially modified, such an exchange or modification is treated as a derecognition of the original liability and the recognition of a new liability, and the difference in the respective carrying amounts is recognised in the statement of profit or loss.
(iv) OffSETTING Of fINANCIAL INSTRuMENTSFinancial assets and financial liabilities are offset and the net amount is reported in the consolidated statement of financial position if there is a currently enforceable legal right to offset the recognised amounts and there is an intention to settle on a net basis, or to realise the assets and settle the liabilities simultaneously.
(v) fAIR VALuE Of fINANCIAL INSTRuMENTSThe fair value of financial instruments that are traded in active markets at each reporting date is determined by reference to quoted market prices or dealer price quotations (bid price for long positions and ask price for short positions), without any deduction for transaction costs.
For financial instruments not traded in an active market, the fair value is determined using appropriate valuation techniques. Such techniques include:
• using recent arm’s length market transactions;• reference to the current fair value of another instrument that is
substantially the same; and
• a discounted cash flow analysis or other valuation models.
2. SuMMARY Of SIGNIfICANT ACCOuNTING POLICIES (CONTINuED)
30
For
per
sona
l use
onl
y

Notes to the FiNANciAL stAtemeNtsFor the YeAr eNDeD 30 JuNe 2015
(Q) IMPAIRMENT Of NON-fINANCIAL ASSETSThe Group assesses, at each reporting date, whether there is an indication that an asset may be impaired. If any indication exists, or when annual impairment testing for an asset is required, the Group estimates the asset’s recoverable amount. An asset’s recoverable amount is the higher of an asset’s or cash-generating unit’s (CGu) fair value less costs to sell and its value in use. Recoverable amount is determined for an individual asset, unless the asset does not generate cash inflows that are largely independent of those from other assets or groups of assets. When the carrying amount of an asset or CGu exceeds its recoverable amount, the asset is considered impaired and is written down to its recoverable amount.
In assessing value in use, the estimated future cash flows are discounted to their present value using a pre-tax discount rate that reflects current market assessments of the time value of money and the risks specific to the asset. In determining fair value less costs to sell, recent market transactions are taken into account. If no such transactions can be identified, an appropriate valuation model is used. These calculations are corroborated by valuation multiples, quoted share prices for publicly traded companies or other available fair value indicators.
The Group bases its impairment calculation on detailed budgets and forecast calculations, which are prepared separately for each of the Group’s CGus to which the individual assets are allocated. These budgets and forecast calculations generally cover a period of five years. For longer periods, a long-term growth rate is calculated and applied to project future cash flows after the fifth year.
Impairment losses of continuing operations are recognised in the statement of profit or loss in expense categories consistent with the function of the impaired asset, except for a property previously revalued and the revaluation was taken to other comprehensive income. In this case the impairment is also recognised in other comprehensive income up to the amount of any previous revaluation.
For assets excluding goodwill, an assessment is made at each reporting date to determine whether there is an indication that previously recognised impairment losses no longer exist or may have decreased. If such indication exists, the Group estimates the assets or CGus recoverable amount. A previously recognised impairment loss is reversed only if there has been a change in the assumptions used to determine the asset’s recoverable amount since the last impairment loss was recognised. The reversal is limited so that the carrying amount of the asset does not exceed its recoverable amount, nor exceed the carrying amount that would have been determined, net of depreciation, had no impairment loss been recognised for the asset in prior years. Such reversal is recognised in the statement of profit or loss unless the asset is carried at a revalued amount, in which case, the reversal is treated as a revaluation increase.
GOODWILLGoodwill is tested for impairment annually as at 30 June and when circumstances indicate that the carrying value may be impaired.
Impairment is determined for goodwill by assessing the recoverable amount of each CGu (or group of CGus) to which the goodwill relates. When the recoverable amount of the CGu is less than its carrying amount, an impairment loss is recognised. Impairment losses relating to goodwill cannot be reversed in future periods.
INTANGIBLE ASSETSIntangible assets with indefinite useful lives are tested for impairment annually as at 30 June either individually or at the CGu level, as appropriate, and when circumstances indicate that the carrying value may be impaired.
(R) CASH AND SHORT TERM DEPOSITSCash and short-term deposits in the statement of financial position comprise cash at banks and on hand and short-term deposits with a maturity of three months or less. For the purpose of the consolidated statement of cash flows, cash and short term deposits consist of cash and short-term deposits as defined above, net of outstanding bank overdrafts.
(S) PROVISIONSProvisions are recognised when the Group has a present obligation (legal or constructive) as a result of a past event, it is probable that an outflow of resources embodying economic benefits will be required to settle the obligation and a reliable estimate can be made of the amount of the obligation. When the Group expects some or all of a provision to be reimbursed, for example under an insurance contract, the reimbursement is recognised as a separate asset but only when the reimbursement is virtually certain. The expense relating to any provision is presented in the statement of profit or loss net of any reimbursement.
PROVISION fOR ASSET DECOMMISSIONINGThe Group records a provision for decommissioning costs of analogue transmitters and related assets. Decommissioning costs are provided at the present value of expected costs to settle the obligation using estimated cash flows and are recognised as part of the cost of the particular asset. The cash flows are discounted at a current pre-tax rate that reflects the risks specific to the decommissioning liability. The unwinding of the discount is expensed as incurred and recognised in the statement of profit or loss as a finance cost. The estimated future costs of decommissioning are reviewed annually and adjusted as appropriate. Changes in the estimated future costs or in the discount rate applied are added to or deducted from the cost of the asset.
WAGES, SALARIES, AND ANNuAL LEAVELiabilities for wages and salaries, including non-monetary benefits and annual leave expected to be settled within 12 months of the reporting date are recognised in other payables in respect of employees’ services up to the reporting date. They are measured at the amounts expected to be paid when the liabilities are settled.
LONG SERVICE LEAVEThe liability for long service leave is recognised and measured as the present value of expected future payments to be made in respect of services provided by employees up to the reporting date using the projected unit credit method. Consideration is given to expected future wage and salary levels, experience of employee departures, and periods of service. Expected future payments are discounted using market yields at the reporting date on corporate bonds with terms to maturity and currencies that match, as closely as possible, the estimated future cash outflows.
(T) SHARE-BASED PAYMENTSEmployees (including senior executives) of the Group receive remuneration in the form of performance rights which are share-based payment transactions, whereby employees render services as consideration for equity instruments (equity-settled transactions).
EQuITY-SETTLED TRANSACTIONS The cost of equity-settled transactions is recognised, together with a corresponding increase in employee benefits reserves in equity, over the period in which the performance and/or service conditions are fulfilled. The cumulative expense recognised for equity-settled transactions at each reporting date until the vesting date reflects the extent to which the vesting period has expired and the Group’s best estimate of the number of equity instruments that will ultimately vest. The statement of profit or loss expense or credit for a period represents the movement in cumulative expense recognised as at the beginning and end of that period and is recognised in employee benefits expense.
No expense is recognised for awards that do not ultimately vest, except for equity-settled transactions for which vesting is conditional upon a market or non-vesting condition. These are treated as vesting irrespective of whether or not the market or non-vesting condition is satisfied, provided that all other performance and/or service conditions are satisfied.
When the terms of an equity-settled transaction award are modified, the minimum expense recognised is the expense as if the terms had not been modified, if the original terms of the award are met. An additional expense is recognised for any modification that increases the total fair value of the share-based payment transaction, or is otherwise beneficial to the employee, as measured at the date of modification.
31Prime media GrouP AnnuAl RepoRt 2015
For
per
sona
l use
onl
y

Notes to the FiNANciAL stAtemeNtsFor the YeAr eNDeD 30 JuNe 2015
(T) SHARE-BASED PAYMENTS (CONTINuED)When an equity-settled award is cancelled, it is treated as if it had vested on the date of cancellation, and any expense not yet recognised for the award is recognised immediately. This includes any award where non-vesting conditions within the control of either the entity or the employee are not met. However, if a new award is substituted for the cancelled award, and designated as a replacement award on the date that it is granted, the cancelled and new award are treated as if they were a modification of the original award, as described in the previous paragraph.
The dilutive effect of outstanding performance rights is reflected as additional share dilution in the computation of diluted earnings per share (see Note 9).
(u) CONTRIBuTED EQuITYOrdinary shares are classified as equity. Incremental costs directly attributable to the issue of new shares or performance rights are shown in equity as a deduction, net of tax, from the proceeds.
3. SIGNIfICANT ACCOuNTING JuDGEMENTS, ESTIMATES AND ASSuMPTIONS
The preparation of the Group’s financial statements requires management to make judgements, estimates and assumptions that affect the reported amounts of revenue, expenses, assets and liabilities, and the disclosure of contingent liabilities, at the end of the reporting period. uncertainty about these assumptions and estimates could result in outcomes that require a material adjustment to the carrying amount of the asset or liability affected in future periods.
JuDGEMENTSIn the process of applying the Group’s accounting policies, management has made the following judgements, which have the most significant effect on the amounts recognised in the consolidated financial statements:
OPERATING LEASE COMMITMENTS – GROuP AS LESSEEThe Group has entered into operating leases that have an average lease term of 3 years for Motor Vehicles, 3 to 5 years for building leases, and 5 to 15 years for transmission site access agreements. The Group has determined, based on an evaluation of the terms and conditions of the arrangements, that it does not retain all the significant risks and rewards of ownership of these sites and equipment and accounts for the contracts as operating leases.
OPERATING LEASE COMMITMENTS – GROuP AS LESSORThe Group has entered into site sharing agreements in relation to transmission sites and equipment it owns. The Group has determined, based on an evaluation of the terms and conditions of the arrangements, that it retains all the significant risks and rewards of ownership of these sites and equipment and accounts for the contracts as operating leases.
ESTIMATES AND ASSuMPTIONSThe key assumptions concerning the future and other key sources of estimation uncertainty at the reporting date, that have a significant risk of causing a material adjustment to the carrying amounts of assets and liabilities within the next year, are described below. The Group based its assumptions and estimates on parameters available when the consolidated financial statements were prepared. Existing circumstances and assumptions about future developments, however, may change due to market changes or circumstances arising beyond the control of the Group. Such changes are reflected in the assumptions when they occur.
IMPAIRMENT Of NON-fINANCIAL ASSETSImpairment exists when the carrying value of an asset or cash generating unit exceeds the recoverable value amount, which is the higher of its fair value less costs to sell and its value in use. The value in use calculation is based on a discounted cash flow model. The cash flows are derived from the budget for next year, plus growth assumptions and do not
include restructuring activities that the Group is not yet committed to or significant future investments that will enhance the assets performance of the CGu being tested. The recoverable amount is most sensitive to the discount rate used for the discounted cash flow model as well as the future cash inflows and the growth rate for extrapolation purposes. The key assumptions used to determine the recoverable amount for different CGus, including a sensitivity analysis, are further explained at Note 18.
IMPAIRMENT Of INVESTMENTS IN fINANCIAL ASSETS (INCLuDING ASSOCIATES)The Group assesses impairment of investments in financial assets including associates at each reporting date in accordance with the measurement rules established in the accounting standards.
For financial assets determined to be associates, the Group assesses at each balance date the circumstances and conditions specific to that associate. These include operating performance, market and environmental factors. If management believes that an impairment trigger exists then the recoverable value of the investment in the associate is determined.
RENEWAL Of BROADCASTING LICENCESThe Group’s television broadcasting licences consist of the right to broadcast television services to specific market areas. These licences are issued by the relevant broadcasting authority for periods of 5 years. The ownership and renewal processes of these licences is such that in the absence of major breaches of licensing and broadcasting regulations, licence renewal is virtually guaranteed for the existing licence holders.
CLASSIfICATION Of ASSETS AND LIABILITIES AS HELD fOR SALEThe Group classifies assets and liabilities as held for sale when the carrying amount will be recovered through a sale transaction. The assets and liabilities must be available for immediate sale and the Group must be committed to selling the asset either through entering into a contractual sale agreement or the activation and commitment to a program to locate a buyer and dispose of the assets and liabilities.
VALuATION Of INVESTMENTSThe Group classifies investments in listed and unlisted securities as “available-for-sale” investments and movements in fair value are recognised directly in equity. The fair value of listed shares has been determined by reference to published price quotations in an active market.
The fair values of unlisted securities not traded in an active market are determined using valuation assumptions that are not observable market prices or rates. Future likely cash flows are determined to most likely arise from the disposal of the securities. Disposal cash flows are determined using Earnings before interest, tax, depreciation and amortisation (‘EBITDA’) multiples and compared to similar companies with observable market sales data.
SHARE-BASED PAYMENT TRANSACTIONSThe Group measures the cost of equity-settled transactions with employees by reference to the fair value of the equity instruments at the date at which they are granted. The fair value is determined by an external valuer using a binomial model, using the assumptions detailed in Note 27.
TAxESDeferred tax assets are recognised for deductible temporary differences and unused tax losses to the extent management considers it is probable that future taxable profits will be available to utilise those temporary differences.
Significant management judgement is required to determine the amount of deferred tax assets that can be recognised, based upon the likely timing and the level of future taxable profits together with future tax planning strategies.
2. SuMMARY Of SIGNIfICANT ACCOuNTING POLICIES (CONTINuED)
32
For
per
sona
l use
onl
y

Notes to the FiNANciAL stAtemeNtsFor the YeAr eNDeD 30 JuNe 2015
4. fINANCIAL RISK MANAGEMENT OBJECTIVES AND POLICIESThe Group’s principal financial liabilities, other than derivatives, comprise loans and borrowings and trade and other payables. The main purpose of these financial liabilities is to finance the Group’s operations. The Group’s principal financial assets include trade and other receivables, and cash and short-term deposits that are derived directly from its operations. The Group also holds available-for-sale investments and from time to time enters into derivative transactions.
The Group is exposed to market risk, credit risk and liquidity risk. The Group’s senior management oversees the management of these risks. The Group manages its exposure to key financial risks including interest rate risks in accordance with the Group’s financial risk management policy. The objective of the policy is to support the delivery of the Group’s financial targets while protecting future financial security.
The Group may, from time to time, enter into derivative transactions, including interest rate swaps. The purpose is to manage the interest rate and currency risks arising from the Group’s operations and its sources of finance. It is the Group’s policy not to trade in derivatives for speculative purposes. The main risks arising from the Group’s financial instruments are cash flow risk, interest rate risk, liquidity risk, and credit risk. The Group did not enter into derivative transactions during the reporting period.
The Board of directors reviews risks in accordance with its approach to risk management as set out in the Directors’ Report and the Group’s Corporate Governance Statements which are displayed on the Company’s website www.primemedia.com.au.
MARKET RISKMarket risk is the risk that the fair value of future cash flows of a financial instrument will fluctuate because of changes in market prices. Market risks primarily consist of interest rate risk.
Interest rate risk is the risk that the fair value or future cash flows of a financial instrument will fluctuate because of changes in market interest rates. The Group’s exposure to market interest rates relates primarily to the Group’s long-term debt obligations with floating interest rates. The level of interest bearing debt is disclosed in Note 20.
At balance date, the Group had the following mix of financial assets and liabilities exposed to Australian variable interest rate risk that are not designated as cash flow hedges:
CONSOLIDATED
2015$’000
2014$’000
financial Assets
Cash and short-term deposits 9,837 12,722
9,837 12,722
financial Liabilities
Secured bank loan facility (88,064) (118,727)
(88,064) (118,727)
Net exposure (78,227) (106,005)
The Group constantly analyses its interest rate exposure. Within this analysis consideration is given to potential renewals of existing positions, alternative financing, alternative hedging positions and the mix of fixed and variable interest rates.
The following sensitivity analysis is based on the interest rate risk exposures in existence at the reporting date. At 30 June 2015, if interest rates had moved, as illustrated in the table below, with all other variables held constant, post tax profit and equity would have been affected as follows:
JuDGEMENTS Of REASONABLY POSSIBLE MOVEMENTS:POST TAx PROfITHIGHER/ (LOWER)
EQuITYHIGHER/ (LOWER)
2015$’000
2014$’000
2015$’000
2014$’000
Consolidated
+0.5% (50 basis points) (274) (371) – –
-0.5% (50 basis points) 274 371 – –
CREDIT RISKCredit risk is the risk that a counterparty will not meet its obligations under a financial instrument or customer contract, leading to a financial loss. The Group is exposed to credit risk from its operating activities (primarily for trade receivables) and from its financing activities, including deposits with banks and financial institutions, foreign exchange transactions and other financial instruments.
TRADE RECEIVABLESIt is the Group’s policy that all customers who trade on credit terms are subject to credit verification procedures including an assessment of their independent credit rating, financial position, past experience and industry reputation. Risk limits are set for each individual customer in accordance with parameters set by the Board. These risk limits are regularly monitored.
In addition, receivable balances are monitored on an ongoing basis with the result that the Group’s exposure to bad debts is not significant.
An impairment analysis is performed at each reporting date on an individual basis for major clients. Additionally, a large number of minor receivables are grouped into homogenous groups and assessed for impairment collectively. The calculation is based on actually incurred historical data. The maximum exposure to credit risk at the reporting date is the carrying value of each class of financial assets disclosed at Note 12. The Group does not hold collateral as security.
A small number of media buying agencies account for approximately 57.2% of Prime’s revenue and no individual agency accounts for more than 15.0% of the Group’s revenue. Agency clients operate with strict credit terms of 45 days and are required to provide detailed financial information as part of their credit approval process. Late payments are closely monitored and followed up if the 45 day terms are not met.
33Prime media GrouP AnnuAl RepoRt 2015
For
per
sona
l use
onl
y

Notes to the FiNANciAL stAtemeNtsFor the YeAr eNDeD 30 JuNe 2015
LIQuIDITY RISKThe Group manages its liquidity risk by monitoring the total cash inflows and outflows expected on a weekly basis. The Group’s objective is to maintain a balance between continuity of funding and flexibility through the use of bank overdrafts, debentures, finance leases and hire purchase agreements. The Group currently has funding through:
• $175 million debenture subscription facility (2014: $175 million), which is currently drawn to 51% of the facility limit (2014: 68%); and• Long Term finance lease contracts over specific items of plant and equipment.
Currently the Group secures up to 56% of the drawn down balance of the interest bearing debt facility for 6 monthly periods. In addition to maintaining sufficient liquid assets to meet short-term payments, at balance date, the Group has available approximately $86 million of undrawn committed borrowing facilities, subject to continued compliance with the bank loan covenants. The facility is repayable in full on expiry on March 2018. Interest will be charged at a rate of BBSY plus a margin between 1.50% and 1.80%. At 30 June 2015, 0.3% of the Group’s debt will mature in less than one year. The remaining contractual maturities of the Group’s financial assets and liabilities are:
YEAR ENDED 30 JuNE 2015≤ 6 MONTHS
$’0006 – 12 MONTHS
$’0001 – 5 YEARS
$’000> 5 YEARS
$’000TOTAL$’000
financial assets
Cash and cash equivalents 9,837 – – – 9,837
Trade and other receivables 49,669 – – – 49,669
59,506 – – – 59,506
financial liabilities
Trade and other payables (35,963) – – – (35,963)
Finance lease contracts (refer note 24) (135) (135) (402) – (672)
Finance lease contracts – finance charges (refer note 24) (23) (22) (18) – (63)
Interest bearing loans (refer note 20) – – (88,064) – (88,064)
Interest bearing loans – known interest charges (1,065) – – – (1,065)
(37,186) (157) (88,484) – (125,827)
Net inflow/(outflow) 22,320 (157) (88,484) – (66,321)
YEAR ENDED 30 JuNE 2014≤ 6 MONTHS
$’0006 – 12 MONTHS
$’0001 – 5 YEARS
$’000> 5 YEARS
$’000TOTAL$’000
financial assets
Cash and cash equivalents 12,722 – – – 12,722
Trade and other receivables 55,518 – – – 55,518
68,240 – – – 68,240
financial liabilities
Trade and other payables (33,270) – – – (33,270)
Finance lease contracts (refer note 24) (123) (123) (672) – (918)
Finance lease contracts – finance charges (refer note 24) (33) (33) (63) – (129)
Interest bearing loans (refer note 20) – – (118,727) – (118,727)
Interest bearing loans – known interest charges (1,879) – – – (1,879)
(35,305) (156) (119,462) – (154,923)
Net inflow/(outflow) 32,935 (156) (119,462) – (86,683)
4. fINANCIAL RISK MANAGEMENT OBJECTIVES AND POLICIES (CONTINuED)
34
For
per
sona
l use
onl
y

Notes to the FiNANciAL stAtemeNtsFor the YeAr eNDeD 30 JuNe 2015
5. INCOME AND ExPENSES
CONSOLIDATED
2015$’000
2014$’000
INCOME AND ExPENSES fROM CONTINuING OPERATIONS(A) INCOME Advertising and other external revenue 253,233 256,342
Finance income 245 290
Other revenue 5,335 3,645
258,813 260,277
Breakdown of finance income:
Interest received – other persons 245 290
245 290
Breakdown of other income:
Government grants 926 1,805
Other revenues 4,409 1,840
5,335 3,645
(B) fINANCE ExPENSES Interest expense – other persons 4,987 6,499
4,987 6,499
(C) EMPLOYEE BENEfIT ExPENSE Wages and salaries 33,517 34,722
Superannuation expense 2,735 2,720
Share based payments expense 1,080 750
Other employee benefits expense 1,491 589
38,823 38,781
(D) OTHER ExPENSES Bad and doubtful debts and credit notes – trade debtors (39) (65)
Minimum lease payments – operating leases 13,278 13,700
35Prime media GrouP AnnuAl RepoRt 2015
For
per
sona
l use
onl
y
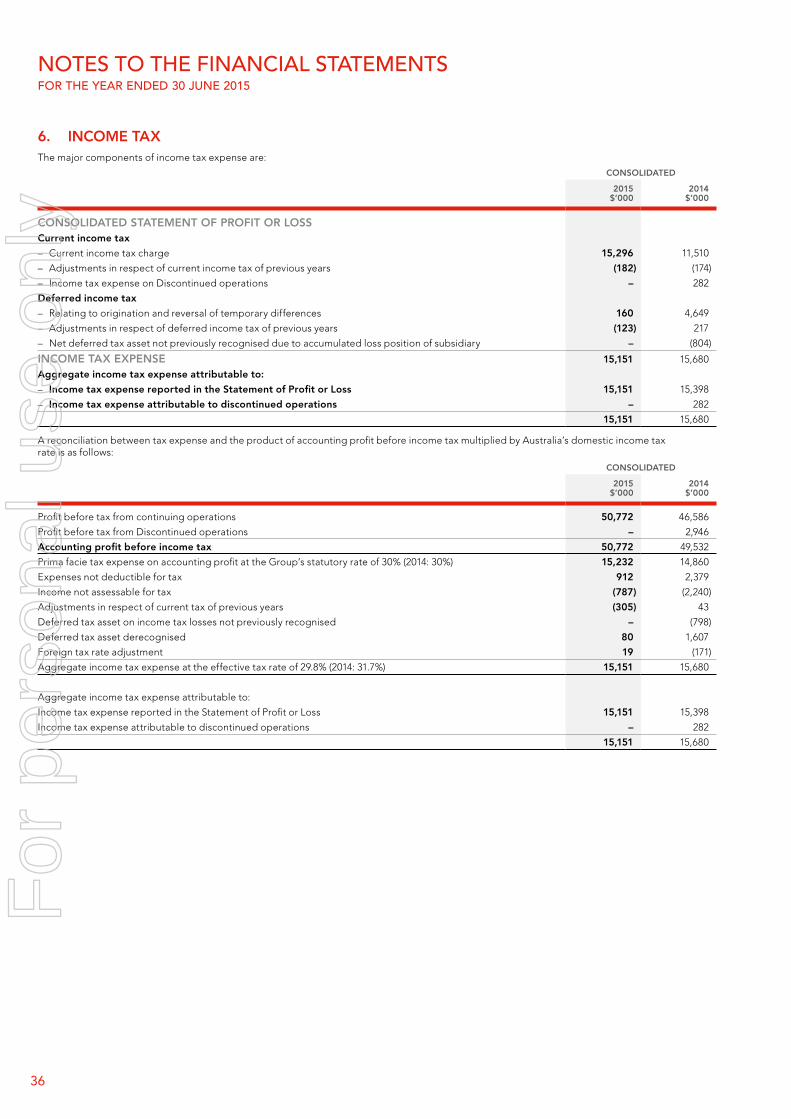
Notes to the FiNANciAL stAtemeNtsFor the YeAr eNDeD 30 JuNe 2015
6. INCOME TAxThe major components of income tax expense are:
CONSOLIDATED
2015$’000
2014$’000
CONSOLIDATED STATEMENT Of PROfIT OR LOSSCurrent income tax
– Current income tax charge 15,296 11,510
– Adjustments in respect of current income tax of previous years (182) (174)
– Income tax expense on Discontinued operations – 282
Deferred income tax
– Relating to origination and reversal of temporary differences 160 4,649
– Adjustments in respect of deferred income tax of previous years (123) 217
– Net deferred tax asset not previously recognised due to accumulated loss position of subsidiary – (804)
INCOME TAx ExPENSE 15,151 15,680
Aggregate income tax expense attributable to:
– Income tax expense reported in the Statement of Profit or Loss 15,151 15,398
– Income tax expense attributable to discontinued operations – 282
15,151 15,680
A reconciliation between tax expense and the product of accounting profit before income tax multiplied by Australia’s domestic income tax rate is as follows:
CONSOLIDATED
2015$’000
2014$’000
Profit before tax from continuing operations 50,772 46,586
Profit before tax from Discontinued operations – 2,946
Accounting profit before income tax 50,772 49,532
Prima facie tax expense on accounting profit at the Group’s statutory rate of 30% (2014: 30%) 15,232 14,860
Expenses not deductible for tax 912 2,379
Income not assessable for tax (787) (2,240)
Adjustments in respect of current tax of previous years (305) 43
Deferred tax asset on income tax losses not previously recognised – (798)
Deferred tax asset derecognised 80 1,607
Foreign tax rate adjustment 19 (171)
Aggregate income tax expense at the effective tax rate of 29.8% (2014: 31.7%) 15,151 15,680
Aggregate income tax expense attributable to:
Income tax expense reported in the Statement of Profit or Loss 15,151 15,398
Income tax expense attributable to discontinued operations – 282
15,151 15,680
36
For
per
sona
l use
onl
y

Notes to the FiNANciAL stAtemeNtsFor the YeAr eNDeD 30 JuNe 2015
(A) DEfERRED TAx ASSETS AND LIABILITIESCONSOLIDATED
2015$’000
CuRRENTINCOME TAx
2015$’000
DEfERREDINCOME TAx
2014$’000
CuRRENTINCOME TAx
2014$’000
DEfERREDINCOME TAx
Opening balance (1,737) 1,442 (7,210) 6,111
Charged to income (15,055) (36) (11,617) (3,780)
Other payments and utilisation of tax losses 11,665 (413) 17,090 (889)
Closing balance (5,127) 993 (1,737) 1,442
Tax expense in statement of comprehensive income 15,151 15,680
Amounts recognised in the statement of financial position:
Deferred tax asset 993 1,442
Deferred tax liability – –
993 1,442
CONSOLIDATED
STATEMENT Of fINANCIAL POSITION
2015$’000
2014$’000
Deferred income tax as at 30 June relates to the following:
Deferred tax liabilities
Accelerated depreciation for tax (1,048) (502)
Leased assets (53) (32)
Prepaid expenses deductible for tax (2,367) (3,196)
Income not yet assessable for tax – –
Fair value of television licences on acquisition (6,690) (6,690)
(10,158) (10,420)
Set-off of deferred tax assets 10,158 10,420
Net deferred tax liabilities – –
Deferred income tax as at 30 June relates to the following:
Deferred tax assets
Employee entitlements 1,654 1,533
Provisions 59 89
Expenses not yet deductible for tax 1,983 2,039
Difference between accounting and tax on building write off 252 505
Impairments of investments 6,690 6,690
Tax losses 513 1,006
11,151 11,862
Set-off of deferred tax liabilities (10,158) (10,420)
Net deferred tax assets 993 1,442
37Prime media GrouP AnnuAl RepoRt 2015
For
per
sona
l use
onl
y

Notes to the FiNANciAL stAtemeNtsFor the YeAr eNDeD 30 JuNe 2015
(B) INCOME TAx LOSSES 2015
$’0002014
$’000
(a) Deferred tax assets arising from tax losses of a controlled entity which at balance date are recognised as being highly probable of recovery. These losses relate to the Australian Tax Consolidated Group and an entity outside the Australian Tax Consolidated Group that is making profits. 513 1,006
(b) Deferred tax assets arising from tax losses of controlled entities not recognised at reporting date as realisation of the benefit is not regarded as highly probable(1) – 15,307
(1) Prime Television New Zealand Limited ceased trading during the financial year and was subsequently deregistered on 14 July 2015. As a result, losses that were regarded as not highly probable of being realised ceased to be available to the Group.
TAx CONSOLIDATION
(i) members of the tax consolidated group and the tax sharing arrangements Effective 1 July 2002, for the purposes of income taxation, Prime Media Group Limited and its 100% owned Australian resident subsidiaries formed a tax consolidated group. Prime Media Group Limited is the head entity of the tax consolidated group. Members of the tax consolidated group have entered into a tax sharing agreement that provides for the allocation of income tax liabilities between the entities should the head entity default on its tax payment obligations. No amounts have been recognised in the financial statements in respect of this agreement on the basis that the possibility of default is remote.
(ii) tax effect accounting by members of the consolidated group
measurement method adopted under uig 1052 tax consolidation AccountingThe head entity and the controlled entities in the tax consolidated group continue to account for their own current and deferred tax amounts. The Group has applied the Group Allocation approach in determining the appropriate amount of current taxes and deferred taxes to allocate to members of the tax consolidated group. The current and deferred tax amounts are measured in a systematic manner that is consistent with the broad principles in AASB 112 Income Taxes. The nature of the tax funding agreement is discussed further below.
In addition to its own current and deferred tax amounts, the head entity also recognises current tax liabilities (or assets) and deferred tax assets arising from unused tax losses and unused tax credits from controlled entities in the tax consolidated group.
Nature of the tax funding agreementMembers of the tax consolidated group have entered into a tax funding agreement. The tax funding agreement provides for the allocation of current taxes to members of the tax consolidated group in accordance with their taxable income for the period, while deferred taxes are allocated to members of the tax consolidated group in accordance with the principles of AASB 112 Income Taxes. Allocations under the tax funding agreement are made at the end of each half year.
The allocation of taxes under the tax funding agreement is recognised as an increase/decrease in the subsidiaries’ intercompany accounts with the tax consolidated group head company, Prime Media Group Limited. In accordance with uIG 1052: Tax Consolidation Accounting, the Group has applied the “separate taxpayer within group” approach in determining the appropriate amount of current taxes to allocate to members of the tax consolidated group.
PRIME MEDIA GROuP LIMITED
2015$’000
2014$’000
Prime Media Group Limited has recognised the following amounts as tax consolidation contribution adjustments:
Total increase to inter-company assets of Prime Media Group Limited 16,762 12,627
7. OPERATING SEGMENTS
IDENTIfICATION Of REPORTABLE SEGMENTSSince the sale of Prime’s radio broadcasting segment in August 2013, the Group has operated as a single segment being television broadcasting. The Board and Executive monitor the operating performance of the segment based on internal reports and discrete financial information that is reported to the Board on at least a monthly basis.
Television broadcasting comprises “free to air” television broadcasting through PRIME7 and GWN7.
The PRIME7 television broadcast signal services the regional locations of Northern and Southern New South Wales, Canberra, Victoria, and the Gold Coast area while regional Western Australia is serviced by the GWN7 television broadcast signal. The majority of revenue is sourced from television and online advertising in Australia.
6. INCOME TAx (CONTINuED)
38
For
per
sona
l use
onl
y

Notes to the FiNANciAL stAtemeNtsFor the YeAr eNDeD 30 JuNe 2015
8. DISCONTINuED OPERATIONS
(A) DETAILS Of OPERATIONS DISPOSED AND CLOSED DOWNThere were no discontinued operations in the current reporting period.
In the previous corresponding period, the Group completed the sale of the Group’s radio business for $24,525,000 in cash, which resulted in a pre-tax gain on sale of $2,302,000. The results of the discontinued operation for the period 1 July to 30 August 2013 are presented in the table at Note 8(B). The Radio segment consisted of the following wholly owned subsidiaries:
Prime Radio (Holdings) Pty Limited ACN: 122 696 753
Prime Radio (Townsville) Pty Limited ACN: 113 960 688
Prime Radio (Cairns) Pty Limited ACN: 113 960 722
Prime Radio (Barrier Reef) Pty Limited ACN: 113 960 651
Prime Radio (Mackay) Pty Limited ACN: 113 960 606
Prime Radio (Mackay- AM) Pty Limited ACN: 122 696 842
Prime Radio (Cairns - AM) Pty Limited ACN: 122 696 879
Prime Radio (Rockhampton) Pty Limited ACN: 113 960 624
Prime Radio (Gladstone) Pty Limited ACN: 113 960 642
AMI Radio Pty Limited ACN: 075 044 861
Hot 91 Pty Limited ACN: 101 804 371
CONSOLIDATED
2015$’000
2014$’000
(B) fINANCIAL PERfORMANCE Of OPERATIONS DISPOSED, CLOSED DOWN OR HELD fOR SALE
Revenue from external sales and customers – 3,364
Other revenue – 135
Total revenue – 3,499
Expenses – (2,855)
Net Profit attributable to discontinued operation – 644
Gain on disposal of discontinued operation – 2,302
Net Profit attributable to discontinued operation before income tax – 2,946
Income tax expense – (282)
Profit attributable to discontinued operation after tax – 2,664
Profit from discontinued operation – 2,664
Loss per share (cents per share)
– Basic from discontinued operations – 0.7
– Diluted from discontinued operations – 0.7
(C) CASH fLOW INfORMATION – DISCONTINuED OPERATIONS Net cash inflow from operating activities – 1,134
Net cash (outflow) from investing activities – (82)
Net cash (outflow) from financing activities – (1,777)
Net cash outflow from discontinued operations – (725)
(D) ASSETS HELD fOR SALETotal current assets – –
Property, plant and equipment 877 1,222
Investment in associates 86 –
Total non-current assets 963 1,222
Assets classified as held for sale 963 1,222
39Prime media GrouP AnnuAl RepoRt 2015
For
per
sona
l use
onl
y

Notes to the FiNANciAL stAtemeNtsFor the YeAr eNDeD 30 JuNe 2015
9. EARNINGS PER SHARECONSOLIDATED
2015$’000
2014$’000
Basic Earnings per share (cents per share)
– profit for the year 9.7 9.2
– profit from continuing operations 9.7 8.5
Diluted Earnings per share (cents per share)
– profit for the year 9.7 9.2
– profit from continuing operations 9.7 8.5
Basic earnings per share amounts are calculated by dividing net profit for the year attributable to ordinary equity holders of the parent by the weighted average number of ordinary shares outstanding during the year.
Diluted earnings per share amounts are calculated by dividing the net profit attributable to ordinary equity holders of the parent by the weighted average number of ordinary shares outstanding during the year plus the weighted average number of ordinary shares that would be issued on the conversion of all the dilutive potential ordinary shares into ordinary shares.
The following reflects the income and share data used in the basic and diluted earnings per share computations:
(A) EARNINGS uSED IN CALCuLATING EARNINGS PER SHARECONSOLIDATED
2015$’000
2014$’000
Net profit attributable to ordinary equity holders of the parent
Continuing operations 35,621 31,188
Discontinued operations – 2,664
Net profit attributable to ordinary equity holders of the parent 35,621 33,852
Earnings used in calculating basic and diluted earnings per share 35,621 33,852
(B) WEIGHTED AVERAGE NuMBER Of SHARESNuMBER
Of SHARESNuMBER
Of SHARES
Weighted average number of ordinary shares used in calculating basic earnings per share: 366,330,303 366,330,303
Adjusted weighted average number of ordinary shares used in calculating diluted earnings per share 366,330,303 366,330,303
All performance rights are anti-dilutive, as service and performance conditions are yet to be met. There have been no other transactions involving ordinary shares or potential ordinary shares between the reporting date and the completion of the financial statements.
(C) INfORMATION ON THE CLASSIfICATION Of SECuRITIES
EQuITY SETTLED SHARE BASED PAYMENTSEquity settled share based payments granted to employees (including KMP) as described in Note 27 are considered to be potential ordinary shares and will be included in the determination of diluted earnings per share to the extent they are dilutive when the performance rights vest.
CONSOLIDATED
2015$’000
2014$’000
Basic Earnings per share (cents per share)
– profit from core earnings 9.1 9.1
Diluted Earnings per share (cents per share)
– profit from core earnings 9.1 9.1
To calculate earnings per share amounts for the core continuing and discontinued operations, the weighted average number of ordinary shares for both basic and diluted amounts is as per the table above. The following table provides the profit figure used as the numerator:
40
For
per
sona
l use
onl
y

Notes to the FiNANciAL stAtemeNtsFor the YeAr eNDeD 30 JuNe 2015
(D) PROfIT fROM CONTINuING OPERATIONS ExCLuDING SPECIfIC ITEMS
CONSOLIDATED
2015$’000
2014$’000
Reported profit after tax from continuing operations 35,621 31,188
Reported profit after tax from discontinued operations – 2,664
35,621 33,852
– Digital Restack Program revenue (non-cash) (1,501) –
– Gain on sale of surplus assets (1,157) (2,302)
– Redundancies 78 626
– Derecognise deferred tax asset carried for New Zealand tax losses – 1,296
– Depreciation of decommissioning costs – 604
– Fair value change in receivable – deferred contingent consideration – (493)
– Income tax expense/(benefit) related to specific items 427 (188)
Core net profit after tax from operations and before specific items attributable to members of Prime Media Group Limited 33,468 33,395
The Group’s final dividend has been declared based on the core net profit after tax.
10. DIVIDENDS PAID AND PROPOSEDCONSOLIDATED
2015$’000
2014$’000
(A) RECOGNISED AMOuNTSDeclared and paid during the year
(i) CuRRENT YEAR INTERIMFranked dividends 3.8 cents per share (2014: 4.0 cents) – ordinary shares 13,921 14,653
(ii) PREVIOuS YEAR fINALFranked dividends 2.8 cents per share (2014: 3.3 cents) – ordinary shares 10,257 12,089
24,178 26,742
(B) uNRECOGNISED AMOuNTS(i) CuRRENT YEAR fINALFranked dividends 3.0 cents per share (2014: 2.8 cents) – ordinary shares 10,990 10,257
THE GROuP
2015 2014
$’000 $’000
(C) fRANKING CREDIT BALANCEThe amount of franking credits available for the subsequent financial year are:
– franking account balance as at the end of the financial year at 30% (2014: 30%) 31,889 31,050
– franking credits that will arise from the payment of income tax payable as at the end of the financial year 5,127 1,762
– franking debits that will arise from the payment of dividends as at the end of the financial year – –
37,016 32,812
The amount of franking credits available for future reporting periods
– impact on the franking account of dividends proposed or declared before the financial report was authorised for issue but not recognised as a distribution to equity holders during the period (4,710) (4,396)
32,306 28,416
(D) TAx RATESThe tax rate at which paid dividends have been franked is 30% (2014: 30%). Dividends proposed will be franked at the rate of 30% (2014: 30%).
41Prime media GrouP AnnuAl RepoRt 2015
For
per
sona
l use
onl
y

Notes to the FiNANciAL stAtemeNtsFor the YeAr eNDeD 30 JuNe 2015
11. CASH AND SHORT-TERM DEPOSITSCONSOLIDATED
2015$’000
2014$’000
Cash balance comprises:
Cash at bank and on hand 9,837 12,722
Closing cash balance 9,837 12,722
Cash at bank earns interest at floating rates based on daily bank deposit rates. The carrying amounts of cash and cash equivalents represent fair value.
Reconciliation of the net profit after tax to the net cash flows from operations
Profit after tax from continuing operations 35,621 31,188
Profit after tax from discontinued operations – 2,664
Net profit after income tax 35,621 33,852
Non-cash adjustment for:
Depreciation and amortisation 9,284 9,912
Amortisation of program rights 2,067 2,067
Provision for doubtful debts (101) (104)
Net (gain)/loss on disposal of property, plant and equipment (2,539) 157
Gain on sale of financial asset – (2,303)
Gain on foreign currency translation (12) (181)
Share of losses of associates 875 833
Share based payments expense 1,080 750
Working capital adjustments
Decrease in trade and other receivables 4,476 837
Decrease in prepayments 237 770
Increase/(decrease) in provisions 81 (68)
Increase/(decrease) in trade and other payables 2,725 (3,526)
Cash flows from operating activities 53,794 42,996
Decrease in deferred tax assets 449 6,090
Increase/(decrease) in tax provision 3,390 (6,147)
Increase/(decrease) in borrowing costs 337 (378)
Net cash flow from operating activities 57,970 42,561
42
For
per
sona
l use
onl
y
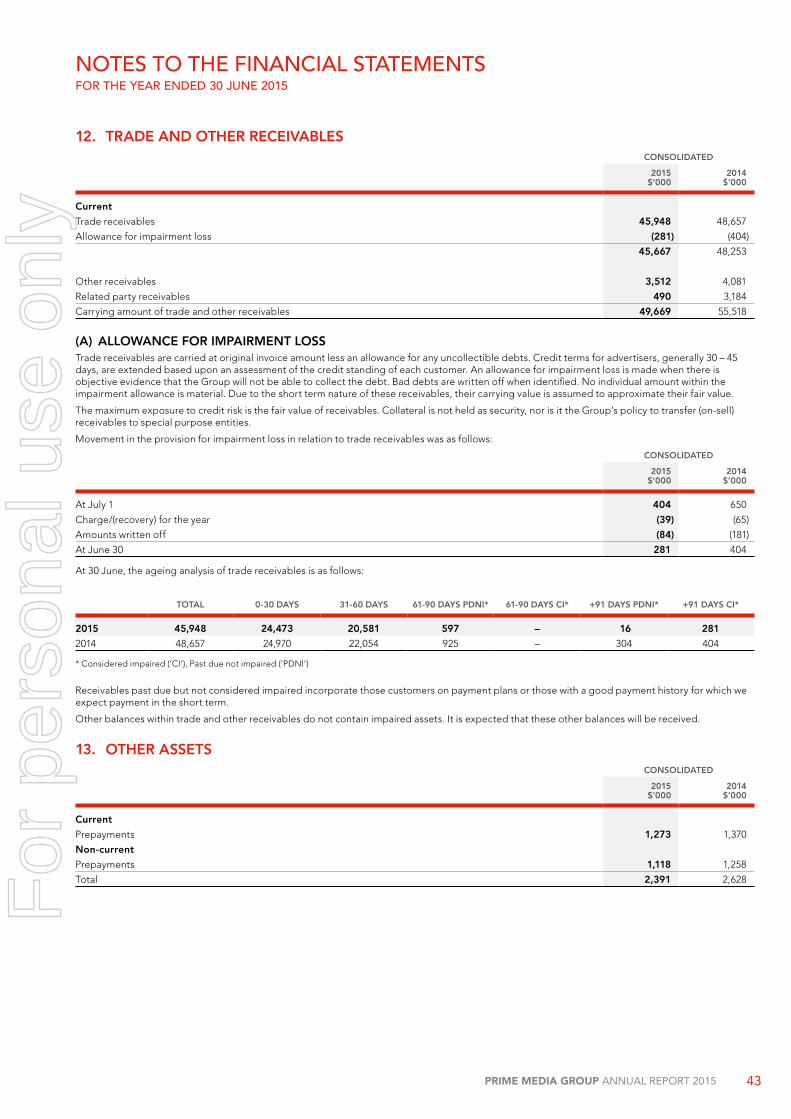
Notes to the FiNANciAL stAtemeNtsFor the YeAr eNDeD 30 JuNe 2015
12. TRADE AND OTHER RECEIVABLESCONSOLIDATED
2015$’000
2014$’000
Current
Trade receivables 45,948 48,657
Allowance for impairment loss (281) (404)
45,667 48,253
Other receivables 3,512 4,081
Related party receivables 490 3,184
Carrying amount of trade and other receivables 49,669 55,518
(A) ALLOWANCE fOR IMPAIRMENT LOSSTrade receivables are carried at original invoice amount less an allowance for any uncollectible debts. Credit terms for advertisers, generally 30 – 45 days, are extended based upon an assessment of the credit standing of each customer. An allowance for impairment loss is made when there is objective evidence that the Group will not be able to collect the debt. Bad debts are written off when identified. No individual amount within the impairment allowance is material. Due to the short term nature of these receivables, their carrying value is assumed to approximate their fair value.
The maximum exposure to credit risk is the fair value of receivables. Collateral is not held as security, nor is it the Group’s policy to transfer (on-sell) receivables to special purpose entities.
Movement in the provision for impairment loss in relation to trade receivables was as follows:
CONSOLIDATED
2015$’000
2014$’000
At July 1 404 650
Charge/(recovery) for the year (39) (65)
Amounts written off (84) (181)
At June 30 281 404
At 30 June, the ageing analysis of trade receivables is as follows:
TOTAL 0-30 DAYS 31-60 DAYS 61-90 DAYS PDNI* 61-90 DAYS CI* +91 DAYS PDNI* +91 DAYS CI*
2015 45,948 24,473 20,581 597 – 16 281
2014 48,657 24,970 22,054 925 – 304 404
* Considered impaired (‘CI’), Past due not impaired (‘PDNI’)
Receivables past due but not considered impaired incorporate those customers on payment plans or those with a good payment history for which we expect payment in the short term.
Other balances within trade and other receivables do not contain impaired assets. It is expected that these other balances will be received.
13. OTHER ASSETS CONSOLIDATED
2015$’000
2014$’000
Current
Prepayments 1,273 1,370
Non-current
Prepayments 1,118 1,258
Total 2,391 2,628
43Prime media GrouP AnnuAl RepoRt 2015
For
per
sona
l use
onl
y

Notes to the FiNANciAL stAtemeNtsFor the YeAr eNDeD 30 JuNe 2015
14. INVESTMENTS IN ASSOCIATES
(A) INVESTMENT DETAILSCONSOLIDATED
2015$’000
2014$’000
unlisted
Mildura Digital Television Pty Limited (refer to Note 8)(1) – 90
West Digital Television Pty Limited 1,259 50
West Digital Television No2 Pty Limited – –
West Digital Television No3 Pty Limited – –
West Digital Television No4 Pty Limited – –
WA SatCo Pty Limited – –
Broadcast Transmission Services Pty Limited – –
Total Investment in Associates 1,259 140
(1) The Group’s investment in Mildura Digital Television Pty Limited has been classified as held for sale in the current year.
(B) THE CONSOLIDATED ENTITY HAS A MATERIAL INTEREST IN THE fOLLOWING ENTITIES:OWNERSHIP INTEREST CONTRIBuTION TO NET PROfIT
2015%
2014%
2015$’000
2014$’000
unlisted
Mildura Digital Television Pty Limited 50% 50% (434) (376)
West Digital Television Pty Limited 50% 50% (441) (457)
West Digital Television No2 Pty Limited 50% 50% – –
West Digital Television No3 Pty Limited 50% 50% – –
West Digital Television No4 Pty Limited 50% 50% – –
WA SatCo Pty Limited 50% 50% – –
Broadcast Transmission Services Pty Limited 33% 33% – –
Total contribution to net profit (875) (833)
(C) MOVEMENTS IN THE CARRYING AMOuNT Of THE GROuP’S INVESTMENT IN ASSOCIATESCONSOLIDATED
2015$’000
2014$’000
At July 1 140 –
Contributions made (1) 2,080 1,243
Share of losses after income tax (875) (833)
Provision for loan funds still to be paid to associate – (270)
Reclassification to assets held for sale (86) –
At June 30 1,259 140
(1) Reflects loan funds advanced to associates under short term loan arrangement or in accordance with requirements of shareholder agreements. These payments are deemed to be part of the Investment in Associates for the purposes of equity accounting.
44
For
per
sona
l use
onl
y

Notes to the FiNANciAL stAtemeNtsFor the YeAr eNDeD 30 JuNe 2015
15. INVESTMENTS IN SuBSIDIARIES
CLOSED GROuP CLASS ORDER DISCLOSuRES
ENTITIES SuBJECT TO CLASS ORDER RELIEfPursuant to Class Order 98/1418, relief has been granted to Prime Television (Holdings) Pty Limited, Prime Television (Southern) Pty Limited, Prime Television (Victoria) Pty Limited, Prime Television (Northern) Pty Limited, Golden West Network Pty Limited, and Prime Television Investments Pty Limited from the Corporations Act 2001 requirements for preparation, audit and lodgement of their financial reports.
As a condition of the Class Order, Prime Media Group Limited and its 100% owned Australian resident subsidiaries entered into a Deed of Cross Guarantee on 17 October 2006 (the “Closed Group”) as amended from time to time by assumption deed for the addition and removal of controlled entities. The effect of the deed is that Prime Media Group Limited has guaranteed to pay any deficiency in the event of winding up of any of the controlled entities within the Closed Group. The controlled entities within the Closed Group, listed below, have also given a similar guarantee in the event that Prime Media Group Limited is wound up.
EQuITY INTEREST
NAMECOuNTRY Of
INCORPORATION2015
%2014
%
Prime Television (Holdings) Pty Limited Australia 100 100
Zamojill Pty Limited Australia 100 100
Prime Television (Southern) Pty Limited Australia 100 100
Prime Television (Northern) Pty Limited Australia 100 100
Prime Television (Victoria) Pty Limited Australia 100 100
Prime Properties (Albury) Pty Limited Australia 100 100
Prime Television Digital Media Pty Limited Australia 100 100
Prime Television Investments Pty Limited Australia 100 100
Golden West Network Pty Limited Australia 100 100
Mining Television Network Pty Limited Australia 100 100
Telepro Pty Limited Australia 100 100
Golden West Satellite Communications Pty Limited Australia 100 100
135 Nominees Pty Limited Australia 100 100
Mid-Western Television Pty Limited Australia 100 100
Seven Affiliate Sales Pty Limited Australia 100 100
Prime Digital Media Pty Limited Australia 100 100
Prime Digitalworks Pty Limited Australia 100 100
Prime Media Broadcasting Services Pty Limited Australia 100 100
Prime Media Communications Pty Limited Australia 100 100
Prime Growth Media Pty Limited Australia 100 100
Prime Media Group Services Pty Limited Australia 100 100
Prime New Media Investments Pty Limited Australia 100 100
Geraldton Telecasters Pty Limited Australia 100 100
The consolidated statement of comprehensive income and statement of financial position of the entities which are members of the ‘Closed Group’ are as follows:
(A) CONSOLIDATED STATEMENT Of COMPREHENSIVE INCOMECLOSED GROuP
2015$’000
2014$’000
Operating profit before income tax - continuing operations 51,667 37,994
Income tax expense attributable to operating profit (15,804) (12,585)
Operating profit after tax from continuing operations 35,863 25,409
Profit after tax from discontinued operations – 2,664
Operating profit after tax 35,863 28,073
Retained losses at beginning of the financial year (73,129) (74,460)
Dividends provided for or paid (24,178) (26,742)
Retained losses at end of the financial period (61,444) (73,129)
45Prime media GrouP AnnuAl RepoRt 2015
For
per
sona
l use
onl
y

Notes to the FiNANciAL stAtemeNtsFor the YeAr eNDeD 30 JuNe 2015
(B) CONSOLIDATED STATEMENT Of fINANCIAL POSITIONCLOSED GROuP
2015$’000
2014$’000
Assets
Current assets 63,205 72,662
Non-current assets 329,466 388,589
Total assets 392,671 461,251
Liabilities
Current liabilities 41,722 35,686
Non-current liabilities 99,310 185,803
Total liabilities 141,032 221,489
Equity 251,639 239,762
16. INVESTMENTS – AVAILABLE-fOR-SALE fINANCIAL ASSETS CONSOLIDATED
2015$’000
2014$’000
Investments at fair value:
Shares in uncontrolled entities (quoted) (i) 5 5
Investments at cost:
Shares in uncontrolled entities (unquoted) (ii) 3 3
Investments at fair value:
Shares in uncontrolled entities (unquoted) (iii) 2,500 2,500
2,508 2,508
Available-for-sale investments consist of investments in ordinary shares which do not have a fixed maturity date or coupon rate.
(i) quoted equity sharesThe fair value of the listed available-for-sale investments has been determined directly by reference to published price quotations in an active market. There are no individually material investments.
(ii) unquoted equity shares at costInvestments in shares of unlisted entities are carried at cost where fair value cannot be reliably measured. The financial instruments held are shares of an entity that has a small shareholder base and a relatively stable share register with few exchanges of shareholdings.
(iii) unlisted shares at fair valueThe fair value of the unquoted available-for-sale investments has been estimated using valuation techniques based on assumptions, which are outlined in Note 3, that are not supported by observable market information. Management believes the estimated fair value resulting from the valuation techniques and recorded in the statement of financial position and the related changes in fair value recorded in other comprehensive income are reasonable and the most appropriate at the reporting date. A reconciliation of the movement during the year is as follows:
CONSOLIDATED
2015$’000
2014$’000
Investments at fair value:
Opening balance 2,500 2,500
Closing balance 2,500 2,500
(iv) valuation sensitivityManagement has estimated the potential effect of using reasonably possible alternatives as inputs to the valuation and has quantified this as a reduction in fair value of approximately $462,000 using less favourable assumptions and an increase in fair value of approximately $462,000 using more favourable assumptions, i.e. change in Enterprise Value / EBITDA multiples of 0.25 in either direction.
impairment on available-for-sale financial investmentsFor available-for-sale financial investments, the Group assesses at each reporting date whether there is objective evidence that an investment or a group of investments is impaired. Refer to Note 2(p)(ii) for objective evidence.
15. INVESTMENTS IN SuBSIDIARIES (CONTINuED)
46
For
per
sona
l use
onl
y
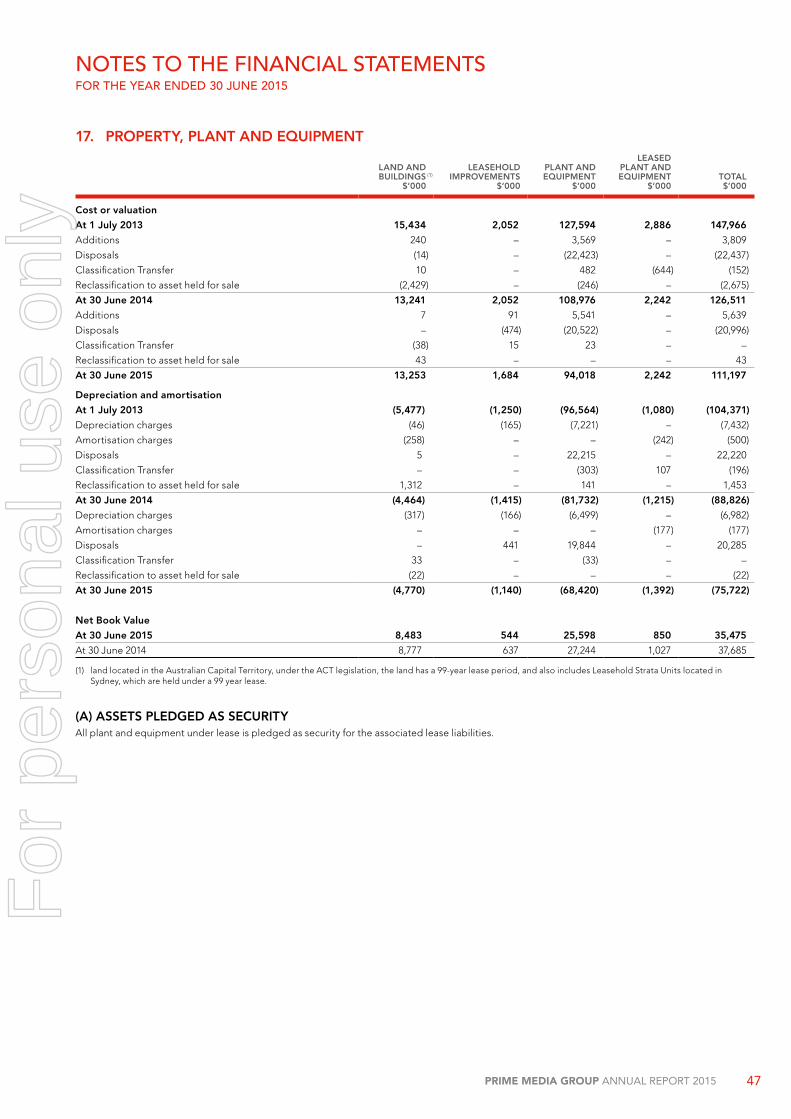
Notes to the FiNANciAL stAtemeNtsFor the YeAr eNDeD 30 JuNe 2015
17. PROPERTY, PLANT AND EQuIPMENT
LAND AND BuILDINGS (1)
$’000
LEASEHOLD IMPROVEMENTS
$’000
PLANT AND EQuIPMENT
$’000
LEASEDPLANT AND EQuIPMENT
$’000TOTAL$’000
Cost or valuation
At 1 July 2013 15,434 2,052 127,594 2,886 147,966
Additions 240 – 3,569 – 3,809
Disposals (14) – (22,423) – (22,437)
Classification Transfer 10 – 482 (644) (152)
Reclassification to asset held for sale (2,429) – (246) – (2,675)
At 30 June 2014 13,241 2,052 108,976 2,242 126,511
Additions 7 91 5,541 – 5,639
Disposals – (474) (20,522) – (20,996)
Classification Transfer (38) 15 23 – –
Reclassification to asset held for sale 43 – – – 43
At 30 June 2015 13,253 1,684 94,018 2,242 111,197
Depreciation and amortisation
At 1 July 2013 (5,477) (1,250) (96,564) (1,080) (104,371)
Depreciation charges (46) (165) (7,221) – (7,432)
Amortisation charges (258) – – (242) (500)
Disposals 5 – 22,215 – 22,220
Classification Transfer – – (303) 107 (196)
Reclassification to asset held for sale 1,312 – 141 – 1,453
At 30 June 2014 (4,464) (1,415) (81,732) (1,215) (88,826)
Depreciation charges (317) (166) (6,499) – (6,982)
Amortisation charges – – – (177) (177)
Disposals – 441 19,844 – 20,285
Classification Transfer 33 – (33) – –
Reclassification to asset held for sale (22) – – – (22)
At 30 June 2015 (4,770) (1,140) (68,420) (1,392) (75,722)
Net Book Value
At 30 June 2015 8,483 544 25,598 850 35,475
At 30 June 2014 8,777 637 27,244 1,027 37,685
(1) land located in the Australian Capital Territory, under the ACT legislation, the land has a 99-year lease period, and also includes Leasehold Strata units located in Sydney, which are held under a 99 year lease.
(A) ASSETS PLEDGED AS SECuRITYAll plant and equipment under lease is pledged as security for the associated lease liabilities.
47Prime media GrouP AnnuAl RepoRt 2015
For
per
sona
l use
onl
y
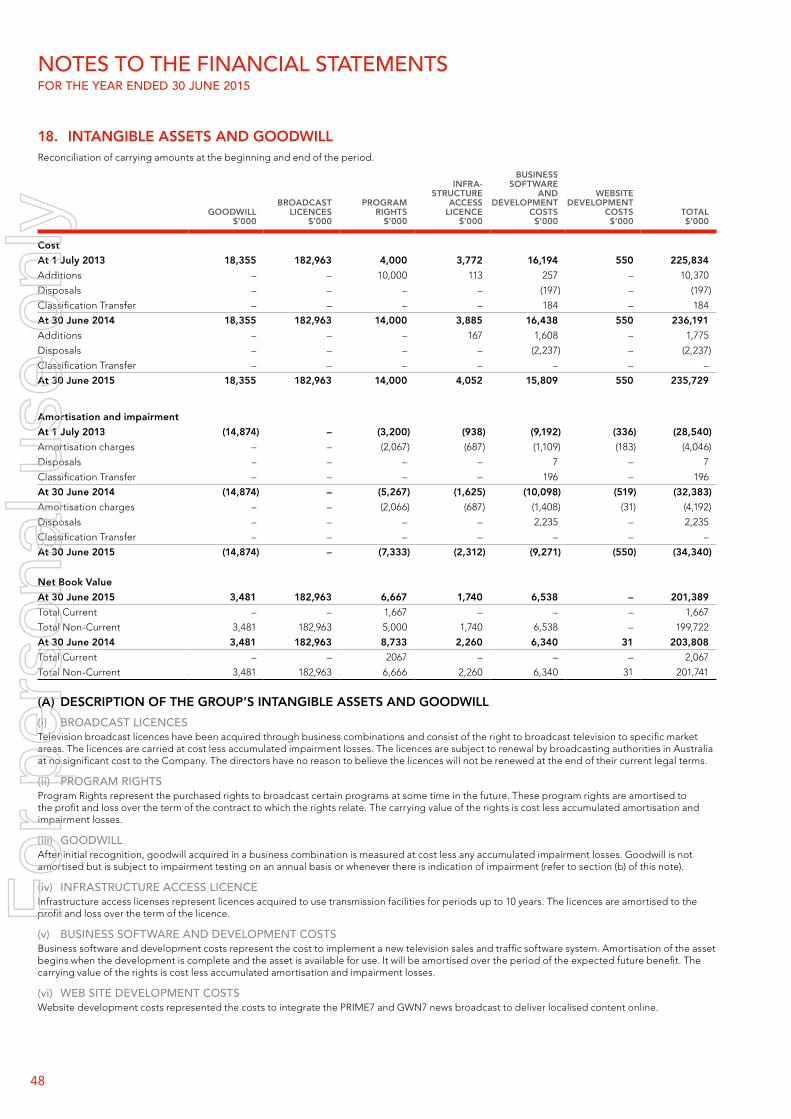
Notes to the FiNANciAL stAtemeNtsFor the YeAr eNDeD 30 JuNe 2015
18. INTANGIBLE ASSETS AND GOODWILLReconciliation of carrying amounts at the beginning and end of the period.
GOODWILL$’000
BROADCAST LICENCES
$’000
PROGRAM RIGHTS
$’000
INfRA- STRuCTuRE
ACCESS LICENCE
$’000
BuSINESS SOfTWARE
AND DEVELOPMENT
COSTS$’000
WEBSITE DEVELOPMENT
COSTS$’000
TOTAL$’000
Cost
At 1 July 2013 18,355 182,963 4,000 3,772 16,194 550 225,834
Additions – – 10,000 113 257 – 10,370
Disposals – – – – (197) – (197)
Classification Transfer – – – – 184 – 184
At 30 June 2014 18,355 182,963 14,000 3,885 16,438 550 236,191
Additions – – – 167 1,608 – 1,775
Disposals – – – – (2,237) – (2,237)
Classification Transfer – – – – – – –
At 30 June 2015 18,355 182,963 14,000 4,052 15,809 550 235,729
Amortisation and impairment
At 1 July 2013 (14,874) – (3,200) (938) (9,192) (336) (28,540)
Amortisation charges – – (2,067) (687) (1,109) (183) (4,046)
Disposals – – – – 7 – 7
Classification Transfer – – – – 196 – 196
At 30 June 2014 (14,874) – (5,267) (1,625) (10,098) (519) (32,383)
Amortisation charges – – (2,066) (687) (1,408) (31) (4,192)
Disposals – – – – 2,235 – 2,235
Classification Transfer – – – – – – –
At 30 June 2015 (14,874) – (7,333) (2,312) (9,271) (550) (34,340)
Net Book Value
At 30 June 2015 3,481 182,963 6,667 1,740 6,538 – 201,389
Total Current – – 1,667 – – – 1,667
Total Non-Current 3,481 182,963 5,000 1,740 6,538 – 199,722
At 30 June 2014 3,481 182,963 8,733 2,260 6,340 31 203,808
Total Current – – 2067 – – – 2,067
Total Non-Current 3,481 182,963 6,666 2,260 6,340 31 201,741
(A) DESCRIPTION Of THE GROuP’S INTANGIBLE ASSETS AND GOODWILL
(i) BroADcAst LiceNcesTelevision broadcast licences have been acquired through business combinations and consist of the right to broadcast television to specific market areas. The licences are carried at cost less accumulated impairment losses. The licences are subject to renewal by broadcasting authorities in Australia at no significant cost to the Company. The directors have no reason to believe the licences will not be renewed at the end of their current legal terms.
(ii) progrAm rightsProgram Rights represent the purchased rights to broadcast certain programs at some time in the future. These program rights are amortised to the profit and loss over the term of the contract to which the rights relate. The carrying value of the rights is cost less accumulated amortisation and impairment losses.
(iii) gooDwiLLAfter initial recognition, goodwill acquired in a business combination is measured at cost less any accumulated impairment losses. Goodwill is not amortised but is subject to impairment testing on an annual basis or whenever there is indication of impairment (refer to section (b) of this note).
(iv) iNFrAstructure Access LiceNceInfrastructure access licenses represent licences acquired to use transmission facilities for periods up to 10 years. The licences are amortised to the profit and loss over the term of the licence.
(v) BusiNess soFtwAre AND DeveLopmeNt costsBusiness software and development costs represent the cost to implement a new television sales and traffic software system. Amortisation of the asset begins when the development is complete and the asset is available for use. It will be amortised over the period of the expected future benefit. The carrying value of the rights is cost less accumulated amortisation and impairment losses.
(vi) weB site DeveLopmeNt costsWebsite development costs represented the costs to integrate the PRIME7 and GWN7 news broadcast to deliver localised content online.
48
For
per
sona
l use
onl
y
Notes to the FiNANciAL stAtemeNtsFor the YeAr eNDeD 30 JuNe 2015
(B) IMPAIRMENT TESTING Of GOODWILL AND INTANGIBLE ASSETS WITH INDEfINITE LIVESOn an annual basis management undertakes a value-in-use assessment of the carrying value of its television broadcasting unit’s intangible assets, which consist of television broadcast licences and goodwill, to test for impairment. The value-in-use calculation is based on the annual budget approved by the Board projected over a 5 year period using growth rate assumptions. The compound annual growth rate for advertising revenue over the 5 year period was assumed to be 0.0%. The rate was determined based on available industry research. Cashflows beyond the 5 year forecast period were extrapolated using a terminal growth rate of 2.0% (2014: 3.0%). The pre-tax discount rate applied to the cash flow projections is 10.95% (2014: 10.96%). The Discounted Cash flow (DCF) valuation of the intangibles assets gives a recoverable amount in excess of the current carrying value.
CONSOLIDATED
2015$’000
2014$’000
Carrying amount of Intangibles allocated to each of the cash generating units
Television Broadcasting Licences 182,963 182,963
Broadcast Licences 182,963 182,963
Goodwill 3,481 3,481
Goodwill on Acquisition 3,481 3,481
(C) KEY ASSuMPTIONS uSED IN VALuE IN uSE CALCuLATIONSThe value in use calculation for the television broadcasting licences is most sensitive to the following assumptions:
• Discount rate; and• Terminal growth rate used to extrapolate cash flows.
The discount rate represents the current market assessment of the risks specific to the Group, taking into consideration the time value of money and individual risks of the underlying assets that have not been incorporated in the cash flow estimates. The discount rate is based on the specific circumstances of the Group and is derived from its weighted average cost of capital (WACC). The WACC takes into account both debt and equity. The cost of equity is derived from the expected return on investment by the Group’s investors. The cost of debt is based on the interest bearing borrowings that the Group is obliged to service. Specific risks are incorporated by applying a beta factor. The beta factor is evaluated annually based on publicly available market data.
Growth rate estimates are based on published industry research, which is obtained on a regular basis throughout the reporting period.
(D) SENSITIVITY Of ASSuMPTIONSThe calculations used to assess the fair value of indefinite life intangible assets are sensitive to changes in key assumptions as follows:
• a 2 percentage point increase in the discount rate will not result in an impairment to the carrying value of indefinite life intangible assets; and• a 2 percentage point reduction in the terminal growth rate will not result in an impairment to the carrying value of indefinite life intangible assets.
49Prime media GrouP AnnuAl RepoRt 2015
For
per
sona
l use
onl
y

Notes to the FiNANciAL stAtemeNtsFor the YeAr eNDeD 30 JuNe 2015
19. TRADE AND OTHER PAYABLES CONSOLIDATED
2015$’000
2014$’000
Current
Trade payables (i) 3,366 1,102
Accrued expenses 24,722 25,194
Accrued employee leave entitlements 7,875 6,974
35,963 33,270
(i) Trade payables are non-interest bearing and are normally settled on 30 day terms.
(A) fAIR VALuESDue to the short term nature of these payables, their carrying value is considered to approximate their fair value.
20. INTEREST-BEARING LOANS AND BORROWINGS 2015
$’0002014
$’000
Current
Obligations under finance lease contracts (Note 24(e)) 2015 270 246
270 246
Non-current
Obligations under finance lease contracts (Note 24(e)) 2016 – 2017 402 672
$175 million secured bank loan facility (2014: $175 million) 2018 88,064 118,727
88,466 119,399
TERMS AND CONDITIONS
BANK LoAN FAciLitYIn 2014, the Company extended its bank loan facility to March 2018 and permanently reduced the facility limit to $175 million. The facility is secured by a charge over the assets of the borrower group comprising all wholly owned entities in Australia, but excluding Broadcast Production Services Pty Limited and its subsidiaries. Interest is charged at the BBSY rate plus a margin of between 1.50% and 1.80%.
(A) fAIR VALuESThe carrying amount of the Group’s current and non-current borrowings approximates their fair value. The fair values have been calculated by discounting the expected future cash flows at prevailing market interest rates varying from 3.6% to 4.4% (2014: 4.2% to 4.7%), depending on the type of borrowing.
The parent entity and certain controlled entities have potential financial liabilities which may arise from certain contingencies disclosed in Note 25. However the directors do not expect those potential financial liabilities to crystallise into obligations and therefore financial liabilities disclosed in the above table are the directors’ estimate of amounts that will be payable by the Group. No material losses are expected and as such, the fair values disclosed are the directors’ estimate of amounts that will be payable by the Group.
Details regarding interest rate risk are disclosed in Note 4.
(B) DEfAuLTS AND BREACHESDuring the current and prior years, there were no defaults or breaches on any of the loans.
50
For
per
sona
l use
onl
y

Notes to the FiNANciAL stAtemeNtsFor the YeAr eNDeD 30 JuNe 2015
21. PROVISIONS
CONSOLIDATED
2015$’000
2014$’000
Current
Provision for asset decommissioning 115 215
Directors’ retiring provision 250 230
365 445
Non-current
Long service leave 417 336
417 336
(A) MOVEMENTS IN PROVISIONSMovements in each class of provisions during the financial year are set out below:
DIRECTORS’ RETIRING
PROVISION$’000
PROVISION fOR ASSET
DECOM- MISSIONING
$’000
LONG SERVICE LEAVE$’000
TOTAL$’000
At 1 July 2014 230 215 336 781
Arising during the year 20 – 134 154
utilised – (100) (53) (153)
At 30 June 2015 250 115 417 782
Current 2015 250 115 – 365
Non-current 2015 – – 417 417
Total 250 115 417 782
Current 2014 230 215 – 445
Non-current 2014 – – 336 336
Total 230 215 336 781
(B) NATuRE AND TIMING Of THE PROVISIONS
(i) provisioN For Asset DecommissioNiNgThe Group has recognised a provision for decommissioning costs for the removal of analogue transmission equipment.
(ii) Director’s retiriNg provisioNRefer to Remuneration Report. The Directors’ Retiring provision was approved by shareholders in November 1997.
(iii) LoNg service LeAveRefer to Note 2(s) for the relevant accounting policy and a discussion of the significant estimations and assumptions applied in the measurement of this provision.
51Prime media GrouP AnnuAl RepoRt 2015
For
per
sona
l use
onl
y

Notes to the FiNANciAL stAtemeNtsFor the YeAr eNDeD 30 JuNe 2015
22. CONTRIBuTED EQuITY
(A) ISSuED AND PAID uP CAPITALCONSOLIDATED
2015$’000
2014$’000
Ordinary shares fully paid
366,330,303 shares (2014: 366,330,303 shares) 310,262 310,262
(B) MOVEMENTS IN SHARES ON ISSuE2015 2014
ORDINARYNuMBER Of
SHARES $’000NuMBER Of
SHARES $’000
Beginning of the financial year 366,330,303 310,262 366,330,303 310,262
End of the financial year 366,330,303 310,262 366,330,303 310,262
(C) EQuITY SETTLED SHARE BASED PAYMENTS
PRIME MEDIA GROuP LIMITED PERfORMANCE RIGHTS PLANDuring the financial year 1,517,438 performance rights (2014: 1,430,000) were issued over ordinary shares. Nil performance rights were cancelled by the Company (2014: Nil).
At the end of the year there were 4,527,438 (2014: 3,976,000) un-issued ordinary shares in respect of which performance rights were outstanding.
(D) TERMS AND CONDITIONS Of CONTRIBuTED EQuITY
ORDINARY SHARESHolders of ordinary shares have the right to receive dividends as declared and, in the event of winding up the company, to participate in the proceeds from the sale of all surplus assets in proportion to the number of and amounts paid up on shares held. Ordinary shares entitle their holder to one vote, either in person or by proxy, at a meeting of the Company.
(E) CAPITAL MANAGEMENT Capital includes equity attributable to the equity holders of the parent.
The primary objective of the Group’s capital management is to ensure that it maintains a strong credit rating and healthy capital ratios to support its business and maximise shareholder value.
The Group manages its capital structure and has regard for changes in economic conditions. To maintain or adjust the capital structure, the Group may adjust the dividend payment to shareholders, return capital to shareholders or issue new shares or sell assets to reduce debt.
During 2015, the Company paid dividends of $24,178,000 (2014: $26,742,000). The Board’s target for dividend payments is up to 75% of core earnings per share. The Board reviews the dividend target as necessary.
The Board and management monitor capital requirements with regard to its banking covenant requirements as well as comparative guidance to companies of similar size and nature of operations. The key capital management measures that the Company reviews on an ongoing basis are:
TARGET AT BALANCE DATE
Shareholder funds (Net Assets) (1) > $135,000,000 $303,613,000
Net Debt to EBITDA < 3.25 times 1.4
Interest Cover to EBITDA > 3.0 times 13.0
(1) Shareholder Funds have been adjusted to reflect the value of the Licences, as set out in the most recent independent valuation obtained December 2012.
52
For
per
sona
l use
onl
y

Notes to the FiNANciAL stAtemeNtsFor the YeAr eNDeD 30 JuNe 2015
23. RETAINED EARNINGS AND RESERVES CONSOLIDATED
2015$’000
2014$’000
Employee benefits equity reserve 4,150 3,957
Accumulated losses (140,536) (151,979)
(A) EMPLOYEE BENEfITS EQuITY RESERVE(i) NAture AND purpose oF reserveThe employee benefits equity reserve is used to record the value of equity benefits provided to employees and directors as part of their remuneration. Refer to Note 27 for further details of these plans.
(ii) movements in reserveBalance at beginning of year 3,957 3,207
Exercise of performance rights (887) –
Share based payment 1,080 750
Balance at end of year 4,150 3,957
(B) (ACCuMuLATED LOSSES)/RETAINED PROfITSBalance at the beginning of year (151,979) (156,801)
Net profit attributable to members of Prime Media Group Limited 35,621 33,852
Reclassification – (2,288)
Total accumulated losses (116,358) (125,237)
Dividends provided for or paid (24,178) (26,742)
Balance at end of year (140,536) (151,979)
53Prime media GrouP AnnuAl RepoRt 2015
For
per
sona
l use
onl
y

Notes to the FiNANciAL stAtemeNtsFor the YeAr eNDeD 30 JuNe 2015
24. COMMITMENTS
(A) CAPITAL ExPENDITuRE COMMITMENTSCONSOLIDATED
2015 $’000
2014$’000
Estimated capital expenditure contracted for at reporting date, but not provided for, payable:
– not later than one year 333 1,959
(B) LEASE ExPENDITuRE COMMITMENTS – GROuP AS LESSEEOPERATING LEASES (CONTINuING OPERATIONS GROuP AS LESSEE):
Minimum lease payments
– not later than one year 7,079 6,700
– later than one year and not later than five years 19,492 19,132
– later than five years 10,757 13,291
Aggregate lease expenditure contracted for at reporting date 37,328 39,123
Operating leases have an average lease term of 3 years for Motor Vehicles, 3 to 5 years for building leases, and 5 to 15 years for transmission site access agreements. Motor Vehicle leases are fixed monthly rentals for the term of the lease. Building leases are generally fixed for the initial lease term, then subject to Consumer Price Index adjustments if options are taken up. The majority of the transmission site leases are rentals that are subject to annual Consumer Price Index adjustment. There are no restrictions placed upon the lessee by entering into these leases.
(C) LEASE ExPENDITuRE COMMITMENTS - GROuP AS LESSORCertain assets owned or under operating leases with excess capacity have been sub-let to third parties. These non-cancellable leases have remaining terms of between 1 to 15 years. All leases include clauses to enable upward revision of the rental charges on an annual basis according to increases in the Consumer Price Index.
OPERATING LEASES (NON-CANCELLABLE GROuP AS LESSOR):
Minimum lease payments receivable
– not later than one year 1,731 1,580
– later than one year and not later than five years 4,470 3,707
– later than five years 1,740 1,118
Aggregate lease income contracted for at reporting date 7,941 6,405
(D) OTHER COMMITMENTS COVERING THE RENTAL Of TECHNICAL EQuIPMENT uNDER A LONG TERM AGREEMENT
The technical communications equipment that is fundamental to the distribution of the television programming and data communications is leased through long term operating leases between 7 and 15 years.
– not later than one year 4,400 5,250
– later than one year and not later than five years 18,098 17,771
– later than five years 6,123 10,850
28,621 33,871
(E) fINANCE LEASE COMMITMENTSCONSOLIDATED
2015 $’000
2014$’000
– not later than one year 315 312
– later than one year and not later than five years 420 735
Total minimum lease payments 735 1,047
– future finance charges (63) (129)
Lease liability 672 918
– current liability 270 246
– non-current liability 402 672
672 918
54
For
per
sona
l use
onl
y

Notes to the FiNANciAL stAtemeNtsFor the YeAr eNDeD 30 JuNe 2015
(f) fINANCE LEASE COMMITMENTS AT PRESENT VALuECONSOLIDATED
2015 $’000
2014$’000
– not later than one year 301 299
– later than one year and not later than five years 371 619
Present value of minimum lease payments 672 918
(G) OTHER COMMITMENTS COVERING TRANSMISSION MAINTENANCE, SITE INSTALLATION AND MANAGEMENT SERVICES
The Company entered into a contract with Broadcast Transmission Services Pty Limited (refer to Note 30) on 1 April 2008, for the provision of site maintenance services over a 10 year period at an annual cost of $1,200,000 per annum.
– not later than one year 1,200 1,200
– later than one year and not later than five years 2,100 3,300
3,300 4,500
25. CONTINGENT LIABILITIESThe Group has guaranteed to an unrelated third party the payment of a contractual commitment of WA SatCo Pty Limited, an associate company in which the Group holds 50% of the share capital. WA SatCo Pty Limited has entered into a non-cancellable contract for the purchase of satellite services in WA until 30 June 2020 at the rate of $2,346,192 per annum. In the event that WA SatCo Pty Limited defaults on any payments under this contract, the Group may be liable for full payment under the guarantee it has provided. WA SatCo Pty Limited has simultaneously entered into an agreement with the Commonwealth Government which provides for 100% funding of this satellite service to 30 June 2020. This agreement can be terminated without notice by the Commonwealth Government.
CONSOLIDATED
2015 $’000
2014$’000
Maximum potential contingent commitment arising from the above mentioned guarantee:
– not later than one year 2,346 2,346
– later than one year and not later than five years 9,384 9,384
– later than five years – 2,346
Maximum contingent commitments 11,730 14,076
As noted above the entire maximum potential contingent commitment is offset by government funding.
26. EMPLOYEE BENEfIT LIABILITY
EMPLOYEE BENEfITS
CONSOLIDATED
NOTES 2015 $’000
2014$’000
The aggregate employee benefit liability is comprised of:
Accrued annual leave and long service leave (current) 19 7,875 6,974
Accrued long service leave (non-current) 21 417 336
8,292 7,310
55Prime media GrouP AnnuAl RepoRt 2015
For
per
sona
l use
onl
y

Notes to the FiNANciAL stAtemeNtsFor the YeAr eNDeD 30 JuNe 2015
27. SHARE BASED PAYMENTS
(A) RECOGNISED SHARE BASED PAYMENT ExPENSESThe expense recognised for employee services received during the year is shown in the table below:
CONSOLIDATED
2015$’000
2014$’000
Expense arising from equity-settled share-based payment transactions 1,080 750
The share-based payment plan is described below. During the financial year, nil performance rights lapsed (2014: Nil), nil performance rights were forfeited (2014: Nil) and nil performance rights were cancelled (2014: Nil).
(B) PRIME MEDIA GROuP LIMITED PERfORMANCE RIGHTS PLANAt the 2011 Annual General Meeting, shareholders approved the Prime Media Group Limited Performance Rights Plan, which was established for Senior Executives of the consolidated entity. The rights are issued for nil consideration and are granted in accordance with the plan’s guidelines established by the Directors of Prime Media Group Limited. The rights vest over a 36 month period subject to continuing service and achieving the following targets:
• 60% of the rights will be subject to achievement of annual core earnings per share (EPS) targets; and • 40% of the rights will be subject to achievement of annual power ratio targets (revenue share: audience share).
The rights cannot be transferred and will lapse 30 days after vesting date.
(C) SuMMARY Of RIGHTS GRANTED uNDER PRIME MEDIA GROuP LIMITED PERfORMANCE RIGHTS The following table outlines the number (No.) and weighted average exercise price (WAEP) of, and movements in, performance rights on issue during the year.
2015 2014
NO. WAEP NO. WAEP
Balance at beginning of year 3,976,000 $0.00 2,546,000 $0.00
– granted 1,517,438 – 1,430,000 –
– exercised (966,000) – – –
– lapsed – – – –
– cancelled – – – –
– forfeited – – – –
Balance at end of year 4,527,438 $0.00 3,976,000 $0.00
Exercisable at end of year – – – –
(D) PERfORMANCE RIGHTS PRICING MODEL
PRIME MEDIA GROuP PERfORMANCE RIGHTS PLANEmployees must remain in service for a period of three years from date of grant. The fair value of performance rights granted in 2015 and 2014 was estimated at the date of the grant using a Black-Scholes methodology, taking into account the terms and conditions upon which the performance rights were granted.
The fair value of performance rights granted in 2013 and prior years was estimated at the date of the grant using a Monte-Carlo methodology, taking into account the terms and conditions upon which the performance rights were granted. The fair value of performance rights granted during the year was estimated on the date of grant using the following inputs to the model:
2015 2014 2013
NOV 14 AuG 14 NOV 2013 OCT 2012 NOV 2012
Expected annual dividends 6.80 7.30 6.89 8.23 8.23
Expected volatility (%) 26.94 27.45 29.00 33.65 35.02
Expected life of performance rights (years) 3 3 3 3 3
Performance rights exercise price ($) 0.00 0.00 0.00 0.00 0.00
Share price at grant date ($) 0.86 1.03 1.06 0.80 0.81
The dividend yield reflects the assumption that the current dividend payout will continue. The expected life of the performance rights is based on historical data and is not necessarily indicative of exercise patterns that may occur. The expected volatility reflects the assumption that the historical volatility is indicative of future trends, which may also not necessarily be the actual outcome.
(E) WEIGHTED AVERAGE REMAINING CONTRACTuAL LIfEThe weighted average remaining contractual life of performance rights outstanding as at 30 June 2015 is 1.3 years (2014: 1.5 years).
(f) RANGE Of ExERCISE PRICEThe range of exercise price for performance rights outstanding at the end of the year was $0.00 (2014: $0.00).
(G) WEIGHTED AVERAGE fOR VALuEThe weighted average fair value of performance rights granted during the year was $0.75 (2014: $0.84).
56
For
per
sona
l use
onl
y

Notes to the FiNANciAL stAtemeNtsFor the YeAr eNDeD 30 JuNe 2015
28. SuBSEQuENT EVENTSOn 28 July 2015, the Company announced that it had begun broadcasting the Victorian Racing.com racing network to the viewing areas of regional Northern NSW, Gold Coast, Southern NSW, the Australian Capital Territory, Victoria and Western Australia on Channel 68.
29. AuDITOR’S REMuNERATIONCONSOLIDATED
2015$
2014$
Amounts received or due and receivable by Ernst & Young Australia for:
– an audit or review of the financial report of the entity and any other entity in the consolidated entity 264,974 296,109
– other services in relation to the entity and any other entity in the consolidated entity 57,344 73,703
– amounts received or due and receivable by related practices of Ernst & Young 23,870 12,906
346,188 382,718
30. RELATED PARTY DISCLOSuRES
(A) SuBSIDIARIESThe consolidated financial statements include the financial statements of Prime Media Group Limited and the subsidiaries listed in the following table:
EQuITY INTEREST
NAME COuNTRY Of INCORPORATION2015
%2014
%
Prime Television (Holdings) Pty Limited Australia 100 100
Prime Television Digital Media Pty Limited Australia 100 100
Prime Digital Media Pty Limited Australia 100 100
Prime Media Group Services Pty Limited Australia 100 100
Prime Media Communications Pty Limited Australia 100 100
Prime New Media Investments Pty Limited Australia 100 100
Prime Growth Media Pty Limited Australia 100 100
Prime Television (Victoria) Pty Limited Australia 100 100
Prime Properties (Albury) Pty Limited Australia 100 100
Prime Television (Southern) Pty Limited Australia 100 100
Prime Television (Northern) Pty Limited Australia 100 100
Prime Television Investments Pty Limited Australia 100 100
Golden West Network Pty Limited Australia 100 100
Mining Television Network Pty Limited Australia 100 100
Telepro Pty Limited Australia 100 100
135 Nominees Pty Limited Australia 100 100
Golden West Satellite Communications Pty Limited Australia 100 100
Mid-Western Television Pty Limited Australia 100 100
Geraldton Telecasters Pty Limited Australia 100 100
Zamojill Pty Limited Australia 100 100
Seven Affiliate Sales Pty Limited Australia 100 100
Prime Media Broadcasting Services Pty Limited Australia 100 100
Broadcast Production Services Pty Limited Australia 100 100
Production Strategies Pty Limited as trustee for Production Strategies Discretionary Trust Australia 100 100
Wastar International Pty Limited Australia 100 100
Screenworld Pty Limited Australia 100 100
OSB Holdings Pty Limited as trustee for the OSB unit Trust Australia 100 100
On Site Broadcasting Pty Limited Australia 100 100
OSB Australia Pty Limited Australia 100 100
OSB Corporation Pty Limited Australia 100 100
On Corporation Pty Limited Australia 100 100
Prime Digitalworks Pty Limited Australia 100 100
Broadcast Rentals Pty Limited Australia 100 100
Prime Television New Zealand Limited (de-registered 14 July 2015) New Zealand 100 100
Prime Ventures New Zealand Limited New Zealand – 100
57Prime media GrouP AnnuAl RepoRt 2015
For
per
sona
l use
onl
y

Notes to the FiNANciAL stAtemeNtsFor the YeAr eNDeD 30 JuNe 2015
(B) uLTIMATE PARENTPrime Media Group Limited is the ultimate Australian entity and the ultimate parent entity of the Group.
(C) KEY MANAGEMENT PERSONNEL (KMP)CONSOLIDATED
2015$’000
2014$’000
Short term employee benefits 4,568 3,921
Post-employment benefits 154 122
Long term benefits 55 29
Share based payments 1,080 744
TOTAL 5,857 4,816
The amounts disclosed in the table are the amounts recognised as an expense during the reporting period that related to KMP. Details of remuneration amounts paid to individual KMP are disclosed in tables 1 and 2 of section 4 of the Remuneration Report.
TRANSACTIONS WITH RELATED PARTIES
WHOLLY OWNED GROuP TRANSACTIONSSales and purchases are made within the wholly owned group in arm’s length transactions both at normal market prices and on normal commercial terms. Outstanding balances at year end are unsecured, interest free and settled through intercompany accounts.
RBA HOLDINGS PTY LIMITEDThis company is owned by regional television operators. This company operates as a provider of transmission facilities under the Digital Black Spots Infill licence. The Company has entered into agreements under normal commercial terms and conditions with this company to use these transmission facilities for periods up to 10 years.
REGIONAL TAM PTY LIMITEDThis company is owned by regional television operators to facilitate and manage the audience metering services for the regional television markets. The Company is party to a commercial agreement in which it purchases ratings services from Regional TAM Pty Limited. This agreement is under normal commercial terms and conditions.
WA SATCO PTY LIMITEDWA SatCo Pty Limited is owned by the Company and WIN Television Pty Limited and has been engaged by the Commonwealth Government to provide the WA Vast Service until 30 June 2020. The shareholders of the company provide services to WA SatCo to enable its operations. These services are recovered from WA SatCo on a cost recovery basis.
BROADCAST TRANSMISSION SERVICES PTY LIMITED (BTS)The Company has a 33% shareholding in BTS. BTS provides transmission maintenance, site installation and management services to regional broadcasters and other third party customers. The Company entered into a contract with BTS for the provision of site maintenance services for the period to 2018 at an annual cost of $1,200,000 per annum under normal commercial terms and conditions.
CHANNEL SEVEN QuEENSLAND PTY LIMITEDThe Company provides sales representation services to Channel Seven Queensland Pty Limited, an entity associated with one of the Company’s major shareholders. The fees payable by Channel Seven Queensland Pty Limited are based on normal commercial terms and conditions applicable to this type of service.
RILEY STREET CONSuLTING PTY LIMITEDThis company, which provided consulting services to the Group to the value of $10,190 during the period, has an association with the Group’s General Counsel and Company Secretary. The consultancy fees payable by the Group were reviewed and approved by the CEO prior to the services being provided, and were based on normal commercial terms and conditions applicable to this type of service.
30. RELATED PARTY DISCLOSuRES (CONTINuED)
58
For
per
sona
l use
onl
y

Notes to the FiNANciAL stAtemeNtsFor the YeAr eNDeD 30 JuNe 2015
31. PARENT ENTITY INfORMATIONPRIME MEDIA
GROuP LIMITED
2015 $’000
2014$’000
Current assets 106 235
Total assets 312,078 382,914
Current liabilities 5,477 2,240
Total liabilities 103,515 146,816
Issued capital 310,262 310,262
Retained earnings (105,849) (78,746)
Employee benefits reserve 4,150 4,583
Total shareholders’ equity 208,563 236,099
Loss of the parent entity (3,550) (3,790)
Total comprehensive loss of the parent entity (3,550) (3,790)
GuARANTEES ENTERED INTO BY PRIME MEDIA GROuP LIMITED IN RELATION TO THE DEBTS Of ITS SuBSIDIARIESAs a condition of the Class Order, Prime Media Group Limited and its 100% owned Australian resident subsidiaries (the “Closed Group”) entered into a Deed of Cross Guarantee on 17 October 2006 as amended from time to time by assumption deed for the addition and removal of controlled entities. The effect of the deed is that Prime Media Group Limited has guaranteed to pay any deficiency in the event that a controlled entity within the Closed Group is wound up. The controlled entities within the Closed Group have also given a similar guarantee in the event that Prime Media Group Limited is wound up. (Refer Note 15).
CONTINGENT LIABILITIES Of PRIME MEDIA GROuP LIMITEDBy virtue of being a member of the Deed of Cross Guarantee mentioned above, the Company has guaranteed to pay any deficiency in the event of winding up Golden West Network Pty Limited (GWN), a wholly owned subsidiary and party to the Deed of Cross Guarantee. GWN has guaranteed to an unrelated third party the payment of a contractual commitment on behalf of WA SatCo Pty Limited, an associate company in which GWN holds 50% of the share capital. WA SatCo Pty Limited has entered into a non-cancellable contract for the purchase of satellite services in WA until 30 June 2020 at the rate of $2,346,192 per annum. In the event that WA SatCo Pty Limited defaults on any payments under this contract, GWN may be liable for full payment under the guarantee it has provided. WA SatCo Pty Limited has simultaneously entered into an agreement with the Commonwealth Government which provides for 100% funding of this satellite service to 30 June 2020. This agreement can be terminated without notice by the Commonwealth Government.
59Prime media GrouP AnnuAl RepoRt 2015
For
per
sona
l use
onl
y

Directors’ DecLArAtioNFor the YeAr eNDeD 30 JuNe 2015
In accordance with a resolution of the directors of Prime Media Group Limited, I state that:
(1) In the opinion of the directors:
(a) the financial statements and notes of Prime Media Group Limited for the financial year ended 30 June 2015 are in accordance with the Corporations Act 2001, including:
(i) giving a true and fair view of the consolidated entity’s financial position as at 30 June 2015 and of its performance for the year ended on that date; and
(ii) complying with Accounting Standards and the Corporations Regulations 2001;
(b) the financial statements and notes also comply with International Financial Reporting Standards as disclosed in Note 2(b); and
(c) there are reasonable grounds to believe that the Company will be able to pay its debts as and when they become due and payable.
(2) This declaration has been made after receiving the declarations required to be made to the Directors by the Chief Executive Officer and Chief Financial Officer in accordance with section 295A of the Corporations Act 2001 for the financial year ending 30 June 2015.
On behalf of the Board
P.J Macourt
Director
Sydney, 26 August 2015
60
For
per
sona
l use
onl
y

iNDepeNDeNt AuDit report
Ernst & Young 680 George Street Sydney NSW 2000 Australia GPO Box 2646 Sydney NSW 2001
Tel: +61 2 9248 5555 Fax: +61 2 9248 5959 ey.com/au
Independent auditor’s report to the members of Prime Media Group Limited
Report on the financial report
We have audited the accompanying financial report of Prime Media Group Limited, which comprises the consolidated statement of financial position as at 30 June 2015, the consolidated statement of comprehensive income, the consolidated statement of changes in equity and the consolidated statement of cash flows for the year ended, notes comprising a summary of significant accounting policies and other explanatory information, and the directors’ declaration of the consolidated entity comprising the company and the entities it controlled at the year’s end or from time to time during the financial year.
Directors’ responsibility for the financial report
The directors of the company are responsible for the preparation of the financial report that gives a true and fair view in accordance with Australian Accounting Standards and the Corporations Act 2001 and for such internal controls as the directors determine are necessary to enable the preparation of the financial report that is free from material misstatement, whether due to fraud or error. In Note 2, the directors also state, in accordance with Accounting Standard AASB 101 Presentation of Financial Statements, that the financial statements comply with International Financial Reporting Standards.
Auditor’s responsibility
Our responsibility is to express an opinion on the financial report based on our audit. We conducted our audit in accordance with Australian Auditing Standards. Those standards require that we comply with relevant ethical requirements relating to audit engagements and plan and perform the audit to obtain reasonable assurance about whether the financial report is free from material misstatement. An audit involves performing procedures to obtain audit evidence about the amounts and disclosures in the financial report. The procedures selected depend on the auditor’s judgment, including the assessment of the risks of material misstatement of the financial report, whether due to fraud or error. In making those risk assessments, the auditor considers internal controls relevant to the entity’s preparation and fair presentation of the financial report in order to design audit procedures that are appropriate in the circumstances, but not for the purpose of expressing an opinion on the effectiveness of the entity’s internal controls. An audit also includes evaluating the appropriateness of accounting policies used and the reasonableness of accounting estimates made by the directors, as well as evaluating the overall presentation of the financial report. We believe that the audit evidence we have obtained is sufficient and appropriate to provide a basis for our audit opinion.
Independence
In conducting our audit we have complied with the independence requirements of the Corporations Act 2001. We have given to the directors of the company a written Auditor’s Independence Declaration, a copy of which is included in the directors’ report.
61Prime media GrouP AnnuAl RepoRt 2015
For
per
sona
l use
onl
y

iNDepeNDeNt AuDit report
Opinion In our opinion:
a. the financial report of Prime Media Group Limited is in accordance with the Corporations Act 2001, including:
i giving a true and fair view of the consolidated entity’s financial position as at 30 June 2015
and of its performance for the year ended on that date; and ii complying with Australian Accounting Standards and the Corporations Regulations 2001;
and
b. the financial report also complies with International Financial Reporting Standards as disclosed in Note 2.
Report on the remuneration report
We have audited the Remuneration Report included in the director’s report for the year ended 30 June 2015. The directors of the company are responsible for the preparation and presentation of the Remuneration Report in accordance with section 300A of the Corporations Act 2001. Our responsibility is to express an opinion on the Remuneration Report, based on our audit conducted in accordance with Australian Auditing Standards.
Opinion In our opinion, the Remuneration Report of Prime Media Group Limited for the year ended 30 June 2015, complies with section 300A of the Corporations Act 2001.
Ernst & Young
Chris George Partner Sydney 26 August 2015
A member firm of Ernst & Young Global Limited Liability limited by a scheme approved under Professional Standards Legislation
62
For
per
sona
l use
onl
y

AsX ADDitioNAL iNFormAtioNFor the YeAr eNDeD 30 JuNe 2015
Additional information required by the Australian Securities Exchange Ltd and not shown elsewhere in this report is as follows. The information is current as at 20 August 2015.
(A) DISTRIBuTION Of EQuITY SECuRITIES
ORDINARY SHARESAs at 20 August 2015, total number of fully paid up shares on issue is 366,330,303.
The number of shareholders, by size of holding, in each class of share is:
NuMBER Of HOLDERS
1–1,000 603
1,001–5,000 1,141
5,001–10,000 730
10,001–100,000 1,180
100,001 and over 102
3,756
The number of shareholders holding less than a marketable parcel of shares: 460
(B) TWENTY LARGEST REGISTERED SHAREHOLDERSThe names of the twenty largest registered holders of quoted shares at 20 August 2015 are:
LISTED ORDINARY SHARES
NuMBER Of SHARES
PERCENTAGE Of ORDINARY
SHARES
1 JP Morgan Nominees Australia Limited 59,433,027 16.22
2 National Nominees Limited 49,918,679 13.63
3 RBC Investor Services Australia Nominees Pty Limited 42,455,701 11.59
4 Network Investment Holdings Pty Limited 41,701,955 11.38
5 BNP Paribas Noms Pty Limited 20,976,729 5.73
6 Citicorp Nominees Pty Limited 20,142,789 5.50
7 HSBC Custody Nominees (Australia) Limited 14,538,160 3.97
8 AMP Life Limited 9,407,602 2.57
9 RBC Investor Services Australia Nominees Pty Limited 8,358,784 2.28
10 Birketu Pty Limited 8,000,000 2.18
11 Mr George Walter Mooratoff 5,000,000 1.36
12 HSBC Custody Nominees (Australia) Limited 4,531,231 1.24
13 RBC Investor Services Australia Nominees Pty Limited 3,478,260 0.95
14 Brispot Nominees Pty Ltd 2,479,308 0.68
15 Citicorp Nominees Pty Limited 2,426,766 0.66
16 Franed Pty Limited 1,650,000 0.45
17 Equitas Nominees Pty Limited 1,045,681 0.29
18 Mr Michael Siddle & Mrs Lee Siddle ATF Siddle Family 983,572 0.27
19 Mr Gerard Van Camp and Mrs Joanna Van Camp 926,305 0.25
20 CVC Limited 908,657 0.25
298,363,206 81.45
63Prime media GrouP AnnuAl RepoRt 2015
For
per
sona
l use
onl
y

AsX ADDitioNAL iNFormAtioNFor the YeAr eNDeD 30 JuNe 2015
(C) SuBSTANTIAL SHAREHOLDERSThe names of substantial shareholders who have notified the Company in accordance with section 671B of the Corporations Act 2001 are:
NuMBER Of SHARES
PERCENTAGE Of ORDINARY
SHARES
Perpetual Limited 53,911,700 14.72%
Network Investment Holdings Pty Ltd and Seven Group Holdings Limited 41,701,955 11.38%#
Ashblue Holdings Pty Limited and Mr Kerry Stokes 41,701,955 11.38%#
North Aston Pty Limited, Wroxby Pty Limited, Australian Capital Equity Pty Limited, ACE Group entities and Mr Kerry Stokes 41,701,955 11.38%#
Invesco Australia Limited 21,405,049 5.84%
NovaPort Capital Pty Limited 21,335,304 5.82%
# These substantial shareholdings relate to the same parcel of shares.
(D) VOTING RIGHTSAll ordinary shares (whether fully paid or not) carry one vote per share without restriction.
64
For
per
sona
l use
onl
y

Designed and produced by ArmstrongQ – www.armstrongQ.com.au
For
per
sona
l use
onl
y

www.primemedia.com.au
For
per
sona
l use
onl
y


