116
CREATING NEW EXPERIENCES ANNUAL REPORT 2016 For personal use only

CREATING NEW EXPERIENCES
ANNUAL REPORT 2016
For
per
sona
l use
onl
y

INSIDE
From local shopping centres to premium retail destinations that compete on an international stage, we aim to enrich our communities by providing unique centres with the shops, services and amenities that they need.
ABOUT US
01 Performance highlights
04 Chairman’s review
06 CEO and Managing Director’s review
09 Operatingandfinancialreview
20 Enhancing the portfolio
26 Digital
28 Our people
30 Sustainability
32 Corporate Governance
33 Board of Directors
36 Executive Committee
38 Tax transparency
42 Financial report
43 Directors’ report
47 Remuneration report
67 Financial statements
112 Corporate directory
About this reportThis annual report is a summary of Vicinity Centres’ operations, activitiesandfinancialpositionasat30June2016.Inthisreport,references to ‘Vicinity’, ‘Group’, ‘we’, ‘us’ and ‘our’ refer to Vicinity Centresunlessotherwisestated.
Referencesinthisreporttoa‘year’and‘FY16’refertothefinancialyearended30June2016unlessotherwisestated. AlldollarfiguresareexpressedinAustraliandollars(AUD)unlessotherwisestated.
Vicinity is committed to reducing the environmental footprint associated with the production of the Annual Report and printed copies are only posted to securityholders who have elected to receiveaprintedcopy.ThisreportisprintedonenvironmentallyresponsiblepapermanufacturedunderISO14001environmentalstandards.
DisclaimerThis report contains forward-looking statements, including statements, indications and guidance regarding future earnings, distributionsandperformance.Theforward-lookingstatements are based on information available to Vicinity Centres as at the dateofthisreport(17August2016).Theseforward-lookingstatements are not guarantees or predictions of future results or performance expressed or implied by the forward-looking statements and involve known and unknown risks, uncertainties, assumptions and other factors, many of which are beyond the controlofVicinityCentres.TheactualresultsofVicinityCentresmay differ materially from those expressed or implied by these forward-looking statements, and you should not place undue relianceonsuchforward-lookingstatements.Exceptasrequired bylaworregulation(includingtheASXListingRules),weundertakenoobligationtoupdatetheseforward-lookingstatements.
For
per
sona
l use
onl
y
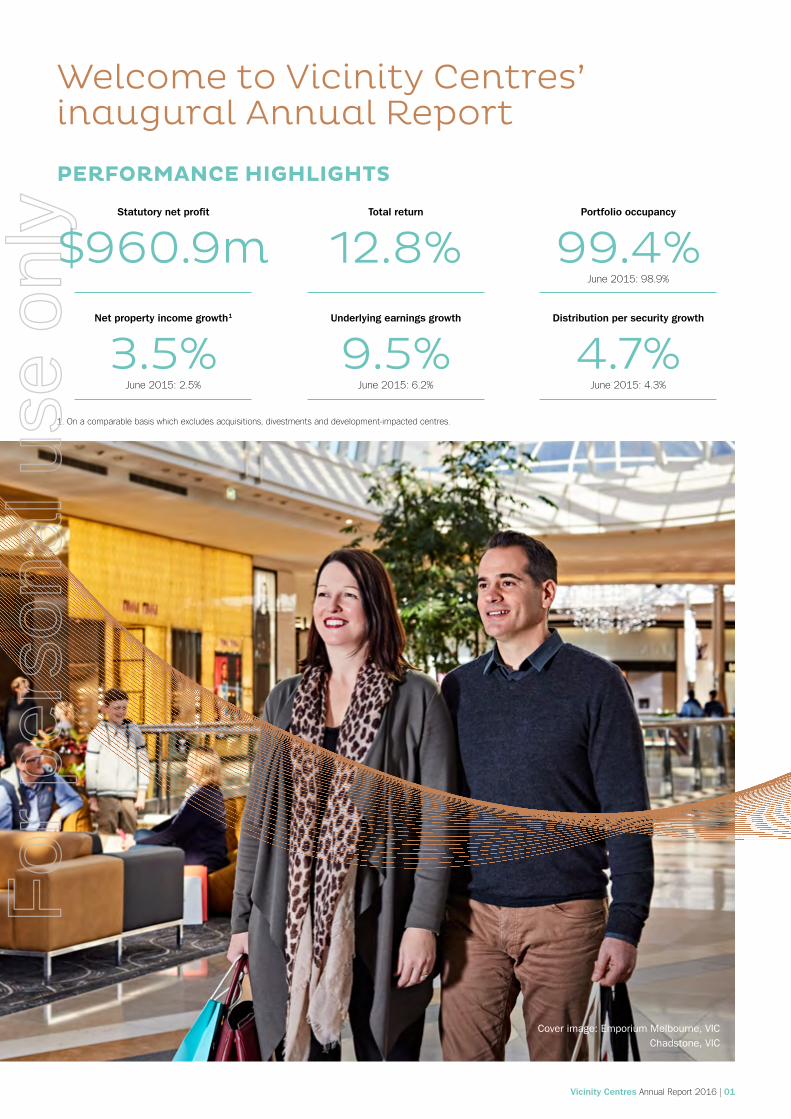
Welcome to Vicinity Centres’ inaugural Annual Report
PERFORMANCE HIGHLIGHTS
Statutory net profit
$960.9mNet property income growth1
3.5%June2015:2.5%
Total return
12.8%Underlying earnings growth
9.5%June2015:6.2%
Portfolio occupancy
99.4%June2015:98.9%
Distribution per security growth
4.7%June2015:4.3%
1.Onacomparablebasiswhichexcludesacquisitions,divestmentsanddevelopment-impactedcentres.
Cover image: Emporium Melbourne, VICChadstone, VIC
Vicinity Centres AnnualReport2016|01
For
per
sona
l use
onl
y

AN ACTIVE FIRST 12 MONTHS AS VICINITY CENTRES
June 2015Merger of Novion Property Group and Federation Centrescompleted.
November 2015Rebrand to
VicinityCentres.
December 2015Reiterated strategy and
announced~$750mto$1bdivestmentprogram.
1.Excludingacquisitioncosts.
Assets under management
2015
JULY AUGUST SEPTEMBER OCTOBER NOVEMBER DECEMBER
2016
JANUARY
F
EBRUARY
MARCH
APRIL MAY JUNE
Total value
$23.6bGross lettable area
2.9m sqm
Leases
9,100+
Retail assets
91Annual retail sales
$18.2b
December 2015Merger
refinancingcompleted.
Two assets acquiredin
Perth for $303m1.
02|Vicinity Centres AnnualReport2016
For
per
sona
l use
onl
y
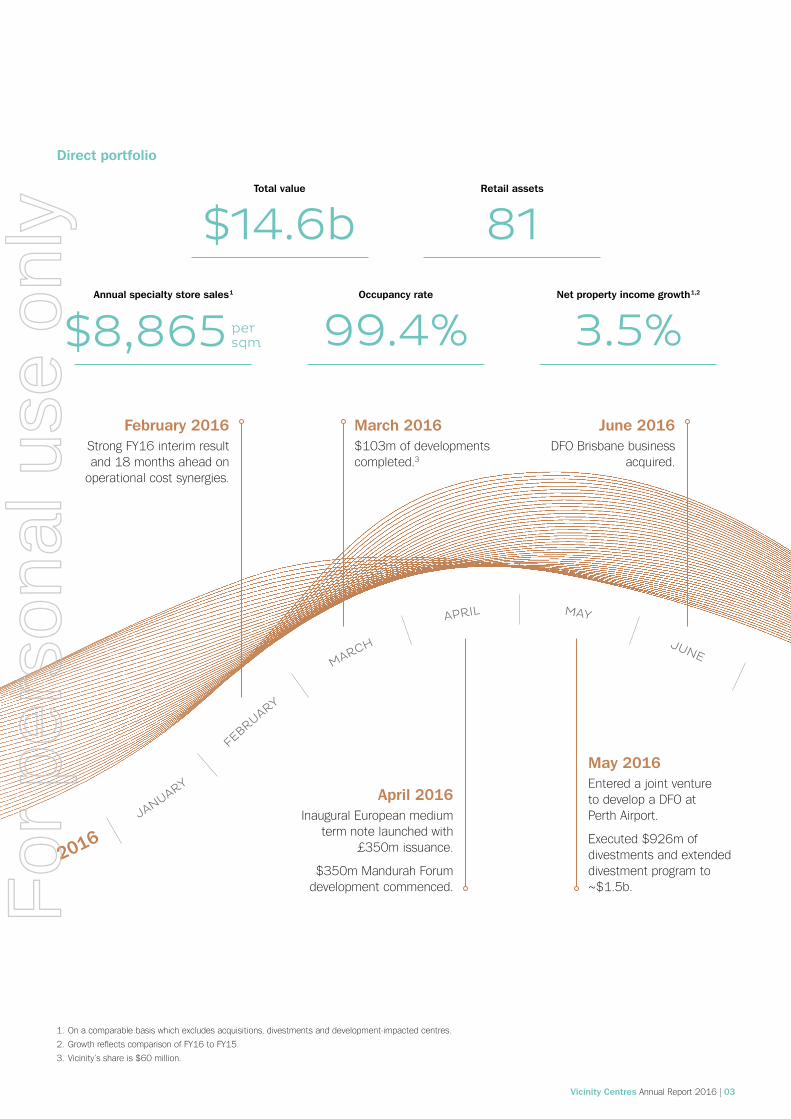
February 2016StrongFY16interimresultand18monthsaheadon
operationalcostsynergies.
March 2016$103mofdevelopmentscompleted.3
April 2016InauguralEuropeanmedium
term note launched with £350missuance.
$350mMandurahForumdevelopmentcommenced.
May 2016Entered a joint venture to develop a DFO at PerthAirport.
Executed$926mofdivestments and extended divestment program to ~$1.5b.
1.Onacomparablebasiswhichexcludesacquisitions,divestmentsanddevelopment-impactedcentres.
2. GrowthreflectscomparisonofFY16toFY15.
3.Vicinity’sshareis$60million.
Direct portfolio
2015
JULY AUGUST SEPTEMBER OCTOBER NOVEMBER DECEMBER
2016
JANUARY
F
EBRUARY
MARCH
APRIL MAY JUNE
Total value
$14.6b
$8,865 persqm
Annual specialty store sales1 Net property income growth1,2
3.5%
Retail assets
81Occupancy rate
99.4%
June 2016DFO Brisbane business
acquired.
Vicinity Centres AnnualReport2016|03
For
per
sona
l use
onl
y

Substantial progress has been made on integration activities and capturing the synergies of the merger, in addition to improving key portfolio metrics significantlyanddeliveringonourportfolioenhancementstrategy.Wehavealsorefinancedtostrengthenthebalancesheet.Theseachievementshavebeenreflected in the strong results delivered for the 12monthsto30June2016.
Vicinitydeliveredastatutorynetprofitof$960.9millionandunderlyingearningsof$757.5million,up9.5%1, driving underlying earningspersecurity(EPS)of19.1centsfortheyear.Thiswassupportedbycomparable2 net property income growth of 3.5%comparedto2.5%intheprioryear,and the material reduction in expenses as aresultofthemerger.Fullyeardistributionpersecuritywas17.7cents,up4.7%1, on a lowerunderlyingearningspayoutratio.
The team has made great progress deliveringonthebenefitsofthemerger. Wehavealreadyexceededtheoperationalcost synergies targeted, more than 24monthsaheadofprogram.Wehavecompletedthemergerrefinancingprogramandalsoadvancedintegrationactivities.
Oneofourfirstprioritiesfortheyearwastoestablish our portfolio strategy to continue to position us as a leading Australian retail propertygroup.Followingacomprehensivereviewoftheportfolio,inDecember2015we reiterated our strategic focus of creating long-term value and sustainable growth by owning,managinganddevelopingqualityAustralianassetsacrosstheretailspectrum.Weestablishedfinancialhurdles,targetingtotalreturnsofover9.0%p.a.andunderlyingEPSgrowthofover3.0%p.a.,bothonathrough-cyclebasis.ThisyearIampleased
to say that Vicinity has performed well in excess of those targets delivering a 12.8%totalreturn3and9.0%growth inunderlyingEPS.
Welaunchedanassetdivestmentprogramofupto$1billion,whichwasupsizedtoapproximately$1.5billionontheback ofsuccessfullysellingfiveassetsfor$926.4million,collectivelyata1%premiumtobookvalue.Todatewehaveagreedapproximately$1.2billionofassetsales4.Whilethereissomeshort-termdilution in earnings prior to reinvestment of the sale proceeds, we believe this will be far outweighed by the likely improvement ingrowthandresilienceofabetterqualityportfoliooverthelongterm.
This divestment program is complemented by reinvestment opportunities in the form ofselectiveacquisitionsanddevelopment.WeincreasedourweightingtoOutletCentres, a sub-sector where Vicinity has a clear competitive advantage, securing two additional DFO opportunities during theyear.WealsoacquiredtwostronglyperformingSubRegionalcentresinPerth.
CHAIRMAN’S REVIEW
Dear Securityholders I am pleased to present to you Vicinity Centres’ (Vicinity) inaugural Annual Report. The first 12 months since the merger of Federation Centres and Novion Property Group in June 2015 has been an active time for the Group.
Peter HayChairman
1. ComparisonstoaggregateofFederationCentres(Federation)andNovionPropertyGroup(Novion)forthe 12monthsto30June2015.
2. Comparableportfolioexcludesacquisitions,divestmentsanddevelopment-impactedcentres.
3. Calculatedas:(Changeinnettangibleassetsduringtheperiod+distributions)/Openingnettangibleassets.Excluding unrealised mark-to-market of derivatives, unrealised foreign exchange and transaction costs from thechangeinNTA,thetotalreturnis14.6%.
4. Excludesfiveassetssoldfor$218.1millioninthefirsthalfofFY16andincludestheinprincipleagreement tosellstakesintwoassetstoISPTfor$224.6million.
The merger created a leading Australian retail property group with 91 retail assets under management totalling $23.6 billion in value (Vicinity share: $14.6 billion) as at 30 June 2016
04|Vicinity Centres AnnualReport2016
For
per
sona
l use
onl
y

5. Assumingnomaterialdeteriorationtoexistingeconomicconditions.
6. Assumesthe$1.5billiondivestmentprogramcompletesinthefirsthalfofFY17.
Wearealsodirectingassetsaleproceedsinto our substantial development pipeline of$3.7billion(Vicinityshare:$1.7billion)toenhance the portfolio and grow organically, including further investment into Australia’s number one retail asset by turnover, ChadstoneShoppingCentre.
During the year, we established our strategies for people, digital and sustainability which provide a robust framework for business activitiesgoingforward.Ourpeoplestrategyis designed to attract and nurture talented andhighlyengagedpeople.Ourdigitalstrategy embraces the role of technology in the retail environment with a vision of creating a seamlessly integrated physical anddigitalretailpropertyplatform.Whileon sustainability, our strategy focuses on creating shared value and positively impactingonourcommunities.
Intheyearahead,weexpecttheeconomicand retail growth outlook to remain relatively stable although key economic indicators are likelytocontinuetoreportmixedsignals.Whilethismayseeconsumerscontinueto be cautious, lower interest rates and a low unemployment rate should continue to supportsolidretailsalesgrowth.
Vicinity expects to achieve underlying EPSintherangeof18.6to18.8centsforthe2017financialyear(FY17)5.Afteradjustingfortheimpactofacquisitionsanddivestments6,thisguidancerangereflectsunderlyingearningsgrowthforFY17of4.5%to5.6%.Vicinity’spayoutratioisexpected tobe90%to95%ofunderlyingearnings.
OnbehalfofyourBoard,Iwouldliketothank the Vicinity team who have worked tirelessly to unify Vicinity while delivering strongfinancialandportfolioperformance.They have laid the foundations for a great business.Iwouldalsoliketothankoursecurityholders for their continued support throughout this transformational year and Ilookforwardtohavingthechanceto meetupwithmanyofyouatour2016Annual General Meeting that will be held inMelbourneon18November2016.
Peter HayChairman
Chadstone, VIC
Vicinity Centres AnnualReport2016|05
For
per
sona
l use
onl
y

Wehavealsomadesubstantialprogressin reshaping the portfolio through developments and capital transactions, while also delivering on post-merger initiatives.
Vicinity has delivered strong growth inunderlyingEPSthisyearof9.0%to 19.1cents.Thisissupportedbynetpropertyincome(NPI)growthof3.5% on a comparable1basis,or1.8%totalNPIgrowth impacted by portfolio changes (includingtheimpactof24non-core assetssoldoverFY15andinFY16). Total expenses have reduced on the backoflocking-inmorethan100%oftargeted operational cost synergies2, realisingacashbenefitof$29million inFY16,andalsolowerborrowingcosts,largelyasaresultofthemerger.
Weendedtheyearwithamuchstrongerbalancesheet.Duringthefirsthalfoftheyear,wecompletedthemergerrefinancingprogram with the repayment of the $1.8billionbridgefacilityandlaterintheyear we materially improved debt duration andfurtherdiversifiedourdebtsources. WelaunchedourfirstEuropeanmediumtermnoteprogramwitha£350million 10-yearnoteissuance,issuedA$433millionof10and15-yearUSprivateplacement
CEO AND MANAGING DIRECTOR’S REVIEW
Dear Securityholders In our inaugural year as Vicinity Centres, I am pleased to present to you the highlights of the past 12 months. Against a relatively subdued economic backdrop, we have generated solid performance from our underlying portfolio and realised significant operational cost synergies to deliver strong earnings growth over the year.
Angus McNaughtonCEO and Managing Director
1. Comparableportfolioexcludesacquisitions,divestmentsanddevelopment-impactedcentres.
2.Onarun-rateorannualisedbasisasperthemergerschemebooklet.
notesandnegotiated$1.1billionofdebtwith new international bank counterparties, allatcompetitivemargins.
Inadditiontooursubstantialrefinancingactivities,theproceedsofthe10assetsales during the year were applied to repay short-termdebt.Asaresult,gearingisat25.9%whichisatthelowerendofourtargetrangeof25%to35%,withminimaldebtexpiringinFY17andFY18.Vicinity’sweightedaveragedebtcostforFY16was4.0%andtheweightedaveragedebtdurationat30June2016was5.3years,upfrom3.0yearsat30June2015.
Wesuccessfullydeliveredonourportfolioenhancement strategy over the year, a primary component of which has been theassetdivestmentprogram.Inalittleover three months after commencing the marketing campaign for up to approximately$1billionofassetsales, wesold$926.4millionofshoppingcentrescollectivelyata1%premiumtobookvalue.As a result of this strong demand for retail assets, the asset divestment program was increasedtoapproximately$1.5billion. Wehavemadegreatprogressontheexpanded program which we expect to completeinthefirsthalfofFY17.
InNovember2015,weacquiredtwoassetsin Perth with strong fundamentals and potential for future growth, The Shops at EllenbrookandLivingstonMarketplace.
WealsosecuredtwoDFOopportunitiesin the year, reinforcing our leadership in a retail sub-sector where Vicinity has a clearcompetitiveadvantage.InMay2016,we entered a joint venture to develop a DFOatPerthAirport,andinJune2016weacquiredtheDFOBrisbanebusiness,expanding our national coverage of OutletCentres.
Development is also a key contributor toourportfolioenhancementstrategy.Duringtheyear,wecompletedfive projectsfor$309million(Vicinityshare:$158million)withanaverageforecast initialyieldoncostof9.1%andforecastinternalrateofreturninexcessof14%.
Our major redevelopment at Chadstone ShoppingCentreinVictoriafor$666million(Vicinityshare:$333million)isnearingcompletionofthefirstretailstage.Thecolumn free grid shell roof is now in place around what will be an impressive atrium which will be the centrepiece to a new world-class leisure and entertainment precinct to create a premier customer experience.Theprojectalsoincludesa new food gallery, seven restaurants, internationalflagshipstoresandanexpandedluxurymall.
WecommencedamajorredevelopmentofMandurahForuminWesternAustraliainApril2016.This$350millionexpansion(Vicinityshare:$175million)willbehomeforbrandnewDavidJonesandTargetstores, with the existing Coles and Kmart
06|Vicinity Centres AnnualReport2016
For
per
sona
l use
onl
y

tenanciestoberefurbished.Itwillprovideanadditional80storesandintroduceanew food court, alfresco dining and fresh foodmarkethall.
Planningofamajor$450millionredevelopment(Vicinityshare:$225million)of The Glen advanced with Board and joint owner approval received during the year, subject to a number of conditions precedent, and it remains on track to commence in2017.
Our development pipeline provides scope for portfolio enhancement well into the foreseeable future with a range of projects continuing to progress in the current pipelinewhichtotals$3.7billion(Vicinityshare:$1.7billion)aswellasanumber of additional projects in various stages ofplanninginourshadowpipeline.
Wealsohaveanassetrefurbishmentteam(ART)focusedonenhancingassetqualityand customer experience in assets that are notflaggedfordevelopmentintheshortterm.Theteaminvestssmallamountsofcapital to improve presentation standards focused on common spaces, food courts, entrancesandamenities.Theseprojectsenhance the sustainability of rents and can provide ancillary income opportunities oroperationalbenefits.TheARTteam hasinvested$6millionthisyearacross fiveprojectswithanaverageinitialyield oncostofover10%,andgreatfeedbackhas been received to date from customers andretailersonthecentreimprovements.
Ithasbeenaveryactiveperiodmakingimprovementstoourportfolioqualityfromcapital transactions and intensive asset management,throughtodevelopments.Thishasbeenreflectedinstronger portfoliometrics.
Ourleasingteamcompletedover1,300leasing deals over the year, excluding developments.Withanintensivefocuson leasing vacant stores and converting short-term leases into long-term deals, the portfolio occupancy rate increased from 98.9%lastyear,to99.4%.
Specialty store moving annual turnover (MAT)growthis3.0%fortheyearto30June2016,relativelyunchangedthroughout the year with the retail market remaining solid despite a softening in the Australianeconomy.Howeverspecialtyproductivity,asmeasuredbyMATpersqm,isup5.4%to$8,865,partlyreflectingtheimprovementinportfolioquality.
Wearealsoexcitedtoannounceourfirststepofournewlyformeddigitalstrategy.Wewillbeconnectingallofourretailassetsandcorporateofficestoasinglehigh-speeddigitalnetworkwithWiFicapabilities.This project will enable Vicinity to advance a number of digital initiatives aimed at enhancing the customer experience and improving operational performance and productivity, while also preparing ourportfolioforthefuture.
Iamverypleasedwithprogressmadeonintegration activities this year, particularly how the teams have come together to establish strong foundations for our businessgoingforward.Weco-locatedteams early in the year and launched our
new brand, Vicinity Centres, in November 2015,toreflectourpositionasaleadingAustralianretailpropertygroup.Wehaveconsolidated property data reporting onto the one platform, providing operational andinternalreportingbenefits.OverthefirsthalfofFY17,importantintegrationmilestones include consolidating our Melbournecorporateofficesintothe newofficetoweratChadstoneandmigratingontooneITplatform.
Intheyearahead,wewillalsocontinue to intensively manage our assets to enhance the customer experience and improve retailer performance, drive cost efficienciesandrevenuegrowth,andcontinuetoimproveportfolioqualitythroughdelivering our development pipeline, select acquisitionsandcompletingourdivestmentprogram.
IwouldliketoreiteratetheChairman’ssentiments in thanking the team for a mighty effort this year, and for helping to make Vicinity an exciting place to work.Ialsowouldliketothankyou,oursecurityholdersforyourongoingsupport.
Angus McNaughtonCEO and Managing Director
During the course of FY16, we enhanced our portfolio through development, acquisitions, divestments and asset refurbishment projects. Continued refinement of our portfolio will further improve the quality of our earnings, make our portfolio more resilient and deliver superior long-term value
Chadstone, VIC
Vicinity Centres AnnualReport2016|07
For
per
sona
l use
onl
y

08|Vicinity Centres AnnualReport2016
For
per
sona
l use
onl
y
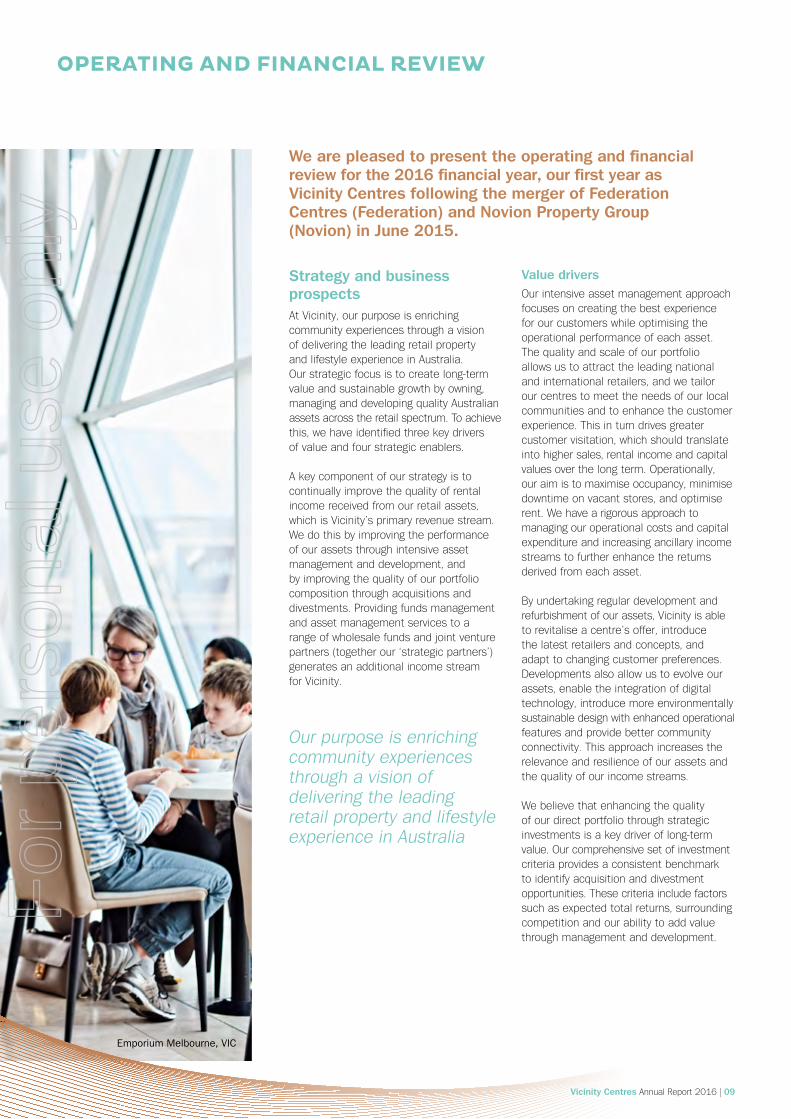
OPERATING AND FINANCIAL REVIEW
Strategy and business prospectsAt Vicinity, our purpose is enriching community experiences through a vision of delivering the leading retail property andlifestyleexperienceinAustralia. Our strategic focus is to create long-term value and sustainable growth by owning, managinganddevelopingqualityAustralianassetsacrosstheretailspectrum.Toachievethis,wehaveidentifiedthreekeydrivers ofvalueandfourstrategicenablers.
A key component of our strategy is to continuallyimprovethequalityofrentalincome received from our retail assets, whichisVicinity’sprimaryrevenuestream.Wedothisbyimprovingtheperformanceof our assets through intensive asset management and development, and byimprovingthequalityofourportfoliocompositionthroughacquisitionsanddivestments.Providingfundsmanagementand asset management services to a range of wholesale funds and joint venture partners(togetherour‘strategicpartners’)generates an additional income stream forVicinity.
Value drivers Our intensive asset management approach focuses on creating the best experience for our customers while optimising the operationalperformanceofeachasset.Thequalityandscaleofourportfolioallows us to attract the leading national and international retailers, and we tailor our centres to meet the needs of our local communities and to enhance the customer experience.Thisinturndrivesgreatercustomer visitation, which should translate into higher sales, rental income and capital valuesoverthelongterm.Operationally,our aim is to maximise occupancy, minimise downtime on vacant stores, and optimise rent.Wehavearigorousapproachtomanaging our operational costs and capital expenditure and increasing ancillary income streams to further enhance the returns derivedfromeachasset.
By undertaking regular development and refurbishment of our assets, Vicinity is able to revitalise a centre’s offer, introduce the latest retailers and concepts, and adapttochangingcustomerpreferences.Developments also allow us to evolve our assets, enable the integration of digital technology, introduce more environmentally sustainable design with enhanced operational features and provide better community connectivity.Thisapproachincreasestherelevance and resilience of our assets and thequalityofourincomestreams.
Webelievethatenhancingthequalityof our direct portfolio through strategic investments is a key driver of long-term value.Ourcomprehensivesetofinvestmentcriteria provides a consistent benchmark toidentifyacquisitionanddivestmentopportunities.Thesecriteriaincludefactorssuch as expected total returns, surrounding competition and our ability to add value throughmanagementanddevelopment.
We are pleased to present the operating and financial review for the 2016 financial year, our first year as Vicinity Centres following the merger of Federation Centres (Federation) and Novion Property Group (Novion) in June 2015.
Our purpose is enriching community experiences through a vision of delivering the leading retail property and lifestyle experience in Australia
Emporium Melbourne, VIC
Vicinity Centres AnnualReport2016|09
For
per
sona
l use
onl
y

EnablersThequality,expertiseandengagementof our people is integral to our business performance.Wearecommittedtoinvesting in our people, with a focus on diversity and inclusion, to attract and retain the best talent and to ensure that they can deliver on our brand purpose of delivering better, easier and more enjoyable experiencesforallofourstakeholders.
Digital technology is fundamentally changing how people work, interact, relax andplay.Itimpactswhere,whenandhowtheyshop.Vicinity’sdigitalvisionistocreate a seamlessly integrated physical anddigitalretailexperience.Digitaltechnology provides Vicinity with an opportunity to enhance the experiences of, and connections with, our customers, retailersandotherstakeholders.Itwillenable a greater understanding of customer behaviour and better-informed decision making, improve operational performance anddriveefficiencies.
Another key enabler of our business is operationalexcellence.ForVicinity,thismeans focusing on superior economic,
environmental and social outcomes throughout our business and across the entire shopping centre management process, having the right governance protocols in place and targeting best practicesystemsandprocesses.Theseelementsimproveefficiency,enhancerisk management, drive better-informed decision making and support a more robust and sustainable business model overthelongterm.
Havingaccesstoadiverserangeofcapitalsources,includingdebt,equityandstrategicpartner investment, is a key enabler for Vicinitytodeliversuperioroutcomes. A strong and conservative capital structure enables investment in existing assets and new opportunities through the property cycle.Accordingly,wearefocusedonmaintaining an investment grade credit rating, modest gearing and diverse debt sourceswithastaggeredmaturityprofileandlongduration.Ourstrategicpartnersprovidean additional source of capital and scale to our platform, generate incremental revenue andprovideacquisitionopportunities.
FY16 outcomes and FY17 focusVicinity’sFY16outcomesandFY17focusfor each of our value drivers and enablers areoutlinedonpage11.
FY17 earnings guidanceVicinity expects to achieve underlying earnings per security in the range of 18.6to18.8centsforthe2017 financialyear1.Afteradjustingfortheimpactofacquisitionsanddivestments2, thisguidancerangereflectsunderlyingearningsgrowthforFY17of4.5%to5.6%.
Vicinity’s payout ratio is expected to be90%to95%ofunderlyingearnings.
OPERATING AND FINANCIAL REVIEW continued
We are focused on creating long-term value and sustainable growth from owning, managing and developing quality Australian assets across the retail spectrum
1.Assumingnomaterialdeteriorationtoexistingeconomicconditions.
2.Assumesthe$1.5billiondivestmentprogramcompletesinthefirsthalfofFY17.
Strategy and business prospects continued
Emporium Melbourne, VIC
10|Vicinity Centres AnnualReport2016
For
per
sona
l use
onl
y

FY16 outcomes and FY17 focus
FY16 outcomes FY17 focus
Value drivers
Investment • Completed comprehensive portfolio review and launched asset divestment program
• Completed~$1.1billionofassetsales
• Acquiredthreeassetsfor~$358millionand entered a joint venture agreement to develop a DFO at Perth Airport
• Completethe~$1.5billionassetdivestmentprogram1
• Continuetoreviewportfoliocomposition(annually)
• Reviewacquisitionopportunitiesforpotentialcapitalredeployment
Development • Deliveredfiveprojectstotalling$309million withanaverageyieldof9.1%andIRRof14+%
• MadesignificantprogressonChadstoneRetail andOfficeproject
• Commenced major redevelopment of Mandurah Forum and advanced the broader pipeline
• CompleteChadstoneRetailandOfficeproject
• Achieve strong progress at Mandurah Forum
• Commence The Glen and DFO at Perth Airport
• Achieve project hurdles for Roselands and Galleria
• Progress broader pipeline
Intensiveassetmanagement
• Executed1,397leases,withanaverageleasing spreadof+0.5%,upfrom-2.2%overFY15
• Achievedoccupancyrateof99.4%,upfrom98.9% in the prior year
• Delivered strong ancillary income growth while controlling expenses
• Assetrefurbishmentteamcompletedfiveprojects
• Completed materiality assessment and established sustainability strategy
• Continue to drive improvements in key portfolio metrics
• Deliver nine asset refurbishment projects
• Set community investment strategy
• Investinselectiverooftopsolarprojects
• Investigatelong-termlowcarbontargetforVicinity
• Embed new sustainability strategy and increase the focus on creating shared value
Enablers
People • Rolled out Group purpose, vision and values
• Established a diversity forum
• Employee engagement survey completed, with key actionsidentifiedandimplemented
• Roll out new human resources management system, talent management framework and diversity strategies
• Introduceinnovative‘realtime’workingpractices
• Enhance the Vicinity culture
Digital • Established digital strategy, centred around three pillars of connectivity, online and omni-channel
• Commenced project to connect all assets to asinglehigh-speednetworkwithWiFicapability(connectivityproject)
• Complete connectivity project
• Harnessvaluefromdigitallyacquireddata
• Significantlyadvancedigitalinitiativesaimedatenhancing the customer experience and improving operational performance
Operational excellence
• Locked-inover100%ofmergeroperationalcostsynergies two years ahead of target date
• SelectedpreferredEnterpriseResourcePlanning(ERP)platform and well progressed on systems consolidation
• Established enterprise risk management framework
• Completed Green Star performance rating of entire portfolio and high-level climate resilience review
• Complete the consolidation of the ERP platform and other systems
• Melbourneheadofficeconsolidationintonewofficetower at Chadstone
• Implementplanningsystemandstreamlineassociatedprocess across business
Capital and strategic partnerships
• Completedmergerrefinancingprogram
• Standard & Poor’s raised ‘A-’ credit rating outlook from ‘stable’ to ‘positive’ and strong initiation from Moody’sat‘A2/stable’
• Enhancedkeydebtmetrics,includingsignificantlylowergearing and increased duration and diversity
• Executed on strategic partner strategies
• Optimise the cost of debt, while appropriately managing debt diversity, duration and hedging
• Maintain investment grade credit rating
• Continue to strengthen strategic partner relationships
1.Includesfiveassetssoldfor$926millioninFY16.
Vicinity Centres AnnualReport2016|11
For
per
sona
l use
onl
y

Operations Vicinity’sfirstfullyearofoperationshasbeentransformational.Westartedtheyearas a newly merged entity with two groups combining to create a leading Australian retailpropertygroupwithsignificantscaleanddiversificationbenefits.Sincethen wehaveactivelyenhancedourportfolio.Wecompletedfivedevelopments,divested10assets,acquiredthreeassetsandcompletedfiveassetrefurbishmentprojects, putting Vicinity’s portfolio in astrongerpositionatyearend.
At30June2016,wehad91retailassetsunder management1 with a combined valueof$23.6billionwhichgenerated$18.2billioninannualsaleswith9,113leasesacross2.9millionsqmofgrosslettablearea(GLA).Vicinityhasanownershipinterestin81oftheseassets1, bringing the value of its direct portfolio to$14.6billion.Thissectionfocuses on the performance of the direct portfolio which generates the majority of Vicinity’s totalincome.
Vicinity’sportfolioiscomprisedof100%Australian retail assets which operate within arelativelystableeconomicenvironment.The Australian economy has experienced somesofteningoverthepast12months,with the commodity sector weighing on theStateeconomiesofWesternAustraliaand Queensland, partly offset by stronger servicessectorgrowthinNewSouthWalesand Victoria, which has kept the national economy growing at a little below the long-termaverage.Despitefluctuatingconsumersentiment, the retail market is being buoyed bylowerinterestrates,withtwo25basispointscashratecutsinMay2016andAugust2016andanunemploymentratewhichremainsbelow6%.
Against this backdrop, retailer performance varies.Withrapidandongoingchangesinconsumer and retail trends, retailers need to continue to evolve and adapt, and those
that are responding to and anticipating these changes are proving to be the most successful.Customersarerewardingretailers with a strong brand or point of difference.Wehaveseenawillingness for international and luxury brands to invest in the Australian market with an appetite forlargerstores.Apparelretailersarealsomoving towards larger store formats to showcasetheirmulti-brandofferings.
Food retailing continues to be popular, with strong demand for café and restaurant offers, while fresh food operators are responding to consumers’ desires for higherqualityandincreasedproductrange.Beauty, health and wellbeing retailers such as hairdressing, manicurists, laser clinics and massage, are also becoming increasinglypopular,reflectingAustralianconsumers’ willingness to spend on discretionaryitems.However,rationalisationoccurring in government and banking services is reducing their store numbers, while pharmacies have been impacted byregulatorychanges.
Across Vicinity’s portfolio, total retail sales ormovingannualturnover(MAT)growthfor the comparable2 portfolio continues toimprove,reporting2.1%growthforthe12monthsto30June2016,upfrom1.3%overtheprioryear.Thispick-upwas primarily driven by major tenants, in particular department stores, who have had success following the recent implementationofrevitalisationstrategies.Total sales of department stores, discount department stores and supermarkets have reboundedto+1.0%growthcompared to-0.3%overtheprioryear.
For specialty stores, comparable MAT growthwas3.0%comparedto3.3%reportedfortheprioryear.Thisresult is despite two prime assets, Chadstone and Emporium Melbourne, not being in thecomparablebasketinbothFY15andFY16.Changestoportfoliocompositionover the year have increased portfolio
quality,withspecialtyMATpersqmincreasingto$8,865,up5.4%comparedto a year earlier, while occupancy costs were14.6%comparedto15.4%at 30June2015.
This growth in specialty store sales, including a particularly strong performance across the DFO Outlet Centre portfolio, underpinned a marked improvement in leasing spreads3, whicharenowpositiveat0.5%acrossrenewalsandreplacements,upfrom-2.2% ayearago.Ourspecialtystoreleasestypicallyhavealeasetermoffivetosixyearswithfixed5%annualincreases.
The portfolio occupancy rate improved significantlyovertheyearfrom98.9%to99.4%at30June2016,benefitingfromvacancies being leased and the conversion of short-term temporary leases into long-term deals, leveraging the broad network of retailer relationships that we have across theportfolio.
Fixed rental increases, strong growth in ancillary income and percentage rent, and a focus on expense control, combined to drivea3.5%increaseincomparablenetproperty income over the year, compared to2.5%fortheprioryear.Totalnetpropertyincomewasup1.8%fortheyear,impactedby changes to the portfolio composition, with24assetssoldoverFY15andinFY16,threeassetsacquiredduringtheyearandvariouscentresunderdevelopment.
Vicinity’srentalincomeiswelldiversified,withover8,300leasesacrossthedirectportfolio with a weighted average lease expiryof5.5years.Nosingleretailgroupprovidesmorethan11%ofgrossrentalincomeandthetop10retailgroupscomprisejust28.7%.Ourintensiveassetmanagement approach focuses on replacing underperforming tenants and introducing newretailersandconcepts.Thesetenantremixes enhance the customer experience and attractiveness of our centres, and also improvethequalityofourrentalincome.
OPERATING AND FINANCIAL REVIEW continued
1. IncludesDFOBrisbanebusiness.
2.Excludesacquisitions,divestmentsanddevelopment-impactedcentres.
3.LeasingspreadsincludeallstoretypesotherthanmajorsandATMs.
12|Vicinity Centres AnnualReport2016
For
per
sona
l use
onl
y

Fixed rental increases, strong growth in ancillary income and percentage rent, and a focus on expense control, combined to drive a 3.5% increase in comparable net property income over the year, compared to 2.5% for the prior year
Emporium Melbourne, VIC
Vicinity Centres AnnualReport2016|13
For
per
sona
l use
onl
y

OPERATING AND FINANCIAL REVIEW continued
Operating cash flows
$741.8mNet tangible assets per security
$2.59June2015:$2.45
Distribution per security growth
4.7%June2015:4.3%
Weighted average interest rate
4.0%June2015:4.2%
Gearing
25.9%June2015:28.0%
Weighted average debt duration
5.3 yearsJune2015:3.0years
Statutory net profit
$960.9mEarnings per securities (EPS)
24.3¢Underlying EPS
19.1¢Up9.0%onFY15
Financial results
Vicinity’s performance for the 2016 financial year was underpinned by income growth in the underlying property portfolio and the realisation of overhead and financing merger synergies. Portfolio quality was enhanced by the divestment of over $1.1 billion of non-core assets, the acquisition of three quality assets and the completion of five major development projects. The balance sheet was strengthened through valuation gains and the completion of the merger refinancing program.
14|Vicinity Centres AnnualReport2016
For
per
sona
l use
onl
y

Financial performanceThefollowingsummarisedsegmentincomestatementisextractedfromNote1oftheFinancialReport.
For the 12 months to:30-Jun-16
$m30-Jun-151
$mProperty Investment segmentNet property income 953.6 936.9Strategic Partnership segmentProperty management, development and leasing fees 56.3 54.0Funds management fees 9.8 12.0Total income 1,019.7 1,002.9Corporateoverheads(netofinternalpropertymanagementfees) (80.8) (105.4)Net interest expense (181.4) (205.7)Underlying earnings 757.5 691.8Subtract pre-merger underlying earnings - (240.8)Property revaluation increments 733.0 430.9Rent lost from undertaking developments (18.0) (12.5)Amortisation of static lease incentives and other project items (32.6) (28.6)Net movement on mark-to-market of derivatives (147.5) (23.0)Impairmentandamortisationofintangibleassets (298.3) (3.3)Integrationandtransactioncosts (41.1) (135.4)Other items 7.9 (4.0)Net profit after tax 960.9 675.1EPS(cents) 24.3 25.6UnderlyingEPS(cents) 19.1 17.6Distributionpersecurity(DPS)(cents) 17.7 16.9Payoutratio(DPSasa%ofunderlyingEPS)(%) 92.5 96.6Adjustedfundsfromoperations(AFFO) 667.4 -DistributionasapercentageofAFFO(%) 105.0 -
1.Comparativeinformationreflectstheunderlyingearningsoftheaggregatedgroupcomprising12monthsofNovionand12monthsofFederation.Informationdisclosedbelowunderlyingearningsisimpactedbytheaccountingforthemerger(refertotheFinancialReportforfurtherdetails)andrepresents12monthsofNovionandonemonthofFederation.Netprofitisonastatutorybasisandrepresents12monthsofNovionandonemonthofFederation.Changesinthedefinitionofunderlyingearningsadopted byVicinity,toexcludetheamortisationofstaticleaseincentives,haveresultedinanetincreaseof$8.7milliontothepreviouslyreported30June2015amount.
2.Comparableportfolioexcludesacquisitions,divestmentsanddevelopment-impactedcentres.
Key highlights and commentary on financial performance• Net property income (NPI) up $16.7 million or 1.8%: Comparable2portfolioNPIwas up3.5%,reflectingfixedrentalincreases,stronggrowthinancillaryincomeandpercentagerent,andafocusonexpensecontrol.Disposalofnon-coreassetsnetofacquisitionsoverFY15andFY16reducedthenetsegmentNPIincomegrowthto1.8%.
• Corporate overheads down $24.6 million or 23.3%:Largelydrivenbymerger-relatedsavingsfromacrossthebusiness.Thelargestcontributionswerefromsalaries,statutoryexpensesandinsurance.
• Net interest expense down $24.3 million or 11.8%: Primarily impacted by merger refinancing.Thelargestcontributionwastheweightedaveragecostofdebtfallingto 4.0%overtheperiod,duetorefinancingandfavourablemarketmovements.
• Property revaluation increments for directly owned properties of $733 million:Reflectsincomegrowthandthestrengthofinvestordemandforqualityretailassets.Overtheperiod,Vicinity’sweightedaveragecapitalisationratetightenedto5.94%(30June2015:6.30%).
• Impairment and amortisation of intangible assets of $298.3 million: Largelydriven bythe$295millionimpairmentofintangiblesrecognisedat31December2015followinganincreaseininvestmentpropertyvalues.RefertoNote21(b)oftheFinancialReport forfurtherinformation.
• Integration and transaction costs of $41.1 million: Transaction costs incurred over the period primarily related to redundancy and advisor costs and are in line with expectations asoutlinedinthemergerschemebooklet.
Vicinity Centres AnnualReport2016|15
For
per
sona
l use
onl
y

OPERATING AND FINANCIAL REVIEW continued
Financial results continuedFinancial positionThefollowingtableoutlinesasummarisedbalancesheetforVicinitybasedonthefullFinancialStatementsincludedintheFinancialReport.
As at:30-Jun-16
$m30-Jun-15
$mCashandcashequivalents 52.8 107.4Heldforsaleproperties 232.1 -Investmentproperties 14,426.6 14,109.7Intangibleassets 602.4 891.4Other assets 535.6 529.4Total assets 15,849.5 15,637.9Borrowings 3,942.2 4,303.1Other liabilities 1,058.3 739.2Total liabilities 5,000.5 5,042.3Net assets 10,849.0 10,595.6Nettangibleassetsbackingpersecurity(NTA)($) 2.59 2.45Netassetvaluepersecurity(NAV)($) 2.74 2.68Gearing1(%) 25.9 28.0
1.CalculatedasdrawndebtatNote7(e)oftheFinancialReport,netofcash,dividedbytotaltangibleassetsexcludingcash,financeleaseassetsandderivativefinancialassets.
Key highlights and commentary on financial position• Investment properties up $549 million2:Largelydrivenbyvaluationgains,capital expenditureandtheacquisitionofthreeassets,partlyoffsetbythedisposalof10non-core assets.RefertoNote4(b)oftheFinancialReportforfurtherinformation.
• Intangible assets down $289.0 million:Decreaseprimarilyreflectsimpairmentto goodwillrecognisedasat31December2015.RefertoNote21(b)oftheFinancialReport forfurtherinformation.
• Borrowings down $360.9 million: Largelydrivenbythedisposalof$1.1billionof non-coreassets,offsetbyacquisitionsanddevelopmentexpenditureovertheperiod.
• Gearing down to 25.9%: Thedecreasereflectsthestrengthenedbalancesheet andisatthelowerendofVicinity’stargetrangeof25%to35%.
2. Includespropertiesheldforsale.
Chatswood Chase Sydney, NSW
16|Vicinity Centres AnnualReport2016
For
per
sona
l use
onl
y

Capital managementWiththemergercompletingon11June2015,ithasbeenanactiveyearofcapitalmanagement for Vicinity resulting in a significantrefinancingofthecombined debtbook.The$1.8billionbridgefacilitywasrepaidinthefirstsixmonthsoftheyear,completingthemergerrefinancingprogram.Wealsonegotiatedanumberoflonger term debt instruments and reduced near-term debt expiries following the settlementof$1.1billionofnon-core assetsales.Theseactivitieshavecombinedto strengthen our balance sheet through a reduction in gearing, extension of our debtdurationanddiversificationofourfundingsources.
Our active capital management program strengthened our balance sheet during the period. Standard & Poor’s raised our ‘A-’ credit rating outlook from ‘stable’ to ‘positive’ and Moody’s initiated coverage at a rating of ‘A2/stable’, being one notch higher rating than the generally regarded equivalent Standard & Poor’s rating
Summary of key debt statistics
As at: 30-Jun-16 30-Jun-15Weightedaverageinterestrate1(%) 4.0 4.2Debt duration2(years) 5.3 3.03
Proportion of debt hedged4(%) 91 74Gearing5(%) 25.9 28.0Interestcoverageratio(ICR)(times) 5.2 4.06
Creditratings:– Moody’s A2/stable N/A– Standard & Poor’s A-/positive A-/stable
1. Prioryearisasat30June2015.Currentyearistheaverageforprior12monthsandinclusiveofmargins,drawnlinefeesandestablishmentfees.
2.Basedonfacilitylimits.
3.Assumedoptiontoextendtermof$1.8billionbridgefacilitywasnotexercised.
4.Asat30June.
5. Calculatedas:Drawndebtnetofcash/totaltangibleassetsexcludingcash,financialleaseassetsandderivativefinancialassets.
6. ICRreportedasat30June2015isbasedononemonthofVicinitydataand11monthsofNoviondata.
Beyond
1,500
1,200
900
600
300
0
FY17 FY18 FY19 FY20 FY21 FY22 FY23
Debt maturity profile ($m)
Bank debtdrawn
US privateplacement
Australian mediumterm notes
European mediumterm notes
Bank debtundrawn
Sources of debt (%)
Vicinity Centres AnnualReport2016|17
For
per
sona
l use
onl
y

Management of riskOur Board and management recognise that effective risk management and internal controls are an integral part of sound management practice and good corporate governance, and are essential to executing on our strategic focus to deliver long- term value and sustainable growth to oursecurityholders.
Vicinity has dedicated risk, compliance and sustainability teams that are responsible for reviewing and monitoring the effectiveness of group-wide compliance and risk management systems on an ongoing basis and ensuring that appropriate compliance andriskmitigationmeasuresareinplace.
Throughout the reporting period, Vicinity had in place an enterprise risk management framework and system of internal controls to ensure that assets are protected and thatmaterialrisksareproactivelyidentified,managedandreported.
The material risks that could affect Vicinity’s achievement of the financial prospects
Development delivery Vicinity’s development pipeline contains a number of current and prospective developmentprojects.Thereisariskthatdevelopment projects are not delivered in accordance with Board approved targets due to delays, increased costs and failure torealisetargetedrentsorvaluation.
Vicinity’s mitigation strategy for this risk involves rigorous project management including an extensive iterative research and planning process with progressive reviewandapprovalsrequiredbyaPropertyInvestmentCommitteeandtheBoard.Development projects do not commence without Board approval, terms being agreed with major tenants, construction contractsbeingfinalisedandtheprojectfeasibilitysupportingaminimumfinancialreturnhurdle.Developmentprojectsarealso regularly monitored against schedule, budgetandscopebyprojectcontrolgroups.
Development Page22
Retail market conditions The majority of Vicinity’s earnings are derivedfromrentalincome.Ifretailmarketconditions are subdued, this has the potential to impact tenant viability, vacancy rates,rentalgrowthandourprofitability.
Vicinity’s approach to mitigating this risk involvesimprovingportfolioqualitythroughacquisitions,divestments,tenantremixesanddevelopments.Atanassetlevel,Vicinity’s intensive asset management approachfocusesonfinancialelementssuch as improving occupancy, reducing controllable costs and generating additional ancillaryincome,andnon-financialelements such as customer experience, amenities and tailoring a centre’s tenant mix.Theseinitiativesdrivegreatercustomer visitation which should translate intohighersalesandrentalgrowth.
Enhancing the portfolio Page20
Structural changes in the retail sector Theretailsectorisconstantlyevolving.Customer behaviour and shopping preferences are changing, including when, where,whyandhowtheyshop.Othersectortrendsincludetheinfluxofinternationalretailers into Australia, changing store formats, evolving retailer strategies, regulatory and industry changes, the role ofdigitaltechnologyandonlineretailing.
Vicinity’s mitigation strategy is to continue to research, monitor, anticipate and adapt tothesetrends.Ourcentremanagement,leasing and development teams work together to create a development master-plan,afive-yearstrategicleasingplan and an operational plan for each asset.Theseplansfactorincustomerpreferences, development and product opportunities, tenant renewal and replacement strategies and rent or capital requirements.The$3.7billionpipeline(Vicinityshare:$1.7billion)ofdevelopmentprojects is focused on ensuring that our centres adapt to structural changes and remain relevant to our customers, retailersandcommunities.
Vicinity has also developed a digital strategy and is increasing resourcing in this area, with the aim of seamlessly integrating Vicinity’s physicalanddigitalretailpropertyplatform.This year, Vicinity launched a connectivity project to connect all of its centres and officestotheonehigh-speeddigitalnetworkwithWiFicapabilities.ThiswillprovidesignificantbenefitsforVicinityandourcustomers,retailersandcommunities.
Developmentpage22Digitalpage26
Capital allocation and the achievement of an optimal property portfolio composition InordertomeetVicinity’sreturnexpectations, it is critical that our property portfolio composition is optimised and thatcapitalisallocatedprudently.Vicinity’s portfolio composition, along withanydevelopments,acquisitionsanddivestmentsundertaken,cansignificantlyimpactonVicinity’stotalreturn.
Vicinity has clear investment criteria forevaluatingassets,withqualitativeandquantitativefactorsusedtoassessassetqualityandperformance.Vicinity’smanagement ensures strong governance and oversight of capital allocation decisions throughitsPropertyInvestmentCommittee.
Enhancing the portfolio Page20
Health and safety Vicinity’s operations expose our team, contractors, retailers and customers to theriskofinjuryorillness.Inaddition, a health and safety incident could affect Vicinity’s reputation, subject it to claims forfinancialcompensationorhaveregulatoryconsequences.
Wearecommittedtoprovidinganinjury-free environment for our team, contractors, retailersandcustomers.Thisunderpins our belief that everyone has the right to gohomesafeandhealthy.Vicinityhas a dedicated health and safety team that has developed and implemented an
OPERATING AND FINANCIAL REVIEW continued
18|Vicinity Centres AnnualReport2016
For
per
sona
l use
onl
y

integrated health and safety management system to support the provision of a safe andhealthyenvironment.Thisincludeshaving appropriate induction and education, the use of competent contractors, regular audits and the appointment of principal contractorsfordevelopmentworks.
Vicinity has also developed a crisis and emergency management system which provides the structure and guidelines for Vicinity to respond to a major incident or crisis occurring at one of its shopping centres,developmentsitesoroffices. This system is supported by a training and education program across our centres, including the use of desktop and simulated ‘live’emergencymanagementexercises.
Our people Page28
Funding and liquidity Vicinity uses debt as an important source of funding for ongoing operations and for development projects and asset acquisitions.Thereisariskthataccessto debt funding is not available at the appropriatepriceintherequiredtimeframesto support the ongoing management and developmentofourbusiness.
Fundingandliquidityriskismanagedthroughaprudentcapitalmanagementphilosophy.Key attributes of this philosophy are the maintenance of a strong balance sheet withmoderategearing(30June2016:25.9%),preservationofaninvestmentgradecreditrating,diversificationofdebtsources and forward planning to address upcomingdebtmaturities.Vicinityalsohas policies in place to regulate the level of exposure to interest rate risk and fully hedges its exposure to foreign currency denominateddebt.
Capital management Page17
Cyber security Overrecentyears,therehasbeensignificantgrowth globally in the number, sophistication andseverityofcyberattacks.Breachorfailure of Vicinity’s information technology systemscouldexposeittofinancialloss,disruption or damage to operations and corporatereputation.
Vicinity has a strong focus on maintaining and improving its organisational resilience and has developed strategies for managing cyber risk including employee education and awareness, maintaining information security policies, procedures and systems, and regular monitoring and review of cyber riskexposuresandcontrols.
Climate change resilienceClimate change presents both a direct and an indirect risk to Vicinity’s business and operations currently, and increasingly overthelongerterm.Risksrelatedtoextreme weather events, such as cyclones, heatwaves,bushfiresandflooding,increasethe vulnerability of our assets and their communities, which may have an impact on customer visitation levels, operational costsandassetvalues.
Wemanageclimatechangeriskbyunderstanding our current and future potential exposure from climate-related events through a portfolio-wide risk assessment.Theresultsoftheriskassessment are then used to underpin management strategies for our assets and further strengthen our due diligence processfordevelopments,acquisitions anddivestments.
Sustainability Page30
Vicinity Centres AnnualReport2016|19
For
per
sona
l use
onl
y

Portfolio strategyOneofourfirstprioritiespostmergerwasto undertake a comprehensive review of our portfolio to ensure that we have an optimal mixofassets.Thisincludedreviewingourcompetitive landscape and establishing clearinvestmentcriteriaforourportfolio.Wereiteratedthatourstrategicfocusisto create long-term value and sustainable growth from owning, managing and developingaportfolioofqualityAustralianassetsacrosstheretailspectrum.Withdifferent retail sub-sectors exhibiting similar risk and return characteristics over the long term, our strategy is to own the best centres ineachsub-sector.
WithVicinityhavingaclearcompetitiveadvantage in owning and managing Outlet Centres, which we brand as DFOs, we will continue to increase our weighting to this segmentovertime.Wehavegeneratedstrong returns from our Outlet Centres, withthefouracquiredin2010generatinganinternalrateofreturn(IRR)of15.1%to date, and this year we accessed two additional Outlet Centre opportunities (see‘Acquisitions’page21).
Wealsoannouncedanassetdivestmentprogram,notingthatwehadsignificantreinvestment opportunities in the form ofoursizeabledevelopmentpipeline andselectiveacquisitions.
DivestmentsInthefirstquarterofFY16,wesoldfivenon-core assets for a combined total of $218million.InDecember2015,weannounced a major asset divestment programofapproximately$750million to$1billion.Inalittleoverthreemonthsafter the marketing campaign began, weagreedthesaleof$926millionofassets.WesoldBrimbankShoppingCentreandForestHillChaseinVictoriaand CliffordGardens,IndooroopillyCentralandToombul in Queensland, on aggregate at a 1%premiumtobookvalue.Thespeedofthesale, and premium to book value achieved, reaffirmedourviewthatthiswastherighttimeinthecycletobesellingassets.
InMay2016,weincreasedthesizeofourasset divestment program to approximately $1.5billion.Thisincluded:
• a second tranche of smaller assets totallingapproximately$350million,and
• the proposed sale of interests in two assetstoISPT1,beinga25%interestinThe Myer Centre Brisbane in Queensland anda50%interestinMorningtonCentralinVictoriaforapproximately$225million.
Given the difference between property yields and borrowing costs, these asset sales are expected to be dilutive to earnings prior to any reinvestment of proceeds.Theshort-termearningsdilutionfrom the asset sales is outweighed by thelong-termbenefitsofanenhancedportfolio generating more robust and higher qualityearningsgrowthandastrengthenedbalancesheetwhichprovidessignificantheadroomforinvestinginour$3.7billiondevelopmentpipeline(Vicinityshare: $1.7billion)orselectiveacquisitions.
ENHANCING THE PORTFOLIO
1. ExchangeandsettlementisexpectedinthefirsthalfofFY17.
Vicinity’s ongoing portfolio enhancement strategy is a major driver of long-term value creation and sustainable growth through the cycle
Livingston Marketplace, WA
A fundamental driver of value creation for Vicinity’s securityholders is our ongoing portfolio enhancement strategy, which is underpinned by targeting selective acquisitions, executing on Vicinity’s significant development pipeline, intensively managing our assets and the divestment of non-core assets.
20|Vicinity Centres AnnualReport2016
For
per
sona
l use
onl
y

AcquisitionsDuring the year, we enhanced our portfoliobyacquiringtwostronglyperforming Sub Regional assets in Perth and accessing two outstanding Outlet Centreopportunities.
InNovember2015,weacquiredtwo qualityshoppingcentresinPerthinWesternAustralia.TheShopsatEllenbrook,a34,979sqmSubRegionalcentrewith 72specialtystores,wasacquiredfor $220million1 at a capitalisation rate of 5.75%.Locatedinastrongandgrowing
catchment, the centre has potential forfutureexpansionwithfivehectaresofadjacentlandonthesite.LivingstonMarketplace,a15,553sqmSubRegionalcentrewith31specialtystores,wasacquiredfor$83million1 at a capitalisation rateof6.00%.Bothoftheseassetshave great fundamentals with high retail spending growth forecast in their catchments and were also under-rented, with specialty stores reporting high sales productivity and low occupancy costs comparedtoothersimilar-sizedcentres.
Wealsoconsolidatedourleadershipposition in the Australian Outlet Centre sectorduringtheyear.InMay2016,weentered into agreements with Perth Airport PtyLtdforajointventuretodevelopaDFOatPerthAirportinWesternAustralia.Development plans and approvals are expectedtobefinalisedandconstruction isexpectedtocommencebyJune2017. Oncompletion,whichisexpectedin2018,thenewDFOassetwillincludeover110storesacross24,000sqmofGLAwithaforecast initial yield on cost for the project ofover8%andaforecastIRRofover13%.Importantly,theassetwillbenefitfrombeingwithin30minutes’driveofthemajority of Perth metropolitan residents, the12millionpluspassengerswhousePerth Airport annually and a number of major transport infrastructure projects aroundtheairport.
InJune2016,weacquiredtheDFOBrisbane businessinQueensland,a26,093sqmOutletCentrewith138specialtystores.Thepurchasepriceof$55million2reflects aninitialyieldoncostof7.50%anda10-yearforecastIRRof9.50%.Locatedadjacent to Brisbane Airport, approximately 8kilometresnorth-eastofthecentralbusiness district, DFO Brisbane is ideally placedtoserviceapproximately1.3millionresidentswholivewithin30minutes’driveoftheassetandover22millionplustravellerswhouseBrisbaneAirportannually.Theassetalsobenefitsfromanaffluentand growing catchment which is forecast to experience4.1%growthinretailexpenditureannuallyoverthenext10years3.
1.Excludingacquisitioncosts.
2. Excludingtransactioncostsandothercostsassociatedwiththeacquisition.
3.MaintradeareaforecastsbyMacroPlanDimasi.
The Shops at Ellenbrook, WA DFO Brisbane, QLD
The Shops at EllenbrookThis well-located Sub Regional centre was acquired in November 2015 for $220 million1. Leveraging the depth and breadth of Vicinity’s expertise on the ground in Perth, the team was active on site and quickly introduced Vicinity’s intensive asset management approach. Since acquisition, our leasing team has completed 13 lease transactions, at an average leasing spread of 14.1%, improving the occupancy rate from 98.3% to 99.7%.
A new centre website and risk and compliance training were complete on day one of Vicinity ownership. A casual mall leasing executive was appointed to the centre and has increased revenue from casual mall sites. We have also been able to improve the profit from on-selling electricity following the inclusion of the site into Vicinity’s Western Australian electricity supply contract.
An expansion of the centre is currently underway to include Aldi and five bulky goods sites, which are due to open in November 2016. The centre also has great fundamentals for future growth, with occupancy costs sitting below industry benchmarks. We are also investigating a potential further expansion of the centre utilising the five hectares of adjacent land.
Vicinity Centres AnnualReport2016|21
For
per
sona
l use
onl
y

DevelopmentOur$3.7billiondevelopmentpipeline(Vicinityshare:$1.7billion)isakeyvaluedriverofourportfolioenhancementstrategy.
The retail environment is rapidly evolving, with changing customer preferences and new retailers and concepts regularly coming tomarket.Developingourassetsallowsusto revitalise our centres, ensuring that they maintain their relevance while adding to theoverallcustomerexperience.Thisinturnhelpstoimprovethequalityofourincome streams through increased market shareandsalesgrowth.
Thechartbelowoutlinesfivemaindevelopment projects that we completed inFY16,alongwithprojectsinouridentifiedpipeline.Wealsohaveasizeablenumberof additional projects that are in various stages of pre-development planning in addition to those listed in our development pipeline.Asplanningprogressesonour‘shadow pipeline’, these projects advance intoouridentifiedpipelinereplacingthoseliveprojectsastheycomplete.Thisprovidesa forward pipeline of development projects forVicinitywellintothefuture.
XXXX
ENHANCING THE PORTFOLIO continued
1. IncludesRockingham$8million(Vicinityshare:$4million),TheShopsatEllenbrook$15millionandGalleria$5million(Vicinityshare:$3million).
2. Assumescompletionoftheproposedsaleofa25%interestinTheMyerCentreBrisbanetoISPT.
Estimated FY17 commencements
Estimated FY18+ commencements
Current
Completedin FY16
Vicinity share Partner share TotalKey ($m):
Galleria 800400The Myer Centre Brisbane2 30075
Cranbourne Park 10954Colonnades 24 47Halls Head Central 27 54
DFO South Wharf 9 12
Warriewood Square 44 87
Gateway Plaza 85Chadstone Retail and Office 666333
Mandurah Forum 350175
Midland Gate 100
DFO Perth Airport 73 145
The Glen 225 450
Roselands 325 650
DFO South Wharf car park
22 28Other1
46 61
Chadstone hotel 8040
Artist’s impression Chadstone, VIC
Development pipeline
ThefollowingchartillustratesVicinity’sdevelopmentprojectscompletedinFY16andcurrentidentifiedpipeline.
22|Vicinity Centres AnnualReport2016
For
per
sona
l use
onl
y

FY16 completed projectsDuringtheyear,wecompletedfive projects with a total development spend of $309million(Vicinityshare:$158million),with a forecast average initial yield on costof9.1%andanaverageforecast IRRofover14%.
InSeptember2015,wecompletedthe redevelopment of Cranbourne Park inVictoria.TheprojectincludednewColes and Target stores, a refurbished Kmart,46additionalspecialtytenants,the introduction of a new-concept children’s play area as well as a complete revitalisationoftheexistingcentre.
The redevelopment of Colonnades in South Australia involved adding a new fresh‘foodhall’mallwith14additionalspecialty stores anchored by an expanded WoolworthsandanewAldi,creatingapointofdifferenceforthecentrewithinitsregion.TheprojectwascompletedinMarch2016.
TheprojectatHallsHeadCentralinWesternAustraliatripledthesizeoftheexistingNeighbourhood centre, transforming it into aSubRegionalasset.TheexistingColessupermarket was refurbished, and new Kmart and Aldi stores were added to the centre,alongwith42specialtystoresandan alfresco dining area which has been very popularsinceitsopeninginMarch2016.
There was a mini major tenancy remix completedinMarch2016atDFOSouthWharfinVictoria.Aformerminimajortenancywasreconfigured,creatinganewloopmallonthelowergroundfloorwith 22newspecialtystoresaddedtothecentre.Theprojectalsoincludedafoodcourtrefurbishmentandremix.
InJune2016,theredevelopmentofWarriewoodSquareinNewSouthWaleswascompleted.Theprojectincludedtheaddition of a new wing to the centre leading intoanewcarparkdeck.TheWoolworthssupermarket was expanded, while Aldi, AMart,CottonOnMegaand26specialtystores, including a new fashion and lifestyle precinct,wereaddedtothecentre.
Colonnades, SA
Halls Head Central, WA
FY16 completed project metricsProject cost ($m) Initial yield IRR
100% Vicinity % %CranbournePark,VIC 109 54 8.5 >14Colonnades, SA 47 24 9.5 >13HallsHeadCentral,WA 54 27 9.6 >15DFOSouthWharf,VIC 12 9 20.0 >28WarriewoodSquare,NSW 87 44 7.3 >11Total – five projects 309 158 9.1 >14
Vicinity Centres AnnualReport2016|23
For
per
sona
l use
onl
y

Development continuedProjects under constructionThe major expansion and redevelopment of Australia’s number one retail asset, Chadstone Shopping Centre, in Victoria, whichcommencedin2014isnowwelladvanced.Theprojectincludesthecomplete demolition of the northern end of the centre to create a world-class entertainment and leisure precinct around acentralatrium.Abovethisisacolumn-free glass grid-shell roof which sits up to 100feetabovethelowergroundfloor and is one of the largest of its kind in theworld.Oncompletion,thecentrewillhave an expanded luxury tenant offer, internationalflagshipstores,sevennewrestaurants,a1,300-seatfoodgallerywith27outlets,anew13-screenHoytsdigitalcinemacomplexandthefirstLEGOLAND® DiscoveryCentreinthesouthernhemisphere.A10-level17,000sqmofficebuildingonsite has also just completed and is close to being fully leased, a great outcome for asuburbanofficeasset.
Already completed on site is the new Target store, which has traded strongly despite sittinginaconstructionzone,anda14-bay bus interchange, Melbourne’s second busiest, servicing much of the city’s south-eastern suburbs.Thefirststageoftheretailprojectisduetoopeninlate2016,withfinalcompletionin2017.Theprojectcostis$666million(Vicinityshare:$333million),with a forecast initial yield on cost of over 6%andIRRofgreaterthan10%.
ENHANCING THE PORTFOLIO continued
Chadstone construction
Our $3.7 billion development pipeline (Vicinity share: $1.7 billion) is a key value driver of our portfolio enhancement strategy
WecommencedamajorredevelopmentofMandurahForuminWesternAustraliainMaythisyear.Theprojectwillcompletelyrepositionthecentre,with80%oftheexisting building being demolished and totalGLAincreasingby26,400sqmtoover64,000sqm.Thedevelopmentwillconsolidate the centre’s position as the dominant retail destination in the trade area, with the introduction of a new-format DavidJonesstore,alongwithanewTargetstore and refurbished Kmart and Coles stores.Itwillincludeuptofiveminimajortenancies including international retailers, a range of fresh food options including indoor and outdoor dining areas, two children’s play areas and an additional 675carparkingspaces.The$350millionproject(Vicinityshare:$175million)willtake two years to build and is expected to deliver a forecast initial yield on cost ofover6%andIRRofover10%.
Planned projectsThe next major project expected to commenceisthe$450millionmajorredevelopment(Vicinityshare:$225million)ofTheGleninVictoria.Thisprojectwillinvolve a complete refurbishment and repositioning of the centre, featuring arelocatedDavidJonesstore,theintroduction of major international and nationalretailers,andanewtownsquare
surrounded by cafés and restaurants overtwolevels.Thereisplanningapprovalforupto500apartmentsacrossthreetowers on the southern end of the site, which will be delivered by a third-party residential developer, which the centre willbenefitfrom.Thecouncilhasapprovedthedevelopmentapplication(DA)andBoard and joint owner approval has been received subject to a number of conditions precedent.Theprojectisexpectedtocommencein2017.
Plans are also progressing rapidly for a major redevelopment of Roselands inNewSouthWales,whichisforecasttocost$650million(Vicinityshare:$325million).Roselandsiswelloverduefor a development and this project will completelytransformthecentre.Theproposed development, includes a new fashion precinct anchored by a department store, the introduction of major international and national brands, a new Kmart and relocated Target, together with a new cinema and entertainment precinct to complement an upmarket leisure and diningoffer.TheDAhasbeenlodgedand major tenant discussions are well underway, with project commencement expectedinFY17.
24|Vicinity Centres AnnualReport2016
For
per
sona
l use
onl
y

A DA has also been submitted for the majorredevelopmentofGalleriainWesternAustraliafor$800million(Vicinityshare:$400million).Theplanseekstoalmostdoublethesizeofthecentretoaround130,000sqmintotal,transformingtheassetintoaSuperRegionalcentre. The expanded centre is proposed to include the addition of a department store, international retailers, mini major tenanciesandover180newspecialtystores.TheprojectistargetedtocommenceinFY18.
Asset refurbishment projectsTheAssetRefurbishmentTeam(ART) wasestablishedtoenhanceassetqualityand customer experience in assets that arenotflaggedfordevelopmentintheimmediatefuture.ARTprojectsinvolve the investment of small amounts of capital to improve presentation standards and centre ambience, focusing on areas such as common mall space, food courts, entrancesandamenities.Theprojects also aim to assist with securing sustainable rents, driving ancillary income, generating operationalefficiencyandimprovingworkplacehealthandsafetystandards.
InFY16,wecompletedfiveARTprojectsatatotalinvestmentof$6.0millionandgeneratinganaveragereturnofover10%.Customer and retailer feedback on these completedprojectshasbeenpositive. A further nine projects are expected to be completedinFY17atanexpectedtotalcostof$17.3millionanddeliveringsimilarreturnsoninvestment.
Intensive asset management Another fundamental driver of our portfolio enhancement strategy is Vicinity’s intensive asset management approach – a collaborative approach across our centre management, operations, leasing and marketing teams focused on enhancing customer experience and optimising the performanceofeveryassetintheportfolio.
With91retailassetsundermanagement, wearethelargestlandlordtotheWesfarmersandWoolworthsgroups.Aportfolioofthisscaledrivesasignificantknowledgebase,with each of our centre teams able to build on the learnings from other centres acrossourportfolio.Notablyasaresultofthe merger, we are also able to generate awiderangeofsynergies.Inprocurementthisyear,wehavesignificantlyreducedthe number of suppliers, creating fewer but larger and more meaningful supplier relationships.Thishasresultedinanimprovement in overall service delivery standards across our business, driven operationalefficiencies,enhancedriskmanagementandloweredoperatingcosts.
Vicinity also generates ancillary income from casual mall leasing, retail media, electricity on-sellingandstorage.Duringtheyear,weidentifiedanumberofopportunitiestoimprove the productivity of these revenue streams.Wecompletednegotiationsforamajor third-party media contract, expanded our large format digital screen roll-out, focused on generating additional rent from storage space and increased the number of assets where we buy electricity in bulk andon-sellittoretailers.
Centre strategic plansAs an extension of the master-planning of our assets, which focuses on the long-term plan for a centre, every asset in our portfolio has a centre strategic planwhichisrefreshedannually.Withafocus on driving superior outcomes over the short to medium term at an asset level, market research, customer insights and retailer strategies are overlaid on the master-planning and vision for an asset to identify opportunities to enhance a centre’s offer.Theseplansarecreatedwiththecollaboration of the centre management, operations, leasing and development teams to focus on the strategic direction of an asset, and progress is monitored quarterly.Theplanidentifieskeyfocusareasforacentreincluding:customerrequirements,strongerperformingretailers,product opportunities, tenant renewal and replacement strategies, and rent andcapitalrequirements.
XXXX
Chadstone Office construction Mandurah Forum artist’s impression, WA
Vicinity Centres AnnualReport2016|25
For
per
sona
l use
onl
y

DIGITAL
In FY17, we are focused on connecting all of our retail assets and corporate offices to the one high-speed digital network with WiFi capabilities throughout. We will also significantly advance a number of digital initiatives aimed at improving operational performance and enhancing the customer experience
Inlinewithourpurposeofenrichingcommunity experiences, our digital strategy aspires to make our centres Australia’s mostfrequentedandmostlovedretaildestinations through seamlessly combined physicalanddigitalcustomerexperiences.
As a newly merged group with a portfolio of greater scale, we took this year as an opportunity for us to take stock, and to take a fresh look at the role that digital plays in the retail experience, now and intothefuture.
To deliver on our digital vision, we are focused on having people with the appropriate skills and enabling them with the right technology to build a ‘digital culture’atVicinity.InFY17,wehavecommitted to building greater capability in digital and data analytics, while also progressing work on our digital pillars ofconnectivity,onlineandomni-channel.
ConnectivityDuring the year, we commenced a major project to connect all of our retail assets andcorporateofficestoasinglehigh-speeddigitalnetworkwithWiFicapabilities. This will enable us to better connect with our millions of customers and gain greater insight into their behaviour, allowing us to further enhance and tailor their retail experiences.Thedatagatheredfromthisnetwork will also provide real-time insights into the operation of our assets, taking our intensive asset management to the next level, and transforming the way we manage, leaseanddevelopourcentres.
OnlineTo best connect with our customers, we need to provide them with an engaging online experience that makes it easy and enjoyableforthemtofindwhattheyarelookingfor.Todothis,wewillfocusoncreating leading websites that complement ourphysicalassets.InFY17,wewillcommence investment in our websites to ensure that they have the appropriate functionality to create a consistent and optimised user experience regardless of howoursitesareaccessed.
Omni-channelThe future state of digital in the retail environment is one where the physical and digital experiences are seamlessly integrated.Thisseamlessintegrationwill ultimately enhance the customer experience by addressing the pain points oftheretailjourney.Digitallyintegratedshopping centres will also make the retail experience with Vicinity more engaging for customersandalsoforretailers.Wewillhave greater connection with our retailers, the ability to provide them with a range of new services and partner with them to achieve common goals in a new retaillandscape.
The uses of digital technology in the retail environmentwillbebroadandsignificant.They include connecting directly with customers, marketing, retail applications and support, advertising and other new incomestreams,operationalefficiencies,improved analytics of our centres and our customers, and enhanced internal communications.
To help us advance in the digital space, we will seek partners and co-source with technology leaders who have well-developed products and services and who arealignedwithourcompanypurpose.Oursizeableportfolioprovidessignificantopportunity to trial new technologies across a range of centre types and to differentiate theuserexperienceaccordingly.
At Vicinity, we embrace the digital future and are excited about the opportunities ahead to create a more tailored experience for our customers, a deeper relationship with our retailers, and enhance the value propositionforoursecurityholders.
The retail marketplace is constantly changing and digital is playing a fundamental role in driving this evolution. Digital technology is changing how people work, interact, relax and play. It impacts where, when and how they shop. This is why Vicinity is focused on a retail experience and customer engagement that is enhanced through digital technology.
26|Vicinity Centres AnnualReport2016
For
per
sona
l use
onl
y

Emporium Melbourne, VIC
Vicinity Centres AnnualReport2016|27
For
per
sona
l use
onl
y

Withourdesiretocreateagreatworkplace,in our inaugural year as Vicinity, we have focused on better understanding the needs ofourpeople.Togetherwiththecleararticulation of our group strategic direction in the year, this focus has allowed us to clearlydefineandstartourjourneytobuildourdesiredVicinityculture.Aspartofthisdiscovery phase, a group-wide engagement surveywasconductedinMarch2016.
Morethan80%ofourpeoplefromacrossthe business responded to the engagement survey,whichreflectsthewillingnessofour people to share their opinions and their passion to make Vicinity a great placetowork.Thesurveyhighlightedthatour people understand and are aligned with Vicinity’s purpose and strategy, and thattheyhaveastrongsafetyfocus.Wealsoidentifiedanumberofareasforgreater focus in the future, such as further investment in people development and careerpathways.
Theoverallengagementscoreof66%recorded is a solid result in a post-merger environment and marginally above the industry benchmark1.Wewillbefocusedon improving that score over the coming years.Thesurveyfeedbackhasalsohelpedto guide the creation and priorities of our peopleandculturestrategy.
People and culture strategyOur people and culture strategy is designed to support a talented and highly engaged team to deliver with energy and passion a better, easier and more enjoyable experience across Vicinity and for our stakeholders.Thefourpillarsofour peopleandculturestrategycomprise:
• Developing talent and capability: investing in talent management, succession planning and learning and development
• Defining and nurturing our culture and values: embedding our desired culture and values, which focus on a ‘workplace of the future’
• Energising and engaging our people: clearly articulating performance and reward opportunities and career pathways, and
• Shaping our organisation: building a diverse and inclusive workplace with a competitive value proposition through targetedworkforceplanning.
Additionalfocusareasinclude:
• Senior leadership:Wearefocusedoneducation, training and support tools for our senior leaders to drive desired cultural outcomes and enhance engagement andcollaborationacrossourbusiness.Vicinity held a senior leadership forum this year, which will become a regular eventand,inFY17,eachpeopleleaderwill participate in our customised ‘everydayleadershipprogram’.
• Learning and development: Retail property is always changing and we believe that, by investing in our people, we enable them to grow with and drive theevolutionofourbusiness.
• Graduate program: The program focuses on building a pool of talent for our future whilst enhancing the mentoring skillsofourexistingteam.Theprograminvolvesattractingqualitygraduates and immersing them in a range of disciplines throughout the business overan18-monthperiod.
• Employee benefits: A range of services andfinancialandnon-financialbenefits for our employees help to attract and retainqualitypeople.
OUR PEOPLE
1.Professionalservicessector.
Our people and culture strategy is designed to support a talented and highly engaged team to deliver with energy and passion a better, easier and more enjoyable experience across Vicinity and for our stakeholders
As a leading retail property group, we realise that our assets are the focal point of a large number of communities across Australia, and our millions of customers are at the heart of everything we do. Every day, our people strive to enhance their local community’s experience by not only engaging with our customers and their communities, but also engaging with our retailers, suppliers and other stakeholders.
28|Vicinity Centres AnnualReport2016
For
per
sona
l use
onl
y

Health and safetyAt Vicinity, we believe everyone has therighttogohomesafeandhealthy. To deliver on our commitment of providing an injury-free environment, we have developed and implemented an integrated health and safety management system whichisalignedtoAS/NZS4801.
Wehave48healthandsafetychampionsacross our business who attended a two-day induction and education workshop during the year on the health and safety management system and are helping to educate relevant team members across thebroaderbusiness.Forus,itisaboutdeveloping a strong health and safety culture through effective leadership and teamwork, not just complying with policy andprocedure.Wearepleasedwiththeexisting appreciation for safety within the team, with high scores for safety achieved inthisyear’sengagementsurvey.
Gender diversityWe recognise the importance of, and are focused on improving, gender balance across all levels of Vicinity.
Our CEO and Managing Director, Angus McNaughton, is a member of the Property Male Champions of Change for the property industry to address inequality and proactively remove barriers.
While we still have work to do on gender balance in the senior levels of the business, across our operational teams we have a greater proportion of women, which better reflects our customer base.
Vicinity’s gender reporting can be found in the 2016 Corporate Governance Statement on our website vicinity.com.au
Diversity and inclusionThroughout the year, we expanded our focusondiversityandinclusion.Thisisfacilitated through the diversity forum chaired by the CEO with senior leadershiprepresentation.
Webelievethatbuildingonourcultureof trust and encouraging our people to bring their whole selves to work will drive a greater variety of ideas, increase collaboration, enable our people to reach their potential, and ultimately drive superioroutcomes.
Wearebuildingaworkplaceenvironmentthat expects and celebrates differences in people, thoughts and actions, and in turn, reflectsthediversityofthecommunities weserve.
Vicinity Centres AnnualReport2016|29
For
per
sona
l use
onl
y
SUSTAINABILITY
By integrating our business and sustainability strategies, we are able to drive superior economic, environmental and social outcomesforVicinityandourcommunities.
FY16 achievementsDuringFY16wecompletedinitiativesaimed at improving Vicinity’s current and futuresustainabilityperformance.Keyactivitiesfortheyearincluded:
• Integrated strategy: The Board endorsed our fully integrated sustainability strategy, which provides a clear roadmap to position us to become a leading global retailpropertygroup.
• Materiality analysis: To garner a greater understanding of Vicinity’s long-term economic, environmental and social risks and opportunities, we conducted our firstmaterialityassessmentasamergedgroup.Thisincludedextensiveinternalengagement, as well as connecting with a number of key external stakeholders to understand their views on Vicinity’s materialrisksandopportunities.Thiswork has informed and validated our sustainability strategy and will be refreshedonanannualbasis.
• Green Star Performance – Portfolio rating: Vicinity completed a Green Star Performance–Portfoliorating.With91centres rated, Vicinity has the largest portfolio of assets to undertake such a rating.Theresultshavebeenusedtoidentify areas for improvement and also high-performing assets that can be used to illustrate and promote great practices acrossourbroaderportfolio.
• Climate resilience:Withretailassetsbeing large, long-life assets, it is important to understand the potential impact that climatechangemayhaveonourportfolio.Wecompletedahigh-levelassessmentof climate change resilience across our portfolio, gaining greater insight into our climate-relatedrisksandopportunities.The results of this work will be used in the coming year to refresh existing asset continuity plans and enhance the climate resilienceofourportfolio.
• Investor surveys: Vicinity reports on its sustainability agenda and performance throughthreemainsurveys:DowJonesSustainabilityIndex(DJSI),CDP(formerlyCarbonDisclosureProject)andGlobalReal Estate Sustainability Benchmark (GRESB).Thisreportingallowsustoprovide transparency to investors and other stakeholders on our sustainability practices, benchmark ourselves against our peers globally and track our performanceovertime.
By integrating our business and sustainability strategies, we are able to drive superior economic, environmental and social outcomes for Vicinity and our communities
Community engagement through furniture recyclingAs a part of our commitment to enriching our communities’ experiences, we are always looking for ways in which we can give back to our local communities.
This year, Vicinity commenced a program to repurpose furniture no longer being used in a centre that otherwise would have been sent to landfill. In partnership with KFive, one of Vicinity’s preferred suppliers, this furniture is refurbished and donated to create living and social spaces for people within our communities. To date, we have piloted this program at two centres.
At Tuggeranong Hyperdome, refurbished furniture was used to furnish two houses of Indigenous student accommodation in North Coburg in Victoria. This project was completed in collaboration with the Wunan Foundation, a community support group for Aboriginal people.
At Broadmeadows Shopping Centre, furniture was donated to create a new recreational space at a local school where the centre also runs a youth engagement program. Importantly, the furniture initiative highlighted to the students that reusing the furniture was not only providing value for the school and reducing disposal costs, but was also more sustainable for the environment.
Following the success of this program to date, this will be an ongoing initiative across our business and is an example of how our community engagement strategy, to be formalised in FY17, will create value for our communities.
Our shopping centres are the focal point of a large and diverse range of communities across Australia, reflecting the millions of customers who visit them each year. In our inaugural year as Vicinity, we have focused on identifying and understanding the needs of some of our key stakeholders including our customers, retailers, suppliers, investors and our people. This has helped to inform and define our newly developed and fully integrated sustainability strategy.
30|Vicinity Centres AnnualReport2016
For
per
sona
l use
onl
y

Sustainability strategyThis year, we developed a fully integrated sustainability strategy that aspires to position us as a leading global retail propertygroup.Ourstrategyfocuses on creating shared value by conducting our business in a way that creates financialandnon-financialvaluefor Vicinityandourstakeholders.Equallyimportant is maintaining and enhancing our social licence to operate to improve our risk-adjusted returns for securityholders while also building onthetrustofourstakeholders.
The table above outlines each of our shared value and social licence to operate pillars andtheirvalueproposition.
FY17 focusOur key sustainability focus areas and initiativesforFY17areasfollows:
• Produce Vicinity’s inaugural sustainability reportdueforreleaseinthefirsthalf ofFY17
• Investigatealong-termlowcarbontarget for Vicinity
• Establish a community investment program
• Investinselectiverooftopsolarprojects,and
• Introduceinitiativesforemployees to engage with and own our sustainabilityprogram.
Otherinitiativestoprogress:
• Sustainability survey reporting
• Climate resilience of our assets
• Establish key sustainability policies in line with our new strategy
• Set asset environmental performance targets and roll out improvement programs
• Continue National Australian Built EnvironmentRatingSystem(NABERS) and Green Star asset ratings, and
• Investigatesustainabilitypartnershipopportunities.
Further informationMore disclosure on Vicinity’s sustainability framework and achievements can be foundonourwebsitevicinity.com.au
Youcanfindmoredisclosureonthefollowingtopics:
Strategy and business prospects Page9
Governance and sustainability policies vicinity.com.au
CDP survey submissions vicinity.com.au
Our people Page28
Corporate Governance Page32
Management of riskPage18
Other stakeholders including retailers, suppliers, customers and our communities vicinity.com.au/sustainability
Shared value and social licence to operate pillars
Pillar Value proposition
Creating shared value
Centresignificance in the community
Improvingourcommunitiesandtheappealofourcentresthroughbothlocalandnationalactivities
Climate resilience Ensuring that our assets are resilient to increasingly variable climatic patterns and can continue to serve their communities over the long term
Transition to low carbon smart assets
Making a positive contribution to an increasingly carbon constrained economy, by creating smarter andmoreefficientassets
Strategic sustainability partnerships
Engagingwithpartners(capital,suppliersandretailers)toderiveenhancedsustainabilityoutcomes in addition to those achievable by Vicinity in isolation
Highlyengagedpeople Leveragingoursustainabilityagendatofosterahighlyengagedworkforcetodrivesuperioroutcomes for Vicinity and its stakeholders
Social licence to operate
Strong governance Targeting and maintaining the highest standards throughout our business
Hightransparency Providing open and honest communications internally and externally
Minimising our direct environmental impact
Recognisingthatweoperateinanenvironmentwithfiniteresourcesbyfocusingonminimising our environmental impact through all aspects of investment, operations and development
Enhanced risk and reputation management
Undertakingactivitiesthatupholdourreputationandappropriatelymanagerisk
Vicinity Centres AnnualReport2016|31
For
per
sona
l use
onl
y

CORPORATE GOVERNANCE
BoardOur Board is committed to high standards ofcorporategovernance.Ourcorporategovernance platform is integral to supporting our strategic value drivers, protecting the rights of all of our investors and creating long-term value and sustainablegrowth.
Corporate governanceThroughoutFY16,VicinityCentres’governance arrangements were consistent with the Corporate Governance Principles andRecommendations(3rdedition)(Principles)publishedbytheASXCorporateGovernanceCouncil.
Our Corporate Governance Statement outlines our approach to governance including the structure and responsibilities ofourBoardandourexecutive.Itisavailableat:vicinity.com.au/about-us/corporate-governance
Further informationYoucanfindmoredisclosureonthefollowingtopics:
Strategy and business prospects Page9
Management of risk Page18
Sustainability Page30
Tax transparency Page38
Corporate directory Page112
Executive CommitteeTheCEOandManagingDirector(CEO),together with the members of the Executive Committee and senior leaders, is responsible for implementing our strategy, achieving Vicinity’sbusinessperformanceandfinancialobjectives and carrying out the day-to-day managementofVicinity’saffairs.
Management is also responsible for supplying the Board with accurate, timely and clear information to enable the Board toperformitsresponsibilities.
Management committeesThe CEO has established a number of committees to facilitate decision makingbymanagement.Managementcommitteesinclude:
• Executive Committee: comprised ofeightmembersoutlinedonpages36 and37
• Property Investment Committee: includestheCEO,ChiefInvestmentOfficer(CIO)(chair),ChiefFinancialOfficer(CFO), ExecutiveGeneralManager(EGM)Shopping Centres, EGM Development andEGMLeasing
• Capital Management Committee: CEO,CFO(chair),CIO,GeneralManager(GM)Treasuryandanexternalmember
• Diversity Forum: includes CEO and a range of senior leaders, and
• Sustainability Committee: includes theCEO(chair),CIO,EGMShoppingCentres, GM Sustainability and other seniorleaders.
32|Vicinity Centres AnnualReport2016
For
per
sona
l use
onl
y

BOARD OF DIRECTORS
Background and ExperiencePeterHayhasastrongbackground and breadth of experience in business, corporategovernance,financeand investment banking advisory work, with a particular expertise in relation to mergers andacquisitions.MrHaywasapartnerofthelegalfirmFreehillsuntil2005,wherehe served as Chief Executive Officerfrom2000.MrHayhasalsohadsignificantinvolvementin advising governments and government-ownedenterprises.
MrHayisChairmanoftheNominationsCommittee.
Current Directorships, Executive Positions and Advisory RolesChairman:NewcrestMiningLimited.
Director:AustralianInstitute ofCompanyDirectors.
Member:AustralianGovernment Takeovers PanelandAICDCorporateGovernanceCommittee.
Past Non-executive Directorships (past three years)GUDHoldingsLimited,NovionLimited,AluminaLimited,AustraliaandNewZealandBankingGroupLimited, NBNCoLimitedandMyerHoldingsLimited.
Peter HayLLB,FAICDChairman, Independent Non-executive DirectorAppointedJune2015
Background and ExperienceAngus McNaughton has more than25years’experienceinthepropertysector.
Previously, Mr McNaughton was the Managing Director and CEO of Novion Property Group(Novion).BeforeNovion, Mr McNaughton held a number of roles within Colonial First State Global Asset Management (CFSGAM)includingManagingDirectorofProperty,HeadofWholesalePropertyandChiefExecutive of the Manager of KiwiIncomePropertyTrustinNewZealand(nowknownasKiwiPropertyGroupLimited).
Current Directorships, Executive Positions and Advisory RolesDirector:ShoppingCentreCouncil of Australia, Property CouncilofAustralia.
Past Non-executive Directorships (past three years)NovionLimited.
Angus McNaughtonBMS(HONS),FAPICEO and Managing DirectorAppointedOctober20151
Background and ExperienceCharles Macek has extensive executive experience in the financeindustryinAustralia,NewZealand,theUnitedKingdomandJapan.Hehas held numerous senior positions and directorships in a range of public companies including Telstra, and is a former Director and Chairman of IOOF,formerChairmanoftheFinancial Reporting Council and former Vice Chairman of the InternationalFinancialReportingStandardsAdvisoryCommittee.
Mr Macek is Chairman of the RemunerationandHumanResources Committee and a member of the Nominations Committee.
Current Directorships, Executive Positions and Advisory RolesChairman:EarthwatchInstituteAustralia and Greenearth EnergyLtd.
Director:SinefaPtyLtd.
Member:ASICDirectorAdvisoryPanelandInvestmentCommitteeofUniSuperLtd.
Past Non-executive Directorships (past three years)WesfarmersLtd.
Charles MacekBEc,M.Admin,FAICD, FCA, FCPA, SF FinIndependent Non-executive DirectorAppointedDecember2011
Background and ExperienceDr David Thurin has had extensive experience in the property industry that includes senior roles within The Gandel Group and associated companies, includingbeingtheJointManagingDirector.DrThurinwas a Director of The Gandel Group at the time of the merger between Gandel Retail Trust and Colonial First State RetailPropertyTrustin2002.Dr Thurin is the Managing Director and founder of Tigcorp PtyLtd,whichhaspropertyinterests in retirement villages andlandsubdivision.Hehasabackground in medicine, having been in private practice for over a decade, and was a prior PresidentoftheInternationalDiabetesInstitute.
Dr Thurin is a member of the RiskandComplianceCommittee.
Current Directorships, Executive Positions and Advisory RolesDirector:TigcorpPtyLtd,Melbourne Football Club andBakerIDIHeartandDiabetesInstitute.
Past Non-executive Directorships (past three years)NovionLimited.
David Thurin (Dr)MBBS,DIPRACOG,FRACGP,MS in ManagementNon-executive DirectorAppointedJune2015
1. AppointedasCEOinAugust2015andManagingDirectorfollowingthe2015AnnualGeneralMeeting inOctober2015.
Vicinity Centres AnnualReport2016|33
For
per
sona
l use
onl
y

Debra StirlingBA,GAICDIndependent Non-executive DirectorAppointedDecember2011
Background and ExperienceDebra Stirling has more than 20years’experienceasaseniorexecutive in retailing, building and construction materials, manufacturing, mining and agriculture.MsStirlingwasExecutive General Manager of People and Communications forNewcrestMiningLimitedfromJanuary2008toJuly2014.Shehaspreviouslyheldexecutive roles with Rinker Group,CSRandColesMyer.
Ms Stirling is a member of theRemunerationandHumanResources Committee and the Risk and Compliance Committee.
Current Directorships, Executive Positions and Advisory RolesChairman:MonashUniversityResourcesAdvisoryBoard.
Member:PNGGovernment’s LaeTechnicalTrainingCentre ofExcellenceTaskforce.
Past Non-executive Directorships (past three years)None.
Background and ExperiencePeter Kahan has a long career in property funds management, with prior roles including Chief ExecutiveOfficerandFinanceDirectorofTheGandelGroup.Mr Kahan was the Finance Director of The Gandel Group at the time of the merger between Gandel Retail Trust and Colonial First State Retail PropertyTrustin2002.Prior to joining The Gandel Group in1994,MrKahanworkedas a Chartered Accountant and heldseveralseniorfinancialroles across a variety of industrysectors.
Mr Kahan is a member of the Audit Committee, the RemunerationandHumanResources Committee and theNominationsCommittee.
Current Directorships, Executive Positions and Advisory RolesDirector:CharterHallGroup.
ExecutiveDeputyChairman:TheGandelGroupPtyLimited.
Past Non-executive Directorships (past three years)NovionLimited.
Background and ExperienceKaren Penrose has a strong background and experience inbusiness,financeandinvestment banking, in both the bankingandcorporatesectors.She is a full-time non-executive director.Herpriorexecutivecareerincludes20yearswithCommonwealth Bank and HSBCandeightyearsasaChiefFinancialOfficerandChiefOperatingOfficerwithtwoASXlistedcompanies.MsPenrose servedChiefExecutiveWomen(CEW)forsixyearsasamemberofCEW’sCouncilandcontinuesas a member of the advisory panelforCEW’sLeadersProgram.
Ms Penrose is Chairman of the Audit Committee and a member of the Risk and ComplianceCommittee.
Current Directorships, Executive Positions and Advisory RolesDirector:AWELimited, SparkInfrastructureGroup,Future Generation Global InvestmentCompanyLimited(probonorole),BankofQueenslandLimited,MarshallInvestmentsPtyLimited, andUrbanGrowthNSW.
Past Non-executive Directorships (past three years)NovionLimitedandSilverChefLimited.
Peter KahanBCOMM,BACC,CA,MAICDNon-executive DirectorAppointedJune2015
Karen PenroseBCOMM(UNSW),CPA,GAICDIndependent Non-executive DirectorAppointedJune2015
Background and ExperienceRichardHaddockhashadalongcareerinfinancialservicesandwas Deputy General Manager, Australia at BNP Paribas, Sydney from1988to2001.
MrHaddockisamemberoftheAudit Committee and the Risk andComplianceCommittee.
Current Directorships, Executive Positions and Advisory RolesChairman:CatholicCare, Australian Catholic Superannuation and Retirement Fund and St Vincent’sCurranFoundation.
Director:RetirementVillagesGroupLtdandCCILimited.
Past Non-executive Directorships (past three years)NovionLimitedandTishmanSpeyerAustraliaLimited.
Richard Haddock AMBA,LLB,FAICDIndependent Non-executive DirectorAppointedJune2015
BOARD OF DIRECTORS continued
34|Vicinity Centres AnnualReport2016
For
per
sona
l use
onl
y

Background and ExperienceWaiTanghasextensiveretailindustry experience and knowledge gained through senior executive and board roles.Herformerseniorexecutive roles included OperationsDirectorforJustGroup and Chief Executive OfficeroftheJustGroupsleepwear business, Peter Alexander.PriortojoiningtheJustGroup,shewasGeneral Manager of Business DevelopmentforPacificBrands.She was also the co-founder oftheHappyLabretailconfectioneryconcept.
Ms Tang is a member of the Audit Committee and the Risk andComplianceCommittee.
Current Directorships, Executive Positions and Advisory RolesDirector:KikkiK,JBHi-FiLimited,VisitVictoriaand theMelbourneFestival.
Past Non-executive Directorships (past three years)Specialty Fashion Group and L’OréalMelbourneFashionFestival.
Wai TangBAppSc,MBA,GAICDIndependent Non-executive DirectorAppointedMay2014
Background and ExperienceTimHammonhasextensivewealth management, property servicesandlegalexperience.HeiscurrentlyChiefExecutiveOfficerofMutualTrustPtyLimitedandpreviouslyworkedforColesMyerLtdinarangeofrolesincludingChiefOfficer,Corporate and Property Services with responsibility for property development and leasingandcorporatestrategy.HewasalsoManagingPartnerofvariousofficesofMallesonsStephenJaques.
MrHammonisChairmanof the Risk and Compliance Committee, a member of the RemunerationandHumanResources Committee and theNominationsCommittee.
Current Directorships, Executive Positions and Advisory RolesChiefExecutiveOfficer:MutualTrustPtyLimited.
Past Non-executive Directorships (past three years)None.
Tim HammonBCom,LLB,MAICDIndependent Non-executive DirectorAppointedDecember2011
Background and ExperienceTrevor Gerber worked for 14yearsatWestfield,initiallyas Group Treasurer and subsequentlyasDirector of Funds Management responsibleforWestfieldTrustandWestfieldAmericaTrust.Hehasbeenaprofessionaldirectorsince2000,andhasexperience in property, funds management, hotels and tourism, infrastructure and aquaculture.
Mr Gerber is a member of the Audit Committee and theRemunerationandHumanResourcesCommittee.
Current Directorships, Executive Positions and Advisory RolesChairman:SydneyAirportHoldings.
Director:CIMICGroupLimited,TassalGroupLimitedandRegisHealthcareLimited.
Past Non-executive Directorships (past three years)NovionLimited.
Trevor GerberBACC, CA, SAIndependent Non-executive DirectorAppointedJune2015
Vicinity Centres AnnualReport2016|35
For
per
sona
l use
onl
y

David Marcun joined Vicinity CentresinJune2015followingthe Merger with Novion Property Group(Novion),andhasmorethan20years’experiencein the retail property sector, predominantlyinfinanceandoperationsroles.
Prior to his current appointment, David was Chief Operating OfficerandHeadofAssetManagementatNovion(andformerlyCFSGAMProperty)since2009.Duringhiscareer,David has been employed by Novion and its prior entities backtothefloatofGandelRetailTrustin1994.Overthistime,Davidplayedasignificantrole in the Merger of Novion and Federation Centres and the internalisation of CFSGAM Property from Commonwealth BankofAustraliain2013-14.David was also involved in the acquisitionofGandelRetailManagement by CFSGAM Propertyin2002.
David is a member of theInstituteofCharteredAccountantsinAustralia.
JustinMillsjoinedVicinityCentresinJune2015followingthe Merger with Novion Property Group(Novion),andhasmorethan17years’experiencein the retail property sector, centre management, asset management, investment managementandstrategy.
Prior to his current appointment,JustinwasGeneral Manager, Retail Management and Strategy at Novion(andformerlyCFSGAMProperty)since2009.Justinjoined CFSGAM Property in 2002wherehisrolesalsoincluded Assistant Fund Manager of CFS Retail Property Trust Group, Centre Manager of Chadstone Shopping Centre and regional responsibilities acrossseveralVictorianassets.
Carolyn Reynolds joined VicinityCentresinMay2014andhasmorethan20years’experience as a commercial litigationandcorporatelawyer.Inhercurrentrole,Carolynhas oversight of the safety, risk, compliance, company secretarial, lease administration and legal functions for Vicinity, and is a Director of the Vicinity subsidiaryBoards.
Prior to her current appointment, Carolyn was a partner at law firmMinterEllisonfromJuly2003.Carolyngainedextensiveexperience over this time whichfeaturedworkonLasVegas Sands Corporate’s bid for the rights to develop and operate the Marina Bay Sands IntegratedResortinSingapore.Carolyn has also gained diverse experience relating to boards from her legal work and involvement with not-for-profitorganisationssuchas Ovarian Cancer Australia, Glenorchy Art and Sculpture Park and the Moreland CommunityLegalCentre.
Carolyn is a member of the AustralianInstituteofCompanyDirectorsandACCAustralia.
David MarcunExecutive General Manager Business Development
Justin MillsExecutive General Manager Shopping Centre Management
Carolyn ReynoldsGeneral Counsel
EXECUTIVE COMMITTEE
Angus McNaughton joined VicinityCentresinAugust2015andhasmorethan25years’experienceinthepropertysector.
Previously, Angus was the Managing Director and CEO of Novion Property Group (Novion).BeforeNovion,Angusheld a number of roles within Colonial First State Global AssetManagement(CFSGAM)including Managing Director ofProperty,HeadofWholesaleProperty and Chief Executive oftheManagerofKiwiIncomePropertyTrustinNewZealand(nowknownasKiwiPropertyGroupLimited).
Angus is a Fellow of the AustralianPropertyInstitute,Director of the Shopping Centre Council of Australia and the Property Council of Australia, and a Property Male Champion ofChange.
Angus McNaughtonCEO and Managing Director
36|Vicinity Centres AnnualReport2016
For
per
sona
l use
onl
y

Michael O’Brien joined Vicinity CentresinOctober2015and hasover27years’experiencein real estate including shopping centre management and development, real estate funds managementandfinance.
Prior to his current appointment, Michael held a number of senior roles at The GPT Group including Group Executive – Corporate Development, ChiefOperatingOfficerand ChiefFinancialOfficer,aswellas Acting Chief Executive for aperiodthrough2008-09.Previous to this, Michael was atLendLeaseCorporationwhere he held a variety of funds management and shopping centre management positions, includingChiefExecutiveOfficer ofLendLeaseRetail.
Michael is a Fellow of the AustralianPropertyInstitute,anda Director of the Green Building CouncilofAustralia.
Michael O’BrienChief Investment Officer and Acting Executive General Manager Development
Simone Carroll joined Vicinity CentresinNovember2015andhascloseto20years’experience in business transformation, with a strong commercial background that spans across human resources, marketing and commercialstrategy.
Prior to her current appointment, Simone has held executive leadership positions and advisor roles for numerous online domestic and international businesses.MostrecentlySimone was Executive General Manager People and Brand Director at REA Group, which has operations that include Australia’s leading residential and commercial property sites,realestate.com.auandrealcommercial.com.au,whereher responsibilities included all marketing and human resource functions across itsinternationalbusinesses.
In2013,Simonewasrecognised as Australian HRDirectoroftheYear.
RichardJamiesonjoinedVicinityCentresinJune2015andhasmorethan25years’experienceinbankingandfinanceroles.
Richard was formerly Chief FinancialOfficeratNovionPropertyGroup.Priortothis,Richard was Acting General Manager for Superannuation, Marketing & Direct at BT Financial Group after three yearsasChiefFinancialOfficer.Previously, Richard was Chief FinancialOfficerforWestpacNewZealandLimitedandInfrastructureFundManagerandChiefFinancialOfficerat Colonial First State Global AssetManagement(CFSGAM).
Richard is a member of theInstituteofCharteredAccountantsinAustralia.
Stuart Macrae joined Vicinity CentresinJune2015followingthe Merger with Novion Property Group(Novion),andhasmorethan25years’experiencein property management, developmentandleasing.
Prior to his current appointment, he was General Manager of LeasingwithNovion(andformerlyCFSGAMProperty)since2002.Stuartalsohelda number of senior leasing roles within Gandel Retail Managementfrom1989 to2002.
Simone CarrollExecutive General Manager Digital, Marketing, People and Culture
Richard JamiesonChief Financial Officer
Stuart MacraeExecutive General Manager Leasing
Vicinity Centres AnnualReport2016|37
For
per
sona
l use
onl
y

TAX TRANSPARENCY
Our approach to tax Vicinity Centres operates under a comprehensive tax risk management policy which is designed to ensure that it always conducts itself in a lawful manner withrespecttoallofitstaxobligations. Incarryingonitsactivities,Vicinity:
• has robust tax governance, with ongoing oversight from Vicinity’s key executives, Audit Committee and Board of Directors
• has a low risk appetite and does not engage in aggressive tax planning and strategies
• is conservatively geared within a publicly disclosedrangeof25%to35%
• is wholly domestic, does not have any offshore subsidiaries and therefore has no related party cross-border transactions, and
• undertakes to comply with all of its statutory obligations in a timely and transparentmanner.
Overall, Vicinity’s tax culture and business practices are driven by our Vision and Values, and are consistent with our purpose ofenrichingthecommunitiesthatweserve.
Australian tax transparencyTo improve the transparency of business tax affairs, the Board of Taxation has designedaTaxTransparencyCode(TTC)that outlines a set of principles and minimum standards to guide the disclosure oftaxinformation.InadoptingtheTTC’sguidelines, Vicinity aims to provide more informativedisclosureonitstaxaffairs.
Furthermore,VicinityLimited,asacorporate taxpayer with total income in excessof$100million,issubjecttotheAustralianTaxationOffice’s(ATO’s)PublicDisclosureofEntityInformationReportthatisreleasedannually.ThisreportdisclosesVicinityLimited’stotalincome,taxableincome and income tax payable for the relevantfinancialyear.
Vicinity values having good relations with all external stakeholders, including the ATO.VicinityisworkingwiththeATOinitsPre-LodgementComplianceReview(PCR)program.UnderthePCRprogram,Vicinityengages with the ATO on a real-time basis so that, where possible, clearance of any tax issues and transactions occurs prior to the lodgement of Vicinity’s annual incometaxreturns.Vicinityhasahistoryofcompliance,whichisreflectiveofitsapproachandattitudetowardstheATO.
Group structureVicinity has a dual stapled structure, with each stapled security comprising one share inacompany(VicinityLimited)andone unitinatrust(VicinityCentresTrust).
VicinityLimited,anditswhollyownedgroup of entities, undertakes the business of managing Vicinity’s shopping centre portfolio including property management, development management and responsible entity and trustee services for Vicinity Centres Trust, its sub-trusts and external wholesalefunds.VicinityLimitedalsoprovides property and development management services for joint owners ofVicinity’sassetsandotherthirdparties.
Vicinity Centres Trust is a managed investment scheme regulated by Australian SecuritiesandInvestmentsCommission(ASIC)andtheCorporations Act 2001.Vicinity Centres Trust and its controlled trusts hold the real estate investments forVicinity.
The stapling of companies to trusts to createAustralianRealEstateInvestmentTrusts(AREITs),asinthecaseofVicinity, is common in the Australian property industry.Astapledpropertygroupgenerallyholds its real estate investments within a trust, while its management and other tradingactivitiesareheldbythecompany.The structure provides investors the opportunity to invest in property through a regulated and managed scheme, while
at the same time allowing investors to receivethebenefitsandefficienciesthatresult from property investment as if theyheldtheirinvestmentdirectly.Thesebenefitsextendtoflow-throughofthetaxableincome(includingcapitalgains) of the trust so that this income is taxed inthehandsoftheinvestor.
Taxation of VicinityVicinity is a tax resident of Australia and operatesentirelywithintheAustralianmarket.Vicinity does not own any foreign assets, nordoesithaveanyforeignsubsidiaries.
As described above, Vicinity is a stapled groupthatconsistsofcompaniesandtrusts.UnderAustraliantaxlaw,companiesaresubject to income tax at the applicable corporatetaxrate(30%forFY16)ontheirtaxableincome.Trusts,incomparison,aregenerallytaxedonaflow-throughbasis,meaning that a trust’s taxable income istaxedinthehandsofthebeneficiaries attheirapplicabletaxrates.
VicinityLimitedanditswhollyownedgroupof entities are consolidated for income tax purposes, resulting in all members of the consolidated group being treated as asinglecorporatetaxpayer.Asaresult,VicinityLimitedisresponsiblefortheincome tax liability of the consolidated tax group, and intra-group transactions are eliminated in order to determine the consolidatedtaxgroup’staxableincome.
Vicinity Centres Trust and its controlled trusts are not liable to pay income tax (includingcapitalgainstax),asthetaxableincome from their property investments flowsthroughthetrustandistaxedinthehandsofinvestorsannually.Vicinity’sinvestors pay tax at their marginal tax rates, in the case of Australian resident investors, orthroughtheManagedInvestmentTrust(MIT)withholdingrulesfornon-residentinvestors.
38|Vicinity Centres AnnualReport2016
For
per
sona
l use
onl
y

Reconciliation of accounting profit to income tax paidA full reconciliation of Vicinity’s accounting netprofittoincometaxpaidisincluded in the deferred and current tax note in Note3oftheFinancialReport.Ininterpretingthe disclosure in the deferred and current tax note, it should be noted that the accountingnetprofitisdeterminedinaccordance with the Australian Accounting Standards.Taxableincome,incontrast, isaconceptdefinedunderincometaxlaw,which is calculated by subtracting allowable deductionsfromassessableincome.Anentity’s income tax liability is calculated by multiplying its taxable income by its applicabletaxrate.
Theaccountingnetprofitthatwasattributable to securityholders of Vicinity Centres Trust and its controlled entities was $1,266.5millionforFY16.Thisaccountingnetprofitwasderivedthroughitstruststructure, so the taxable income that is referrabletothisnetprofitisthereforetaxed in the hands of securityholders, asdescribedabove.
TheVicinityLimitedincometaxconsolidatedgroup generated an accounting net loss of$305.6million.ThereforeVicinityLimitedwasalsoinataxlossposition,albeit a much lower tax loss for the year ofapproximately$70million,duetointegration costs and costs relating to the internalisation of the Novion Property Group.Therefore,VicinityLimitedwillpaynilincometaxforFY16.VicinityLimited’slosses that are carried forward to later income years are partly recognised through its deferred tax asset balance and described in detail in the deferred and current tax disclosuresatNote3(c)oftheFinancialReport.VicinityLimitedwillbecometaxpayable when it fully utilises its tax losses andotherdeferredtaxassets.
ItisnotedthatVicinityLimited’sniltaxableincome and nil income tax payable will be reported in the ATO’s Public Disclosure of EntityInformationReportforthe2016financialyear,whichisexpectedtobereleasedinlate2017.
Effective tax rateUndertheTTC,Vicinityhaschosentocalculateitseffectivetaxrate(ETR)asincometaxexpense(currentanddeferred)dividedbyaccountingprofit.Itisnoted thatthisisasimplifiedmethodofcalculating the ETR, and should not be compared to the corporate tax rate without appreciating the differences between accountingprofitandtaxableincome (asexplainedabove).Furtherinformationis available on the ATO’s tax transparency webpageexplainingsuchvariances(refer to‘Furtherinformation’onpage40).
Given that Vicinity Centres Trust does notpayincometax(rather,taxispaidbyVicinity’ssecurityholders),ithasnilincometaxexpenseandthereforenilETR.VicinityLimitedwillnotpayincometaxinrespectofFY16duetoitstaxlosses,henceithasniltaxexpenseandthereforenilETR.
Chadstone, VIC
Vicinity Centres AnnualReport2016|39
For
per
sona
l use
onl
y

Contributions to the Australian tax systemVicinityCentresTrust’sflow-through trust status means that Vicinity investors pay income tax directly on Vicinity’s propertyinvestmentsincome.ForFY16, Vicinity’s investors will pay income tax on the taxable components of the $700.7milliondistributionpaidtothem.The taxable components of the distribution will be communicated to retail investors and uploaded onto the Vicinity website, along with the Fund Payment notice for MITwithholdingpurposes,inlateAugust2016.Asthemajorityofournon-residentinvestors hold their interests indirectly (forexamplethroughcustodians),the Fund Payment notice informs these third parties of the amount of tax to withhold fromourdistribution.
Additionally, as a business that operates in the Australian property industry, Vicinity is subject to various other taxes at the federal,stateandlocalgovernmentlevels.These taxes amount to approximately $312.6millionandareeitherborne by Vicinity as a cost of our business, or are remitted by Vicinity as part of our contribution to the administration of the taxsystem.Ascanbeseenbelow,thetaxesremittedincludepayasyougo(PAYG)withholding taxes paid by our employees andGoodsandServicesTax(GST)wecollect from our retailers who rent space in our centres, net of GST claimed by Vicinity onitsownpurchases.
The information provided below summarises Vicinity’s Australian tax contributionforFY16.
Further information• VicinityLimitedtaxespaidinformationis
published by the ATO in its Report of Entity Informationpublishedondata.gov.au
• A breakdown of the taxable components that investors receive via their annual taxation statements will be available inlateAugustonVicinity’swebsite: vicinity.com.au
• ATO’s webpage on tax transparency for corporate tax entities, including backgroundinformationandexplanations:ato.gov.au/Business/Large-business/ In-detail/Tax-transparency/Tax-transparency--reporting-of-entity-tax-information
• Further details on the merger can be found in the ‘Merger of Federation Centres and Novion Property Group’ section under ‘About this report’ in the Notes to the FinancialStatements.
Land tax $30.8mStamp duty – merger $63.2mStamp duty – property acquisitions $18.9mLocal rates and levies $50.3mFringe benefits tax $1.4mPayroll tax $12.0mWorkCover contributions $0.6m
Total taxes borne by Vicinity$177.2m1,2
Net GST remitted $74.9m– GST collected $185.4m– Less GST claimed $110.5m
PAYG withholding $59.7mTaxes withheld from investors3 $0.8m
Total taxes remitted by Vicinity$135.4m2
1.Landtaxandlocalratesandleviesdatahasbeenextractedfromthegroupfinancialstatementsandthereforemayvaryfromtheactualtaxespaidduetotimingdifferences.
2. Inrespectofthefinancialyearended30June2016.
3. ThisrepresentstaxeswithheldfromVicinity’sinvestors.Asthemajorityofourinvestorseithersupplytheirtaxfilenumberorinthecaseofnon-residents,holdtheirinterestsindirectly,thisfigureisnotrepresentativeoftheactualtaxpaidbyourinvestors.
TAX TRANSPARENCY continued
40|Vicinity Centres AnnualReport2016
For
per
sona
l use
onl
y

Emporium Melbourne, VIC
Vicinity Centres AnnualReport2016|41
For
per
sona
l use
onl
y

FINANCIAL REPORTFor the year ended 30 June 2016
INSIDE
43 Directors’ Report
47 Remuneration Report
66 Auditor’sIndependenceDeclaration
67 StatementofComprehensiveIncome
68 Balance Sheet
69 StatementofChangesinEquity
70 Cash Flow Statement
71 Streamlined Financial Statements
72 Notes to the Financial Statements
72 About this Report
74 Operations
88 Capital Structure and Financial Risk Management
94 WorkingCapital
97 Remuneration
100 Other Disclosures
108 Directors’ Declaration
109 IndependentAuditor’sReport
111 Summary of Securityholders
42|Vicinity Centres AnnualReport2016
For
per
sona
l use
onl
y

TheDirectorsofVicinityLimitedpresentthefinancialreportofVicinityCentresfortheyearended30June2016.VicinityCentres(VicinityortheGroup)isastapledgroupcomprisingVicinityLimited(theCompany)andVicinityCentresTrust(theTrust).Althoughseparateentities,the Stapling Deed entered into by the Company and the Trust ensures that shares in the Company and units in the Trust are ‘stapled’ togetherandaretradedcollectivelyontheAustralianSecuritiesExchange,undertheASXcode‘VCX’.
DirectorsTheBoardofDirectorsofVicinityLimitedandVicinityCentresRELtd,asResponsibleEntity(RE)ofVicinityCentresTrust(together,theVicinityBoard)consistofthesameDirectors.ThefollowingpersonsweremembersoftheVicinityLimitedBoardfrom1July2015anduptothedateofthisreportunlessotherwisestated:
ChairmanPeterHay(Independent)
Non-executive DirectorsCharlesMacek(Independent)David Thurin DebraStirling(Independent)(appointed28October2015)1
KarenPenrose(Independent)Peter Kahan RichardHaddockAM(Independent)TrevorGerber(Independent)(appointed28October2015)1
TimHammon(Independent)WaiTang(Independent)
Executive DirectorAngusMcNaughton(appointedasChiefExecutiveOfficeron3August2015andManagingDirectoron28October2015)1
FurtherinformationonthebackgroundandexperienceoftheDirectorsiscontainedonpages33to35ofthisreport.
Company SecretariesCarolynReynolds(appointed20November2015)Michelle Brady
Principal activitiesTheGrouphasitsprincipalplaceofbusinessatChadstoneShoppingCentre,1341DandenongRoad,Chadstone,Victoria3148.
The principal activities of the Group during the year were property investment, property management, property development, leasing andfundsmanagement.
DIRECTORS’ REPORT
1. TheVicinityLimitedconstitutioncontainedalimitonthemaximumnumberofDirectorsbeingeight.FollowingsecurityholderapprovalofamendmentstotheVicinityLimitedconstitutionatthe2015AnnualGeneralMeeting, this limit was removed and Mr Gerber, Ms Stirling and Mr McNaughton were appointed as Directors of Vicinity Limited.PriortotheirappointmentasDirectors,MrGerberandMsStirlingwerealternateDirectorsofVicinityLimited.
Vicinity Centres AnnualReport2016|43
For
per
sona
l use
onl
y

Merger of Federation Centres and Novion Property GroupOn11June2015,thestapledentitiesFederationCentres(Federation)andNovionPropertyGroup(Novion)merged(theMerger)tocreateVicinityCentres,oneofAustralia’sleadingrealestateinvestmenttrusts.UnderthetermsoftheMerger,eachNovionSecuritywasexchangedfor0.8225FederationSecurities,resultinginFederationasthelegalacquirerandNovionasthelegalacquiree.Underaccountingstandards(AASB3Business Combinations),thetransactionwasaccountedforasareverseacquisitionandNovionwasidentifiedastheaccountingacquirerandFederationastheaccountingacquiree.Accordingly,thefollowingamountsarerepresentedinthefinancialstatements:
12 months to 30-Jun-16
12 months to 30-Jun-15
StatementofComprehensiveIncomeVicinity Centres
1monthFederation+
12monthsNovionStatementofChangesinEquityCash Flow Statement
UnderlyingEarningsVicinity Centres
12monthsFederation+
12monthsNovion
As at 30-Jun-16
As at 30-Jun-15
Balance Sheet Vicinity Centres Vicinity Centres
Change of corporate nameOn28October2015thesecurityholdersoftheGroupapprovedthechangeoftheCompany’snamefromFederationLimitedtoVicinityLimited.Consequently,on2November2015,theGroupwasrebrandedasVicinityCentres,FederationCentresTrustNo.1wasrenamedVicinityCentresTrustandFederationCentresLimitedwasrenamedVicinityCentresRELtd.
Review of results and operationsTheoperatingandfinancialreviewiscontainedonpages9to19ofthisreport.
Significant mattersThe Directors are not aware of any matter or circumstance not otherwise dealt with in the Directors’ Report or the Financial Statements thathassignificantlyormaysignificantlyaffecttheoperationsoftheGroup,theresultsofthoseoperations,orthestateoftheGroup’saffairsinfuturefinancialyears.
DistributionsTotaldistributionsdeclaredbyVicinityduringtheyearwereasfollows:
Total $m
Cents per stapled security
Interim–31December2015 348.4 8.8Final–30June2016 352.3 8.9Total – year end 700.7 17.7
Thefinaldistributionof8.9centsperstapledsecuritywillbepaidon30August2016.
DIRECTORS’ REPORT continued
44|Vicinity Centres AnnualReport2016
For
per
sona
l use
onl
y

Director related informationIndemnification and insurance of Directors and OfficersThe Company must indemnify the Directors, on a full indemnity basis and to the full extent permitted by law, against all losses or liabilities incurredbytheDirectorsasofficersoftheCompanyorofarelatedbodycorporateprovidedthatthelossorliabilitydoesnotariseoutofmisconduct,includinglackofgoodfaith.
Duringthefinancialyear,theCompanyinsureditsDirectors,SecretariesandOfficersagainstliabilitytothirdpartiesandforcostsincurredindefendinganycivilorcriminalproceedingsthatmaybebroughtagainstthemintheircapacityasDirectorsorOfficersofVicinity.Thisexcludesaliabilitythatarisesoutofwilfulbreachofdutyorimproperuseofinsideinformation.ThepremiumalsoinsurestheCompanyforanyindemnitypaymentsitmaymaketoitsOfficersinrespectofcostsandliabilitiesincurred.Disclosureofthepremiumpayableisprohibitedundertheconditionsofthepolicy.
Director security holdingsDirectorsecurityholdingsasat30June2016aredetailedonpage65oftheRemunerationReport.Therehavebeennomovementsinsecurityholdingsbetween30June2016andthedateofthisreport.
Meetings of DirectorsDetailsofthenumberofmeetingsoftheBoardofVicinityLimitedandthenumberofmeetingsattendedbyeachDirectorisshowninthetablebelow.(A) represents number of meetings eligible to attend and (B)representsthenumberofmeetingsattended.
Board – General Meetings
Board – Special Purpose Meetings1 Audit Committee
Remuneration Committee
Risk & Compliance Committee
(A) (B) (A) (B) (A) (B) (A) (B) (A) (B)PeterHay 9 9 8 8 - - - - - -Angus McNaughton2 6 6 6 6 - - - - - -Charles Macek 9 9 8 8 - - 8 8 - -David Thurin 9 9 8 7 - - - - 5 5Debra Stirling2 6 6 6 6 - - 8 7 5 5Karen Penrose 9 9 8 7 8 8 - - 5 5Peter Kahan 9 9 8 8 8 8 8 8 - -RichardHaddockAM 9 9 8 7 8 8 - - 5 5Trevor Gerber2 6 6 6 5 8 7 8 8 - -TimHammon 9 9 8 8 - - 8 8 5 5WaiTang3 9 8 8 8 8 7 - - 5 4
1.SpecialPurposeBoardmeetingswerescheduledandconvenedatshortnoticetoconsiderspecialpurposeapprovals.
2.TheVicinityLimitedconstitutioncontainedalimitonthemaximumnumberofDirectorsbeingeight.FollowingsecurityholderapprovalofamendmentstotheVicinityLimitedconstitutionatthe2015AnnualGeneralMeeting,thislimitwasremovedandMrGerber,MsStirlingandMrMcNaughtonwereappointedasDirectorsofVicinityLimited. PriortotheirappointmentasDirectors,MrGerberandMsStirlingwerealternateDirectorsofVicinityLimited.
3.MsTangwasgrantedapersonalleaveofabsencefortheJune2016meetings.
VicinityhadaNominationsCommittee,consistingofMrHay,MrHammon,MrMacekandMrKahan,whichdidnotmeetduringtheyear.
Vicinity Centres AnnualReport2016|45
For
per
sona
l use
onl
y

Auditor related informationErnst&Young(EY)istheauditoroftheGroupandislocatedat8ExhibitionStreet,Melbourne,Victoria3000.
Indemnification of AuditorsTo the extent permitted by law, the Company has agreed to indemnify EY, as part of the terms of its audit engagement agreement, against claims by third parties arising from theaudit(foranunspecifiedamount).No payment has been made under this indemnity to EY during or since the end ofthefinancialyear.
Non-audit servicesThe Group may decide to employ the auditor on assignments additional to their statutory audit duties where the auditor’s expertise and experience with the Group are essential and will not compromise theirindependence.
Details of the amounts paid or payable to EY for audit and non-audit services provided duringtheyeararesetoutinNote17totheFinancialReport.
The Board has considered the non-audit services provided during the year and is satisfiedtheseservicesarecompatiblewiththe general standard of independence for auditors imposed by the Corporations Act 2001(Cth)forthefollowingreasons:
• All non-audit services have been reviewed by the Audit Committee to ensure they do not impact the impartiality and objectivity of the auditor; and
• None of the services undermine the general principles relating to auditor independence as set out in APES 110Code of Ethics for Professional Accountants.
A copy of the auditor’s independence declarationasrequiredundersection307CoftheCorporations Act 2001(Cth)is included immediately following the Directors’report.
Environmental regulationThe Group is subject to the reporting obligations under the National Greenhouse and Energy Reporting (NGER) Act 2007 (Cth).ThisrequirestheGrouptoreportannual greenhouse gas emissions, energy use and production for all assets under managementforyearsending30June. The Group met this obligation during the2016financialyearbysubmitting its NGER report to the Department of the Environment for the year ended 30June2015by31October2015.TheGroup monitors its other environmental legal obligations and is compliant for thereportingperiod.
Corporate GovernanceInrecognisingtheneedforhighstandardsof corporate behaviour and accountability, theDirectorsofVicinityLimitedsupportand have followed the third edition of theASXCorporateGovernanceCouncil’sCorporate Governance Principles and Recommendations.Thefullcorporategovernance statement is available on the Corporate Governance section of the Company’swebsiteatvicinity.com.au.
Options over unissued securitiesAsat30June2016andatthedate ofthisreport,therewere4,385,154unissued ordinary securities under option intheformofperformancerights.Refer to the remuneration report for further details of the options outstanding for KeyManagementPersonnel.
Option holders do not have any rights, by virtue of the option, to participate in any securityissueoftheGroup.
Events after the end of the reporting periodNo matters have arisen since the end of theyearwhichhavesignificantlyaffectedormaysignificantlyaffecttheoperationsofthe Group, the results of those operations, or the state of affairs of the Group in future financialperiods.
Rounding of amountsThe Company is an entity of a kind referred toinClassOrder2016/191,issuedbytheAustralianSecuritiesandInvestmentsCommission(ASIC),relatingtothe‘roundingoff’ofamountsintheDirectors’report.Accordingly, amounts in the Directors’ report have been rounded off to the nearest tenth ofamilliondollars($m)inaccordancewiththatClassOrder,unlessstatedotherwise.
DIRECTORS’ REPORT continued
46|Vicinity Centres AnnualReport2016
For
per
sona
l use
onl
y
Dear Securityholders
OnbehalfoftheBoard,IampleasedtopresentourFY16RemunerationReportfor which we will seek your approval at our Annual General Meeting in November 2016.TheRemunerationReportisdesigned to provide you with the necessary information to demonstrate the link between Vicinity’s strategy, performance, and the remuneration outcomes for our ExecutiveKeyManagementPersonnel.
WhilethefirstfullyearasVicinityhasseensignificantchangeandtransitiontakeplaceacross the business, we have achieved or exceededanumberofkeyfinancialandstrategicmilestones.
Planned merger synergies and related activitieshavebeenwellprogressed.Substantial progress has been made onenhancingthequalityoftheportfoliothrough delivery of the development pipeline and successfully executing an asset divestment program as well as select acquisitions.Pleasingly,theseinitiativeshave contributed to underlying earnings persecuritygrowthof9.0%to19.1cents1, nettangibleassetsof$2.59persecurityup5.7%,andatotalreturnof14.6%fortheyearended30June2016.Statutorynetprofitfortheyearwas$960.9million.
As part of our evolution in our inaugural year post merger, we have made a number of new executive appointments and reviewed our Executive Key Management Personnel.Thishasresultedinseveralchanges and further details can be found insection1.3.
The evolving journey of bringing two cultures together with a focus on best of both is well advanced, one which values a strong community purpose, and health, safety andwellbeing.
Withunderlyingearningsandtotalreturntargets exceeded, and the substantial progress made on post-merger integration andportfolioqualityenhancementinitiatives,anaverageof77.8%ofthemaximum Performance Reward Plan Short (PRPS)opportunityavailablewasawardedtoExecutiveKeyManagementPersonnel.NoPerformanceRewardPlanLong(PRPL)vested to current KMPs due to them commencing employment after the awardsweregranted.
During the year, a minimum security holding policyforIndependentNon-executiveDirectorswasintroduced.ThispolicyencouragesDirectorstoacquireaholdingofsecuritiesequalinvaluetooneyearofbaseBoardfees(onanaftertaxbasis)withinfiveyearsfromtheintroductionofthepolicy.
To recognise the importance of the contribution by all employees we maintain anExemptEmployeeSecurityPlan(EESP).This enables Vicinity Centres to gift up to $1,000worthofsecuritiestoeacheligibleemployee.Thisyearweexpectsome 1,100employeestobenefitfromtheEESP.
Vicinity’s reward principles and framework remainedconsistentthroughoutFY16butarebeingreviewed.Akeyfocusremainson motivating performance and further aligning the interests of executives and securityholders.
Charles MacekChairman–RemunerationandHumanResources Committee
REMUNERATION REPORT
Charles MacekChairman – Remuneration and HumanResourcesCommittee
Letter from Chairman of the Remuneration and Human Resources Committee
1. ComparisonstoaggregateofFederationCentres(Federation)andNovionPropertyGroup(Novion)for the12monthsto30June2015.
Vicinity Centres AnnualReport2016|47
For
per
sona
l use
onl
y

Report overviewThisRemunerationReportoutlines:
• Vicinity’s reward principles and framework
• TheGroup’sperformanceforthe2016financialyearandtheoutcomesforExecutiveKMPremuneration,and
• RemunerationreceivedbyDirectorsandExecutiveKMP.
ThecontentsoftheRemunerationReport(assetoutbelow)aregovernedbytheCorporations Act 2001,s300AandtheCorporationsLegislation.Unlessotherwisenoted,figurescontainedwithinthisreportarepreparedonabasisconsistentwiththerequirementsofAustralianAccountingStandardsandhavebeenaudited.
1. Remuneration framework 492. Company performance and Executive remuneration outcomes 513. Executive remuneration – further information 584. Non-executive Director remuneration 615. Other Remuneration information 63
Impact of the merger on comparative informationAshighlightedinthe‘MergerofFederationCentresandNovionPropertyGroup’sectiononpage44oftheDirectorsreport,themergerwasaccountedforasareverseacquisitionintheyearended30June2015.ThismeansthatthecomparativeinformationinthisRemunerationReportfortheyearended30June2015comprisesremunerationof:
• KMP of the Federation Group for the pre-merger period, and
• KMPofVicinityforthepost-mergerperiod(11June2015to30June2015).
RemunerationofformerNovionKMPandNon-executiveDirectorspriortothemergerisnotincludedinthecomparativeinformation.
REMUNERATION REPORT continued
48|Vicinity Centres AnnualReport2016
For
per
sona
l use
onl
y

1. Remuneration framework1.1 Reward principles and frameworkAt Vicinity, the objective of our remuneration framework is to build capability through attracting, retaining and engaging the right executive teamwhilealigningtheiractionswithsecurityholderinterests.Thisisachievedthroughlinkingremunerationtobothshortandlong-termcompanyperformance.Thisencouragesexecutivestofocusoncreatinglong-termgrowthandcomplementsourVisionofenrichingcommunityexperiencesbyminimisingactionsthatfocusonlyontheshortterm.
The diagram below provides a snapshot linking our reward principles to the components of our remuneration framework and how these componentsaremeasuredtoensurethatexecutiveandsecurityholderinterestsarealigned.
Reward Principles
Attract, retain and motivate highperformingexecutives.
Demonstrate link between performance, strategy execution
andvaluecreation.
Encourage executives to manage from the perspective
ofsecurityholders.
Remuneration Framework
Components Performance Measures Strategic Objective
Total Fixed Remuneration (TFR)
Base salary, superannuation and anysalarysacrificeamounts.
Further details are contained insection3.1.
+
• Benchmarkedtocompetitiverates.
• Size,scopeandcomplexityoftherole.
• Therelevantjobmarket.
• Individualexperience,capability andperformance.
• Remuneration set at competitive levels, to attract, retain and engage keytalent.
Performance Reward Plan Short (PRPS)
Annualbonusopportunity,12monthperformance period subject to performancetargets.
Partially paid in cash and partially deferredintoequity(24months deferralfortheCEOand18months forotherExecutiveKMP).
Further details are contained insection3.2.
+
Measured against four performance categories:
• Financial: targets include underlying earnings, net property income and managementexpenseratio.
• Strategic: relates to embedding values across the organisation anddeliveringGroupstrategy.
• People & Leadership: employee engagement and relationships with keystakeholders.
• Operational Excellence: comprises innovation, sustainability and safetymetrics.
• Financial targets relate to Vicinity’s capacity to pay distributions and generatesecurityholderreturns.
• Strategic measures focus on asset andbusinessplanning.
• People and leadership objectives aim to promote a culture and behaviours that drive company performance and reflectourlong-termobjectives.
• Operational excellence areas focus on providing safe and sustainable environments for employees, customers and retailers, and a drive forefficiencyandinnovationacross thebusiness.
Performance Reward Plan Long (PRPL)
Performance rights, three year performance period, additional one yearholdinglock.
Further details are contained insection3.3.
The performance rights vest subject toachievementofan:
• Internalhurdlebasedontotalreturn(TR);and
• External hurdle based on total securityholderreturn(TSR)relative totheS&P/ASX200A-REIT (AustralianRealEstateInvestmentTrust)index,excludingWestfieldCorporation(ASX:WFD).
• Encourages sustainable high performance over the medium to long termandsecurityholdervaluecreation.
• Providesretentionelement.
• TR measures the extent to which VicinityefficientlymanagesandextractsvaluefromVicinity’sassets.
• Relative TSR hurdle aligns remuneration with Vicinity’s long-term return relative toitsnominatedpeergroup.
Vicinity Centres AnnualReport2016|49
For
per
sona
l use
onl
y

1. Remuneration framework continued1.2 Pay mixAsignificantcomponentofexecutiveremunerationislinkedtoshortandlong-termcompanyperformancetoassistinaligningexecutiveinterestswiththoseofsecurityholders.TherelativeweightingsofthefixedandatriskcomponentsoftotaltargetremunerationforCurrentExecutiveKMParedetailedinFigure1.1below.AhigherproportionoftheCEO’stotalremunerationisatriskashehasthegreatestscopetoinfluenceVicinity’slong-termperformance.
Figure 1.1
TFR 35%PRPS 35%PRPL 30%
Chief Executive Officer
TFR 40%PRPS 30%PRPL 30%
Chief Financial Officer
TFR 44%PRPS 28%PRPL 28%
Chief Investment Officer
1.3 Key Management Personnel (KMP)The KMP of the Group includes all Non-executive Directors and those executives who are deemed to have authority and responsibility forplanning,directingandcontrollingtheactivitiesofVicinity(ExecutiveKMP).
AsummaryoftheexecutiveswhoheldKMPpositionsduringtheyearandtheirtenureasKMPisshowninTable1.2below.Throughout thisreporttheterm:
• ‘CurrentExecutiveKMP’isusedtorefertothosepersonswhowereExecutiveKMPat30June2016,and
• ‘FormerExecutiveKMP’referstothosepersonswhoheldExecutiveKMPpositionforpartofthecurrentorprioryear.
Table 1.2
Name Position TenureCurrent Executive KMPAngus McNaughton CEOandManagingDirector(CEO) Partyear(appointed3August2015)RichardJamieson ChiefFinancialOfficer(CFO) Full yearMichael O’Brien1 ChiefInvestmentOfficer(CIO) Partyear(appointed12October2015)
Former Executive KMP2
Steven Sewell ChiefExecutiveOfficerandManagingDirector Partyear(ceased3August2015)Stuart Macrae1 ExecutiveGeneralManagerLeasing Partyear(until12October2015)JonathanTimms1 Executive General Manager Development Partyear(until12October2015)
1. Duringtheyear,aChiefInvestmentOfficer(CIO)wasappointedwhoisresponsibleforoversightoftheGroup’sassetstrategy.ThisresultedinareviewofKMPbeingcompletedwiththeExecutiveGeneralManagerLeasingandExecutiveGeneralManagerDevelopmentnolongerconsideredKMPfromthedateoftheCIO’sappointment.
2. TheFormerExecutiveKMPnotedinthistablearethosewhoheldaKMPpositionduringFY16.FormerExecutiveKMPwhoheldKMPpositionsduringtheyearended 30June2015areincludedinthestatutoryremunerationtablesinsection2.4.
ThelistofNon-executiveDirectorsduringthecurrentandprioryearscanbefoundinsection4.2.
REMUNERATION REPORT continued
50|Vicinity Centres AnnualReport2016
For
per
sona
l use
onl
y
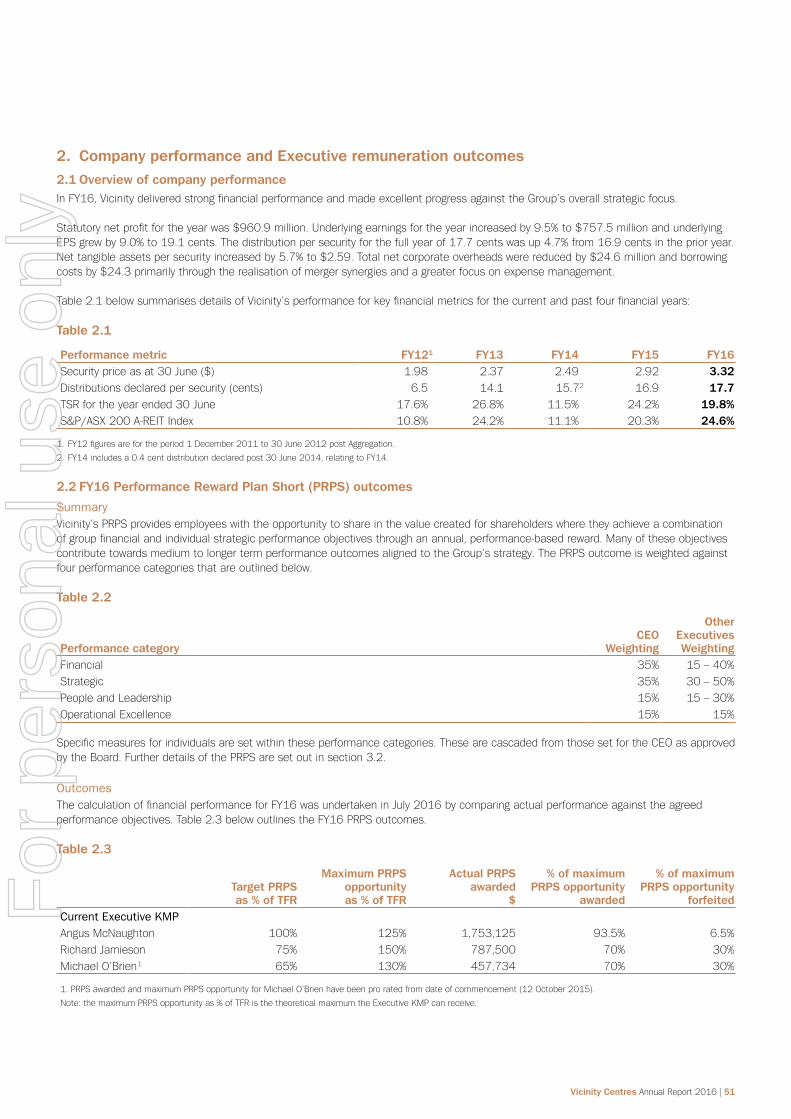
2. Company performance and Executive remuneration outcomes2.1 Overview of company performanceInFY16,VicinitydeliveredstrongfinancialperformanceandmadeexcellentprogressagainsttheGroup’soverallstrategicfocus.
Statutorynetprofitfortheyearwas$960.9million.Underlyingearningsfortheyearincreasedby9.5%to$757.5millionandunderlyingEPSgrewby9.0%to19.1cents.Thedistributionpersecurityforthefullyearof17.7centswasup4.7%from16.9centsintheprioryear.Nettangibleassetspersecurityincreasedby5.7%to$2.59.Totalnetcorporateoverheadswerereducedby$24.6millionandborrowingcostsby$24.3primarilythroughtherealisationofmergersynergiesandagreaterfocusonexpensemanagement.
Table2.1belowsummarisesdetailsofVicinity’sperformanceforkeyfinancialmetricsforthecurrentandpastfourfinancialyears:
Table 2.1
Performance metric FY121 FY13 FY14 FY15 FY16Securitypriceasat30June($) 1.98 2.37 2.49 2.92 3.32Distributionsdeclaredpersecurity(cents) 6.5 14.1 15.72 16.9 17.7TSRfortheyearended30June 17.6% 26.8% 11.5% 24.2% 19.8%S&P/ASX200A-REITIndex 10.8% 24.2% 11.1% 20.3% 24.6%
1.FY12figuresarefortheperiod1December2011to30June2012postAggregation.
2.FY14includesa0.4centdistributiondeclaredpost30June2014,relatingtoFY14.
2.2 FY16 Performance Reward Plan Short (PRPS) outcomes
SummaryVicinity’s PRPS provides employees with the opportunity to share in the value created for shareholders where they achieve a combination ofgroupfinancialandindividualstrategicperformanceobjectivesthroughanannual,performance-basedreward.ManyoftheseobjectivescontributetowardsmediumtolongertermperformanceoutcomesalignedtotheGroup’sstrategy.ThePRPSoutcomeisweightedagainstfourperformancecategoriesthatareoutlinedbelow.
Table 2.2
Performance categoryCEO
Weighting
Other Executives Weighting
Financial 35% 15–40%Strategic 35% 30–50%PeopleandLeadership 15% 15–30%Operational Excellence 15% 15%
Specificmeasuresforindividualsaresetwithintheseperformancecategories.ThesearecascadedfromthosesetfortheCEOasapprovedbytheBoard.FurtherdetailsofthePRPSaresetoutinsection3.2.
OutcomesThecalculationoffinancialperformanceforFY16wasundertakeninJuly2016bycomparingactualperformanceagainsttheagreedperformanceobjectives.Table2.3belowoutlinestheFY16PRPSoutcomes.
Table 2.3
Target PRPS as % of TFR
Maximum PRPS opportunity as % of TFR
Actual PRPS awarded
$
% of maximum PRPS opportunity
awarded
% of maximum PRPS opportunity
forfeitedCurrent Executive KMPAngus McNaughton 100% 125% 1,753,125 93.5% 6.5%RichardJamieson 75% 150% 787,500 70% 30%Michael O’Brien1 65% 130% 457,734 70% 30%
1.PRPSawardedandmaximumPRPSopportunityforMichaelO’Brienhavebeenproratedfromdateofcommencement(12October2015).
Note:themaximumPRPSopportunityas%ofTFRisthetheoreticalmaximumtheExecutiveKMPcanreceive.
Vicinity Centres AnnualReport2016|51
For
per
sona
l use
onl
y

2. Company performance and executive remuneration outcomes continued2.2 FY16 Performance Reward Plan Short (PRPS) outcomes continued
Table 2.4: CEO performance against FY16 PRPS targets
Objective and weighting Measure Reason chosen Result as assessed by the Board
Financial (35%) Underlyingearnings per security(EPS)
UnderlyingEPSisakeymeasure of underlying performance and a key driver of Vicinity’s capacity to pay distributions, which is typically a primary focus of investors in theS&P/ASX200A-REITIndex.
Objective exceeded
•DeliveredunderlyingEPSgrowthof9.0%to19.1cents. EPSatthetopendoftheguidancerangeof18.8to 19.1cents(beforeassetacquisitionsanddivestments)
Net property income(NPI)
NPIisakeymeasureofunderlying property operating performance.
Objective exceeded
•OutperformedNPItargets(asadjustedforassetacquisitions anddivestments)
Occupancy rate Ensures security of base income.
Objective exceeded
•Portfoliooccupancyrateof99.4%,astrongimprovement on98.9%at30June2015
Management expense ratio (MER)
Focuses management attention ontheefficientmanagement of operating expenses
Objective exceeded
•AchievedanMERof0.34%,exceedingthetargetof0.36%
Strategic (35%) Organisational culture and strategy
Organisational culture and business strategy are two fundamental drivers of businesssuccess.
Objective met
•Grouppurpose,visionandvaluesdefiningVicinity’saspirationalculture were rolled out and embedded throughout the organisation
• Group strategy, including Vicinity’s strategic drivers and enablers, was developed and is being implemented
Merger synergies realisation
Synergy realisation was one of the key objectives of the merger and drives investor returns, allowing for redeployment of funds tootherstrategicinitiatives.
Objective exceeded
•Locked-inoperationalcostsavingsof$50milliononarunratebasisand$29milliononacashbasis,wellaheadofprogramand targets
•Achievedtargetedfinancingcostsavings
Effective capital management
Balance sheet strength is a critical foundation forfuturesuccess.
Objective exceeded
•Moody’screditratingof‘A2’(stableoutlook)achieved,whileStandardandPoor’saffirmedtheir‘A-’creditratingwitharevisedrating outlook of positive from stable
•$4.5billionmergerrefinancingprogramcompleted,includingrepaymentofthe$1.8billionbridgefacility
•Durationextendedfrom3.2yearsat30June2015to5.3yearsat30June2016,debtsourcesdiversifiedandanewmarketestablishedviathe£350millionEMTNissue
•Gearingat25.9%atthebottomendofthetargetrange of25%–35%
REMUNERATION REPORT continued
52|Vicinity Centres AnnualReport2016
For
per
sona
l use
onl
y

Objective and weighting Measure Reason chosen Result as assessed by the Board
Strategic (35%)continued
Portfolio optimisation and enhancement
Optimising the portfolio underpinsthequalityandsecurityofbaseincome.
Objective exceeded
•Sold$218millionofnon-coreassetsinthefirsthalfofFY16
•Sold(andsettled)fiveassetsfor$926millioninthesecond halfofFY16
•AcquiredTheShopsatEllenbrook,LivingstonMarketplaceandthe DFO Brisbane business, and entered into a joint venture to develop a DFO at Perth Airport
• The Asset Refurbishment Team delivered favourable returns andsignificantlyenhancedcentrepresentationandexperience
Delivery of development pipeline
Shopping centre development isakeydriveroffuturegrowth.
Objective exceeded
•SuccessfullydeliveredCranbournePark,HallsHeadCentral,Colonnades,DFOSouthWharfandWarriewoodSquareprojects.Totalcostof$310millionwithanaverageyieldof9.1%and anInternalRateofReturn(IRR)of14+%
•Chadstoneretailandofficeprojectsprogressingtoprogram and budget
•Developmentpipelineexpandedto$3.7billion(Vicinityshare$1.7billion)
• Commenced the Mandurah Forum development and The Glen development is approved subject to conditions precedent
•SignificantprogressontheRoselandsprojectandacross the shadow pipeline
People and Leadership (15%)
Implementbestpractice reward framework
A reward framework which retains talent and promotes diversity underpins ongoing businessstabilityandsuccess.
Objective partially met
•InitialreviewofPerformanceRewardPaymentframeworkcompleted,withfurtherreviewdeferredtoFY17
• Diversity strategy approved and Diversity Forum established
Strengthen capability and depth of talent
A high performing team is a key driver of business performance.
Objective met
•AnumberofhighqualityappointmentstotheExecutiveCommittee and broader senior leadership team completed
• Development programs and talent mapping implemented
Stakeholder management
Stakeholder relationships are critical for ensuring support for group strategy andinitiatives.
Objective met
• Active engagement with institutional investors
• Strong engagement and working relationship developed between Board and Management
Vicinity Centres AnnualReport2016|53
For
per
sona
l use
onl
y

Objective and weighting Measure Reason chosen Result as assessed by the Board
Operational Excellence (15%)
Technology and innovation
Technology and innovation provide opportunities for enhancing experiences anddrivingefficiencygains.
Objective met
• Business systems review completed and integration on track forcompletioninFY17
• Digital and brand strategies developed and being implemented, including the centre connectivity project
Sustainability Reducing our environmental impact and supporting and enhancing our communities are key to the long-term sustainabilityofourbusiness.
Objective met
• Group sustainability strategy developed, approved by the Board and being implemented
Safety framework and processes
Providing safe environments for our staff, retailers and customersisparamount.
Objective met
•Implementedarangeofinitiativestoimproveorganisationalsafety, including development of the integrated health and safety management system, safety leadership guidelines forVicinityboardsandexecutivesandtheVicinityHealth & Safety Policy
• No material safety issues outstanding
2.3 FY16 Performance Reward Plan Long (PRPL) outcomes
SummaryThePRPLprovidesanannualopportunityfortheExecutiveCommitteeandSeniorLeadersforanequityaward(throughperformancerights)subjecttotheachievementofperformancehurdlesoverthreeyearsandafurther12monthholdinglock.ThePRPLalignsasignificantportionofoverallremunerationtosecurityholdervalueoverthelongerterm.
Pleaserefertosection3.3forfurtherdetailsoftheplan.
OutcomesTheFY14PRPLgrantwastestedat30June2016andtheoverallvestinglevelachievedwas60%.100%wasachievedagainsttheReturnonEquity(ROE)andEPShurdles(growthof120.6%and20.9%respectively).NilvestingwasachievedagainsttherelativeTSRhurdle.
NoPRPLperformancerightsvestedtoanyCurrentExecutiveKMPduringtheyearastheywerenotemployeesoftheGroupatthetimetheseperformancerightsweregrantedinFY13.ThefirstperiodinwhichtheCurrentExecutiveKMPwillbeeligibleforperformancerightstovestwillbetheyearending30June2019(thatis,threeyearsaftertheFY16performancerightsweregranted).DetailsoftheFY16granttocurrentExecutiveKMParecontainedinTable2.5.
REMUNERATION REPORT continued
2. Company performance and executive remuneration outcomes continued2.2 FY16 Performance Reward Plan Short (PRPS) outcomes continued
Table 2.4: Performance against FY16 PRPS targets continued
54|Vicinity Centres AnnualReport2016
For
per
sona
l use
onl
y

FY16 GrantsTheFY16PRPLgrantwasmadetotheExecutiveCommitteeandseniorleadersfrom1July2015.
Table2.5showsthenumberofperformancerightsgrantedtotheCurrentExecutiveKMPundertheFY16PRPL.Thenumberofperformancerightsgrantedwasallocatedusingthe‘facevalue’methodology.
Thefairvalueoftheperformancerightsatgrantdatearealsoincludedinthetablebelow,calculatedinaccordancewithAASB2Share Based Payment.
Asoutlined,theseperformancerightsmayvestinthreeyears’timeprovidedTSRandTRhurdlesaremet.Iftheperformancerightsvestthereisanadditional12-monthholdinglockinwhichtheycannotbetraded.Furtherdetailsonthehurdlerequirementsarecontained insection3.3below.
Table 2.5: FY16 PRPL grants
Number of performance
rights granted1 Grant date
Face value of rights on grant date
$
PRPL face value as a
percentage of TFR at
grant date %
Fair value of rights ongrant date2,3
$
PRPL fair value as a
percentage of TFR at
grant date %
Current Executive KMP Angus McNaughton 457,232 27November2015 1,300,000 86.7 738,430 49.2RichardJamieson 197,841 27November2015 562,500 75.0 319,514 42.6Michael O’Brien 160,031 27November2015 455,000 65.0 258,451 36.9Total 815,104 2,317,500 78.6 1,316,395 44.6
1. ThegrantsmadetoExecutiveKMPrepresentedtheirfullPRPLentitlementfortherelevantfinancialyear.ThesecuritypriceusedinthecalculationisthevolumeweightedaveragepriceofVicinity’ssecurities10tradingdaysimmediatelyfollowingthe2015AnnualGeneralMeeting.
2.Calculatedbasedonafairvalueperperformancerightof: Grant date:27November2015 TR hurdle:$2.19 TSR hurdle:$1.04
Thefairvalueperperformancerightwascalculatedbyindependentconsultantsasatthegrantdateidentifiedabove.ThevaluationoftheTSRperformancerightsincorporatestheprobabilityofachievingmarketconditionswhereasthevaluationofTRperformancerightsdoesnot.ThisresultsinalowerfairvalueforTSRperformancerightsthanforTRperformancerights.FurtherdetailsonassumptionsusedtodeterminethefairvalueoftheperformancerightsareincludedinNote14(a)totheFinancialReport.ThefairvalueisrecognisedasanexpenseintheStatementofComprehensiveIncomeoverthethreeyearvestingperiod.
3. Thevalueofthegranthasbeendeterminedbasedonthefairvalueperinstrumentasatthedateofgrant.TheminimumtotalvalueofthegranttotheExecutiveKMPisnilshouldnoneoftheapplicableperformanceconditionsbemet.
Vicinity Centres AnnualReport2016|55
For
per
sona
l use
onl
y

2.
Com
pany
per
form
ance
and
exe
cuti
ve r
emun
erat
ion
outc
omes
con
tinue
d2
.4 S
tatu
tory
rem
uner
atio
n ta
bles
Table
2.6
below
sho
wsth
ere
mun
erat
ion
rece
ived
byea
chC
urre
ntE
xecu
tive
KMP
durin
gth
ecu
rrent
and
prio
rye
ars,fo
rth
epe
riod
which
the
ywer
ea
KMP.
Tab
le2
.6.1
sho
wsth
esa
me
info
rmat
ion
forFo
rmer
Exe
cutiv
eKM
P.T
hese
tab
lesha
veb
een
prep
ared
ina
ccor
danc
ewith
the
req
uire
men
tso
fthe
Cor
pora
tions
Act
and
the
relev
antAc
coun
ting
Stan
dard
s.T
hefi
gure
s
prov
ided
und
erthe
per
form
ance
right
sco
lum
nsa
rea
ccou
nting
values
and
do
notre
flect
act
ualp
aym
ents
rec
eive
d.
Tabl
e 2
.6: T
otal
Cur
rent
Exe
cuti
ve K
MP
rem
uner
atio
n fo
r FY
16
and
FY1
5
Sho
rt-t
erm
ben
efits
Oth
er lo
ng-t
erm
be
nefi
tsS
hare
-bas
ed p
aym
ents
Post
-em
ploy
men
t
Cur
rent
Exe
cuti
ve K
MP
Peri
od
Bas
e sa
lary $
PRPS
cash
1
$
Non
-m
onet
ary2
$O
ther $
Leav
een
titl
e-m
ents
4
$
Perf
or-
man
ceri
ghts
5
$
PRPS
Def
erre
d6
$
Sup
er-
annu
atio
n co
ntri
buti
ons $
Term
in-
atio
n be
nefi
ts $To
tal $
%
Perf
or-
man
cere
late
d7
Angu
s M
cNau
ghto
n(c
omm
ence
d3A
ugus
t2015)
FY1
61
,34
2,5
19
1,3
14
,84
42
2,5
85
20
4,0
33
3-
24
6,1
43
43
8,2
81
17
,69
9-
3,5
86
,10
45
6%
FY15
--
--
--
--
--
-
Rich
ard
Jam
ieso
n(b
ecam
eKM
Pon
11Jun
e2015)
FY1
67
14
,98
43
93
,75
03
,44
1-
-1
06
,50
53
93
,75
02
5,0
00
-1
,63
7,4
30
55
%FY
15
33,6
44
--
--
--
1,2
50
-34,8
94
-
Mic
hael
O’B
rien
(com
men
ced
12O
ctob
er2
015)
FY1
65
30
,72
32
28
,86
73
,64
9-
-8
6,1
50
22
8,8
67
14
,48
1-
1,0
92
,73
75
0%
FY15
--
--
--
--
--
-
Tota
l – C
urre
nt E
xecu
tive
KM
PFY
16
2,5
88
,22
61
,93
7,4
61
29
,67
52
04
,03
3-
43
8,7
98
1,0
60
,89
85
7,1
80
-6
,31
6,2
71
54
%FY
15
33,6
44
--
--
--
1,2
50
-34,8
94
-
1.Th
eca
shc
ompo
nent
is5
0%o
fthe
FY1
6P
RPS
forEx
ecut
ive
KMP
(75%fo
rth
eCEO
),an
dissch
eduled
to
bep
aid
inS
epte
mbe
r2016(f
ollowing
Boar
dap
prov
alo
fthe
aud
ited
FY16fi
nanc
ials
tate
men
ts).
2.Non
-mon
etar
ybe
nefit
sinclud
em
otor
veh
iclesan
dot
herno
n-ca
shfr
inge
ben
efits
(inc
luding
the
value
ofd
eath
and
tot
alp
erm
anen
tdisa
bilityinsu
ranc
epr
emium
spa
idb
yVicinityo
nbe
half
ofthe
Exe
cutiv
eKM
P).
3.Oth
erb
enefi
tsin
clud
ere
loca
tion
allowan
cesor
reim
bursem
ents
($183,3
33reloc
ation
allowan
ce,$
20,7
00reim
bursem
ents
).
4.Le
ave
entit
lem
ents
refl
ectlong
-ser
vice
leav
eac
crue
dfo
rth
epe
riod.
5.Ina
ccor
danc
ewith
the
req
uire
men
tso
fAus
tralian
Acco
untin
gSt
anda
rds,rem
uner
ation
includ
esa
pro
portion
ofthe
fair
value
ofthe
equ
ityc
ompe
nsat
ion
gran
ted
oro
utst
anding
dur
ing
the
year
(tha
tis,a
por
tion
ofp
erfo
rman
ceright
saw
arde
dun
der
the
PRPL
tha
tre
maine
dun
vest
eda
sat
30Jun
e2016).
The
fair
value
ofthe
equ
ityin
stru
men
tsis
det
erm
ined
asat
the
gra
ntd
ate
and
isp
rogr
essive
lya
lloca
ted
over
the
ves
ting
perio
d.T
hisam
ount
includ
eda
sre
mun
erat
ion
isn
otrelat
edto
or
indica
tive
ofthe
ben
efit(if
any
)tha
tEx
ecut
ive
KMP
may
ultim
atelyre
alise
shou
ldthe
per
form
ance
right
sve
st.T
hefa
irva
lue
ofthe
per
form
ance
right
sat
the
dat
eof
the
irgr
antha
sbe
end
eter
mined
ina
ccor
danc
ewith
AAS
B2,a
pplying
am
onte
ca
rlosim
ulat
ion
valuat
ion
met
hod.
6.Th
eam
ount
pre
sent
edrep
rese
ntsth
eva
lue
ofP
RPS
defe
rred
that
has
bee
nre
cogn
ised
asan
exp
ense
inthe
cur
rent
per
iod
asreq
uire
dby
acc
ount
ing
stan
dard
s.
7.Th
epe
rcen
tage
per
form
ance
relat
edfo
rth
eFY
16fi
nanc
ialy
earisthe
sum
ofP
RPS
cash
and
sha
re-b
ased
pay
men
tsd
ivided
byth
eto
talr
emun
erat
ion,refl
ectin
gth
eac
tualp
erce
ntag
eof
rem
uner
ation
atrisk
forth
eye
ar.
REMUNERATION REPORT continued
56|Vicinity Centres AnnualReport2016
For
per
sona
l use
onl
y

Tabl
e 2
.6.1
: Tot
al F
orm
er E
xecu
tive
KM
P re
mun
erat
ion
for
FY1
6 a
nd F
Y15
Sho
rt-t
erm
ben
efits
Oth
er lo
ng-t
erm
be
nefi
tsS
hare
-bas
ed p
aym
ents
Post
-em
ploy
men
t
Form
er
Exec
utiv
e K
MP
Peri
od
Bas
e sa
lary $
PRPS
cash
1
$
Non
-m
onet
ary1
$O
ther $
Leav
een
titl
e-m
ents
1
$
Perf
or-
man
ceri
ghts
1
$
PRPS
Def
erre
d1
$
Sup
er-
annu
atio
n co
ntri
buti
ons $
Term
inat
ion
bene
fits $
Tota
l $
%
Perf
orm
ance
rela
ted
7
Stev
en S
ewel
l2FY
16
13
5,3
32
-1
,70
97
8,2
85
7-
26
7,3
76
-1
,71
71
,09
2,3
07
61
,57
6,7
26
17
.0FY
15
1,3
63,6
06
1,2
50,0
00
7,7
22
--
880,6
36
877,8
65
18,7
84
-4,3
98,6
13
68.4
Stua
rt M
acra
e3FY
16
24
0,2
06
99
,05
4-
45
0,0
00
83
,74
92
1,6
17
99
,05
45
,45
0-
91
9,1
30
23
.9FY
15
42,4
80
--
-649
--
939
-44,0
68
-
Jona
than
Tim
ms3
FY1
62
23
,64
96
5,7
42
2,0
54
--
10
7,3
65
-5
,44
9-
40
4,2
59
42
.8FY
15
687,9
30
362,5
00
5,1
51
--
354,6
47
252,2
50
18,7
84
-1,6
81,2
62
57.7
Pete
r C
oron
eo4
FY1
6-
--
--
--
--
--
FY15
468,8
87
295,3
77
6,0
44
--
86,9
55
189,5
22
17,7
93
-1,0
64,5
78
53.7
Colleen
Har
ris4
FY1
6-
--
--
--
--
--
FY15
432,3
27
212,6
71
3,6
25
--
185,6
73
188,4
69
17,8
24
-1,0
40,5
89
56.4
Car
olyn
Rey
nold
s4FY
16
--
--
--
--
--
-FY
15
386,6
88
165,4
11
2,4
69
--
29,6
24
66,1
64
17,7
93
-668,1
49
39.1
Tom
Hon
an4
FY1
6-
--
--
--
--
--
FY15
767,6
05
732,5
34
7,1
91
--
249,3
87
307,0
44
17,7
93
485,5
16
2,5
67,0
70
50.7
Kerri
eLa
vey5
FY1
6-
--
--
--
--
--
FY15
270,0
15
10,0
00
15,8
35
--
115,6
71
63,8
14
12,5
23
439,3
78
927,2
36
20.4
Mar
kW
ilson
4FY
16
--
--
--
--
--
-FY
15
703,7
57
448,9
73
12,6
82
-10,4
71
363,2
54
134,8
26
17,7
93
984,2
08
2,6
75,9
64
35.4
Tota
l – F
orm
er
Exec
utiv
e K
MP
FY1
65
99
,18
71
64
,79
63
,76
35
28
,28
53
,74
93
96
,35
89
9,0
54
12
,61
61
,09
2,3
07
2,9
00
,11
52
2.8
FY15
5,1
23,2
95
3,4
77,4
66
60,7
19
-11,1
20
2,2
65,8
47
2,0
79,9
54
140,0
26
1,9
09,1
02
15,0
67,5
29
52.0
1.Re
ferto
cor
resp
onding
foot
note
son
Tab
le2
.6.
2.M
rSt
even
Sew
ellc
ease
dto
be
KMP
on3
Aug
ust2015fo
llowing
the
appo
intm
entof
MrAn
gusM
cNau
ghto
nas
CEO
.MrSe
well’s
em
ploy
men
tfin
ishe
don
2D
ecem
ber2015.
3.M
rSt
uartM
acra
ean
dM
rJo
nath
anT
imm
sce
ased
asKM
Pon
12O
ctob
er2
015fo
llowing
the
KMP
review
discu
ssed
insec
tion
1.3
.MrTim
mssu
bseq
uent
lyc
ease
dem
ploy
men
ton
29A
pril2016.
4.Cea
sed
asK
MP
onthe
dat
eof
the
Mer
ger(1
1Jun
e2015).
MsCar
olyn
Rey
noldsre
mains
an
employ
eeo
fthe
Gro
up.
5.M
sKe
rrie
Lave
yce
ased
em
ploy
men
ton
13F
ebru
ary2015.
6.Com
prises
balan
ceo
fnot
ice
perio
dan
dre
loca
tion.
7.Ac
crue
dan
nualle
ave
entit
lem
entpa
ido
uta
tte
rminat
ion.
8.$450,0
00spe
cialp
aym
entsu
bjec
tto
per
form
ance
and
ret
entio
n.
Vicinity Centres AnnualReport2016|57
For
per
sona
l use
onl
y

3. Executive remuneration – further informationThissectioncontainsfurtherdetailsofthethreecomponentsofExecutiveKMPremunerationbeing:
• Fixed remuneration;
• Performance Reward Plan Short; and
• PerformanceRewardPlanLong.
3.1 Fixed remunerationFixedremunerationcomprisesbasesalary,superannuationcontributionsandanysalarysacrificeamounts(forexample,motorvehicleleases).Vicinityaimstoprovideacompetitiveleveloffixedremunerationthatrecognisesthesize,scopeandcomplexityoftherole; therelevantjobmarket;andtheexperience,capabilityandperformanceoftheincumbent.
3.2 Performance Reward Plan Short (PRPS) Refertosection2.2forasummaryofthePRPSandoutcomesforFY16.
PRPS arrangementsOpportunity FortheCEO,theFY16PRPSopportunityatatargetlevelofperformanceis100%ofTFR.
ForotherExecutiveKMP,thePRPSopportunityatatargetlevelofperformanceisbetween65% and75%ofTFR.
EachExecutiveKMP(otherthantheCEO)hasatheoreticalmaximumoftwotimestargetfor exceptionalindividualandVicinity’sperformance.FortheCEO,themaximumislimitedto1.25times targetopportunity.
Performance period TheapplicablePRPSperformanceperiodisthefullfinancialyear.WhereanExecutiveKMPcommenced orceasedemploymentduringtheyear,theirPRPSwasevaluatedandpaidonapro-ratabasis.
TheCEOwillbeeligibleforthefullfinancialyearasperhisExecutiveServicesAgreement.
Grant date, payment and deferral
PRPS is provided as a cash payment except for Executive KMP and senior executives where it is partially deferredintoequityforaperiodof12to24months(24monthsfortheCEO,18monthsforExecutiveKMPandotherExecutiveCommitteemembers).Executivesreceivedividendsonthedeferredequityduringtheholdinglockperiod.
OutcomesarecalculatedfollowingtheBoard’sreviewofVicinity’sFY16auditedfinancialresultsandwill bepaidinSeptember2016.
Performance targets and measurement
Section2.2providesadetailedsummaryoftheperformanceobjectivesandmeasuresandthesubsequentresultsfortheCEOandExecutiveKMPforFY16respectively.
PerformanceobjectivesforFY16werefinalisedbytheBoardinthecaseoftheCEO,andbytheCEOandBoardinthecaseofotherExecutiveKMP.TheRemunerationandHumanResourcesCommittee(theCommittee),withinputfromtheChairmanoftheBoard,assessestheCEO’sperformanceagainsthisobjectivesandmakestherecommendationtotheBoardforfinaldetermination.
The CEO assesses the performance of all other Executive KMP relative to their individual objectives andmakesrecommendationstotheCommitteeforconsideration.Inturn,theCommitteemakesrecommendationstotheBoardforfinaldetermination.
REMUNERATION REPORT continued
58|Vicinity Centres AnnualReport2016
For
per
sona
l use
onl
y

3.3 Performance Reward Plan Long (PRPL) Refertosection2.3forasummaryofthePRPLandawardsduringFY16.
PRPL arrangementsType of equity awarded Performance rights which provide participants with the right to receive one Vicinity stapled security at a future
time for nil consideration, subject to the achievement of agreed performance hurdles at the end of the performanceperiod(assetoutbelow).
Untiltheperformancerightsvest,anExecutiveKMPhasnoentitlementtoreceivedividendsordistributionsfrom,nolegalorbeneficialinterestin,andnovotingrightsassociatedwith,theunderlyingstapledsecurities.
Performance Period Threeyears.
Thereisanadditionalholdinglockperiodof12monthsafterthethree-yearperformanceperiodends.Duringthis period, the vested performance rights cannot be traded but the holder is entitled to receive dividends, distributionsandvote.
Performance hurdles Allocationsofperformancerightsaretestedagainsttwoperformancehurdles:
•50%aresubjecttotheachievementofarelativeTSR1; and
•50%aretiedtotheachievementofTR2.
Eachhurdlewillbemeasuredindependentlyattheendoftheperformanceperiod.
Opportunity AnExecutiveKMPmayreceiveaPRPLawardequalinvalueto65%–87%ofTFR.Thenumberofrightsallocatedwasdeterminedbasedonthe10dayVolumeWeightedAveragePrice(VWAP)ofVicinitysecuritiesimmediatelyfollowingthe2015AnnualGeneralMeeting.
Vesting scale Thefollowingvestingscalesapply:
Total securityholder return (TSR) Total return (TR)Percentile ranking Percentage vesting Target total return Percentage vesting
<51st 0% 9.0% 0%Between51stand75th 51%to100% Between9.0%to9.5% Between50%and100%
≥75th 100% ≥9.5% 100%
Followingtesting,anyrightsthatdonotvest,lapse.
1. Broadly,TSRmeasuresthereturntoasecurityholderovertherelevantperformanceperiodintermsofchangesinmarketvalueofthesecuritiesplusthevalueofanydividendsanddistributionspaidonthesecurities.TheBoarddecidedthatanappropriatecomparatorgroupfortherelativeTSRperformancehurdlewastheS&P/ASX200A-REITIndexexcludingWestfieldCorporation.Whereappropriate,theBoardhasdiscretiontoadjustthecomparatorgrouptotakeintoaccountevents,includingbutnotlimitedtotakeovers,mergersorde-mergers,thatmightoccurwithrespecttotheentitiesinthecomparatorgroup.
2. TRiscalculatedasthechangeinVicinity’sNetTangibleAssets(NTA)valueduringtheperformanceperiodplustotaldistributionsmadedividedbytheNTAvalueatthebeginningoftheperformanceperiod.
3.4 PRPS and PRPL – Cessation of employment, clawback or change of controlTheBoardretainsdiscretiontodeterminethetreatmentofthePRPSandPRPLawardsonthecessationofemployment,howevergenerally:
•Ifterminatedforcause,anyexistingPRPLandPRPSentitlementswillbeforfeited.
•Intheeventofcessationofemploymentforsuchreasonsasredundancy,death,totalandpermanentdisablementorretirement:
–apro-rataamountofunvestedperformancerightswillremainonfoot,withthebalanceforfeited.Performancerightsmaythenvest at the end of the performance period subject to meeting the performance measures under the associated plan and will be subject totheholdinglock.
–PRPSfortheyearwillbepro-ratedovertheemploymentperiodandpaidfullyincashatthesametimeasallothers(noamounts aredeferredintoequity).
The Board also has the right to reduce future award payments or adjusted unvested amounts to ‘clawback’ from participants if there hasbeenseriousmisconductoramaterialmisstatementintheGroupfinancialresults.
Intheeventofachangeincontrol,theBoardhasabsolutediscretiontodeterminethetreatmentforPRPSandPRPLentitlements.
Vicinity Centres AnnualReport2016|59
For
per
sona
l use
onl
y

3. Executive remuneration – further information continued3.5 Total PRPL holdingsTotalperformancerightsheldbyKMPincludingtheFY16Grantdetailedaboveareasfollows:
Opening Performance
RightsGranted as
remunerationForfeited/
lapsed Vested ClosingCurrent KMPAngus McNaughton - 457,232 - - 457,232RichardJamieson - 197,841 - - 197,841Michael O’Brien - 160,031 - - 160,031Total - 815,104 - - 815,104
Former Executive KMP4
Steven Sewell1,2 1,963,069 - 423,902 796,855 742,312Stuart Macrae - 142,295 - - 142,295JonathanTimms1,3 772,284 197,841 231,886 383,672 354,567Total 2,735,353 340,136 655,788 1,180,527 1,239,174
1.Afterperformancetesting,98.5%oftheFY13PRPLvestedand1.5%lapsed.
2.AsMrStevenSewellceasedemploymenton2December2015,heforfeited19%ofhisFY14and53%ofhisFY15PRPLperformancerights.
3.AsMrJonathanTimmsceasedemploymenton29April2016,heforfeited6%ofhisFY14,39%ofhisFY15and72%ofhisFY16PRPLperformancerights.
4.TheFormerExecutiveKMPnotedinthistablearethosewhoheldaKMPpositionduringFY16.
3.6 Service agreementsRemunerationandothertermsofemploymentforExecutiveKMPareformalisedinExecutiveServicesAgreements(ESAs).Theterms andconditionsofemploymentoftheExecutiveKMPreflectmarketconditionsatthetimeofenteringintotheircontract.
KeyfeaturesoftheExecutiveKMPESAsincludethefollowing:
• Eligibility to participate in short and long-term incentive plans
• Ongoing employment until terminated by either the Executive KMP or Vicinity, and
• Vicinitymaymakepaymentsinlieuofallorpartoftheapplicablenoticeperiod.
Noticeperiodprovisionsaredetailedbelow.
Termination by Vicinity
For cause OtherTermination by Executive KMP Termination payment1
Angus McNaughton Immediately 12months 6months 12monthsxTFRRichardJamieson Immediately 6months 6months 6monthsxTFRMichael O’Brien Immediately 6months 6months 6monthsxTFR
1. Paid,subjecttolaw,ifVicinityterminatedtheExecutiveKMP’semploymentagreementonnoticeandwithoutcause,andmakespaymentinlieuofnotice.Terminationpaymentsaregenerallynotpaidonresignationorterminationwithcause,althoughtheBoardmaydetermineexceptionstothis.Noterminationpaymentwillexceed the limit under the Corporations Act 2001.
REMUNERATION REPORT continued
60|Vicinity Centres AnnualReport2016
For
per
sona
l use
onl
y

4. Non-executive Director remuneration4.1 Remuneration philosophyNon-executive Director fee levels are set with regard to time commitment and workload, the risk and responsibility attached to the role and externalmarketbenchmarking.Topromoteindependenceandimpartiality,noelementofNon-executiveDirectorremunerationis‘atrisk’,thatis,noelementisbasedontheperformanceofVicinity.
Thecurrentmaximumfeepoolof$2.25millionwasendorsedbyVicinitysecurityholdersinNovember2011.
Board and committee feesFY16Boardandcommitteefeesareoutlinedinthetablebelow:
Table 4.1: FY16 Board and committee fees
Board/Committee RoleFY16 fees1
$
BoardChairman 450,000Non-executive Director 160,000
Audit CommitteeChairman 40,000Member 20,000
Risk and Compliance CommitteeChairman 40,000Member 20,000
Nominations CommitteeChairman No additional feeMember No additional fee
Remuneration and HR CommitteeChairman 40,000Member 20,000
1.Feesareinclusiveofsuperannuation.
TheChairmanoftheBoardreceivesnofurtherremunerationforcommitteemembership,althoughhemayattendcommitteemeetings.
Non-executive Directors are entitled to be reimbursed for all reasonable business-related expenses, including travel on company business, thatmaybeincurredinthedischargeoftheirduties.
TheCommitteeengagedKPMGtoundertakeabenchmarkinganalysisinFebruary2016ofnon-executivedirectorfeesintheexternalmarket.ThisresultedintheFY17feesforBoardandcommitteemembershipremainingunchangedfromFY16.
Vicinity Centres AnnualReport2016|61
For
per
sona
l use
onl
y
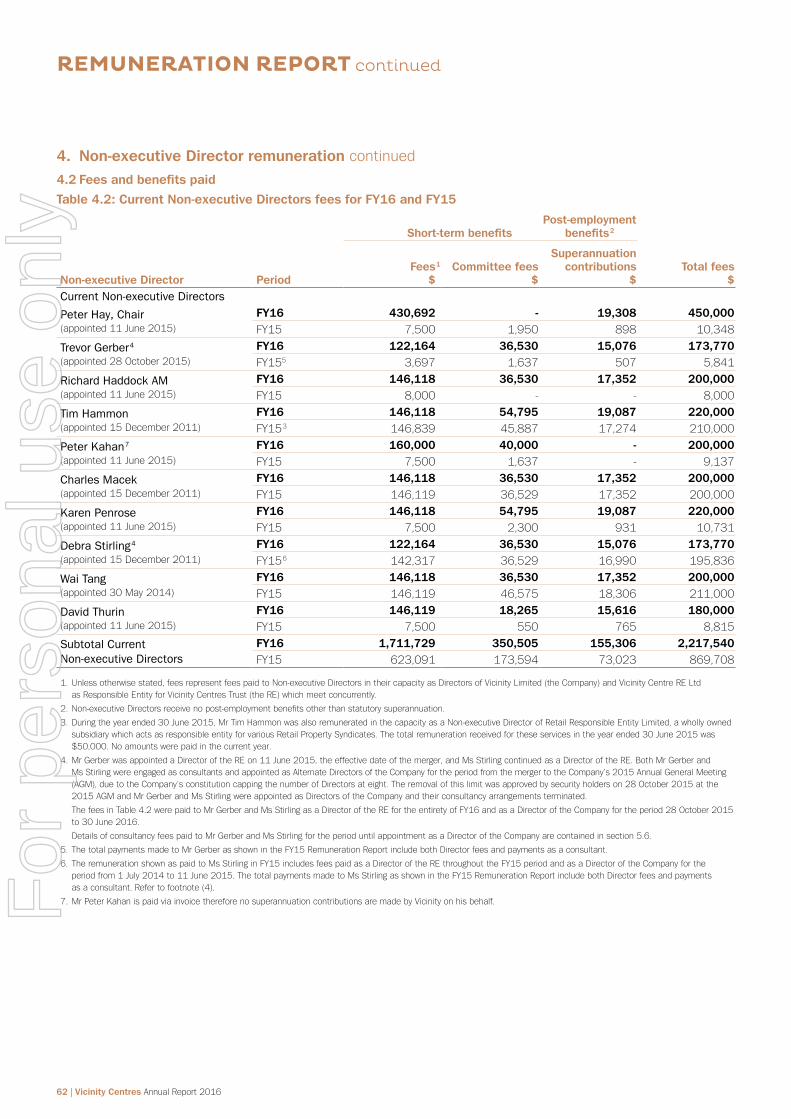
4. Non-executive Director remuneration continued4.2 Fees and benefits paid
Table 4.2: Current Non-executive Directors fees for FY16 and FY15
Short-term benefitsPost-employment
benefits2
Non-executive Director PeriodFees1
$Committee fees
$
Superannuation contributions
$Total fees
$Current Non-executive Directors
Peter Hay, Chair(appointed11June2015)
FY16 430,692 - 19,308 450,000FY15 7,500 1,950 898 10,348
Trevor Gerber4
(appointed28October2015)FY16 122,164 36,530 15,076 173,770FY155 3,697 1,637 507 5,841
Richard Haddock AM(appointed11June2015)
FY16 146,118 36,530 17,352 200,000FY15 8,000 - - 8,000
Tim Hammon(appointed15December2011)
FY16 146,118 54,795 19,087 220,000FY153 146,839 45,887 17,274 210,000
Peter Kahan7
(appointed11June2015)FY16 160,000 40,000 - 200,000FY15 7,500 1,637 - 9,137
Charles Macek(appointed15December2011)
FY16 146,118 36,530 17,352 200,000FY15 146,119 36,529 17,352 200,000
Karen Penrose(appointed11June2015)
FY16 146,118 54,795 19,087 220,000FY15 7,500 2,300 931 10,731
Debra Stirling4
(appointed15December2011)FY16 122,164 36,530 15,076 173,770FY156 142,317 36,529 16,990 195,836
Wai Tang(appointed30May2014)
FY16 146,118 36,530 17,352 200,000FY15 146,119 46,575 18,306 211,000
David Thurin(appointed11June2015)
FY16 146,119 18,265 15,616 180,000FY15 7,500 550 765 8,815
Subtotal Current Non-executive Directors
FY16 1,711,729 350,505 155,306 2,217,540FY15 623,091 173,594 73,023 869,708
1. Unlessotherwisestated,feesrepresentfeespaidtoNon-executiveDirectorsintheircapacityasDirectorsofVicinityLimited(theCompany)andVicinityCentreRELtd asResponsibleEntityforVicinityCentresTrust(theRE)whichmeetconcurrently.
2.Non-executiveDirectorsreceivenopost-employmentbenefitsotherthanstatutorysuperannuation.
3. Duringtheyearended30June2015,MrTimHammonwasalsoremuneratedinthecapacityasaNon-executiveDirectorofRetailResponsibleEntityLimited,awhollyownedsubsidiarywhichactsasresponsibleentityforvariousRetailPropertySyndicates.Thetotalremunerationreceivedfortheseservicesintheyearended30June2015was$50,000.Noamountswerepaidinthecurrentyear.
4. MrGerberwasappointedaDirectoroftheREon11June2015,theeffectivedateofthemerger,andMsStirlingcontinuedasaDirectoroftheRE.BothMrGerberand MsStirlingwereengagedasconsultantsandappointedasAlternateDirectorsoftheCompanyfortheperiodfromthemergertotheCompany’s2015AnnualGeneralMeeting(AGM),duetotheCompany’sconstitutioncappingthenumberofDirectorsateight.Theremovalofthislimitwasapprovedbysecurityholderson28October2015atthe2015AGMandMrGerberandMsStirlingwereappointedasDirectorsoftheCompanyandtheirconsultancyarrangementsterminated.
ThefeesinTable4.2werepaidtoMrGerberandMsStirlingasaDirectoroftheREfortheentiretyofFY16andasaDirectoroftheCompanyfortheperiod28October2015 to30June2016.
DetailsofconsultancyfeespaidtoMrGerberandMsStirlingfortheperioduntilappointmentasaDirectoroftheCompanyarecontainedinsection5.6.
5.ThetotalpaymentsmadetoMrGerberasshownintheFY15RemunerationReportincludebothDirectorfeesandpaymentsasaconsultant.
6. TheremunerationshownaspaidtoMsStirlinginFY15includesfeespaidasaDirectoroftheREthroughouttheFY15periodandasaDirectoroftheCompanyforthe periodfrom1July2014to11June2015.ThetotalpaymentsmadetoMsStirlingasshownintheFY15RemunerationReportincludebothDirectorfeesandpayments asaconsultant.Refertofootnote(4).
7.MrPeterKahanispaidviainvoicethereforenosuperannuationcontributionsaremadebyVicinityonhisbehalf.
REMUNERATION REPORT continued
62|Vicinity Centres AnnualReport2016
For
per
sona
l use
onl
y

Table 4.2.1: Former Non-executive Directors fees for FY16 and FY15
Short-term benefitsPost-employment
benefits2
Non-executive Director PeriodFees1
$Committee fees
$
Superannuation contributions
$Total fees
$Former Non-executive Directors
Bob Edgar(ceasedasDirectoron11June2015)
FY16 - - - -FY15 410,208 - 18,637 428,845
Clive Appleton(ceasedasDirectoron11June2015)
FY16 - - - -FY15 139,000 34,750 16,507 190,257
Fraser MacKenzie(ceasedasDirectoron11June2015)
FY16 - - - -FY15 139,000 62,147 19,110 220,257
Subtotal Former Non-executive Directors
FY16 - - - -FY15 688,208 96,897 54,254 839,359
TotalFY16 1,720,673 340,763 155,230 2,216,666FY15 1,303,904 267,217 126,264 1,697,385
1. FeesrepresentfeespaidtoNon-executiveDirectorsintheircapacityasDirectorsofVicinityLimited(theCompany)andVicinityCentreRELtdasResponsibleEntityforVicinityCentresTrust(theRE).
2.Non-executiveDirectorsreceivenopost-employmentbenefitsotherthanstatutorysuperannuation.
5. Other remuneration information5.1 Remuneration governanceThe Board of Directors has responsibility to ensure good governance is in place in relation to all human resource matters including remuneration.ToensurethattheBoardactsindependentlyofmanagementandisfullyinformedwhenmakingremunerationdecisions, theBoardhasestablishedthefollowingprotocols:
• TheBoardhasestablishedaRemunerationandHRCommittee(theCommittee)comprisedofNon-executiveDirectors.TheCommittee is responsible for reviewing and making recommendations on remuneration policies for Vicinity, including policies governing the remuneration ofExecutiveKMPandotherseniorexecutives.FurtherinformationregardingtherespectiverolesandresponsibilitiesoftheBoardand theCommitteearecontainedintheirrespectivecharters,availableatvicinity.com.au.
• WhenconsideringtherecommendationsoftheCommittee,theBoardappliesapolicyprohibitingtheCEOandotherexecutivesfrombeingpresentandparticipatingindiscussionsimpactingtheirownremuneration.
• The Committee can seek advice from both management and external advisors in developing its remuneration recommendations for theBoard.
5.2 External advisors and consultantsTo assist in performing its duties, and making recommendations to the Board, the Committee directly engages external advisors to provide input to the process of reviewing Executive KMP and Non-executive Director remuneration, and to provide advice on various aspectsoftheremunerationframework.
DuringFY16,KPMGand3degreesconsultingwereengagedbytheCommitteeandmanagementtoprovideanumberofservices.
TheworkundertakenbyKPMGand3degreesconsultinginFY16didnotconstitutearemunerationrecommendationforthepurposes of the Corporations Act.
Vicinity Centres AnnualReport2016|63
For
per
sona
l use
onl
y

5. Other remuneration information continued5.3 Share trading restrictionsVicinity’s Securities Trading Policy prohibits senior executives from hedging or otherwise limiting their exposure to risk in relation to unvested Vicinitysecuritiesissuedoracquiredunderanyapplicableequityarrangements.
5.4 Minimum executive securityholdingsAmandatorysecurityownershippolicyisinplaceforexecutives.ThisrequiresExecutiveKMPandotherseniorexecutivestoacquire andretainaminimumholdingofsecuritiesequalto60%ofTFR(100%ofTFRforCEO)withinfiveyears.DeferredPRPSandPRPLcounttowardtheholdinglevel.
5.5 Minimum Non-executive Director securityholdingsDuringFY16,aminimumsecurityholdingpolicyforNon-executiveDirectorswasintroduced.ThispolicyencouragesDirectorstoacquireaholdingofsecuritiesequalinvaluetooneyearofbaseBoardfees(onanaftertaxbasis)withinfiveyearsfromtheintroductionofthepolicy.
5.6 Other transactions with KMPUndertheconsultancyarrangementsdescribedinfootnote4toTable4.2,theannualfeepayabletoeachofMrGerberandMsStirling(eachintheirpersonalcapacityandasanindependentcontractor)was$80,000fortheprovisionofconsultancyservicessuchasattendingBoardandcommitteemeetings,andundertakinganalysis,strategicplanningandotherrelatedservices(Services).
TheconsultancyarrangementsimposedobligationsoneachofMrGerberandMsStirlinginrelationtothetimerequiredtodischargetheServices,themanagementofconflictsandobligationsofconfidentiality,requiredthattheybeprovidedwithprofessionalindemnityinsurancecoverage, and provided for automatic termination on appointment as a Director of the Company or on resignation or termination as a DirectoroftheRE.
Theconsultancyfeespaidunderthesearrangementswere:
FY161
$FY152
$Debra Stirling 26,230 4,164Trevor Gerber 26,230 4,164Total 52,460 8,328
1. Fortheperiodfrom1July2015toappointmentasadirectoron28October2015.Refertofootnote4ontable4.2.
2.Fortheperiodfrom12June2015to30June2015.Refertofootnote4ontable4.2.
REMUNERATION REPORT continued
64|Vicinity Centres AnnualReport2016
For
per
sona
l use
onl
y

5.7 Executive KMP and Non-executive Director securityholdingsThetablebelowshowsthesecuritiesheld(directlyorindirectly)byNon-executiveDirectorsandExecutiveKMPasat30June2016. Therewerenochangesinholdingsbetween30June2016andthedateofthisreport.
Opening Securities1
Granted as remuneration
Additions during the year
Other Movements Closing
Non-executive DirectorsPeterHay 37,291 - 35,000 - 72,291Trevor Gerber 20,563 - 29,437 - 50,000RichardHaddockAM 45,402 - 80,000 - 125,402TimHammon 10,000 - 15,000 - 25,000Peter Kahan - - - - -Charles Macek 50,000 - - - 50,000Karen Penrose 20,563 - - - 20,563Debra Stirling 10,000 - - - 10,000WaiTang 980 - 2,000 - 2,980David Thurin 13,895,373 - - - 13,895,373Total 14,090,172 - 161,437 - 14,251,609
Executive KMPAngus McNaughton 37,729 - 144,783 - 182,512Steven Sewell 1,284,367 796,855 - (2,081,222)2 -RichardJamieson - - - - -Michael O’Brien - - - - -Stuart Macrae 61,005 - - (61,005)2 -JonathanTimms 99,052 - - (99,052)2 -Total 1,482,153 796,855 144,783 (2,241,279) 182,512
1.Reflectssecuritiesbalanceasat1July2015orasatthedateofappointmentasaDirectororKMP.
2. ClosingsecuritybalanceatdatepersonceasedtobeaDirectororExecutiveKMP.
There were no other related party transactions or balances with Directors and Executive KMP or their controlled entities, in relation tosecuritiesheld.
End of the Remuneration Report.
SignedinMelbourneon17August2016inaccordancewitharesolutionofDirectors.
Peter Hay Chairman
Vicinity Centres AnnualReport2016|65
For
per
sona
l use
onl
y

AUDITOR’S INDEPENDENCE DECLARATION
A member firm of Ernst & Young Global LimitedLiability limited by a scheme approved under Professional Standards Legislation
Ernst & Young8 Exhibition Street Melbourne VIC 3000 AustraliaGPO Box 67 Melbourne VIC 3001
Tel: +61 3 9288 8000Fax: +61 3 8650 7777ey.com/au
Auditor’s Independence Declaration to the Directors of Vicinity Limited
As lead auditor for the audit of Vicinity Centres for the financial year ended 30 June 2016, I declare to the best of my knowledge and belief, there have been:
a) no contraventions of the auditor independence requirements of the Corporations Act 2001 in relation to the audit; and
b) no contraventions of any applicable code of professional conduct in relation to the audit.
This declaration is in respect of Vicinity Limited and the entities it controlled during the financial year.
Ernst & Young
David ShewringPartner17 August 2016
66|Vicinity Centres AnnualReport2016
For
per
sona
l use
onl
y
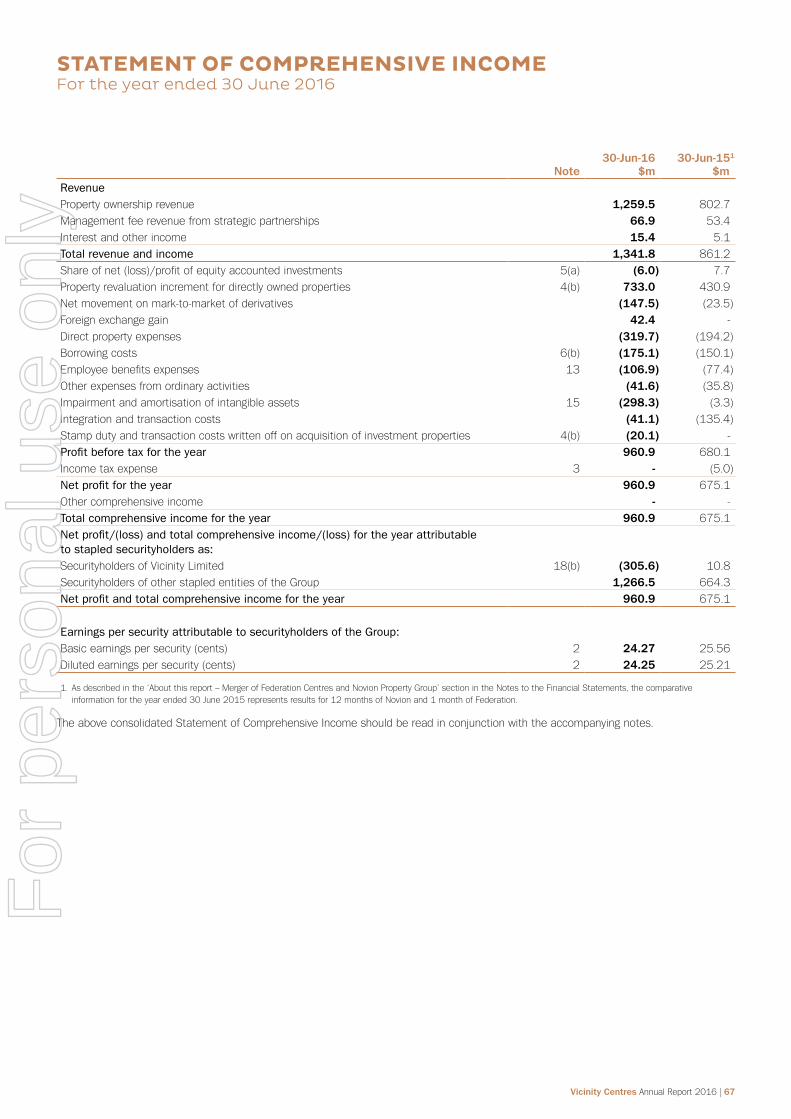
Note30-Jun-16
$m30-Jun-151
$mRevenueProperty ownership revenue 1,259.5 802.7Management fee revenue from strategic partnerships 66.9 53.4Interestandotherincome 15.4 5.1Total revenue and income 1,341.8 861.2Shareofnet(loss)/profitofequityaccountedinvestments 5(a) (6.0) 7.7Property revaluation increment for directly owned properties 4(b) 733.0 430.9Net movement on mark-to-market of derivatives (147.5) (23.5)Foreign exchange gain 42.4 -Direct property expenses (319.7) (194.2)Borrowing costs 6(b) (175.1) (150.1)Employeebenefitsexpenses 13 (106.9) (77.4)Other expenses from ordinary activities (41.6) (35.8)Impairmentandamortisationofintangibleassets 15 (298.3) (3.3)Integrationandtransactioncosts (41.1) (135.4)Stampdutyandtransactioncostswrittenoffonacquisitionofinvestmentproperties 4(b) (20.1) -Profit before tax for the year 960.9 680.1Incometaxexpense 3 - (5.0)Net profit for the year 960.9 675.1Other comprehensive income - -Total comprehensive income for the year 960.9 675.1Net profit/(loss) and total comprehensive income/(loss) for the year attributable to stapled securityholders as:SecurityholdersofVicinityLimited 18(b) (305.6) 10.8Securityholders of other stapled entities of the Group 1,266.5 664.3Net profit and total comprehensive income for the year 960.9 675.1
Earnings per security attributable to securityholders of the Group:Basicearningspersecurity(cents) 2 24.27 25.56Dilutedearningspersecurity(cents) 2 24.25 25.21
1. Asdescribedinthe‘Aboutthisreport–MergerofFederationCentresandNovionPropertyGroup’sectionintheNotestotheFinancialStatements,thecomparativeinformationfortheyearended30June2015representsresultsfor12monthsofNovionand1monthofFederation.
TheaboveconsolidatedStatementofComprehensiveIncomeshouldbereadinconjunctionwiththeaccompanyingnotes.
STATEMENT OF COMPREHENSIVE INCOMEFor the year ended 30 June 2016
Vicinity Centres AnnualReport2016|67
For
per
sona
l use
onl
y

BALANCE SHEETAs at 30 June 2016
Note30-Jun-16
$m30-Jun-15
$mCurrent assetsCashandcashequivalents 52.8 107.4Receivables and other assets 9 105.5 123.5Investmentpropertiesheldforsale 4(a) 232.1 -Financialassetscarriedatfairvaluethroughprofitorloss 3.6 6.3Derivativefinancialinstruments 6(d) 15.6 -Investmentsaccountedforusingtheequitymethod - 0.5Total current assets 409.6 237.7Non-current assetsInvestmentproperties 4(a) 14,426.6 14,109.7Investmentsaccountedforusingtheequitymethod 5 80.5 93.4Intangibleassets 15 602.4 891.4Plantandequipment 13.8 14.3Derivativefinancialinstruments 6(d) 112.2 87.1Deferred tax assets 3(c) 84.3 84.3Receivables and other assets 9 120.1 120.0Total non-current assets 15,439.9 15,400.2Total assets 15,849.5 15,637.9Current liabilitiesInterestbearingliabilities 6 193.1 1,357.4Distribution payable 352.3 336.5Payablesandotherfinancialliabilities 10 237.8 199.5Provisions 11 85.8 157.9Derivativefinancialinstruments 6(d) - 0.3Total current liabilities 869.0 2,051.6Non-current liabilitiesInterestbearingliabilities 6 3,749.1 2,945.7Otherfinancialliabilities 10 200.4 38.9Provisions 11 2.3 5.4Derivativefinancialinstruments 6(d) 179.7 0.7Total non-current liabilities 4,131.5 2,990.7Total liabilities 5,000.5 5,042.3Net assets 10,849.0 10,595.6EquityContributedequity 8 8,493.2 8,493.2Share-based payment reserve 4.7 11.5Retainedprofits 2,351.1 2,090.9Total equity 10,849.0 10,595.6
TheaboveconsolidatedBalanceSheetshouldbereadinconjunctionwiththeaccompanyingnotes.
68|Vicinity Centres AnnualReport2016
For
per
sona
l use
onl
y

Att
ribu
tabl
e to
sec
urit
yhol
ders
of
Vici
nity
Lim
ited
Att
ribu
tabl
e to
sec
urit
yhol
ders
of
othe
r st
aple
d en
titi
es o
f th
e G
roup
Con
trib
uted
eq
uity
$
mR
eser
ves
$m
Ret
aine
d pr
ofits
/ (A
ccum
ulat
ed
loss
es)
$m
Tota
l $
m
Con
trib
uted
eq
uity
$
mR
eser
ves
$m
Ret
aine
d pr
ofits
$
mTo
tal
$m
Tota
l equ
ity
$m
As a
t 1
Jul
y 2
01
41
22
4.1
-(2
.3)
22
1.8
3,9
14
.9-
1,9
65
.05
,87
9.9
6,1
01
.7Net
pro
fitfo
rth
eye
ar-
-10.8
10.8
--
664.3
664.3
675.1
Tota
l com
preh
ensi
ve in
com
e fo
r the
yea
r-
-1
0.8
10
.8-
-6
64
.36
64
.36
75
.1Tr
ansa
ctio
ns w
ith s
ecur
ityho
lder
s
in t
heir
capa
city
as
secu
rityh
olde
rs:
Issu
eof
sec
urities
,net
oft
rans
actio
nco
sts
4.4
--
4.4
117.4
--
117.4
121.8
Con
side
ratio
n is
sued
on
Mer
ger
252.8
11.1
-263.9
3,9
82.4
--
3,9
82.4
4,2
46.3
Equityraising
cos
tso
nM
erge
r(0
.2)
--
(0.2
)(2
.6)
--
(2.6
)(2
.8)
Mov
emen
t in
sha
re b
ased
pay
men
t re
serv
e-
0.4
-0.4
--
--
0.4
Dis
trib
utio
ns p
aid
and
paya
ble
--
--
--
(546.9
)(5
46.9
)(5
46.9
)To
tal e
quity
as
at 3
0 J
une
20
15
48
1.1
11
.58
.55
01
.18
,01
2.1
-2
,08
2.4
10
,09
4.5
10
,59
5.6
Net
(los
s)/p
rofit
forth
eye
ar-
-(3
05.6
)(3
05.6
)-
-1,2
66.5
1,2
66.5
960.9
Tota
l com
preh
ensi
ve (
loss
)/in
com
e
for
the
year
--
(30
5.6
)(3
05
.6)
--
1,2
66
.51
,26
6.5
96
0.9
Tran
sact
ions
with
sec
urity
hold
ers
in
the
ir ca
paci
ty a
s se
curit
yhol
ders
:M
ovem
ent
in s
hare
bas
ed p
aym
ent
rese
rve
-(6
.8)
-(6
.8)
--
--
(6.8
)D
istr
ibut
ions
pai
d an
d pa
yabl
e-
--
--
-(7
00.7
)(7
00.7
)(7
00.7
)To
tal e
quity
as
at 3
0 J
une
20
16
48
1.1
4.7
(29
7.1
)1
88
.78
,01
2.1
-2
,64
8.2
10
,66
0.3
10
,84
9.0
1.As
des
cribed
inthe
‘Abo
utthisre
port–
Mer
gerof
Fed
erat
ion
Cen
tres
and
Nov
ion
Prop
ertyG
roup
’sec
tion
inthe
Not
esto
the
Fina
ncialS
tate
men
ts,t
hec
ompa
rativ
einfo
rmat
ion
forth
eye
are
nded
30Jun
e2015rep
rese
ntsre
sults
for
12m
onth
sof
Nov
ion
and
1m
onth
ofF
eder
ation.
The
abov
eSt
atem
entof
Cha
nges
inE
quity
sho
uld
berea
dinc
onjunc
tion
with
the
acc
ompa
nying
note
s.
STATEMENT OF CHANGES IN EQUITYFor the year ended 30 June 2016
Vicinity Centres AnnualReport2016|69
For
per
sona
l use
onl
y

Note30-Jun-16
$m30-Jun-151
$mCash flows from operating activitiesReceipts in the course of operations 1,508.7 987.2Payments in the course of operations (618.3) (400.6)Distributions and dividends received from associates, joint venture partnerships and managed investments 12.6 3.0Interestandotherrevenuereceived 9.5 3.1Interestpaid (170.7) (174.7)Net cash inflows from operating activities 16 741.8 418.0
Cash flows from investing activitiesPayments for capital expenditure on investment properties (422.2) (198.8)Paymentsforacquisitionofinvestmentproperties (358.0) -Proceeds from disposal of investment properties 1,146.7 267.0Paymentsforplantandequipmentandotherinvestments (3.4) (7.7)Proceeds from other assets 3.5 7.7Payments for intangibles (9.3) -Proceedsfromcapitaldistributionfromequityaccountedinvestments - 38.0Net cash received in business combination - 60.1Integrationandtransactioncostspaid (40.0) (56.1)Stamp duty paid (83.4) -Net cash inflows from investing activities 233.9 110.2
Cash flows from financing activitiesProceeds from borrowings 4,519.2 4,579.5Repayments of borrowings (4,837.8) (4,690.0)Distributions paid to external securityholders (684.9) (294.6)Termination payments for derivatives - (95.6)Debt establishment costs paid (14.6) (8.4)Acquisitionofsecuritiesonmarketforsettlementofsharebasedpaymentplans (12.2) -Stapled security issue costs paid - (2.8)Net cash outflows from financing activities (1,030.3) (511.9)Net (decrease)/increase in cash and cash equivalents held (54.6) 16.3Cash and cash equivalents at the beginning of the year 107.4 91.1Cash and cash equivalents at the end of the year 52.8 107.4
1. Asdescribedinthe‘Aboutthisreport–MergerofFederationCentresandNovionPropertyGroup’sectionintheNotestotheFinancialStatements,thecomparativeinformationfortheyearended30June2015represents12monthsforNovionand1monthforFederation.
TheaboveCashFlowStatementshouldbereadinconjunctionwiththeaccompanyingnotes.
CASH FLOW STATEMENTFor the year ended 30 June 2016
70|Vicinity Centres AnnualReport2016
For
per
sona
l use
onl
y

STREAMLINED FINANCIAL STATEMENTS
Thisyear,theGroup’sfinancialstatementshavebeenpresentedinamorestreamlinedmannerbychangingtheformatandlayout tosimplifytheinformationdisclosedandmakeitmorerelevanttousers.Similarnoteshavebeengroupedintosectionswithrelevantaccountingpoliciesandjudgementandestimatedisclosuresincorporatedwithinthenotestowhichtheyrelate.
NotesOperations
1. Segment reporting
2. Earnings per security
3. Taxes
4. Investment properties
5. Equity accounted investments
Capital structure and financial risk management
6. Interest bearing liabilities and derivatives
7. Capital and financial risk management
8. Contributed equity
Working capital
9. Receivables and other assets
10. Payables and other financial liabilities
11. Provisions
Remuneration
12. Key management personnel
13. Employees
14. Share based payments
Other disclosures
15. Intangible assets
16. Notes to the cash flow statement
17. Auditor’s remuneration
18. Parent entity financial information
19. Related parties
20. Commitments and contingencies
21. Other Group accounting matters
22. Events occurring after the reporting date
Vicinity Centres AnnualReport2016|71
For
per
sona
l use
onl
y

NOTES TO THE FINANCIAL STATEMENTS
ABOUT THIS REPORT
VicinityCentres(theGroup)islistedontheAustralianSecuritiesExchange(ASX)underthecodeVCX.ItcomprisesVicinityLimited (theCompany)andVicinityCentresTrust(theTrust).TheStaplingDeedenteredintobytheCompanyandtheTrustensuresthatshares intheCompanyandunitsintheTrustare‘stapled’togetherandtradedcollectively.TheCompanyandTrustarefor-profitentitiesthat aredomiciledandoperatewhollyinAustralia.
Basis of preparationThisgeneralpurposefinancialreport:
• HasbeenpreparedinaccordancewiththeConstitutionsofentitieswithintheGroup,theCorporations Act 2001(Cth)andAustralianAccountingStandards(AASB)issuedbytheAustralianAccountingStandardsBoard.CompliancewithAASBsensurescompliancewithInternationalFinancialReportingStandards(IFRS)asissuedbytheInternationalAccountingStandardsBoard(IASB);
• IspresentedinAustraliandollars($)androundedtothenearesttenthofamilliondollars($m)inaccordancewithASICClassOrder2016/191(unlessotherwisestated);
• Hasbeenpreparedinaccordancewiththehistoricalcostconvention,exceptforcertainfinancialassetsandliabilitiesandinvestmentproperties which have been recognised at fair value; and
• WasauthorisedforissuebytheBoardofDirectorson17August2016.TheDirectorshavethepowertoamendandreissuethe financialreport.
AlthoughtheGrouphasanetcurrentdeficiencyof$459.4million(currentliabilitiesexceedcurrentassets)atreportingdate,theGrouphassufficientcurrentundrawnAustraliandollarborrowingfacilities(of$1,196.0million,refertoNote6(a))andgeneratessufficientoperatingcashflowstomeetitscurrentobligationsastheyfalldue.Accordingly,thisfinancialreporthasbeenpreparedonagoing concernbasis.
Accounting policiesTheGroup’saccountingpoliciesarecontainedwithintherelevantnotestothisfinancialreport.Otheraccountingpoliciesthatrelate tothefinancialstatementsasawhole,detailsofanychangesinaccountingpoliciesandtheimpactofneworamendedaccountingstandardsarecontainedinNote21.
Critical accounting estimates and judgementsThepreparationoffinancialstatementsrequirestheGrouptomakejudgements,estimatesandassumptions.Thesearebasedonhistoricalexperience and other factors considered to be reasonable under the circumstances, but which are inherently uncertain, the result of which formthebasisofthecarryingvalueofthoseassetsandliabilities.Consequently,futureactualresultscoulddifferfromtheseestimates.Judgementsandestimatesconsideredmaterialtothisfinancialreportare:
Judgement or Estimate ReferenceRecognition of deferred tax assets Note3Valuation of investment properties Note4Valuation of derivatives Note6Recoverability of goodwill and intangibles Note15(b)andNote21(b)
72|Vicinity Centres AnnualReport2016
For
per
sona
l use
onl
y
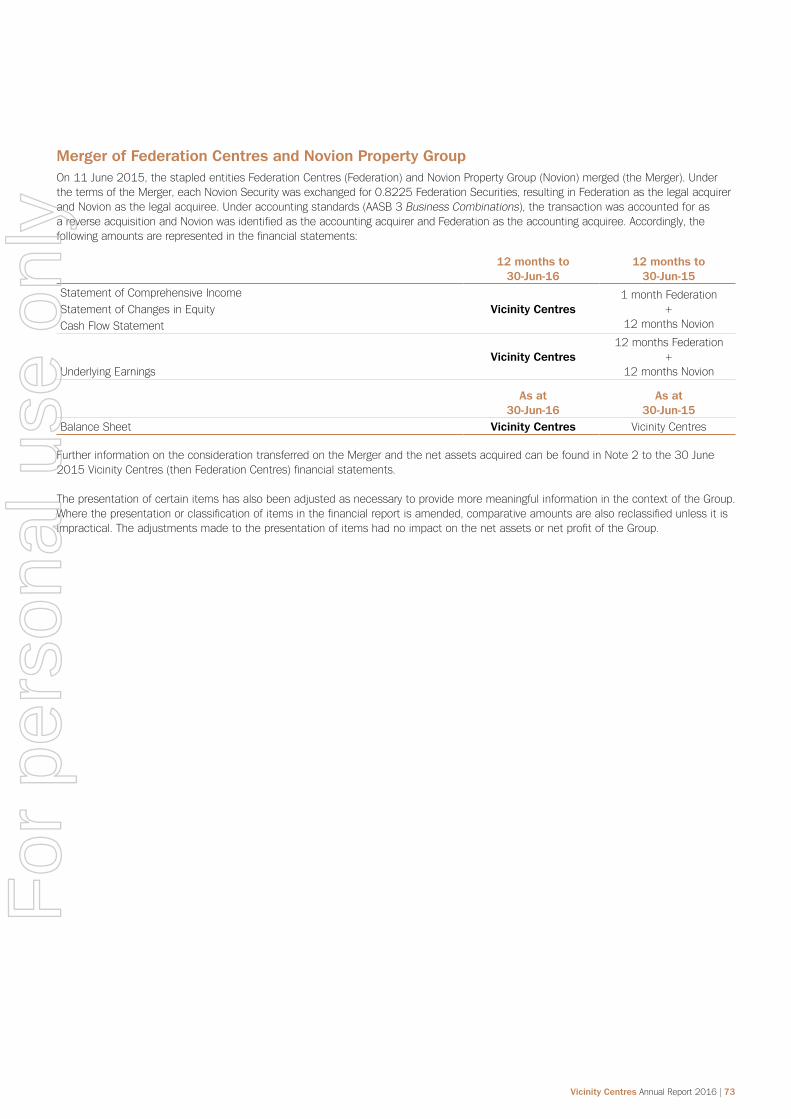
Merger of Federation Centres and Novion Property GroupOn11June2015,thestapledentitiesFederationCentres(Federation)andNovionPropertyGroup(Novion)merged(theMerger).UnderthetermsoftheMerger,eachNovionSecuritywasexchangedfor0.8225FederationSecurities,resultinginFederationasthelegalacquirerandNovionasthelegalacquiree.Underaccountingstandards(AASB3Business Combinations),thetransactionwasaccountedforas areverseacquisitionandNovionwasidentifiedastheaccountingacquirerandFederationastheaccountingacquiree.Accordingly,thefollowingamountsarerepresentedinthefinancialstatements:
12 months to 30-Jun-16
12 months to 30-Jun-15
StatementofComprehensiveIncomeVicinity Centres
1monthFederation+
12monthsNovionStatementofChangesinEquityCash Flow Statement
UnderlyingEarningsVicinity Centres
12monthsFederation+
12monthsNovion
As at 30-Jun-16
As at 30-Jun-15
Balance Sheet Vicinity Centres Vicinity Centres
FurtherinformationontheconsiderationtransferredontheMergerandthenetassetsacquiredcanbefoundinNote2tothe30June2015VicinityCentres(thenFederationCentres)financialstatements.
ThepresentationofcertainitemshasalsobeenadjustedasnecessarytoprovidemoremeaningfulinformationinthecontextoftheGroup.Wherethepresentationorclassificationofitemsinthefinancialreportisamended,comparativeamountsarealsoreclassifiedunlessitisimpractical.TheadjustmentsmadetothepresentationofitemshadnoimpactonthenetassetsornetprofitoftheGroup.
Vicinity Centres AnnualReport2016|73
For
per
sona
l use
onl
y

1. Segment reportingTheGroup’soperatingsegmentsidentifiedforinternalreportingpurposesarethePropertyInvestmentandStrategicPartnershipssegmentswhichcomprise:
• Property Investment: net property income derived from investment in retail property; and
• Strategic Partnerships:feeincomefrompropertymanagement,development,leasingandmanagementofwholesalepropertyfunds.
TheinternalreportingonthesesegmentsisprovidedtotheChiefOperatingDecisionMakerstomakestrategicdecisions.DuringtheyeartheChiefOperatingDecisionMakersweretheManagingDirector&ChiefExecutiveOfficer(CEO)andtheChiefFinancialOfficer(CFO).
SegmentperformanceisassessedbasedonUnderlyingEarningswhichiscalculatedasstatutorynetprofit,adjustedforfairvalueadjustments,certainunrealisedandnon-cashitems,andotheritemsthatarenon-recurringorcapitalinnature.InadditiontoUnderlyingEarnings,from1July2015,theCEOandCFOalsoreviewAdjustedFundsfromOperations(AFFO)inassessingtheperformanceoftheGroup.AFFOisdeterminedbyadjustingUnderlyingEarningsforotheritemsinaccordancewiththeguidelinespublishedbythePropertyCouncilofAustralia.
(a) Segment results
For the 12 months to:30-Jun-16
$m30-Jun-151
$mProperty Investment segmentNet property income 953.6 936.9
Strategic Partnership segmentProperty management, development and leasing fees 56.3 54.0Funds management fees 9.8 12.0Total income 1,019.7 1,002.9Corporateoverheads(netofinternalpropertymanagementfees) (80.8) (105.4)Net interest expense (181.4) (205.7)Underlying Earnings 757.5 691.8Adjustedfor:Rent lost from undertaking developments (18.0)Maintenance capital expenditure and tenant incentives paid (72.1)Adjusted Funds From Operations2 667.4Distribution declared 700.7 666.93
Distribution as a percentage of Underlying Earnings 92.5% 96.4%Distribution as a percentage of AFFO2 105.0% -
1. AlthoughtheMergeroccurredon11June2015,forcomparisonpurposes,managementassessesGroupperformanceagainstaggregatedFederationandNovionresultsfortheyearended30June2015.ChangesinthedefinitionofunderlyingearningsadoptedbyFederationandthedistributableincomedefinitionadoptedbyNovion(toexcludetheamortisationofstaticleaseincentivesfromNetPropertyIncome)haveresultedinanetincreaseinunderlyingearningsof$8.7millionfromthepreviouslyreportedunderlyingearningsanddistributableincomeofFederationandNovionrespectivelyat30June2015.
2. AFFOwasnotpreviouslyusedbyNovionasameasureofsegmentperformance.Assuch,informationforthecomparativeyearisnotreported.
3. RepresentsaggregatedistributionsforFederationandNovionfortheyearended30June2015.DistributionsshownintheStatementofChangesinEquityof$546.9millionexcludeFederations31December2014distributionof$119.9million.
OPERATIONS
74|Vicinity Centres AnnualReport2016
For
per
sona
l use
onl
y

GroupperformanceisalsomonitoredonUnderlyingEarningspersecurity(underlyingEPS).ThecalculationofunderlyingEPSforeachyearusesthebasicweightedaveragenumberofsharesonissueascalculatedinNote2.
For the 12 months to:30-Jun-16
cents30-Jun-151
centsUnderlyingEPS 19.14 17.56Distribution per security 17.70 16.90
1. AsUnderlyingEarningsforyearended30June2015representstheaggregatedFederationandNovionresult,theunderlyingEPSiscalculatedbasedontheweightedaveragesecuritiesofNoviononissueplustheweightedaveragesecuritiesofFederationonissuefortheyear.
(b) Reconciliation of underlying earnings to net profit after tax
For the 12 months to:30-Jun-16
$m30-Jun-15
$mUnderlying Earnings 757.5 691.8SubtractFederationUnderlyingEarningspriortotheMerger1 - (240.8)Property revaluation increments for directly owned properties2 733.0 430.9Non-distributable(loss)/gainrelatingtoequityaccountedinvestments2 (15.6) 2.8Amortisation of static lease incentives3 (10.2) (6.9)Amortisation of other project items3 (22.4) (21.7)Straight-lining of rent adjustment4 4.8 6.4Rent lost from undertaking developments5 (18.0) (12.5)Stampdutyandtransactioncostswrittenoffonacquisitionofinvestmentproperties (20.1) -Net movement on mark-to-market of derivatives6 (147.5) (23.0)Net unrealised foreign exchange gain 42.4 -Integrationandtransactioncosts7 (41.1) (135.4)Impairmentandamortisationofintangibleassets8 (298.3) (3.3)Incometaxexpense - (5.0)Other non-distributable items (3.6) (8.2)Net profit after tax 960.9 675.1
Thematerialadjustmentstonetprofittoarriveatunderlyingearningsandreasonsfortheirexclusionaredescribedbelow:
1. RepresentsFederation’scontributiontounderlyingearningsinthecomparativeperiodwhichdoesnotformpartofthecomparativenetprofitaftertax.Refertothe‘About thisreport–MergerofFederationCentresandNovionPropertyGroup’section.
2.Netprofitincludesnon-distributablefairvaluemovementsrelatingtodirectlyownedpropertiesandequityaccountedinvestments.
3. Certainpaymentssuchasleaseincentivesrelatingtoinvestmentpropertiesarecapitalisedininvestmentproperties.AmortisationoftheseitemsisthenrecognisedasanexpenseinaccordancewithAustralianAccountingStandards.TenantincentivespaidduringtheyeararereflectedintheAFFOcalculationatNote1(a).Accordingly,amortisationoftheseincentivesisexcludedfromunderlyingearnings.
4.Straight-liningofrentalrevenue,whichisrequiredbyAustralianAccountingStandards,isanunrealisednon-cashamount.
5. TheGrouprecognisesrentlostfromundertakingdevelopmentsinnetpropertyincome.ThisincomedoesnotmeetthedefinitionofrevenueunderAustralianAccountingStandardsandisthereforenotrecognisedinstatutorynetprofit.
6. Fairvaluemovementsinderivativescomprisemark-to-marketmovementsrequiredbyAustralianAccountingStandardsforvaluationpurposes,includingrealisedand unrealisedamounts.
7.TheGrouphasincurredcostsinthecurrentandprioryearinrelationtotheMerger.
8.NetprofitincludestheimpairmentandamortisationofintangibleassetsasoutlinedinNote15and21(b).Thesearenon-cashexpenses.
Vicinity Centres AnnualReport2016|75
For
per
sona
l use
onl
y

1. Segment reporting continued(c) Reconciliation of segment income to total revenueThefollowingisareconciliationoftotalsegmentincometototalrevenueandotherincomeintheStatementofComprehensiveIncome.Segment income is the share of net property income of investment properties, services revenue earned from management of assets on behalfofstrategicpartnersorwholesalefundsanddistributionsreceivedfrommanagedfundinvestments.Therefore,toreconciletototalrevenuepertheStatementofComprehensiveIncome,wedeductdistributionsreceivedfromequityaccountedinvestments,thenaddbackexpensesdeductedindeterminingnetpropertyincomeandinterestrevenuenotincludedinsegmentincome,asshownbelow:
For the 12 months to:30-Jun-16
$m30-Jun-15
$mTotal segment income 1,019.7 1,002.9Adjustedfor:
Federation Group segment income prior to the Merger - (340.0)NetpropertyincomefromequityaccountedinvestmentsnotshowninrevenuepertheStatement ofComprehensiveIncome (20.2) (5.1)Straight-lining revenue 4.8 6.4Property related expenses included in net property income 359.9 220.5Amortisation of static lease incentives and other project items (32.6) (28.6)Interestandotherrevenuenotincludedinsegmentincome 10.2 5.1
Total revenue and other income per Statement of Comprehensive Income 1,341.8 861.2
(d) Segment assets and liabilitiesThe property investment segment reported to the CEO and CFO includes investment properties held directly and those that are included in equityaccountedinvestments.ThepropertyinvestmentvaluesaremeasuredinamannerconsistentwiththeBalanceSheet.Abreakdownofthetotalinvestmentpropertiesinthepropertyinvestmentsegmentisshownbelow:
30-Jun-16$m
30-Jun-15$m
InvestmentpropertiesNote4(a)1 14,418.7 14,095.3Investmentpropertiesincludedinequityaccountedinvestments 267.1 245.4Total interests in directly owned investment properties 14,685.8 14,340.7Assets under management on behalf of strategic partners2 8,920.6 8,317.5Total assets under management 23,606.4 22,658.2
1. ExcludesplanningandholdingcostsrelatingtoinvestmentpropertiesasdisclosedinNote4(a).
2.Representsthevalueofpropertyinterestsmanaged,butnotowned,consolidatedorotherwiseaccountedforbytheGroup.
AllotherassetsandliabilitiesareunallocatedforreportingtotheCEOandCFO.
OPERATIONS continued
76|Vicinity Centres AnnualReport2016
For
per
sona
l use
onl
y

2. Earnings per securityThebasicanddilutedearningspersecurityfortheGrouparecalculatedbelowinaccordancewiththerequirementsofAASB133 Earnings per Share.
Basicearningspersecurityisdeterminedbydividingthenetprofitorlossafterincometaxbytheweightedaveragenumberofsecuritiesoutstandingduringtheyear.
Dilutedearningspersecurityadjuststhefiguresusedinthedeterminationofbasicearningspersecuritybytakingintoaccounttheinterestandotherfinancingcostsassociatedwithdilutivepotentialordinarysecuritiesandtheweightedaveragenumberofsecuritiesassumedtohavebeenissuedfornoconsiderationinrelationtodilutivepotentialordinarysecurities.
Basicanddilutedearningspersecurityareasfollows:
For the 12 months to: 30-Jun-16 30-Jun-15Earnings per security attributable to securityholders of the Vicinity Group:Basicearningspersecurity(cents) 24.27 25.56Dilutedearningspersecurity(cents) 24.25 25.21
Earnings per security attributable to securityholders of the Parent (Vicinity Limited):Basic(loss)/earningspersecurity(cents) (7.72) 0.41Diluted(loss)/earningspersecurity(cents) (7.72) 0.39
Thefollowingnetprofit/(loss)amountsareusedinthenumeratorincalculatingearningsperstapledsecurity:
For the 12 months to:30-Jun-16
$m30-Jun-15
$mEarnings used in calculating basic earnings per security of the Vicinity Group 960.9 675.1Adjustedfor:Borrowing costs attributable to convertible notes - 17.4Less:Amountcapitalisedinqualifyingassets - (1.7)Earnings used in calculating diluted earnings per security of the Vicinity Group 960.9 690.8
Earnings used in calculating basic and diluted earnings per security of the Parent (Vicinity Limited) (305.6) 10.8
The following weighted average number of securities are used in the denominator in calculating earnings per security for the parent and theGroup:
For the 12 months to:30-Jun-16
Number (m)30-Jun-151
Number (m)Weightedaveragenumberofsecuritiesusedasthedenominatorincalculatingbasicearningspersecurity 3,958.6 2,641.3Adjustment for potential dilution from performance rights granted 3.8 2.3Adjustment for potential dilution from convertible notes - 97.4Weighted average number of securities and potential securities used as the denominator in calculating the diluted earnings per security 3,962.4 2,741.0
1. DuetoaccountingfortheMergerasareverseacquisition(asdescribedinthe‘Aboutthisreport–MergerofFederationCentresandNovionPropertyGroup’section)thenumberofsecuritiesusedinthecalculationofearningspersecurityfortheyearended30June2015representstheweightedaveragenumberofsecuritiesofNovion pre-merger,multipliedbytheMergerexchangeratioof0.8225,plustheweightedaveragenumberofsecuritiesonissuepost-mergertotheendoftheyear.
Vicinity Centres AnnualReport2016|77
For
per
sona
l use
onl
y

3. Taxes(a) Group taxation
Income taxVicinity Centres Trust (flow through trust structure)VicinityCentresTrust(theTrust)anditscontrolledtrustsarenotliabletopayincometax(includingcapitalgainstax)onthebasisthattheirbeneficiariesarepresentlyentitledtothenetincomeofthetrusts.ThismeansthatthetaxableincomefromtheTrust’spropertyinvestmentsistaxedonaflowthroughbasisinthehandsoftheTrust’sinvestors.TheTrust’sinvestorspaytaxattheirmarginaltaxrates,inthecaseofAustralianresidentinvestors,orthroughtheManagedInvestmentTrustwithholdingrulesfornon-residentinvestors.Asaresult,theGrouphaszeroincometaxexpenserecognisedinrespectoftheTrust’sprofit.
Vicinity Limited (corporate tax group)VicinityLimitedanditssubsidiarieshaveformedataxconsolidatedgroup(TCG).Underthisarrangement,VicinityLimited,theheadentity,accountsforitsowncurrentanddeferredtaxamountsandassumesthosefromsubsidiariesintheTCG.MembersoftheTCGhaveenteredintoataxfundingarrangementwhichsetsoutthefundingobligationsofmembersoftheTCGinrespectoftaxamounts.Thetaxfundingarrangementrequirespaymentsto/fromtheheadentitytoberecognisedviaaninter-entityreceivable/payablewhichisatcall.
Incometaxexpensefortheyeariscalculatedatthecorporatetaxrateof30%andcomprisescurrentanddeferredtaxexpense.Theseamountsarerecognisedinprofitorloss,excepttotheextenttheyrelatetoitemsrecogniseddirectlyinothercomprehensiveincomeorequity.Currenttaxexpenserepresentstheexpenserelatingtotheexpectedtaxableincomeattheapplicablerateforthefinancialyear.Deferredtaxexpenserepresentsthetaxexpensesinrespectoffuturetaxconsequencesofrecoveringorsettlingthecarryingamount ofanassetorliability.Thesefuturetaxconsequencesarerecordedasdeferredtaxassetstotheextentitisprobablethatfuturetaxableprofitswillbeavailabletoutilisethemordeferredtaxliabilities.Whereappropriate,deferredtaxassetsandliabilitiesareoffsetaspermittedbyAustralianAccountingStandards.
AsummaryofVicinityLimited’scurrentanddeferredtaxexpense,andrecogniseddeferredtaxassets,isshownbelow:
For the 12 months to:30-Jun-16
$m30-Jun-15
$mCurrentincometaxbenefit/(expense) 6.3 (0.4)Deferred income tax expense (2.8) (4.3)Adjustment for current year tax of prior periods 0.7 (0.3)Benefitfromtaxlossesnotrecognised (4.2) -Income tax expense - (5.0)
Statutory taxes and leviesTheGroupalsoincursfederal,statebasedorlocalauthoritytaxesincludinglandtax,councilratesandlevies.TheseareincludedwithindirectpropertyexpensesintheStatementofComprehensiveIncome.Alsoincludedinemployeebenefitsexpensesareemploymentrelatedtaxessuchasfringebenefitstax,payrolltaxandworkcovercontributions.
FurtherdetailsofthesetaxescanbefoundinourVicinityCentresApproachtoTaxessectionofthisAnnualReport.ThetaxespaidreporthasbeenpreparedinaccordancewiththeBoardofTaxVoluntaryTaxTransparencyCode.
Goods and services taxRevenues,expensesandassetsarerecognisednetoftheamountofGoodsandServicesTax(GST)exceptwhere:
• The GST incurred on a purchase of goods and services is not recoverable from the taxation authority, in which case the GST is recognised aspartofthecostofacquisitionoftheassetoraspartoftheexpenseitemasapplicable;and
• Receivablesandpayables,whicharestatedwiththeamountofGSTincluded.
The net amount of GST recoverable from, or payable to, the taxation authority is included as part of receivables and payables in the BalanceSheet.CashflowsareincludedintheCashFlowStatementonagrossbasisandtheGSTcomponentofcashflowsarisingfrominvestingandfinancingactivities,thatisrecoverablefrom,orpayableto,thetaxationauthorityisclassifiedaspartofoperatingcashflows.
CommitmentsandcontingenciesaredisclosednetoftheamountofGSTrecoverablefrom,orpayableto,thetaxationauthority.FurtherdetailsofthesetaxescanbefoundinourVicinityCentresApproachtoTaxessectionofthisAnnualReport.
OPERATIONS continued
78|Vicinity Centres AnnualReport2016
For
per
sona
l use
onl
y

(b) Reconciliation between income tax expense/(benefit) to net profitThereconciliationbelowtakestheGroup’snetprofitbeforetaxanddeducts:
• ThecomponentoftheGroup’sprofitattributabletotheTrust(which,asdescribedinNote3(a),isnotsubjecttotaxprovidedthatunitholdersarepresentlyentitledtotheincomeoftheTrust);and
• Itemsincludedinnetprofitbeforetaxwhicharenotsubjecttotax.
For the 12 months to:30-Jun-16
$m30-Jun-15
$mProfitbeforetaxfortheyear 960.9 680.1Less:ProfitattributedtotheTrustandnotsubjecttotax (1,266.5) (664.3)Net (loss)/profit before tax attributable to securityholders of Vicinity Limited (305.6) 15.8
Primafacieincomebenefit/(expense)at30% 91.7 (4.7)Tax effect of amounts not taxable in calculating income tax expense:Non-deductible impairment and amortisation of intangible assets (89.5) (1.0)Netadjustmentrelatingtoacquisitionofsharebasedpayments 2.4 -Prior period adjustments 0.7 (0.3)Other non-deductible items (2.4) (1.3)Other items 1.3 2.3Benefitfromtaxlossesnotrecognised (4.2) -Income tax expense - (5.0)
(c) Movement in temporary differencesAsummaryofthemovementsindeferredtaxbalancesisasfollows:
Provisions$m
Intangible assets
$mOther
$m
Allowabledeductions1
$mTax losses
$mTotal
$mAt 1 July 2014 17.3 (5.3) 2.2 38.6 10.5 63.3Acquiredthroughbusinesscombination 7.4 - 4.9 - 13.6 25.9Allowable deductions - - - (14.7) 14.7 -Charged:–toprofit (5.3) 1.0 0.1 - (0.8) (5.0)–directlytoequity - - 0.1 - - 0.1At 30 June 2015 19.4 (4.3) 7.3 23.9 38.0 84.3Allowable deductions - - - (15.0) 15.0 -Charged:–toprofit (1.5) 1.0 (2.3) 0.6 2.2 -At 30 June 2016 17.9 (3.3) 5.0 9.5 55.2 84.3
1. TheGroupisentitledtotaxdeductionsunders40-880oftheIncome Tax Assessment Act 1997 primarily resulting from the termination of funds management contracts inMarch2014.
Thedeferredtaxassetof$84.3millionisrecognisedbasedonforecastsasitisprobabletheGroupwillearnsufficienttaxableincome infutureperiodstoutilisethetaxdeductions.
Unrecogniseddeferredtaxassetsat30June2016are$25.3million(30June2015:$19.8million)whichwillbereviewedonanannualbasisandmayberecognisedatalaterdateifconsideredlikelytoberecovered.
Vicinity Centres AnnualReport2016|79
For
per
sona
l use
onl
y

4. Investment propertiesTheGroup’sinvestmentpropertiesrepresentfreeholdandleaseholdinterestsinlandandbuildingsheldtoderiverentalincome.They areinitiallymeasuredatcost,includingrelatedtransactioncosts.Subsequently,ateachreportingperiod,theyarecarriedattheirfairvaluesbasedonthemarketvaluedeterminedbyindependent(external)valuersorinternalvaluations.Thesevaluationsincludethecost ofcapitalworksinprogressondevelopmentprojects.FurtherdetailontheGroup’svaluationprocessandvaluationmethodsisdescribedinNote4(c).
(a) Portfolio summary30-Jun-16 30-Jun-15
Shopping centre typeNumber of properties
Value $m
Weighted average cap rate
%Number of properties
Value $m
Weighted average cap rate
%Super Regional 1 2,215.0 4.75 1 1,871.8 5.00Major Regional 7 3,144.2 5.79 7 3,068.7 5.84City Centre 4 1,849.5 5.06 4 1,665.0 5.56Regional 10 2,105.4 6.33 12 2,520.1 6.67Outlet Centre 5 1,084.8 6.49 5 952.2 6.82Sub Regional 34 3,272.5 6.75 36 3,197.2 7.19Neighbourhood and other 19 747.3 6.86 22 820.3 7.17Planning and holding costs1 - 25.8 - - 14.4 -Total 80 14,444.5 5.94 87 14,109.7 6.30Add:Financeleaseassets2 214.2 -Less:Propertiesheldforsale(currentasset)3 (232.1) -Total investment properties 14,426.6 14,109.7
1. Planningandholdingcostsrelatingtopotentialmajordevelopmentprojectsarecapitalisedandcarriedwithintheoverallinvestmentpropertybalance.Thesecosts arereviewedeachperiodandthestatusoftheprojectassessedtodetermineifcontinuedcapitalisationofthesecostsremainsappropriate.
2. RefertoNote21(c)forfurtherdetail.
3. RepresentsthecarryingamountofinvestmentpropertieswhichtheGrouphadanagreementtosell.At30June2016,thevaluerepresentsa25%freeholdinterest inTheMyerCentreBrisbane,a50%freeholdinterestinMorningtonCentralanda100%freeholdinterestinBowesSt.ThesesalesareexpectedtosettleinFY17.
(b) Movements for the year
30-Jun-16$m
30-Jun-151
$mOpening balance 14,109.7 8,830.4Investmentpropertiesacquiredthroughbusinesscombination1 - 4,734.4Acquisitionsincludingassociatedstampdutyandtransactioncosts2 378.1 -Capital expenditure3 406.5 192.8Capitalised interest4 11.8 10.4Disposals (1,146.7) (67.0)Property revaluation increment for directly owned properties 733.0 430.9Stampdutyandtransactioncostswrittenoffonacquisitions (20.1) -Amortisation of incentives (32.6) (28.6)Straight-lining of rent adjustment 4.8 6.4Closing balance 14,444.5 14,109.7
1. Federation’sinvestmentpropertieswereacquiredbyNovionaspartoftheMergerdescribedinthe‘Aboutthisreport–MergerofFederationCentresandNovionPropertyGroup’section.
2.Comprisespurchasepriceof$358.0millionplusstampdutyandtransactioncostsof$20.1million.
3. Includesdevelopmentcosts,maintenancecapitalexpenditureandleaseincentives.
4. Borrowingcostsincurredintheconstructionofqualifyingassetshavebeencapitalisedataweightedaveragerateof4.1%(30June2015:5.3%).
OPERATIONS continued
80|Vicinity Centres AnnualReport2016
For
per
sona
l use
onl
y

(c) Portfolio valuation
ProcessEachinvestmentpropertyisvaluedeitherindependently(externally)orinternallyinDecemberandJuneeachyearaspartofthebi-annualvaluationprocess.Thisprocessrequires:
• Each property to be independently valued at least once per year;
• Independentvaluers(whoareselectedfromapre-approvedpanel)thatareappropriatelyqualified.Thisisconsideredtobewhentheyareauthorisedbylawtocarryoutsuchvaluationsandhaveatleastfiveyearsvaluationexperience(includingatleasttwoyearsinAustralia);
• Internalvaluationstobeundertakenifapropertyisnotdueforanindependentvaluation;
• Whereaninternalvaluationshowsavariancegreaterthan10%fromthelastindependentvaluation,anewindependentvaluationtobeundertaken(evenifthisresultsinapropertybeingindependentlyvaluedtwiceinoneyear);and
• Internalvaluationstobereviewedbyadirectorofanindependentvaluationfirmtoassesstheassumptionsadoptedandthereasonablenessoftheoutcomes.
ThevaluationprocessisgovernedbytheBoardandtheinternalPropertyInvestmentCommittee,withinputfromkeyexecutivesasrequired.Theprocessisreviewedperiodicallytotakeintoaccountanyregulatorychanges,changesinmarketconditions,andanyotherrequirementsthatwouldneedtobeadopted.
MethodologyTodeterminefairvalue:
• Independentvaluationscommonlyadoptthemidpointofthe‘capitalisationofnetincome’and‘discountedcashflow’(DCF)methods;
• Internalvaluationsuseindustrysoftwaretoutilisethelatestavailablepropertyfinancialinformationinthe‘capitalisationofnetincome’method with a cross check using the DCF method;
• Both independent and internal valuations employ the ‘residual value’ method when valuing development properties; and
• Propertiesthathavesaleagreementsinplacebytheendofthefinancialyeararevaluedattheagreedsaleamount.
Method DescriptionCapitalisation of net income
Thefullyleasedannualnetincomeofthepropertyiscapitalisedinperpetuityfromthevaluationdate.Various adjustments are then made to the calculated result, including estimated future incentives, capital expenditure,vacancyallowancesandreversionstomarketrent.
Thecapitalisationratereflectsthenature,locationandtenancyprofileofthepropertytogetherwithcurrentmarketinvestmentcriteria,asevidencedbycurrentsalesevidence.
Discounted cash flow Projectedcashflowsforaselectedinvestmentperiod(usually10years)arederivedfromcontractedormarketrents,operatingcosts,leaseincentives,capitalexpenditureandfutureincomeonvacantspace.
Thecashflowsassumethepropertyissoldattheendoftheinvestmentperiodforaterminalvalue.Thisterminal value is calculated by capitalising in perpetuity assumed rents at the end of the investment period byanappropriateterminalyield.
Fairvalueisdeterminedtobethepresentvalueoftheseprojectedcashflows,whichiscalculatedbyapplyingamarket-deriveddiscountratetothecashflows.
Residual value (for properties under development)
The value of the asset on completion is calculated using the capitalisation of net income and DCF methodsasdescribedabove,basedontheforecastincomeprofileatdevelopmentcompletion.Theestimated cost to complete the development, including construction costs and associated expenditures, financecosts,andanallowancefordeveloper’sriskandprofitisdeductedfromthevalueoftheasset oncompletiontoderivethecurrentvalue.
Vicinity Centres AnnualReport2016|81
For
per
sona
l use
onl
y

4. Investment properties continued(c) Portfolio valuation continued
Key inputs and sensitivitiesTheGrouphasclassifiedfairvaluemeasurements(suchasthoseperformedoninvestmentproperties)intothefollowinghierarchy asrequiredbyAASB13Fair Value Measurement:
• Level1:quotedprices(unadjusted)inactivemarketsforidenticalassetsorliabilities.
• Level2:inputsotherthanquotedpricesincludedwithinlevel1thatareobservablefortheassetorliability,eitherdirectlyorindirectly.
• Level3:inputsfortheassetorliabilitythatarenotbasedonobservablemarketdata(unobservableinputs).
InputstoinvestmentpropertyvaluationsareconsideredLevel3ofthefairvaluehierarchyasthecapitalisationofincomeandDCFmethodsrequireassumptionstobemadetodeterminecertaininputsthatarenotbasedonobservablemarketdata.
Atreportingdate,thekeyunobservableinputsusedbytheGroupindeterminingfairvalueofitsinvestmentpropertiesaresummarisedbelow:
30-Jun-16 30-Jun-15
Unobservable inputsRange
of inputsWeighted
average inputsRange
of inputsWeighted
average inputs SensitivityCapitalisation rate1 4.75% – 8.50% 5.94% 5.00%–10.00% 6.30% The higher the discount rate,
terminal yield, capitalisation rate and downtime for tenants vacating, the lower thefairvalue.
Discount rate2 7.00% – 9.25% 7.95% 8.00%–10.25% 8.50%Terminal yield3 5.00% – 8.75% 6.18% 5.25%–10.25% 6.54%Expected downtime (for tenants vacating)
2 months to 12 months
4 months2monthsto 12months
4months
Rental growth rate 2.70% – 4.50% 3.70% 2.50%–4.60% 3.70%The higher the rental growth rate,thehigherthefairvalue.
1. Thecapitalisationrateistherequiredannualyieldofnetmarketincomeusedtodeterminethevalueoftheproperty.Therateisdeterminedwithregardstocomparablemarkettransactions.
2. Thediscountrateisarequiredannualtotalrateofreturnusedtoconvertaforecastcashflowofanassetintoapresentvalue.Itshouldreflecttherequiredrateofreturn ofthepropertygivenitsriskprofilerelativetocompetingusesofcapital.Therateisdeterminedwithregardstocomparablemarkettransactions.
3. Theterminalyieldisthecapitalisationrateusedtoconvertforecastannualincomeintoaforecastassetvalueattheendoftheholdingperiodwhencarryingoutadiscountedcashflowcalculation.Therateisdeterminedwithregardstocomparablemarkettransactionsandtheexpectedriskoftheassetattheendofthecashflowperiod.
Alloftheabovekeyassumptionshavebeentakenfromthelatestexternalvaluationreportsandinternalvaluationassessments. BowesStisexcludedfromthe30June2016inputsasitisacommercialpropertyandheldforsale.
Forallinvestmentpropertiesthecurrentuseequatestothehighestandbestuse.
OPERATIONS continued
82|Vicinity Centres AnnualReport2016
For
per
sona
l use
onl
y

(d) List of investment properties
i. Super RegionalCarrying value
Ownership interest%
Valuation type
30-Jun-16$m
30-Jun-15$m
Chadstone Shopping Centre 50 Internal 2,215.0 1,871.8Total Super Regional 2,215.0 1,871.8
ii. Major RegionalCarrying value
Ownership interest%
Valuation type
30-Jun-16$m
30-Jun-15$m
Bankstown Central 50 External 343.0 320.0Bayside Shopping Centre 100 External 570.0 556.2Chatswood Chase Sydney 100 External 1,011.2 952.1Galleria 50 Internal 382.5 360.0Northland Shopping Centre 50 External 482.5 482.5Roselands 50 External 185.0 179.8The Glen 50 Internal 170.0 218.1Total Major Regional 3,144.2 3,068.7
iii. City CentreCarrying value
Ownership interest%
Valuation type
30-Jun-16$m
30-Jun-15$m
Emporium Melbourne1 50 External 570.0 489.6Myer Bourke Street1 33 External 151.3 122.8The Myer Centre Brisbane2 50 Internal 384.2 382.7QueensPlaza 100 External 744.0 669.9Total City Centre 1,849.5 1,665.0
RefertofootnotesattheendofNote4(d).
Vicinity Centres AnnualReport2016|83
For
per
sona
l use
onl
y

4. Investment properties continued(d) List of investment properties continued
iv. RegionalCarrying value
Ownership interest%
Valuation type
30-Jun-16$m
30-Jun-15$m
Broadmeadows Shopping Centre 100 External 322.8 333.7Colonnades 50 External 155.5 150.8Cranbourne Park 50 Internal 147.5 130.5Eastlands Shopping Centre 100 Internal 163.0 162.7ElizabethShoppingCentre 100 External 374.1 368.2GrandPlazaShoppingCentre 50 External 205.0 191.0Mandurah Forum 50 External 172.5 156.3Mount Ommaney 25 Internal 105.0 104.1Rockingham Shopping Centre 50 External 300.0 280.3Runaway Bay Shopping Village 50 External 160.0 127.5ForestHillChase3 100 - - 281.7Toombul3 100 - - 233.3Total Regional 2,105.4 2,520.1
v. Outlet CentreCarrying value
Ownership interest%
Valuation type
30-Jun-16$m
30-Jun-15$m
DFO Brisbane4,5 100 External 55.0 -DFO Essendon6 100 Internal 163.0 152.9DFOHomebush 100 Internal 390.0 320.0DFO Moorabbin7 100 External 110.5 108.6DFOSouthWharf8 75 External 366.3 311.6IndooroopillyCentral3 100 - - 59.1Total Outlet Centre/other 1,084.8 952.2
RefertofootnotesattheendofNote4(d).
OPERATIONS continued
84|Vicinity Centres AnnualReport2016
For
per
sona
l use
onl
y

vi. Sub RegionalCarrying value
Ownership interest%
Valuation type
30-Jun-16$m
30-Jun-15$m
Altona Gate Shopping Centre 100 Internal 94.0 86.9Armidale Central 100 External 45.5 44.5Belmont Village 100 Internal 46.3 44.5BoxHillNorth 100 External 86.6 70.0BoxHillSouth9 100 Internal 161.0 144.4Brandon Park 50 External 57.5 58.2Buranda Village 100 Internal 41.5 38.1Carlingford Court 50 Internal 108.5 101.5CastlePlazaShoppingCentre 100 Internal 168.9 152.7Corio Shopping Centre 100 Internal 126.0 123.8Gympie Central 100 External 78.0 75.0HallsHeadCentral10 50 External 47.4 -Karratha City 50 External 56.6 57.5Kurralta Central 100 Internal 37.0 35.7LakeHavenShoppingCentre 100 Internal 273.5 268.3LavingtonSquare 100 Internal 58.0 56.0LivingstonMarketplace4 100 Internal 84.0 -Maddington Central 100 Internal 119.0 114.4MaitlandHunterMall 100 Internal 20.0 16.8Mornington Central2 100 Internal 65.0 61.8Nepean Village 100 Internal 164.0 142.1Northgate Shopping Centre 100 External 103.5 96.2Roxburgh Park Shopping Centre 100 External 111.9 105.2Sunshine Marketplace 50 External 57.5 56.0TaigumSquare 100 External 91.0 89.3The Shops at Ellenbrook4 100 Internal 233.0 -Toormina Gardens 50 Internal 40.0 40.0Tweed Mall 100 External 70.0 79.0WarnbroCentre 100 Internal 123.5 122.0WarriewoodSquare 50 External 132.5 87.7WarwickGrove 100 Internal 197.5 184.1WestEndPlaza 100 External 64.4 59.0WhitsundayCentral 100 Internal 63.0 59.6WodongaPlaza 100 External 46.4 47.3Brimbank Shopping Centre3 100 - - 165.5Clifford Gardens Shopping Centre3 100 - - 188.5GoulburnPlaza3 100 - - 67.2Mount Gambier Central3 100 - - 24.8WestsidePlaza3 100 - - 33.6Total Sub Regional 3,272.5 3,197.2
RefertofootnotesattheendofNote4(d).
Vicinity Centres AnnualReport2016|85
For
per
sona
l use
onl
y

4. Investment properties continued(d) List of investment properties continued
vii. Neighbourhood and OtherCarrying value
Ownership interest%
Valuation type
30-Jun-16$m
30-Jun-15$m
Albany Brooks Garden 100 External 23.8 25.1BentonsSquare11 100 Internal 77.3 76.8Bowes Street2 100 Internal 7.5 10.0Currambine Central 100 Internal 98.0 87.3DianellaPlaza 100 Internal 81.5 72.2FlindersSquare 100 Internal 31.0 30.3GoldfieldsPlaza 100 External 27.0 25.0HallsHeadCentral10 50 - - 22.1HiltonPlaza 100 Internal 17.8 19.0Kalamunda Central 100 Internal 37.5 36.8LennoxVillage 50 Internal 32.5 30.3Milton Village 100 Internal 25.5 22.0Monier Village 100 External 19.5 19.9North Shore Village 100 Internal 23.5 20.8Oakleigh Central 100 External 62.0 58.0Oxenford Village 100 External 28.4 26.5Stirlings Central 100 Internal 50.0 48.0Terrace Central 100 External 32.5 31.5The Gateway 100 Internal 42.5 38.8Victoria Park Central 100 External 29.5 27.0Katherine Oasis3 100 - - 27.9LutwycheCity3 100 - - 65.0Total Neighbourhood and Other 747.3 820.3
1. Thetitlestothesepropertiesareleaseholdwith290yearsremainingoneachgroundleases.
2. Partofthesepropertiesareheldforsaleat30June2016,refertofootnote(3)inNote4(a).
3. Disposedduringtheyear.
4. Acquiredduringtheyear.
5. TherighttooperatetheDFOBrisbanebusinesshas30yearsremaining.
6. Thetitletothispropertyisleaseholdwith32yearsremainingonthegroundlease.
7. Thetitletothispropertyisleaseholdwith18yearsremainingonthegroundlease.
8. Thetitletothispropertyisleaseholdwith92yearsremainingonthegroundlease.
9. Thetitletothispropertyisleaseholdwithoptionstoextendthegroundleaseto2134attheGroup’soption.
10.Followingcompletionofthecentrere-developmentHallsHeadCentralisnowaSub-Regionalcentre.
11.TheGrouphadanoptiontoacquiretheremaining50%ofBentonsSquare.Thiswasexercisedon5July2016.Basedonthetermsoftheagreement,100%ofthepropertyresultswereaccountedforintheGroupfinancialstatements,withadeferredsettlementliabilityrecognisedonthe50%ofthepropertyunderoption(refertoNote10).
(e) Operating lease receivablesTheinvestmentpropertiesareleasedtotenantsunderoperatingleaseswithrentalspayablemonthly.Futureminimumrentalrevenuereceivablesundernon-cancellableoperatingleasesofinvestmentpropertiesareasfollows:
30-Jun-16 $m
30-Jun-15 $m
Not later than one year 833.2 906.4Laterthanoneyearandnotlaterthanfiveyears 2,077.3 2,286.3Laterthanfiveyears 1,091.6 1,317.4Total operating lease receivables 4,002.1 4,510.1
OPERATIONS continued
86|Vicinity Centres AnnualReport2016
For
per
sona
l use
onl
y

5. Equity accounted investmentsEquityaccountedinvestmentsarepredominantlyinvestmentpropertyjointventureswithstrategicpartnerswherethepropertyownershipinterestisheldthroughajointlyownedtrustratherthandirectownershipintothepropertytitle.TheGrouphascontractualarrangementsthatestablishjointcontrolovertheeconomicactivitiesofthesetrusts,basedonstandardmarketterms.TheseareaccountedforintheGroup’sfinancialstatementsusingtheequitymethod.
Carrying value
30-Jun-16$m
30-Jun-15$m
VictoriaGardensRetailTrust(JointVenture) 76.3 70.8Other associates and joint ventures 4.2 23.1Closing Balance 80.5 93.9
(a) Movements for the year30-Jun-16
$m30-Jun-15
$mOpening balance 93.9 36.4Acquiredthroughbusinesscombination - 92.4Additional investments made during the year 2.0 0.3Shareofnet(loss)/profitofequityaccountedinvestments (6.0) 7.7Distributions (8.9) (42.9)Return of capital (0.5) -Closing balance 80.5 93.9
(b) Summarised financial information for material equity accounted investmentsVictoria Gardens
Retail Trust1
30-Jun-16$m
30-Jun-15$m
Investmentproperties–non-current 127.1 105.3Interestbearingliabilities–non-current (46.6) (34.0)Other net liabilities (4.2) (0.5)Net assets 76.3 70.8Total income 9.3 0.9Aggregatenetprofitsafterincometax 10.1 0.5Interestexpense (1.9) (0.1)Distributions receivable by the Group 3.6 3.5
1.Summarisedfinancialinformationrepresents50%oftheunderlyingfinancialstatementinformationofthejointventurewithnoadjustmentsmade.
(c) Related party transactions with equity accounted investments during the year
Victoria Gardens Retail Trust (joint venture, 50% ownership interest)AssetmanagementfeesearnedbytheGroupformanagementservicesprovidedtoVictoriaGardensRetailTrusttotalled$827,485 (30June2015:$64,400).At30June2016,$66,127remainspayabletotheGroup(30June2015:$71,000).TheGroupalso hasdistributionsreceivableof$3,667,754atbalancedate(30June2015:$3,451,695).
Vicinity Asset Operations Pty Ltd (VAO) (associate, 33% ownership interest)RentandoutgoingspayablebyVAOasatenantoftheGroup’scentreswas$13,513,859(30June2015:$12,842,000).Dividends paidtotheGroupwere$904,717(30June2015:$2,198,000).Noamountsarereceivableat30June2016(30June2015:nil).
Tuggeranong Town Centre Trust (joint venture, 50% ownership interest)AssetmanagementfeesearnedbytheGroupformanagementservicesprovidedtoTuggeranongTownCentreTrust(TTCT)totalled$1,368,659(30June2015:$122,333).At30June2016nomanagementfeesremainpayabletotheGroup(30June2015:nil).
AsdisclosedinNote9,theGrouphasaloanreceivablefromTTCTof$117,387,000asat30June2016(30June2015:$117,387,000).Theinterestincomefortheyearwas$7,132,051(30June2015:$269,308).At30June2016,$294,739remainspayabletotheGroup(30June2015:$242,000).TheGroupalsohasotherpayablestoTTCTof$361,810atbalancedate(30June2015:$310,000)anddistributionsreceivableof$1,508,237(30June2015:$2,869,593).
Vicinity Centres AnnualReport2016|87
For
per
sona
l use
onl
y

6. Interest bearing liabilities and derivativesInterestbearingliabilitiesareinitiallyrecognisedatfairvalue,netoftransactioncostsincurredandsubsequentlymeasuredatamortisedcostusingtheeffectiveinterestratemethod.
Foreign currency denominated notes, are translated to A$ at the applicable exchange rate at year end with the gain or loss attributable toexchangeratemovementsrecognisedinprofitorlossintheStatementofComprehensiveIncome.Priorto1May2016,theUSprivateplacementnotes(USPPs)weredesignatedinhedgerelationshipswithCrossCurrencySwaps.TheGroupelectedtodiscontinuethesehedgerelationshipsfrom1May2016,refertoNote6(b)forfurtherdetails.ThefollowingtableoutlinestheGroup’sinterestbearingliabilitiesatbalancedate:
30-Jun-16$m
30-Jun-15$m
Current liabilities UnsecuredA$MediumTermNotes(A$MTNs) - 440.0US$USPPs 193.1 648.9Convertible notes - 270.4Deferred debt costs1 - (1.9)Total current liabilities 193.1 1,357.4Non-current liabilitiesSecuredA$ MTNs 323.2 328.7UnsecuredBank debt 1,696.3 2,380.9A$ MTNs 250.0 250.0GBPEuropeanMediumTermNotes(EMTNs) 619.9 -US$USPPs 877.6 -Deferred debt costs1 (17.9) (13.9)Total non-current liabilities 3,749.1 2,945.7Total interest bearing liabilities 3,942.2 4,303.1
1. Deferreddebtcostscomprisetheunamortisedvalueofborrowingcostsonestablishmentorrefinanceofdebtfacilities.ThesecostsaredeferredontheBalanceSheet andamortisedtoborrowingcostsintheStatementofComprehensiveIncome.
(a) Facilities availableThe maturity of the Group’s total available facilities by type excluding fair value adjustments1aredetailedinthetablebelow:
Facility typeLess than
1 year1 to 3 years
3 to 5 years
5 to 10 years
Greater than 10
years30-Jun-16 Total $m
30-Jun-15 Total $m
Bank debt2 - 1,592.3 1,300.0 - - 2,892.3 5,097.3US$USPPs 177.6 38.0 - 407.9 367.4 990.9 564.2A$ MTNs - - 550.0 - - 550.0 990.0GBP EMTNs - - - 655.2 - 655.2 -Convertible Notes - - - - - - 253.4Total facilities available 177.6 1,630.3 1,850.0 1,063.1 367.4 5,088.4 6,904.9Amountdrawn(refernote7(a)) (3,892.4) (4,188.5)Total undrawn facilities 1,196.0 2,716.4
1. ThecarryingamountoftheUS$USPPs,GBPEMTNsandsecuredA$MTNsintheBalanceSheetincludesadjustmentsforfairvalueitemsandforeignexchangetranslationof$67.7million(30June2015:$130.4million).Thesefairvalueadjustmentsareexcludedfromthecalculationoftotalfacilitiesavailableandamountsdrawn.Additionally,deferreddebtcostsof$17.9million(30June2015:$15.8million)arenotreflectedintheamountdrawn.
2.Totaldebtfacilitiesisreducedbybankguaranteesof$17.7million(30June2015:$2.7million)drawnagainstbankdebtfacilities.
CAPITAL STRUCTURE AND FINANCIAL RISK MANAGEMENT
88|Vicinity Centres AnnualReport2016
For
per
sona
l use
onl
y
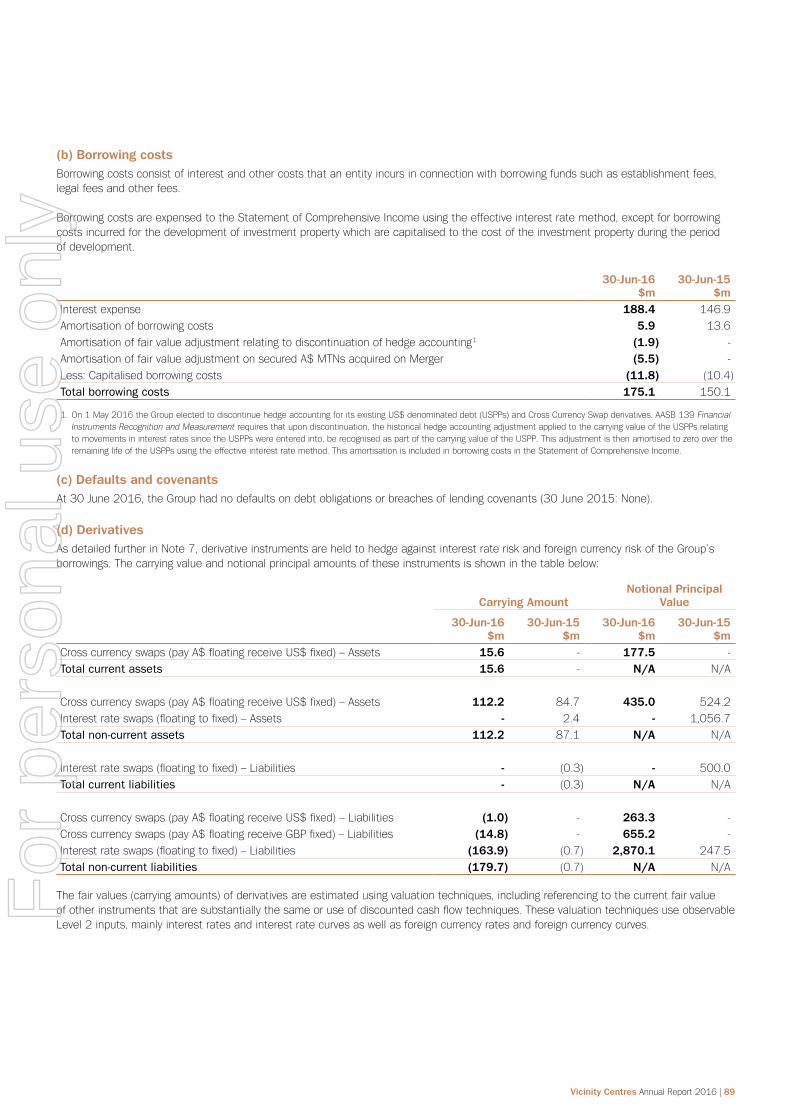
(b) Borrowing costsBorrowing costs consist of interest and other costs that an entity incurs in connection with borrowing funds such as establishment fees, legalfeesandotherfees.
BorrowingcostsareexpensedtotheStatementofComprehensiveIncomeusingtheeffectiveinterestratemethod,exceptforborrowingcosts incurred for the development of investment property which are capitalised to the cost of the investment property during the period ofdevelopment.
30-Jun-16$m
30-Jun-15$m
Interestexpense 188.4 146.9Amortisation of borrowing costs 5.9 13.6Amortisation of fair value adjustment relating to discontinuation of hedge accounting1 (1.9) -AmortisationoffairvalueadjustmentonsecuredA$MTNsacquiredonMerger (5.5) -Less:Capitalisedborrowingcosts (11.8) (10.4)Total borrowing costs 175.1 150.1
1. On1May2016theGroupelectedtodiscontinuehedgeaccountingforitsexistingUS$denominateddebt(USPPs)andCrossCurrencySwapderivatives.AASB139Financial Instruments Recognition and Measurementrequiresthatupondiscontinuation,thehistoricalhedgeaccountingadjustmentappliedtothecarryingvalueoftheUSPPsrelatingtomovementsininterestratessincetheUSPPswereenteredinto,berecognisedaspartofthecarryingvalueoftheUSPP.ThisadjustmentisthenamortisedtozeroovertheremaininglifeoftheUSPPsusingtheeffectiveinterestratemethod.ThisamortisationisincludedinborrowingcostsintheStatementofComprehensiveIncome.
(c) Defaults and covenantsAt30June2016,theGrouphadnodefaultsondebtobligationsorbreachesoflendingcovenants(30June2015:None).
(d) DerivativesAsdetailedfurtherinNote7,derivativeinstrumentsareheldtohedgeagainstinterestrateriskandforeigncurrencyriskoftheGroup’sborrowings.Thecarryingvalueandnotionalprincipalamountsoftheseinstrumentsisshowninthetablebelow:
Carrying AmountNotional Principal
Value
30-Jun-16$m
30-Jun-15$m
30-Jun-16$m
30-Jun-15$m
Crosscurrencyswaps(payA$floatingreceiveUS$fixed)–Assets 15.6 - 177.5 -Total current assets 15.6 - N/A N/A
Crosscurrencyswaps(payA$floatingreceiveUS$fixed)–Assets 112.2 84.7 435.0 524.2Interestrateswaps(floatingtofixed)–Assets - 2.4 - 1,056.7Total non-current assets 112.2 87.1 N/A N/A
Interestrateswaps(floatingtofixed)–Liabilities - (0.3) - 500.0Total current liabilities - (0.3) N/A N/A
Crosscurrencyswaps(payA$floatingreceiveUS$fixed)–Liabilities (1.0) - 263.3 -Crosscurrencyswaps(payA$floatingreceiveGBPfixed)–Liabilities (14.8) - 655.2 -Interestrateswaps(floatingtofixed)–Liabilities (163.9) (0.7) 2,870.1 247.5Total non-current liabilities (179.7) (0.7) N/A N/A
Thefairvalues(carryingamounts)ofderivativesareestimatedusingvaluationtechniques,includingreferencingtothecurrentfairvalue ofotherinstrumentsthataresubstantiallythesameoruseofdiscountedcashflowtechniques.ThesevaluationtechniquesuseobservableLevel2inputs,mainlyinterestratesandinterestratecurvesaswellasforeigncurrencyratesandforeigncurrencycurves.
Vicinity Centres AnnualReport2016|89
For
per
sona
l use
onl
y

7. Capital and financial risk managementTheGroup’streasuryteamisresponsibleforthedaytodaymanagementoftheGroup’scapitalrequirementsandfinancialriskmanagement.TheseactivitiesareoverseenbytheCapitalManagementCommittee(CMC),whichoperatesundertheCMCandtreasurypolicies,whichareendorsedbytheAuditCommitteeandapprovedbytheBoardofDirectors.TheoverallobjectivesoftheCMCareto:
• EnsurethattheGrouphasfundsavailabletomeetallfinancialobligations,workingcapitalandcommittedcapitalexpenditurerequirements;
• MonitorandensurecompliancewithallrelevantfinancialcovenantsundertheGroup’sdebtfacilities;
• ReducetheimpactofadverseinterestrateorforeignexchangemovementsontheGroupusingapprovedfinancialriskmanagementinstruments; and
• Diversifybankingcounterpartiestomitigatecounterpartycreditrisk.
ThekeyfinancialrisksmonitoredbytheCMCandstrategiesadoptedbytheGrouptoassistinachievingtheseobjectivesaresetout inthesectionsbelow:
Risk Primary source(s) Explanation and risk management strategy DetailsInterest Rate Risk
Floating rate borrowings
InterestrateriskrepresentsthepotentialforchangesinmarketinterestratestoimpactthetotalinterestexpensefortheGroup.
Floating-to-fixedinterestrateswaps1areusedtomanagethisrisk.
Underthetermsoftheseswaps,theGroupagreestoexchange,atspecifiedintervals,amountsbasedonthedifferencebetweenthefixedcontractinterestrateandthefloatingmarketinterestratecalculatedbyreferencetoanagreednotionalprincipalamount.
Note7(a)
Foreign Exchange Rate Risk
Foreign denominated interest bearing liabilities(USPPs andEMTNs)
Foreignexchangeriskreferstotheriskthatvalueorcashflowsarisingfromafinancialcommitment,assetorliability,denominatedinaforeigncurrency,willfluctuatedue tochangesinaforeignexchangerate.
This risk is managed through the use of cross-currency swaps1 which swap the foreign currencyinterestpaymentsintoAustralianDollarsandfixtheexchangeratefortheconversionoftheprincipalrepayment.
Note7(b)
Liquidity Risk
Interestbearingliabilities
LiquidityriskrepresentstheriskthattheGroupwillbeunabletomeetfinancialobligationsastheyfalldue.
Tomanagethisrisk,sufficientcapacityundertheGroup’sfinancingfacilitiesismaintainedto meet the needs arising from the Board approved short-term and medium-term business strategy.Thisisachievedthroughsecuringandmaintainingfundingfromarangeofsources(e.g.Banks,Australianandforeigndebtcapitalmarkets),maintainingsufficientundrawn debt capacity and cash balances and managing the amount of borrowings thatmatureorfacilitiesthatexpireinanyoneyear.
Note7(c)
Credit Risk
Tenant receivables, derivative counterparties and bank deposits
Creditriskistheriskthatatenantorcounterpartytoafinancialinstrumentfailsto meettheirfinancialobligationstotheGroup.
To mitigate tenant credit risk an assessment is performed taking into consideration the financialbackgroundofthetenantandtheamountofanyguaranteeorbankguaranteeprovidedascollateralunderthelease.
To mitigate credit risk in relation to derivative counterparties and bank deposits, theGrouphaspoliciestolimitexposuretoanyonefinancialinstitution.
The maximum exposure to credit risk at the balance date is the carrying amount oftheGroup’sfinancialassets.
Note9,
Note6(d)
1. DerivativefinancialinstrumentssuchasinterestrateswapsandcrosscurrencyswapsarenotpermittedtobeenteredintoforspeculativepurposesundertheGroup’s hedgingpolicy.Limitsareinplaceinrespectoftheirusetohedgecashflowssubjecttointerestrateandforeignexchangerisk.Noneofthesederivativesarecurrently inhedgerelationships.
CAPITAL STRUCTURE AND FINANCIAL RISK MANAGEMENT continued
90|Vicinity Centres AnnualReport2016
For
per
sona
l use
onl
y

(a) Interest rate riskAsatthebalancedate,theGrouphadthefollowingexposuretocashflowinterestraterisk:
30-Jun-16 $m
30-Jun-15 $m
Totalinterestbearingliabilities(Note6) 3,942.2 4,303.1Add:Deferreddebtcosts 17.9 15.8Add:FairvalueandforeignexchangeadjustmentstoGBPEMTNs 35.3 -Less:FairvalueandforeignexchangeadjustmentstoUS$USPPs (79.9) (84.7)Less:FairvalueadjustmentonsecuredA$MTNsacquiredonMerger (23.1) (28.7)Less:Fairvalueadjustmentonconvertiblenotes - (17.0)Total drawn debt 3,892.4 4,188.5Less:Fixedrateborrowings (665.0) (1,283.4)Net variable rate borrowings exposed to cash flow interest rate risk at 30 June 3,227.4 2,905.1Less:Notionalprincipalofoutstandinginterestrateswapcontracts (2,870.1) (1,804.2)Representative net variable rate borrowings exposed to cash flow interest rate risk 357.3 1,100.9Hedged ratio1 91% 74%
1. Calculatedastotaldrawndebtlessrepresentativenetvariablerateborrowingsexposedtocashflowinterestrateriskdividedbytotaldrawndebt.
Sensitivity to interest ratesAshiftintheforwardinterestratecurveof+/-25bps,assumingthenetexposuretocashflowinterestrateriskasat30June2016remainsunchangedforthenext12months,wouldimpacttheGroup’scashinterestcostforthenext12monthsby$0.9million (30June2015+/-25bps:$2.8million).
ThefairvaluesofderivativesusedbytheGrouparealsosensitivetointerestrates.Ashiftintheforwardinterestratecurveof+/-25bps,assumingthenetexposuretofairvalueinterestrateriskasat30June2016remainsunchangedforthenext12months,wouldimpactnetprofitandequityforthenext12monthsby$10.0million(30June2015+/-25bps:$14.2million).
Thissensitivityanalysisshouldnotbeconsideredaprojection.
(b) Foreign exchange rate riskAt30June2016,theGrouphasthefollowingnetexposuretoforeigncurrencytranslationriskarisingfromUS$andGBP denominatedborrowings:
US$ Borrowings30-Jun-16
US$ $m30-Jun-15
US$ $mTotalinterestbearingliabilitiesinUS$ 693.0 449.0Less:Notionalvalueofcrosscurrencyswaps(payA$receiveUS$) (693.0) (449.0)Net exposure to US$ translation risk - -Hedge ratio for interest bearing liability in US$ 100% 100%
GBP Borrowings30-Jun-16
GBP $m30-Jun-15
GBP $mTotal interest bearing liabilities in GBP 350.0 N/ALess:Notionalvalueofcrosscurrencyswaps(payA$receiveGBP) (350.0) N/ANet exposure to GBP translation risk - N/AHedge ratio for interest bearing liability in GBP 100% N/A
ThecarryingvaluesofdebtandderivativesheldbytheGrouparealsosensitivetoforeignexchangerates.Ashiftintheforwardexchangeratecurveof+/-5cents,assumingthenetexposuretofairvalueexchangerateriskasat30June2016remainsunchangedforthenext12months,wouldimpactnetprofitandequityforthenext12monthsby$27.0million(30June2015+/-5cents:nil).
Vicinity Centres AnnualReport2016|91
For
per
sona
l use
onl
y

7. Capital and financial risk management continued(c) Liquidity riskThecontractualmaturityofinterestbearingliabilitiesandtheinterestpaymentprofileisshownbelow.Estimatedinterestandprincipalpaymentsarecalculatedbasedontheforwardinterestandforeignexchangeratesprevailingatyearend.Timingofpaymentsisbased oncurrentcontractualobligationswhichmaynotaligntotheclassificationsofcurrentandnon-currentliabilities.RefertoNote10fordetailsontradeandotherliabilitiesthatarenotincludedinthetablebelow.
30 June 2016
Less than1 year
$m
1 to 3 years
$m
Greater than
3 years$m
Total$m
Carrying amount
$mBank debt - 1,539.3 157.0 1,696.3 1,696.3 A$ AMTNs - - 550.0 550.0 573.2 US$USPPs 189.8 41.5 770.8 1,002.1 1,070.7 GBP EMTNs - - 720.4 720.4 619.9 Estimated interest payments on borrowings 139.2 243.6 486.0 868.8 N/AEstimatednetinterestrateswapcashoutflow 17.6 62.2 104.2 184.0 163.9 Estimatedgrosscrosscurrencyswapcashoutflows 235.7 142.5 1,745.8 2,124.0 N/AEstimatedgrosscrosscurrencyswapcash(inflows) (251.0) (145.2) (1,889.9) (2,286.1) (112.0)Total contractual outflows 331.3 1,883.9 2,644.3 4,859.5 4,012.0
30 June 2015
Less than 1 year
$m
1 to 3 years
$m
Greater than
3 years$m
Total $m
Carrying amount
$mBank debt - 2,380.9 - 2,380.9 2,380.9A$ AMTNs 440.0 - 550.0 990.0 1,018.7US$USPPs - 177.6 386.7 564.3 648.9Convertible notes 270.4 - - 270.4 270.4Estimated interest payments on borrowings 148.1 168.2 195.3 511.6 N/AEstimatednetinterestrateswapcashoutflow/(inflow) 2.2 (0.1) (3.2) (1.1) (1.4)Estimatedgrosscrosscurrencyswapcashoutflows 17.0 207.6 500.8 725.4 N/AEstimatedgrosscrosscurrencyswapcash(inflows) (25.8) (228.9) (597.3) (852.0) (84.7)Total contractual outflows 851.9 2,705.3 1,032.3 4,589.5 4,232.8
(d) Fair value of borrowings Asat30June2016,theGroup’sdebthasafairvalueof$4,081.6million(30June2015:$4,355.7million).
Thedifferencebetweenthecarryingamountandfairvalueisduetofixedrateborrowingsheld.Thefairvalueoffixedrateborrowingsiscalculatedbydiscountingthecontractualcashflowsusingtheyieldtomaturityorprevailingmarketdiscountratesformarketfixedinterestdebtinstruments,withsimilarterms,maturityandcreditquality.Hadthefixeddebtbeenrecognisedatfairvalue,theseinputswouldhavebeenclassifiedasLevel2underthefairvaluehierarchyasthemarketdiscountratesusedareindirectlyobservable.
CAPITAL STRUCTURE AND FINANCIAL RISK MANAGEMENT continued
92|Vicinity Centres AnnualReport2016
For
per
sona
l use
onl
y

(e) Capital risk managementTheGroupmaintainsastrongandconservativecapitalstructurewithappropriateliquidity,astrongbalancesheetandadiversifieddebtprofile(bysourceandtenor).TheGrouphaslong-termcreditratingsof‘A-’fromStandard&Poor’sand‘A2’fromMoody’sInvestorsService.
Keymetricsmonitoredarebankfacilitiestodebtcapitalmarketsdebtandgearingratios.Theseareshowninthetablesbelow:
Bank facilities to capital market debt
Facility type30-Jun-16
$m30-Jun-15
$mTotal bank facilities1 2,910.0 5,100.0Total capital market debt 2,196.1 1,807.6Total debt facilities available to the Group 5,106.1 6,907.6Bank facilities as a proportion of total debt facilities 57% 74%Capital market debt as a proportion of total debt facilities 43% 26%
1. Includesbankguaranteefacilitiesof$17.7million(30June2015:$2.7million).
Gearing30-Jun-16 30-Jun-15
Drawndebtnetofcash($m) 3,839.6 4,081.1Totaltangibleassetsexcludingcash,financeleaseassetsandderivativefinancialassets($m) 14,852.3 14,552.0Gearing ratio (target range of 25.0% to 35.0%) 25.9% 28.0%
8. Contributed equity AnordinarystapledsecuritycomprisesoneshareintheCompanyandoneunitintheTrust.OrdinarystapledsecuritiesentitletheholdertoparticipateindistributionsandtheproceedsonwindingupoftheGroupinproportiontothenumberofsecuritiesheld.Ordinarystapledsecuritiesareclassifiedasequity.
Incrementalcostsdirectlyattributabletotheissueofnewstapledsecuritiesareshowninequityasadeduction,netoftax,fromtheproceeds.Incrementalcostsdirectlyattributabletotheissueofnewstapledsecuritiesfortheacquisitionofabusinessarenotincluded inthecostoftheacquisitionaspartofthepurchaseconsideration.
ThenumberofordinarysecuritiesoftheGroupisshowninthetablebelow.Allordinarysecuritiesarefullypaid.
30-Jun-16Number (m)
30-Jun-15Number (m)
30-Jun-16$m
30-Jun-15$m
Stapled securities on issue at beginning of the year 3,958.6 2,482.3 8,493.2 4,139.0Issueofstapledsecurities–DividendReinvestmentPlan - 48.5 - 121.8Issueofstapledsecurities–EmployeeShareAcquisitionPlan - 0.2 - -Stapled securities issued to effect the Merger - 1,427.6 - 4,232.4Total stapled securities on issue at the end of the year 3,958.6 3,958.6 8,493.2 8,493.2
Vicinity Centres AnnualReport2016|93
For
per
sona
l use
onl
y

9. Receivables and other assetsTradeandotherreceivablesarerecognisedinitiallyatfairvalueandsubsequentlymeasuredatamortisedcostusingtheeffectiveinterestmethod,lessanyprovisionforimpairment.
Debtsthatareindividuallyknowntobeuncollectablearewrittenoffwhenidentified.Anallowanceaccount(provisionfordoubtfuldebts) is used when there is objective evidence that the Group may not be able to collect all amounts due according to the original terms of thereceivables.
Note30-Jun-16
$m30-Jun-15
$mTrade debtors 17.4 25.3Accrued income 22.7 23.3Performance fees accrual - 8.0Receivables from strategic partnerships 25.2 11.7Distribution receivable from joint ventures and associates 5.1 8.2Less:Provisionfordoubtfuldebts (4.6) (6.9)Total receivables 65.8 69.6
Prepayments 7.5 9.9Levies 13.4 13.5Tenant security deposits held 1.9 8.9Other 16.9 21.6Total current receivables and other assets 105.5 123.5
LoantoTuggeranongTownCentreTrust 5(c) 117.4 117.4Investmentinrelatedparty 2.7 2.6Total non-current receivables and other assets 120.1 120.0
Risk of tenant defaultTenantdebtorbalancesarecontinuallymonitoredwiththeGroupconsideringreceivablesthathavenotbeenpaidfor30daysaftertheinvoicedateaspastdue.Promptrecoveryofthesebalancesissought.Wherethereareindicatorsthatfullrecoverywillnotoccur,provisionismadefortheseamounts.
Ofthe$70.4milliontradeandrelatedpartyreceivablesoutstanding(30June2015:$76.5million),$10.6million,whichrepresentsapproximately0.79%oftotalcombinedrevenue,isconsideredpastduebutnotimpairedat30June2016(30June2015:$7.2million).Theserelatetoanumberofindividualcustomersforwhomthereisnorecenthistoryofdefault.
TheGrouphasrecognisedalossof$3.6million(30June2015:$1.8million)inrespectofimpairedtradereceivablesduringtheyear. Thelosshasbeenincludedin“otherexpensesfromordinaryactivities”intheStatementofComprehensiveIncome.
The Group does not hold any collateral in relation to trade or other receivables, other than security deposits or bank guarantees as is usual inleasingagreements.
Themaximumexposuretocreditriskatthebalancedateisthecarryingamountofeachclassofreceivablesoutlinedabove.
WORKING CAPITAL
94|Vicinity Centres AnnualReport2016
For
per
sona
l use
onl
y

10. Payables and other financial liabilitiesPayablesandotherfinancialliabilitiesrepresentliabilitiesforgoodsandservicesprovidedtotheGrouppriortotheendofthefinancialyearandthatareunpaid.Theamountsareunsecuredandareusuallypaidwithin30daysofrecognition.Tradeandotherpayablesarecarriedatamortisedcostandarenotdiscountedduetotheirshort-termnature.
30-Jun-16$m
30-Jun-15$m
CurrentTrade payables and accrued expenses 70.4 80.6Performance fees payable - 8.0Rents received in advance 27.1 26.1Accrued interest expense 16.7 13.6Accrued capital expenditure 62.0 51.4Security deposits 1.3 9.5Otherfinancialliability–BentonsSquare1 38.6 -Finance lease liabilities2 13.8 -Other 7.9 10.3Total current liabilities 237.8 199.5
Non-CurrentOtherfinancialliability–BentonsSquare1 - 38.9Finance lease liabilities2 200.4 -Total non-current liabilities 200.4 38.9
1.Referfootnote11inNote4(d).
2.ReferNote21(c).
At30June2016,thecarryingvalueofpayablesandotherfinancialliabilitiesapproximatedtheirfairvalue.Allcurrentpayables,excludingfinanceleaseliabilities,areexpectedtobedueandpayablewithinthenextthreemonths.
Vicinity Centres AnnualReport2016|95
For
per
sona
l use
onl
y

WORKING CAPITAL continued
11. ProvisionsProvisionscompriseliabilitiesarisingfromemployeebenefitssuchasannualleaveandlongserviceleave,aswellasprovisionsforstampdutyforwhichtheamountortimingofthesettlementisuncertainasitisoutsidethecontroloftheGroup.
Short-termemployeebenefitssuchasannualleaveexpectedtobesettledwithin12monthsofthereportingdatearerecognisedasaliabilitywhentheemployeehasrenderedtheserviceandmeasuredastheundiscountedamountexpectedtobepaidinexchangeforthatservice.
Otherlong-termemployeebenefitssuchaslongserviceleavearerecognisedandmeasuredusinganactuarialtechnique,theprojectedunitcreditmethod,tomakeareliableestimateoftheultimatecosttotheentityofthebenefitthatemployeeshaveearnedinreturnfortheirserviceinthecurrentandpriorperiods.
Wheretheprovisionsarenotexpectedtobesettledwhollybefore12monthsaftertheendoftheannualreportingperiodinwhichtheobligation arises, the liability is discounted to present value based on management’s best estimate of the timing of settlement and the expenditurerequiredtosettletheliabilityatthereportingdate.Thediscountratesusedtodeterminethepresentvaluearedeterminedbyreferencetomarketyieldsattheendofthereportingperiodattachingtohighqualitycorporatebondswithtermstomaturityandcurrenciesthatmatch,ascloselyaspossible,theestimatedfuturecashoutflowsoftherelatedemployeeliability.
30-Jun-16$m
30-Jun-15$m
Current employee entitlements 55.8 60.8Other current provisions 30.0 97.1Total current provisions 85.8 157.9
Non-current employee entitlements 2.3 5.4Total non-current provisions 2.3 5.4
Themovementsfortheyearinothercurrentprovisionsareasfollows:
30-Jun-15$m
Arising during the
yearPaid during
the yearOther
movements30-Jun-16
$mStamp duty 74.9 22.2 (83.4) (4.7) 9.0Levies 13.5 13.4 (13.5) - 13.4Other 8.7 - - (1.1) 7.6Total current provisions 97.1 35.6 (96.9) (5.8) 30.0
96|Vicinity Centres AnnualReport2016
For
per
sona
l use
onl
y

REMUNERATION
12. Key management personnelTheremunerationoftheKeyManagementPersonnel(KMP)oftheGroupisdisclosedintheRemunerationReport.Thecompensation ofKMPincludedintheGroupfinancialstatementscomprises:
30-Jun-16$’000
30-Jun-151
$’000Short-termemployeebenefits–ExecutiveKMP 5,323 8,991Short-termemployeebenefits–Non-executiveKMP 2,114 1,872Terminationbenefits 1,092 2,613Share-based payments 1,995 2,384Post-employmentbenefits 225 225Otherlong-termemployeebenefits 736 64Total remuneration of KMP of the Group 11,485 16,149
1. TheremunerationofKMPincludedasanexpensefortheyearended30June2015comprisedtheremunerationoftheNovionKMPuptothedateofMerger(11June2015)plustheremunerationoftheVicinityCentresGroupKMPfromthedateoftheMergerto30June2015.
13. EmployeesEmployeebenefitsexpensesconsistof:
30-Jun-16$m
30-Jun-151
$mSalaries and wages 97.6 64.3Share-based payments expenses 5.3 2.4Otheremployeebenefitsexpenses 4.0 10.7Total employee benefit expenses 106.9 77.4
1. Asdescribedinthe“Aboutthisreport–MergerofFederationCentresandNovionPropertyGroup”sectionintheNotestotheFinancialStatements,thecomparativeinformationfortheyearended30June2015representsresultsfor12monthsofNovionand1monthofFederation.
Vicinity Centres AnnualReport2016|97
For
per
sona
l use
onl
y

REMUNERATION continued
14. Share based paymentsTheGroupremunerateseligibleemployeesthroughthreesecuritybasedcompensationplans.Theseplansaredesignedtoalignexecutives’andemployees’interestswiththoseofsecurityholdersbyincentivisingparticipantstodeliverlong-termshareholderreturns.Asummary ofeachplanisdescribedbelow:
Plan DescriptionPerformance Reward Payment Long (PRPL)
ExecutivesandseniormanagementaregrantedperformancerightstoacquireVicinitysecuritiesfornilconsideration.Theserightsvestwhencertainhurdlerequirements,whicharesetwhentherightsaregranted,aremet.Achievementofthehurdlerequirementsareassessedthreeyearsaftertherightsaregranted(thevestingperiod).ThedetailedhurdlerequirementsaresetoutinNote14(a).
Performance Reward Payment Short (PRPS)
PRPS provides certain executives and senior management with the opportunity to receive an annual, performance-basedincentivepayment,whenacombinationofshort-termGroupfinancialandindividualperformanceobjectivesisachieved.CertainexecutivesandseniormanagementarethenrequiredtodeferaportionoftheirannualPRPSpaymentintoequityforaperiodof12to24months.TheamountsdeferredwillbecomeavailabletotheemployeeattheendofthedeferralperiodprovidedtheyremainemployedbytheGroup.
$1,000 Employee Plan
$1,000worthofVicinitysecuritiesaregrantedannuallytoeligibleemployeesfornilconsideration.SecuritiesgrantedundertheplanaresubjecttoathreeyeartradingrestrictionunlesstheemployeeceasestobeemployedbytheGroup.
FurtherdetailsrelatingtothePRPLandPRPSplansareincludedinNote14(a).
Thefollowingexpenseswererecognisedrelatingtothesharebasedcompensationplans:
30-Jun-16$m
30-Jun-15$m
PerformanceRewardPaymentLong 2.6 4.6Performance Reward Payment Short 1.7 0.5$1,000EmployeePlan1 1.0 0.6Total share based payment expense 5.3 5.7Share based payment expense included in employee expenses 5.3 2.4Share based payment expense included in transaction costs2 - 3.3
1. Atotalof360,828securitiesweregrantedunderthe$1,000EmployeePlanduringtheyear(30June2015:271,990).
2. AsaresultoftheMergercertainsharebasedpaymentswerevestedandsettledincash.TheexpensethatresultedfromtheMergerwasincludedwithintransactioncosts.
ThemovementinthenumberofPRPLperformancerightswasasfollows:
30-Jun-16Number
30-Jun-15Number
Opening balance at the beginning of the year 5,913,252 -Granted 2,918,865 2,535,110Forfeited and lapsed (1,164,940) (1,060,082)Vested (3,282,023) (1,475,028)FederationperformancerightsacquiredasaresultoftheMerger - 5,913,252Outstanding at the end of the year 4,385,154 5,913,252
Exercisable at the end of the year Nil NilWeightedaverageremainingcontractuallife 2.28 years 2.46years
98|Vicinity Centres AnnualReport2016
For
per
sona
l use
onl
y

(a) Plan details
Performance Reward Payment Long conditionsSalientfeaturesofeachPRPLperformancerightcurrentlyonissueare:
Grant year FY16 FY14 and FY15Performance periods 3years 3yearsHolding lock 12monthsaftertheendoftheperformanceperiod 12monthsaftertheendoftheperformanceperiodPerformance hurdles1 50%RelativeTotalSecurityholderReturn(TSR)/
50%TotalReturn(TR)40%TSR/
60%underlyingEPSandReturnonEquityTSR comparator Group S&P/ASX200A-REITIndexexcluding
WestfieldCorporationS&P/ASX200A-REITIndexexcluding
WestfieldCorporationVesting scale – TSR Percentile ranking Percentage vesting Percentile ranking Percentage vesting
≤51st 0% ≤51st 0%Between51stand75th 51%to100% Between51stand75th 51%to100%
≥75th 100% ≥75th 100%Vesting scale – Total Return2 (FY16)
Target total return Percentage vesting Target achieved Percentage vesting9.0% 0% 95% 25%
Underlying EPS / Return on Equity2 (FY15)
Between9.0%to9.5% Between50%and100% Between95%and105% Between25%and99%≥9.5% 100% ≥105% 100%
1.ForthepurposesofPlanassessment,eachperformancemeasureoperatesindependentlyoftheother.
2.RefertotheRemunerationReportforfurtherinformationonhowTotalReturnandReturnonEquityarecalculated.
Performance Reward Payment Long – Performance Rights ValuationThefairvalueofperformancerightsgrantedunderthePRPLisestimatedatthedateofgrantusingaMonteCarloSimulationModeltakingintoaccountthetermsandconditionsuponwhichtheperformancerightsweregranted.Thetotalgrantdatefairvalueisexpensedoverthevestingperiod(threeyears)andisadjustedtoreflecttheactualnumberofrightsforwhichtherelatedserviceandnon-marketvestingconditionsareexpectedtobemet.
InvaluingtheperformancerightsissuedinFY16,anumberofassumptionswereusedasshowninthetablebelow:
Assumption Basis FY16 FY15Distribution yield Expectedannualdistributionrateoverthenextthreeyears. 6.0% 6.6%Risk-free interest rate Threeyeargovernmentbondyieldsasatgrantdate. 2.1% 2.6%VolatilitycorrelationbetweenVCX and other comparator companies
Analysisofhistoricaltotalsecurityreturnvolatility(i.e.standarddeviation)andtheimpliedvolatilitiesofexchangetradedoptions. 35.0% 45.0%
Volatility of Vicinity securities Asabove. 23.0% 23.0%
TSRofVCXsecuritiesPerformance between the start date of the testing period and thevaluationdate.
(5.1)% 9.8%
Holdinglockadjustment Adjustmentfor12monthholdinglockperiod. 7.5% 7.5%Security price at measurement date ClosingVCXsecuritiespriceatgrantdate. $2.75 $2.74Fair value per right – TR $2.19 $2.14Fair value per right – TSR $1.04 $1.20
Performance Reward Payment ShortThenumberofsecuritiesgrantedanddeferredunderthePRPSplanduringtheyearended30June2016relatingtoincentivepaymentsearnedintheyearended30June2015was620,482(30June2015:nil)andthefairvalueofthesesecuritieswas$2.79persecurity(30June2015:nil)determinedbasedonthesecuritypriceofVicinityatthegrantdateof1September2015.
Vicinity Centres AnnualReport2016|99
For
per
sona
l use
onl
y

15. Intangible assets(a) BackgroundIntangibleassetbalancesrelatetothevalueofexternalmanagementcontractsandgoodwill.
External management contractsExternalmanagementcontractsreflecttherighttoprovideassetandfundsmanagementservicestoexternalpartiesinaccordancewithmanagementagreements.TheywererecognisedattheirfairvalueatboththedateofNovion’sinternalisationofmanagementfromtheCommonwealthBankofAustralia(on24March2014)andtheMerger(on11June2015).Thevalueofthesecontractsisallocated tothestrategicpartnershipscash-generatingunit(CGU)whichisalsoanoperatingandreportablesegment.
Finite lifeExternalmanagementcontractsthatareconsideredtohaveafinitelifeareamortisedonastraight-linebasisdependingonthetimingoftheprojectedcashflowsunderthemanagementagreements.Theamortisationperiodisbasedonterminationdatesreflectedinthemanagementagreements(withconsiderationgiventorenewals).TheGroupamortisesintangibleassetswithafinitelifeusingthestraight-linemethodoverperiodsrangingfrom1.5to9years.
Indefinite lifeExternal management contracts, primarily those associated with strategic partners who co-own assets with the Group and that have managementagreementswithoutterminationdates,areconsideredtohaveindefiniteusefullivesandarethereforenotamortised.
GoodwillGoodwill relates to the internalised management of the owned properties and the portfolio premium associated with being a large listedRealEstateInvestmentTrust(REIT).ThisbalanceisallocatedtothePropertyInvestmentCGUwhichisalsoanoperatingandreportablesegment.
Portfolio premiumThe ‘portfolio premium’ that was recognised upon Merger relates to value elements not captured in the underlying fair value of the individualproperties.Thisportfoliopremiumrepresents,amongstotheritems,developmentpotential,liquidity,diversifiedportfoliobenefitsandtheGroup’sabilitytoobtainandattractdebtfunding.
Internal management contractsInternalmanagementcontractsrelatetotheincrementalvaluecreatedinrelationtotheGroup’sinvestmentpropertiesbyreplacingpropertymanagementfeeswithaninternalisedcoststructure(assetmanagementbusiness)i.e.thevalueofmanagementcontractsrelatingtointernallyownedassets.
Areconciliationofthemovementsinthevalueofintangibleassetsforthecurrentandprioryearisshownbelow:
Goodwill$m
Indefinite life management
contracts$m
Finite life management
contracts$m
Total$m
Opening carrying value 1 July 2014 254.5 97.1 12.3 363.9Arising from business combinations 458.2 72.6 - 530.8Transfer between categories - (5.5) 5.5 -Amortisation charge - - (3.3) (3.3)Carrying value 30 June 2015 712.7 164.2 14.5 891.4Impairment1 and amortisation charge (295.0) - (3.3) (298.3)Arisingfromacquisitions 9.3 - - 9.3Carrying value 30 June 2016 427.0 164.2 11.2 602.4
1. Theimpairmentchargeof$295.0milliontogoodwillwasrecordedat31December2015basedontheassessmentofrecoverableamountperformedatthattime. RefertoNote21(b)forfurtherdetailsofthisassessment.
OTHER DISCLOSURES
100|Vicinity Centres AnnualReport2016
For
per
sona
l use
onl
y

(b) Impairment testingTheGroupperformsimpairmenttestingforintangibleassetsonanannualbasis(at30Juneeachyear)orwhenthereareotherindicatorsofimpairment.SummarisedbelowaretheresultsoftheGroup’sannualimpairmenttestingprocessperformedat30June2016.
Forfurtherdetailsonthe$295.0millionimpairmentrecordedat31December2015refertoNote21(b).
External management contractsAsdescribedinNote15(a),externalmanagementcontractsareallocatedtothestrategicpartnershipsCGUforthepurposesofimpairmenttesting.TherecoverableamountofthestrategicpartnershipsCGUisdeterminedusingafairvaluelesscostofdisposal(fairvalue)approach.Thisisperformedusingadiscountedcashflow(DCF)valuationoftheexternalassetandfundsmanagementbusinesswhichisbasedonthefollowingkeyassumptions:
Key assumption 30-Jun-16 30-Jun-15CashflowsforforecastEarningsBeforeIncomeTax(EBIT)onmanagementfees 5 years 5yearsTerminal growth rates 2.3% – 2.5% 2.5%Post tax discount rate range 7.64% – 8.14% 7.75%–8.25%
Sensitivities to these assumptions have been tested and the Group has determined that no reasonably possible changes would give risetoimpairmentat30June2016.Thefuturedisposalofinterestsindirectlyownedorequityaccountedinvestmentpropertyassets,wheretheGroupalsogivesupanyfuturerightsunderexistingfinitelifeorindefinitelifecontracts,mayleadtothederecognitionoftheassociated carrying values of these management contracts, as the Group may no longer be entitled to the management fees under disposalarrangements.
GoodwillAsdescribedinNote15(a),GoodwillisallocatedtoPropertyInvestmentCGUforthepurposesofimpairmenttesting.TherecoverableamountofthePropertyInvestmentCGUisdeterminedusingafairvalueapproach.InordertodeterminethefairvalueofthePropertyInvestmentCGUasawholeanEnterpriseValue(EV)approachhasbeenadopted.ThisapproachestimatesfairvaluebasedonaDCFanalysisusingunderlyingearningsadjustedforinterestexpense,cashflowsfromtheStrategicPartnershipsCGUandcapitalexpenditurerequirements.Therecoverableamount,whichisequaltothecarryingvalue,hasbeendeterminedastheGroup’snetassetvalueless thevalueofthefiniteandindefinitelifemanagementcontracts.
ThetablebelowsummariseskeyassumptionsusedintheEVmodel:
Key assumption 30-Jun-16 30-Jun-15Cashflowsforforecastunderlyingearnings&operationalcapitalexpenditure 3 years 3yearsTerminal growth rates 2.3% – 2.5% 2.5%Post tax discount rate range 7.64% – 8.14% 7.75%–8.25%Costofequity 8.36% – 8.86% 8.75%–9.25%
ThecarryingamountofthePropertyInvestmentCGUincludesthevalueoftheGroup’sinvestmentpropertieswhichareheldatfairvalue.Thesefairvaluesaredeterminedbasedonanumberofassumptions,asoutlinedinNote4(c).AsthecarryingamountofthePropertyInvestmentCGUisequaltoitsrecoverableamount,anyreasonablypossiblechangeintheassumptionsthatimpactthepropertyvaluationsandEVmodelmayhaveacorrespondingimpactonthecarryingamountofthePropertyInvestmentCGU,includinggoodwill.
Process for determination of key assumptionsThe key assumptions used in the fair value assessment of both goodwill and the external management contracts have been determined asfollows:
• RelevantdiscountratesarecalculatedbasedontheCapitalAssetPricingModelwithreferencetotheGroup’scostofdebt,costofequityand target gearing ratios;
• Terminal growth rates are estimated with reference to macro-economic conditions and the Group’s expected earnings growth through fixedrentalincreases;and
• Forecastunderlyingearnings,operationalcapitalexpenditureandassetandfundsmanagementcashflowsarebasedonthevaluesdeterminedbytheGroup’sbudgetingandplanningprocess.
TheGroupconsiderstheinputsandthevaluationapproachtobeconsistentwiththeapproachtakenbymarketparticipants.
As forecast underlying earnings, discount rates and growth rates are unobservable inputs into the valuation process, the key assumptions areconsideredtobeLevel3inthefairvaluehierarchy.
Vicinity Centres AnnualReport2016|101
For
per
sona
l use
onl
y

OTHER DISCLOSURES continued
16. Notes to the cash flow statementThereconciliationofnetprofitaftertaxforthefinancialyeartonetcashprovidedbyoperatingactivitiesisprovidedbelow.
30-Jun-16$m
30-Jun-15$m
Net profit after tax for the financial year 960.9 675.1Exclude non-cash items and cash flows under investing and financing activities:
Amortisation of static lease incentives and other project items 32.6 28.6Straight-lining of rent adjustment (4.8) (6.4)Property revaluation increment for directly owned properties (733.0) (430.9)Shareofnet(profit)/lossofinvestmentsaccountedforusingtheequitymethod 6.0 (7.7)Distributionsofnetincomefromequityaccountedinvestments 8.9 3.0Capitalised borrowing costs (11.8) (10.4)Amortisation of borrowing costs 5.9 13.6Net movement on mark-to-market of derivatives 147.5 23.5Foreign exchange gain (42.4) -Share-based payment expense 5.3 0.9Integrationandtransactioncosts 41.1 135.4Impairmentandamortisationofintangibleassets 298.3 3.3Stampdutyandothercostswrittenoffonacquisitionofinvestmentproperties 20.1 -Other non-cash items 2.1 2.2
Movements in working capital:Decrease in payables and other liabilities (23.7) (16.0)Decrease in receivables and other assets 28.8 3.8
Net cash inflow from operating activities 741.8 418.0
17. Auditor’s remunerationDuringtheyear,thefollowingfeeswerepaidorpayableforservicesprovidedbytheauditorsoftheGroup,EYoritsrelatedpractices.
30-Jun-16 $’000
30-Jun-15 $’000
Audit servicesStatutoryauditandreviewoffinancialreports 1,309.2 1,541.9Other assurance services 462.5 461.0Non-audit services prior to appointment as Group auditor1 - 939.9Taxation services 291.3 185.2Total auditors’ remuneration 2,063.0 3,128.0
1. PriortotheMergerPricewaterhouseCooperswastheGroupauditorofNovion.AssuchEYprovidednon-auditservicestoNovion.FeespaidtoPricewaterhouseCoopers intheyearended30June2015totalled$1,691,000equatingtototalfeespaidtoauditorsoftheGroupintheyearended30June2015of$4,819,000.
102|Vicinity Centres AnnualReport2016
For
per
sona
l use
onl
y

18. Parent entity financial information(a) Summary financialsThefinancialinformationpresentedbelowrepresentsthatofthelegalparententity,anddeemedparententityofthestapledGroup,VicinityLimited.Investmentsinsubsidiaryentitiesareaccountedforatcost,lessanyimpairmentrecognisedsinceacquisition.Otheraccountingpoliciesareconsistentwiththoseusedforthepreparationoftheconsolidatedfinancialreport.
30-Jun-16$m
30-Jun-15$m
Balance sheetCurrent assets 303.0 141.2Total assets 1,035.8 1,160.7Current liabilities (439.8) (239.2)Total liabilities (951.1) (774.5)EquityContributedequity 455.3 455.3Share-based payment reserve (4.1) 11.5Accumulated losses (366.5) (80.6)Total equity 84.7 386.2Netprofit/(loss)forthefinancialyearofVicinityLimitedasparententity (285.9)1 (13.2)Totalcomprehensiveprofit/(loss)forthefinancialyearofVicinityLimited (285.9)1 (13.2)
1.ThecurrentyearlossofVicinityLimitedastheparententityincludestheimpactofthe$295.0millionimpairmentofthegoodwillbalancerecognisedat31December2015.RefertoNote21(b)forfurtherdetailsoftheimpairmentrecognised.
VicinityLimitedhasaccesstotheGroup’scashflowfromoperationsandundrawnbankfacilities,inordertopayitscurrentobligations asandwhentheyfalldue.
The parent entity has no capital expenditure commitments which have been contracted but not provided for, or operating lease commitments andcontingenciesasatreportingdate.GuaranteesprovidedtosubsidiaryentitiesaredisclosedatNote20(c)andpredominantlyrelatetofulfillingcapitalrequirementsunderAustralianFinancialServicesLicencesheldbythesesubsidiaries.
(b) Stapled entity allocation of net profitInaccordancewithAASB3Business Combinations,theCompanyisthedeemedparentoftheVicinityCentresstapledgroup.AstheCompanyhasnolegalownershipoverVicinityCentresTrustanditscontrolledentities,theallocationofnetprofitandnetassetsisshownseparatelyfortheCompanyandtheTrustintheStatementofComprehensiveIncome,BalanceSheetandStatementofChangesinEquity.
ThefollowingillustratesthecontributionoftheCompanytothestapledGroup’snetprofitaftertax:
Vicinity Limited and controlled entities30-Jun-16
$m30-Jun-151
$mOperating result of the Company 22.6 27.0Less:IntegrationandtransactioncostsincurredbytheCompany2 (29.9) (7.9)Less:Impairmentandamortisationofintangibles (298.3) (3.3)Net (loss)/profit before tax attributable to securityholders of Vicinity Limited (as the Companies) (305.6) 15.8Incometaxexpense - (5.0)Net (loss)/profit after tax attributable to securityholders of Vicinity Limited (305.6) 10.8Net profit after tax attributable to securityholders of Vicinity Centres Trust (as other stapled entities of the Group) 1,266.5 664.3Net profit after tax of the Stapled Group 960.9 675.1
1. Asaresultofthereverseacquisitionasdescribedinthe‘Aboutthisreport–MergerofFederationCentresandNovionPropertyGroup’sectionthecomparativeinformation fortheyearended30June2015comprisestheresultsofNovionLimited,theparentofNovionPropertyGrouptothedateoftheMerger(11June2015),plustheresults ofVicinityLimitedfromthedateoftheMergerto30June2015.
2. Integrationandtransactioncostsof$41.1millionintheStatementofComprehensiveIncomeinclude$11.2millionincurredbytheTrustsand$29.9millionincurred bytheCompany.
Vicinity Centres AnnualReport2016|103
For
per
sona
l use
onl
y

19. Related parties (a) BackgroundTheparententityoftheGroupisVicinityLimitedwhichisdomiciledandincorporatedinAustralia.Allsubsidiariesandsub-trusts oftheGrouparewhollyownedsubsidiariesofVicinityLimitedorsub-trustsofVicinityCentresTrustasat30June2016.
(b) Information on related party transactions and balancesVicinityFundsRELtd(formerlyNovionRELimited),awhollyownedsubsidiaryoftheGroup,istheResponsibleEntity/Trustee ofthefollowingfunds(collectivelyknownastheWholesalefundsmanagedbytheGroup):
• DirectPropertyInvestmentFund–A(DPIF-A);
• DirectPropertyInvestmentFund–B(DPIF-B);
• VicinityEnhancedRetailFund(VERF);
• InternationalPrivateEquityRealEstateFund(IPERE);
• InternationalRealEstateTrust(IRET);and
• AustralianInvestmentsTrust(AIT).
ThetransactionswiththeWholesalefundsandthebalancesoutstandingat30June2016areoutlinedinthetablesbelow.
Related party balances with Wholesale funds
Property jointly ownedFunds management
fee receivable Alignment fee payable
30-Jun-16$’000
30-Jun-15$’000
30-Jun-16$’000
30-Jun-15$’000
30-Jun-16$’000
30-Jun-15$’000
WholesalefundsmanagedbytheGroup 505,000 598,716 2,043 2,301 262 1,291
Animpairmentassessmentisundertakeneachfinancialyearbyexaminingthefinancialpositionoftherelatedpartytodeterminewhetherthereisobjectiveevidencethatarelatedpartyreceivableisimpaired.Whensuchobjectiveevidenceexists,theGrouprecognisesanallowancefortheimpairmentloss.Outstandingrelatedpartytradereceivablesbalancesatyearendareunsecuredandsettlementoccursincash.Interestischargedonanarm’slengthbasisonamountsgreaterthan90daysoutstanding.TheGroupdoesnotholdanycollateralinrelationtorelatedpartyreceivables.
RelatedpartytransactionswithWholesalefundsAsset and funds management fee
revenue Distribution income Alignment fee expense
30-Jun-16$’000
30-Jun-15$’000
30-Jun-16$’000
30-Jun-15$’000
30-Jun-16$’000
30-Jun-15$’000
WholesalefundsmanagedbytheGroup 17,971 16,812 110 51 1,049 1,291
(c) Other related party transactionsDuringthefinancialyear,asubsidiaryoftheGroupsettledatransactionfortheacquisitionanumberofcommercialunits(theStrataPlan)adjacenttooneofitsproperties(theTransaction).
MrRichardHaddockAM,aDirectoroftheGroup,togetherwithhisfamilywereapartytotheTransactionastheholderofoneunitintheStrataPlan.Thatunit,whichMrHaddockandhisfamilyhadheldsince1990,wasacquiredbytheGroup’ssubsidiaryonarm’slengthtermsforavalueof$1,349,000on4September2015.
TheBoard’sproceduresunderitsconflictofinterestpolicywereinplacethroughouttheTransactioninordertomanagetheconflicts ofinterestarisingfromtheTransaction.
OTHER DISCLOSURES continued
104|Vicinity Centres AnnualReport2016
For
per
sona
l use
onl
y

20. Commitments and contingencies(a) Operating lease commitmentsEstimatedoperatingleaseexpenditurecontractedforatreportingdate,butnotprovidedforinthefinancialstatements:
30-Jun-16 $m
30-Jun-15 $m
Not later than one year 5.7 4.4Laterthanoneyearandnotlaterthanfiveyears 18.2 18.4Laterthanfiveyears 4.3 7.1Total operating lease commitments 28.2 29.9
(b) Capital commitmentsEstimatedcapitalexpenditurecontractedforatreportingdate,butnotprovidedfor:
30-Jun-16 $m
30-Jun-15 $m
Not later than one year 182.3 176.4Laterthanoneyearandnotlaterthanfiveyears 66.2 32.9Total capital commitments 248.5 209.3
(c) Contingent assets and liabilitiesBankguaranteestotalling$61.1millionhavebeenarrangedbytheGroup,primarilytoguaranteeobligationsforfouroftheGroup’sResponsibleEntitiestomeettheirfinancialobligationsundertheirAustralianFinancialServicesLicences.
Asatreportingdate,therewerenoothermaterialcontingentassetsorliabilities.
21. Other Group accounting matters(a) Other accounting policiesThissectioncontainsotheraccountingpoliciesthatrelatetothefinancialstatementsasawhole,detailofanychangesinaccountingpoliciesandtheimpactofneworamendedaccountingstandards.
Principles of consolidationTheseconsolidatedfinancialstatementscomprisetheassetsandliabilitiesofallcontrolledentitiesat30June2016andtheresults ofallcontrolledentitiesforthefinancialyearunlessotherwisestated.Controlledentitiesare:
• All entities over which the Group is exposed to, or has rights to, variable returns from its involvement with the entity and has the ability to affect those returns through its power to direct the activities of the entity; and
• Fully consolidated from the date on which control is transferred to the Group, and, where applicable, deconsolidated from the date onwhichcontrolceases.
Theacquisitionmethodofaccountingisusedtoaccountfortheacquisitionofcontrolledentities,andthebalancesandeffectsoftransactionsbetweenallcontrolledentitiesareeliminatedinfull.
InaccordancewithAASB3Business Combinations,VicinityLimitedisthedeemedparentofthestapledGroup.TheresultsandequityattributabletoVicinityCentresTrust(thatis,theamountsshownasattributabletosecurityholdersofotherstapledentitiesoftheGroup)areshownpriortotheeliminationoftransactionsbetweenVicinityLimitedandVicinityCentresTrust.
Vicinity Centres AnnualReport2016|105
For
per
sona
l use
onl
y

21. Other Group accounting matters continued(a) Other accounting policies continued
Revenue recognitionRevenueismeasuredatthefairvalueoftheconsiderationreceivedorreceivable.Revenueisrecognisedforthefollowingactivities:
Property ownership revenueAstheownerofanumberofshoppingcentres,theGroupderivesrentalrevenuefromtheleasingoftheretailspaceintheseproperties.Leaseincomeisrecognisedonastraight-linebasisovertheleaseterm.Itemsincludedinthestraightliningcalculationasrequiredbyaccountingstandardsareleaseincentivesgiventotenantsandfixedrentalincreasesthatformpartofrentalcontracts.
Management fee revenueProperty management and leasing fees are generated from existing properties, and development fees are derived in respect of new developmentsandredevelopments.Fundsmanagementrevenuerelatestoincomereceivedforthemanagementofexternallyownedproperties,wholesalepropertyfundsandpropertymandates.Feesareinaccordancewithgenerallyacceptedcommercialterms andconditions.
Feerevenueisrecognisedonanaccrualsbasisasearnedandwhenitcanbereliablymeasured.
Interest revenueInterestrevenueisrecognisedonatimeproportionbasisusingtheeffectiveinterestmethod.
Investments in joint operationsIncludedininvestmentpropertiesareshoppingcentresthatareaccountedforasjointoperations–intheformofdirectownershipofapartialfreeholdorleaseholdinterestinashoppingcentrewithastrategicpartner,basedonstandardmarketjointoperationagreements.TheGroupaccountsforjointoperationsbyrecognisingitsshareoftheshoppingcentre,classifiedasinvestmentproperty,anditsshare ofotherassets,liabilities,incomeandexpensesfromtheuseandoutputofthejointoperation.
Impact of new and amended standardsTherearenonewandamendedstandardsthatbecameeffectivefortheGroupon1July2015thathaveamaterialimpactonthefinancialstatements.
Future impact of Accounting Standards and Interpretations issued but not yet effectiveCertainnewAccountingStandardsandInterpretationshavebeenpublishedthatarenotmandatoryforthe30June2016reportingperiod.TheGrouphasassessedtheimpactofthesenewAccountingStandardsandInterpretationsthatarerelevanttotheGroup(basedon thecurrentandknownfutureactivitiesoftheGroup),anddoesnotexpectanymaterialimpactonnetassets,netprofit,presentation ordisclosureswhenthesestandardsbecomeeffectiveandareadopted. (b) Impairment of goodwill at 31 December 2015AsdescribedinNote15(b),animpairmenttogoodwillof$295.0millionwasrecordedat31December2015.Atthattime,theincreasein the value of the investment property portfolio and market based valuation cross checks, were considered to represent indicators of impairment,therebyrequiringanassessmentofrecoverableamount.Thisassessmentresultedinaportionofthegoodwill,primarilyrepresentedbythevalueattributabletothediversifiedportfoliopremium,beingwrittenoff.
Recoverable amount assessment methodologyTherecoverableamountat31December2015wasdeterminedusingafairvalueapproach.Thisapproachisconsistentwiththemethodologyappliedat30June2016,whichisoutlinedinNote15(b).
Enterprise value model key assumptions and estimation approachThetablebelowsummariseskeyassumptionsusedinthe31December2015EnterpriseValuemodel:
Key assumption 31-Dec-15 30-Jun-15Cashflowsforforecastunderlyingearnings&operationalcapitalexpenditure 3years 3yearsTerminal growth rates 2.3%–2.5% 2.5%Post tax discount rate range 7.92%–8.42% 7.75%–8.25%Costofequity 8.85%–9.35% 8.75%–9.25%
FordetailsontheannualimpairmenttestrefertoNote15(b).
OTHER DISCLOSURES continued
106|Vicinity Centres AnnualReport2016
For
per
sona
l use
onl
y

(c) Finance lease liabilitiesAsdisclosedinthefootnotestoNote4(d),anumberoftheGroup’sinvestmentpropertiesareheldunderlong-termleaseholdarrangements.Aspermarketpractice,externalandinternalvaluationsperformedtodeterminethefairvaluesofthesepropertiesatreportingdate(asdisclosedinNote4)havedeductedtheestimatedleasepaymentsfromthevaluationcashflows.
AsrequiredbyAASB140Investment Properties, where the fair value model is used to value investment property, the present value oftheseminimumpaymentsundertheleaseholdarrangementsmustthenbepresentedseparatelyasa:
• Financeleaseassetthatisaddedtotheoverallinvestmentpropertybalance(referNote4(a));and
• Correspondingfinanceleaseliability(referNote10).
Minimum lease
payments$m
Future finance charges
$m
Present value of
payments$m
Theminimumleasepaymentsunderfinanceleasesfalldueasfollows:Not later than one year 13.8 - 13.8Laterthanonebutnotmorethanfiveyears 62.4 (13.1) 49.3Morethanfiveyears1 597.7 (446.6) 151.1Total 673.9 (459.7) 214.2
1. PredominantlyrelatestopaymentsrelatingtotheDFOBrisbanebusinesswhichwasacquiredinMay2016.FordetailsofotherpropertiessubjecttoleaseholdarrangementsrefertothefootnotesinNote4(d).
22. Events occurring after the reporting dateNomattershavearisensincetheendoftheyearwhichhavesignificantlyaffectedormaysignificantlyaffecttheoperationsoftheGroup,theresultsofthoseoperations,orthestateofaffairsoftheGroupinfuturefinancialperiods.
Vicinity Centres AnnualReport2016|107
For
per
sona
l use
onl
y

DIRECTORS’ DECLARATION
InaccordancewitharesolutionoftheDirectorsofVicinityLimited,wedeclarethat:
(a) intheopinionoftheDirectors,thefinancialstatementsandnotessetoutonpages67to107areinaccordancewiththeCorporations Act 2001(Cth),including:
i. givingatrueandfairviewoftheGroupanditscontrolledentities’financialpositionasat30June2016andoftheperformance forthefinancialyearendedonthatdate,and
ii. complyingwithAustralianAccountingStandards,theCorporations Regulations 2001(Cth)andtheConstitution,and
iii.complyingwithInternationalFinancialReportingStandardsasissuedbytheInternationalAccountingStandardsBoardasdisclosedinthenotestothefinancialstatementsonpage72ofthe2016AnnualReport,and
(b) intheopinionoftheDirectors,therearereasonablegroundstobelievethattheGroupanditscontrolledentitieswillbeabletopaytheir debts as and when they become due and payable, and
(c) theDirectorshavebeengiventheDeclarationsrequiredtobemadetotheDirectorsinaccordancewithsection295AoftheCorporations Act 2001(Cth)forthefinancialyearended30June2016.
SignedinaccordancewiththeresolutionoftheDirectorsofVicinityLimited.
Peter HayChairman
Melbourne17August2016
108|Vicinity Centres AnnualReport2016
For
per
sona
l use
onl
y
INDEPENDENT AUDITOR’S REPORT
A member firm of Ernst & Young Global LimitedLiability limited by a scheme approved under Professional Standards Legislation
Ernst & Young8 Exhibition Street Melbourne VIC 3000 AustraliaGPO Box 67 Melbourne VIC 3001
Tel: +61 3 9288 8000Fax: +61 3 8650 7777ey.com/au
Independent auditor's report to the members of Vicinity Limited
Report on the financial report
We have audited the accompanying financial report of Vicinity Centres, which comprises the balance sheet as at 30 June 2016, the statement of comprehensive income, the statement of changes in equity and the cash flow statement for the year then ended, notes comprising a summary of significant accounting policies and other explanatory information, and the directors' declaration of the consolidated entity comprising Vicinity Limited (the ‘Company’) and the entities it controlled at the year's end or from time to time during the financial year.
Directors' responsibility for the financial report
The directors of the company are responsible for the preparation of the financial report that gives a true and fair view in accordance with Australian Accounting Standards and the Corporations Act 2001 and for such internal controls as the directors determine are necessary to enable the preparation of the financial report that is free from material misstatement, whether due to fraud or error. In the notes to the financial statements, the directors also state, in accordance with Accounting Standard AASB 101 Presentation of Financial Statements, that the financial statements comply with International Financial Reporting Standards.
Auditor's responsibility
Our responsibility is to express an opinion on the financial report based on our audit. We conducted our audit in accordance with Australian Auditing Standards. Those standards require that we comply with relevant ethical requirements relating to audit engagements and plan and perform the audit to obtain reasonable assurance about whether the financial report is free from material misstatement.
An audit involves performing procedures to obtain audit evidence about the amounts and disclosures in the financial report. The procedures selected depend on the auditor's judgment, including the assessment of the risks of material misstatement of the financial report, whether due to fraud or error. In making those risk assessments, the auditor considers internal controls relevant to the entity's preparation and fair presentation of the financial report in order to design audit procedures that are appropriate in the circumstances, but not for the purpose of expressing an opinion on the effectiveness of the entity's internal controls. An audit also includes evaluating the appropriateness of accounting policies used and the reasonableness of accounting estimates made by the directors, as well as evaluating the overall presentation of the financial report.
We believe that the audit evidence we have obtained is sufficient and appropriate to provide a basis for our audit opinion.
Independence
In conducting our audit we have complied with the independence requirements of the Corporations Act 2001. We have given to the directors of the company a written Auditor’s Independence Declaration, a copy of which is included in the directors’ report.
Vicinity Centres AnnualReport2016|109
For
per
sona
l use
onl
y

INDEPENDENT AUDITOR’S REPORT continued
A member firm of Ernst & Young Global LimitedLiability limited by a scheme approved under Professional Standards Legislation
Opinion
In our opinion:
a. the financial report of Vicinity Centres is in accordance with the Corporations Act 2001, including:
i giving a true and fair view of the consolidated entity's financial position as at 30 June 2016 and of its performance for the year ended on that date; and
ii complying with Australian Accounting Standards and the Corporations Regulations 2001; and
b. the financial report also complies with International Financial Reporting Standards as disclosed in the notes to the financial statements.
Report on the remuneration report
We have audited the Remuneration Report included in the directors' report for the year ended 30 June 2016. The directors of the Company are responsible for the preparation and presentation of the Remuneration Report in accordance with section 300A of the Corporations Act 2001. Our responsibility is to express an opinion on the Remuneration Report, based on our audit conducted in accordance with Australian Auditing Standards.
Opinion
In our opinion, the Remuneration Report of Vicinity Limited for the year ended 30 June 2016, complies with section 300A of the Corporations Act 2001.
Ernst & Young
David Shewring Partner Melbourne 17 August 2016
110|Vicinity Centres AnnualReport2016
For
per
sona
l use
onl
y

SUMMARY OF SECURITYHOLDERSas at 15 August 2016
Spread of securityholders
RangeNumber of
securityholdersNumber of securities
% of issued securities
100,001andover 224 3,773,951,228 95.3310,001to100,000 5,791 125,745,192 3.185,001to10,000 4,933 35,937,500 0.911,001to5,000 8,312 22,709,399 0.571to1,000 6,368 307,317 0.01Total 25,628 3,958,650,636 100.0
Thenumberofsecurityholdersholdinglessthanamarketableparcelof148securities($3.39on15August2016)is1,067andtheyhold39,418securities.
On–market purchase of securitiesDuringFY16,4,262,851VCXsecuritieswerepurchasedon-marketatanaveragepricepersecurityof$2.78bythetrusteefortheEESP,PRPSandPRPLtosatisfyentitlementsundertheseplans.
Substantial securityholders
Company name Effective dateNumber of securities
% of issued securities
TheGandelGroupPtyLtdanditsassociates 11June2015 682,861,296 17.25NationalNomineesasCustodianforUniSuperLtd 11June2015 301,124,003 7.61BlackRockGroup(BlackRockInc.anditsassociates) 5June2015 228,545,589 5.77VanguardInvestmentsAustraliaLtd 16July2012 86,311,928 6.44
20 largest securityholders
Rank NameNumber of
securities held% of issued
securities1 HSBCCustodyNominees(Australia)Limited 1,096,936,192 27.712 JPMorganNomineesAustraliaLimited 624,183,601 15.773 NationalNomineesLimited 386,282,799 9.764 CiticorpNomineesPtyLimited 322,346,473 8.145 BNPParibasNomineesPtyLtd 318,420,499 8.046 BNPParibasNomsPtyLtd 95,099,809 2.407 RosslynbridgePtyLtd 83,062,778 2.108 BesganNo.1PtyLtd 79,856,234 2.028 BesganNo.2PtyLtd 79,856,234 2.028 BesganNo.3PtyLtd 79,856,234 2.028 BesganNo.4PtyLtd 79,856,234 2.029 AllowaterPtyLtd 55,755,286 1.4110 CenarthPtyLtd 41,223,461 1.0411 BraybridgePtyLtd 39,385,610 0.9912 LedburnProprietaryLimited<TheAltonaTrustGateA/C> 33,556,774 0.8513 BroadganProprietaryLimited 32,906,624 0.8314 CiticorpNomineesPtyLimited 30,106,933 0.7615 AMPLifeLimited 29,103,903 0.7416 RBCInvestorServicesAustraliaNomineesPtyLimited 16,184,828 0.4117 AustralianFoundationInvestmentCompanyLimited 15,627,500 0.3918 HSBCCustodyNominees(Australia)Limited–GSCOECA 13,564,488 0.3419 ApplebrookPtyLtd 11,926,250 0.3019 JadecliffPtyLtd 11,926,250 0.3019 MoondalePtyLtd 11,926,250 0.3019 RosecreekPtyLtd 11,926,250 0.3020 LedburnProprietaryLimited 9,207,633 0.23Total 20 largest securityholders 3,610,085,127 91.19Balance of register 348,565,509 8.81Total issued capital 3,958,650,636 100.00
Vicinity Centres AnnualReport2016|111
For
per
sona
l use
onl
y

Vicinity Centrescomprising:
Vicinity LimitedABN90114757783
and
Vicinity Centres RE LtdABN88149781322
as Responsible Entity for
Vicinity Centres TrustARSN104931928
ASX listingVicinityCentresislistedontheASX underthelistingcodeVCX
Board of DirectorsPeterHay(Chairman)Angus McNaughtonCharles MacekDavidThurin(Dr)Debra StirlingKaren PenrosePeter KahanRichardHaddockAMTimHammonTrevor GerberWaiTang
Company SecretariesCarolyn ReynoldsMichelle Brady
Registered officeChadstone Shopping Centre 1341DandenongRoadChadstoneVictoria3148Australia
Telephone:+61399361222Facsimile: +61399361333Website: vicinity.com.au
AuditorsErnst & Young8ExhibitionStreetMelbourneVictoria3000Australia
Security registrarIfyouhavequeriesrelatingtoyoursecurityholding or wish to update your personal or payment details, please contact thesecurityregistrar:
LinkMarketServicesLimitedLevel1,333CollinsStreet,MelbourneVictoria3000Australia
Generalsecurityholderenquiries:
Toll Free: +611300887890Facsimile: +61292870303Facsimile: +61292870309
(forproxyvoting)Email: vicinity@linkmarketservices.
com.auPostal Address:LockedBagA14,Sydney
SouthNSW1235Australia
Access your securityholding onlineYou can update your personal details and access information about your securityholding online by clicking ‘Securityholder login’ on our home page atvicinity.com.au,orviathe‘InvestorServices’ section of the Security Registrar’s websiteatlinkmarketservices.com.au, orscantheQRCode(below)totake youtotheinvestorcentre.
Securityholders can use the online systemto:
• view your holding balances, distribution payments and transaction history
• choose your preferred annual report and communications options
• confirmwhetheryouhavelodgedyour TaxFileNumber(TFN)or
• AustralianBusinessNumber(ABN)
• update your contact details
• update your bank account details
• check Vicinity Centres’ security price, and
• download various securityholder instructionforms.
Contact Vicinity CentresWearecommittedtodeliveringahighlevelofservicetoallsecurityholders.Shouldtherebe some way you feel that we can improve ourservice,wewouldliketoknow.Whetheryou are making a suggestion or a complaint, yourfeedbackisalwaysappreciated.
Investor RelationsEmail: [email protected]
The Responsible Entity is a member (memberno.28912)oftheFinancialOmbudsmenService(FOS),anexternalcomplaintsresolutionscheme.FOSoffersconsumers a single national source of accessible information and expertise for banking, insurance and investment disputes.Ifyouarenotsatisfiedwiththe resolution of your complaint by the Responsible Entity, you may refer your complainttoFOS.
Key dates1
30August2016 June2016distribution payment
18November2016 2016AnnualGeneral Meeting
29December2016 Ex-distribution date for December 2016distribution
30December2016 Record date for December2016distribution
15February2017 FY17interimresults
2March2017 Payment of December2016distribution
29June2017 Ex-distribution date forJune2017distribution
30June2017 Record date forJune2017distribution
16August2017 FY17annualresults
30August2017 June2017distribution payment
1.Thesedatesmaybesubjecttochange.
CORPORATE DIRECTORY
112|Vicinity Centres AnnualReport2016
For
per
sona
l use
onl
y

For
per
sona
l use
onl
y


