53
INDEPENDENT EXPERT'S REPORT AND FINANCIAL SERVICES GUIDE 9 JANUARY 2017 VALUATION OF RURALCO HOLDINGS LIMITED Proposed acquisition of the business of TP Jones For personal use only
INDEPENDENT EXPERT'S REPORT
AND FINANCIAL SERVICES GUIDE
9 JANUARY 2017
VALUATION OF
RURALCO HOLDINGS LIMITED Proposed acquisition of the business of TP Jones
For
per
sona
l use
onl
y

ADELAIDE GPO Box 1572, Adelaide SA 5000 T 08 8385 2200 leadenhall.com.au
SYDNEY Level 11, 65 York St, Sydney NSW 2000 T 02 8823 6224
[email protected] ABN 11 114 534 619 AFSL 293586 T 1800 355 778
9 January 2017 The Independent Directors Ruralco Holdings Limited Level 5, Building A, 26 Talavera Road, Macquarie Park NSW 2113 Dear Directors,
Independent Expert’s Report in Relation to the Acquisition of TP Jones’ Business
1. Introduction
TP Jones & Co (“TP Jones”) provides goods and services to the agricultural sector, including spray and irrigation advice and the retail of rural merchandise operating out of four locations in the North, North East and Midlands regions of Tasmania.
On 15 November 2016, Ruralco Holdings Limited (“Ruralco”), through its wholly-owned subsidiary, Roberts Limited (“Roberts”), announced that it had entered into an agreement to acquire the business of TP Jones on a cash-free, debt-free basis for consideration of $16 million (“Consideration”) less working capital and other adjustments to be determined at completion (the “Proposed Transaction”).
Further details of the Proposed Transaction are set out in Section 1 of our detailed report.
2. Purpose of report
Acquisition of TP Jones
The former Managing Director of TP Jones, Mr John Tuskin, is also a former non-executive director of Ruralco and holds a 15% interest in the vendors of the TP Jones business. As a result of this relationship, and since the Consideration is greater than 5% of the net assets of Ruralco, an Independent Expert’s Report (“IER”) is required by Ruralco to assess whether the Proposed Transaction is fair and reasonable to Ruralco’s shareholders in accordance with ASX Listing Rule 10.10.2 (“Listing Rule 10”).
The independent directors of Ruralco have requested Leadenhall Corporate Advisory Pty Ltd (“Leadenhall”) to prepare an IER, advising whether, in our opinion, the Proposed Transaction is fair and reasonable to Ruralco shareholders not associated with TP Jones (“Shareholders”).
Break fee
A break fee of $0.5 million (“Break Fee”) is payable to TP Jones in the event that shareholder approval is not obtained (or the other conditions precedent are not satisfied or waived) and the Proposed Transaction does not complete.
As the payment of the Break Fee would be a payment to a related party, the Break Fee is subject to shareholder approval under Chapter 2E of the Corporations Act (“Chapter 2E”) unless Ruralco forms the view that the Break Fee would be reasonable if Ruralco and TP Jones were dealing at arm’s length.
The independent directors have therefore also requested Leadenhall to provide an opinion as to whether the Break Fee is a term that would be reasonable if Ruralco and TP Jones were dealing at arm’s length in accordance with Chapter 2E.
Notice of meeting
This report will be included in the notice of meeting (“NOM”) in relation to the Proposed Transaction to assist Ruralco Shareholders to evaluate the Proposed Transaction and the reasonableness of the Break Fee.
Further details of the purpose of this report are set out in Section 2 of our detailed report.
For
per
sona
l use
onl
y

Ruralco Holdings Limited Independent Expert’s Report and Financial Services Guide
Page 3 of 53
3. Basis of evaluation
Listing Rule 10
In order to assess whether the Proposed Transaction is fair and reasonable to Shareholders in accordance with Listing Rule 10 we have:
♦ Assessed it as fair if the value of the TP Jones business is equal to or greater than the value of the Consideration
♦ Assessed it as reasonable if it is fair, or if despite not being fair, the advantages to Shareholders outweigh the disadvantages
Break Fee
In order to evaluate the terms of the Break Fee, we have considered the following factors:
♦ How the terms of the overall transaction compare with those of any comparable transactions between parties dealing on an arm’s length basis in similar circumstances
♦ The nature and content of the negotiating process
♦ The impact of the transaction on the company
Further details of the basis of evaluation are set out in Section 2 of our detailed report.
4. Analysis of fairness
We have assessed the fair market value of the business of TP Jones using the capitalisation of future maintainable earnings (“CFME”) methodology. In applying the CFME methodology we have:
♦ Determined a maintainable level of EBITDA of $2.7 million to $3.0 million. This equates to a maintainable level of EBIT of $2.5 million to $2.8 million after adjusting for depreciation and amortisation. This level of earnings was assessed after consideration of historical earnings (normalised to remove non-recurring items and to include the full-year impact of recent acquisitions), year to date earnings, TP Jones management forecasts for FY17 as well as broker forecasts for broadly comparable companies
♦ Applied an EBITDA multiple of 5.0x to 5.5x and an EBIT multiple of 5.5x to 6.0x. These are control multiples, derived from analysis of takeover transactions and share market trading prices of companies with similar businesses to TP Jones
The result from this methodology was cross-checked using a discounted cash flow (“DCF”) analysis over a period of five years (with a terminal value) with the following key assumptions:
♦ Revenue growth based on a combination of historical growth rates, growth from the acquisition of two new stores and growth initiatives being implemented
♦ Gross profit margins assumed to increase to a higher maintainable level having regard to management forecasts and the position of the business within the Tasmanian market
♦ Terminal growth rate of 2.5%
♦ Discount rate of 14.0% to 15.0%
The result from this analysis provided additional support for the assessed valuation range pursuant to the CFME approach presented above.
Further details of the valuation of the TP Jones business are set out in Section 6 of our detailed report.
For
per
sona
l use
onl
y

Ruralco Holdings Limited Independent Expert’s Report and Financial Services Guide
Page 4 of 53
We have assessed whether the Proposed Transaction is fair by comparing our assessed fair market value of TP Jones’ business on a control basis with the Consideration. This comparison is set out in the table below.
Table 1: Assessment of fairness
Source: Leadenhall analysis
We have estimated the value of the consideration to be $15.8 million after deducting the after-tax cost of leave balances of $0.2 million and assuming no working capital adjustments upon completion.
Since the Consideration is within the assessed range of values of the TP Jones business, the Proposed Transaction is fair to Shareholders.
5. Analysis of reasonableness
We have defined the Proposed Transaction as reasonable if it is fair, or if despite not being fair, there are sufficient reasons for Shareholders to vote for the proposal. Since the transaction is fair, it is therefore reasonable. However, we have also considered the following advantages and disadvantages of the Proposed Transaction to Shareholders.
Advantages
We consider the principal advantages of the Proposed Transaction to Ruralco shareholders are:
♦ In line with Ruralco strategy: Ruralco has a stated strategy of targeted expansion of its retail footprint. Tasmania represents a desirable market for this expansion with significant growth expected in the agricultural sector over the long-term. TP Jones services producers of high value commodities throughout a key region with secure access to water which is consistent with Ruralco’s strategy
♦ Potential synergies which have not been fully factored into purchase price: Ruralco management have estimated a range of potential synergies which include cost savings from procurement and other efficiencies of approximately $0.5 million. Additionally, Ruralco has identified potential synergies such as site consolidation as well as leveraging Ruralco’s agency businesses (i.e. real estate, wool & livestock) across TP Jones. These aspects have not been quantified but are expected to have a meaningful contribution to future profitability of the combined business with limited risks to achieving these benefits
♦ Access to key management: TP Jones has a highly experienced management team and Ruralco believes the merger will achieve the required cultural and operational changes to improve the performance of the Roberts business
♦ Expected to be accretive to earnings per share (“EPS”): Ruralco have estimated that the Proposed Transaction will be EPS accretive
Disadvantages
The main disadvantages of the Proposed Transaction are:
♦ Increased gearing: If the Proposed Transaction proceeds, the gearing for Ruralco will increase moderately as the consideration is anticipated to be debt funded
♦ Purchase price includes an element of synergies which may not be achieved: Based on our analysis, the purchase price includes an element of the synergies expected to be realised by Ruralco. Whilst the synergies quantified by Ruralco pertain to relatively low risk cost savings, there is a risk that the synergies will not be realised to the extent expected
Fair market value of TP Jones' business 13.5 16.5
Consideration 15.8 15.8
$'m Low High
For
per
sona
l use
onl
y

Ruralco Holdings Limited Independent Expert’s Report and Financial Services Guide
Page 5 of 53
6. Opinion on Proposed Transaction
In our opinion the Proposed Transaction is fair and reasonable to Shareholders.
We have evaluated the Proposed Transaction for the Shareholders as a whole. We have not considered its effect on the particular circumstances of individual investors. Due to their personal circumstances, individual investors may place a different emphasis on various aspects of the Proposed Transaction from the one adopted in this report. Accordingly, individuals may reach a different conclusion to ours on whether the Proposed Transaction is fair and reasonable. If in doubt, investors should consult an independent financial adviser about the impact of this Proposed Transaction on their specific financial circumstances.
This opinion should be read in conjunction with our detailed report which sets out our scope, analysis and findings in more detail.
7. Opinion on break fee
In evaluating whether the Break Fee is representative of arm’s length terms we noted:
♦ The size of the Break Fee was comparable to break fees negotiated between unrelated parties for similar sized transactions
♦ Mr Tuskin was excluded from the negotiation of the terms of the Break Fee
♦ The Break Fee has a negligible impact on Ruralco
Based on our analysis of the factors noted above, there is nothing that has come to our attention to indicate that the Break Fee is not representative of arm’s length terms in accordance with Chapter 2E.
This opinion should be read in conjunction with our detailed report which sets out our scope, analysis and findings in more detail.
Yours faithfully
Dave Pearson Richard Norris Director Director
Note: All amounts stated in this report are in Australian dollars unless otherwise stated.
Tables in this report may not add due to rounding.
For
per
sona
l use
onl
y

Ruralco Holdings Limited Independent Expert’s Report and Financial Services Guide
Page 6 of 53
LEADENHALL CORPORATE ADVISORY PTY LTD
ABN 11 114 534 619
Australian Financial Services Licence No: 293586
FINANCIAL SERVICES GUIDE
Leadenhall Corporate Advisory Pty Ltd (“Leadenhall” or “we” or “us” or “our” as appropriate) has been engaged to issue general financial product advice in the form of a report to be provided to you.
Financial Services Guide
In providing this report, we are required to issue this Financial Services Guide (“FSG”) to retail clients. This FSG is designed to help you to make a decision as to how you might use this general financial product advice and to ensure that we comply with our obligations as a financial services licensee.
Financial Services We are Licensed to Provide
We hold Australian Financial Services Licence 293586 which authorises us to provide financial product advice in relation to securities (such as shares and debentures), managed investment schemes and derivatives.
We provide financial product advice by virtue of an engagement to issue a report in connection with a financial product. Our report will include a description of the circumstances of our engagement and the party who has engaged us. You will not have engaged us directly but will be provided with a copy of the report because of your connection to the matters in respect of which we have been engaged to report.
Any report we provide is provided on our own behalf as a financial service licensee authorised to provide the financial product advice contained in that report.
General Financial Product Advice
The advice produced in our report is general financial product advice, not personal financial product advice, because it has been prepared without taking into account your personal objectives, financial situation or needs. You should consider the appropriateness of this general advice having regard to your own objectives, financial situation and needs before you act on the advice. Where the advice relates to the acquisition or possible acquisition of a financial product, you should also obtain a product disclosure statement relating to the product and consider that statement before making any decision about whether to acquire the product.
Benefits that We May Receive
We charge fees for providing reports. These fees will be agreed with the person who engages us to provide the report. Fees will be agreed on either a fixed fee or time cost basis. Leadenhall is entitled to receive a fixed fee of $40,000 (excl. GST) for preparing this report. This fee is not contingent upon the outcome of the Proposed Transaction.
Except for the fees referred to above, neither Leadenhall, nor any of its directors, consultants, employees or related entities, receive any pecuniary or other benefit, directly or indirectly, for or in connection with the provision of this report.
Remuneration or Other Benefits Received by our Employees, Directors and Consultants
All our employees receive a salary. Our employees are eligible for bonuses which are not based on the outcomes of any specific engagement or directly linked to the provision of this report. Our directors and consultants receive remuneration based on time spent on matters.
For
per
sona
l use
onl
y

Ruralco Holdings Limited Independent Expert’s Report and Financial Services Guide
Page 7 of 53
Referrals
We do not pay commissions or provide any other benefits to any person for referring clients to us in connection with the reports that we are licensed to provide.
Complaints Resolution
As the holder of an Australian Financial Services Licence, we are required to have a system in place for handling complaints from persons to whom we have provided reports. All complaints must be in writing, to the following address:
Leadenhall Corporate Advisory Pty Ltd GPO Box 1572 Adelaide SA 5001 Email: [email protected]
We will try to resolve your complaint quickly and fairly and will endeavour to settle the matter within 14 days from the time the matter is brought to our attention.
If you do not get a satisfactory outcome, you have the option of contacting the Financial Ombudsman Service (“FOS”). The FOS will then be able to advise you as to whether or not they can assist in this matter. The FOS can be contacted at the following address:
Financial Ombudsman Service GPO Box 3 Melbourne VIC 3001
Telephone: 1300 780 808 Email: [email protected]
Compensation Arrangements
Leadenhall holds professional indemnity insurance in relation to the services we provide. The insurance cover satisfies the compensation requirements of the Corporations Act 2001.
9 January 2017
For
per
sona
l use
onl
y

Ruralco Holdings Limited Independent Expert’s Report and Financial Services Guide
Page 8 of 53
CONTENTS
1 Terms of the Proposed Transaction ............................................................. 9
2 Scope ............................................................................................................ 10
3 Agribusiness Industry ................................................................................. 12
4 Profile of TP Jones ....................................................................................... 14
5 Valuation Methodology ................................................................................ 22
6 Valuation of TP Jones’ Business ................................................................ 23
7 Evaluation of the Proposed Transaction .................................................... 31
8 Evaluation of the Break Fee ........................................................................ 33
: Glossary ............................................................................................ 35
: Valuation Methodologies ................................................................. 36
: Comparable Entities ......................................................................... 39
: Control Premium .............................................................................. 41
: Discount Rate ................................................................................... 46
: Qualifications, Declarations and Consents .................................... 53
For
per
sona
l use
onl
y

Ruralco Holdings Limited Independent Expert’s Report and Financial Services Guide
Page 9 of 53
1 TERMS OF THE PROPOSED TRANSACTION
1.1 Overview
TP Jones provides goods and services to the agricultural sector, including spray and irrigation advice and the retail of rural merchandise. The business of TP Jones is jointly owned by TPJ Nominees Pty Ltd as trustee of the TPJ Unit Trust No. 2 and TP Jones Pty Ltd (together, the “Vendors”). Ruralco, via its wholly owned subsidiary, Roberts, proposes to acquire all of the assets of the TP Jones business.
The agreed price for the acquisition of the TP Jones business is $16 million on a cash-free, debt-free basis. $0.5 million of the purchase price has been pre-paid and is held in escrow. The agreed price is to be reduced to reflect the after-tax cost to Ruralco of taking over the accrued long service and annual leave entitlements of transferring employees. The price will also be adjusted to reflect the difference between the agreed $4.0 million level of working capital and the amount of working capital upon completion.
We have estimated the value of the consideration to be $15.8 million after deducting the after-tax cost of leave balances of $0.2 million and assuming no working capital adjustments upon completion.
Other relevant terms include:
♦ All employees of TP Jones will be offered employment with Roberts on terms and conditions substantially similar to, and no less favourable than, the employees’ existing terms of employment
♦ A number of parties including Mr Tuskin are providing guarantees for the due and punctual performance of the Vendors in favour of Roberts. The guarantee will operate for three years from the date of the agreement
♦ The Asset Sale Agreement contains a number of standard warranties and completion deliverables
1.2 Conditions
The Proposed Transaction is also subject to a number of conditions including:
♦ Key employees and at least 75% of the non-key employees entering into employment agreements with Roberts on satisfactory terms
♦ Ruralco Shareholders approving the proposed acquisition
For
per
sona
l use
onl
y
Ruralco Holdings Limited Independent Expert’s Report and Financial Services Guide
Page 10 of 53
2 SCOPE
2.1 Purpose of the Report
Acquisition of TP Jones
ASX Listing Rule 10.1 requires a listed entity to obtain shareholders’ approval before it acquires a substantial asset from a related party. The Notice of Meeting sent to shareholders advising them of such a transaction must include a report from an independent expert stating whether the transaction is fair and reasonable to the Shareholders.
An asset is considered to be substantial if its value, or the consideration being paid for it, is 5% or more of the equity in the listed entity, as set out in its latest accounts lodged with the ASX.
The equity of Ruralco on 30 September 2016 was $202 million (excluding non-controlling interests), as set out in the preliminary final report lodged with the ASX on 15 November 2016. As the consideration to be paid for the business of TP Jones is approximately 7.5% of the most recently reported net assets attributable to equity holders of Ruralco, the TP Jones business would represent a substantial asset of Ruralco.
Mr John Tuskin, a former non-executive director of Ruralco, is also the former Managing Director of TP Jones and holds a 15% interest in the vendors of the TP Jones business. Accordingly, the Proposed Transaction is with a related party.
As a result, the Proposed Transaction must be approved by Ruralco Shareholders. The independent directors of Ruralco have therefore requested Leadenhall to prepare an IER in accordance with Listing Rule 10 advising whether, in our opinion, the Proposed Transaction is fair and reasonable to Shareholders. This report is to accompany the NOM to be sent to shareholders of Ruralco in order to assist the Shareholders in their decision whether to vote for, or against, the Proposed Transaction.
Break fee
A break fee of $0.5 million is payable to TP Jones in the event that Shareholder approval is not obtained (or the other conditions precedent are not satisfied or waived) and the Proposed Transaction does not complete. As the payment of the Break Fee would be a payment to a related party, the Break Fee is subject to shareholder approval under Chapter 2E unless Ruralco forms the view that the Break Fee would be reasonable if Ruralco and TP Jones were dealing at arm’s length.
The independent directors have therefore requested Leadenhall to provide an opinion as to whether the Break Fee is a term that would be reasonable if Ruralco and TP Jones were dealing at arm’s length in accordance with Chapter 2E.
2.2 Basis of Evaluation
Acquisition of TP Jones
Overview
The ASX Listing Rules do not define the term ‘fair and reasonable’ and provide no guidance on what should be considered when assessing whether a proposed transaction is fair and reasonable. However, guidance on what an independent expert should consider and how ‘fair and reasonable’ should be defined is contained in Regulatory Guide 111: Content of Expert Reports (“RG 111”) which states that there should be separate assessments of whether a transaction is ‘fair’ and whether it is ‘reasonable’. Accordingly, we have considered the concepts of “fairness” and “reasonableness” separately as described below.
Fairness
According to RG 111.57 ‘a proposed related party transaction is ‘fair’ if the value of the financial benefit to be provided by the entity to the related party is equal to or less than the value of the consideration being provided to the entity’. This comparison should be made ‘assuming a knowledgeable and willing, but not anxious, buyer and a knowledgeable and willing, but not anxious, seller acting at arm’s length.’
We have therefore assessed the Proposed Transaction as fair if the value of the TP Jones business is equal to or greater than the value of the Consideration.
For
per
sona
l use
onl
y

Ruralco Holdings Limited Independent Expert’s Report and Financial Services Guide
Page 11 of 53
We have assessed the value of the TP Jones business using the concept of fair market value, which is defined by the International Glossary of Business Valuation Terms as:
The price, expressed in terms of cash equivalents, at which property would change hands between a hypothetical willing and able buyer and a hypothetical willing and able seller, acting at arm’s length in an open and unrestricted market, when neither is under compulsion to buy or sell and when both have reasonable knowledge of the relevant facts.
We consider this to be consistent with the definition of value contained in RG 111.57 and common market practice.
Special value is defined as the amount a specific purchaser is willing to pay in excess of fair market value. A specific purchaser may be willing to pay a premium over fair market value as a result of potential economies of scale, reduction in competition or other synergies they may enjoy arising from the acquisition of the asset. However, to the extent a pool of hypothetical purchasers could all achieve the same level of synergies the value of those synergies may be included in fair market value. Our assessed value of the TP Jones business does not include any special value in accordance with RG 111.
Reasonableness
In accordance with RG 111, we have defined the Proposed Transaction as being reasonable if it is fair, or if despite not being fair, Leadenhall believes that there are sufficient reasons for Shareholders to vote in favour of the proposal. We have therefore considered whether the advantages to Shareholders of the Proposed Transaction outweigh the disadvantages. To assess the reasonableness of the Proposed Transaction we have considered the following significant factors recommended by RG 111.62:
♦ The impact of the transaction on the financial situation and solvency of Ruralco
♦ Opportunity costs
♦ The alternative options available to Ruralco and the likelihood of those options occurring
♦ The bargaining position of Ruralco
♦ Whether there is selective treatment of any security holder, particularly the related party
♦ Any special value of the transaction to Ruralco
We have also considered the other significant advantages and disadvantages to Shareholders of the Proposed Transaction.
Break Fee
There is no specific guidance to assessing the arm’s length principles in Chapter 2E. However ASIC Regulatory Guide 76 Related Party Transactions (“RG 76”) provides guidance in evaluating related party transactions of this nature. Having considered the relevant guidance of RG 76 we have therefore considered the following factors:
♦ How the terms of the overall transaction compare with those of any comparable transactions between parties dealing on an arm’s length basis in similar circumstances
♦ The nature and content of the bargaining process, including whether the entity followed robust protocols to ensure that conflicts of interest were appropriately managed in negotiating and structuring the transaction
♦ The impact of the transaction on the company
2.3 Individual Circumstances
We have evaluated the Proposed Transaction for the Shareholders as a whole. We have not considered its effect on the particular circumstances of individual investors. Due to their personal circumstances, individual investors may place a different emphasis on various aspects of the Proposed Transaction from the one adopted in this report. Accordingly, individuals may reach a different conclusion to ours on whether the Proposed Transaction is fair and reasonable. If in doubt investors should consult an independent financial adviser about the impact of this Proposed Transaction on their specific financial circumstances.
For
per
sona
l use
onl
y

Ruralco Holdings Limited Independent Expert’s Report and Financial Services Guide
Page 12 of 53
3 AGRIBUSINESS INDUSTRY
3.1 Summary
TP Jones provides rural merchandise / agri-products at its four locations in Tasmania. We have therefore provided a brief overview of the rural merchandise sector with a focus on the market in Tasmania where possible.
3.2 Markets and Products
The North, North East and Midlands regions of Tasmania are an important agricultural market with high value horticulture (poppies, peas, potatoes and onions), broadacre crop farming, viticulture and animal production. The region is well positioned with reliable access to water and includes a large number of both cattle and sheep (meat and wool) livestock operations.
The Tasmanian Department of Primary Industries, Parks, Water and Environment estimates the gross value of agricultural production in Tasmania to have grown by 6.2% over the 2014-2015 period with a total gross value of agricultural production of $1.4 billion at the farm gate. In contrast, the average Australian agricultural productivity growth rate from 2002 to 2011 was 1.4% per annum.
Agricultural primary producers in Tasmania purchase various inputs which are supplied by the rural merchandise / agri-products sector. An overview of the main rural merchandise products lines supplied to this market is given below:
♦ Animal production: Includes supplies used in livestock production, parasite control, animal nutrition, animal health, shearing, and livestock identification and handling equipment
♦ Crop production: Includes agricultural chemicals used in pest and disease control, and to regulate growth
♦ Fencing: Includes a range of wire, timber, steel and electric fencing options
♦ Seed: Supply of seed varieties and blends for a range of applications
♦ Stock feed: Includes a range of animal feed suitable for various types of livestock and pets
♦ Fertiliser: Includes a range of granular and liquid fertiliser products suitable for broadacre crop farming, horticulture, viticulture and turf markets
♦ Irrigation: Supply of agricultural water management products and equipment
♦ Hardware and general: Various types of equipment and other non-consumables such as farming equipment, livestock handling equipment, and protective clothing
In addition to the above products, certain operators offer a combination of technical advice and merchandise sales in varying degrees known as a “high service model” as a point of differentiation. Services offered in this regard include (among others) agronomic, crop management, seed production and livestock production services. These services extend over a wide range of offerings such as soil testing and analysis, fertiliser and chemical recommendations and supply, crop rotation and irrigation advice, grazing management, pasture species recommendations, crop monitoring and equipment calibration. Services may be offered on a fee-for-service basis or for low to no profit as an enabler for merchandise sales.
3.3 Key Drivers and Success Factors
Based on discussion with both Ruralco and TP Jones management, the market is relatively mature in terms of total serviceable customer numbers. However, the dollar value by customer is increasing as farmers adopt methods which require more intensive usage of farming inputs to increase production. The key drivers for consumers and operators in the sector are outlined below:
♦ Macroeconomic factors: Weather conditions and underlying agricultural prices have a strong influence on farm yields and therefore, the demand for farming inputs supplied by this industry
♦ Service quality: Loyalty, trust and quality of service are key drivers of customer choice. Operators may attempt to justify prices above other retailers / buying groups by adopting a high service model
For
per
sona
l use
onl
y

Ruralco Holdings Limited Independent Expert’s Report and Financial Services Guide
Page 13 of 53
♦ Relationships and location: The Tasmanian agribusiness market is not serviced from the mainland of Australia and competition is predominantly based on locality. Thus, proximity to, and a direct relationship with, the customer are strong factors that influence the ongoing buying decisions of customers
♦ Pricing: While proximity, relationships and trust appear to be strong factors that influence the buying decisions of a customer, price continues to be a key influencing factor
♦ Access to supply: Ensuring supply of the right products at a competitive price is a key component for retailers
3.4 Competitive environment
Customers of the Tasmanian agri-products industry tend to shop based on proximity to their farm (i.e. ease of dispatch / collection from shopfront to farm / paddock). As such, competition is geography focused with sales made largely in paddock and dispatched / collected from the branch. Furthermore, customers do not generally purchase all their needs from one operator but instead often purchase rural merchandise products from different suppliers.
Ruralco, through its wholly-owned subsidiary Roberts, and TP Jones are two of Tasmania’s largest agribusiness retailers. Ruralco also owns Combined Rural Traders (“CRT”), a buying group of independent rural retailers in Australia. CRT has over 300 independent retailers Australia-wide, with two members operating in Tasmania, TP Jones (with four locations) and CH & MH Sargent (in Burnie).
Besides Roberts, TP Jones’s competitors include Elders (six locations) and E.E. Muir & Sons (trading as Serve-Ag) (eight locations). There are also a number of smaller rivals selling a similar range of products and services, such as MG Trading (two locations), Yolla Producers Co-operative Society (two locations), Jamieson’s Statewide Rural (one location), Rural Solutions Tasmania (one location), Swanston Rural (two locations), Westbury Rural Supplies (one location) and Tas Rural Supplies (online only).
All products are readily available across most retailers and there are no exclusive distribution arrangements in relation to rural merchandise.
Barriers to entry are limited as existing or potential retailers, such as Elders, could move swiftly to increase competition should another competitor attempt to raise prices / reduce service levels. Capital requirements to start and grow a new business are relatively low.
3.5 Outlook
The key factors influencing the Tasmanian agribusiness sector, in the near term, are outlined below:
♦ Intention by the Tasmanian and Australian governments to grow the Tasmanian agricultural sector with the Australian government welcoming the recommendations of the Tasmanian Fruit and Vegetable Industry Taskforce. The taskforce was established to develop a growth plan for the Tasmanian fruit and vegetable industry
♦ Irrigation development through the Tasmanian Irrigation Tranche Two project which aims to develop five new irrigation schemes across Tasmania. Tranche One is nearing completion and received $140 million in funding from the Commonwealth government and $80 million from the Tasmanian government
♦ In FY16, Tasmania was impacted by particularly challenging weather conditions with the farmers afflicted by both drought and flooding. These conditions have since abated. Weather conditions going forward will continue to influence the growth and profitability of the overall agricultural and agribusiness industries
♦ The increasingly global food supply chain with strong external demand for quality grass-fed and grain-fed beef and lamb from niche markets around the world as well as rising demand from the growing middle-class in Asia
♦ The state government’s agricultural growth plans which aim to grow the value of agriculture in Tasmania to $10 billion per year by 2050 (an increase of $8.4 million over 35 years)
For
per
sona
l use
onl
y

Ruralco Holdings Limited Independent Expert’s Report and Financial Services Guide
Page 14 of 53
4 PROFILE OF TP JONES
4.1 Introduction
TP Jones is a CRT member based in Tasmania with branches in Youngtown, Campbell Town, Latrobe and Longford. The business focuses on providing high service, technical advice to growers reflective of the intensive nature of the farming practices in the markets in which it operates. TP Jones employs 40 staff including nine technical staff / agronomists. It services broadacre crop farming, horticultural, viticulture, dairy, irrigation and animal health markets.
In 2016, the business grew from two to four branches through the acquisitions of a Landmark store in Latrobe and Tas Ag Services in Campbell Town. In addition, the business relocated its Longford branch to a better location through the acquisition of Rural Supplies Longford. These three initiatives have increased the scale and earnings base of the business.
4.2 History
A brief history of TP Jones is set out in the table below:
Table 2: History of TP Jones
Year Event
1985 Business commenced to fill a gap in the rural supplies market. At the time, the business was largely focused on the sheep industry.
Early 1990’s TP Jones acquired the Elders wholesale business that operated in Tasmania.
1995 Significant fire which resulted in total loss in the main showroom.
2005 The business underwent a critical review and developed a simple but effective strategy that saw all operations (new or existing) being customer and sales focused.
2006
“Fee-for-service” agronomy division commenced with the appointment of the current head of business services and current director / shareholder Dr Corey Hogarth. This was set up as an alternative to the “free agronomy services for product sales” approach generally adopted by competitors and saw a significant broadening of the customer base.
2010 Invested (one-third share) in a start-up grain trading business called XLD Grain Pty Ltd (“XLD”) which brought together three partners with expertise in grain trading, price risk management and logistics.
2011
Employed General Manager, Rafe Bell, and expanded business to include Spray Shop Tasmania as a brand to provide expertise in spray application technology and techniques. Also, commenced operation of a satellite store in Longford with this branch becoming the base for agronomic services in 2012.
2015 Commenced importing fertiliser and trialling of a new fertiliser business including offering growers the ability to forward contract fertiliser in much the same way as grain. This business is supported by a fertiliser specialist.
2016
Announced an agreement with Tas Ag Services (“Campbell Town”) in March 2016 to purchase stock, plant & equipment (“P&E”) and goodwill as well as the lease on the premises.
Took over Rural Supplies Longford (“Longford”) in April 2016 through an asset purchase of the stock and P&E, and established a long-term premises lease with the owner. TP Jones previously leased a smaller site in the town and this acquisition upgraded the site and removed a competitor.
Purchased the stock and P&E, and took over the premises and vehicle leases of Landmark’s Latrobe store (“Latrobe”) in May 2016.
Source: TP Jones
For
per
sona
l use
onl
y
Ruralco Holdings Limited Independent Expert’s Report and Financial Services Guide
Page 15 of 53
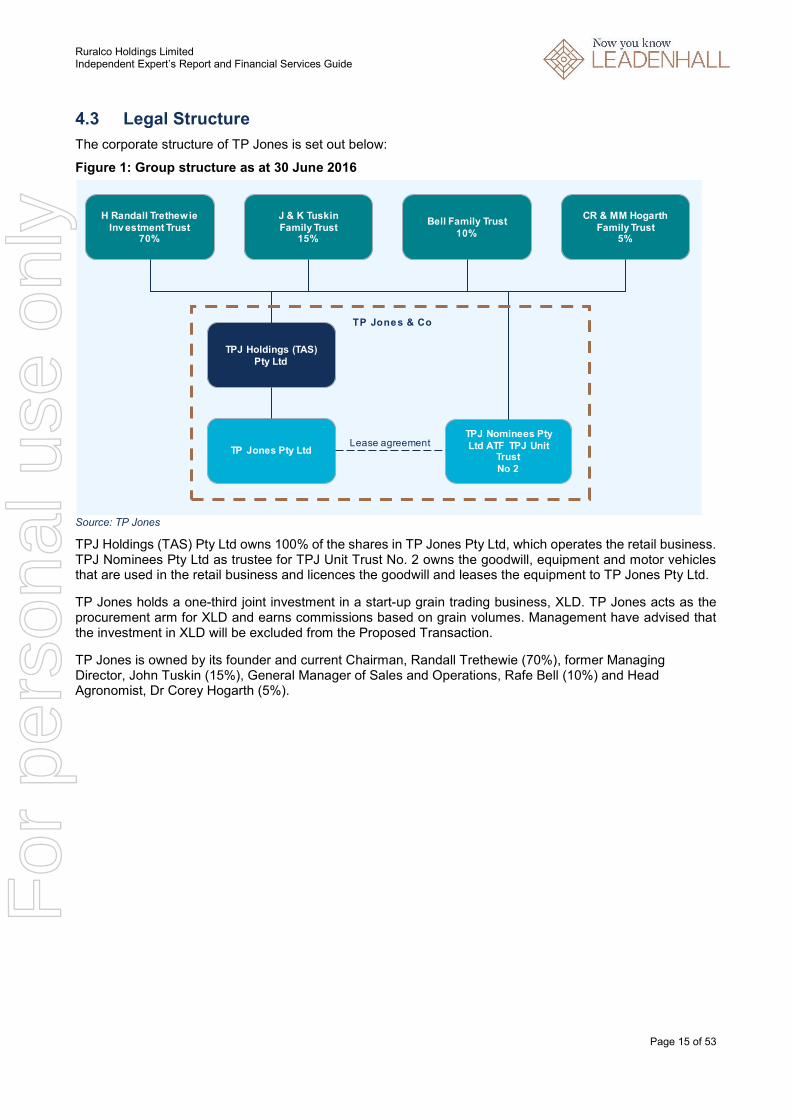
4.3 Legal Structure
The corporate structure of TP Jones is set out below:
Figure 1: Group structure as at 30 June 2016
Source: TP Jones
TPJ Holdings (TAS) Pty Ltd owns 100% of the shares in TP Jones Pty Ltd, which operates the retail business. TPJ Nominees Pty Ltd as trustee for TPJ Unit Trust No. 2 owns the goodwill, equipment and motor vehicles that are used in the retail business and licences the goodwill and leases the equipment to TP Jones Pty Ltd.
TP Jones holds a one-third joint investment in a start-up grain trading business, XLD. TP Jones acts as the procurement arm for XLD and earns commissions based on grain volumes. Management have advised that the investment in XLD will be excluded from the Proposed Transaction.
TP Jones is owned by its founder and current Chairman, Randall Trethewie (70%), former Managing Director, John Tuskin (15%), General Manager of Sales and Operations, Rafe Bell (10%) and Head Agronomist, Dr Corey Hogarth (5%).
Lease agreement
TP Jones & Co
H Randall TrethewieInv estment Trust
70%
J & K TuskinFamily Trust
15%
Bell Family Trust10%
CR & MM HogarthFamily Trust
5%
TPJ Holdings (TAS)Pty Ltd
TPJ Nominees Pty Ltd ATF TPJ Unit
TrustNo 2
TP Jones Pty Ltd
For
per
sona
l use
onl
y

Ruralco Holdings Limited Independent Expert’s Report and Financial Services Guide
Page 16 of 53
4.4 Business and Branches
As a CRT and ProWater member (ProWater is also part of Ruralco), TP Jones has strong links and loyalty to the culture of Ruralco. TP Jones adopts an agronomic and service approach to its business. TP Jones is also ranked alongside Roberts as a premier brand within their market.
The customer base of the business has grown considerably over the last five years with a broad mix of customers consisting of a number of key corporate accounts and other clients.
Youngtown
The Youngtown branch is the most established and includes a secondary brand, ‘Spray Shop Tasmania’, which holds an exclusive dealership for Croplands spray equipment. This is a point of difference within the rural supplies market enabling TP Jones to offer both agronomic and application advice.
The branch also has a high level of foot traffic with cash sales accounting for 15% of total turnover. This foot traffic is leveraged to capture additional high margin convenience sales.
Longford
The recent expansion of the Longford branch through the relocation to a premier site has increased the TP Jones presence in that market. Management also expect to generate increased sales supported by a new seed specialist and increased customer foot-fall due to the improved location. In addition, TP Jones have commenced direct fertiliser sales based out of this store (previously conducted only out of Youngtown). This is supported by the hiring of a fertiliser specialist.
Campbell Town and Latrobe
TP Jones did not have a presence in Campbell Town or Latrobe before the acquisitions of these new stores.
The Campbell Town market comprises larger farms with enterprises that differ from those already serviced by the existing stores. Furthermore, the management team have implemented a focus on agronomy with new specialist employees brought in to facilitate this initiative.
The Latrobe market represents a different market segment as well, with high value crop being planted in this region. The market is also considered relatively drought-proof due to the diversity in both crop-type and environments.
4.5 Products and Services
Product lines offered by TP Jones are largely similar to those offered by other operators in the industry. The main point of differentiation for TP Jones is the fee-for-service and high service / agronomy model.
The following table summarises the different product lines offered by TP Jones with revenue generated from FY14 to FY16.
Figure 2: Summary of Products and Services
Source: TP Jones Note: The minor differences between total sales above and sales revenue per the audited financial statements is due to the treatment
and timing of rebates and year end adjustments. These differences will not have a material impact on our analysis.
Core sales 13,466 16,623 18,247 16.4%
Fertiliser (direct) 3,603 4,666 5,362 22.0%
Agronomy and livestock services 300 360 358 9.2%
Spray Shop Tasmania 862 806 644 -13.6%
Total sales 18,231 22,455 24,611 16.2%
$'000 FY14 FY15 FY16CAGR
(FY14-FY16)
For
per
sona
l use
onl
y

Ruralco Holdings Limited Independent Expert’s Report and Financial Services Guide
Page 17 of 53
In relation to the above, we note the following:
♦ Core sales consist of agricultural and rural supplies such as seeds, fertiliser, livestock & crop production supplies, irrigation equipment, fencing and general merchandise, similar to products offered by competitors
♦ Fertiliser (direct) represents fertiliser sold directly to farms as an agent for a fertiliser manufacturer. Management expects continued growth of this sales channel with the hiring of a fertiliser specialist and the acquisitions of new stores servicing different geographical markets
♦ Agronomy and livestock services relate to fee-for-service technical advice or analysis for a range of agricultural production and management activities. Agronomy services produce high margins compared to general product sales
♦ Spray Shop Tasmania specialises in sales of spraying technology and equipment as well as advice in relation to spray application, equipment maintenance and equipment calibration. While sales have declined from FY14 to FY16, management believe this is largely due to cyclically low levels of capital expenditure across the Tasmanian agricultural industry during the FY16 period and management also believe there is likely to be a step-up in expenditure in the near-term
4.6 Directors and Senior Management
The directors and key management personnel of TP Jones include:
Table 3: Directors and key management personnel
Name Title
Randall Trethewie Founder and Chairman
Rafe Bell Director and General Manager – Sales and Operations
Dr Corey Hogarth Director and General Manager – Business Services
Source: TP Jones Note: John Tuskin has resigned from his position as Managing Director to join Ruralco.
For
per
sona
l use
onl
y
Ruralco Holdings Limited Independent Expert’s Report and Financial Services Guide
Page 18 of 53
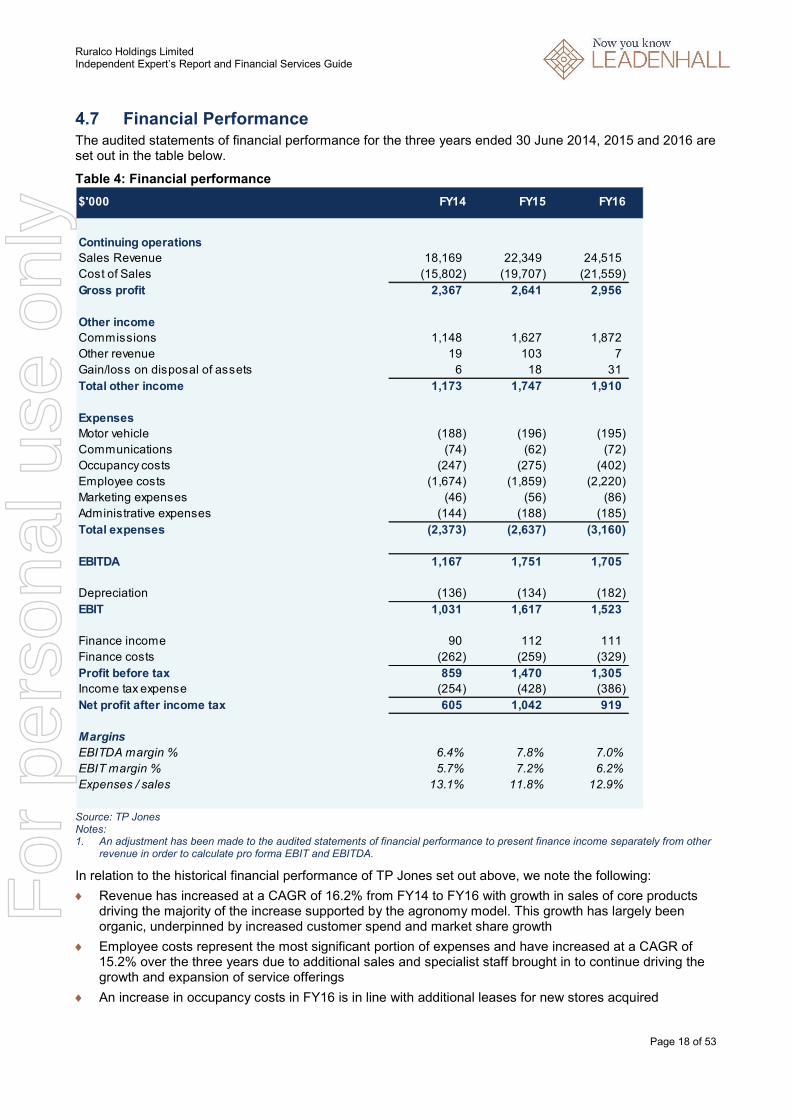
4.7 Financial Performance The audited statements of financial performance for the three years ended 30 June 2014, 2015 and 2016 are set out in the table below.
Table 4: Financial performance
Source: TP Jones Notes: 1. An adjustment has been made to the audited statements of financial performance to present finance income separately from other
revenue in order to calculate pro forma EBIT and EBITDA.
In relation to the historical financial performance of TP Jones set out above, we note the following:
♦ Revenue has increased at a CAGR of 16.2% from FY14 to FY16 with growth in sales of core products driving the majority of the increase supported by the agronomy model. This growth has largely been organic, underpinned by increased customer spend and market share growth
♦ Employee costs represent the most significant portion of expenses and have increased at a CAGR of 15.2% over the three years due to additional sales and specialist staff brought in to continue driving the growth and expansion of service offerings
♦ An increase in occupancy costs in FY16 is in line with additional leases for new stores acquired
Continuing operations
Sales Revenue 18,169 22,349 24,515
Cost of Sales (15,802) (19,707) (21,559)
Gross profit 2,367 2,641 2,956
Other income
Commissions 1,148 1,627 1,872
Other revenue 19 103 7
Gain/loss on disposal of assets 6 18 31
Total other income 1,173 1,747 1,910
Expenses
Motor vehicle (188) (196) (195)
Communications (74) (62) (72)
Occupancy costs (247) (275) (402)
Employee costs (1,674) (1,859) (2,220)
Marketing expenses (46) (56) (86)
Administrative expenses (144) (188) (185)
Total expenses (2,373) (2,637) (3,160)
EBITDA 1,167 1,751 1,705
Depreciation (136) (134) (182)
EBIT 1,031 1,617 1,523
Finance income 90 112 111
Finance costs (262) (259) (329)
Profit before tax 859 1,470 1,305
Income tax expense (254) (428) (386)
Net profit after income tax 605 1,042 919
Margins
EBITDA margin % 6.4% 7.8% 7.0%
EBIT margin % 5.7% 7.2% 6.2%
Expenses / sales 13.1% 11.8% 12.9%
$'000 FY14 FY15 FY16
For
per
sona
l use
onl
y

Ruralco Holdings Limited Independent Expert’s Report and Financial Services Guide
Page 19 of 53
The following table sets out normalised pro forma EBITDA and EBIT for TP Jones for FY15 and FY16.
Table 5: Normalised earnings FY15 and FY16
Source: TP Jones, Ernst & Young and Leadenhall Analysis
The ‘Adjusted EBITDA’ and ‘Adjusted EBIT’ include the following adjustments:
♦ Non-operational revenue includes insurance recoveries for damaged goods, profit on the sale of equipment, dividends received in relation to shares in Ruralco and FBT reimbursements in relation to private usage of directors’ motor vehicles
♦ The deferred rebates relate to rebates received from suppliers every three years subject to meeting certain sales targets. These rebates generated profits of approximately $93,000 in FY15 and it is expected that a similar profit will be realised in 2019. The FY16 adjustment reflects the expected profit split evenly across the three-year timeframe. The FY15 adjustment reallocates a 2/3rd portion of the income received in FY15 (a total of $93,000) back into earlier years
♦ TP Jones currently has a non-executive Chairman who is not involved in the day-to-day operation of TP Jones and is paid a salary and superannuation package as well as fully maintained vehicle, phone and electronic equipment. As these costs are not required for the ongoing operations for a business of this size, these costs have been added back to earnings
♦ Transaction costs incurred in relation to the recent acquisitions and consolidation of business branding and operations, as well as one-off transaction bonuses have been added back to reported EBITDA
♦ As part of TP Jones’s investment in XLD, TP Jones provided storage facilities to XLD (at a rental cost of $25,000). XLD will be incurring the rental costs of the storage facility going forward and therefore, the cost was added back to earnings
♦ The adjustments to annualise earnings for the new stores, Latrobe and Campbell Town, represent the average annual EBITDA for those stores from FY14 to FY15. The lower adjustments in FY16, as compared to FY15, are due to a portion of the results already being incorporated into the FY16 reported EBITDA for the time that those stores were a part of the consolidated business (two months for Latrobe and three months for Campbell Town in FY16)
♦ Depreciation for the new stores is estimated based on historical deprecation for those stores (average of FY14 and FY15 for Latrobe and FY15 only for Campbell Town)
Reported EBITDA 1,751 1,705
Non-operational revenue (28) (50)
Deferred rebates (62) 30
Chairman salary 140 140
Transaction costs - 90
Rent - 25
Latrobe - Annualised results 298 248
Campbell Town - Annualised results 239 179
Adjusted EBITDA 2,338 2,367
Depreciation - Existing stores (134) (182)
Depreciation - New stores (34) (34)
Adjusted EBIT 2,170 2,151
$'000 FY15 FY16
For
per
sona
l use
onl
y

Ruralco Holdings Limited Independent Expert’s Report and Financial Services Guide
Page 20 of 53
4.8 Financial Position
The audited statements of financial position as at 30 June 2014, 2015 and 2016 are set out in the table below.
Table 6: Financial position
Source: TP Jones
In relation to the historical financial position of TP Jones set out above, we note the following:
♦ The high level of inventory at 30 June 2016 is due to the recent acquisitions of the Latrobe and Campbell Town stores. Management expected to reduce inventory levels in the months following the acquisitions. However, this has proven difficult in light of the challenging trading conditions in the first quarter of FY17 caused by severe weather conditions in Tasmania
♦ The acquisitions have also resulted in an increase in both property, plant & equipment and intangible assets. The intangible assets balance represents goodwill
♦ The significant balance of trade and other payables is due to the recent acquisitions which have resulted in higher inventory levels
Current assets
Cash 1 43 102
Trade and other receivables 2,856 3,356 3,400
Inventories 2,562 3,167 5,190
Total current assets 5,419 6,567 8,692
Non-current assets
Investments 256 226 263
Property, plant & equipment 512 681 1,006
Intangible assets 2,612 2,612 3,216
Deferred tax assets 51 48 76
Total non-current assets 3,432 3,567 4,560
Total assets 8,851 10,133 13,253
Current liabilities
Trade and other payables (3,004) (3,005) (4,895)
Borrowings (633) (458) (535)
Provisions (170) (166) (261)
Current tax liabilities (104) (180) (94)
Total current liabilities (3,911) (3,810) (5,784)
Non-current liabilities
Borrowings (2,507) (3,345) (4,059)
Deferred tax liabilities (41) (49) (70)
Total non-current liabilities (2,548) (3,394) (4,129)
Total liabilities (6,459) (7,204) (9,913)
Net assets 2,392 2,929 3,339
$'000 FY14 FY15 FY16
For
per
sona
l use
onl
y

Ruralco Holdings Limited Independent Expert’s Report and Financial Services Guide
Page 21 of 53
4.9 Outlook for TP Jones
Through both organic growth and recent acquisitions, TP Jones has increased its sales and earnings base over the past year. The following factors are likely to contribute to the continuing growth of the business:
♦ The expansion of TP Jones into different geographical markets and market segments through the recent acquisitions represents an opportunity to grow its market share and customer base. Furthermore, management believe that there is significant room for improvement at the new branches
♦ Management believe that there is a significant opportunity to capture a greater share of revenue from corporate clients
♦ Management expects further expansion of the Longford branch with the potential for it to become an agricultural hub for the region and the business. Longford is currently the base for agronomic services
♦ There is significant potential upside in the fertiliser business. Fertiliser supply was previously controlled by fertiliser manufacturers who supplied their products directly to farms. TP Jones has managed to negotiate access to fertiliser supply and is now providing additional fertiliser-related services to farmers such as forward contracts on fertiliser (similar to grain forward contracts), budgeting and customisation of supply to farmers based on their cropping requirements. These services represent a greenfield opportunity and a unique business in the Tasmanian agricultural market
♦ The continuing investment by the government and other parties in the agricultural infrastructure of Tasmania will enable further growth of the local agribusiness industry which TP Jones is a part of
Challenges faced by TP Jones which may hinder its growth are as follows:
♦ Weather patterns indicate that possible droughts and severe weather events may become more frequent over the long term. For example, poor weather conditions in recent months has resulted in poor operating results for the business. Recurrence of severe weather conditions will have a negative influence on the agricultural industry and TP Jones
♦ There is a threat of new entrants to the market given the low capital intensity and minimal barriers to entry. New entrants could potentially be national operators who do not have a presence in Tasmania or operators with existing businesses in Tasmania attempting to expand. Given the recent losses of staff by Roberts to competitors, this could be a significant constraint to the growth of TP Jones. In addition, other national operators would have the capacity to sustain losses for an extended period of time while finding a foothold in the market which could lead to heavy discounting strategies
For
per
sona
l use
onl
y

Ruralco Holdings Limited Independent Expert’s Report and Financial Services Guide
Page 22 of 53
5 VALUATION METHODOLOGY
5.1 Available Valuation Methodologies
To estimate the fair market value of the business of TP Jones we have considered common market practice and the valuation methodologies recommended in RG 111. There are a number of methods that can be used to value a business including:
♦ The discounted cash flow method
♦ The capitalisation of future maintainable earnings method
♦ Asset based methods
♦ Analysis of share market trading
♦ Industry specific rules of thumb
Each of these methods is appropriate in certain circumstances and often more than one approach is applied, at least as a secondary cross-check to a primary method. The choice of methods depends on factors such as the nature of the business being valued, the return on the assets employed in the business, the valuation methodologies usually applied to value such businesses and the availability of the required information. A detailed description of these methods and when they are appropriate is provided in Appendix 2.
5.2 Selection of Valuation Methodology
In selecting an appropriate valuation methodology to value the TP Jones business we have considered the following factors:
♦ TP Jones is neither an asset based business nor an investment holding company. It is also considered to be a going concern, thus an asset based approach is not likely to be the most appropriate
♦ TP Jones has experienced significant organic growth as well as recently acquiring two new stores and relocating a third store to improved premises. This strong growth is expected to continue over the short / medium term and would be expected from a number of comparable listed companies
♦ There are some listed companies with similar businesses to TP Jones and a wide range of listed companies operating in comparable industries with similar profit drivers. We are also aware of a number of comparable transactions involving similar companies. Thus, we consider the CFME approach to be appropriate
♦ TP Jones is not a publicly traded company
♦ We are not aware of any industry specific valuation methodologies appropriate to TP Jones
Accordingly, we are of the opinion that the most appropriate methodology to value the business operated by TP Jones is the CFME method with a cross-check using the DCF method.
For
per
sona
l use
onl
y

Ruralco Holdings Limited Independent Expert’s Report and Financial Services Guide
Page 23 of 53
6 VALUATION OF TP JONES’ BUSINESS
6.1 Capitalisation of Future Maintainable Earnings
Determining the fair market value of the business operated by TP Jones using the CFME approach requires consideration of the following factors:
♦ An appropriate earnings base for assessing maintainable earnings
♦ An appropriate level of maintainable earnings
♦ An appropriate earnings multiple
♦ The value of any non-operating assets and liabilities
These considerations are discussed in more detail below.
6.2 Bases of Maintainable Earnings
The first step in the valuation process is to determine the measure of earnings to be capitalised. The following measures of earnings are often used for business valuations:
♦ Revenue: mostly used for companies that are not expected to be profitable in the near term or as a cross-check of a valuation conclusion derived using another method
♦ EBITDA: most appropriate where depreciation distorts earnings, for example in a company that has a significant level of depreciating assets but little ongoing capital expenditure requirement
♦ EBITA: in most cases EBITA will be more reliable than EBITDA as it takes account of the capital intensity of the business
♦ EBIT: whilst commonly used in practice, multiples of EBITA are usually more reliable as they remove the impact of amortisation which is typically a non-cash accounting entry that may not reflect a need for future capital investment (unlike depreciation)
♦ NPAT: relevant in valuing businesses where interest is a major part of the overall earnings of the group (e.g. financial services businesses such as banks)
Multiples of EBITDA, EBITA and EBIT are commonly used to value the whole business for acquisition purposes where gearing is in the control of the acquirer. In contrast, NPAT (or P/E) multiples are often used for valuing a minority interest in a company as the investor has no control over the level of debt.
We have selected to analyse multiples of both EBITDA and EBIT because:
♦ Earnings multiples based on EBITDA and EBIT are not affected by different financing structures which impact multiples of net profit after tax
♦ The varying capital intensity of the comparable companies means that an analysis of EBIT is useful. As EBITDA is commonly considered in control transactions and some transactional information is only available at the EBITDA level, we have also considered EBITDA multiples
♦ Third party forecasts of EBITA are not readily available making EBITA multiples difficult to calculate without making assumptions about ongoing levels of depreciation (i.e. most brokers do not separately forecast depreciation and amortisation)
6.3 Level of Maintainable Earnings
When considering an appropriate level of future maintainable earnings, it is important to base the analysis on a maintainable level of earnings which includes adjustments for any non-recurring items as these items will not impact the ongoing earnings of the business
In assessing a maintainable level of earnings, we have considered:
♦ Normalised historical EBITDA of approximately $2.5 million and EBIT of approximately $2.3 million as set out in Table 5 in Section 4.7
For
per
sona
l use
onl
y

Ruralco Holdings Limited Independent Expert’s Report and Financial Services Guide
Page 24 of 53
♦ The FY17 Board approved budget of TP Jones for FY17 of an EBITDA of $3.2 million. This budget has been prepared on a branch by branch basis using FY16 actual results as the revenue base for the Youngtown and Longford branches while using the average of FY14 and FY15 for Latrobe and FY15 only for Campbell Town. Operating expenses have been estimated using a detailed bottom-up approach based on a review of staffing, occupancy, marketing, finance and other operating requirements. The budget anticipates significant growth in revenue and EBITDA for FY17 compared to normalised FY16 results driven by the following factors:
• Full year impact of performance improvements expected at the newly-acquired branches which were considered by management to be underperforming
• Anticipated uplift in revenue and earnings from the Longford branch attributable to the larger footprint and increased market share from the acquisition of a competing store
• Growth initiatives being implemented across the branch network driven by the hiring of additional technical / specialist staff with an increased focus on animal health, fertiliser and agronomics
However, there are a number of risks to achieving the FY17 budget including:
• The budget assumes increases in gross profit margins across multiple product lines due to the active targeting of higher margin items and a move towards agency products. There is a risk that attempts to generate higher margins will result in loss of sales volume as products may not be priced as competitively
• Whilst new specialist staff are being hired to support the growth initiatives, a risk remains that the improvements and growth will not be realised to the expected degree
• From discussions with management and analysis recent management accounts TP Jones’ performance for the first three months of FY17 was behind budget due to the effects of severe weather on the Tasmanian agricultural industry. While the effects are likely to impact earnings for several months in the current year, they are deemed to be one-off events and are not expected to be recurring. Financial results in more recent months have been ahead of budget
♦ Near-term consensus growth rates for broadly comparable listed companies with exposure to the Tasmanian market as a broad indication for near term growth in the sector. We note that the consensus EBITDA growth rates for Ruralco and Elders for FY17 and FY18 is 13.8% and 10.3% respectively for Ruralco and 6.7% and 2.2% respectively for Elders
After considering the historical earnings, forecast earnings and margins of comparable companies we have selected the following maintainable earnings:
Table 7: Selected maintainable earnings
Source: Leadenhall analysis
Low High Low High
Selected maintainable earnings 2.7 3.0 2.5 2.8
$'mEBITDA EBIT
For
per
sona
l use
onl
y

Ruralco Holdings Limited Independent Expert’s Report and Financial Services Guide
Page 25 of 53
6.4 Earnings Multiple
The multiples selected to apply to maintainable earnings implicitly reflect expectations about future growth, risk and the time value of money. Multiples can be derived from three main sources:
♦ From the trading prices of companies that are engaged in the same or similar lines of business and that are actively traded on a public stock market
♦ From transactions of significant interests in companies engaged in the same or similar lines of business
♦ From first principles based on an appropriate discount rate and growth expectations
We have conducted an analysis of both public company trading multiples and transaction multiples in order to determine an appropriate earnings multiple to apply to the valuation of the TP Jones business.
In respect of public company trading multiples, there are no specialised agricultural retail companies listed on the ASX. However, there are a number of listed Australian companies that operate in the broader agricultural and retail sectors that have similar profit drivers to TP Jones. We have also included a limited number of overseas companies that operate agricultural retail businesses or that have broadly similar drivers to TP Jones.
The following table sets out the historical and forecast trading EBITDA and EBIT multiples for the selected comparable companies.
Table 8: Trading multiples of comparable companies
Source: FactSet and Leadenhall Analysis as at 6 January 2017
Notes:
1. Australian Agricultural Company has been excluded as it has very high multiples due to the value in the business being driven by its asset base (herd and property values). As such, it is not considered to be a good comparison.
Historical Current Historical Current
Suppliers to agriculture industry
Tractor Supply Company United States 9,926 13.5x 12.5x 16.0x 15.0x
Elders Limited Australia 453 9.1x 8.6x 9.7x 9.1x
Ruralco Holdings Limited Australia 228 7.1x 6.2x 9.1x 7.8x
Apiam Animal Health Ltd. Australia 121 15.0x 8.4x 16.8x 9.5x
Lindsay Australia Limited Australia 109 6.7x 5.7x 18.4x 12.4x
Average 10.3x 8.3x 14.0x 10.8x
Median 9.1x 8.4x 16.0x 9.5x
Manufacturers that supply to agriculture industry
Incitec Pivot Limited Australia 6,192 12.3x 10.2x 19.8x 15.6x
Nufarm Limited Australia 2,471 9.2x 8.1x 12.1x 10.5x
Ridley Corporation Limited Australia 400 8.9x 7.8x 12.7x 10.7x
Average 10.1x 8.7x 14.9x 12.3x
Median 9.2x 8.1x 12.7x 10.7x
Producers and distributors of agricultural products
Costa Group Holdings Ltd. Australia 1,114 15.9x 12.5x 22.8x 17.5x
Select Harvests Limited Australia 490 10.3x 9.4x 13.5x 12.1x
Webster Limited Australia 475 22.0x 15.0x 30.1x 18.3x
Farm Pride Foods Limited Australia 88 5.6x 5.1x 7.2x 6.6x
Wellard Ltd. Australia 86 14.6x n/a nmf n/a
Australian Dairy Farms Limited Australia 36 nmf 12.6x nmf 19.7x
Australian Agricultural Projects Australia 5 11.5x n/a 17.4x n/a
Average 13.3x 10.9x 18.2x 14.8x
Median 13.1x 12.5x 17.4x 17.5x
CompanyMarket
cap ($m)
EBITDA multiple EBIT multipleCountry
For
per
sona
l use
onl
y
Ruralco Holdings Limited Independent Expert’s Report and Financial Services Guide
Page 26 of 53
It should be noted that these multiples are based on trading of minority shareholdings. In contrast, we are considering the value of the business operated by TP Jones on a control basis. Therefore, consideration must be given to observed control premiums in the Australian market and the impact on the minority trading multiples, of the comparable companies, if applied. Further information on control premiums is provided in Appendix 4.
In addition to considering the differences between minority and control multiples, we have also considered the following factors in relation to the comparable company trading multiples in determining an appropriate earnings multiple to apply to the valuation of the TP Jones business:
♦ There are no pure play agricultural retail companies listed in Australia. There is one agricultural retail company (Tractor Supply Company) listed in the United States which is significantly larger in terms of both revenue (US$6 billion) and market cap. TP Jones would likely trade on a lower multiple than this company due to its smaller size
♦ The most comparable Australian companies in terms of operations are Elders and Ruralco which are both agribusiness companies providing various products and services to the agricultural industry. However, these companies are significantly larger and more diversified than TP Jones. All other things being equal, smaller companies tend to trade on lower multiples
♦ The above manufacturing companies generally produce higher margins than distribution / retail companies. TP Jones generates margins lower than the manufacturing companies but higher than the large, diversified agribusiness companies due in part to its retail model as well as its position in the Tasmanian agri-retail market. All things being equal, companies with higher margins tend to trade on higher multiples. TP Jones would likely trade on a high multiple due to the quality of its earnings
♦ The most comparable Australian companies, in terms of size (market cap), supplying goods or services to the agricultural industry are Apiam Animal Health and Lindsay Australia. However, Lindsay Australia is a more capital intensive business with a heavier focus on the logistics segment of its business which also produces higher margins
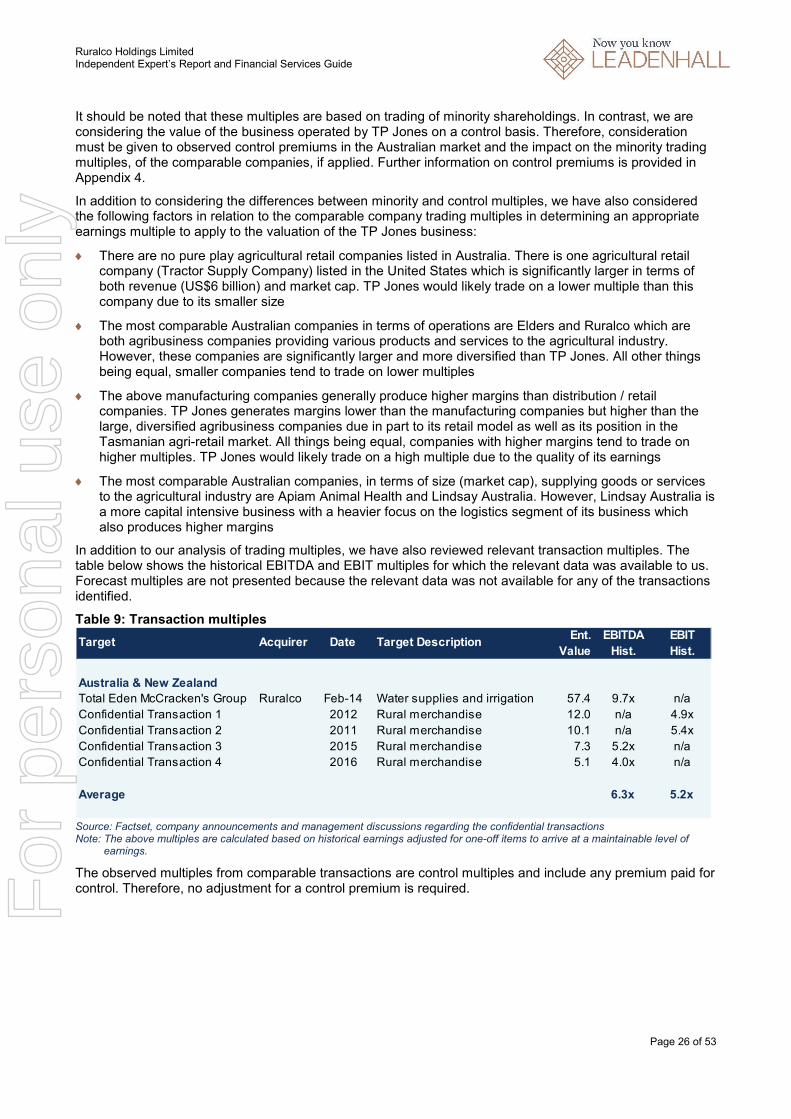
In addition to our analysis of trading multiples, we have also reviewed relevant transaction multiples. The table below shows the historical EBITDA and EBIT multiples for which the relevant data was available to us. Forecast multiples are not presented because the relevant data was not available for any of the transactions identified.
Table 9: Transaction multiples
Source: Factset, company announcements and management discussions regarding the confidential transactions Note: The above multiples are calculated based on historical earnings adjusted for one-off items to arrive at a maintainable level of
earnings.
The observed multiples from comparable transactions are control multiples and include any premium paid for control. Therefore, no adjustment for a control premium is required.
Hist. Hist.
Australia & New Zealand
Total Eden McCracken's Group Ruralco Feb-14 Water supplies and irrigation 57.4 9.7x n/a
Confidential Transaction 1 2012 Rural merchandise 12.0 n/a 4.9x
Confidential Transaction 2 2011 Rural merchandise 10.1 n/a 5.4x
Confidential Transaction 3 2015 Rural merchandise 7.3 5.2x n/a
Confidential Transaction 4 2016 Rural merchandise 5.1 4.0x n/a
Average 6.3x 5.2x
EBITDA EBITTarget Acquirer Date Target Description
Ent.
Value
For
per
sona
l use
onl
y

Ruralco Holdings Limited Independent Expert’s Report and Financial Services Guide
Page 27 of 53
We have considered the following factors in relation to the above transaction multiples in determining an appropriate earnings multiple to apply to the valuation of the TP Jones business:
♦ The above acquisitions were made on an arm’s length basis and therefore provide direct comparisons to the Proposed Transaction
♦ The Total Eden transaction occurred at a relatively high multiple compared to the smaller rural supplies businesses. In addition, Total Eden operates a water supplies, management and irrigation business with 37 retail branches, significantly larger than TP Jones. Given the relatively small size of TP Jones, it would likely attract a smaller multiple than this transaction
♦ The rural merchandise transactions are closer in size to TP Jones with similar business models and sizes of their branch networks. It would be expected that TP Jones would attract a similar multiple to these smaller transactions
♦ Confidential Transaction 1 was not for a full controlling stake (50.1%) and a significant amount of influence was still capable of being exerted by the vendor. The transaction would likely have attracted a higher multiple if a larger stake had been acquired
♦ TP Jones generates earnings margins at the higher end of the range of margins produced by the above companies. All other things being equal, higher margins tend to attract higher multiples
Our key considerations in selecting appropriate earnings multiples to apply to our valuation of the TP Jones business are summarised below:
♦ We have placed more reliance on the transaction multiples as guidance in selecting earnings multiples on a control basis
♦ We have considered what the selected control multiples may convert to in terms of minority multiples and compared this to the observed trading multiples of comparable companies
♦ We have considered the potential synergies available to Ruralco or another potential buyer of the business. Ruralco management have estimated a range of potential synergies which include cost savings from procurement, site consolidation as well as leveraging Ruralco’s agency businesses. We consider that similar synergies could be achieved by other potential buyers of the business. The availability of synergies is often a component of the control premium paid to acquire control of a business. The transactions we have considered are control transactions and would therefore include a control premium inclusive of any synergies to the extent they were available to the acquirer and that there was sufficient tension in the sales process to compel the acquirer to pay for such synergies. As TP Jones provides access to a broad geographic footprint in a market with relatively less competition than mainland Australia, the potential synergies available may be greater than some of the smaller transactions identified above
♦ Although we have allowed for substantial growth in the selected maintainable earnings, we consider that there is still potential for additional growth in the medium term over and above our selected level of maintainable earnings. This growth is in addition to the potential synergies discussed above and is expected to be driven by the growth initiatives currently being implemented over the coming years as well as continuing investment in agronomy and other services
Based on the above, we have selected the following earnings multiples to apply to our valuation of the business operated by TP Jones:
Table 10: Selected earnings multiples
Source: Leadenhall analysis
Low High Low High
Selected earnings multiples 5.0 5.5 5.5 6.0
$'mEBITDA EBIT
For
per
sona
l use
onl
y
Ruralco Holdings Limited Independent Expert’s Report and Financial Services Guide
Page 28 of 53
6.5 Non-Operating Assets and Liabilities
The multiplication of maintainable earnings by a selected control multiple results in an enterprise or business value. In order to assess the equity value (value to shareholders) it is necessary to allow for non-operating assets and liabilities. These can be:
♦ Surplus assets: assets held by the company that are not utilised in its business operations
♦ Net debt: comprising of debt used to fund a business, less surplus cash held by the company
♦ Non-operating liabilities: liabilities of a company not directly related to its current business operations
No surplus assets, net debt or non-operating liabilities are being acquired as part of the Proposed Transaction.
We note that 70% of the value of accrued long service and annual leave balances of transferring employees at completion will be deducted from the agreed price of $16 million. We have included this in determining the value of the consideration as detailed in Section 1.1. As such, we have not allowed for this in assessing the value of the business of TP Jones.
We have also assumed that the level of working capital upon completion is equivalent to the target working capital of $4.0 million as set out in the terms of the Proposed Transaction. This target working capital is assumed to be representative of a normal level of working capital. As such, no adjustment is required in respect of working capital.
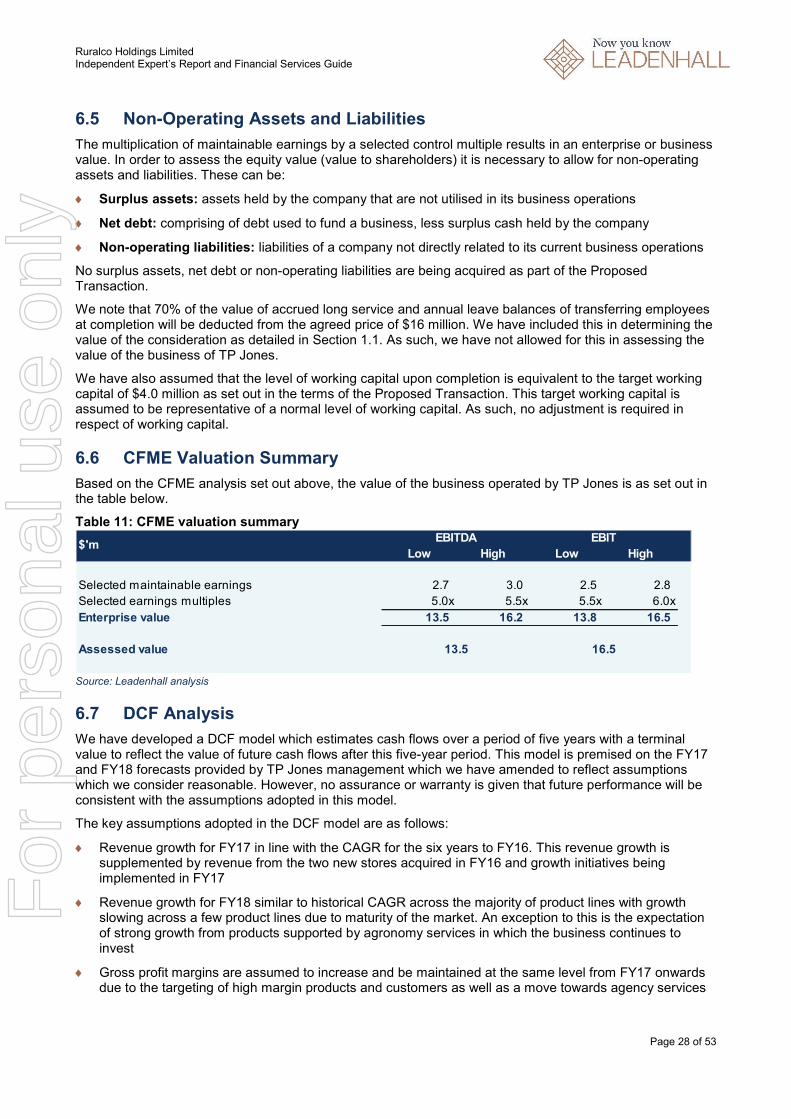
6.6 CFME Valuation Summary
Based on the CFME analysis set out above, the value of the business operated by TP Jones is as set out in the table below.
Table 11: CFME valuation summary
Source: Leadenhall analysis
6.7 DCF Analysis
We have developed a DCF model which estimates cash flows over a period of five years with a terminal value to reflect the value of future cash flows after this five-year period. This model is premised on the FY17 and FY18 forecasts provided by TP Jones management which we have amended to reflect assumptions which we consider reasonable. However, no assurance or warranty is given that future performance will be consistent with the assumptions adopted in this model.
The key assumptions adopted in the DCF model are as follows:
♦ Revenue growth for FY17 in line with the CAGR for the six years to FY16. This revenue growth is supplemented by revenue from the two new stores acquired in FY16 and growth initiatives being implemented in FY17
♦ Revenue growth for FY18 similar to historical CAGR across the majority of product lines with growth slowing across a few product lines due to maturity of the market. An exception to this is the expectation of strong growth from products supported by agronomy services in which the business continues to invest
♦ Gross profit margins are assumed to increase and be maintained at the same level from FY17 onwards due to the targeting of high margin products and customers as well as a move towards agency services
Low High Low High
Selected maintainable earnings 2.7 3.0 2.5 2.8
Selected earnings multiples 5.0x 5.5x 5.5x 6.0x
Enterprise value 13.5 16.2 13.8 16.5
Assessed value
$'mEBITDA EBIT
16.513.5
For
per
sona
l use
onl
y

Ruralco Holdings Limited Independent Expert’s Report and Financial Services Guide
Page 29 of 53
♦ Operating expenses are forecast to increase significantly to support the agronomy service model which is primarily labour driven
♦ Capital expenditure is assumed to increase in line with revenue growth based on the historical capital requirements of the business as a proportion of revenue
♦ We have assumed working capital reinvestment based on debtor days of 50, inventory days of 60 and creditor days of 60 which is in line with historical averages
♦ Cost savings of $0.25 million which represent approximately 50% of the anticipated efficiencies from procurement, personnel and other administrative functions as estimated by Ruralco but which we consider would reasonably be achievable by other market participants
♦ A terminal growth rate of 2.5% which is in line with inflation rates
♦ A weighted average cost of capital of 14.0% to 15.0% based on the assumptions set out in Appendix 5
Based on the above assumptions, the value of the TP Jones business, inclusive of the above synergies, is in the range of $16.8 million to $17.4 million. Excluding synergies, the value of the business is in the range of $15.2 million to $15.8 million. This is supportive of the higher end of the valuation range derived from the CFME method.
The above assumptions are intended to reflect the assumptions that could reasonably be adopted by market participants in their pricing of similar business. We note that the assumptions described above are subject to considerable uncertainty and that potential acquirers of the TP Jones business may make significantly different assumptions. Further, the assessed value of the TP Jones business could vary materially based on changes in certain key assumptions. Accordingly, we have conducted a sensitivity analysis below to highlight the impact on the value caused by movements in key assumptions. To assess the impact of variations in key assumptions, we have analysed the sensitivity of the mid-point of our valuation range to changes in the following key assumptions:
♦ Revenue growth (+/- 3%): Revenue growth is primarily driven by the full-year revenue from new acquisitions and forecast growth initiatives. These key drivers could be impacted in the future by maturity of the market, successful implementation of growth initiatives and lower than expected revenue attributable to the new branches
♦ Gross margin (+/- 1%): The drivers for gross margin could be affected by competition which would impede the ability for TP Jones to raise prices to capture more margin
♦ Capital expenditure (+/- 1%): Capital expenditure is assumed based on historical capital requirements of the business as a percentage of revenue. A change in capital requirements going forward will have an effect on future capital expenditure
♦ Overhead costs (+/- 1%): Overheads are comprised mainly of fixed costs such as salaries and occupancy costs
♦ Discount rate (+/- 1%): The valuation is sensitive to the weighted average cost of capital adopted as the discount rate in the valuation
♦ Synergies (+/- 10%): Synergies contribute significantly to the value of the transaction. The ability to realise the synergies is dependent on implementation of the cost saving strategies envisaged by management
For
per
sona
l use
onl
y

Ruralco Holdings Limited Independent Expert’s Report and Financial Services Guide
Page 30 of 53
The output of this sensitivity analysis, based on the midpoint of the DCF valuation range including synergies ($17.1 million), is summarised in the figure below.
Figure 3: Sensitivity analysis ($'m)
Source: Leadenhall analysis
As shown in the figure above, our DCF analysis is most sensitive to changes in revenue growth. This is primarily due to the impact of significant revenue growth increasing the earnings base of the business. A 10% change in the anticipated synergies has little impact on the total value of TP Jones’ business.
17.0
16.6
16.1
16.1
14.2
13.5
17.3
17.8
18.1
18.2
20.0
21.0
12 13 14 15 16 17 18 19 20 21 22
Synergies (+/- 10%)
Discount rate (+/- 1%)
Overheads (+/- 1%)
Capex (+/- 1%)
Gross margin % (+/-1%)
Revenue Growth (+/- 3%)
For
per
sona
l use
onl
y

Ruralco Holdings Limited Independent Expert’s Report and Financial Services Guide
Page 31 of 53
7 EVALUATION OF THE PROPOSED TRANSACTION
7.1 Fairness
We have assessed whether the Proposed Transaction is fair by comparing our assessed fair market value of the business operated by TP Jones on a control basis with the Consideration. This comparison is set out in the table below.
Table 12: Assessment of fairness
Source: Leadenhall analysis
Since the Consideration is within the assessed range of values of the TP Jones business the Proposed Transaction is fair to Shareholders.
7.2 Reasonableness
We have defined the Proposed Transaction as reasonable if it is fair, or if despite not being fair, there are sufficient reasons for Shareholders to vote for the proposal. We have therefore considered the following advantages and disadvantages of the Proposed Transaction to Shareholders.
Advantages
♦ In line with Ruralco strategy: Ruralco has a stated strategy of targeted expansion of its retail footprint. Tasmania represents a desirable market for this expansion with significant growth expected in the agricultural sector over the long-term. TP Jones services producers of high value commodities throughout a key region with secure access to water which is consistent with Ruralco’s strategy
♦ Potential synergies which have not been fully factored into purchase price: Ruralco management have estimated a range of potential synergies which include cost savings from procurement and other efficiencies of approximately $0.5 million. Additionally, Ruralco has identified potential synergies such as site consolidation as well as leveraging Ruralco’s agency businesses (i.e. real estate, wool & livestock) across TP Jones. These aspects have not been quantified but are expected to have a meaningful contribution to future profitability of the combined business with limited risks to achieving these benefits
♦ Access to key management: TP Jones has a highly experienced management team and Ruralco believes the merger will achieve the required cultural and operational changes to improve the performance of the Roberts business
♦ Expected to be accretive to EPS: Ruralco have estimated that the Proposed Transaction will be EPS accretive
Disadvantages
The main disadvantages of the Proposed Transaction are:
♦ Increased gearing: If the Proposed Transaction proceeds, the gearing for Ruralco will increase moderately as the consideration is anticipated to be debt funded
♦ Purchase price includes an element of synergies which may not be achieved: Based on our analysis, the purchase price includes an element of the synergies expected to be realised by Ruralco. Whilst the synergies quantified by Ruralco pertain to relatively low risk cost savings, there is a risk that the synergies will not be realised to the extent expected
Conclusion on reasonableness
As the Proposed Transaction is fair it is also reasonable.
Fair market value of TP Jones' business 13.5 16.5
Consideration 15.8 15.8
$'m Low High
For
per
sona
l use
onl
y

Ruralco Holdings Limited Independent Expert’s Report and Financial Services Guide
Page 32 of 53
7.3 Opinion
The Proposed Transaction is fair and reasonable to Shareholders.
We have evaluated the Proposed Transaction for the Shareholders as a whole. We have not considered its effect on the particular circumstances of individual investors. Due to their personal circumstances, individual investors may place a different emphasis on various aspects of the Proposed Transaction from the one adopted in this report. Accordingly, individuals may reach a different conclusion to ours on whether the Proposed Transaction is fair and reasonable. If in doubt investors, should consult an independent financial adviser about the impact of this Proposed Transaction on their specific financial circumstances.
For
per
sona
l use
onl
y

Ruralco Holdings Limited Independent Expert’s Report and Financial Services Guide
Page 33 of 53
8 EVALUATION OF THE BREAK FEE
8.1 Approach
In evaluating whether the Break Fee is representative of arm’s length terms we have considered the following factors:
♦ How the terms of the overall transaction compare with those of any comparable transactions between parties dealing on an arm’s length basis in similar circumstances
♦ The nature and content of the bargaining process, including whether the entity followed robust protocols to ensure that conflicts of interest were appropriately managed in negotiating and structuring the transaction
♦ The impact of the transaction on the company
Our consideration of each of the above factors is set out below
8.2 Comparable Transaction Analysis
Arrangements to pay break fees (also known as termination or reimbursement fees) are a common feature in transactions. Typically, a break fee transfers the risk of paying some or all of the advisory and other costs if the deal does not proceed.
We have undertaken an analysis of ASX announcements of all completed takeover transactions in Australia over the last 5 years with a transaction size (on a controlling basis) of less than $100 million. As a result of this analysis we identified 63 transactions for which information on break fees was available. A summary of the outcome of this analysis is set out below:
Table 13: Summary of transaction analysis
$ As a % of
transaction price Minimum 50,000 0.1% Maximum 2,150,000 17.7% Average 460,371 2.2% Median 324,982 1.3%
Source: Leadenhall analysis, Factset, ASX announcements
As set out above:
♦ The absolute value of the Break Fee ($500,000) is in line with the average observed in transactions of broadly comparable size
♦ The Break Fee as a percentage of the transaction price for TP Jones is 3.1% which is above the average of the transactions identified. We note that the Takeovers panel has stated that it considers that 1% of the value of the bid is a useful guideline as to what amount is reasonable for a break-fee but acknowledges that in ‘low-value’ bids the costs may reasonably exceed 1%, whereas in high-value bids a fee of 1% may be excessive. We do not consider the Break Fee as a percentage of the transaction price to be unreasonable given the level of disruption to the TP Jones business as a consequence of the Proposed Transaction
♦ We have also analysed break fees as a percentage of transaction price for transaction sizes of less than $25 million. While this reduces the sample size to 22 transactions, we note that the average break fees for these transactions is 3.4% of the transaction price which is more than the Break Fee agreed to be paid to TP Jones of 3.1%
For
per
sona
l use
onl
y

Ruralco Holdings Limited Independent Expert’s Report and Financial Services Guide
Page 34 of 53
Negotiation process
Consideration of the nature and content of the bargaining process, including how the transaction was initiated, structured, negotiated and disclosed to directors, is also relevant in determining whether the terms of a related party transaction are arm’s length.
We note that in respect of the Break Fee and the Proposed Transaction as a whole:
♦ The terms were negotiated by TP Jones and their advisers and Ruralco management. Mr Tuskin was not included in the negotiations
♦ Based on discussions with the parties involved, we understand that the negotiation process was conducted on normal arm’s length terms and included both parties making compromises on aspects of the terms of the transaction. In particular, TP Jones and their advisers initially sought a higher break fee but after further negotiations the amount was reduced
♦ All aspects of the transaction were formally documented
Based on the above, there is nothing that would indicate that the negotiation process was not an arm’s length process.
Impact on the company
We note that in respect of the Break Fee:
♦ Any requirement to pay the Break Fee would have a negligible impact on the financial position of Ruralco
♦ A break fee is a not an unusual component of a transaction such as this. Since the Break Fee helps facilitate the Proposed Transaction, which we have assessed as fair and reasonable, then we consider the Break Fee is a reasonable component of the Proposed Transaction
8.3 Opinion
Based on our analysis and considerations above, there is nothing that has come to our attention to indicate that the Break Fee is not representative of arm’s length terms in accordance with Chapter 2E.
For
per
sona
l use
onl
y

Ruralco Holdings Limited Independent Expert’s Report and Financial Services Guide
Page 35 of 53
: GLOSSARY
Term Meaning
ASIC
Australian Securities and Investments Commission
Break Fee A break fee of $0.5 million payable to TP Jones in the event that
shareholder approval is not obtained and the Proposed Transaction does
not complete
CAGR Compound annual growth rate
Campbell Town Former Tas Ag Services store in Campbell Town
CAPM Capital asset pricing model
CFME Capitalisation of future maintainable earnings
Chapter 2E Chapter 2E of the Corporations Act
Consideration Consideration of $16 million
CRT Combined Rural Traders – A buying group of independent rural traders
DCF Discounted cash flow
EBIT Earnings before interest and tax
EBITA Earnings before interest, tax and amortisation
EBITDA Earnings before interest, tax, depreciation and amortisation
EPS Earnings per share
Fair market value The price, expressed in terms of cash equivalents, at which property would
change hands between a hypothetical willing and able buyer and a
hypothetical willing and able seller, acting at arm’s length in an open and
unrestricted market, when neither is under compulsion to buy or sell and
when both have reasonable knowledge of the relevant facts
FOS Financial Ombudsman Service
FSG Financial Services Guide
FY Financial year
IER Independent Expert’s Report
Latrobe Former Landmark Latrobe store in Latrobe
Leadenhall Leadenhall Corporate Advisory Pty Ltd
Listing Rule 10 ASX Listing Rule 10.10.2
Longford Former Rural Supplies Longford store in Longford
NOM Notice of meeting in relation to the Proposed Transaction
NPAT Net profit after tax
P/E Price to earnings
Proposed Transaction The proposed acquisition of the business of TP Jones by Roberts
RG 76 Regulatory Guide 76: Related Party Transactions
RG 111 Regulatory Guide 111: Content of Expert Reports
Roberts Roberts Limited
Ruralco Ruralco Holdings Limited
Shareholders Current Ruralco shareholders not associated withTP Jones
TP Jones TP Jones & Co
US United States
Vendors TPJ Nominees Pty Ltd as trustee for the TPJ Unit Trust No. 2 and TP Jones
Pty Ltd
WACC Weighted average cost of capital
XLD XLD Grain Pty Ltd
For
per
sona
l use
onl
y
Ruralco Holdings Limited Independent Expert’s Report and Financial Services Guide
Page 36 of 53
: VALUATION METHODOLOGIES
In preparing this report we have considered valuation methods commonly used in practice and those recommended by RG 111. These methods include:
♦ The discounted cash flow method
♦ The capitalisation of earnings method
♦ Asset based methods
♦ Analysis of share market trading
♦ Industry specific rules of thumb
The selection of an appropriate valuation method to estimate fair market value should be guided by the actual practices adopted by potential acquirers of the company involved.
Discounted Cash Flow Method
Description
Of the various methods noted above, the discounted cash flow method has the strongest theoretical standing. It is also widely used in practice by corporate acquirers and company analysts. The discounted cash flow method estimates the value of a business by discounting expected future cash flows to a present value using an appropriate discount rate. A discounted cash flow valuation requires:
♦ A forecast of expected future cash flows
♦ An appropriate discount rate
It is necessary to project cash flows over a suitable period of time (generally regarded as being at least five years) to arrive at the net cash flow in each period. For a finite life project or asset this would need to be done for the life of the project. This can be a difficult exercise requiring a significant number of assumptions such as revenue growth, future margins, capital expenditure requirements, working capital movements and taxation.
The discount rate used represents the risk of achieving the projected future cash flows and the time value of money. The projected future cash flows are then valued in current day terms using the discount rate selected.
The discounted cash flow method is often sensitive to a number of key assumptions such as revenue growth, future margins, capital investment, terminal growth and the discount rate. All of these assumptions can be highly subjective sometimes leading to a valuation conclusion presented as a range that is too wide to be useful.
Use of the Discounted Cash Flow Method
A discounted cash flow approach is usually preferred when valuing:
♦ Early stage companies or projects
♦ Limited life assets such as a mine or toll concession
♦ Companies where significant growth is expected in future cash flows
♦ Projects with volatile earnings
It may also be preferred if other methods are not suitable, for example if there is a lack of reliable evidence to support a capitalisation of earnings approach. However, it may not be appropriate if:
♦ Reliable forecasts of cash flow are not available and cannot be determined
♦ There is an inadequate return on investment, in which case a higher value may be realised by liquidating the assets than through continuing the business
For
per
sona
l use
onl
y

Ruralco Holdings Limited Independent Expert’s Report and Financial Services Guide
Page 37 of 53
Capitalisation of Earnings Method
Description
The capitalisation of earnings method is a commonly used valuation methodology that involves determining a future maintainable earnings figure for a business and multiplying that figure by an appropriate capitalisation multiple. This methodology is generally considered a short form of a discounted cash flow, where a single representative earnings figure is capitalised, rather than a stream of individual cash flows being discounted. The capitalisation of earnings methodology involves the determination of:
♦ A level of future maintainable earnings
♦ An appropriate capitalisation rate or multiple.
A multiple can be applied to any of the following measures of earnings:
Revenue – most commonly used for companies that do not make a positive EBITDA or as a cross-check of a valuation conclusion derived using another method.
EBITDA - most appropriate where depreciation distorts earnings, for example in a company that has a significant level of depreciating assets but little ongoing capital expenditure requirement.
EBITA - in most cases EBITA will be more reliable than EBITDA as it takes account of the capital intensity of the business.
EBIT - whilst commonly used in practice, multiples of EBITA are usually more reliable as they remove the impact of amortisation which is a non-cash accounting entry that does not reflect a need for future capital investment (unlike depreciation).
NPAT - relevant in valuing businesses where interest is a major part of the overall earnings of the group (e.g. financial services businesses such as banks).
Multiples of EBITDA, EBITA and EBIT are commonly used to value whole businesses for acquisition purposes where gearing is in the control of the acquirer. In contrast, NPAT (or P/E) multiples are often used for valuing minority interests in a company.
The multiple selected to apply to maintainable earnings reflects expectations about future growth, risk and the time value of money all wrapped up in a single number. Multiples can be derived from three main sources. Using the guideline public company method, market multiples are derived from the trading prices of stocks of companies that are engaged in the same or similar lines of business and that are actively traded on a free and open market, such as the ASX. The merger and acquisition method is a method whereby multiples are derived from transactions of significant interests in companies engaged in the same or similar lines of business. It is also possible to build a multiple from first principles.
Use of the Capitalisation of Earnings Method
The capitalisation of earnings method is widely used in practice. It is particularly appropriate for valuing companies with a relatively stable historical earnings pattern which is expected to continue. This method is less appropriate for valuing companies or assets if:
♦ There are no suitable listed company or transaction benchmarks for comparison
♦ The asset has a limited life
♦ Future earnings or cash flows are expected to be volatile
♦ There are negative earnings or the earnings of a business are insufficient to justify a value exceeding the value of the underlying net assets F
or p
erso
nal u
se o
nly

Ruralco Holdings Limited Independent Expert’s Report and Financial Services Guide
Page 38 of 53
Asset Based Methods
Description
Asset based valuation methods estimate the value of a company based on the realisable value of its net assets, less its liabilities. There are a number of asset based methods including:
♦ Orderly realisation
♦ Liquidation value
♦ Net assets on a going concern basis
♦ Replacement cost
♦ Reproduction cost
The orderly realisation of assets method estimates fair market value by determining the amount that would be distributed to shareholders, after payment of all liabilities including realisation costs and taxation charges that arise, assuming the company is wound up in an orderly manner. The liquidation method is similar to the orderly realisation of assets method except the liquidation method assumes the assets are sold in a shorter time frame. Since wind up or liquidation of the company may not be contemplated, these methods in their strictest form may not necessarily be appropriate. The net assets on a going concern basis method estimates the market values of the net assets of a company but does not take account of realisation costs.
The asset / cost approach is generally used when the value of the business’ assets exceeds the present value of the cash flows expected to be derived from the ongoing business operations, or the nature of the business is to hold or invest in assets. It is important to note that the asset approach may still be the relevant approach even if an asset is making a profit. If an asset is making less than an economic rate of return and there is no realistic prospect of it making an economic return in the foreseeable future, an asset approach would be the most appropriate method.
Use of Asset Based Methods
An asset-based approach is a suitable valuation method when:
♦ An enterprise is loss making and is not expected to become profitable in the foreseeable future
♦ Assets are employed profitably but earn less than the cost of capital
♦ A significant portion of the company’s assets are composed of liquid assets or other investments (such as marketable securities and real estate investments)
♦ It is relatively easy to enter the industry (for example, small machine shops and retail establishments)
Asset based methods are not appropriate if:
♦ The ownership interest being valued is not a controlling interest, has no ability to cause the sale of the company’s assets and the major holders are not planning to sell the company’s assets
♦ A business has (or is expected to have) an adequate return on capital, such that the value of its future income stream exceeds the value of its assets
Analysis of Share Trading
The most recent share trading history provides evidence of the fair market value of the shares in a company where they are publicly traded in an informed and liquid market. There should also be some similarity between the size of the parcel of shares being valued and those being traded. Where a company’s shares are publicly traded then an analysis of recent trading prices should be considered, at least as a cross-check to other valuation methods.
Industry Specific Rules of Thumb
Industry specific rules of thumb are used in certain industries. These methods typically involve a multiple of an operating figure such as eyeballs for internet businesses, numbers of beds for hotels etc. These methods are typically fairly crude and are therefore usually only appropriate as a cross-check to a valuation determined using an alternative method.
For
per
sona
l use
onl
y

Ruralco Holdings Limited Independent Expert’s Report and Financial Services Guide
Page 39 of 53
: COMPARABLE ENTITIES
The following company descriptions are extracted from descriptions provided by FactSet.
Company Description
Apiam Animal Health Ltd.
Apiam Animal Health Ltd. engages in providing genetics, veterinary services, wholesale and retail of related products, together with technical services related to food-chain security. It engages in the following segments Veterinary Consulting, Products and Ancillary & Support Services. The company was by Chris Richards founded in 1998 and is headquartered in East Bendigo, Australia.
Australian Agricultural Company Limited
Australian Agricultural Co. Ltd. engages in the ownership and operation of feedlots and farms for the production of beef and agricultural products. It operates through the following segments: Grassfed, Grainfed, Northern Beef, and Corporate. The company was founded in 1824 and is headquartered in Brisbane, Australia.
Australian Agricultural Projects Ltd.
Australian Agricultural Projects Ltd. engages in the management and operations of an olive grove. Its portfolio includes Victorian Olive Oil Project I, Victorian Olive Oil Project II, and Peppercorn Estate Limited. The company was founded in January 2003 and is headquartered in Hampton East, Australia.
Australian Dairy Farms Limited
Australian Dairy Farms Ltd. engages in the financial services industry. It proposes to enter the Australian dairy industry as a farm owner and operator to produce fresh milk for sale to milk processors. The company was founded by Paul I. Malcolm in 1992 and is headquartered in Brisbane, Australia.
Costa Group Holdings Ltd.
Costa Group Holdings Ltd. engages in horticultural business. It operates through the following segments: Produce, International and Costa Farms & Logistics. Produce segment operates in four categories: berries, mushrooms, glasshouse-grown tomatoes and citrus. The company is headquartered in Ravenhall, Australia.
Elders Limited
Elders Ltd. engages in providing financial, real estate services to rural, agricultural and automotive businesses. The company operates its business through the following segments: Network, Feed and Processing, Live Export and Other. The company was founded by Alexander Lang Elder in 1839 and is headquartered in Adelaide, Australia.
Farm Pride Foods Limited
Farm Pride Foods Ltd. engages in the production, processing, and selling of egg and egg related products. Its activities include grades, packs, processes, supplies and markets shell eggs and process egg products within Australia and Asia. The company was founded in 1937 and is headquartered in Melbourne, Australia.
Incitec Pivot Limited
Incitec Pivot Ltd. manufactures and markets commercial explosives and fertilizers. The company operates through the following segments: Explosives and Fertilizers. Incitec Pivot was founded in 2003 and is headquartered in Melbourne, Australia.
Lindsay Australia Limited
Lindsay Australia Ltd. provides transport, logistics and rural supply services. It operates through the Transport and Rural segments. The company was founded in 1953 and is headquartered in Brisbane, Australia.
Nufarm Limited
Nufarm Ltd. engages in the manufacture and marketing of agricultural crop protection products. It operates through the Crop Protection and Seed Technologies segments. The company was founded by Maxwell A. Fremder on May 21, 1957 and is headquartered in Melbourne, Australia.
For
per
sona
l use
onl
y

Ruralco Holdings Limited Independent Expert’s Report and Financial Services Guide
Page 40 of 53
Company Description
Ridley Corporation Limited
Ridley Corp. Ltd. produces and markets stock feed and animal feed supplements. It operates through AgriProducts and Property segments. The AgriProducts segment engages in the supply of animal nutrition solutions. The Property Segment is the realisation of opportunities in respect of surplus property assets and sales of residual property site assets. The company was founded in 1987 and is headquartered in Melbourne, Australia.
Ruralco Holdings Limited
Ruralco Holdings Ltd. provides merchandising services. It operates through the Rural Services and Financial Services segments. The Rural Services segment offers livestock agency, wool broking, rural merchandise, rural machinery service and sales, water broking, real estate operations and stockfeed manufacture, seed, and grain marketing. The Financial Services segment comprises of finance broking and agricultural advisory services. The company was founded in 1865 and is headquartered in Hobart, Australia.
Select Harvests Limited
Select Harvests Ltd. engages in almond farming, processing and marketing company. It engages in the processing, packaging, marketing and distribution of edible nuts, dried fruits, seeds, and a range of natural health products. It also provides management services to external owners of almond orchards, including orchard development, tree supply, farm management, land rental and irrigation infrastructure, and the marketing selling of almonds on behalf of external investors. The company operates through the following segments: Food Division and Almond Division. Select Harvests is headquartered in Thomastown, Australia.
Tractor Supply Company
Tractor Supply Co. engages in the retail sale of farm and ranch products. It operates retail farm and ranch stores and focuses on supplying the lifestyle needs of recreational farmers and ranchers, as well as tradesmen and small businesses. The firm operates its retail stores under the names: Tractor Supply Company, Del's Feed & Farm Supply, and HomeTown Pet. Its product categories include livestock and pet, hardware, tools, truck and towing, clothing and footwear, agriculture and seasonal, gift and toy products. The company was founded by Charles E. Schmidt, Sr. in 1938 and is headquartered in Brentwood, Tennessee.
Webster Limited
Webster Ltd. is a food and agribusiness company, which engages in producing, processing, marketing, and exporting vegetables and walnuts. It operates through the Agriculture and Horticulture segments. The Agriculture segment offers annual row crops including cotton, wheat and maize as well as livestock. The Horticulture segment pertains to tree crops which are currently walnuts. The company was founded in 1831 and is headquartered in Leeton, Australia.
Wellard Ltd.
Wellard Ltd. is engaged in the production and distribution of livestock and grain. Its operations cover every aspect of the export chain, including feed milling, livestock aggregation, road transport, feedlot facilities throughout Australia and modern shipping. The company operates through the following segments: Livestock Marketing, Export & Transportation, and Other. Wellard was founded in 1980 and is headquartered in Fremantle, Australia.
For
per
sona
l use
onl
y

Ruralco Holdings Limited Independent Expert’s Report and Financial Services Guide
Page 41 of 53
: CONTROL PREMIUM
Background
The difference between the control value and the liquid minority value is the control premium. The opposite of a control premium is a minority discount (also known as a discount for lack of control). A control premium is said to exist because the holder of a controlling stake has several rights that a minority holder does not enjoy (subject to shareholders’ agreements and other legal constraints), including:
♦ Appoint or change operational management
♦ Appoint or change members of the board
♦ Determine management compensation
♦ Determine owner’s remuneration, including remuneration to related party employees
♦ Determine the size and timing of dividends
♦ Control the dissemination of information about the company
♦ Set strategic focus of the organisation, including acquisitions, divestments and any restructuring
♦ Set the financial structure of the company (debt / equity mix)
♦ Block any or all of the above actions
The most common approach to quantifying a control premium is to analyse the size of premiums implied from prices paid in corporate takeovers. Another method is the comparison between prices of voting and non-voting shares in the same company. We note that the size of the control premium should generally be an outcome of a valuation and not an input into one, as there is significant judgement involved.
Takeover Premiums
Dispersion of premiums
The following chart shows the spread of premiums paid in takeovers between 2005 and 2015. We note that these takeover premiums may not be purely control premiums, for example the very high premiums are likely to include synergy benefits, while the very low premiums may be influenced by share prices rising in anticipation of a bid.
Sources: FactSet, Leadenhall analysis
This chart highlights the dispersion of premiums paid in takeovers. The chart shows a long tail of high premium transactions, although the most common recorded premium is in the range of 20% to 30%, with approximately 60% of all premiums falling in the range of 0% to 40%.
0
20
40
60
80
Nu
mb
er o
f tra
nsa
ctio
ns
% Premium
Takeover premium by size
0-10 10-20 20-30 30-40 40-50 50-60 60-70 70-80 80-90 90-100
For
per
sona
l use
onl
y

Ruralco Holdings Limited Independent Expert’s Report and Financial Services Guide
Page 42 of 53
Premiums over time
The following chart shows the average premium paid in completed takeovers compared to the price one month before the initial announcement.
Sources: FactSet, Leadenhall analysis
The chart indicates that while premiums vary over time, there is no clearly discernible pattern. The mean is higher than the median due to a small number of high premiums.
Premiums by industry
The following chart shows the average takeover premium by industry, compared to the share price one month before the takeover was announced. Most industries show an average premium of 20% to 50%.
Sources: FactSet, Leadenhall analysis
A number of industries have fairly high averages which have been impacted by specific transactions as set out below:
♦ Producer Manufacturing: includes two transactions with control premiums over 100%. The average premium is 25% lower when these transactions are excluded.
♦ Technology Services: includes four transactions with control premiums in excess of 100%. The average premium is 30% lower when these transactions are excluded.
♦ Industrial Services: includes two transactions with control premiums in excess of 100%. The average premium is 30% lower when these transactions are excluded.
♦ Energy Minerals: includes six transactions with control premiums in excess of 100%. The average premium is 20% lower when these transactions are excluded.
♦ Commercial Services: includes four transactions with control premiums in excess of 100%. The average premium is 20% lower when these transactions are excluded.
0%
20%
40%
60%
80%
2005 2006 2007 2008 2009 2010 2011 2012 2013 2014 2015
Average takeover premium (1 month)
Mean Median
0%
20%
40%
60%
80%
Average takeover premium (2005 - 2015)
For
per
sona
l use
onl
y

Ruralco Holdings Limited Independent Expert’s Report and Financial Services Guide
Page 43 of 53
♦ Health Services: includes one transaction with a control premium of 183%. The average premium is 20% lower when this transaction is excluded.
Key factors that generally lead to higher premiums being observed are more than one party presenting a takeover offer, favourable trading conditions in certain industries (e.g. recent mining and tech booms), when the price includes special value and scrip offers where the price of the acquiring entity's shares increases between announcement and completion.
Industry Practice
In Australia, industry practice is to apply a control premium in the range of 20% to 40%, as shown in the following list quoting ranges noted in various independent experts’ reports.
♦ Deloitte - 20% to 40%
♦ Ernst & Young - 20% to 40%
♦ Grant Samuel - 20% to 35%
♦ KPMG - 25% to 40%
♦ Lonergan Edwards - 30 to 35%
♦ PwC - 20% to 40%
The range of control premiums shown above is consistent with most academic and professional literature published by leading valuation experts.
Alternative View
Whilst common practice is to accept the existence of a control premium, in the order of 20% to 40%, certain industry practitioners (particularly in the US) disagree with the validity of this conclusion. Those with an alternate view point to the fact that very few listed companies are acquired each year as evidence that 100% of a company is not necessarily worth more than the proportionate value of a small interest. The reason we see some takeovers at a premium is that if a company is not well run, there is a control premium related to the difference in value between a hypothetical well-run company and the company being run as it is.
Impact of Methodologies Used
The requirement for an explicit valuation adjustment for a control premium depends on the valuation methodology adopted and the level of value to be examined. It may be necessary to apply a control premium to the value of a liquid minority value to determine the control value. Alternatively, in order to estimate the value of a minority interest, it may be necessary to apply a minority discount to a proportional interest in the control value of the company.
Discounted cash flow
The discounted cash flow methodology generally assumes control of the cash flows generated by the assets being valued. Accordingly, such valuations reflect a premium for control. Where a minority value is sought a minority discount must therefore be applied. The most common exception to this is where a discounted dividend model has been used to directly determine the value of an illiquid minority holding.
Capitalisation of earnings
Depending on the type of multiple selected, the capitalisation of earnings methodology can reflect a control value (transaction multiples) or a liquid minority value (listed company trading multiples).
Asset based methodologies
Asset based methodologies implicitly assume control of the assets being valued. Accordingly, such valuations reflect a control value.
For
per
sona
l use
onl
y
Ruralco Holdings Limited Independent Expert’s Report and Financial Services Guide
Page 44 of 53
Intermediate Levels of Ownership
There are a number of intermediate levels of ownership between a portfolio interest and 100% ownership. Different levels of ownership/strategic stakes will confer different degrees of control and rights as shown below.
♦ 90% - can compulsory purchase remaining shares if certain conditions are satisfied
♦ 75% - power to pass special resolutions
♦ > 50% - gives control depending on the structure of other interests (but not absolute control)
♦ > 25% - ability to block a special resolution
♦ > 20% - power to elect directors, generally gives significant influence, depending on other shareholding blocks
♦ < 20% generally has only limited influence
Conceptually, the value of each of these interests lies somewhere between the portfolio value (liquid minority value) and the value of a 100% interest (control value). Each of these levels confers different degrees of control and therefore different levels of control premium or minority discount.
50%
For all practical purposes, a 50% interest confers a similar level of control to holdings of greater than 50%, at least where the balance of the shares are listed and widely held. Where there are other significant holders, such as in a 50/50 joint venture, 50% interests involve different considerations depending upon the particular circumstances.
Strategic parcels do not always attract a control premium. In fact, if there is no bidder, the owner may be forced to sell the shares through the share market, usually at a discount to the prevailing market price. This reflects the fact that the sale of a parcel of shares significantly larger than the average number of shares traded on an average day in a particular stock generally causes a stock overhang, therefore there is more stock available for sale than there are buyers for the stock and in order to clear the level of stock available, the share price is usually reduced by what is referred to as a blockage discount.
20% to 50%
Holdings of less than 50% but more than 20% can confer a significant degree of influence on the owner. If the balance of shareholders is widely spread, a holding of less than 50% can still convey effective control of the business. However, it may not provide direct ownership of assets or access to cash flow. This level of holding has a strategic value because it may allow the holder significant influence over the company’s management, possibly additional access to information and a board seat.
<20%
Holdings of less than 20% are rarely considered strategic and would normally be valued in the same way as a portfolio interest given the stake would not be able to pass any ordinary or special resolution on their own if they were against the interests of the other shareholders. Depending on the circumstances, a blockage discount may also apply.
As explained above, the amount of control premium or minority discount that would apply in specific circumstances is highly subjective. In relation to the appropriate level of control premium, Aswath Damodaran1 notes “the value of controlling a firm has to lie in being able to run it differently (and better)”. A controlling shareholder will be able to implement their desired changes. However, it is not certain that a non-controlling shareholder would be able to implement changes they desired. Thus, following the logic of Damodaran and the fact that the strategic value of the holding typically diminishes as the level of holding decreases, the appropriate control premium for a non-controlling shareholder should be lower than that control premium for a controlling stake.
1 Aswath Damodaran is a Professor of Finance at the Stern School of Business at New York University, where he teaches corporate finance and equity valuation. He has written several books on equity valuation, as well as corporate finance and investment. He is also widely published in leading finance journals.
For
per
sona
l use
onl
y

Ruralco Holdings Limited Independent Expert’s Report and Financial Services Guide
Page 45 of 53
Key Factors in Determining a Reasonable Control Premium
Key factors to consider in determining a reasonable control premium include:
♦ Size of holding – Generally, larger stakes attract a higher control premium
♦ Other holdings – The dispersion of other shareholders is highly relevant to the ability for a major shareholder to exert control. The wider dispersed other holdings are, the higher the control premium
♦ Industry premiums – Evidence of premiums recently paid in a given industry can indicate the level of premium that may be appropriate
♦ Size – medium sized businesses in a consolidating industry are likely to be acquired at a larger premium than other businesses
♦ Dividends – a high dividend pay-out generally leads to a low premium for control
♦ Gearing – a company that is not optimally geared may attract a higher premium than otherwise, as the incoming shareholder has the opportunity to adjust the financing structure
♦ Board – the ability to appoint directors would increase the control premium attaching to a given parcel of shares. The existence of independent directors would tend to decrease the level of premium as this may serve to reduce any oppression of minority interests and therefore support the level of the illiquid minority value
♦ Shareholders agreement - the existence and contents of a shareholders’ agreement, with any protection such as tag along and drag along rights offered to minority shareholders lowers the appropriate control premium
For
per
sona
l use
onl
y

Ruralco Holdings Limited Independent Expert’s Report and Financial Services Guide
Page 46 of 53
: DISCOUNT RATE
The selected discount rate applied in our DCF analysis for TP Jones has been determined using the weighted average cost of capital (“WACC”). We have estimated the cost of equity with the capital asset pricing model (“CAPM”).
Post-tax cost of equity (Ke)
The CAPM is based on the assumption that investors require a premium for investing in equities rather than in risk-free investments (such as government bonds). The cost of equity, Ke, is the rate of return that investors require to make an equity investment in a firm.
The cost of equity capital under CAPM is determined using the following formula:
The components of the CAPM formula are:
Table 14: Components of CAPM
Input Definition
Ke The required post-tax return on equity
Rf The risk-free rate of return
Rm The expected return on the market portfolio
MRP The market risk premium (Rm – Rf)
β The beta, the systematic risk of a stock (this is an equity or levered beta)
α The specific company risk premium
Each of the components in the above equation is discussed below.
Risk-free rate (Rf)
The relevant risk-free rate of return is the return on a risk-free security, typically over a long-term period. In practice, long dated government bonds are an acceptable benchmark for the risk-free security. Based on the spot rate at 5 January 2017 we have selected a risk-free rate of 2.8% for the purpose of our analysis.
Equity market risk premium (MRP)
The MRP (Rm – Rf) represents the additional return that investors expect from an investment in a well-diversified portfolio of assets (such as a market index). It is the excess return above the risk-free rate that investors demand for their increased exposure to risk, when investing in equity securities.
Leadenhall undertakes a review of the MRP at least every six months, taking account of market trading levels and industry practice at the time. Based on this research, we have adopted an MRP of 6.5%.
Beta estimate (β)
Description
The beta factor is a measure of the risk of an investment or business operation, relative to a well-diversified portfolio of assets. The only risks that are captured by beta are those risks that cannot be eliminated by the investor through diversification. Such risks are referred to as systematic, undiversifiable or uninsurable risk.
Beta is a measure of the relative riskiness of an asset in comparison to the market as a whole – by definition the market portfolio has an equity beta of 1.0. The equity beta’s of various Australian industries listed on the Australian Stock Exchange are reproduced below.
Ke = Rf + β x (Rm – Rf) + α
For
per
sona
l use
onl
y
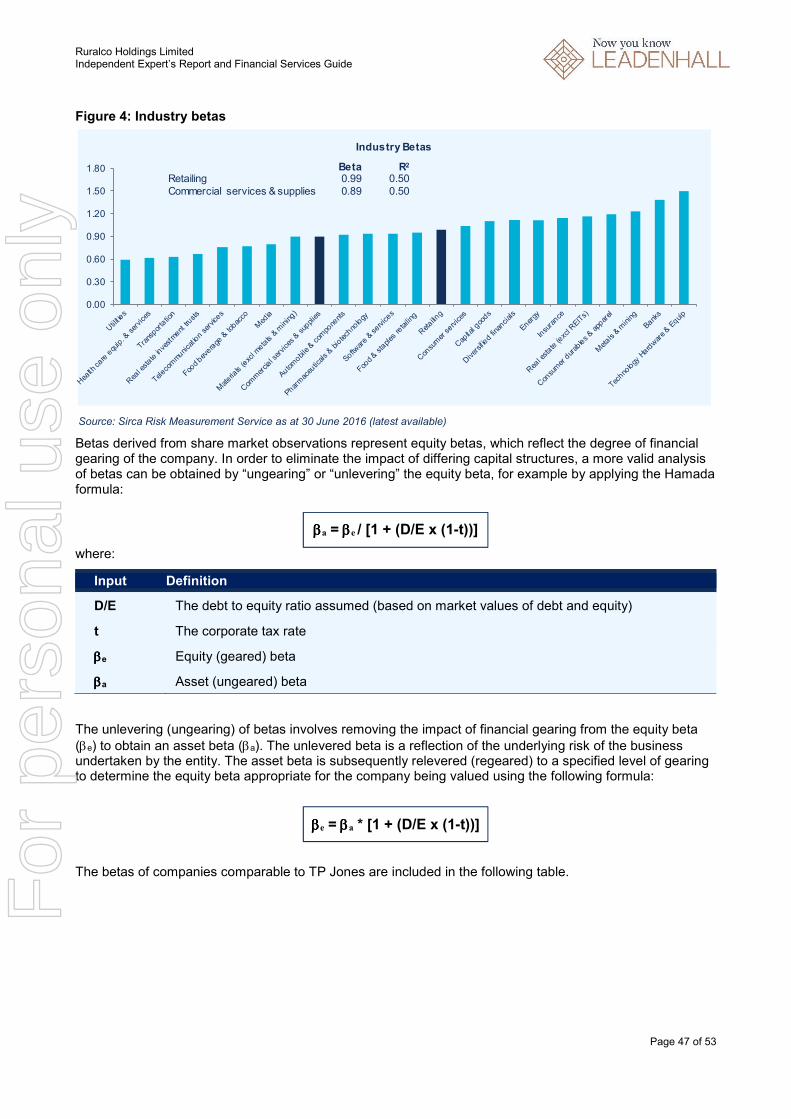
Ruralco Holdings Limited Independent Expert’s Report and Financial Services Guide
Page 47 of 53
Figure 4: Industry betas
Source: Sirca Risk Measurement Service as at 30 June 2016 (latest available)
Betas derived from share market observations represent equity betas, which reflect the degree of financial gearing of the company. In order to eliminate the impact of differing capital structures, a more valid analysis of betas can be obtained by “ungearing” or “unlevering” the equity beta, for example by applying the Hamada formula:
ββββa = ββββe / [1 + (D/E x (1-t))]
where:
Input Definition
D/E The debt to equity ratio assumed (based on market values of debt and equity)
t The corporate tax rate
ββββe Equity (geared) beta
ββββa Asset (ungeared) beta
The unlevering (ungearing) of betas involves removing the impact of financial gearing from the equity beta
(βe) to obtain an asset beta (βa). The unlevered beta is a reflection of the underlying risk of the business undertaken by the entity. The asset beta is subsequently relevered (regeared) to a specified level of gearing to determine the equity beta appropriate for the company being valued using the following formula:
ββββe = ββββa * [1 + (D/E x (1-t))]
The betas of companies comparable to TP Jones are included in the following table.
0.00
0.30
0.60
0.90
1.20
1.50
1.80
Industry Betas
RetailingCommercial services & supplies
Beta0.990.89
R2
0.500.50
For
per
sona
l use
onl
y

Ruralco Holdings Limited Independent Expert’s Report and Financial Services Guide
Page 48 of 53
Table 15: Comparable company betas
Source: Factset as at 6 January 2017 and SIRCA as at 30 June 2016 (latest available)
Note: Shaded figures represent statistically insignificant observations and / or outliers which have been excluded from the ‘Adjusted’ metrics
Selected beta (ββββ)
In selecting an appropriate beta for TP Jones, we have considered the following:
♦ The adjusted average equity beta of the comparable Australian companies is between 0.94 and 1.20. The adjusted average has been calculated by eliminating those companies with a statistically insignificant R2
♦ The adjusted median equity beta of the comparable Australian companies is between 0.99 and 1.02. The adjusted average has also been calculated by eliminating those companies with a statistically insignificant R2
♦ There is only one international comparable company considered above. Due to the differences between the US and Australian market, we have placed more weight on the Australian comparable companies when selecting an appropriate beta for TP Jones
As a result of these considerations we have selected an equity beta of 0.9 to 1.0.
Specific company risk premium (α)
Size premium
A number of studies have been undertaken attempting to measure the size premium, in particular in the US. The Valuation Handbook published by Duff & Phelps contains calculations of the size premium for each decile of market capitalisation. As the size premium is most significant for very small companies, the tenth decile is then further divided into four equal segments. The following table summarises the size premium data from the 2015 Valuation Handbook.
SIRCA R 2 FactSet R 2
Australian
IPL-AU Incitec Pivot Limited 6,040 1.02 0.20 1.10 0.25
NUF-AU Nufarm Limited 2,417 1.06 0.12 0.99 0.16
CGC-AU Costa Group Holdings Ltd. 1,082 n/a n/a 0.91 0.19
AAC-AU Australian Agricultural Company Limited 913 0.84 0.13 0.60 0.09
SHV-AU Select Harvests Limited 479 2.92 0.13 1.09 0.12
WBA-AU Webster Limited 482 1.11 0.12 0.28 0.01
ELD-AU Elders Limited 447 0.38 0.00 0.34 0.00
RIC-AU Ridley Corporation Limited 383 0.60 0.07 0.24 0.01
RHL-AU Ruralco Holdings Limited 235 0.23 0.01 0.13 0.00
AHX-AU Apiam Animal Health Ltd. 122 n/a n/a 0.62 0.04
LAU-AU Lindsay Australia Limited 109 0.84 0.10 0.23 0.00
FRM-AU Farm Pride Foods Limited 88 -0.62 0.01 0.09 0.00
WLD-AU Wellard Ltd. 86 n/a n/a 0.72 0.02
AHF-AU Australian Dairy Farms Limited 35 -0.11 0.00 1.67 0.00
AAP-AU Australian Agricultural Projects Ltd. 5 -0.26 0.00 0.33 0.00
Average 0.67 0.07 0.62 0.06
Median 0.72 0.09 0.60 0.01
Adjusted average 1.20 0.12 0.94 0.16
Adjusted median 1.02 0.12 0.99 0.16
United States
TSCO-US Tractor Supply Company 9,811 n/a n/a 1.06 0.28
CodeMarket Cap
($m)
Equity BetaCompany Name
For
per
sona
l use
onl
y

Ruralco Holdings Limited Independent Expert’s Report and Financial Services Guide
Page 49 of 53
Table 16: Evidence of size premium
As mentioned above, the existence of the size premium has been well documented. However, there are limited studies setting out the appropriate bands of size premium and the quantum of size premium applicable to each band. For this reason, the above table should be taken as broad support for the size effect and not an exact guide to the extent of any particular discount or premium that should be applied.
Although there is considerable evidence from the US, in the Australian context, the relatively small size of the Australian equity market makes it more difficult to observe the existence of this phenomenon.
Leadenhall and others have conducted a number of high level studies which have confirmed the existence of the size effect in the Australian market. However, we are not aware of any Australian studies that have been performed with the same detail and rigour as the US studies, such as the Duff & Phelps data presented above. Based on the evidence from US studies and our knowledge of prices actually paid in Australian transactions, from which a discount rate can be implied, we believe the size premium ranges in the below table are appropriate. This table should be taken as a guide to the appropriate size premium for a given business and needs to be considered in conjunction with the specific circumstances of a particular business.
Decile
Low High
24,429 591,016 -0.4%
10,171 24,273 0.6%
5,864 10,106 0.9%
3,723 5,845 1.1%
2,552 3,724 1.6%
1,689 2,543 1.7%
1,011 1,687 1.7%
549 1,011 2.2%
301 549 2.7%
232 301 3.2%
191 232 5.5%
116 191 7.5%
3 116 12.0%
Source: Duff & Phelps 2015 Valuation Handbook
Notes:
1. Measured over the period from January 1926 to December 2013
2. Size premium compared to return predicted by CAPM
3. Market capitalisation as at 31 December 2013
4. Risk free rate used in this analysis is the yield on 20 year US government bonds
Size Premium
Mkt Cap Range (US$m) Size
Premium
10y
1 (Largest)
2
3
4
5
6
7
8
9
10w
10x
10z (Smallest)
For
per
sona
l use
onl
y

Ruralco Holdings Limited Independent Expert’s Report and Financial Services Guide
Page 50 of 53
Table 17: Leadenhall size premium bandings
Source: Leadenhall analysis
We have selected a size risk premium of 7% to reflect the fact that TP Jones would be near the bottom end of the range for a micro-cap company.
Other company specific risks
The specific company risk premium adjusts the cost of equity for company specific factors, including unsystematic risk factors such as reliance on key customers, reliance on key suppliers, existence of contingent liabilities etc. We have not allowed for a company specific risk premium.
Dividend Imputation
Since July 1987, Australia has had a dividend imputation system in place, which aims to remove the double taxation effect of dividends paid to investors. Under this system, domestic equity investors receive a taxation credit (franking credit) for any tax paid by a company. The franking credit attaches to any dividends paid out by a company and the franking credit offsets personal tax. To the extent the investor can utilise the franking credit to offset personal tax, then the corporate tax is now not a real impost. It is best considered as a withholding tax for personal taxes. It can therefore be argued that the benefit of dividend imputation should be added to any analysis of value.
However, in our view, the evidence relating to the value that the market ascribes to imputation credits is inconclusive. There are diverse views as to the value of imputation credits and the appropriate method that should be employed to calculate this value. Due to the uncertainty surrounding the extent to which acquirers of assets factor in dividend imputation, we have taken the conservative approach and not factored in dividend imputation.
Low High Low High
Largest 4,000 Above - -
Large 1,000 4,000 - 1.0%
Mid-cap 300 1,000 1.0% 2.0%
Low-cap 100 300 2.0% 3.0%
Small-cap 50 100 3.0% 5.0%
Micro-cap 10 50 5.0% 8.0%
Medium private 1 5 10 8.0% 11.0%
Small private 1 2 5 11.0% 15.0%
Smallest 1 - 2 15.0% 20.0%
Note:
1.
Size Premium Guide for Australia
Size Mkt Cap Range (AU$m) Size Premium
We do not generally consider the CAPM model to be reliable for entities of this size as they often do not meet the background
assumptions underpinning the CAPM. In particular investors are often not diversified and it is rarely possible to lend or borrow stock
of entities this size. These suggested size premiums are therefore presented as an approximate guide only as alternate models,
studies and rules of thumb are commonly utilised for these types of companies.
For
per
sona
l use
onl
y
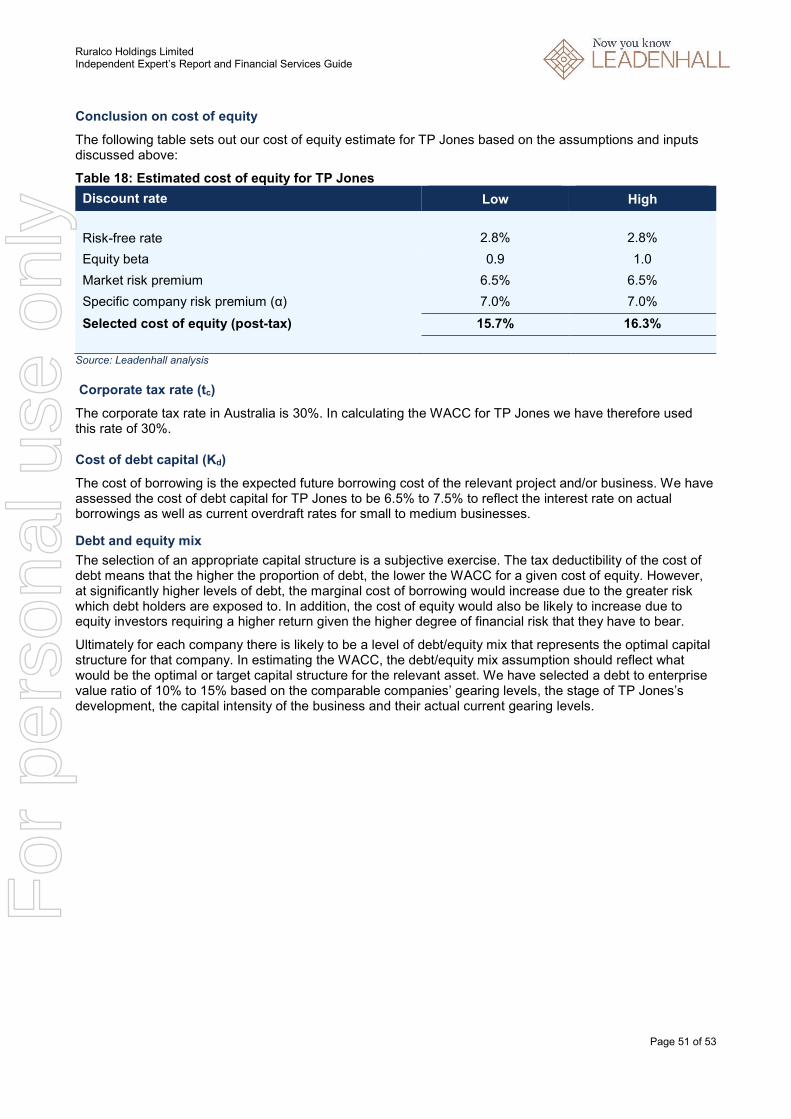
Ruralco Holdings Limited Independent Expert’s Report and Financial Services Guide
Page 51 of 53
Conclusion on cost of equity
The following table sets out our cost of equity estimate for TP Jones based on the assumptions and inputs discussed above:
Table 18: Estimated cost of equity for TP Jones
Discount rate Low High
Risk-free rate 2.8% 2.8%
Equity beta 0.9 1.0
Market risk premium 6.5% 6.5%
Specific company risk premium (α) 7.0% 7.0%
Selected cost of equity (post-tax) 15.7% 16.3%
Source: Leadenhall analysis
Corporate tax rate (tc)
The corporate tax rate in Australia is 30%. In calculating the WACC for TP Jones we have therefore used this rate of 30%.
Cost of debt capital (Kd)
The cost of borrowing is the expected future borrowing cost of the relevant project and/or business. We have assessed the cost of debt capital for TP Jones to be 6.5% to 7.5% to reflect the interest rate on actual borrowings as well as current overdraft rates for small to medium businesses.
Debt and equity mix
The selection of an appropriate capital structure is a subjective exercise. The tax deductibility of the cost of debt means that the higher the proportion of debt, the lower the WACC for a given cost of equity. However, at significantly higher levels of debt, the marginal cost of borrowing would increase due to the greater risk which debt holders are exposed to. In addition, the cost of equity would also be likely to increase due to equity investors requiring a higher return given the higher degree of financial risk that they have to bear.
Ultimately for each company there is likely to be a level of debt/equity mix that represents the optimal capital structure for that company. In estimating the WACC, the debt/equity mix assumption should reflect what would be the optimal or target capital structure for the relevant asset. We have selected a debt to enterprise value ratio of 10% to 15% based on the comparable companies’ gearing levels, the stage of TP Jones’s development, the capital intensity of the business and their actual current gearing levels.
For
per
sona
l use
onl
y

Ruralco Holdings Limited Independent Expert’s Report and Financial Services Guide
Page 52 of 53
Calculation of WACC
The table below summarises the discount rate we have derived for TP Jones, based on the assumptions and inputs discussed above.
Table 19: Estimated WACC for TP Jones
Discount rate Low High
Selected cost of equity (post-tax) 15.7% 16.3%
Debt to enterprise value ratio 15% 10%
Tax rate 30.0% 30.0%
Cost of debt 6.5% 7.5%
Calculated WACC (post tax nominal) 14.0% 15.2%
Selected WACC 14.0% 15.0%
Source: Leadenhall analysis
For
per
sona
l use
onl
y

Ruralco Holdings Limited Independent Expert’s Report and Financial Services Guide
Page 53 of 53
: QUALIFICATIONS, DECLARATIONS AND CONSENTS
Responsibility and purpose
This report has been prepared for Ruralco’s shareholders for the purpose of assessing the Proposed Transaction. Leadenhall expressly disclaims any liability to any shareholder, or anyone else, whether for our negligence or otherwise, if the report is used for any other purpose or by any other person.
Reliance on information
In preparing this report we relied on the information provided to us by Ruralco and TP Jones being complete and accurate and we have assumed it has been prepared in accordance with applicable Accounting Standards and relevant national and state legislation. We have not performed an audit, review or financial due diligence on the information provided. Drafts of our report were issued to Ruralco’s management for confirmation of factual accuracy.
Prospective information
To the extent that this report refers to prospective financial information, we have considered the prospective financial information and the basis of the underlying assumptions. The procedures involved in Leadenhall’s consideration of this information consisted of enquiries of Ruralco and TP Jones’s personnel and analytical procedures applied to the financial data. These procedures and enquiries did not include verification work nor constitute an audit or a review engagement in accordance with Australian Auditing Standards, or any other standards. Nothing has come to our attention as a result of these enquiries to suggest that the financial projections for TP Jones, when taken as a whole, are unreasonable for the purpose of this report.
We note that the forecasts and projections supplied to us are, by definition, based upon assumptions about events and circumstances that have not yet transpired. Actual results in the future may be different from the prospective financial information of TP Jones referred to in this report and the variation may be material, since anticipated events frequently do not occur as expected. Accordingly, we give no assurance that any forecast results will be achieved.
Market conditions
Leadenhall’s opinion is based on prevailing market, economic and other conditions as at the date of this report. Conditions can change over relatively short periods of time. Any subsequent changes in these conditions could impact upon the conclusion reached in this report.
As a valuation is based upon expectations of future results it involves significant judgement. Although we consider the assumptions used and the conclusions reached in this report are reasonable, other parties may have alternative expectations of the future, which may result in different valuation conclusions. The conclusions reached by other parties may be outside Leadenhall’s preferred range.
Indemnities
In recognition that Leadenhall may rely on information provided by Ruralco and TP Jones and their officers, employees, agents or advisors, Ruralco has agreed that it will not make any claim against Leadenhall to recover any loss or damage which it may suffer as a result of that reliance and that it will indemnify Leadenhall against any liability that arises out of Leadenhall’s reliance on the information provided by Ruralco or TP Jones and their officers, employees, agents or advisors or the failure by Ruralco or TP Jones and their officers, employees, agents or advisors to provide Leadenhall with any material information relating to this report.
Qualifications
The personnel of Leadenhall principally involved in the preparation of this report were Dave Pearson, BCom., CA, CFA, CBV, M.App.Fin, Richard Norris, BA (Hons), FCA, M.App.Fin, F.Fin, Simon Dalgarno, B.Ec, FCA, F.FINSIA and Chern Fung Yee, BCom., CPA.
This report has been prepared in accordance with “APES 225 – Valuation Services” issued by the Accounting Professional & Ethical Standards Board and this report is a valuation engagement in accordance with that standard and the opinion is a Conclusion of Value.
Independence
Leadenhall has acted independently of Ruralco. Compensation payable to Leadenhall is not contingent on the conclusion, content or future use of this report.
For
per
sona
l use
onl
y


