50
2015 Annual Report For personal use only

2015 A
nn
ua
l Re
po
rt
For
per
sona
l use
onl
y

2
Corporate Directory
DIRECTORSMr Alasdair Cooke Executive Chairman
Dr Charles (Frazer) Tabeart Managing Director
Mr Gregory (Bill) Fry Executive Director
Mr Valentine Chitalu Non-Executive Director
Mr Philip Clark Non-Executive Director
Mr Vincent (Ian) Masterton-Hume Non-Executive Director
Mr Wayne Richard Trumble Non-Executive Director
Mr John Dean Non-Executive Director
COMPANY SECRETARYMr Daniel Davis
REGISTERED OFFICEGranite House La Grande Rue St Martin, Guernsey GY1 3RS
REPRESENTATIVE OFFICE IN AUSTRALIASuite 1, 245 Churchill Avenue Subiaco, Western Australia, 6008
SHARE REGISTERLink Market Services Limited Level 12, QV1 Building, 250 St Georges Terrace Perth, Western Australia, 6000
STOCK EXCHANGE LISTINGSAustralian Securities Exchange (ASX: AFR) Botswana Stock Exchange (BSE: AFR)
AUDITORBDO Audit (WA) Pty Limited 38 Station Street Subiaco, Western Australia, 6008
SOLICITORSFairweather Corporate Lawyers 595 Stirling Highway Cottesloe, Western Australia, 6011
BANKERSWestpac Banking Corporation Level 6, 109 St Georges Terrace Perth, Western Australia, 6000
WEBSITEwww.africanenergyresources.com
Table of Contents
Managing Director’s Letter 01
02Sese Joint Venture
04Mmamabula West Power Project
05Mmamantswe Power Project
06Tenement Schedule
07Annual Statement of Mineral Resources
08Financial Report
09Directors’ Report
19Directors’ Declaration
20Independent Audit Report
25Consolidated Statement of Profit or Loss & Other Comprehensive Income
26Consolidated Statement of Financial Position
27Consolidated Statement of Changes in Equity
28Consolidated Statement of Cash Flows
29Notes to the Consolidated Financial Statements
45Additional Shareholder Information
africanenergyresources.com
For
per
sona
l use
onl
y

AfricanEnergy Annual Report 2017 01
Managing Director’s Letter
Dear Shareholder,
The supply and demand of power in the southern African region remained in broad balance during the last twelve months, but with notable shortages in key markets. Zambia, the largest producer of copper in Africa, continues to experience widespread power shortages caused by a dependence on hydro-electric power schemes that have been operating below capacity due to low rainfall and excessive exploitation during the past few years.
Despite the commissioning of 300MW of new coal-fired generation and a new 120MW hydro-electric project, Zambia has still needed to import large amounts electricity via a series of short-term, often high-cost contracts to help meet local demand. This situation has resulted in sharp increases in power tariffs to US $0.093 per kWh for all major industrial customers in Zambia, with additional increases likely in the coming years. Furthermore, the supply of power to major industrial users has not always been sufficient to meet demand, resulting in load shedding and supply interruptions to the major mines on the Copperbelt.
In this context of reducing regional power stability and increasing tariffs, African Energy progressed its coal to power projects and remains committed to becoming an independent producer of reliable, affordable and secure base-load electricity. Major milestones achieved during the year include:
• First Quantum Minerals Ltd continued to invest in the Sese JV Project, increasing its stake to 61%. First Quantum will invest a further A$5 million to reach a 75% interest, following which African Energy’s 25% interest in any coal-to-power project developed at the site will be loan carried by First Quantum through to production.
• Technical studies on preliminary design and layout, operating and capital costs and transmission routes between Botswana and Zambia have been completed for a 450MW power station and integrated coal mine.
• The Sese JV Project continued to receive strong support from the Government of Botswana via the approval of a 25-year mining licence for the project, plus the granting of a Manufacturing Development Approval Order which provides for a 5-year tax holiday from commercial completion followed by a 15% corporate tax rate for the power project.
• First Quantum also increased its stake in African Energy to 13.8% via an equity placement of A$1.38 million at A$ 0.078 per share.
African Energy remains well funded, carries no debt and has low corporate overheads. Coupled with a strong development partner at the Sese JV Project, and a high-quality portfolio, the Company is well placed to develop major power projects for the region.
Frazer Tabeart, Managing DirectorF
or p
erso
nal u
se o
nly

02 africanenergyresources.com
Sese Joint Venture
African Energy’s coal projects in Botswana are situated close to the interconnected regional transmission grid, and are all capable of providing secure, low cost fuel for large-scale base-load power projects.
First Quantum Minerals Ltd (FQML) became a majority equity partner at the Sese Joint Venture in 2014 and have since directly invested AUD $13m for a 61% project interest and committed to invest a further AUD $5m to increase its stake to 75%.
Once this 75% interest has been earned, FQML is responsible for arranging the funds required to build the Sese integrated power project, and will loan carry African Energy’s residual 25% interest through to commercial production.
For
per
sona
l use
onl
y

AfricanEnergy Annual Report 2017 03
Sese Joint Venture
In 2017, AFR and FQML completed several technical programs to support an updated mining study. An ensuing conceptual study of the proposed power station layout and design, determined that Sese coal is a suitable fuel for all common power station boiler technologies and can readily meet the required air quality and emissions standards.
This study also established the operating costs, capital costs and a robust financial model for a 450MW project and the associated coal mine, and further demonstrated that power from Sese could be delivered to the Zambian Copperbelt where FQML operates a large copper mining and smelting business.
A Mining Licence has been granted for an initial period of 25-years over an area of approximately 51 km2 which contains 650Mt of coal in Block-C.
A Manufacturing Development Approval Order under which the project will receive a 5-year tax holiday from the commencement of commercial operations followed by a 15% corporate tax rate was also awarded to the Sese Project in 2017.
The Sese JV has now secured most of the licenses and permits required to develop an integrated coal and power project in Botswana.
An application for a Generation and Export Licence has been submitted which, along with suitable transmission agreements, are the only key outstanding commercial documents. The Joint Venture partners continue to use their best endeavors to secure these remaining permits and agreements.
For
per
sona
l use
onl
y

04 africanenergyresources.com
Mmamabula West Power Project
The 2.4 billion tonne Mmamabula West project contains some of the best quality coal in Botswana in two 4-6m thick seams which are at 100-150m depth.
A prefeasibility study has determined that low-cost underground mining presents an opportunity to produce affordable power station fuel from a conventional underground coal mine.
African Energy continued to develop this project during the last year, with a focus on five key activities: – Completion of a detailed fuel specification for both coal seams for use in power generation. – An infill drilling program designed to place 50-70 million tonnes of coal into the measured resource category and to support feasibility studies for an integrated coal mine and 600MW power station has been completed. An updated mineral resource is expected in due course.
– An application for Land Rights over the area to be developed has been submitted.
– An Environmental and Social Impact Assessment for the project which includes a 600MW power station and a 4.5 Mtpa underground coal mine has been submitted to the Department of Environmental Affairs in Botswana. – Monitoring of groundwater levels and groundwater chemistry to provide a robust environmental baseline and a preliminary hydrogeological model of the project and its surrounds continued.
For
per
sona
l use
onl
y

AfricanEnergy Annual Report 2017 05
Mmamantswe Power Project
The Mmamantswe project is only 20km from the border and is close to the regional power transmission grid and planned transmission expansions into South Africa.
The Mmamantswe project has secured environmental approvals for up to 10Mtpa of coal mining and up to 2,000MW of power generation.
African Energy has executed a binding Agreement to sell Mmamantswe to TM Consulting, a South African developer, for USD $20M if the developer successfully negotiates a power purchase agreement with South Africa’s Department of Energy, and the project reaches financial close.
In the past year, TM Consulting, assisted by African Energy, managed several programs to advance the project, including an evaluation of optimal power station sizing and design, scoping a definitive feasibility study, and developing a financial model for the integrated coal mine and power project.
African Energy has also applied for Land Rights over the project area, access corridor and grid connection corridor.
For
per
sona
l use
onl
y

Project Name Tenement Name Tenement Holder Licence
Number
African Energy Equity
Area (sq km)
Date Granted
Current Expiry Date
BOTSWANA
SESE Sese Mining Licence Sese Power Subsidiary (Pty) Ltd ML2016/42L 39% 51 22-Mar-17 31-Jan-42
SESE Sese African Energy Resources Botswana (Pty) Ltd PL 96/2005 39% 287 26-Jul-05 31-Dec-18
SESE Sese West African Energy Resources Botswana (Pty) Ltd PL197/2007 39% 229 01-Oct-07 31-Dec-18
SESE Foley North African Energy Resources Botswana (Pty) Ltd PL004/2013 39% 774 01-Jan-13 31-Mar-18
MMAMANTSWE Mmamantswe Mmamantswe Coal (Pty) Ltd PL069/2007 100% 453 01-Jul-12 31-Dec-18
MMAMABULA WEST Mmamabula West Phokoje Power (Pty) Ltd PL56/2005 100% 293 01-July-05 *
ZAMBIA
SINAZONGWE Sinazongwe AFR Zambia Ltd 20612-HQ-LPL 100% 38 12-Aug-15 11-Aug-17
SINAZONGWE Sinazongwe Central AFR Zambia Ltd 16566-HQ-LPL 100% 5 04-Jul-12 13-Aug-19
Tenement Schedule
JORC Statement
The Australasian Code for Reporting of Exploration Results, Mineral Resources and Ore Reserves (the ‘JORC Code’) sets out minimum standards, recommendations and guidelines for Public Reporting in Australasia of Exploration Results, Mineral Resources and Ore Reserves. The information contained in this announcement has been presented in accordance with the JORC Code (2012 edition) and references to “Measured, Indicated and Inferred Resources” are to those terms as defined in the JORC Code (2012 edition).
Information in this report relating to Exploration results, Mineral Resources or Ore Reserves is based on information compiled by Dr Frazer Tabeart (an employee of African Energy Resources Limited) who is a member of The Australian Institute of Geoscientists. Dr Tabeart has sufficient experience which is relevant to the style of mineralisation and type of deposit under consideration and to the activity which he is undertaking to qualify as a Competent Person under the 2012 Edition of the Australasian Code for reporting of Exploration Results, Mineral Resources and Ore Reserves. Dr Tabeart consents to the inclusion of the data in the form and context in which it appears.
*An application to extend PL56/2005 (Mmamabula West) was submitted to the Department of Mines in December 2016, and is currently being processed as part of a large back-log of submissions.
06 africanenergyresources.com
For
per
sona
l use
onl
y

AfricanEnergy Annual Report 2017 07
Annual Statement of Mineral Resources
Sese Project (AFR 39%, FQM 61%): Raw coal on an air-dried basisResource Zone In-Situ
Tonnes*CV (MJ/kg)
CV (kcal/kg)
Ash % IM% VM% FC% S%
MEASURED (Bk-C) 333 Mt 17.6 4,200 30.2 7.9 20.6 41.4 2.1
MEASURED (Bk-B) 318 Mt 16.0 3,820 34.8 7.4 20.4 37.4 1.7
INDICATED 1,714 Mt 15.3 3,650 38.9 6.6 18.7 35.8 2.0
INFERRED 152 Mt 15.0 3,600 39.1 6.4 19.5 34.9 2.2
TOTAL 2,517 Mt
Sese West Project (AFR 39%, FQM 61%): Raw coal on an air-dried basisResource Zone In-Situ
Tonnes*CV (MJ/kg)
CV (kcal/kg)
Ash % IM% VM% FC% S%
INFERRED 2,501 Mt 14.6 3,500 40.2 6.1 19.8 31.9 2.0
TOTAL 2,501 Mt
Mmamabula West Project (AFR 100%): Raw coal on an air-dried basisResource Zone In-Situ
Tonnes*CV (MJ/ kg)
CV (kcal/kg)
Ash % IM% VM% FC% S%
INDICATED 892 Mt 20.2 4,825 25.5 6.0 26.0 41.0 1.5
INFERRED 1,541 Mt 20.0 4,775 25.5 5.7 25.9 41.2 1.7
TOTAL 2,433 Mt
Mmamantswe Project (AFR 100%): Raw coal on an air-dried basisResource Zone In-Situ
Tonnes*CV (MJ/kg)
CV (kcal/kg)
Ash % IM% VM% FC% S%
MEASURED 978 Mt 9.5 2,270 56.5 3.9 15.8 21.8 2.0
INDICATED 265 Mt 7.9 1,890 62.3 3.3 14.2 18.1 2.1
INFERRED N/A
TOTAL 1,243 Mt
Mineral Resources & Ore Reserve Governance A summary of the governance and internal controls applicable to African Energy’s Mineral Resources and Ore Reserves processes are as follows:
• Review and validation of drilling and sampling methodology and data spacing, geological logging, data collection and storage, sampling and analytical quality control; • Geological interpretation – review of known and interpreted structure, lithology and weathering controls; • Estimation methodology – relevant to mineralisation style and proposed mining methodology; • Comparison of estimation results with previous mineral resource models, and with results using alternate modelling methodologies; • Statistical and visual validation of block model against raw composite data; and • Use of external Competent Persons to assist in the preparation of JORC Mineral Resources updates.
*In-Situ Tonnes have been derived by removing volumes for modeled intrusions, burnt coal and weathered coal and then applying appropriate geological loss factors to the remaining Gross In-Situ Tonnes. The Coal Resources quoted for the Sese, Mmamabula West and Mmamantswe Projects in the table above have been defined in accordance with the practices recommended by the Joint Ore Reserves Committee (2004 edition of the JORC Code), with the exception of Sese West which is reported as per the 2012 edition. There have been no material changes to any of the resources since they were first announced.
For
per
sona
l use
onl
y

Financial Report30 June 2017
African Energy Resources Limited
ARBN 123 316 781
08 africanenergyresources.com
For
per
sona
l use
onl
y

AfricanEnergy Annual Report 2017 09 90
African Energy Resources Limited Financial Report 30 June 2017 Directors’ Report
4 | P a g e
Your Directors present their report on the Consolidated Entity consisting of African Energy Resources Limited (Company) and its controlled entities for the financial year ended 30 June 2017. 1. Directors and Company Secretary
The Directors and the Company Secretary of the Company at any time during or since the end of the financial year are as follows. Mr Alasdair Cooke BSc (Hons), MAIG – Executive Chairman Mr Cooke has served as Chairman of the Board of the Company since its incorporation. Mr Cooke is a geologist with over 25 years’ experience in the resource exploration industry throughout Australia and internationally. For the past 15 years Mr Cooke has been involved in mine development through various private and public resource companies, prior to which he held senior positions in BHP Billiton plc’s international new business and reconnaissance group. Mr Cooke is a founding director of Mitchell River Group, which over the past sixteen years has established a number of successful ASX listed resources companies, including Panoramic Resources Limited, operating the Savannah and Lanfranchi nickel projects in Australia; Albidon Limited, operating the Munali Nickel Mine in Zambia, Mirabela Nickel Limited, operating the Santa Rita nickel project in Brazil; Exco Resources Limited, developing copper and gold resources in Australia; and Energy Ventures Limited.
Other current directorships Special responsibilities EVE Investments Anova Metals Limited
Executive Chairman Member of the remuneration committee
Former directorships in the last three years Interests in shares and options none 50,003,682 shares
1,100,000 performance rights 1,750,000 options
Dr Charles (Frazer) Tabeart PhD, BSc (Hons) ARSM, MAIG – Managing Director Dr Tabeart is a graduate of the Royal School of Mines with a PhD and Honours in Mining Geology. He has over 25 years’ experience in international exploration and mining projects, including 16 years with WMC Resources. Whilst at WMC, Dr Tabeart managed exploration portfolios in the Philippines, Mongolia and Africa, gaining considerable experience in a wide variety of commodities and operating with staff from diverse cultural backgrounds. Dr Tabeart was appointed Managing Director of the Company in November 2007 after serving two years as General Manager. Under his stewardship the Company discovered and delineated the coal resource at the Sese Coal & Power Project and has since managed the strategic direction of company to focus upon the delivery of multiple coal‐fired power stations, captive coal‐mines and an export coal mine. He has overseen the acquisition of Mmamantswe and Mmamabula West Coal Projects that has grown the resource inventory of the Company to 8.7Bt of thermal coal.
Other current directorships Special responsibilities PolarX Limited Segue Resources Limited
Managing Director
Former directorships in the last three years Interests in shares and options none 4,774,100 shares
2,600,000 performance rights 2,500,000 options
Mr Gregory (Bill) Fry – Executive Director Mr Fry has more than 25 years corporate experience in the mining and resources industry, specialising in accounting, management, business development and general corporate activities. He has vast experience in project evaluation and development, project funding, management, finance and operations. Over the past 15 years, Mr Fry has been a Director of several private and public companies with activities ranging from funds management, minerals exploration, mining and quarrying. He has been an Executive Director of African Energy Resources since listing and is responsible for the Company’s commercial and financial business programs.
Directors’ Report
For
per
sona
l use
onl
y

10 africanenergyresources.com
African Energy Resources Limited Financial Report 30 June 2017
Directors Report (continued)
5 | P a g e
Other current directorships Special responsibilities EVE Investments Anova Metals Limited
Member of the Audit committee
Former directorships in the last three years Interests in shares and options 5,869,610 shares
1,600,000 performance rights 875,000 options
Mr Valentine Chitalu MPhil, BAcc, FCCA – Non‐Executive Director Mr Chitalu, a Zambian national and resident, is a Chartered Certified Accountant, Fellow of the Association of Chartered Certified Accountants (UK) and holds a practicing certificate from the Zambia Institute of Certified Accountants. He also holds a Masters Degree in Economics, Finance and Politics of Development and a Bachelor’s Degree in Accounting and Finance. Mr Chitalu has been a Non‐Executive Director of African Energy Resources since listing and has assisted African Energy through his extensive business and Government contacts in the region.
Other current directorships Special responsibilities CDC Group nil Former directorships in the last three years Interests in shares and options nil 2,251,425 shares
400,000 performance rights 500,000 options
Mr Philip Clark – Non‐Executive Director BE (Mining), MBA, MAUSIMM, GAICD Mr Clark brings a broad range of business skills to African Energy, with a particular focus on developing coal resources. He previously spent over 30 years working for BHP Billiton, culminating in five years as Vice President of Resource Development for BHP Billiton Energy Coal globally. He also held previous roles in coal mine management. During the past three years he has held no other public Directorships. Mr Clark is Chairman of the Company’s Audit and Remuneration Committees. Other current directorships Special responsibilities City West Water Australia Japan Energy Developments Ltd
Chairman of Audit & Risk Committee Chairman of Remuneration Committee
Former directorships in the last three years Interests in shares and options Engineers Without Borders Australia Engineers Without Borders International
2,485,392 shares 300,000 performance rights 500,000 Options
Mr Vincent Ian Masterton‐Hume ‐ Non‐Executive Director Mr Hume's career in the resources industry stretches back several decades, primarily in the fields of managed fund investments, capital raising and project development. He currently sits on the boards of Silver City Mines; TSX‐listed Golden Minerals; and ASX‐listed Iron Road. He is a former Director of ASX and TSX‐listed Marengo Mining. Mr Hume was a Founding Partner of The Sentient Group (“Sentient”), an independent private equity investment firm that specialises in the global resource industry. He remains an independent advisor to Sentient, following his retirement from the fund in 2008. Sentient manages in excess of US $2.3 billion in the development of metal, mineral and energy assets across the globe. Sentient’s current investment portfolio includes projects in power generation, energy storage, potash, and base, precious and ferrous metals mining, covering countries as diverse as China, Brazil, Canada, Papua New Guinea, Finland, Australia, Kenya and Botswana. Prior to the founding of Sentient, Mr Hume was a consultant to AMP’s Private Capital Division, working on the development of a number of Chilean mining investment joint ventures, as well as advising on a number of specific investments across a range of commodities and locations.
Other current directorships Special responsibilities Golden Minerals Limited Iron Road Limited
Member of Remuneration Committee
Directors’ Report (continued)
For
per
sona
l use
onl
y

AfricanEnergy Annual Report 2017 11
African Energy Resources Limited Financial Report 30 June 2017
Directors Report (continued)
6 | P a g e
Former directorships in the last three years Interests in shares and options Marengo Mining Limited Silver City Mines Limited
4,157,606 shares 100,000 performance rights 500,000 options
Mr Wayne Trumble BBA (Hons) ‐ Non‐Executive Director Mr Trumble is a senior executive with 35 years of specific industry expertise in electricity, investment and construction. For the twelve years to 2016, Mr Trumble was the Executive General Manager of Griffin Power Pty Ltd, reporting to the Board of the Griffin Group, where he led Griffin’s move from fuel supplier to electricity generator. He was responsible for preparation of strategy and the development, execution and operation of Griffin’s $1.2 billion Bluewaters coal fired project, providing 436 MW of base load power in Western Australia. Mr Trumble led the team responsible for all aspects of the project development and construction including all required environmental approvals, negotiations of turn‐key EPC contract, off take contracts, grid interconnection and approval of project financing to a level of $1.0 billion. Prior to working at Griffin, Mr Trumble was the Managing Director of TransAlta Energy where he was responsible for the commissioning and operation of the 105MW Parkeston Power Station at Kalgoorlie.
Other current directorships Special responsibilities Clean Energy Investment Holdings Pty Ltd Member of Audit & Risk Committee Former directorships in the last three years Interests in shares and options Energy Made Clean Molopo Energy Limited
327,273 shares 1,000,000 performance rights 500,000 options
Mr John Dean ‐ Non‐Executive Director Mr Dean is an employee of First Quantum Minerals (FQM). Since joining FQM in 2011 he has fulfilled various roles within their mining operations including at FQM’s Sentinel Copper Mine, its new flagship mine in Zambia. Prior to joining FQM, Mr Dean worked as an analyst in the energy and natural resource industries, possessing expertise in the valuation and commercial analysis of upstream oil and gas projects, as well as experience in electricity, natural gas, and crude oil markets. Mr Dean graduated with honours from the University of Louisville in the United States with a Bachelor of Science in Business Administration, and was later awarded a Masters of Business Administration with distinction from the University of Oxford. In addition to the Directorship, Mr Dean is a part of the team responsible for the development of power generation projects at the Sese Coal & Power Project under the joint venture with FQM.
Current directorships Special responsibilities nil nil Former directorships in the last three years Interests in shares and options nil nil
Mr Yan Zhao ‐ Alternate Director Mr Zhao was an alternate Director to Mr Ian Hume and resigned in the year to focus on other work commitments.
Current directorships Special responsibilities nil nil Former directorships in the last three years Interests in shares and options nil nil
Daniel Davis – Company Secretary Mr Davis is a member of CPA Australia who has worked in the resources sector for the past twelve years specialising in African based explorers and producers. Mr Davis has been Company Secretary since 2009.
For
per
sona
l use
onl
y

12 africanenergyresources.com
African Energy Resources Limited Financial Report 30 June 2017
Directors Report (continued)
7 | P a g e
1.1 Directors’ Meetings The number of Directors’ meetings and number of meetings attended by each of the Directors of the Company during the financial year were:
Director Board of Directors Remuneration Committee Audit & Risk Committee Present Held Present Held Present Held
Alasdair Cooke 2 2 2 2 ‐ ‐ Charles Tabeart 2 2 ‐ ‐ ‐ ‐ Gregory Fry 2 2 ‐ ‐ 2 2 Valentine Chitalu 2 2 ‐ ‐ ‐ ‐ Philip Clark Vincent Masterton‐Hume Wayne Trumble John Dean
2 1 2 2
2 2 2 2
2 2 ‐ ‐
2 2 ‐ ‐
2 ‐ 2 ‐
2 ‐ 2 ‐
2. Review of Operations
The supply and demand of power in the southern African region remained in broad balance during the last twelve months, but with notable shortages in key markets. Zambia, the largest producer of copper in Africa, continues to experience widespread power shortages caused by an over reliance on hydro‐electric power schemes that have been hampered by low rainfalls and excessive exploitation during the past few years. Despite the commissioning of 300MW of new coal‐fired generation and a new 120MW hydro‐electric project, Zambia has still needed to import large amounts electricity via a series of short‐term, often high‐cost contracts to help meet local demand. This situation has resulted in sharp increases in power tariffs to US $0.093 per kWh for all major industrial customers in Zambia, with additional increases likely in the coming years. Furthermore, the supply of power to major industrial users has not always been sufficient to meet demand, resulting in load shedding and supply interruptions to the major mines on the Copperbelt. In this context of reducing regional power stability, African Energy progressed its coal to power projects and remains committed to becoming an independent producer of reliable, affordable and secure base‐load electricity. Major milestones achieved during the year include:
First Quantum Minerals Ltd. (FQM) continued to invest in the Sese JV Project, increasing its stake to 61%. First Quantum will invest a further A$5 million to reach a 75% interest, following which African Energy’s 25% interest in any coal‐to‐power project developed at the site will be loan carried by First Quantum through to production.
Technical studies on preliminary design and layout, operating and capital costs and transmission routes between Botswana and Zambia have been completed for a 450MW power station and integrated coal mine.
The Sese JV Project continued to receive strong support from the Government of Botswana via the approval of a 25‐year mining licence for the project, plus the granting of a Manufacturing Development Approval Order which provides for a 5‐year tax holiday from commercial completion followed by a 15% corporate tax rate for the power project.
All project information and technical studies have been incorporated into an Information Memorandum which is suitable for briefing potential lenders to the project.
Negotiations with Botswana government departments to secure a Generation and Export Licence and suitable transmission and wheeling agreements with the relevant southern African power utilities commenced in the year. In order to conclude these commercial arrangements, AFR and FQM have extended the period required FQM to complete its earn‐in for 75% interest in the Sese JV beyond the current end date of July 2017.
Post balance date, FQM increased its stake in African Energy to 13.8% via an equity placement of A$1.38 million at A$ 0.078 per share. 3. Remuneration Report ‐ Audited
This Remuneration Report outlines the remuneration arrangements which were in place during the year, and remain in place as at the date of this report, for the Directors and key management personnel (“KMP”) of African Energy Resources Limited. The information provided in this remuneration report has been Audited as required by section 308(3c) of the Corporations Act 2001.
3.1 Principles of Compensation
The objective of the Company’s executive reward framework is to ensure reward for performance is competitive and appropriate for the results delivered. The framework aligns executive reward with achievement of strategic objectives and the creation of value for shareholders, and conforms with market practice for delivery of reward. The Board ensures that executive reward satisfies the following key criteria for good reward governance practices:
Directors’ Report (continued)
For
per
sona
l use
onl
y
AfricanEnergy Annual Report 2017 13
African Energy Resources Limited Financial Report 30 June 2017
Directors Report (continued)
8 | P a g e
competitiveness and reasonableness; acceptability to shareholders; performance linkage / alignment of executive compensation; transparency; and capital management.
Alignment to shareholders’ interests:
has economic profit as a core component of plan design; focuses on sustained growth in shareholder wealth, consisting of dividends and growth in share price, and delivering constant return
on assets as well as focusing the executive on key non‐financial drivers of value; and attracts and retains high calibre executives.
Alignment to program participants’ interests:
rewards capability and experience; reflects competitive reward for contribution to growth in shareholder wealth; provides a clear structure for earning rewards; and provides recognition for contribution.
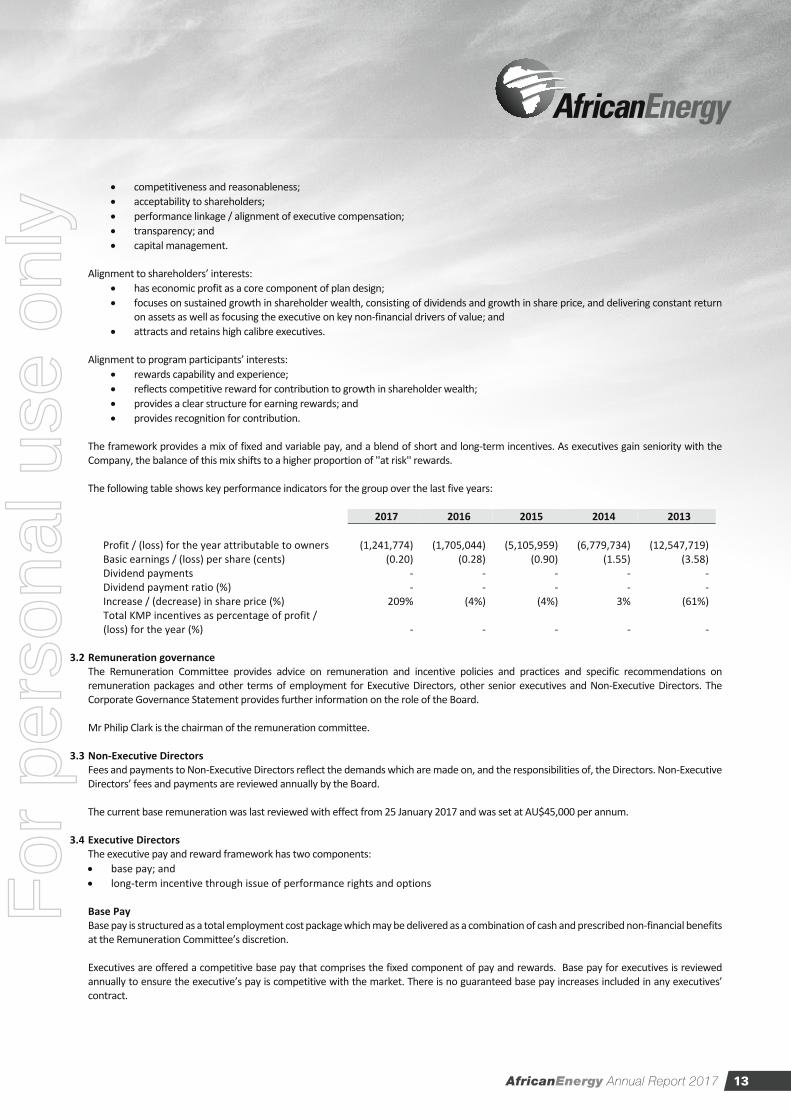
The framework provides a mix of fixed and variable pay, and a blend of short and long‐term incentives. As executives gain seniority with the Company, the balance of this mix shifts to a higher proportion of ''at risk'' rewards. The following table shows key performance indicators for the group over the last five years:
2017 2016 2015 2014 2013
Profit / (loss) for the year attributable to owners
(1,241,774) (1,705,044) (5,105,959) (6,779,734) (12,547,719) Basic earnings / (loss) per share (cents) (0.20) (0.28) (0.90) (1.55) (3.58) Dividend payments ‐ ‐ ‐ ‐ ‐ Dividend payment ratio (%) ‐ ‐ ‐ ‐ ‐ Increase / (decrease) in share price (%) 209% (4%) (4%) 3% (61%) Total KMP incentives as percentage of profit / (loss) for the year (%) ‐ ‐ ‐ ‐ ‐
3.2 Remuneration governance
The Remuneration Committee provides advice on remuneration and incentive policies and practices and specific recommendations on remuneration packages and other terms of employment for Executive Directors, other senior executives and Non‐Executive Directors. The Corporate Governance Statement provides further information on the role of the Board. Mr Philip Clark is the chairman of the remuneration committee.
3.3 Non‐Executive Directors
Fees and payments to Non‐Executive Directors reflect the demands which are made on, and the responsibilities of, the Directors. Non‐Executive Directors’ fees and payments are reviewed annually by the Board. The current base remuneration was last reviewed with effect from 25 January 2017 and was set at AU$45,000 per annum.
3.4 Executive Directors
The executive pay and reward framework has two components: base pay; and long‐term incentive through issue of performance rights and options Base Pay Base pay is structured as a total employment cost package which may be delivered as a combination of cash and prescribed non‐financial benefits at the Remuneration Committee’s discretion. Executives are offered a competitive base pay that comprises the fixed component of pay and rewards. Base pay for executives is reviewed annually to ensure the executive’s pay is competitive with the market. There is no guaranteed base pay increases included in any executives’ contract.
For
per
sona
l use
onl
y

14 africanenergyresources.com
African Energy Resources Limited Financial Report 30 June 2017
Directors Report (continued)
9 | P a g e
Long‐term incentives The award of performance rights and options to Directors, provides an opportunity for Directors to participate in the Company's growth and an incentive to contribute to that growth. The Remuneration Committee has determined performance hurdles that will apply to each performance right and option issued. Performance conditions attached to performance rights and options are detailed in note 7.4. Service Contracts On appointment to the Board, Executive Directors enter into an executive service agreement with the Company. The agreement details the Board policies and terms, including compensation, relevant to the office of Director. The Company currently has service contracts in place with the following three Board members. All contracts with Executive Directors are for a two year term but can be terminated by either party with three months’ notice. Details of the service agreements are listed below. Mr Alasdair Campbell Cooke ‐ Executive Chairman, the Company Commencement date: 1 January 2017 Base salary is US$65,110 (AU$85,000) Termination payment is the equivalent of three months consulting fees Dr Charles Frazer Tabeart ‐ Managing Director, the Company Commencement date: 1 January 2017 Base salary is US$245,120 (AU$320,000) Termination payment is the equivalent of three months consulting fees Mr Gregory William Fry ‐ Executive Director, the Company Commencement date: 1 January 2017 Base salary is US$122,560 (AU$160,000) Termination payment is the equivalent of three months consulting fees No other key management personnel have service contracts in place with the Consolidated Entity.
3.5 Comments made at the Company’s 2016 Annual General Meeting
The Company did not receive any specific feedback at the AGM or throughout the year on its remuneration practices. 3.6 Directors and Executive Officers’ Remuneration (Consolidated Entity)
Details of the remuneration of the Directors of the Consolidated Entity (as defined in AASB 124 Related Party Disclosures) of the Consolidated Entity are set out in the following tables. The key management personnel of the Consolidated Entity are the Directors of African Energy Resources Limited.
Directors’ Report (continued)
For
per
sona
l use
onl
y

AfricanEnergy Annual Report 2017 15
African Energy Resources Limited Financial Report 30 June 2017
Directors Report (continued)
10 | P a g e
The following tables set out remuneration paid to key management personnel of the Consolidated Entity during the year.
Key Management Personnel ‐ 2017
Short term employee benefits
Share based payments Total
Cash salary & fees Shares Performance Rights
US$ US$ US$ US$ Non‐Executive Directors Valentine Chitalu 33,920 ‐ 3,537 37,457 Philip Clark 33,920 ‐ (12,388) 21,532 Vincent Masterton‐Hume 33,920 ‐ 884 34,804 Wayne Trumble 33,920 ‐ 6,629 40,549 John Dean 33,920 ‐ ‐ 33,920 Total Non‐Executive Directors 169,600 ‐ (1,338) 168,262 Key Management Personnel Executive Directors Gregory Fry 120,606 ‐ (31,095) 89,511 Charles Tabeart 241,211 ‐ (67,497) 173,714 Alasdair Cooke 82,163 ‐ (12,895) 69,268 Total Key Management Personnel 443,980 ‐ (111,487) 332,493 Total 613,580 ‐ (112,825) 500,755 Key Management Personnel – 2016 Non‐Executive Directors Valentine Chitalu 32,771 ‐ 5,127 37,898 Philip Clark 32,771 ‐ 2,037 34,808 Vincent Masterton‐Hume 32,771 ‐ 1,282 34,053 Wayne Trumble 32,771 ‐ 9,609 42,380 John Dean 32,771 ‐ ‐ 32,771 Total Non‐Executive Directors 163,855 ‐ 18,055 181,910 Key Management Personnel Executive Directors Gregory Fry 116,520 ‐ 9,832 126,352 Charles Tabeart 233,040 ‐ 11,974 245,014 Alasdair Cooke 86,662 8,375 8,762 103,799 Total Key Management Personnel 436,222 8,375 30,568 475,165 Total 600,077 8,375 48,622 657,074
Negative remuneration values are due to a reversal in share based payment expense as a result of a change in management estimates for the achievement of performance rights. The Group did not engage a remuneration consultant during the year.
3.7 Share‐based compensation
The Company awarded performance rights and options to directors for no consideration during the year. Performance rights and options carry no dividend or voting rights. When exercisable, each right is convertible into one ordinary share and each options is convertible to one ordinary share by paying the option exercise price. On 19 December 2016 Directors were awarded 1,266,667 performance rights that shall vest upon the formal execution of a 300MW Sese PPA or when FQM have made a formal financial commitment to a 300MW power station at Sese post 1 October 2017 as follows.
Alasdair Cooke 166,666 Charles Tabeart 666,667 Gregory Fry 333,333 Phil Clark 100,000
Performance Rights awarded to Mr Cooke, Dr Tabeart and Mr Fry vest upon the formal execution by the Company of a Power Purchase Agreement for the full output of a 300MW Integrated Power project at Sese with an execution date from 1 October 2017 to 31 December 2019.
For
per
sona
l use
onl
y

16 africanenergyresources.com
African Energy Resources Limited Financial Report 30 June 2017
Directors Report (continued)
11 | P a g e
Performance Rights awarded to Mr Clark shall vest upon completion of a bankable feasibility study on the Sese Coal Project with an effective completion date from 1 October 2017 to 31 December 2019.
Shareholder approval date 22 November 2016 22 November 2016 Number 1,166,666 100,000 Price on Issue Date A$0.039 A$0.039 Likelihood of hurdle being met (See note 1.6) more likely than less likely less likely than more likely Expiry = 30 September 2019 30‐Sep‐19 30‐Sep‐19 Fair Value (market price on the date of issue) A$0.039 A$0.039 Total value US$34,580 US$2,964 Expensed in Period US$3,338 Nil
On 19 December 2016 Directors were awarded 7,125,000 options exercisable at 6c upon the Company or its partners making an irrevocable commitment to a power purchase agreement at Mmamabula West. Options were valued using binomial option pricing model using the following inputs.
Shareholder approval date 22 November 2016 Number 10,875,000 Price on Issue Date A$0.039 Strike Price: A$0.06 Likelihood of hurdle being met (See note 1.6) less likely than more likely Expiry = 30 September 2019 30‐Sep‐19 Volatility 80% Fair Value AU$0.0146 per option Total value US$120,740 Expensed in Period Nil
3.8 Directors’ and Executives Interests
A. Shares
Balance at 30/06/2016
Purchases (Sales)
Balance at 30/06/2017
Balance at Reporting
Date Non‐executive Directors Valentine Chitalu 2,251,425 ‐ 2,251,425 2,251,425 Philip Clark 2,485,392 ‐ 2,485,392 2,485,392 Vincent Masterton‐Hume 4,157,606 ‐ 4,157,606 4,157,606 Wayne Trumble 327,273 ‐ 327,273 327,273 John Dean ‐ ‐ ‐ ‐ Executive Directors Alasdair Cooke 50,003,682 ‐ 50,003,682 50,003,682 Charles Tabeart 4,774,100 ‐ 4,774,100 4,774,100 Gregory Fry 5,869,610 ‐ 5,869,610 5,869,610
69,869,088 ‐ 69,869,088 69,869,088
Directors’ Report (continued)
For
per
sona
l use
onl
y

AfricanEnergy Annual Report 2017 17
African Energy Resources Limited Financial Report 30 June 2017
Directors Report (continued)
12 | P a g e
B. Performance Rights
Balance at 30/06/2016
Issued 19 December
2016
Balance at 30/06/2017
Vested and exercisable Unvested
Non‐executive Directors Valentine Chitalu 400,000 ‐ 400,000 ‐ 400,000 Philip Clark 200,000 100,000 300,000 ‐ 300,000 Vincent Masterton‐Hume 100,000 ‐ 100,000 ‐ 100,000 Wayne Trumble 1,000,000 ‐ 1,000,000 ‐ 1,000,000 John Dean ‐ ‐ ‐ ‐ ‐ Executive Directors
Alasdair Cooke 933,333 166,667 1,100,000 ‐ 1,100,000 Charles Tabeart 1,933,333 666,667 2,600,000 ‐ 2,600,000 Gregory Fry 1,266,667 333,333 1,600,000 ‐ 1,600,000
5,833,333 1,266,667 7,100,000 ‐ 7,100,000 C. Options
Balance at 30/06/2016
Issued 19 December
2016
Balance at 30/06/2017
Vested and exercisable Unvested
Non‐executive Directors Valentine Chitalu ‐ 500,000 500,000 ‐ 500,000 Philip Clark ‐ 500,000 500,000 ‐ 500,000 Vincent Masterton‐Hume ‐ 500,000 500,000 ‐ 500,000 Wayne Trumble ‐ 500,000 500,000 ‐ 500,000 John Dean ‐ ‐ ‐ ‐ ‐ Executive Directors Alasdair Cooke ‐ 1,750,000 1,750,000 ‐ 1,750,000 Charles Tabeart ‐ 2,500,000 2,500,000 ‐ 2,500,000 Gregory Fry ‐ 875,000 875,000 ‐ 850,000
‐ 7,125,000 7,125,000 ‐ 7,125,000
On 19 December 2016 directors were awarded 7,125,000 options exercisable at 6c upon the Company or its partners making an irrevocable commitment to a power purchase agreement at Mmamabula West.
D. Other related party transactions The terms and conditions of the transactions with Directors, key executives and associates and their related entities were no more favourable than those available, or which might reasonably be expected to be available, on similar transactions to non‐Director related entities on an arm’s length basis. Charges from Charges to
2017 2016 2017 2016 US$ US$ US$ US$
Mitchell River Group Pty Ltd 111,668 190,066 ‐ ‐ Anova Metals Limited ‐ 2,383 ‐ 5,823 EVE Investments Limited ‐ ‐ 40,611 34,771
At 30 June 2017 the company had a payable outstanding to Mitchell River Group of US$2,962 (30 June 2016: US$15,799). This is the end of the Audited remuneration report.
4. Principal Activities The principal activity of the Consolidated Entity during the course of the financial year was the development of power projects in southern Africa.
5. Events Subsequent to Reporting Date
On 10 August, the Company agreed with First Quantum Minerals (FQM) to extend the period for FQM to complete the earn‐in by 12 months, to 12 July 2018, at which time if firm arrangements for wheeling power are not in place the commitment date may be extended by a further 12 months.
For
per
sona
l use
onl
y

18 africanenergyresources.com
African Energy Resources Limited Financial Report 30 June 2017
Directors Report (continued)
13 | P a g e
In connection with the extension of the Sese JV earn‐in period FQM subscribed for 17,692,308 new African Energy shares at a price of A$0.078 per share, for total proceeds of A$1.38 million. Also in connection with the JV extension, FQM has transferred to African Energy, their entire holding of 5,985,886 shares in ASX‐listed Caravel Minerals. African Energy is a a substantial shareholder of Caravel Minerals with 7.3% of the voting power. No other matters or circumstances have arisen since the end of the financial year which have significantly affected or may significantly affect the operations, results or state of affairs of the Group in future financial years which have not been disclosed publicly at the date of this report.
6. Likely Developments and Expected Results
The Group will continue to pursue activities within its corporate objectives. Further information about likely developments in the operations of the Group and the expected results of those operations in the future financial years has not been included in this report because disclosure would likely result in unreasonable prejudice to the Group.
7. Significant Changes in the State of Affairs
In the opinion of the Directors, other than stated under Review of Operations, and Events Subsequent to Reporting Date, there were no significant changes in the state of affairs of the Group that occurred during the financial year under review and subsequent to the year end.
8. Environmental Regulations
The Consolidated Entity’s operations are not subject to any significant environmental regulations under the legislation of countries in which it operates. However, the Board believes there are adequate systems in place for the management of its environmental requirements and is not aware of any breach of those environmental requirements as they apply. The Company is not subject to the reporting requirements of both the Energy Efficiency Opportunities Act 2006 and the National Greenhouse and Energy Reporting Act 2007.
9. Indemnification and Insurance of Officers and Auditors
11.1 Indemnification An indemnity agreement has been entered into with each of the Directors and Company Secretary of the Company named earlier in this report. Under the agreement, the Company has agreed to indemnify those officers against any claim or for any expenses or costs which may arise as a result of work performed in their respective capacities to the extent permitted by law. There is no monetary limit to the extent of this indemnity. 11.2 Insurance During the financial year, the Company has taken out an insurance policy in respect of Directors’ and officers’ liability and legal expenses’ for Directors and officers.
10. Corporate Structure
African Energy Resources Limited is a Company limited by shares that is incorporated and domiciled in Guernsey. The Company is listed on the Australian Securities Exchange and Botswana Stock Exchange under code AFR.
11. Non‐Audit Services
During the year, there were no non‐Audit services provided by BDO Audit (WA) Pty Limited (2016: nil).
12. Lead Auditor’s Independence Declaration The lead Auditor’s Independence Declaration is set out on page 16 and forms part of the Directors’ report for the financial year ended 30 June 2017.
Charles Frazer Tabeart Managing Director Perth, 29 September 2017
Directors’ Report (continued)
For
per
sona
l use
onl
y

AfricanEnergy Annual Report 2017 19
African Energy Resources Limited Financial Report 30 June 2017 Directors’ Declaration
14 | P a g e
African Energy Resources Limited and its Controlled Entities The Directors of the Company declare that: 1 The financial statements, comprising the consolidated statement of profit or loss and other comprehensive income , consolidated
statement of financial position, consolidated statement of cash flows, consolidated statement of changes in equity and accompanying notes, are in accordance with the Corporations Act 2001; and
(a) comply with Accounting Standards and the Corporations Regulations 2001 and other mandatory professional reporting
requirements; and
(b) give a true and fair view of the financial position as at 30 June 2017 and of the performance for the year ended on that date of
the Consolidated Entity.
2 In the Directors opinion, there are reasonable grounds to believe that the Company will be able to pay its debts as and when they
become due and payable.
3 The Consolidated Entity has included in the notes to the financial statements an explicit and unreserved statement of compliance with International Financial Reporting Standards.
4 The Directors have been given the declarations by the Chief Executive Officer and Chief Financial Officer required by section 295A
of the Corporations Act 2001. This declaration is made in accordance with a resolution of the Board of Directors and is signed on behalf of the Directors by: Charles Frazer Tabeart Managing Director Perth, 29 September 2017
Directors’ Declaration
For
per
sona
l use
onl
y

20 africanenergyresources.com
BDO Audit (WA) Pty Ltd ABN 79 112 284 787 is a member of a national association of independent entities which are all members of BDO Australia Ltd ABN 77 050 110 275,an Australian company limited by guarantee. BDO Audit (WA) Pty Ltd and BDO Australia Ltd are members of BDO International Ltd, a UK company limited by guarantee, andform part of the international BDO network of independent member firms. Liability limited by a scheme approved under Professional Standards Legislation other than forthe acts or omissions of financial services licensees
Tel: +61 8 6382 4600Fax: +61 8 6382 4601www.bdo.com.au
38 Station StreetSubiaco, WA 6008PO Box 700 West Perth WA 6872Australia
INDEPENDENT AUDITOR'S REPORT
To the members of African Energy Resources Limited
Report on the Audit of the Financial Report
Opinion
We have audited the financial report of African Energy Resources Limited (the Company) and itssubsidiaries (the Group), which comprises the consolidated statement of financial position as at 30June 2017, the consolidated statement of profit or loss and other comprehensive income, theconsolidated statement of changes in equity and the consolidated statement of cash flows for the yearthen ended, and notes to the financial report, including a summary of significant accounting policiesand the directors’ declaration.
In our opinion the accompanying financial report of the Group, is in accordance with the CorporationsAct 2001, including:
(i) Giving a true and fair view of the Group’s financial position as at 30 June 2017 and of itsfinancial performance for the year ended on that date; and
(ii) Complying with Australian Accounting Standards and the Corporations Regulations 2001.
Basis for opinion
We conducted our audit in accordance with Australian Auditing Standards. Our responsibilities underthose standards are further described in the Auditor’s responsibilities for the audit of the FinancialReport section of our report. We are independent of the Group in accordance with the CorporationsAct 2001 and the ethical requirements of the Accounting Professional and Ethical Standards Board’sAPES 110 Code of Ethics for Professional Accountants (the Code) that are relevant to our audit of thefinancial report in Australia. We have also fulfilled our other ethical responsibilities in accordancewith the Code.
We confirm that the independence declaration required by the Corporations Act 2001, which has beengiven to the directors of the Company, would be in the same terms if given to the directors as at thetime of this auditor’s report.
We believe that the audit evidence we have obtained is sufficient and appropriate to provide a basisfor our opinion.
Key audit matters
Key audit matters are those matters that, in our professional judgement, were of most significance inour audit of the financial report of the current period. These matters were addressed in the context ofour audit of the financial report as a whole, and in forming our opinion thereon, and we do not providea separate opinion on these matters.
Independent Audit Report
For
per
sona
l use
onl
y
AfricanEnergy Annual Report 2017 21
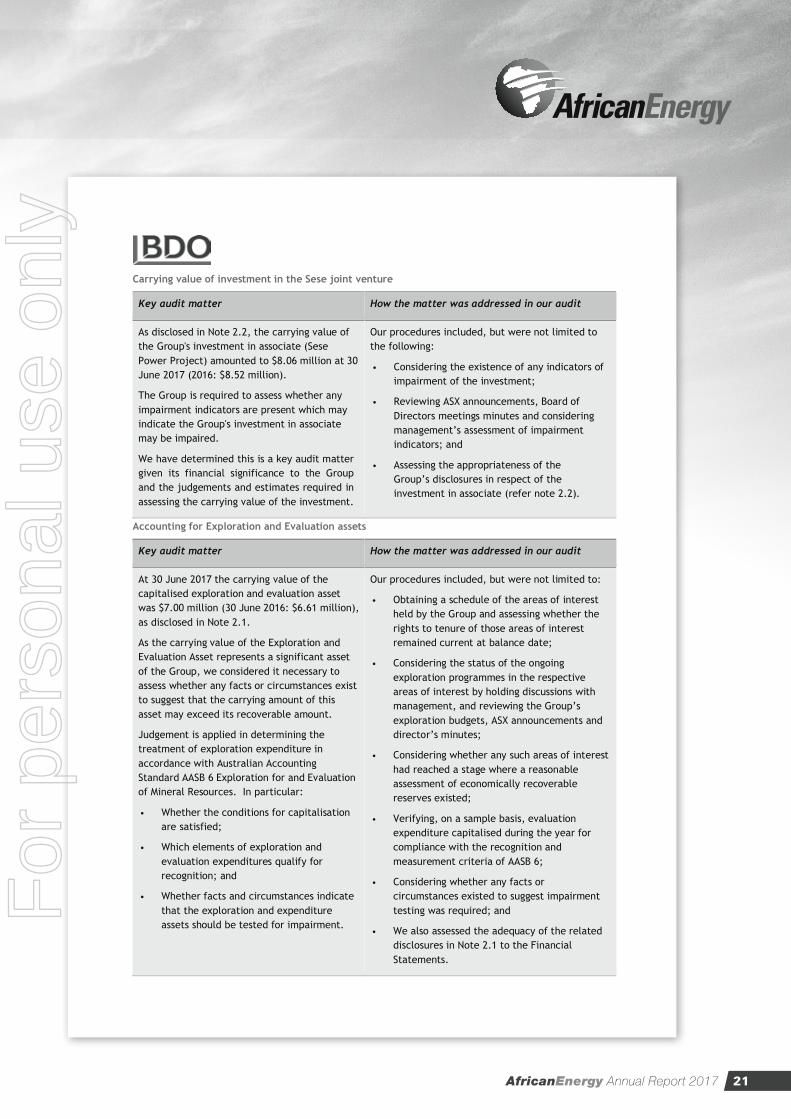
Carrying value of investment in the Sese joint venture
Key audit matter How the matter was addressed in our audit
As disclosed in Note 2.2, the carrying value ofthe Group's investment in associate (SesePower Project) amounted to $8.06 million at 30June 2017 (2016: $8.52 million).
The Group is required to assess whether anyimpairment indicators are present which mayindicate the Group's investment in associatemay be impaired.
We have determined this is a key audit mattergiven its financial significance to the Groupand the judgements and estimates required inassessing the carrying value of the investment.
Our procedures included, but were not limited tothe following:
• Considering the existence of any indicators ofimpairment of the investment;
• Reviewing ASX announcements, Board ofDirectors meetings minutes and consideringmanagement’s assessment of impairmentindicators; and
• Assessing the appropriateness of theGroup’s disclosures in respect of theinvestment in associate (refer note 2.2).
Accounting for Exploration and Evaluation assets
Key audit matter How the matter was addressed in our audit
At 30 June 2017 the carrying value of thecapitalised exploration and evaluation assetwas $7.00 million (30 June 2016: $6.61 million),as disclosed in Note 2.1.
As the carrying value of the Exploration andEvaluation Asset represents a significant assetof the Group, we considered it necessary toassess whether any facts or circumstances existto suggest that the carrying amount of thisasset may exceed its recoverable amount.
Judgement is applied in determining thetreatment of exploration expenditure inaccordance with Australian AccountingStandard AASB 6 Exploration for and Evaluationof Mineral Resources. In particular:
• Whether the conditions for capitalisationare satisfied;
• Which elements of exploration andevaluation expenditures qualify forrecognition; and
• Whether facts and circumstances indicatethat the exploration and expenditureassets should be tested for impairment.
Our procedures included, but were not limited to:
• Obtaining a schedule of the areas of interestheld by the Group and assessing whether therights to tenure of those areas of interestremained current at balance date;
• Considering the status of the ongoingexploration programmes in the respectiveareas of interest by holding discussions withmanagement, and reviewing the Group’sexploration budgets, ASX announcements anddirector’s minutes;
• Considering whether any such areas of interesthad reached a stage where a reasonableassessment of economically recoverablereserves existed;
• Verifying, on a sample basis, evaluationexpenditure capitalised during the year forcompliance with the recognition andmeasurement criteria of AASB 6;
• Considering whether any facts orcircumstances existed to suggest impairmenttesting was required; and
• We also assessed the adequacy of the relateddisclosures in Note 2.1 to the FinancialStatements.
For
per
sona
l use
onl
y

22 africanenergyresources.com
Other information
The directors are responsible for the other information. The other information comprises theunaudited information contained in the director’s report for the year ended 30 June 2017, but does notinclude the financial report and our auditor’s report thereon, which we obtained prior to the date ofthis auditor’s report, and the annual report, which is expected to be made available to us after thatdate.
Our opinion on the financial report does not cover the other information and we do not express anyform of assurance conclusion thereon.
In connection with our audit of the financial report, our responsibility is to read the other informationidentified above and, in doing so, consider whether the other information is materially inconsistentwith the financial report or our knowledge obtained in the audit or otherwise appears to be materiallymisstated.
If, based on the work we have performed on the other information that we obtained prior to the dateof this auditor’s report, we conclude that there is a material misstatement of this other information,we are required to report that fact. We have nothing to report in this regard.
When we read the annual report, if we conclude that there is a material misstatement therein, we arerequired to communicate the matter to the directors and will request that it is corrected. If it is notcorrected, we will seek to have the matter appropriately brought to the attention of users for whomour report is prepared.
Responsibilities of the directors for the Financial Report
The directors of the Company are responsible for the preparation of the financial report that gives atrue and fair view in accordance with Australian Accounting Standards and the Corporations Act 2001and for such internal control as the directors determine is necessary to enable the preparation of thefinancial report that gives a true and fair view and is free from material misstatement, whether due tofraud or error.
In preparing the financial report, the directors are responsible for assessing the ability of the group tocontinue as a going concern, disclosing, as applicable, matters related to going concern and using thegoing concern basis of accounting unless the directors either intend to liquidate the Group or to ceaseoperations, or has no realistic alternative but to do so.
Independent Audit Report (continued)
For
per
sona
l use
onl
y

AfricanEnergy Annual Report 2017 23
Auditor’s responsibilities for the audit of the Financial Report
Our objectives are to obtain reasonable assurance about whether the financial report as a whole is freefrom material misstatement, whether due to fraud or error, and to issue an auditor’s report thatincludes our opinion. Reasonable assurance is a high level of assurance, but is not a guarantee that anaudit conducted in accordance with the Australian Auditing Standards will always detect a materialmisstatement when it exists. Misstatements can arise from fraud or error and are considered materialif, individually or in the aggregate, they could reasonably be expected to influence the economicdecisions of users taken on the basis of this financial report.
A further description of our responsibilities for the audit of the financial report is located at theAuditing and Assurance Standards Board website (http://www.auasb.gov.au/Home.aspx) at:
http://www.auasb.gov.au/auditors_responsibilities/ar1.pdf
This description forms part of our auditor’s report.
Report on the Remuneration Report
Opinion on the Remuneration Report
We have audited the Remuneration Report included in pages 7 to 12 of the directors’ report for theyear ended 30 June 2017.
In our opinion, the Remuneration Report of African Energy Resources Limited, for the year ended 30June 2017 complies with section 300A of the Corporations Act 2001.
Responsibilities
The directors of the Company are responsible for the preparation and presentation of theRemuneration Report in accordance with section 300A of the Corporations Act 2001. Our responsibilityis to express an opinion on the Remuneration Report, based on our audit conducted in accordance withAustralian Auditing Standards.
BDO Audit (WA) Pty Ltd
Jarrad Prue
Director
Perth, 29 September 2017For
per
sona
l use
onl
y

24 africanenergyresources.com
BDO Audit (WA) Pty Ltd ABN 79 112 284 787 is a member of a national association of independent entities which are all members of BDO Australia Ltd ABN 77 050 110 275,an Australian company limited by guarantee. BDO Audit (WA) Pty Ltd and BDO Australia Ltd are members of BDO International Ltd, a UK company limited by guarantee, andform part of the international BDO network of independent member firms. Liability limited by a scheme approved under Professional Standards Legislation other than forthe acts or omissions of financial services licensees
Tel: +61 8 6382 4600Fax: +61 8 6382 4601www.bdo.com.au
38 Station StreetSubiaco, WA 6008PO Box 700 West Perth WA 6872Australia
DECLARATION OF INDEPENDENCE BY JARRAD PRUE TO THE DIRECTORS OF AFRICAN ENERGYRESOURCES LIMITED
As lead auditor of African Energy Resources Limited for the year ended 30 June 2017, I declare that, tothe best of my knowledge and belief, there have been:
1. No contraventions of the auditor independence requirements of the Corporations Act 2001 inrelation to the audit; and
2. No contraventions of any applicable code of professional conduct in relation to the audit.
This declaration is in respect of African Energy Resources Limited and the entities it controlled duringthe period.
Jarrad Prue
Director
BDO Audit (WA) Pty Ltd
Perth, 29 September 2017
Independent Audit Report (continued)
For
per
sona
l use
onl
y

AfricanEnergy Annual Report 2017 25
African Energy Resources Limited Financial Report 30 June 2017 Consolidated Statement of Profit or Loss and Other Comprehensive Income For the year ended 30 June 2017
20 | P a g e
2017 2016 Note US$ US$
Revenue from continuing operations 3.2 73,773 122,178 Personnel expenses 3.3 (344,010) (959,231) Professional & administration expense 3.3 (432,895) (537,385) Exploration & evaluation expensed (80,704) (45,168) Share of Loss in Sese JV 2.2 (458,346) (275,807) Foreign currency loss 408 (9,631) Loss before tax (1,241,774) (1,705,044) Income tax expense 3.4 ‐ ‐ Loss after income tax for the year (1,241,774) (1,705,044)
Attributable to: Equity holders of the Company (1,241,774) (1,705,044)
Loss for the year (1,241,774) (1,705,044)
Other comprehensive income Items that may be reclassified subsequently to profit or loss Foreign currency translation reserve 71,540 (262,066)
Total other comprehensive income / (loss) for the year 71,540 (262,066)
Total comprehensive loss attributable to the ordinary equity holders of the Company: Total comprehensive loss for the year (1,170,234) (1,967,110)
Loss per share for loss attributable to the ordinary equity holders of the Company: Basic and diluted loss per share (cents per share) 3.5 (0.20) (0.28)
The Consolidated Statement of Profit or Loss and Other Comprehensive Income is to be read in conjunction with the accompanying notes
Consolidated Statement of Profit or Loss and Other Comprehensive Income
For the year ended 30 June 2017
For
per
sona
l use
onl
y

26 africanenergyresources.com
African Energy Resources Limited Financial Report 30 June 2017 Consolidated Statement of Financial Position As at 30 June 2017
21 | P a g e
2017 2016
Note US$ US$ Assets Current assets Cash & cash equivalents 4.1 2,621,783 3,942,840 Trade & other receivables 4.3 138,786 129,360
Total current assets 2,760,569 4,072,200 Non‐current assets Investment in Sese Joint Venture 2.2 8,056,900 8,515,246 Property, plant & equipment 398 1,940 Exploration & evaluation 2.1 7,001,817 6,610,155
Total non‐current assets 15,059,115 15,127,341 Total assets 17,819,684 19,199,541 Liabilities Current liabilities Trade & other payables 4.4 118,675 197,305
Total current liabilities 118,675 197,305 Total liabilities 118,675 197,305 Net assets 17,701,009 19,002,236 Equity Contributed equity 5.1 63,109,911 63,109,911 Reserves 215,728 275,181 Retained Earnings (Accumulated losses) (45,624,630) (44,382,856)
Total equity attributable to shareholders of the Company 17,701,009 19,002,236
The consolidated statement of financial position is to be read in conjunction with the accompanying notes
Consolidated Statement of Financial Position
As at 30 June 2017
For
per
sona
l use
onl
y

AfricanEnergy Annual Report 2017 27
African Energy Resources Limited Financial Report 30 June 2017 Consolidated Statement of Changes in Equity for the year ended 30 June 2017
22 | P a g e
Contributed
equity
Accumulated losses
Foreign Currency Translation Reserve
Share‐Based
Payments Reserve
Total equity
US$ US$ US$ US$ US$ At 30 June 2015 63,545,081 (42,677,812) (4,886,734) 5,324,756 21,305,291 Net earnings for the year ‐ (1,705,044) ‐ ‐ (1,705,044) Effect of translation of foreign operations to group presentation currency ‐ ‐ (262,066) ‐ (262,066) Total comprehensive income for the year ‐ (1,705,044) (262,066) ‐ (1,967,110) Transactions with owners in their capacity as owners: Share buyback (443,887) ‐ ‐ ‐ (443,887) Share based payments 8,717 ‐ ‐ 99,225 107,942 (435,170) ‐ ‐ 99,225 (335,945) At 30 June 2016 63,109,911 (44,382,856) (5,148,800) 5,423,981 19,002,236 Net earnings for the year ‐ (1,241,774) ‐ ‐ (1,241,774) Effect of translation of foreign operations to group presentation currency ‐ ‐ 71,540 ‐ 71,540 Total comprehensive income for the year ‐ (1,241,774) 71,540 ‐ (1,170,234) Transactions with owners in their capacity as owners: Share based payments ‐ ‐ ‐ (130,993) (130,993) ‐ ‐ ‐ (130,993) (130,993) At 30 June 2017 63,109,911 (45,624,630) (5,077,260) 5,292,988 17,701,009
The consolidated statements of changes in equity are to be read in conjunction with the accompanying notes
Consolidated Statement of Changes in Equity
For the year ended 30 June 2017
For
per
sona
l use
onl
y

28 africanenergyresources.com
African Energy Resources Limited Financial Report 30 June 2017 Consolidated Statement of Cash Flows for the year ended 30 June 2017
23 | P a g e
2017 2016 Note US$ US$ Cash flows from operating activities
Interest received 76,351 150,444 Payment to suppliers and employees (997,191) (1,471,544) Net cash (outflow) from operating activities 4.2 (920,840) (1,321,100)
Cash flows from investing activities Payment for exploration and evaluation (461,333) (278,615) Net cash (outflow) from investing activities (461,333) (278,615)
Cash flows from financing activities Buyback of shares ‐ (443,887) Net cash inflow/(outflow) from financing activities ‐ (443,887)
Cash and cash equivalents at the beginning of the year 4.1 3,942,840 6,240,350 Net (decrease) / increase in cash and cash equivalents (1,382,173) (2,043,602) Effect of exchange rate fluctuations on cash held 61,116 (253,908) Cash and cash equivalents at the end of the year 4.1 2,621,783 3,942,840 The consolidated statements of cash flows are to be read in conjunction with the accompanying notes
Consolidated Statement of Cash Flows
For the year ended 30 June 2017
For
per
sona
l use
onl
y

AfricanEnergy Annual Report 2017 29
African Energy Resources Limited Financial Report 30 June 2017 Notes to the Consolidated Financial Statements
24 | P a g e
1. Basis of Preparation
1.1 Statement of Compliance
These general purpose financial statements have been prepared in accordance with Australian Accounting Standards (‘AASBs’) (including Australian Interpretations) adopted by the Australian Accounting Standards Board (‘AASB’) and the Corporations Act 2001. The financial report of the Consolidated Entity also complies with IFRSs and interpretations as issued by the International Accounting Standards Board. African Energy Resources Limited is a for‐profit entity for the purposes of preparing financial statements. The financial report was authorised for issue by the Directors on 29 September 2017.
1.2 Basis of measurement
The financial report is prepared under the historical cost convention.
1.3 Functional and presentation currency
These consolidated financial statements are presented in US dollars (‘US$’). The functional currency of the Company and each of the operating subsidiaries is US$ which represents the currency of the primary economic environment in which the Company and each of the operating subsidiaries operates. Subsidiaries denominated in Australian dollars (‘AU$’) are translated at the closing rate on reporting date. Profit and loss items are translated on the prevailing rate on the date of transaction.
1.4 Going concern
The financial report has been prepared on a going concern basis, which contemplates the continuity of normal business activity and the realisation of assets and the settlement of liabilities in the normal course of business.
1.5 Reporting entity
African Energy Resources Limited (referred to as the ‘Parent Entity’ or the ‘Company’) is a company domiciled in Guernsey. The consolidated financial statements of the Company as at and for the year ended 30 June 2017 comprise the Company and its subsidiaries (together referred to as the ‘Consolidated Entity’ or the ‘Group’). The Group is primarily involved in power and coal development in southern Africa.
1.6 Use of estimates and judgments
The preparation of a financial report in conformity with Australian Accounting Standards requires management to make judgments, estimates and assumptions that affect the application of policies and reported amounts of assets and liabilities, income and expenses. The estimates and associated assumptions are based on historical experience and various other factors that are believed to be reasonable under the circumstances, the results of which form the basis of making the judgements about carrying values of assets and liabilities that are not readily apparent from other sources. Actual results may differ from these estimates. These accounting policies have been consistently applied by each entity in the Consolidated Entity. The estimates and underlying assumptions are reviewed on an ongoing basis. Revisions to accounting estimates are recognised in the period in which the estimate is revised if the revision affects only that period or in the period of the revision and future periods if the revision affects both current and future periods. In particular, information about significant areas of estimation uncertainty and critical judgments in applying accounting policies that have the most significant effect on the amount recognised in the financial statements are described in the following notes:
Note 2.1 – Exploration & evaluation expenditure ‐ If, after having capitalised expenditure under this policy, the Directors conclude that the Group is unlikely to recover the expenditure by future exploration or sale, then the relevant capitalised amount will be written off to the Statement of Profit or Loss and other Comprehensive Income.
Note 2.2 – Investments in Associates – The carrying amount of the investment is tested for impairment indicators at least annually in accordance with AASB 136 Impairment of Assets. Where there are indicators present the group compares its recoverable amount (fair value less costs to sell) with its carrying amount.
Note 7.4 – Share‐based payments arrangements ‐ The Group values options issued at fair value at the grant date using the binomial option pricing model taking into account the exercise price, the term of the option, the impact of dilution, the share price at grant date, the expected volatility of the underlying share, the expected dividend yield and risk free interest rate for the term of the option. Performance rights are valued at face value of the share on the date of issue. At each reporting period management assess the probability of the vesting of options and performance rights where
Notes to the Consolidated Financial Statements
For the year ended 30 June 2017
For
per
sona
l use
onl
y

30 africanenergyresources.com
African Energy Resources Limited Financial Report 30 June 2017 Notes to the Consolidated Financial Statements (continued)
25 | P a g e
applicable in accordance with AASB 2 – Share based payments (non‐market conditions). The probability is assessed to either be less likely or more likely (0% or 100%) and a vesting expense is recorded accordingly.
2. Capital Expenditure
2.1 Exploration and evaluation expenditure
Exploration and evaluation activity involves the search for energy resources, the determination of technical feasibility and the assessment of commercial viability of an identified resource. Exploration and evaluation assets are only recognised if the rights of the area of interest are current and either: a) the expenditures are expected to be recouped through successful development and exploitation of the area of interest; or b) activities in the area of interest have not at the reporting date, reached a stage which permits a reasonable assessment of
the existence or other wise of economically recoverable reserves and active and significant operations in, or in relation to, the area of interest are continuing.
(a) Exploration and Evaluation Carrying Values
Exploration and evaluation assets are assessed for impairment if sufficient data exists to determine technical feasibility and commercial viability and facts and circumstances suggest that the carrying amount exceeds the recoverable amount. For the purposes of impairment testing, exploration and evaluation assets are allocated to cash‐generating units to which the exploration activity relates. The cash generating unit shall not be larger than the area of interest. Once the technical feasibility and commercial viability of the extraction of mineral resources in an area of interest are demonstrable, exploration and evaluation assets attributable to that area of interest are first tested for impairment and then reclassified from intangible assets to mineral property and development assets within property, plant and equipment. The recoverability of the carrying amounts of exploration and evaluation assets is dependent on the successful development and commercial exploitation or sale of the respective area of interest.
2017 2016
US$ US$ Mmamabula West Coal Project 3,601,645 3,214,851 Mmamantswe Coal Project 3,400,172 3,395,304 Carrying amount of exploration and evaluation 7,001,817 6,610,155
(b) Exploration and Evaluation movement reconciliation
Balance at the beginning of the year 6,610,155 6,179,689 Additions 380,856 437,020 Effect of movements in foreign exchange 10,806 (6,554) Carrying amount at 30 June 7,001,817 6,610,155
2.2 Investments in Associates
Associates are entities over which the Group has significant influence but not control or joint control. Associates are accounted for in the parent entity financial statements at cost and the consolidated financial statements using the equity method of accounting. Under the equity method of accounting, the group's share of post‐acquisition profits or losses of associates is recognised in consolidated profit or loss and the group's share of post‐acquisition other comprehensive income of associates is recognised in consolidated other comprehensive income. The cumulative post‐acquisition movements are adjusted against the carrying amount of the investment. Dividends received from associates are recognised in the parent entity's profit or loss, while they reduce the carrying amount of the investment in the consolidated financial statements. Subsidiaries are all entities over which the group has control. Control is determined with reference to whether the group is exposed to, or has rights to, variable returns from its involvement with the entity and has the ability to affect those returns through its power to direct the activities of the entity. Where the group loses control of a subsidiary but retains significant influence, the retained interest is re‐measured to fair value at the date that control is lost and the difference between fair value and the carrying amount is recognised in profit or loss. There is judgement involved in determining whether control has been lost and determining the fair value of the investment held.
Notes to the Consolidated Financial Statements (continued)
For
per
sona
l use
onl
y

AfricanEnergy Annual Report 2017 31
African Energy Resources Limited Financial Report 30 June 2017 Notes to the Consolidated Financial Statements (continued)
26 | P a g e
(a) Movements in carrying amounts
2017 2016 US$ US$ Balance at the beginning of the year 8,515,246 8,791,053 Share of Losses after income tax (458,346) (275,807) Carrying amount at 30 June 8,056,900 8,515,246
(b) Share of the results of its associates
The groups share of the results of its associates and its aggregated assets and liabilities are as follows.
Ownership Interest %
Company's share of:
Assets US$
Liabilities US$
Revenues US$
(Loss) US$
African Energy Holdings SRL 39% 5,619,876 15,005 ‐ (458,346)
(c) Summarised financial information of associate ‐ African Energy Holdings SRL
2017 2016 Summarised statement of financial position US$ US$ Current Assets Cash and cash equivalents 79,649 61,203 Trade and other receivables 92,344 422,159
Total current assets 171,993 483,362 Non‐current Assets Exploration & evaluation 14,112,860 12,860,916 Property, plant & equipment 125,085 173,418
Total non‐current assets 14,237,945 13,034,334 Total assets 14,409,937 13,517,696 Current Liabilities Trade and other payables 38,476 1,766,747
Total current liabilities 38,476 1,766,747 Total liabilities 38,476 1,766,747 Net assets 14,371,462 11,750,949
2017 2016 Summarised statement of comprehensive income US$ US$ Revenue - ‐ Total Operating Expense (1,098,124) (586,823)
Loss from operating activities (1,098,124) (586,823) Other comprehensive income ‐ ‐
Total comprehensive income (1,098,124) (586,823)
3. Financial Performance
3.1 Segment information
AASB 8 Operating Segments requires a ‘management approach’, under which segment information is presented on the same basis as that used for internal reporting purposes. The segments are reported in a manner that is consistent with the internal reporting provided to the chief operating decision maker.
For
per
sona
l use
onl
y

32 africanenergyresources.com
African Energy Resources Limited Financial Report 30 June 2017 Notes to the Consolidated Financial Statements (continued)
27 | P a g e
(a) Description of Segments The Company’s Board receives financial information across three reportable segments. These are Coal‐fired Power Projects; Power Investments and Unallocated.
(b) Segment Information
For the year ended 30 June 2017 Coal‐fired Power Projects
Power Investments Unallocated Consolidated
US$ US$ US$ US$ Total segment revenue ‐ ‐ 73,773 73,773 Profit (loss) before income tax ‐ (539,050) (702,724) (1,241,774)
Segment Assets Investment in Sese JV 8,056,900 ‐ 8,056,900 Exploration and evaluation expenditure 7,001,817 ‐ ‐ 7,001,817 Property, plant and equipment ‐ ‐ 398 398 Cash and short term receivable ‐ ‐ 2,760,569 2,760,569
Total Segment Assets 7,001,817 8,056,900 2,760,967 17,819,684
Segment Liabilities Trade & other payables ‐ ‐ 118,675 118,675
Total Segment Liabilities ‐ ‐ 118,675 118,675
For the year ended 30 June 2016
Total segment revenue ‐ ‐ 122,178 122,178 Profit (loss) before income tax ‐ (45,168) (1,659,876) (1,705,044)
Segment Assets Investment in Sese JV ‐ 8,515,246 ‐ 8,515,246 Exploration and evaluation expenditure 6,610,155 ‐ ‐ 6,610,155 Property, plant and equipment ‐ ‐ 1,940 1,940 Cash and short term receivable ‐ ‐ 4,072,200 4,072,200
Total Segment Assets 6,610,155 8,515,246 4,074,140 19,199,541
Segment Liabilities Trade & other payables ‐ ‐ 197,305 197,305
Total Segment Liabilities ‐ ‐ 197,305 197,305
3.2 Revenue
(a) Revenue recognition Revenue is recognised to the extent that it is probable that the economic benefits will flow to the entity and the revenue can be reliably measured.
(b) Net financial income
Net financial income comprises interest payable on borrowings calculated using the effective interest method, interest receivable on funds invested, dividend income and foreign exchange gains and losses. Interest income is recognised in the profit or loss as it accrues, using the effective interest method. Management fees are recognised in the profit or loss as the right to a fee accrues, in accordance with contractual rights. 2017 2016
US$ US$ Interest received 73,773 122,178
73,773 122,178
Notes to the Consolidated Financial Statements (continued)
For
per
sona
l use
onl
y

AfricanEnergy Annual Report 2017 33
African Energy Resources Limited Financial Report 30 June 2017 Notes to the Consolidated Financial Statements (continued)
28 | P a g e
3.3 Expenses
2017 2016 Personnel expenses Note US$ US$ Employee salaries 177,290 225,295 Superannuation 16,120 17,767 Directors fees 614,229 595,073 Recharge of staff costs to Sese Joint Venture as per Sese JV agreement (342,137) ‐ Share Based Payments 7.7 (130,993) 107,942 Payroll tax 9,501 13,154
344,010 959,231
2017 2016 Professional & administration expense US$ US$ Audit Tax and Accounting 60,921 75,338 Compliance & Insurance 96,496 115,358 Occupancy 103,147 77,038 Travel 73,604 106,642 Marketing 38,857 57,195 Legal fees 24,594 71,915 Depreciation and Impairment of PP&E 917 1,441 Other 34,359 32,458
432,895 537,385
3.4 Income Taxes
(a) Income tax expense: 2017 2016 US$ US$
Current tax ‐ ‐ Deferred tax ‐ ‐ Overprovision in respect to prior years ‐ ‐
‐ ‐
(b) Reconciliation of income tax expense to prima facie tax payable:
2017 2016 US$ US$
Loss before income tax (1,241,774) (1,705,044) Prima facie income tax at 30% (372,532) (511,513) Tax effect of amounts not deductible in calculating taxable income:
Sundry items 283 510 Other (29,245) 64,310
(401,494) (446,693) Difference in overseas tax rates 6,284 3,359 Tax loss not recognised 395,210 443,334 Income tax expense/(benefit) ‐ ‐
(c) Tax losses:
2017 2016 US$ US$
Unused tax losses for which no deferred tax asset has been recognised (752,507) (1,188,822) Potential tax benefit @ 30% (225,752) (356,647) Difference in overseas tax rates 10% 6,284 3,359 Potential tax benefit (219,468) (353,288)
For
per
sona
l use
onl
y

34 africanenergyresources.com
African Energy Resources Limited Financial Report 30 June 2017 Notes to the Consolidated Financial Statements (continued)
29 | P a g e
(d) Unrecognised deferred tax assets arising on timing differences and losses
2017 2016 US$ US$
Timing 152,805 97,002 Losses ‐ Revenue 4,173,072 3,953,604
4,325,877 4,050,606 The tax benefits of the above deferred tax assets will only be obtained if:
i. The Consolidated Entity derives future assessable income of a nature and of an amount sufficient to enable the benefits to be utilised;
ii. The Consolidated Entity continues to comply with the conditions for deductibility imposed by law; iii. No changes in income tax legislation adversely affect the Consolidated Entity from utilising the benefits.
Income tax on the Statement of Profit or Loss and other Comprehensive Income for the periods presented comprises current and deferred tax. Income tax is recognised in the Statement of Profit or Loss and other Comprehensive Income except to the extent that it relates to items recognised directly in equity, in which case it is recognised in equity. The current income tax charge is calculated on the basis of the tax laws enacted or substantively enacted at the end of the reporting period in the countries where the Company’s subsidiaries and associates operate and generate taxable income. Management periodically evaluates positions taken in tax returns with respect to situations in which applicable tax regulation is subject to interpretation. It establishes provisions where appropriate on the basis of amounts expected to be paid to the tax authorities. Deferred tax is provided using the liability method, providing for temporary differences between the carrying amounts of assets and liabilities for financial reporting purposes and the amounts used for taxation purposes. A deferred tax asset is recognised only to the extent that it is probable that future taxable profits will be available against which the asset can be utilised. Deferred tax assets are reduced to the extent that it is no longer probable that the related tax benefit will be realised, or to the extent that the Group has deferred tax liabilities with the same taxation authority. Additional income taxes that arise from the distribution of dividends are recognised at the same time as the liability to pay the related dividend.
3.5 Earnings per share
(e) Basic loss per share The calculation of basic loss per share at 30 June 2017 was based on the losses attributable to ordinary shareholders of US$1,241,774 (2016: US$1,705,044 and a weighted average number of ordinary shares outstanding during the financial year ended 30 June 2017 of 606,946,983 (2016: 612,535,581) calculated as follows:
2017 2016 US$ US$
Loss attributable to ordinary shareholders (1,241,774) (1,705,044)
Issued number of ordinary shares at 1 July 606,646,983 616,618,702 Effect of weighted average number of shares issued during the period 300,000 (4,083,121) Weighted average number of shares for year to 30 June 606,946,983 612,535,581
Basic (loss) per share (cents per share) (0.20) (0.28)
Basic earnings per share is calculated by dividing the profit attributable to equity holders of the Company, excluding any costs of servicing equity other than ordinary shares, by weighted average number of ordinary shares outstanding during the financial year, adjusted for the bonus elements in ordinary shares issued during the year.
(f) Diluted loss per share
Potential ordinary shares are not considered dilutive, thus diluted loss per share is the same as basic loss per share.
Notes to the Consolidated Financial Statements (continued)
For
per
sona
l use
onl
y

AfricanEnergy Annual Report 2017 35
African Energy Resources Limited Financial Report 30 June 2017 Notes to the Consolidated Financial Statements (continued)
30 | P a g e
4. Working Capital Management
4.1 Cash and Cash Equivalents
Cash and cash equivalents comprise cash balances, short term bills and call deposits. Bank overdrafts that are repayable on demand and form an integral part of the Consolidated Entity’s cash management are included as a component of cash and cash equivalents for the purpose of the statement of cash flows.
2017 2016
US$ US$ Cash at bank and in hand 604,282 603,832 Short‐term deposits 2,017,501 3,339,008
2,621,783 3,942,840
Refer to note 5.2 for risk exposure analysis.
4.2 Reconciliation of loss after income tax to net cash flows from operating activities
2017 2016 Cash flows from operating activities US$ US$ (Loss) for the year (1,241,774) (1,705,044) Adjustments for: Equity‐settled share‐based payment expenses (130,993) 107,942 Share of Loss in Sese JV 458,346 275,807 Depreciation and amortisation expense 917 1,441 Exploration & evaluation expensed 80,704 45,168 Foreign exchange losses (3,483) (1,272) Change in operating assets & liabilities (Increase)/decrease in trade and other receivables (33,593) (3,223) (Decrease)/increase in trade and other payables (50,964) (41,919) Net cash used in operating activities (920,840) (1,321,100)
4.3 Trade and other receivables
The fair value of trade and other receivables, excluding construction work in progress, is estimated as the present value of future cash flows, discounted at the market rate of interest at the reporting date.
2017 2016
US$ US$ Trade debtors 75,747 32,962 Interest receivable 31,851 34,429 GST and VAT receivable 31,188 61,969
138,786 129,360
Trade and other receivables are recorded at amounts due less any allowance for doubtful debts.
4.4 Trade and other payables
Trade and other payables are recognised when the related goods or services are received, at the amount of cash or cash equivalent that will be required to discharge the obligation, gross of any settlement discount offered. Trade payables are non‐interest bearing and are settled on normal terms and conditions. 2017 2016
US$ US$ Trade creditors 49,939 75,822 Accrued expenses 15,325 66,085 Payroll liabilities 53,411 55,398
118,675 197,305
For
per
sona
l use
onl
y

36 africanenergyresources.com
African Energy Resources Limited Financial Report 30 June 2017 Notes to the Consolidated Financial Statements (continued)
31 | P a g e
Liabilities for employee benefits for wages, salaries and annual leave that are expected to be settled within 12 months of the reporting date represent present obligations resulting from employees’ services provided to reporting date, are calculated at undiscounted amounts based on remuneration wage and salary rates that the Consolidated Entity expects to pay as at reporting date including related on‐costs, such as workers compensation insurance and payroll tax.
4.5 Impairment
The Group assesses at each reporting date whether there is objective evidence financial asset or group of financial assets is impaired. No impairment was recorded for the year.
5. Funding and Risk Management
The Group's objectives when managing capital are to safeguard their ability to continue as a going concern, so that it can continue to provide returns for shareholders and benefits for other stakeholders and to maintain an optimal capital structure to reduce the cost of capital. In order to maintain or adjust the capital structure, the Group may adjust the amount of dividends paid to shareholders, return capital to shareholders, issue new shares or sell assets to reduce debt. Ordinary shares entitle the holder to participate in dividends and the proceeds on winding up of the Company in the proportion to the number and amount paid on the shares held. Ordinary shares are classified as equity. Incremental costs directly attributable to the issue of new shares or options are shown in equity as a deduction, net of tax, from the proceeds. Incremental costs directly attributable to the issue of new shares or options for the acquisition of a business are not included in the cost of the acquisition as part of the purchase consideration. If the entity reacquires its own equity instruments, for example as a result of a share buy‐back, those instruments are deducted from equity and the associated shares are cancelled. No gain or loss is recognised in the profit or loss and the consideration paid including any directly attributable incremental costs (net of income taxes) is recognised directly in equity.
5.1 Contributed equity
Movement in share capital Date Number of shares
Issue price US$ cents US$
Balance 30 June 2015 616,618,702 63,545,081 Conversion of performance rights 01 Jul 2015 1,166,666 ‐ ‐ Shares in lieu of salary 01 Jul 2015 166,667 5.2 8,717 November share buyback 30 Nov 2015 (29,000) 3.8 (1,099) December share buyback 31 Dec 2015 (8,617,573) 3.8 (326,495) January share buyback 31 Jan 2016 (3,158,479) 3.7 (116,293) Conversion of performance rights 02 Feb 2016 500,000 ‐ ‐ Balance 30 June 2016 606,646,983 63,109,911 Conversion of performance rights 01 Jul 2016 300,000 ‐ ‐ Balance 30 June 2017 606,946,983 63,109,911
5.2 Financial risk management
The Group's activities expose it to a variety of financial risks: market risk (including currency risk, interest rate risk and price risk), credit risk and liquidity risk. The Group's overall risk management program focuses on the unpredictability of financial markets and seeks to minimise potential adverse effects on the financial performance of the Group. The Group uses different methods to measure different types of risk to which it is exposed. Risk management is carried out by the Audit & Risk Committee under a charter approved by the Board of Directors. The Audit & Risk Committee identifies, evaluates and hedges foreign currency risks by holding cash in the currency that it is budgeted to be spent in.
(a) Market risk i. Foreign currency risk
Foreign exchange risk arises from future commercial transactions and recognised assets and liabilities denominated in a currency that is not the entity’s functional currency and net investments in foreign operations. Some exposure to foreign exchange risk exists in respect to the Australian subsidiaries which provides administrative and technical support to the Group and have transactions denominated in Australian Dollars. The risk is measured using sensitivity analysis and cash flow forecasting.
Notes to the Consolidated Financial Statements (continued)
For
per
sona
l use
onl
y

AfricanEnergy Annual Report 2017 37
African Energy Resources Limited Financial Report 30 June 2017 Notes to the Consolidated Financial Statements (continued)
32 | P a g e
The Group’s exposure to foreign currency risk at the end of the reporting period, expressed in US$, was: 2017 2016 US$ US$ Cash held in US Dollars (US$) 250,976 428,934 Cash held in South African Rand (ZAR) 12,268 21,214 Cash held in Botswana Pula (BWP) 46,596 19,468 Trade and other receivables (BWP) 17,787 41,954 Trade and other payables (BWP) (29,138) (51,250)
ii. Price risk
The Group does not hold investments and therefore is not exposed to equity securities price risk.
iii. Interest rate risk The Group has significant interest‐bearing assets; however a change in interest rates would not have a material impact on the results.
Interest rate risk Foreign exchange risk
‐ 100 bps + 100 bps ‐10% +10%
Carrying amount
Profit US$
Equity US$
Profit US$
Equity US$
Profit US$
Equity US$
Profit US$
Equity US$
30 June 2017 Financial assets Cash and cash equivalents 2,621,783 26,218 (26,218) (26,218) 26,218 (25,098) 25,098 25,098 (25,098) Trade and other receivables 138,786 ‐ ‐ ‐ ‐ (13,879) 13,879 13,879 (13,879) Financial liabilities Trade and other payables 118,675 ‐ ‐ ‐ ‐ 2,914 (2,914) (2,914) 2,914
Interest rate volatility was chosen to reflect expected short term fluctuations in market interest rates. Foreign exchange volatility was chosen to reflect expected short term fluctuations in the Australian Dollar.
iv. Credit risk
The carrying amount of cash and cash equivalents, trade and other receivables (excluding prepayments), represent the Group’s maximum exposure to credit risk in relation to financial assets. Cash and short term liquid investment are placed with reputable banks, so no significant credit risk is expected. The Group does not have any material exposure to any single debtor or group of debtors, so no significant credit risk is expected. The credit quality of financial assets that are neither past due nor impaired can be assessed by reference to external credit rates:
2017 2016 US$ US$ Cash at bank & short term bank deposits A‐1+ 2,560,821 3,912,157 FNB Botswana (not rated) 46,596 19,167 Standard Bank South Africa (not rated) 12,268 6,450 Stanbic Bank (Zambia) (not rated) ‐ 2,908 Cash on hand 2,098 2,158
2,621,783 3,942,840
(b) Liquidity risk Prudent liquidity risk management implies maintaining sufficient cash and marketable securities, the availability of funding through an adequate amount of committed credit facilities and the ability to close out market positions. The Group manages liquidity risk by continuously monitoring forecast and actual cash flows and matching the maturity profiles of financial assets and liabilities. Due to the dynamic nature of the underlying businesses, management aims at maintaining flexibility in funding by keeping committed credit lines available with a variety of counterparties. Surplus funds are only invested in instruments that are tradeable in highly liquid markets. The tables below analyse the Group’s financial liabilities into relevant maturity groupings. The amounts disclosed in the table are the contractual undiscounted cash flows. Balances due within 12 months equal their carrying amounts as the impact of discounting is not significant.
For
per
sona
l use
onl
y

38 africanenergyresources.com
African Energy Resources Limited Financial Report 30 June 2017 Notes to the Consolidated Financial Statements (continued)
33 | P a g e
2017
Less than 6 months
6 ‐ 12 months
Total contractual cash flows
Trade Payables 118,675 ‐ 118,675
118,675 ‐ 118,675
2016
Trade Payables 197,305 ‐ 197,305
197,305 ‐ 197,305
(c) Fair value estimation The fair value of financial assets and financial liabilities must be estimated for recognition and measurement or for disclosure purposes. The fair value of financial instruments traded in active markets is based on quoted market prices at the reporting date. The quoted market price used for financial assets held by the Group is the current bid price. The fair value of financial instruments that are not traded in an active market is determined using valuation techniques. The Group uses a variety of methods and makes assumptions that are based on market conditions existing at each reporting date. Quoted market prices or dealer quotes for similar instruments are used for long‐term debt instruments held. Other techniques, such as estimated discounted cash flows, are used to determine fair value for the remaining financial instruments. The carrying value less impairment provision of trade receivables and payables are assumed to approximate their fair values due to their short‐term nature. The fair value of financial liabilities for disclosure purposes is estimated by discounting the future contractual cash flows at the current market interest rate that is available to the Group for similar financial instruments.
6. Group Structure
6.1 Basis of consolidation
(a) Subsidiaries Subsidiaries are all entities (including structured entities) over which the Group has control. The Group controls an entity when the Group is exposed to, or has rights to, variable returns from its involvement with the entity and has the ability to affect those returns through its power to direct the activities of the entity. Subsidiaries are fully consolidated from the date on which control is transferred to the Group. They are deconsolidated from the date that control ceases. Investments in subsidiaries are carried at their cost of acquisition in the Company’s financial statements.
(b) Transactions eliminated on consolidation
Intragroup balances, and any unrealised gains and losses or income and expenses arising from intragroup transactions, are eliminated in preparing the consolidated financial statements.
(c) Comparatives
Prior period comparatives are for the year from 1 July 2015 to 30 June 2016.
6.2 Foreign currency
(a) Foreign currency transactions Transactions in foreign currencies are translated to the functional currency at the foreign exchange rate ruling at the date of the transaction. Monetary assets and liabilities denominated in foreign currencies at the reporting date are translated to United States dollars at the foreign exchange rate ruling at that date. Foreign exchange differences arising on translation are recognised in the Statement of Profit or Loss and other Comprehensive Income. Non‐monetary assets and liabilities that are measured in terms of historical cost in a foreign currency are translated using the exchange rate at the date of the transaction. Non‐monetary assets and liabilities denominated in foreign currencies that are stated at fair value are translated to US$ at foreign exchange rates ruling at the dates the fair value was determined.
(b) Financial statements of foreign operations The assets and liabilities of Australian subsidiaries, including goodwill and fair value adjustments arising on consolidation, are translated to US dollars at foreign exchange rates ruling at the reporting date. The revenues and expenses of foreign operations, excluding foreign operations in hyperinflationary economies, are translated to US dollars at rates approximating to the foreign exchange rates ruling at the dates of the transactions.
Notes to the Consolidated Financial Statements (continued)
For
per
sona
l use
onl
y

AfricanEnergy Annual Report 2017 39
African Energy Resources Limited Financial Report 30 June 2017 Notes to the Consolidated Financial Statements (continued)
34 | P a g e
Foreign exchange differences arising on translation are recognised directly in the foreign currency translation reserve (“FCTR”), as a separate component of equity. When a foreign operation is disposed of, in part or in full, the relevant amount in the FCTR is transferred to profit or loss, as part of the gain or loss on sale where applicable.
(c) Net investment in foreign operations
Exchange differences arising from the translation of the net investment in foreign operations, and of related effective hedges are taken to translation reserve and released into profit or loss upon disposal.
6.3 Parent Entity Disclosures
The parent entity within the Group is African Energy Resources Limited.
2017 2016
US$ US$ Current Assets 6,296,418 7,218,400 Non‐Current Assets 11,404,591 11,783,840 Total Assets 17,701,009 19,002,240
Current Liabilities ‐ ‐ Total Liabilities ‐ ‐
Contributed equity 63,109,911 63,109,911 Reserves 5,292,988 5,423,981 Accumulated losses (50,701,890) (49,531,652) Total Equity 17,701,009 19,002,240
Gain (loss) for the year (1,170,238) (1,967,111) Other comprehensive income / (loss) for the year ‐ ‐ Total comprehensive income / (loss) for the year (1,170,238) (1,967,111)
There were no commitments, contingent liabilities or contingent assets at the parent level at 30 June 2017.
6.4 Subsidiaries
The consolidated financial statements incorporate the assets, liabilities and results of the following principal subsidiaries in accordance with the accounting policy described in note 6.1(a).
Country of incorporation Ownership interest
Ownership interest
2017 2016 Botswana Energy Solutions Limited British Virgin Is. 100% 100% Mmamantswe Coal (Pty) Ltd* Botswana 100% 100% African Energy Holdings SRL 2 Barbados 100% 100% Phokoje Power (Pty) Ltd Botswana 100% 100% AFR Australia Pty Ltd Australia 100% 100%
*Mmamantswe Coal (Pty) Ltd subject to conditional sale agreement to TM Consulting.
7. Related parties
7.1 Key Management Personnel
US$500,755 (2016: US$657,074) was paid to Directors of the Company during the year. Of this amount US$613,580 (2016: US$600,077) was paid in cash with the balance paid in equity instruments. Disclosures relating to key management personnel are set out in the Remuneration Report.
7.2 Cash Bonus
Sese Power Project Directors are entitled to a cash bonus (as shown below) upon the achievement of certain hurdles regarding the Sese Power Project.
For
per
sona
l use
onl
y

40 africanenergyresources.com
African Energy Resources Limited Financial Report 30 June 2017 Notes to the Consolidated Financial Statements (continued)
35 | P a g e
Charles Tabeart US$130,725 Alasdair Cooke US$130,200 Gregory Fry US$130,200 Philip Clark US$44,625 Valentine Chitalu US$44,625
Hurdle 1: 50% payable at financial close of a 300MW (or greater) power station at Sese, or when FQM have made a formal financial commitment to a 300MW (or greater) power station at Sese. This bonus expires if the hurdle is not met by 30/09/2018. Hurdle 2: 50% payable on the commencement of annuity type cash flows to African Energy from the Sese JV. This bonus expires if Hurdle 1 is not met by 30/09/2018.
Mmamantswe Project The board have resolved to set a bonus pool for Key Management Personnel and Employees of 5% of the total cash proceeds realised from the sale of the Mmamantswe Project, capped at AU$1,000,000. The bonus is payable when the Consolidated Entity receives the cash consideration from the sale of the Mmamantswe Project. The following Key Management Personnel are entitled to a percentage of the total bonus pool as follows:
Frazer Tabeart 25% Alasdair Cooke 10% Gregory Fry 10%
7.3 Other related party transactions
The terms and conditions of the transactions with Directors, key executives and associates and their related entities were no more favourable than those available, or which might reasonably be expected to be available, on similar transactions to non‐Director related entities on an arm’s length basis. Charges from Charges to
2017 2016 2017 2016 US$ US$ US$ US$ Mitchell River Group Pty Ltd 111,668 190,066 ‐ ‐ Anova Metals Limited ‐ 2,383 ‐ 5,823 EVE Investments Limited ‐ ‐ 40,611 34,771
7.4 New issue of Performance Rights
On 19 December 2016 the Company granted 1,266,666 performance rights to Directors as follows. Alasdair Cooke 166,666 Charles Tabeart 666,667 Gregory Fry 333,333 Phil Clark 100,000
Performance Rights awarded to Mr Cooke, Dr Tabeart and Mr Fry vest upon the formal execution by the Company of a Power Purchase Agreement for the full output of a 300MW Integrated Power project at Sese with an execution date from 1 October 2017 to 31 December 2019. Performance Rights awarded to Mr Clark shall vest upon completion of a bankable feasibility study on the Sese Coal Project with an effective completion date from 1 October 2017 to 31 December 2019.
Shareholder approval date 22 November 2016 22 November 2016 Number 1,166,666 100,000 Price on Issue Date A$0.039 A$0.039 Likelihood of hurdle being met (See note 1.6) more likely than less likely more likely than less likely Expiry = 30 September 2019 30‐Sep‐19 30‐Sep‐19 Fair Value (market price on the date of issue) A$0.039 A$0.039 Total value US$34,580 US$2,964 Expensed in Period US$3,338 Nil
Notes to the Consolidated Financial Statements (continued)
For
per
sona
l use
onl
y

AfricanEnergy Annual Report 2017 41
African Energy Resources Limited Financial Report 30 June 2017 Notes to the Consolidated Financial Statements (continued)
36 | P a g e
7.5 New issue of Options
On 19 December, the Company granted 7,125,000 options exercisable at 6c to Directors. Options shall vest upon an irrevocable commitment to a power purchase agreement at Mmamabula West.
Alasdair Cooke 1,750,000 Charles Tabeart 2,500,000 Gregory Fry 875,000 Philip Clark 500,000 Valentine Chitalu 500,000 Vincent Masterton‐Hume 500,000 Wayne Trumble 500,000
Options were valued using binomial option pricing model using the following inputs. Shareholder approval date 22 November 2016 Number 10,875,000 Price on Issue Date A$0.039 Strike Price: A$0.06 Likelihood of hurdle being met (See note 1.6) less likely than more likely Expiry = 30 September 2019 30‐Sep‐19 Volatility 80% Fair Value AU$0.0146 per option Total value US$120,740 Expensed in Period Nil
7.6 Assets and liabilities at 30 June arising from transactions with related parties
2017 2016 US$ US$
Trade and other receivables 16,571 26,377 Trade and other payables 2,962 15,799
7.7 Share based payments
(a) Performance Rights
The Company has granted performance rights to Directors and employees are as follows: Fair Value of performance rights is equal to the market price on the date of issue
Issue Date Expiry Date Vesting hurdle*
Unvested at 1 July 2016
Issued in Year
Vested in Year
Forfeited in Year
Unvested at 30 June 2017 Fair Value
01‐Oct‐12 30‐Sep‐17 BFS 100,000 ‐ ‐ ‐ 100,000 ‐ 01‐Oct‐12 30‐Sep‐17 COAL 1,166,666 ‐ ‐ ‐ 1,166,666 ‐ 01‐Oct‐12 30‐Sep‐17 GEO 300,000 ‐ ‐ ‐ 300,000 ‐ 01‐Oct‐12 30‐Sep‐17 PPA 1,166,667 ‐ ‐ ‐ 1,166,667 156,447 24‐Oct‐13 23‐Oct‐18 PPA 833,333 ‐ ‐ ‐ 833,333 63,856 24‐Oct‐13 23‐Oct‐18 PQ 833,333 ‐ ‐ ‐ 833,333 63,856 28‐Nov‐14 27‐Nov‐19 FC 4,500,000 ‐ ‐ ‐ 4,500,000 199,996 28‐Nov‐14 27‐Nov‐19 PPA 666,667 ‐ ‐ ‐ 666,667 29,629 28‐Nov‐14 27‐Nov‐19 PPAZ 300,000 ‐ ‐ ‐ 300,000 13,333 31‐Mar‐15 30‐Mar‐20 MMA2 500,000 ‐ ‐ ‐ 500,000 ‐ 04‐May‐15 03‐May‐20 T4 400,000 ‐ 300,000 100,000 ‐ ‐ 22‐Nov‐16 31‐Dec‐19 PPA2 ‐ 1,166,667 ‐ ‐ 1,166,667 34,865 22‐Nov‐16 31‐Dec‐19 BFS2 ‐ 100,000 ‐ ‐ 100,000 2,988
10,766,666 1,266,667 300,000 100,000 11,633,333 564,970
(i) The share price at 19 November 2016 was A$0.039.
For
per
sona
l use
onl
y

42 africanenergyresources.com
African Energy Resources Limited Financial Report 30 June 2017 Notes to the Consolidated Financial Statements (continued)
37 | P a g e
* Vesting hurdle Likelihood of hurdle being met (See note 1.6)
T4 continued service until 1 July 2016 Vested in year PPA Formal execution of a 300MW Sese PPA or when FQM have made
a formal financial commitment to a 300MW power station at Sese less likely than more likely
PPAZ Formal execution of a PPA between the Sese JV company and ZESCO for the full output of a 300MW IPP at Sese
more likely than less likely
COAL Cumulative export coal sales from any AFR coal project exceeding 100,000t
less likely than more likely
PQ Formal pre‐qualification of the joint bid for the 300MW tender, or the commencement of direct negotiations with the Government of Botswana for a 300MW project, or when FQM have made a formal financial commitment to a 300MW power station at Sese
more likely than less likely
BFS successful completion of a bankable feasibility study on Sese Coal Project or when FQM have made a formal financial commitment to a 300MW power station at Sese
less likely than more likely
GEO 100% upon sign off of Mining Reserve or when FQM have made a formal financial commitment to a 300MW power station at Sese
less likely than more likely
FC Financial close of a 300MW power station whereby all conditions are satisfied by all parties and all agreements are executed, or when FQM have made a formal financial commitment to a 300MW power station at Sese
more likely than less likely
MMA2 unconditional completion of binding SSA or successful award of SA IPP tender to Mmamantswe
less likely than more likely
PPA2 Formal execution of a 300MW Sese PPA or when FQM have made a formal financial commitment to a 300MW power station at Sese from 1 October 2017 to 31 December 2019
more likely than less likely
BFS2 successful completion of a bankable feasibility study on Sese Coal Project or when FQM have made a formal financial commitment to a 300MW power station at Sese from 1 October 2017 to 31 December 2019
more likely than less likely
(b) Options
As at 30 June 2017 the group had the following options on issue.
Number of Options
First Quantum Minerals (10c strike expiring Nov 2017) 13,800,000
Directors and Staff Options (6c strike expiring Sep 2019) 10,875,000
24,675,000 (c) Shares
The Company issued 300,000 shares (2016: 1,833,333) to Directors and employees during the year as follows.
Shares issued to Directors and Staff Date Shares Conversion of performance rights that vested upon continued service 1/07/2016 300,000 Issued in year ended 30 June 2017 300,000 Conversion of performance rights 1/07/2015 1,166,666 Shares in lieu of salary 1/07/2015 166,667 Conversion of performance rights 2/02/2016 500,000 Issued in year ended 30 June 2016 1,833,333
Performance rights are valued at face value of the share on the date of issue and expensed of the expected life of the right and taking into account the likelihood of hurdle being met.
Notes to the Consolidated Financial Statements (continued)
For
per
sona
l use
onl
y
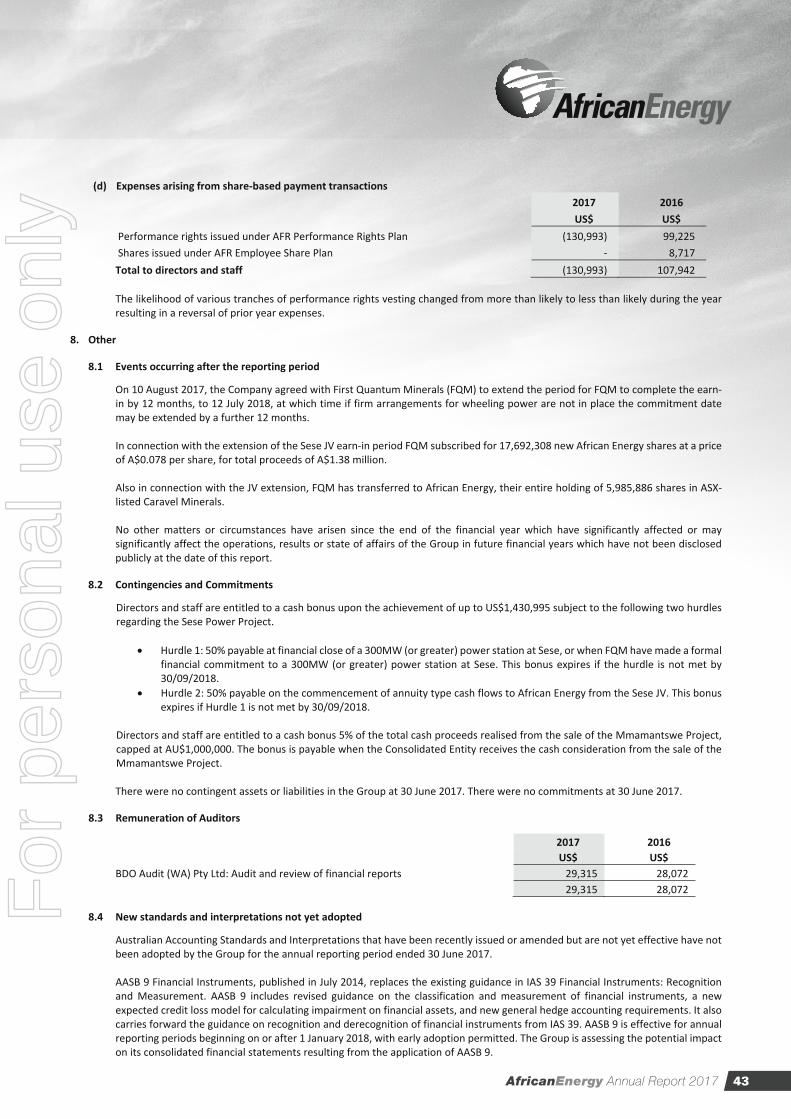
AfricanEnergy Annual Report 2017 43
African Energy Resources Limited Financial Report 30 June 2017 Notes to the Consolidated Financial Statements (continued)
38 | P a g e
(d) Expenses arising from share‐based payment transactions
2017 2016
US$ US$ Performance rights issued under AFR Performance Rights Plan (130,993) 99,225 Shares issued under AFR Employee Share Plan ‐ 8,717 Total to directors and staff (130,993) 107,942 The likelihood of various tranches of performance rights vesting changed from more than likely to less than likely during the year resulting in a reversal of prior year expenses.
8. Other
8.1 Events occurring after the reporting period
On 10 August 2017, the Company agreed with First Quantum Minerals (FQM) to extend the period for FQM to complete the earn‐in by 12 months, to 12 July 2018, at which time if firm arrangements for wheeling power are not in place the commitment date may be extended by a further 12 months. In connection with the extension of the Sese JV earn‐in period FQM subscribed for 17,692,308 new African Energy shares at a price of A$0.078 per share, for total proceeds of A$1.38 million. Also in connection with the JV extension, FQM has transferred to African Energy, their entire holding of 5,985,886 shares in ASX‐listed Caravel Minerals. No other matters or circumstances have arisen since the end of the financial year which have significantly affected or may significantly affect the operations, results or state of affairs of the Group in future financial years which have not been disclosed publicly at the date of this report.
8.2 Contingencies and Commitments
Directors and staff are entitled to a cash bonus upon the achievement of up to US$1,430,995 subject to the following two hurdles regarding the Sese Power Project.
Hurdle 1: 50% payable at financial close of a 300MW (or greater) power station at Sese, or when FQM have made a formal
financial commitment to a 300MW (or greater) power station at Sese. This bonus expires if the hurdle is not met by 30/09/2018.
Hurdle 2: 50% payable on the commencement of annuity type cash flows to African Energy from the Sese JV. This bonus expires if Hurdle 1 is not met by 30/09/2018.
Directors and staff are entitled to a cash bonus 5% of the total cash proceeds realised from the sale of the Mmamantswe Project, capped at AU$1,000,000. The bonus is payable when the Consolidated Entity receives the cash consideration from the sale of the Mmamantswe Project. There were no contingent assets or liabilities in the Group at 30 June 2017. There were no commitments at 30 June 2017.
8.3 Remuneration of Auditors
2017 2016 US$ US$
BDO Audit (WA) Pty Ltd: Audit and review of financial reports 29,315 28,072 29,315 28,072
8.4 New standards and interpretations not yet adopted
Australian Accounting Standards and Interpretations that have been recently issued or amended but are not yet effective have not been adopted by the Group for the annual reporting period ended 30 June 2017. AASB 9 Financial Instruments, published in July 2014, replaces the existing guidance in IAS 39 Financial Instruments: Recognition and Measurement. AASB 9 includes revised guidance on the classification and measurement of financial instruments, a new expected credit loss model for calculating impairment on financial assets, and new general hedge accounting requirements. It also carries forward the guidance on recognition and derecognition of financial instruments from IAS 39. AASB 9 is effective for annual reporting periods beginning on or after 1 January 2018, with early adoption permitted. The Group is assessing the potential impact on its consolidated financial statements resulting from the application of AASB 9.
For
per
sona
l use
onl
y

44 africanenergyresources.com
African Energy Resources Limited Financial Report 30 June 2017 Notes to the Consolidated Financial Statements (continued)
39 | P a g e
AASB 15 Revenue from Contracts with Customers establishes a comprehensive framework for determining whether, how much, and when revenue is recognised. It replaces existing revenue recognition guidance, including IAS 18 Revenue, IAS 11 Construction contracts, and IFRIC 13 Customer Loyalty Programmes. AASB 15 is effective for annual reporting periods beginning on or after 1 January 2018, with early adoption permitted. The Group is assessing the potential impact on its consolidated financial statements resulting from the application of AASB 15. AASB 16 Leases removes the classification of leases as either operating or finance leases – for the lessee – effectively treating all leases as finance leases. Short term leases (less than 12 months) and leases of low value assets are exempt from the lease accounting requirements. Furthermore, there are changes in accounting over the life of the lease as a front‐loaded pattern of expense will be recognised for most leases, even when a constant annual rental is paid. Lessor accounting remains similar to current practice. African Energy Resources has not yet determined the extent of the impact of this standard.
Notes to the Consolidated Financial Statements (continued)
For
per
sona
l use
onl
y

AfricanEnergy Annual Report 2017 45
Incorporation and General Information African Energy Resources Limited was incorporated in Guernsey and is subject to Guernsey law. In Australia, the Company is registered as a foreign company under the Australian Corporations Act (ARBN 123 316 781). It is not subject to Chapter 6 of the Australian Corporations Act dealing with the acquisition of shares (including substantial shareholdings and takeovers). However, the Company has inserted into its Articles of Association (“Articles”) some restrictions on the ability to acquire shares in the Company. These sections of the Articles reflect the restrictions on acquisitions of shares contained in Parts 6.1 and 6.2 of the Australian Corporations Act. The Company has undertaken to comply with the Listing Rules of the ASX. Guernsey law does not impose any limitation on the acquisition of securities in the Company.
Exchange Listings
African Energy Resources Limited shares are listed on the Australian Securities Exchange (ASX) and Botswana Stock Exchange (BSE). The Company’s ASX and BSE code is AFR.
Substantial Holders
As notified to the Company as at 9 October 2017
Name Number Of Shares Held %IC
Sentient Executive GP IV Limited 141,404,786 22.56% First Quantum Minerals (Australia) Pty Limited 86,692,308 13.83% Mr Alasdair Campbell Cooke (and associated entities) 50,003,683 7.98%
Class of shares and voting rights
At 9 October 2017, there were 2,810 holders of 626,689,024 ordinary fully paid shares of the Company. The voting rights attaching to the ordinary shares are in accordance with the Company’s Memorandum & Articles of Association being that:
a. each shareholder entitled to vote may vote in person or by proxy, attorney or Representative;
b. on a show of hands, every person present who is a shareholder or a proxy, attorney or representative of a shareholder has one vote; and
c. on a poll, every person present who is a shareholder or a proxy, attorney or Representative of a shareholder shall, in respect of each fully paid Share held by him, or in respect of which he is appointed a proxy, attorney or Representative, have one vote for the Share, but in respect of partly paid Shares, shall, have such number of votes as bears the proportion which the paid amount (not credited) is of the total amounts paid and payable (excluding amounts credited).”
Distribution of Shareholders
Range Securities % No. of holders %
100,001 and Over 586,074,719 93.52 408 14.52 10,001 to 100,000 35,467,782 5.66 937 33.35 5,001 to 10,000 3,150,063 0.50 405 14.41 1,001 to 5,000 1,881,364 0.30 612 21.78 1 to 1,000 115,096 0.02 448 15.94 Total 626,689,024 100.00 2,810 100.00 Unmarketable Parcels 5,505,118 0.88 1,499 53.54
Additional Shareholder Information
For
per
sona
l use
onl
y

46 africanenergyresources.com
Unquoted Equity Securities
Number of securities on issue
Exercise Price Expiry Date Number of
Holders Names of Holders Holding More
Than 20% Number Held
Unlisted Options 13,800,000
AU$0.10 27‐Nov‐2017 1 First Quantum Minerals (Australia) Pty Limited
100%
10,875,000 AU$0.06 13 Frazer Tabeart 23% Performance Rights
11,633,333 nil various 12 Frazer Tabeart 22%
Largest 20 shareholders at 9 October 2017
Rank Name Number Of Shares Held %IC
1 Sentient Executive GP IV Limited 141,404,786 22.56% 2 First Quantum Minerals (Australia) Pty Limited 86,692,308 13.83% 3 Mr Alasdair Campbell Cooke (and associated entities) 50,003,683 7.98% 4 PS Consulting Pty Ltd 22,000,000 3.51% 5 Mr Stacey Radford 19,237,334 3.07% 6 Mr David George Metford 12,338,585 1.97% 7 CS Third Nominees Pty Limited 7,312,500 1.17% 8 Mr Donal Paul Windrim 6,871,914 1.10% 9 Mr Gregory William Fry (and associated entities) 5,869,610 0.94% 10 General Advisory Pty Ltd 5,645,926 0.90% 11 Mr Henry John Deburgh & Mrs Elizabeth Margaret Deburgh 5,489,685 0.88% 12 Mr Brian Henry Mccubbing & Mrs Adriana Maria Mccubbing 5,000,000 0.80% 13 Helmet Nominees Pty Ltd 5,000,000 0.80% 14 Charles Frazer Tabeart (and associated entities) 4,774,100 0.76% 15 Raejan Pty Ltd 4,700,000 0.75% 16 Aurora Uranium Limited 4,551,797 0.73% 17 ZW2 Pty Ltd 4,500,000 0.72% 18 Mr Robert Campbell Cooke & Mrs Elizabeth Minna Cooke 4,500,000 0.72% 19 Jolib Pty Ltd 4,435,625 0.71% 20 Mr Vincent Ian Masterton‐Hume (and associated entities) 4,157,606 0.66%
Total Top 20 404,485,459 64.54%
Other information
There is no current on‐market buyback of the Company’s securities and the Company does not have any securities on that issue that are subject to escrow restriction.
Additional Shareholder Information (continued)
For
per
sona
l use
onl
y

For
per
sona
l use
onl
y

2015 A
nn
ua
l Re
po
rt
African Energy A
nnual Report 2017
PERTH OFFICE Suite 1, 245 Churchill Avenue, Subiaco WA 6008 | PO Box 162, Subiaco WA 6904 Tel: +61 8 6465 5500 | Fax: +61 8 6465 5599 | Email: [email protected]
African Energy Resources Limited ARBN 123 316 781
africanenergyresources.com
For
per
sona
l use
onl
y


