Focus Minerals Limited ACN 005 470 799 | ABN 56 005 470 799 | ASX: FML Level 2, 159 Adelaide Terrace, East Perth WA 6004 | PO Box 3233, East Perth WA 6892 T +61 (0) 8 9215 7888 | F +61 (0) 8 9215 7889 | E [email protected]| W focusminerals.com.au Page 1 of 45 Market Announcement 22 September 2020 Outstanding Coolgardie 2020 PFS Results Highlights: • 6 years, mostly open pit production for average 63,000oz per year • NPV7.5% : A$183m (gold price assumption: A$2,200/oz) • Maximum drawdown: A$48m (incl. $24m for mill refurbishment and $4m for tailings lift) • Internal Rate of Return: 71% • Additional deposits under review to potentially extend the LOM • JORC 2012 Total Proved & Probable Ore Reserves at 6.64Mt @ 1.97g/t: Classification Tonnage (Mt) Au Grade (g/t) Au Contained Oz Proved Reserve 1.48 1.37 65,500 Probable Reserve 5.16 2.15 356,500 Total Ore Reserve 6.64 1.97 422,000 West Australian gold explorer Focus Minerals Ltd. (ASX: FML) (Focus or the Company) is pleased to announce results of the Coolgardie Pre-Feasibility Study (PFS) refresh and Ore Reserve upgrade. Summary of key PFS results comprises: The Company is actively reviewing additional potentially minable resources to further improve the proposed PFS schedule. Resource updates are scheduled for release by the end of 2020. Commenting on the 2020 Coolgardie PFS update, Focus Minerals’ CEO, Mr Zhaoya Wang, said: “The 2020 Coolgardie PFS Refresh indicates opportunity to develop a robust production schedule with further upside. Our technical team is continuing to develop additional potentially mineable resources that can improve the economic case for a resumption of mining in Coolgardie.” PFS Resource Production months Recovered Gold (Koz) Diluted Grade (g/t) Total Cost per Ounce (A$) Greenfields Open Pit 31 80 1.34 1,534 Brilliant Open Pit 60 171 1.58 1,715 Bonnie Vale Underground 49 139 5.26 791 Total PFS Schedule 74 390 1.97 1,282 For personal use only
Transcript
Focus Minerals Limited
ACN 005 470 799 | ABN 56 005 470 799 | ASX: FML
Level 2, 159 Adelaide Terrace, East Perth WA 6004 | PO Box 3233, East Perth WA 6892
T +61 (0) 8 9215 7888 | F +61 (0) 8 9215 7889 | E [email protected] | W focusminerals.com.au Page 1 of 45
Market Announcement
22 September 2020
Outstanding Coolgardie 2020 PFS Results
Highlights:
• 6 years, mostly open pit production for average 63,000oz per year
• Maximum drawdown: A$48m (incl. $24m for mill refurbishment and $4m
for tailings lift)
• Internal Rate of Return: 71%
• Additional deposits under review to potentially extend the LOM
• JORC 2012 Total Proved & Probable Ore Reserves at 6.64Mt @ 1.97g/t:
Classification Tonnage (Mt) Au Grade (g/t) Au Contained Oz
Proved Reserve 1.48 1.37 65,500
Probable Reserve 5.16 2.15 356,500
Total Ore Reserve 6.64 1.97 422,000
West Australian gold explorer Focus Minerals Ltd. (ASX: FML) (Focus or the Company) is pleased to
announce results of the Coolgardie Pre-Feasibility Study (PFS) refresh and Ore Reserve upgrade.
Summary of key PFS results comprises:
The Company is actively reviewing additional potentially minable resources to further improve the
proposed PFS schedule. Resource updates are scheduled for release by the end of 2020.
Commenting on the 2020 Coolgardie PFS update, Focus Minerals’ CEO, Mr Zhaoya Wang, said:
“The 2020 Coolgardie PFS Refresh indicates opportunity to develop a robust production schedule
with further upside. Our technical team is continuing to develop additional potentially mineable
resources that can improve the economic case for a resumption of mining in Coolgardie.”
PFS Resource Production
months Recovered Gold (Koz)
Diluted Grade (g/t)
Total Cost per Ounce (A$)
Greenfields Open Pit 31 80 1.34 1,534
Brilliant Open Pit 60 171 1.58 1,715
Bonnie Vale Underground 49 139 5.26 791
Total PFS Schedule 74 390 1.97 1,282
For
per
sona
l use
onl
y
Market Announcement | Page 2 of 45
Overview Coolgardie 2020 PFS Resources
Developing a Robust Production Schedule
The Company’s Coolgardie Project hosts recently updated total: Measured, Indicated and Inferred
Mineral Resources comprising 33.7Mt @ 2.2 g/t Au for 2.41Moz. From this resource inventory the
2020 Coolgardie PFS refresh (PFS) was run on 3 deposits with recently updated combined:
Measured, Indicated and inferred resources comprising: 13.5 Mt @ 2.41 g/t Au for 1,043 Moz.
Figure 1: Key Resources included in the 2020 Coolgardie PFS Refresh and resources under review
For
per
sona
l use
onl
y
Market Announcement | Page 3 of 45
The Study has been conducted by independent consultants Mining One Pty Ltd (Trembath, et al.,
2020). Key assumptions informing the 2020 Coolgardie PFS Refresh include:
• Gold price assumption: A$2,200/oz
• Discount rate: 7.5%
• Fuel price after rebates: $0.8/litre
• Electricity: $0.20/kwh
• Processing rate: 1.4Mtpa
• Mill refurbishment CAPEX to 1.4 Mtpa A $24M including 20% contingency (9 Months Build)
• Tails dam third lift CAPEX A $4M
• Conversion of Greenfield open pit to in pit tails facility on completion of mining
• Stockpiling Greenfield open pit ore to ~500Kt prior to commissioning mill
• Only Brilliant South resource contained entirely on tenement M15/646 considered in the PFS
Several potential mine schedules were contemplated in the PFS prior to agreeing to the following key
developments:
• Mill CAPEX begins month 1 and runs for 9 Months – A $24M
• Tails dam third lift CAPEX Months 8/9 – A $4M
• Starter open pit at Greenfields Months 3 – 15 with mill recovered 0.95Mt @ 1.16 g/t for
35.7Koz
• Initial stockpiling of Greenfield ore Months 3 – 9 and start processing month 10
• Greenfield stage 2 open pit Months 15 – 33 with mill recovered 1.11 Mt @ 1.23 g/t for
44.1Koz
• Brilliant open pit Months 15 – 74 with mill recovered 3.72Mt @ 1.42 g/t for 171Koz
• Bonnie Vale underground Capex starts Month 1 and first production starts month 17
• Bonnie Vale top down mining Months 17 – 66 with mill recovered 0.86Mt @ 5.04 g/t for
139Koz
Figure 2: Mill Feed, Stockpiles and recovered ounces
End GF Stage 1/
start Stage 2 and
Brilliant
Start Bonnie
Vale
End GF Stage 2
Finish
Bonnie
Vale
Finish
Brilliant
South Start GF
Stage 1
For
per
sona
l use
onl
y
Market Announcement | Page 4 of 45
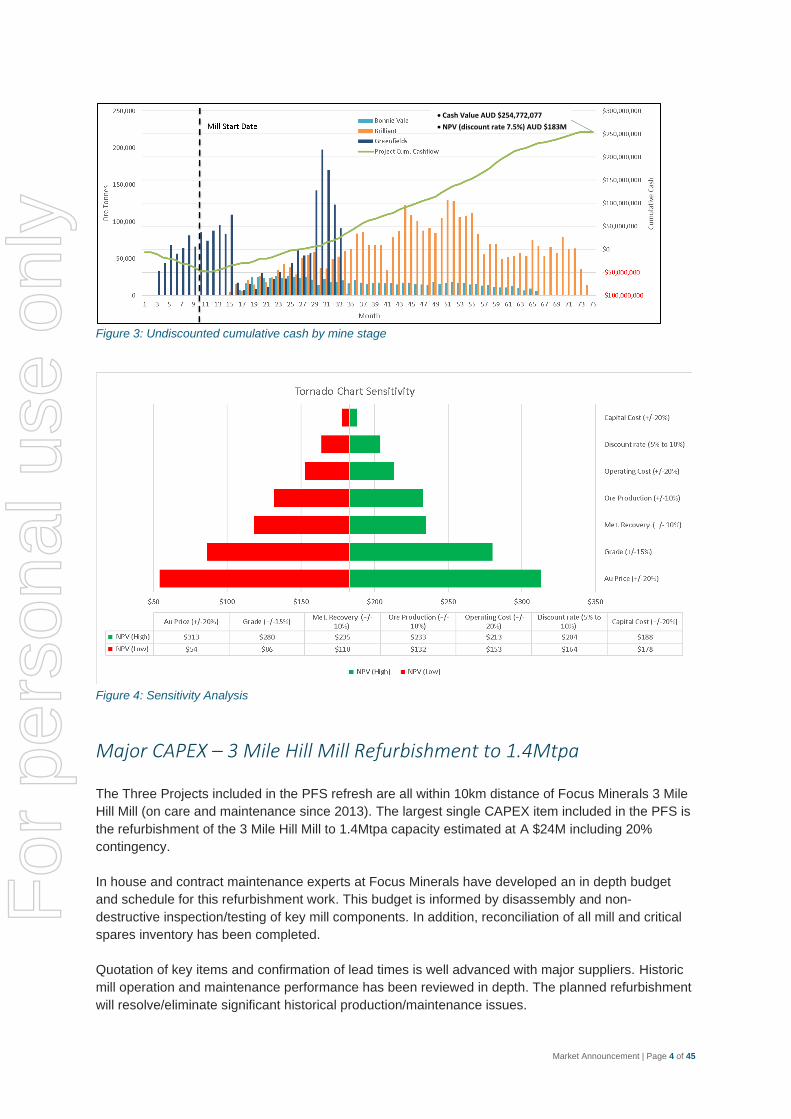
Figure 3: Undiscounted cumulative cash by mine stage
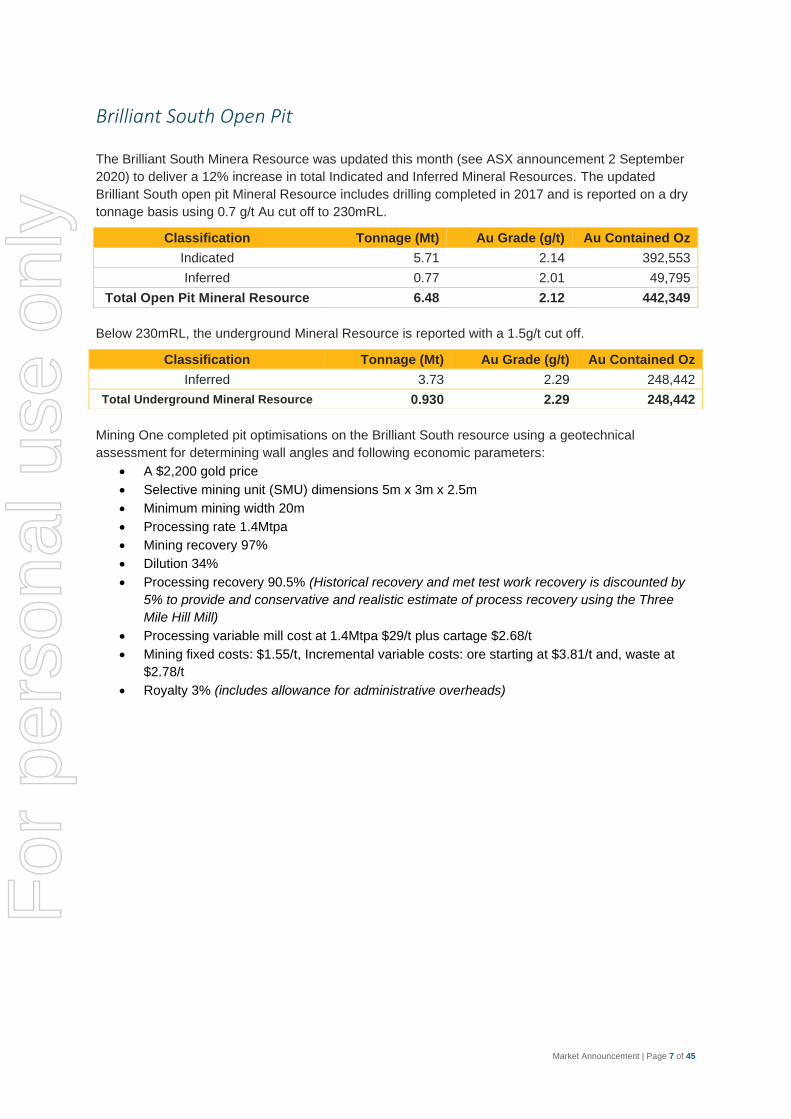
Figure 4: Sensitivity Analysis
Major CAPEX – 3 Mile Hill Mill Refurbishment to 1.4Mtpa
The Three Projects included in the PFS refresh are all within 10km distance of Focus Minerals 3 Mile
Hill Mill (on care and maintenance since 2013). The largest single CAPEX item included in the PFS is
the refurbishment of the 3 Mile Hill Mill to 1.4Mtpa capacity estimated at A $24M including 20%
contingency.
In house and contract maintenance experts at Focus Minerals have developed an in depth budget
and schedule for this refurbishment work. This budget is informed by disassembly and non-
destructive inspection/testing of key mill components. In addition, reconciliation of all mill and critical
spares inventory has been completed.
Quotation of key items and confirmation of lead times is well advanced with major suppliers. Historic
mill operation and maintenance performance has been reviewed in depth. The planned refurbishment
will resolve/eliminate significant historical production/maintenance issues.
• Cash Value AUD $254,772,077
• NPV (discount rate 7.5%) AUD $183M
• Cash Value AUD $254,772,077
• NPV (discount rate 7.5%) AUD $183M
For
per
sona
l use
onl
y
Market Announcement | Page 5 of 45
The refurbished mill will be updated to current standards improving tracking and reporting of mill
performance to deliver 1.4Mtpa production. The mill refurbishment budget/schedule has been
reviewed for accuracy/omissions/feasibility by a major independent mill engineering/construction firm.
Greenfields Open Pit
The Greenfields open pit Mineral Resource was updated two months ago (see ASX announcement 9
July 2020) to deliver a 81% increase in total Measured and Indicated resource to 170m depth using a
0.8 g/t Au cut off. The updated Mineral Resource reported on a dry tonnage basis comprises:
Classification Tonnage (Mt) Au Grade (g/t) Au Contained Oz
Measured 1.15 1.75 64,606
Indicated 1.52 1.53 74,517
Total Mineral Resource 2.66 1.62 139,123
The 2020 PFS schedules two stages of open pit mining at Greenfields open pit. The staged approach
delivers faster ramp up of ore production in the initial starter pit to maximise cash flow and minimise
debt draw down. The follow up second stage of mining cuts back the stage 1 pit to final design
minimise debt draw down. The follow-up second stage of mining cuts back the Stage 1 pit to final
design. The PFS schedule for mining of Greenfields starts in Month 3 and concludes in Month 33. It is
anticipated the final Greenfields open pit will be converted on completion to a tailings storage facility,
pending further groundwater studies.
Mining One completed pit optimisations on the Greenfields resource using a geotechnical assessment
for determining wall angles and following economic parameters:
• A $2,200 gold price
• Selective mining unit (SMU) dimensions 10m x 4m x 2.5m
• Minimum mining width 20m
• Processing rate 1.4Mtpa
• Mining recovery 93%
• Dilution 19%
• Processing recovery 90% (Historical recovery and met test work recovery has been
discounted by 5% to provide and conservative and realistic estimate of process recovery
using the Three Mile Hill Mill)
• Processing variable mill cost at 1.4Mtpa $29/t
• Mining fixed costs: $1.55/t, Incremental variable costs: ore starting at $2.43/t and, waste at
$3.11/t
• Royalty 3% (includes allowance for administrative overheads)
For
per
sona
l use
onl
y
Market Announcement | Page 6 of 45
Figure 5: Plan view PFS 2020 Stage 1 (Magenta) and 2 (Blue) Pit Crests. The 2020 PFS designs essentially leaves the existing east and south east walls as final walls.
Within the final Greenfields pit design SMU’s exceeding 0.46 g/t Au cut off are reported as a mining
diluted Ore Reserve comprising:
Classification Tonnage (Mt) Au Grade (g/t) Au Contained Oz
Proved Reserve 1.48 1.37 65,500
Probable Reserve 0.58 1.24 23,000
Total Ore Reserve 2.06 1.34 89,000
After PFS estimated process recovery of 90% is applied 80Koz gold will be recovered at a cash cost
of 1,534/oz.
For
per
sona
l use
onl
y
Market Announcement | Page 7 of 45
Brilliant South Open Pit
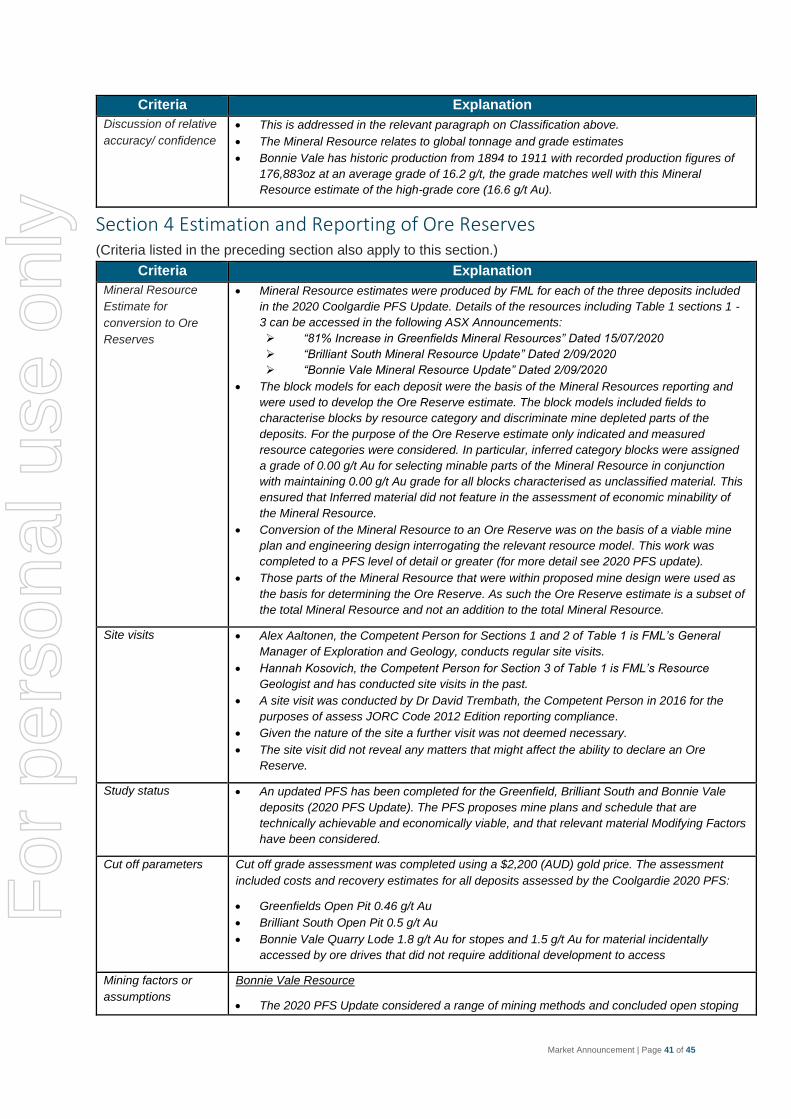
The Brilliant South Minera Resource was updated this month (see ASX announcement 2 September
2020) to deliver a 12% increase in total Indicated and Inferred Mineral Resources. The updated
Brilliant South open pit Mineral Resource includes drilling completed in 2017 and is reported on a dry
tonnage basis using 0.7 g/t Au cut off to 230mRL.
Below 230mRL, the underground Mineral Resource is reported with a 1.5g/t cut off.
Mining One completed pit optimisations on the Brilliant South resource using a geotechnical
assessment for determining wall angles and following economic parameters:
• A $2,200 gold price
• Selective mining unit (SMU) dimensions 5m x 3m x 2.5m
• Minimum mining width 20m
• Processing rate 1.4Mtpa
• Mining recovery 97%
• Dilution 34%
• Processing recovery 90.5% (Historical recovery and met test work recovery is discounted by
5% to provide and conservative and realistic estimate of process recovery using the Three
Mile Hill Mill)
• Processing variable mill cost at 1.4Mtpa $29/t plus cartage $2.68/t
• Mining fixed costs: $1.55/t, Incremental variable costs: ore starting at $3.81/t and, waste at
$2.78/t
• Royalty 3% (includes allowance for administrative overheads)
Classification Tonnage (Mt) Au Grade (g/t) Au Contained Oz
Indicated 5.71 2.14 392,553
Inferred 0.77 2.01 49,795
Total Open Pit Mineral Resource 6.48 2.12 442,349
Classification Tonnage (Mt) Au Grade (g/t) Au Contained Oz
Inferred 3.73 2.29 248,442
Total Underground Mineral Resource 0.930 2.29 248,442
For
per
sona
l use
onl
y
Market Announcement | Page 8 of 45
A large open pit was designed at Brilliant South that will support the PFS schedule between months
15 and 74. The pit is a cut back on the historic Herald Resourced open pit that produced 88,000oz at
an average grade of 2.45 g/t.
Figure 6: Plan view Brilliant South Open Pit design crest
For
per
sona
l use
onl
y
Market Announcement | Page 9 of 45
Within the final Brilliant South pit design SMU’s exceeding 0.5 g/t Au cut off can be reported as a
mining diluted Ore Reserve comprising:
Classification Tonnage (Mt) Au Grade (g/t) Au Contained Oz
Proved Reserve - - -
Probable Reserve 3.72 1.58 188,000
Total Reserve 3.72 1.58 188,000
After PFS estimated process recovery of 90.5% is applied 171Koz gold will be recovered at a cash
cost of 1,715/oz.
Bonnie Vale Quarry Lode Underground
The Bonnie Vale Quarry Lode underground Mineral Resource was updated this month (see ASX
announcement 2 September 2020) to deliver a 6.4% increase in total Indicated and Inferred Mineral
Resources. The updated Mineral Resource reported on a dry tonnage basis using 1.5 g/t cut off
comprises:
Mining One completed mining optimisations on the Quarry Lode resource using parameters updated
as required from the 2017 PFS study. Economic parameters used include:
• A $2,200 gold price
• General technical and admin (C+O) $6.30/t ore
• Ore drive development (25% production) $9.01/t ore
JORC Code, 2012 Edition – Table 1 For the purpose of assessing and reporting compliance with the JORC (2012) code, Table 1 of the of
the JORC code has been compiled and provided below. Further detail regarding the basis of the Ore
Reserve estimates can be found in the 2020 PFS Update and the original 2017 PFS study and
relevant Mineral Resource reports.
Section 1 Sampling Techniques and Data (Criteria in this section apply to all succeeding sections.)
Section 1 Details for the Greenfields deposit reproduced from ASX Announcement “81%
Increase in Greenfields Mineral Resources” Dated 15/07/2020
Criteria Explanation
Sampling techniques • Focus Minerals Ltd (FML) RC samples were sampled on one metre intervals via a
riffle splitter.
• At the assay laboratory, all samples were oven dried, crushed to a nominal 10mm
using a jaw crusher (core samples only) and weighed. Samples in excess of 3kg in
weight were riffle split to achieve a maximum 3kg sample weight before being
pulverized to 90% passing 75μm. The samples were then prepared for fire assay.
• Historic RC holes have been sampled on 1m or as a 2m composite. It is unsure how
the composite sampling for pre-Focus drilling would have been undertaken.
• For diamond core, sample intervals are either cut on metre intervals or with intervals
selected to geological boundaries down to 10cm. Core is cut in half by diamond
bladed saw with half sent to the laboratory and half retained in the core tray on site.
Some of the diamond core has been ¼ core sampled, this is only in the minority of
cases.
Drilling techniques • Drilling included in the Mineral Resource estimate include RC face sampling hammer
or NQ size diamond core. All FML drill core was orientated by the drilling contractor
using an Ezy-mark system. Most holes were surveyed upon completion of the drilling
have either been surveyed by single-shot camera, electronic multi-shot (EMS) or
Gyroscopic methods.
Drill sample recovery • In recent FML drilling all RC samples are drilled dry wherever possible to maximize
recovery, with water injected on the outside return to minimize dust. There have been
no recovery or sample quality issues for the FML drilling RC chips or drill core.
• Sample recovery have been recorded in the drill hole logs for the diamond holes
drilled by CGNL with no recovery issues. Historic RC drilling recovery is not
recorded.
Logging • FML drill holes were logged for the entire length of the hole.
• All diamond core samples were orientated, marked into metre intervals and
compared to the depth measurements on the core blocks. Any core loss was noted
and recorded in the database. All core was logged for structure and geology using
the same system as RC. The core was photographed wet and dry one tray at a time
using a standardised photography jig.
• All RC samples were geologically logged to record weathering, regolith, rock type,
colour, alteration, mineralisation, structure and texture and any other notable features
that are present.
• Logging was qualitative; however, the geologists often record quantitative mineral
percentage ranges.
• Original drill logs have been viewed and used to validate data stored in acQuire for a
majority of the pre-Focus drilling.
Sub-sampling techniques
and sample preparation
• FML diamond core samples were taken from half core or quarter core cut using an
Almonte automatic core saw. The remainder of the core was retained in core trays.
• RC samples were cone split to a nominal 2.5kg to 3kg sample weight. The drilling
method was designed to maximise sample recovery and delivery of a clean,
representative sample into the calico bag.
For
per
sona
l use
onl
y
Market Announcement | Page 14 of 45
Criteria Explanation
• The samples were collected in a pre-numbered calico bag bearing a unique sample
ID. Samples were crushed to 75μm at the laboratory and riffle split (if required) to a
maximum 3kg sample weight.
• Analytical methods for gold analysis for much of the historical drilling are 40g Fire
Assay method and 50g Aqua Regia completed at various laboratories in Kalgoorlie
and Perth. FML samples have been assayed by ALS Chemex in Kalgoorlie or Perth
using a 30g Fire Assay method with an AAS finish.
• The assay laboratories’ sample preparation procedures follow industry best practice,
with techniques and practices that are appropriate for this style of mineralisation. Pulp
duplicates were taken at the pulverising stage and selective repeats conducted at the
laboratories’ discretion.
• Drilling completed by Focus is subject to rigorous quality control processes in the
sampling process. Routine standards and “blanks” are inserted into the sample
strings and monitored on return from the laboratory. Any failures by these control
samples to be within the acceptable three standard deviation limits above and below
the certified values results in a string of samples around the failed sample to be re-
tested by the laboratory.
• Regular reviews of the sampling were carried out by the supervising geologist and
senior field staff, to ensure all procedures were followed and best industry practice
carried out.
• The sample sizes were considered to be appropriate for the type, style and
consistency of mineralisation encountered during this phase of exploration.
Quality of assay data
and laboratory tests
• The assay method and laboratory procedures were appropriate for this style of
mineralisation. The fire assay technique was designed to measure total gold in the
sample.
• No geophysical tools, spectrometers or handheld XRF instruments were used.
• The QA/QC process described above was sufficient to establish acceptable levels of
accuracy and precision. All results from assay standards and duplicates were
scrutinised to ensure they fell within acceptable tolerances.
• Very little in the way of quality control data is available from sampling of the historical
drilling that currently defines the resource. Drilling by Focus aimed to confirm the
geometry of the ore envelope and grade tenor encountered in historical drilling.
Verification of sampling
and assaying
• Significant intervals were visually inspected by company geologists to correlate assay
results to logged mineralisation.
• Primary data is sent in digital format to the company’s Database Administrator (DBA)
as often as was practicable. The DBA imports the data into an acQuire database,
with assay results merged into the database upon receipt from the laboratory. Once
loaded, data was extracted for verification by the geologist in charge of the project.
• Historic holes were validated against paper copies and WAMEX reports where
possible.
• No adjustments were made to any current or historic data. If data could not be
validated to a reasonable level of certainty it was not used in any resource
estimations.
Location of data points • All co-ordinates and bearings use the MGA94 Zone 51 grid system.
• FML drill collars were surveyed by DGPS base station instruments.
• Most of the RC and diamond holes have down hole surveys by
either Eastmann single shot camera, Electronic Multi-shot or Gyroscopic methods.
• Historic hole collar survey methods are unknown although Gold Mines Coolgardie JV
states collars were surveyed by Company Survey.
Data spacing and
distribution
• Drilling has been conducted on 20m by 10 – 15m spaced grid on sections orientated
across strike of the ore zone at an azimuth of either 020º or 200 º and at various
dips.
• After mining commenced FML conducted RC Grade control drilling on a 10m x 10m
staggered grid at different pit floor levels across the mineralisation, averaging 40m
depth. Wider spaced drilling exists at depth up to as wide as 40m by 80m.
For
per
sona
l use
onl
y
Market Announcement | Page 15 of 45
Criteria Explanation
Orientation of data in
relation to geological
structure
• Drilling was designed based on known geological models, field mapping, verified
historical data and cross-sectional interpretation.
• Drill holes were orientated at right angles to the strike of the deposit, with dip
optimised for drill capabilities and dip of the mineralisation.
Sample security • All samples were reconciled against the sample submission with any omissions or
variations reported to FML.
• Historic sample security is not recorded.
Audits or review • Significant data validation was completed by consultants Hellmann and Schofield
who completed a resource estimate in 2005.
Section 1 Details for the Brilliant South deposit reproduced from ASX Announcement “Brilliant
South Mineral Resource Update” Dated 2/09/2020
Criteria Explanation
Sampling techniques • This report relates to results from Reverse Circulation (RC) drilling and diamond core
drilling. The information of sampling techniques below applies to the drill holes drilled
by Focus Minerals (FML) only.
• RC percussion drill chips were collected through a cyclone and cone splitter.
Samples were collected on a 1m basis. Diamond core was sampled across identified
zones of mineralisation by site geologists, the sample widths varied between a
minimum of 0.2m and a maximum of 1m.
• RC chips were passed through a cone splitter to achieve a sample weight of
approximately 3kg. The splitter was levelled at the beginning of each hole using a
bullseye level. The spoils were collected in green bags at 1m intervals.
• 4m composite samples were taken by spear sampling the green spoils bag. Where
results returned greater than 0.2g/t Au, the 1m samples were submitted.
• At the assay laboratory all samples were oven dried, crushed to a nominal 10mm
using a jaw crusher (core samples only) and weighed. Samples in excess of 3kg in
weight were riffle split to achieve a maximum 3kg sample weight before being
pulverized to 90% passing 75μm.
• The diamond core was marked up for sampling by the supervising geologist during
the core logging process, with sample intervals determined by the presence of
mineralisation and/or alteration. The core was cut in half using an Almonte automatic
core saw.
• Goldfan collected 2kg samples as either 4m composites or as 1m samples through
mineralised ground or interesting geology. Samples were run through a cyclone.
Where the 4m composite samples returned greater than 0.2g/t Au, 1m samples were
submitted. Diamond core was sampled according to lithological boundaries.
Mineralised zones were half diamond sawn in intervals generally not exceeding 1m.
• MPI collected drill cuttings at one metre intervals which were passed through a trailer
mounted cyclone and stand-alone riffle splitter to provide a 4-6kg split sample and a
bulk residue for logging. All samples were dry. Initially samples were spear-sampled
to form up to 5m composites and submitted for analysis. Any results above 0.5g/t Au
resulted in the 1m samples then being submitted.
Drilling techniques • All FML drilling was completed using an RC face sampling hammer or NQ2/HQ3 size
diamond core. Where achievable, all drill core was oriented by the drilling contractor
using an Ezy-mark system. Most holes were surveyed upon completion of drilling
initially using an electronic multi-shot (EMS) camera and since Sept 2013 a north-
seeking gyroscope; holes were surveyed open-hole prior to 2017. Since late 2016, all
holes were surveyed using various gyroscopes (non-north-seeking paired with an
azimuth aligner and north-seeking) by the drill contractors whilst drilling.
For
per
sona
l use
onl
y
Market Announcement | Page 16 of 45
Criteria Explanation
• Goldfan used RC face sampling hammer or NQ2 diamond core drilling methods. The
core was not orientated. Holes were downhole surveyed by Eastman single shot
camera and later by Eastman multiple shot camera.
• MPI used RC drilling methods and downhole surveys by Eastman single shot camera.
Drill sample recovery • FML Sample recovery was recorded by a visual estimate during the logging process.
• All RC samples were drilled dry whenever possible to maximize recovery, with water
injection on the outside return to minimise dust.
• Goldfan states a consistent sample recovery in the range of 80-90%
Logging • The information of logging techniques below applies to the drill holes drilled by FML
only. All core samples were oriented, marked into metre intervals and compared to the
depth measurements on the core blocks. Any loss of core was noted and recorded in
the drilling database.
• All RC samples were geologically logged to record weathering, regolith, rock type,
colour, alteration, mineralisation, structure and texture and any other notable features
that are present.
• All diamond core was logged for structure, and geologically logged using the same
system as that for RC.
• The logging information was transferred into the company’s drilling database once the
log was complete.
• Logging was qualitative, however the geologists often recorded quantitative mineral
percentage ranges for the sulphide minerals present.
• Diamond core was photographed one core tray at a time using a standardised
photography jig.
• More recently samples from RC holes were archived in standard 20m plastic chip
trays.
• The entire length of all holes is logged.
• Historic RC holes have been logged at 1m intervals to record weathering, regolith,
rock type, colour, alteration, mineralisation, structure and texture and any other
notable features that are present.
• Goldfan logged diamond core to lithological boundaries, core was photographed.
Sub-sampling techniques
and sample preparation
• The information of sub-sampling and sample preparation below applies to the drill
holes drilled by FML only.
• Core samples were taken from half core, cut using an Almonte automatic core saw.
The remainder of the core was retained in core trays tagged with a hole number and
metre mark.
• RC samples were cone split to a nominal 2.5kg to 3kg sample weight. The drilling
method was designed to maximise sample recovery and delivery of a clean,
representative sample into the calico bag.
• Where possible all RC samples were drilled dry to maximise recovery. The use of a
booster and auxiliary compressor provide dry sample for depths below the water table.
Sample condition was recorded (wet, dry, or damp) at the time of sampling and
recorded in the database.
• The samples were collected in a pre-numbered calico bag bearing a unique sample
ID. Samples were crushed to 75μm at the laboratory and riffle split (if required) to a
maximum 3kg sample weight. Gold analysis was initially by 40g aqua regia for the
composite samples then 40g Fire Assay for individual samples with an ICP-OES or
AAS Finish.
• The assay laboratories’ sample preparation procedures follow industry best practice,
with techniques and practices that are appropriate for this style of mineralisation. Pulp
duplicates were taken at the pulverising stage and selective repeats conducted at the
laboratories’ discretion.
• Earlier FML QAQC checks involved inserting a standard or blank every 10 samples in
RC and taking a field duplicate every 20 samples in RC. Field duplicates were
For
per
sona
l use
onl
y
Market Announcement | Page 17 of 45
Criteria Explanation
collected from the cone splitter on the rig. Diamond core field duplicates were not
taken, a minimum of 1 standard was inserted for every sample batch submitted. In
more recent drilling no blanks were submitted, only standards every 25 samples with a
duplicate taken off the rig every 20th sample.
• Regular reviews of the sampling were carried out by the supervising geologist and
senior field staff, to ensure all procedures were followed and best industry practice
carried out.
• The sample sizes are considered to be appropriate for the type, style and consistency
of mineralisation encountered during this phase of exploration.
• Goldfan originally submitted its samples to Australian Laboratories Group Kalgoorlie.
The 2kg samples were oven dried, then crushed to a nominal 6mm and split once
through a Jones riffle splitter. A 1kg sub-sample was fine pulverised in a Keegor
Pulveriser to a nominal 100 microns. This sample was homogenised and 400-500g
split as the assay pulp for analysis. Assaying was by a classical fire assay on a 50g
charge to a lower detection limit of 0.01 ppm gold.
• Diamond core and later RC drilled by Goldfan was submitted to Minlab Kalgoorlie
where the whole of the sample is pulverised in a ring mill before 300g sample is split
as the assay pulp. Assaying was by fire assay on a 50g charge to a lower detection
limit of 0.01 ppm gold.
• Goldfan conducted inter-laboratory check sampling over approx. 10% of holes over
the whole program with results found to be within acceptable limits.
• Laboratory repeat checks were also run on the assay data.
• MPI submitted their samples to Analabs in Perth for analysis for gold by 50g fire assay
for a 0.01g/t detection limit.
• Laboratory repeat checks were also run, it appears minimum 3 analysis checks run for
most of the drill holes.
Quality of assay data and
laboratory tests
• The assay method and laboratory procedures were appropriate for this style of
mineralisation. The fire assay technique was designed to measure total gold in the
sample.
• No geophysical tools, spectrometers or handheld XRF instruments were used.
• The QA/QC process described above was sufficient to establish acceptable levels of
accuracy and precision. All results from assay standards and duplicates were
scrutinised to ensure they fell within acceptable tolerances.
Verification of sampling
and assaying
• Significant intervals were visually inspected by company geologists to correlate assay
results to logged mineralisation. Consultants were not used for this process.
• Normally if old historic drilling was present, twinned holes are occasionally drilled to
test the veracity of historic assay data; however, no twinned holes were drilled during
this program.
• Primary data is sent in digital format to the company’s Database Administrator (DBA)
as often as was practicable. The DBA imports the data into an acQuire database, with
assay results merged into the database upon receipt from the laboratory. Once
loaded, data was extracted for verification by the geologist in charge of the project.
• No adjustments were made to any current or historic data. If data could not be
validated to a reasonable level of certainty it was not used in any resource
estimations.
Location of data points • FML drill collars were surveyed after completion, using a DGPS instrument. All drill
core was oriented by the drilling contractor using an Ezy-mark system. Most holes
were surveyed upon completion of drilling. Initially an electronic multi-shot camera was
used until Sept 2013 when a north-seeking gyroscope tool was used. Holes were
surveyed open hole prior to 2016. Since late 2016, most drill holes were surveyed
using various gyroscope systems (non-north-seeking gyroscopes paired with azimuth
aligners and north-seeking gyroscopes) by the drillers whilst drilling, otherwise
surveyed open hole using a north-seeking gyroscope. Since the start of 2017,
For
per
sona
l use
onl
y
Market Announcement | Page 18 of 45
Criteria Explanation
gyroscopes were used for “single shot” surveys whilst drilling, otherwise a single shot
Eastman camera downhole survey was used.
• All coordinates and bearings use the MGA94 Zone 51 grid system.
• FML utilises Landgate sourced regional topographic maps and contours as well as
internally produced survey pick-ups produced by the mining survey teams utilising
DGPS base station instruments.
• Goldfan holes were laid out and picked up by the Three Mile Hill Survey Department.
Down hole surveying was conducted by Down Hole Surveys using Eastman multiple
shot cameras.
• MPI collar survey methods are unknown, down hole surveys were by Eastman single
shot camera.
Data spacing and
distribution
• Drill spacing along the Brilliant trend is approximately 20m x 20m through the main
lode horizon, increasing to 20m x 40m and 40m x 40m to the north of 6573000mN.
Orientation of data in
relation to geological
structure
• Drilling was designed based on known geological models, field mapping, verified
historical data and cross-sectional interpretation.
• Drill holes were oriented at right angles to strike of deposit, with dip optimised for drill
capabilities and the dip of the ore body.
Sample security • All samples were reconciled against the sample submission with any omissions or
variations reported to FML.
• All samples were bagged in a tied numbered calico bag, grouped into green plastic
bags. The bags were placed into cages with a sample submission sheet and delivered
directly from site to the Kalgoorlie laboratories by FML personnel on a daily basis.
• Historic sample security is not recorded.
Audits or reviews • A review of sampling techniques was carried out by rOREdata Pty Ltd in late 2013 as
part of a database amalgamation project. Their only recommendation was to change
the QA/QC intervals to bring them into line with the FML Laverton system, which uses
the same frequency of standards and duplicates but has them inserted at different
points within the numbering sequence.
Section 1 Details for the Bonnie Vale Quarry Lode deposit reproduced from ASX Announcement
“Bonnie Vale Mineral Resource Update” Dated 2/09/2020
Criteria Explanation
Sampling techniques • This report relates to results from Reverse Circulation (RC) drilling and diamond core
drilling. The information of sampling techniques below applies to the drill holes drilled by
Focus Minerals (FML) only.
• RC percussion drill chips were collected through a cyclone and cone splitter. Samples were
collected on a 1m basis. Diamond core was sampled across identified zones of
mineralisation by site geologists, the sample widths varied between a minimum of 0.2m and
a maximum of 1m. For the 2004 drill program at Bonnie Vale 4m composite samples were
collected manually using spear sampling of green bags and submitted for assay. Where the
RC composite samples returned an assay value of 0.2g/t Au or greater, the 1m cone-split
samples were then submitted for analysis.
• RC chips were passed through a cone splitter to achieve a sample weight of approximately
3kg. The splitter was levelled at the beginning of each hole using a bullseye level. At the
assay laboratory all samples were oven dried, crushed to a nominal 10mm using a jaw
crusher (core samples only) and weighed. Samples in excess of 3kg in weight were riffle
split to achieve a maximum 3kg sample weight before being pulverized to 90% passing
75μm. The samples were then prepared for fire assay.
• When visible gold was observed in RC chips, this sample was then flagged by the
supervising geologist for the benefit of the laboratory. The diamond core was marked up for
sampling by the supervising geologist during the core logging process, with sample intervals
determined by the presence of mineralisation and/or alteration. The core was cut in half
For
per
sona
l use
onl
y
Market Announcement | Page 19 of 45
Criteria Explanation
using an Almonte automatic core saw, with half-core samples submitted to Kalgoorlie assay
laboratories for fire assay analysis by a 50g fire assay with an ICP-OES or AAS Finish.
• Matador Exploration Pty Ltd (Matador) collected drill cuttings at 1m intervals and passed
through a trailer-mounted cyclone and stand-along riffle splitter to provide a 4-6kg split
sample and bulk residue for logging. 4m composites were taken by spearing the residue and
submitted for assay and where results were returned above 0.2g/t, the 1m riffle split
samples were submitted for analysis.
• Coolgardie Gold NL (CGNL) does not state sampling techniques except commentary that
4m composites were used and resampled when assays returned 0.2g/t Au or greater.
Drilling techniques • All FML drilling was completed using an RC face sampling hammer or NQ2/HQ size
diamond core. Drill core was oriented by the drilling contractor using an Ezy-mark or
electronic system were core conditions allowed. Most holes were surveyed upon completion
of drilling using a north-seeking gyroscope. The holes were surveyed initially open-hole and
in later programs within the rods. Otherwise a single shot Eastman camera downhole survey
was used.
• Matador used RC drilling methods and surveyed the hole using Electronic Multi-Shot (EMS)
system.
• CGNL used RC drilling methods.
Drill sample recovery • FML Sample recovery was recorded by a visual estimate during the logging process.
• All RC samples were drilled dry whenever possible to maximize recovery, with water
injection on the outside return to minimise dust.
• Study of sample recovery versus gold grade does not indicate a bias in the gold grade
caused by any drop in sample recovery.
• Diamond core sample recovery was measured and calculated (core loss) during the logging
process, generally there was excellent recovery.
Logging • The information of logging techniques below applies to the drill holes drilled by FML only. All
core samples were oriented, marked into metre intervals and compared to the depth
measurements on the core blocks. Any loss of core was recorded in the database.
• All RC samples were geologically logged to record weathering, regolith, rock type, colour,
alteration, mineralisation, structure and texture and any other notable features that are
present.
• All diamond core was logged for structure, and geologically logged using the same system
as that for RC.
• The logging information was recorded into acQuire format using a Toughbook notepad and
then transferred into the company’s drilling database once the log was complete.
• Logging was qualitative, however the geologists often recorded quantitative mineral
percentage ranges for the sulphide minerals present.
• Diamond core was photographed wet and dry one core tray at a time using a standardised
photography jig.
• Samples from RC holes were archived in standard 20m plastic chip trays and in later
programs photographed 4 chip trays per photo.
• The entire length of all holes is logged.
• Matador and CGNL logged RC samples at 1m intervals to record weathering, regolith, rock
type, colour, alteration, mineralisation, structure and texture and any other notable features
that are present.
Sub-sampling
techniques and
sample preparation
• The information of sub-sampling and sample preparation below applies to the drill holes
drilled by FML only.
• Core samples were taken from half core, cut using an Almonte automatic core saw. The
remainder of the core was retained in core trays tagged with a hole number and metre mark.
• RC samples were cone split to a nominal 2.5kg to 3kg sample weight. The drilling method
was designed to maximise sample recovery and delivery of a clean, representative sample
into the calico bag.
• Where possible all RC samples were drilled dry to maximise recovery. The use of a booster
For
per
sona
l use
onl
y
Market Announcement | Page 20 of 45
Criteria Explanation
and auxiliary compressor provide dry sample for depths below the water table. Sample
condition was recorded (wet, dry, or damp) at the time of sampling and recorded in the
database.
• The samples were collected in a pre-numbered calico bag bearing a unique sample ID.
Samples were crushed to 75μm at the laboratory and riffle split (if required) to a maximum
3kg sample weight. Gold analysis was determined by a 30g to 50g fire assay with an ICP-
OES or AAS Finish.
• The assay laboratories’ sample preparation procedures follow industry best practice, with
techniques and practices that are appropriate for this style of mineralisation. Pulp duplicates
were taken at the pulverising stage and selective repeats conducted at the laboratories’
discretion.
• Prior to 2016 FML inserted 3 standards and took 5 duplicates for every 100 samples. Field
duplicates were collected from the cone splitter on the rig for RC samples at a frequency of
one duplicate every 20 samples, excluding the 100th sample as this was a standard.
Diamond core field duplicates were not taken. From 2016 FML inserted 1 standard every
25th sample, while the 1 duplicate every 20th sample remained unchanged from previous
years.
• Regular reviews of the sampling were carried out by the supervising geologist and senior
field staff, to ensure all procedures were followed and best industry practice carried out.
• The sample sizes were considered to be appropriate for the type, style and consistency of
mineralisation encountered during this phase of exploration.
• Matador RC samples were drilled dry and cone or riffle split to achieve a 4-6kg sample
weight. Certified standards were inserted every 20 samples. At the laboratory either a blank
or a certified standard were inserted every 20 samples and a duplicate was taken every 10
samples.
• CGNL sub-sampling and sample preparation is unknown.
Quality of assay data
and laboratory tests
• The assay method and laboratory procedures were appropriate for this style of
mineralisation. The fire assay technique was designed to measure total gold in the sample.
• No geophysical tools, spectrometers or handheld XRF instruments were used.
• The QA/QC process described above was sufficient to establish acceptable levels of
accuracy and precision. All results from assay standards and duplicates were scrutinised to
ensure they fell within acceptable tolerances.
• Matador samples were submitted for analysis for gold by standard 30g fire assay with the
finish by Atomic Absorption (AA) with a 0.01g/t detection limit.
• CGNL analysis methods and QA/QC checks are unknown.
Verification of
sampling and
assaying
• Significant intervals were visually inspected by company geologists to correlate assay
results to logged mineralisation. Consultants were not used for this process.
• Normally if old historic drilling was present, twinned holes are occasionally drilled to test the
veracity of historic assay data; however, no twinned holes were drilled during this program.
• Primary data is sent in digital format to the company’s Database Administrator (DBA) as
often as was practicable. The DBA imports the data into an acQuire database, with assay
results merged into the database upon receipt from the laboratory. Once loaded, data was
extracted for verification by the geologist in charge of the project.
• No adjustments were made to any current or historic data. If data could not be validated to a reasonable level of certainty it was not used in any resource estimations.
• Historic holes were validated against paper copies and WAMEX reports where possible.
Location of data
points
• FML drill collars were surveyed after completion, using a DGPS instrument. All drill core was
oriented by the drilling contractor using an Ezy-mark or electronic system. Most holes were
surveyed upon completion of drilling using a north-seeking gyroscope and holes were
surveyed either open-hole or within the rods. Otherwise a single shot Eastman camera
downhole survey was used.
• All coordinates and bearings use the MGA94 Zone 51 grid system.
• FML utilises Landgate sourced regional topographic maps and contours as well as internally
produced survey pick-ups produced by the mining survey teams utilising DGPS base station
For
per
sona
l use
onl
y
Market Announcement | Page 21 of 45
Criteria Explanation
instruments.
• Matador has not stated the collar survey method, down-hole surveys used the Electronic
Multi-Shot (EMS) system.
• CGNL survey methods are unknown.
Data spacing and
distribution
• Drill spacing across the Coolgardie prospects varied depending on the exploration stage
that the drill target currently existed.
• Drilling varied from wide spaced exploration RC drilling to precisely placed diamond tails
designed to test mineralisation at depth and along strike.
• Drill spacing at the Bonnie Vale deposit varies from a 5m x 25m to 50m x 50m.
Orientation of data in
relation to geological
structure
• Drilling was designed based on known geological models, field mapping, verified historical
data and cross-sectional interpretation.
• Drill holes were oriented at right angles to strike of deposit, with dip optimised for drill
capabilities and the dip of the ore body.
Sample security • All samples were reconciled against the sample submission with any omissions or variations
reported to FML.
• All samples were bagged in a tied numbered calico bag, grouped into green plastic bags.
The bags were placed into cages with a sample submission sheet and delivered directly
from site to the Kalgoorlie laboratories by FML personnel.
• Historic sample security is not recorded.
Audits or reviews • A review of sampling techniques was carried out by rOREdata Pty Ltd in late 2013 as part of
a database amalgamation project. Their only recommendation was to change the QA/QC
intervals to bring them into line with the FML Laverton system, which uses the same
frequency of standards and duplicates but has them inserted at different points within the
numbering sequence.
Section 2 Reporting of Exploration Results (Criteria listed in the preceding section also apply to this section.)
Section 2 Details for the Greenfields deposit reproduced from ASX Announcement “81%
Increase in Greenfields Mineral Resources” Dated 15/07/2020
Criteria Explanation
Mineral tenement and
land tenure status
• Greenfields is located within Mining Lease M15/154, registered to Focus Minerals Ltd.
and Focus Operations Pty Ltd of Perth, Western Australia and which is current until
April 2027.
• The Malinyu Ghoorlie 2017 and Maduwongga 2017 Claims overlap this resource area
Exploration done by other
parties
• Greenfields is a site of numerous historic workings including small pits and shafts.
However, no production figures are available for these workings.
• Modern exploration by Coolgardie Gold NL include trenching and multiple drill
campaigns including RAB, RC and Diamond drilling.
• Gold Mines of Coolgardie Pty Ltd (GMC), MPI Gold Pty Ltd and FML have also run
drilling campaigns of RC and Diamond at Greenfields.
• Focus Minerals mined the deposit by open pit extraction until July 2013.
For
per
sona
l use
onl
y
Market Announcement | Page 22 of 45
Criteria Explanation
Geology
• The Greenfields deposit is located within the Greenfield dolerite sill within the
Coolgardie Greenstone Belt.
• There are three rock types present in the pit; dolerite (south wall), felsic volcaniclastics
(footwall to mineralisation) and ultramafics (North Wall). The mineralisation at
Greenfields forms a conjugate set of steep and moderate dipping lodes.
• Mineralisation is hosted by a quartz vein stockwork that exploits a conjugate set of
brittle-ductile fractures. Bucky quartz veins have accessory pyrrhotite and
arsenopyrite sulphides and sometimes visible gold is observed. Veins display crack
seal textures and are commonly weakly wall rock laminated.
• The wall rock to the veins is commonly bleached over 0.2 - 0-.4m intervals.
Drill hole information
• Historic drilling information has been validated against publicly available WAMEX
reports. Not all drill holes can be found referenced in the WAMEX reports. However,
cross-checking of original drill surveys was verified against the database. Most of
these holes were drilled in the excavated pit area and has been depleted from the
BONC165 – BONC169 Mineral Resource Update for Bonnie
Vale Deposit 30/05/2018
Data aggregation
methods
• Mineralised intersections are reported at a 1.00g/t Au cut-off with a minimum reporting width
of 1m for RC holes and 0.2m for diamond holes, reported as length-weighted average
grades.
Relationship between
mineralisation widths
and intercept lengths
• Holes were drilled orthogonal to mineralisation as much as possible, however the exact
relationship between intercept width and true width cannot be estimated exactly in all cases.
Diagrams • Refer to Figures and Tables in body of the release.
Balanced reporting • The majority of drill assay results used in this estimation are published in previous news
releases.
Other substantive
exploration data
• There is no other material exploration data to report at this time.
Further work • The company is further reviewing the exploration results and anticipates additional drilling to
follow up on the encouraging results at Bonnie Vale.
For
per
sona
l use
onl
y
Market Announcement | Page 33 of 45
Section 3 Estimation and Reporting of Mineral Resources (Criteria listed in section 1, and where relevant in section 2, also apply to this section)
• Section 3 Details for the Greenfields deposit reproduced from ASX Announcement “81%
Increase in Greenfields Mineral Resources” Dated 15/07/2020
Criteria Explanation Database integrity • Data was geologically logged electronically; collar and downhole surveys were also received
electronically as was the laboratory analysis results. These electronic files were loaded into an
acQuire database by either consultants rOREdata or the company in-house Database
Administrator. Data was routinely extracted to Microsoft Access during the drilling program for
validation by the geologist in charge of the project.
• FML’s database is a Microsoft SQL Server database (acQuire), which is case sensitive,
relational, and normalised to the Third Normal Form. As a result of normalisation, the following
data integrity categories exist:
o Entity Integrity: no duplicate rows in a table, eliminated redundancy and chance
of error.
o Domain Integrity: Enforces valid entries for a given column by restricting the
type, the format, or a range of values.
o Referential Integrity: Rows cannot be deleted which are used by other records.
o User-Defined Integrity: business rules enforced by acQuire and validation codes
set up by FML.
• Additionally, in-house validation scripts are routinely run in acQuire on FML’s database and
they include the following checks:
o Missing collar information
o Missing logging, sampling, downhole survey data and hole diameter
o Overlapping intervals in geological logging, sampling, down hole surveys
o Checks for character data in numeric fields
• The historical Greenfields drill data was validated by the Focus data management team and
the Project Geologist. This involved collaborating all collar, downhole survey, geology and
assay data with existing hardcopy material as well as displaying the holes in three dimensions
in Surpac to determine any unusual or unlikely trends in the data so that it could be rectified
before loading into the Focus site database. This process was thorough and took a couple of
months for the team to complete.
Site visits • Alex Aaltonen, the Competent Person for Sections 1 and 2 of Table 1 is FML’s General
Manager - Exploration and conducts regular site visits.
• Hannah Kosovich, the Competent Person for Section 3 of Table 1 is FML’s
Resource Geologist and last visited site in February 2014.
Geological
interpretation
• All available drill hole, mining data and pit mapping was used to guide the geological
interpretation of the mineralisation.
• The mineralised geological interpretation was generated in Seequent Leapfrog Geo implicit
modelling software.
• A total of 29 lodes were modelled. Four larger, steeper dipping (55o to SSW) lodes were
modelled, along with 25 less continuous, shallower dipping (~28o to SSW) lodes. The
shallower lodes intersect the steeper lodes near surface with “soft boundaries” meaning drill
holes intersecting both mineralised lodes were shared in the estimation process. However,
blocks in the final model were coded with the flat lying mineralised domain estimation values
and associated lode codes.
• Minor deviation of the lode geometry was modelled between drill holes down dip and along
strike.
Dimensions • The resource extends over a NW strike length of over 480m and includes the ~150m interval
from the base of the final mined surface down to the 150mRL, some 250m below surface.
For
per
sona
l use
onl
y
Market Announcement | Page 34 of 45
Criteria Explanation
• The thickness of the four steeper lodes varies from average thickness of 20m near surface
pinching to an average thickness of 3m at depth. The flatter lying lodes vary from 1m to 8m
wide have an average thickness of 3m.
Estimation and
modelling techniques
• Samples within the wireframes were composited to even 1m intervals, the dominant sample
interval from historic drilling. Residual samples that did not meet the minimum length
criteria (less than 0.2m) of the compositing process were appended to the adjacent sample so
that all material within the wireframe was included.
• Composited assay values of each domain were exported to a text file (.csv) and imported into
Snowden Supervisor for geostatistical analysis.
• A review of histograms, probability plots and mean/variance plots for
the individual lodes revealed outlier sample values in some of the ldoes. A maximum top-cut
of 15g/t Au and an average of 10g/t Au was used for the different lodes, with assays above the
top-cut set to the top-cut value.
• Variograms were modelled in Supervisor for the four steeper lodes and one of the flat
lying lodes that had the largest number of samples. Other flay lying lodes shared
this variogram.
• GEOVIA Surpac Software was used for the estimation and modelling process. The model was
created in GDA 94 grid co-ordinates. Block sizes for the model were 5m in Y, 10m in X and 5m
in Z direction. Sub celling of the parent blocks was permitted to 1.25m in the Y direction, 2.5m
in the X direction and 1.25m in the Z direction. Sub-blocking was used to best fill the
wireframes and inherit the grade of the parent block. No rotation was applied to the orientation
of the blocks.
• Minimum (8) and maximum (20) sample numbers were selected based on a Kriging
Neighbourhood analysis in Supervisor.
• An elliptical search was used orientated on the lode geometry and based on range of the
Variograms.
• Three search passes were run in order to fill the block model with estimated Au values. After
each search pass the search range was increased and the minimum number of samples was
decreased.
• The estimate was validated by a number of methods. An initial visual review was done by
comparing estimated blocks and raw drill holes.
• Tonnage weighted mean grades were compared for all lodes with the raw and top-capped drill
hole values. There were no major differences.
• Swath plots of drill hole values and estimated Au grades were generated in Supervisor
software and showed the estimated grades honoured the trend of the drilling data.
Moisture • Tonnages are estimated on a dry basis.
Cut-off parameters • The Resources for Greenfields have been reported above a 0.8g/t cut-off for open pit above
230mRL.
Mining factors or
assumptions
• An existing open pit exists at Greenfields, mining would continue by cut-back and open cut
extraction.
Metallurgical factors or
assumptions
• In house, metallurgical testwork has been conducted on Greenfields samples and recoveries
are in the plus 90% range.
• GMC who mined Greenfields from Dec 2003 to Jan 2005 had an overall reconciliation of
~96.9% of tonnes, 100.7% of grade and 101% of ounces milled compared to mined.
Environmental factors
or assumptions
• Greenfields deposit occurs in an area of previous disturbance with an open cut pit and
associated waste dump.
• All closure plans will need to be updated prior to seeking mine approvals
• The Three Mile Hill Processing Plant is currently on care and maintenance, but has all the
necessary tailing facilities etc, that would allow for a restart of the plant.
For
per
sona
l use
onl
y
Market Announcement | Page 35 of 45
Criteria Explanation Bulk density • Bulk density test work was carried out on diamond core samples using a water immersion
method for these determinations.
• Average bulk densities were applied to modelled weathering profiles.
• Bulk densities of 2.07, 2.43 and 2.87 t/m³ were applied to Oxide, Transitional and Fresh
resources respectively.
Classification • Resources have been classified as either Measured or Indicated based mainly on geological
confidence in the geometry and continuity of the lodes. In addition, various estimation output
parameters such as number of samples, search pass, kriging variance, and slope of
regression have been used to assist in classification.
• Measured resources have been reported inside the 2013 Pre-Feasibility Study pit design
optimisation.
• Indicated resources have been reported above the 230mRL given the close drill spacing and
reasonable prospects for economic extraction.
Audits or reviews • No external audits of the Mineral Resource have been conducted.
Discussion of relative
accuracy/ confidence
• The Mineral Resource relates to global tonnage and grade estimates.
• The Greenfields Pit has been mined in 4 campaigns in the modern era commencing in 1986
and finishing in 2005 producing some 0.98Mt @ 1.81g/t for 56,776 ounces (reconciled).
Section 3 Details for the Brilliant South deposit reproduced from ASX Announcement “Brilliant
South Mineral Resource Update” Dated 2/09/2020
Criteria Explanation
Database integrity • FML data was geologically logged electronically, collar and downhole surveys were also
received electronically as was the laboratory analysis results. These electronic files were
loaded into an acQuire database by either consultants rOREdata or the company in-house
Database Administrator. Data was routinely extracted to Microsoft Access during the drilling
program for validation by the geologist in charge of the project.
• FML’s database is a Microsoft SQL Server database (acQuire), which is case sensitive,
relational, and normalised to the Third Normal Form. As a result of normalisation, the
following data integrity categories exist:
• Entity Integrity: no duplicate rows in a table, eliminated redundancy and chance of error.
• Domain Integrity: Enforces valid entries for a given column by restricting the type, the
format, or a range of values.
• Referential Integrity: Rows cannot be deleted which are used by other records.
• User-Defined Integrity: business rules enforced by acQuire and validation codes set up
by FML.
• Additionally, in-house validation scripts are routinely run in acQuire on FML’s database and
they include the following checks:
• Missing collar information
• Missing logging, sampling, downhole survey data and hole diameter
• Overlapping intervals in geological logging, sampling, down hole surveys
o Checks for character data in numeric fields
• Data extracted from the database were validated visually in GEOVIA Surpac software and
ARANZ Geo Leapfrog software. Also, when loading the data any errors regarding missing
values and overlaps are highlighted.
• Historic data has been validated against WAMEX reports where possible.
Site visits • Alex Aaltonen, the Competent Person for Sections 1 and 2 of Table 1 is FML’s General Manager - Exploration and conducts regular site visits.
• Hannah Kosovich, the Competent Person for Section 3 of Table 1 is FML’s Resource Geologist and last visited site in February 2014.
For
per
sona
l use
onl
y
Market Announcement | Page 36 of 45
Criteria Explanation
Geological
interpretation
• All available drill hole and historic mining data was used to guide the geological interpretation
of the mineralisation.
• The mineralised geological interpretation was digitized in GEOVIA Surpac software on a
section by section basis. An approximate 0.5g/t cut-off was used, infrequently sub 0.5g/t
samples were included for continuity. The logging of felsic intrusive’s also guided the
interpretation.
• Minor deviation only of the lode geometry was noticed between drill holes along strike and
down-dip.
• Minor lodes with less continuity and sample numbers were also interpreted.
Dimensions • The entire Brilliant deposit strikes NNW with a total strike length of 2km, Brilliant can be
separated into Brilliant and Brilliant North with an approximate 200m gap of low-grade
mineralization between the two zones. The main lodes of mineralisation have been modelled
to approximately 460m below surface with an average width of 3 - 4m for most lodes.
Estimation and
modelling techniques
• The drill hole samples were composited to 1m within each domain. This is the dominant
sampling interval.
• All domain boundaries were considered “hard” boundaries and no drill hole information was
used by another domain in the estimation.
• Composited assay values of each domain were exported to a text file (.csv) and imported into
Snowden Supervisor for geostatistical analysis.
• A review of histograms, probability plots and mean/variance plots for each domain revealed
some outlier sample values.
• Top capping of higher Au values within each domain was carried out with Au values above
the cut-off grade reset to the cut-off grade.
• For the main domain, a top-cut of 26g/t Au was selected, the different domains had different
top-cuts as required.
• Variograms were modelled in Supervisor on the larger domains that had greater than 100
samples, these variogram models were then shared with the smaller domains of similar
orientation and proximity. Due to the skewed nature of the dataset a Normal Scores
transformation was applied to obtain better variograms. A back-transformation was then
applied before being exported.
• GEOVIA Surpac Software was used for the estimation and modelling process. The model
was created in GDA 94 grid co-ordinates. Block sizes for the model were 10m in Y, 10m in X
and 5m in Z direction. Sub celling of the parent blocks was permitted to 5m in the Y direction,
1.25m in the X direction and 2.5m in the Z direction. Sub-blocking was used to best fill the
wireframes and inherit the grade of the parent block. No rotation was applied to the
orientation of the blocks.
• Block size is approximately ½ of the average drill hole spacing.
• An Ordinary Kriging (OK) estimation technique was selected and used the variograms
modelled in Supervisor. Each domain was estimated separately using only its own sample
values.
• Minimum (8) and maximum (24) sample numbers were selected based on a Kriging
Neighbourhood analysis in Supervisor. This was dropped to a minimum (4) samples on the
second and third search pass.
• An elliptical search was used based on range of the Variograms.
• Three search passes were run in order to fill the block model with estimated Au values. It was
noted however at depth on the larger lodes where few samples exist high grade values were
being “smeared” long distances due to a lack of drill holes. Therefore, the larger domains, 1,
2 and 3 were estimated in two parts. Above the 230m RL where most of the sampling exists
an OK estimate was run with no restrictions on samples grades within the lodes. Beneath the
230mRL a “grade dependent search” option was used to limit the search radius high grade
values could be used in the estimation process. At Brilliant grades greater than 10g/t Au
could only be used to inform blocks up to a 30m search ellipse distance away. This limited
the influence of a few high-grade values at depth.
• The estimate was validated by a number of methods. An initial visual review was done by
comparing estimated blocks and raw drill holes.
For
per
sona
l use
onl
y
Market Announcement | Page 37 of 45
Criteria Explanation
• Tonnage weighted mean grades were compared for all lodes with the raw and top-capped
drill hole values. There were no major differences.
• Swath plots of drill hole values and estimated Au grades by northing and RL were done for
the main domain and showed that the estimated grades honoured the trend of the drilling
data.
• Historic mine production from Brilliant is estimated to be around 1.1Mt @ 2.45g/t Au for
88,000 ounces. Within the current pit void, 1.14Mt @ 2.0g/t Au for 74,500 Oz is reported from
the updated Brilliant Model.
Moisture • Tonnages are estimated on a dry basis.
Cut-off parameters • The Open Pit Mineral Resource for Brilliant South has been reported above a 0.7g/t cut-off
for open to 230mRL, this is based on 2020 preliminary whittle shell optimisation at AUD
$2,200/oz. A 1.5g/t cut-off for underground resources is used below the 230mRL and is
based on preliminary 2020 assessment of the Bonnie Vale Underground using AUD
$2,200/oz.
Mining factors or
assumptions
• The Brilliant deposit would be mined by open-cut and underground via decline and stoping.
Metallurgical factors
or assumptions
• In December 1996 Ammtec Ltd conducted metallurgical test work on 2 composite samples
from Brilliant (TNG1166, 37-38m and 43-44m. Grade: 1.49 ppm) and (TNG1167, 26-27m
and 29-30m. Grade: 3.35 ppm). Work carried out included detailed elemental analysis, grind
establishment, gravity separation/cyanidation and gravity separation/floatation/cyanidation
test work. Excellent overall gold recoveries were reported for the gravity/cyanide leaching
test work with 97.75% for Comp 1 and 95.51% for Comp 2.
• The cyanidation leach testing of the flotation concentrates showed successful gravity
separation of 37.29% of total gold content for Comp 1 and 14.76% for Comp 2. Floatation
testing of gravity tailings recovered a further 49.65% of gold content for Comp 1 and 66.02%
for Comp 2. Giving an overall gold extraction levels of 87.04% for Comp 1 and 80.78% for
Comp 2 to gravity separation/floatation test work. Cyanide leach testing of the floatation
concentrates gave moderate extraction for Comp 1 at 72.51% and low gold extraction for
Comp 2 at 54.45%.
Environmental factors
or assumptions
• The Brilliant deposit occurs within the historic Brilliant open cut pit with previous ground
disturbances including open cut pit, waste dumps and milling residues/tailings from the
nearby State Battery.
• All closure plans will need to be updated prior to seeking mine approvals
Bulk density • Density values were assigned based on weathering profile and rock type, using SG test work
on FML diamond core samples and historic figures used in the region. An average density of
1.8 for completely oxidised, 2.4 for transitional and 2.75 for fresh rock were applied to the
model.
Classification • Resources have been classified as either Indicated or Inferred based mainly on geological
confidence in the geometry and continuity of the lodes. In addition, various estimation output
parameters such as number of samples, search pass, kriging variance, and slope of
regression have been used to assist in classification.
• Above the 230mRL significant drilling exists coupled with the successful extraction of
resources from the pit over a number of years; therefore, the larger domains that estimated in
the first 2 search passes were classified as Indicated.
• Estimated blocks in the larger domains beneath the 230mRL were classified Inferred. Smaller
domains that still had good sample coverage and continuity were classified as Inferred.
• Smaller domains based on one or two drill holes intercept data were assigned a ‘not
classified’ code and are not included in the reported Mineral Resource estimate.
Audits or reviews • The previous Brilliant Mineral Resource was reviewed by ARANZGeo consultant. Little has
changed in this new resource with the addition of infill holes drilled by FML.
For
per
sona
l use
onl
y
Market Announcement | Page 38 of 45
Criteria Explanation
Discussion of relative
accuracy/ confidence
• This is addressed in the relevant paragraph on Classification above.
• The Mineral Resource relates to global tonnage and grade estimates
• Brilliant has been historically mined open cut with recorded production figures of 88,000
ounces at an average grade of 2.45 g/t, the new model was reported within the pit boundary
and similar figure of 75,000 ounces at an average grade of 2.0g/t.
Section 3 Details for the Bonnie Vale Quarry Lode deposit reproduced from ASX Announcement
“Bonnie Vale Mineral Resource Update” Dated 2/09/2020
Criteria Explanation
Database integrity • Data was geologically logged electronically; collar and downhole surveys were also received
electronically as was the laboratory analysis results. These electronic files were loaded into
an acQuire database by either consultants rOREdata or the company in-house Database
Administrator. Data was routinely extracted to Microsoft Access during the drilling program
for validation by the geologist in charge of the project.
• FML’s database is a Microsoft SQL Server database (acQuire), which is case sensitive,
relational, and normalised to the Third Normal Form. As a result of normalisation, the
following data integrity categories exist:
• Entity Integrity: no duplicate rows in a table, eliminated redundancy and chance of error.
• Domain Integrity: Enforces valid entries for a given column by restricting the type, the
format, or a range of values.
• Referential Integrity: Rows cannot be deleted which are used by other records.
• User-Defined Integrity: business rules enforced by acQuire and validation codes set up by
FML.
• Additionally, in-house validation scripts are routinely run in acQuire on FML’s database and
they include the following checks:
• Missing collar information
• Missing logging, sampling, downhole survey data and hole diameter
• Overlapping intervals in geological logging, sampling, down hole surveys
• Checks for character data in numeric fields
• Data extracted from the database were validated visually in GEOVIA Surpac software and
ARANZ Geo Leapfrog software. Also, when loading the data any errors regarding missing
values and overlaps are highlighted.
Site visits • Alex Aaltonen, the Competent Person for Sections 1 and 2 of Table 1 is FML’s General
Manager of Exploration and Geology, conducts regular site visits.
• Hannah Kosovich, the Competent Person for Section 3 of Table 1 is FML’s Resource
Geologist and has conducted site visits in the past.
Geological
interpretation
• All available drill hole and historic mining data was used to guide the geological
interpretation of the mineralisation.
• Historic underground works at Bonnie Vale have focused on extracting mineralised quartz
reefs dipping at a 40°-45° angle.
• This current interpretation of an un-excavated quartz reef at Bonnie Vale also supports
mineralised quartz veins dipping at 40°-45°.
• The mineralised geological interpretation was digitized in GEOVIA Surpac software on a
section by section basis. An approximate 0.5g/t cut-off was used, infrequently sub 0.5g/t
samples (logged as quartz veining) included for continuity.
• Minor deviation only of the lode geometry was noticed between drill holes along strike and
down-dip.
• Minor lodes with less continuity and sample numbers were also interpreted.
• Modelling of host rock and surrounding geology units in Seequent Leapfrog Geo implicit
modelling software was used to guide the mineralisation interpretation with mineralised lodes
confined to the Granodiorite.
Dimensions • The main Quarry Reef lode extends east south east over a strike length of 500m and
For
per
sona
l use
onl
y
Market Announcement | Page 39 of 45
Criteria Explanation
extends from about a depth of 70m below surface to approximately 550m below surface.
The thickness of the main Quarry Reef lode varies from 2m to approximately 10m, with an
average thickness of 4m.
Estimation and
modelling techniques
• Within the main mineralised lode, a ‘core’ domain of higher Au values closely associated
with the quartz veining was interpreted. The boundary between the high-grade core and
surrounding main mineralisation envelope was considered a hard boundary and no samples
were shared between the two domains. The use of these domains controlled the limit of the
high gold values encountered at Bonnie Vale.
• Only RC and Diamond holes were used in the Estimation. In total 61 RC holes, 1 Diamond
and 16 RC pre-collar with diamond tail holes (RC/DD) were used.
• The drill hole samples were composited to 1m within each domain. This is the dominant
sampling interval.
• Composited assay values of each domain were exported to a text file (.csv) and imported
into Snowden Supervisor and Geovariances Isatis software for geostatistical analysis.
• A review of histograms, probability plots and mean/variance plots for each domain revealed
some outlier sample values.
• Top capping of higher Au values within each domain was carried out with Au values above
the cut-off grade reset to the cut-off grade.
• For the main core lode, a top cap of 40g/t was applied, while 15g/t was used for the
surrounding domain. Different caps were used for the other minor lodes.
• Directional variograms were modelled on the main Quarry Reef lode, without the higher-
grade core samples. A Normal Scores transformation was applied to the data set for the
surrounding to obtain variograms that could be modelled. A back-transformation was applied
before exporting the variograms in a Surpac readable format. This variogram was also used
for the minor lode domains, with minor orientation differences as required. For the core high-
grade domain, the variogram was modelled in Isatis on capped but non-transformed data.
• GEOVIA Surpac Software was used for the estimation. An Ordinary Kriging (OK) technique
was selected using the variograms modelled in Supervisor/Isatis. Each domain was
estimated separately using only its own sample values. No samples were shared between
domains (hard boundaries).
• Minimum (10) and maximum (24) sample numbers were selected based on a Kriging
Neighbourhood analysis in Supervisor.
• An elliptical search was used based on range of the Variograms (see table below).
• Three search passes were run in order to fill the majority of the block model with estimated
Au values.
• Block sizes for the model were 10m in Y, 10m in X and 5m in Z direction. Sub celling of the
parent blocks was permitted to 2.5m in the Y direction, 2.5m in the X direction and 1.25m in
the Z direction. Sub-blocking was used to best fill the wireframes and inherit the grade of the
parent block. The block model was rotated 450 about the Y axis to orientate the blocks to
better fill the NW trend of the mineralisation.
• Block size is approximately ½ of the average drill hole spacing.
• The estimate was validated by a number of methods. An initial visual review was done by
comparing estimated blocks and raw drill holes.
• Tonnage weighted mean grades were compared for all lodes with the raw and top-capped
drill hole values. There were no major differences.
For
per
sona
l use
onl
y
Market Announcement | Page 40 of 45
Criteria Explanation
• Swath plots of drill hole values and estimated Au grades by northing, easting and RL were
done for the core and surrounding main and showed that the estimated grades honoured
the trend of the drilling data.
• Historic mine production from Bonnie Vale was recorded as an average gold grade of 16.2
g/t, which is very close to the estimated grade of the high-grade core lode for this estimate
(16.6 g/t Au).
Moisture • Tonnages are estimated on a dry basis.
Cut-off parameters • The Resources for Bonnie Vale have been reported above a 1.5g/t cut-off. This is based on
a gold price of AUD $2,200/oz.
• Operating costs considered include underground mining, transport to and processing at
FML’s Three Mile Hill processing plant (10km away) and administration.
• Operating costs are based on the results of a Preliminary Feasibility Study (PFS) completed
by consultants Mining One in 2017, ASX release: Coolgardie PFS Summary and Ore
Reserve Upgrade, 13 October 2017.
Mining factors or
assumptions
• The PFS assessed a range of mining methods and proposed the Quarry Reef at Bonnie
Vale being underground mined from a decline access using open stoping with cemented
rock fill.
Metallurgical factors
or assumptions
• One sample (BONC055, 140-141m. Grade: 9.66 g/t) was sent to ALS Metallurgy for
gravity/cyanide leaching test. The results show that the gravity gold recovery was high, at
~68%., overall gold extraction was very high, at >99%, with a final leach tail grade of only
0.05 g/t Au.
Environmental factors
or assumptions
• The Quarry Reef occurs within the historic Bonnie Vale mining centre with previous ground
disturbances including waste dumps and milling residues/tailings.
• The PFS Environmental assumptions included the mine plan utilising all waste generated as
mine fill.
• All closure plans will need to be updated prior to seeking mine approvals The Three Mile Hill
Processing Plant is currently on care and maintenance but has all necessary tailing facilities
etc. that would allow for a rapid restart of the plant.
Bulk density • A bulk density of 2.65 t/m3 was used for the mineralised lodes. Previously the laminated
quartz veins were assigned an overly conservative value of 2.6 t/m3 This was an undercall
compared to the database of measurements. A value of 2.6 t/m3 would be expected for a
pure quartz vein. However, Quarry Lode mineralisation is hosted by laminated veins that
include slivers of altered wall rock and the increase in density is warranted.
• Footwall tonalite/granodiorite density was also updated to 2.65 t/m3
• Hanging wall Ultramafic was assigned a bulk density of 2.80 t/m3.
• The water immersion technique was used for these determinations on half cut diamond core
Classification • Mineral Resources have been classified as either Indicated or Inferred based mainly on
geological confidence in the geometry and continuity of the lodes. In addition, various
estimation output parameters such as number of samples, search pass, kriging variance,
and slope of regression have been used to assist in classification.
• Significant portions of the core and surrounding main lodes which were estimated in the first
search pass were classified as Indicated. In addition, one of the minor lodes that was very
close to the main lode (Domain 4) and was supported by ample drilling was classified as
Indicated.
• The remainder of the core and main lodes were classified Inferred, as were some of the
minor lodes with good continuity and numerous drill intercepts. Smaller domains based on a
single drill hole intercept data or filled on the second or third search pass were assigned a
‘not classified’ code and are not included in the reported Mineral Resource estimate.
Audits or reviews • Previous Mineral Resources released for Bonnie Vale have been reviewed by QG Australia
including reviewed/critiqued FML’s work on the geological interpretation, assay QAQC
information, estimation methodology and parameters, and estimate validation.
For
per
sona
l use
onl
y
Market Announcement | Page 41 of 45
Criteria Explanation
Discussion of relative
accuracy/ confidence
• This is addressed in the relevant paragraph on Classification above.
• The Mineral Resource relates to global tonnage and grade estimates
• Bonnie Vale has historic production from 1894 to 1911 with recorded production figures of
176,883oz at an average grade of 16.2 g/t, the grade matches well with this Mineral
Resource estimate of the high-grade core (16.6 g/t Au).
Section 4 Estimation and Reporting of Ore Reserves (Criteria listed in the preceding section also apply to this section.)
Criteria Explanation
Mineral Resource
Estimate for
conversion to Ore
Reserves
• Mineral Resource estimates were produced by FML for each of the three deposits included
in the 2020 Coolgardie PFS Update. Details of the resources including Table 1 sections 1 -
3 can be accessed in the following ASX Announcements:
➢ “81% Increase in Greenfields Mineral Resources” Dated 15/07/2020
➢ “Brilliant South Mineral Resource Update” Dated 2/09/2020
➢ “Bonnie Vale Mineral Resource Update” Dated 2/09/2020
• The block models for each deposit were the basis of the Mineral Resources reporting and
were used to develop the Ore Reserve estimate. The block models included fields to
characterise blocks by resource category and discriminate mine depleted parts of the
deposits. For the purpose of the Ore Reserve estimate only indicated and measured
resource categories were considered. In particular, inferred category blocks were assigned
a grade of 0.00 g/t Au for selecting minable parts of the Mineral Resource in conjunction
with maintaining 0.00 g/t Au grade for all blocks characterised as unclassified material. This
ensured that Inferred material did not feature in the assessment of economic minability of
the Mineral Resource.
• Conversion of the Mineral Resource to an Ore Reserve was on the basis of a viable mine
plan and engineering design interrogating the relevant resource model. This work was
completed to a PFS level of detail or greater (for more detail see 2020 PFS update).
• Those parts of the Mineral Resource that were within proposed mine design were used as
the basis for determining the Ore Reserve. As such the Ore Reserve estimate is a subset of
the total Mineral Resource and not an addition to the total Mineral Resource.
Site visits • Alex Aaltonen, the Competent Person for Sections 1 and 2 of Table 1 is FML’s General
Manager of Exploration and Geology, conducts regular site visits.
• Hannah Kosovich, the Competent Person for Section 3 of Table 1 is FML’s Resource
Geologist and has conducted site visits in the past.
• A site visit was conducted by Dr David Trembath, the Competent Person in 2016 for the
purposes of assess JORC Code 2012 Edition reporting compliance.
• Given the nature of the site a further visit was not deemed necessary.
• The site visit did not reveal any matters that might affect the ability to declare an Ore
Reserve.
Study status • An updated PFS has been completed for the Greenfield, Brilliant South and Bonnie Vale
deposits (2020 PFS Update). The PFS proposes mine plans and schedule that are
technically achievable and economically viable, and that relevant material Modifying Factors
have been considered.
Cut off parameters Cut off grade assessment was completed using a $2,200 (AUD) gold price. The assessment
included costs and recovery estimates for all deposits assessed by the Coolgardie 2020 PFS:
• Greenfields Open Pit 0.46 g/t Au
• Brilliant South Open Pit 0.5 g/t Au
• Bonnie Vale Quarry Lode 1.8 g/t Au for stopes and 1.5 g/t Au for material incidentally
accessed by ore drives that did not require additional development to access
Mining factors or
assumptions
Bonnie Vale Resource
• The 2020 PFS Update considered a range of mining methods and concluded open stoping
For
per
sona
l use
onl
y
Market Announcement | Page 42 of 45
Criteria Explanation
with cemented rock fill was likely to maximise the value of the resource with minimal
technical risk.
• Preliminary capital tunnel development supporting Individual stope designs was completed
on the basis the economic cut-off grade, geotechnical guidance and operating parameters of
the likely mining equipment.
• A geotechnical assessment based on core logging was used to provide guidance on the
achievable supported and unsupported hydraulic radius for tunnel and stope design. A
modified tributary area method was used to develop stable pillar designs.
• Grade control drilling was taken into account in the PFS.
• A block model was provided with appropriate resource categories’ and grade distribution. It
was assumed that the model was a fair and reasonable representation of the resource. It
was also assumed that the productivities estimated by specialist mining contractors were fair
and reasonable.
• Dilution estimates were based on geotechnical analysis of the proposed stope designs. The
average over-break estimate was used as the basis of factoring tonnes and grade. Further
dilution from mining adjacent to CRF was also accounted for using a factor. Total dilution
applied was 16%.
• A minimum mining width of 2m was applied for underground stoping.
• Over-break in ore and waste development was assumed to be offset somewhat by under
break. Discrepancies here are unlikely to have a significant effect on the cost of mining.
• A 98% extraction rate for open stoping was assumed. The high value of the resource, its
geology and geometry, combined with the proposed mining method is likely to produce high
resource recovery rates.
• Blocks classified as inferred in the resource model were not used in determining the viability
of the stope designs used for estimating the Ore Reserve. After the Reserve stope designs
were completed, they were used to interrogate the resource block model for the purpose of
developing an ore production inventory. For the purpose of estimating the dilution grade a
small proportion of inferred block grade were used. A proportion of the stope designs also
contained blocks that had no resource classification. These blocks were given a zero grade.
It should be noted that parts of the resource model categorised as inferred and included in
the stope designs was a small proportion of the overall mining inventory. The unclassified
material was more significant (25%) but given that it has been given a zero grade there is no
risk of over stating the Reserve value. Given the location of inferred and uncategorised
material relative to the indicated material it is reasonable to reclassify the inferred and
unclassified material as indicated. This approach has been endorsed by the JORC.
• The 2020 PFS Update properly considers the infrastructure requirements for the mine.
Importantly the Three Mile Hill processing plant, administration buildings and the town of
Coolgardie itself provide considerable infrastructure to support mining at Bonnie Vale.
Greenfields and Brilliant South Resources
• The 2020 PFS update considered a range of mining methods and concluded that open pit
mining was the most appropriate method for mining the Greenfields and Brilliant South
Mineral Resources. Further studies may assess the viability of the resource beneath the
proposed pit however the current Reserve estimate does not consider this possibility.
• A Whittle assessment was completed initially (Lerchs & Grossmann, 1965) and used as the
basis of a detailed pit designs and scheduling.
• The practicality of the pit and dump designs were assessed including assessing
geotechnical stability.
• Grade control drilling was taken into account in the PFS.
• Block models were provided with appropriate resource categories’ and grade distribution. It
was assumed that the model was a fair and reasonable representation of the resource. It
was also assumed that the productivities estimated provided by specialist mining contractors
were fair and reasonable.
• A dilution and recovery assessment was completed for both Greenfields and Brilliant South
based on resource geometry and proposed selective mining unit (SMU). Results from this
analysis indicate 97% recovery and 34% dilution for Brilliant South, and 93% recovery and
For
per
sona
l use
onl
y
Market Announcement | Page 43 of 45
Criteria Explanation
19% dilution for Greenfields.
• A minimum mining width of 20m was used in the assessment.
• Blocks classified as inferred in the resource model were given a zero grade to ensure that
the inferred material was not a determinant in the Reserve estimate.
• Minimal infrastructure will be required given that the resources have been previously mined
and are in close proximity to the Three Mile Hill processing plant, administration buildings
and the town of Coolgardie itself.
Metallurgical factors
or assumptions
• FML owns the Three Mile Hill Mill (Care and Maintenance Status) that has previously
successfully treated a range of ores from Coolgardie deposits.
• FML have completed detailed CAPEX and OPEX estimated to refurbish this Mill to 1.4Mtpa
capacity. These estimated have been independently verified by GRES.
• Metallurgical testwork has been completed for each of the deposits and included in the PFS:
• Greenfields – Four historic metallurgical sample reports provided by FML. As no recent work
has been conducted as part of the PFS the results have been discounted by 5% resulting in
PFS estimated processing recovery of 90%
• Brilliant South – FML supplied resort on 11 metallurgical samples and historic mill
performance treating Brilliant ore. As no recent work has been conducted as part of the PFS
the results have been discounted by 5% resulting in PFS estimated processing recovery of
90.5%
• Bonnie Vale – 6 Samples were considered during the 2017 PFS covering a range of
representative grades from representative locations. The results have been discounted by
3% resulting in PFS estimated processing recovery of 95.8%.
Environmental • All three deposits considered by the PFS are located on mine licenses. Furthermore, each
site is located in the vicinity of historic mine infrastructure including accesses, waste dumps,
mine offices.
• It is anticipated that all Bonnie Vale waste rock will be reused for back filling mined voids.
• Waste dump preliminary designs were incorporated into the PFS assessment of Greenfields
and Brilliant South.
• Additional base line studies including: waste material classification, flora, fauna and
hydrogeological studies are recommended at all PFS deposits in order to progress mine
approvals.
• The PFS schedule requires expansion of the Three Mile Tails Facility. FML already have
approval for the 3rd lift to this tails facility and the capital expenditure has been estimated
and included in the Ore Reserve mine plan.
• The conversion of the Greenfields open pit to an in pit TSF will require additional approvals.
However, it is noted that the proposed in pit TSF is located adjacent to the existing 3 Mile in
pit TSF and several other above ground TSF’s
• It is expected that there will be no serious conditions or impediments to mining any of the
three PFS deposits.
Infrastructure • The PFS properly considers the infrastructure requirements for the proposed mining.
• The current Three Mile Hill plant is on care and maintenance. The plant requires 9 months
of refurbishment (including supply of long lead time items) to be upgraded to 1.4Mtpa
capacity. The refurbishment schedule and budget have been verified by independent
engineers GRES. The cost of this refurbishment is included in the Ore Reserve mine plan.
• Site setup and infrastructure required to support mining at Bonnie Vale was assessed in
detail during the 2017 Coolgardie PFS and has been included in the Ore Reserve mine plan.
Costs • Capital costs have been estimated on the basis of budget quotes from suppliers sourced in
the 2017 PFS and detailed design and scheduling.
• Opex costs have been estimated on the basis of budget quotes from suppliers source in the
2017 PFS and detailed design and scheduling. Quotes from specialist mining contractors
sourced in 2017 have been used to validate the estimates.
• Mill Capex and OPEX was supplied by FML who have completed detailed review of plant
performance and modelling. Mill CAPEX and OPEX have been validated by independent
For
per
sona
l use
onl
y
Market Announcement | Page 44 of 45
Criteria Explanation
engineering review completed by GRES in August 2020.
• No inflation or escalation was assumed in the modelling
• No allowances were made for the content of deleterious elements beyond what is currently
understood.
• The study was assessed Australian dollars and is somewhat insensitive to exchange rate
fluctuations. For those costs depending on exchange rates published rates at the time of the
study were used.
• Transportation charges for the gold and further refining charges have not been included but
are not considered significant.
• A 2.5% royalty is applicable; however, a rate of 3% has been used to account for further
administrative costs.
Revenue factors • The head grade is derived from interrogating the Mineral Resource model with the proposed
mine design. Mining factors were applied to account for recovery and dilution. Costs and
charges were based on what has historically been achieved on site or from budget
estimates from suppliers. Production was derived from scheduling, based on productivity
estimates from the relevant contractor and detailed modelling.
• A gold price of A $2,200/oz has been used for the PFS and Ore Reserve estimation. This
price is consistent with medium term projections from reliable analysist and is significantly
below the current gold price. FML used the Consensus Economics forecast for setting the
gold price for the 2020 PFS. The August 2020 Consensus Economics median 5 year
forecast price in A $ is higher than the price used in the 2020 Coolgardie PFS.
Market Assessment • Gold is readily saleable and requires no specific marketing or sales contract.
• There are no direct competitors in the production of gold
• The gold price in Australian dollars has held sustained gains in recent years.
• The 2020 PFS update assumes a fixed price forecast over the life of mine. The current long-
term forecast price indicates that a higher metal price may be achieved over the life of the
mine.
Economic • A discount rate of 7.5% was used in the analysis of the Ore Reserve estimate NPV. All
resources included in the PFS have positive NPV’s.
• Bonnie vale underground has relatively low production compared to the open pits. However,
with base load production coming from pits Bonnie vale benefits from shared costs and
sustained 1.4 Mtpa capacity milling.
Social • FML has been and continues to be a significant contributor to the Coolgardie and Kalgoorlie
Shires. Furthermore, when in production FML contributed significantly to community projects
including the annual Coolgardie Day Festival. FML expectsfuture employment opportunities
for the Coolgardie and Kalgoorlie communities would be welcomed.
Other • There are some geotechnical risks that need to be targeted at the next level of analysis. The
material impact of these risks is not considered to be significant with an appropriate
management plan.
• The hydrogeology at each of the PFS projects requires further study prior to commencing
the next level of analysis.
• Further mining dilution/loss studies are recommended for each of the open pits included in
the PFS.
• Further metallurgical testing at Brilliant and Greenfields is recommended. This is not
considered a material risk to the Ore Reserve estimate.
• The use of Greenfields pit as a tailing facility will need approval. However, given its location
and the fact that this approach has been utilised in an adjacent pit, this approval is not seen
as a material risk.
• All the resources and proposed mining activity is located on mining leases held by FML.
• There is a long history of mining evidenced at each of the deposits included in the PFS.
There is no reason to believe that a license to operate will not be granted.
Classification • Measured category Mineral Resource has only been estimated at the Greenfields open pit
For
per
sona
l use
onl
y
Market Announcement | Page 45 of 45
Criteria Explanation
(following incorporation of detailed 2013 RC grade control in the resource model). The
portion of this measured resource above cut-off grade of 0.46 g/t Au and within the staged
PFS pit designs has been classified as Proved Ore Reserve. The remaining Indicated
resource at Greenfields above cut-off and within the PFS design is classified as Probable
Ore Reserve
• Only Indicated resources at Brilliant South have been assessed for estimation of Ore
Reserves. Indicated resources above the 0.5 g/t cut off and within the PFS design have
been classified as Probable Ore Reserves.
• Only Indicated resources at Bonnie Vale Underground have been used to estimate Ore
Reserves. Mineable shapes have been generated and refined at Bonnie Vale during the
PFS. A cut-off grade of 1.8 g/t Au has been established for minable stopes. Ore drives also
mine the mineralisation and have been added to the resource within the minable shapes.
Where economic to do so ancillary stopes that are accessed by the PFS mine design with
grades as low as 1.5 g/t have also been included in the resources within minable shapes.
• Dilution of stopes with material classified as Inferred in the model is limited. Given its
location and incorporation into minable shapes that have a majority of indicated material,
this inferred material has been reclassed as Indicated for the purpose of assessing the Ore
Reserve. However, up to 30% dilution with unclassified material is estimated by the PFS. As
all unclassified material has a set grade of 0.00 g/t Au this included dilution will not result in
overstate the gold content of Ore Reserves. For the purpose of assessing the Reserve
estimate it has been classified and Indicated. Only Probable Ore Reserves have been
estimated at Bonnie Vale
• It is the Competent Person’s view that the methods used for the purpose of Ore Reserve
estimation provide a fair and reasonable estimate of the mineable parts of the Mineral
Resources as it is currently understood.
Audits and Reviews • No external audit has been completed to date on the current Ore Reserve estimate.
Discussion of relative
accuracy/ confidence
• The Ore Reserves are based on a PFS completed to a level of detail that is typically
expected for the scale of the Mineral Resource currently understood. A Key factor in the
assessment of the Ore Reserve is the accuracy of the cost estimates and key determinants
such as the mine production profile. Confidence intervals around such estimates are almost
impossible to quantify (McCarthy 2009, p63). Maybe all that can be said here is that
sufficient detail has been considered to show that the mine plan has a reasonable chance of
success.
• The use of geostatistical analysis to estimate the relevant confidence intervals for the Ore
Reserve estimate would be complex. Simulation methods that may help in this regard have
been recommended in the PFS. However, further work is considered unnecessary for the
purpose of an Ore Reserve declaration primarily because of the conservative nature of the
methodology adopted and the robust nature of the economic assessment.
• Key risks to the Ore Reserve value are: gold price, grade tonnage distribution, production
rate, metallurgical recovery and mining costs. The Competent Person believes that the
required attention to detail has been given to the project such that assumptions and
estimates are based on reasonable grounds. The economics of the project have been tested
in the PFS with sensitivity analysis on and found to be robust.