38
February 25, 2015 SpeedCast International Limited Financial Results Presentation Year Ended December 31, 2014 For personal use only

February 25, 2015
SpeedCast International Limited
Financial Results Presentation
Year Ended December 31, 2014
For
per
sona
l use
onl
y

2
Agenda
Operational & Financial Highlights
Full Year Financial Results
M&A Activities
Growth Strategy & Outlook
Q&A
For
per
sona
l use
onl
y

3
Disclaimer
This presentation has been prepared by SpeedCast International Limited ("SpeedCast"). By accessing or attending this presentation you acknowledge that you have read and understood the following statements.
The information in this presentation does not constitute financial product advice (nor investment, tax, accounting or legal advice) and does not take account of your individual investment objectives, including the merits and risks involved in an investment in shares in SpeedCast, or your financial situation, taxation position or particular needs. You must not act on the basis of any matter contained in this presentation, but must make your own independent assessment, investigations and analysis of SpeedCast and obtain any professional advice you require before making an investment decision based on your investment objectives.
All values are in US dollars (USD$) unless otherwise stated.
Past performance information given in this presentation is given for illustrative purposes only and should not be relied upon as (and is not) an indication of future performance.
This presentation contains certain “forward looking statements”. Forward looking statements include those containing words such as: “anticipate”, “estimate”, “should”, “will”, “expect”, “plan”, “could”, “may”, “intends”, “guidance”, “project”, “forecast”, “likely” and other similar expressions. Any forward looking statements, opinions and estimates provided in this presentation are based on assumptions and contingencies which are subject to change without notice and involve known and unknown risks and uncertainties and other factors which are beyond the control of SpeedCast. In particular, this presentation contains forward looking statements that are subject to risk factors associated with the service provider industry. These statements may be affected by a range of variables which could cause actual results or trends to differ materially, including but not limited to: price fluctuations, actual demand, currency fluctuations, loss of market, industry competition, environmental risks, physical risks, legislative, fiscal and regulatory developments, economic and financial market conditions in various countries and regions, and political risksproject delay or advancement approvals and cost estimates. Such forward looking statements only speak as to the date of this presentation and SpeedCast assumes no obligation to update such information except as required by law. Forward looking statements are provided as a general guide only and should not be relied upon as an indication or guarantee of future performance. Actual results may differ materially from those expressed or implied in such statements because events and actual circumstances may not occur as forecast and these differences may be material. Readers are cautioned not to place undue reliance on forward looking statements and, except as required by law or regulation, SpeedCast assumes no obligation to update these forward looking statements. To the maximum extent permitted by law, SpeedCast and its officers, employees, agents, associates and advisers do not make any representation or warranty, express or implied, as to the accuracy, reliability or completeness of such information, or likelihood of fulfilment of any forward looking statement, and disclaim all responsibility and liability for these forward looking statements (including, without limitation, liability for negligence).
For
per
sona
l use
onl
y

Operational & Financial Highlights
For
per
sona
l use
onl
y

5
Key highlights
Achieved FY2014 IPO prospectus forecast, thus showing strong
growth over 2013
Double-digit revenue growth across services (ex Afghanistan) and
wholesale voice
EBITDA margin growth highlighting operational leverage
Investment in key resources for the Maritime and Energy verticals for
future growth without sacrificing near-term results
Smooth integration of acquired businesses in particular Satcomms
Australia and Oceanic Broadband
Declaration of fully franked AUD3.36 cents per-share dividend for
period 1 July 2014 to 31 Dec 2014, in line with prospectus guidance
of 40-60% of NPATA per share
Acquisition of Geolink Satellite Services
For
per
sona
l use
onl
y

6
Full year 2014 results
IPO prospectus revenue and earnings
delivered while investing in 2015-2016
growth
Continuation of strong revenue growth since
2011, with slight acceleration of overall
revenue growth in 2014 versus 2013.
Maritime business grew 34%.
18% EBITDA growth and continued EBITDA
margin improvement thanks to synergies;
significantly better growth than in 2013.
33% NPATA growth on 2013.
9.5
15.9 17.5
20.7
11%
15% 16%17%
2011 2012 2013 2014
EBITDA (US$m)
87.0
102.9 111.3
121.5
2011 2012 2013 2014
Total Revenue (US$m)
US$mProforma
2014
IPO Prospectus
2014
Proforma2013
Diff to2013
Total revenue 121.5 119.0 111.3 +9.2%
EBITDA 20.7 20.6 17.5 +18.3%
EBITDA margin % 17% 17% 16% +1%
NPATA 11.1 10.8 8.3 +33.3%
NPATA per share (cents) 9.2 9.0 6.9 +33.3%
For
per
sona
l use
onl
y

7
Full year 2014 results
Strong year on year organic revenue growth
despite a more than 50% decline in
Afghanistan revenues (USD5.8M churn).
Service revenues (ex. Afghanistan) up 15.5%
over 2013.
Equipment sales in line with historical trends
Very strong 38% growth in our wholesale
voice business as SpeedCast strengthens its
leadership in the Pacific region
US$mProforma
2014Proforma
2013Diff to
2013
Total revenue 121.5 111.3 +9.2%
Service Revenue (ex. Afghanistan) 88.0 76.2 +15.5%
Equipment revenue 12.5 12.7 (1.6%)
Wholesale VOIP 15.7 11.4 +37.7%
Service revenue (Afghanistan) 5.3 11.1 (52.3%)
For
per
sona
l use
onl
y

8
Pro forma revenue breakdown
51.2
63.4
76.2
88.0
2011 2012 2013 2014
Service Revenue (ex. Afghanistan)
Note: Amounts are in USD millions
Strong growth in recurring service revenue base
Maritime growth momentum with good backlog into 2015
Higher-than-usual churn in Australia due to difficulties in the
mining sector, but we expect the bulk of the churn to be behind
us. Natural Resources still grew 14% in 2014.
Enterprise service revenues grew as well double digit, pushed
by the Aeronautical vertical
Telecom services grew 8% as the implementation of a large
cellular backhaul project was slower than expected
Diversified revenue base by both industry and geography
High growth delivered in Maritime has resulted in Maritime
becoming our biggest vertical, ahead of Telecom
28%
30%
25%
13%
4%
Pro forma service revenue (excl. Afghanistan) by Geography
Maritime
Australia
Pacific Islands
Rest of Asia Pacific
EMEA & Others
28%
15%
9%
27%
16%
5%
Pro forma service revenue (excl. Afghanistan) by Vertical
Maritime
Natural Resources
Government
Telecommunications
Enterprise
Others
For
per
sona
l use
onl
y

9
Other operational highlights
Acquisition of Satcomms Australia (Perth teleport, Queensland
presence) and Oceanic Broadband (PNG focused)
Creation of the Energy division led by Keith Johnson, previously
President of the Energy division at Harris Caprock, and opening of our
Houston office
Development into High Throughput Satellites with a partnership
agreement with O3B and a distribution agreement with Inmarsat for
Global Xpress
Consolidation of our operations with recently acquired companies and
investment to upgrade the two newly owned teleports in Perth and Port
Moresby
For
per
sona
l use
onl
y

Full Year Financial Results
For
per
sona
l use
onl
y

11
Summary income statement
• Revenue $2.5M above IPO forecast
after adverse impact of change in FX
rates of $0.6M.
• D&A in line with IPO forecast. Slight
upside due to FX
• Net FX impact on EBITDA not material
due to natural hedge of foreign currency
revenues with foreign currency opex
costs.
• Net Finance costs in line with IPO and
Prior Year
• Effective tax rate at 24% compared with
28% in IPO forecast
• NPAT and net cash earnings (NPATA)
both $0.3M above IPO forecast
• Payment of a fully franked dividend of
AUD3.36 cents per share,
corresponding to 50% of 2H USD6.3M
NPATA.
CommentaryUS$m
Proforma2014
IPO Prospectus
2014
Proforma2013
Diff to2013
Revenue 121.5 119.0 111.3 +9.2%
EBITDA 20.7 20.6 17.5 +18.3%
EBITDA % 17% 17% 16% +1%
Depreciation (4.4) (4.5) (3.8)
Amortisation (5.9) (5.9) (5.9)
EBIT 10.4 10.2 7.8 +33.3%
Net finance costs (2.0) (2.0) (2.0)
Share of JV profits 0.2 0.3 0.3
Profit before tax 8.6 8.5 6.1 +41.0%
Income tax expense (2.1) (2.4) (2.5)
NPAT 6.5 6.1 3.6 +80.6%
Amortisation (after tax) 4.6 4.7 4.7
NPATA 11.1 10.8 8.3 +33.7%
For
per
sona
l use
onl
y

12
Reconciliation of pro forma statutory results
Commentary
US$m 2014 2013
Statutory NPAT (6.9) (15.6)
Pro forma impact of Acquisitions 0.4 2.2
Pro forma share of profit of Joint Ventures 0.1 0.3
Acquisition transaction costs 0.8 2.6
Non-recurring foreign exchange (gain)/loss (1.6) 5.8
Amortisation 2.0 7.1
Share based payments 1.2 -
Net finance costs adjustment 5.9 6.5
Public company costs (0.2) (0.8)
IPO transaction costs 6.8 -
Tax effect of pro forma adjustments (2.0) (4.3)
Pro forma NPAT 6.5 3.6
Add back: Amortisation (net of tax) 4.6 4.7
Pro forma NPATA 11.1 8.3
US$m 2014 2013
Statutory revenue 117.7 90.7
Pro forma impact of acquisitions 3.8 20.6
Pro forma revenue 121.5 111.3
• Represents the pre-acquisition revenue and NPAT of SatComms (acquired
effective 2 June 2014) and Oceanic (acquired effective 1 July 2014), and the
add back of a non-recurring salary arrangement with former owners of
Pactel.
• Acquisitions transactions costs - represents due diligence and other
transaction costs incurred by SpeedCast primarily in relation to SatComms
and Oceanic acquisitions.
• Non recurring foreign exchange gain - represents the pro forma add back of
a non-recurring foreign exchange realised gains primarily in relation to debt
held prior to the New Banking Facilities.
• Amortisation - represents the pro forma add back of historical amortisation
expense to exclude accelerated amortisation charges for acquired
trademarks and brand names following a rebranding of group companies to
SpeedCast.
• Share based payments - represents the pro forma difference between the
share based payments expense arising from the previous equity-settled
ownership based compensation scheme and the Long-term Incentive Plan
which commenced upon the IPO of SpeedCast, as if the LTIP had
commenced on 1 January 2014.
• Net finance costs adjustment - represents the pro forma add back of net
finance costs together with accelerated amortisation of borrowing costs on
the debt held prior to the New Banking Facilities, less the pro forma inclusion
of net finance costs on the New Banking Facilities, as if the New Banking
Facilities commenced on 1 January 2014.
• Public company costs - represents the pro forma inclusion of the incremental
costs that SpeedCast incurred as a public company, as if these costs were
being incurred from 1 January 2014
• IPO transaction costs - represents the pro forma add back of costs of the
IPO that were expensed to the income statement in accordance with
Australian Accounting Standards.
• Tax effect of pro forma adjustments. The pro forma effective tax rate for FY
2014 is 24%.
For
per
sona
l use
onl
y

13
Summary balance sheet
CommentaryUS$m 2014 2013
Cash 10.1 12.3
Trade & other receivables 23.7 17.3
Inventories 3.2 1.6
Total current assets 37.0 31.2
Investment in JV 0.1 -
PP&E 14.5 11.5
Deferred Tax Assets 2.2 1.3
Intangibles (including Goodwill) 52.7 61.7
Total Assets 106.5 105.7
Trade and other payables 31.9 26.9
Income tax payable 0.1 1.7
Other liabilities - 3.6
Total Current liabilities 32.0 32.2
Borrowings 41.4 44.6
Deferred Tax Liabilities 4.5 6.4
Total Liabilities 77.9 83.2
Net Assets 28.6 22.5
• At 31 December 2014, cash at bank was
$10.1M (2013 Pro forma: $4.2M)
• Net current assets were $5.0M at 31
December 2014 (2013: Net current liabilities
of $1.0M)
• The goodwill and intangibles balance
reduced by $7M due to changes in the FX
translation rate (primarily AUD:USD). $6.3M
was added in the period relating to the
acquisitions of SatComms & Oceanic.$8M of
amortization was charged in the period
including the accelerated write down
following the re-branding of previous
acquisitions to SpeedCast.
• Drawn debt was $41.6M at 31 December
2014, 69% of the committed facilities
available to the Group.For
per
sona
l use
onl
y

14
Summary cash flow statement
• Strong operating cash flow generation
• Investment in capex, including $6.2M
relating to growth
• Net debt at $31.5M at 31 December 2014,
including over $10.1M in cash.
• Leverage ratio at 1.5, well below target
range of 1.75 – 2.25
• Interest cover was 10.4 times in 2014
(2013: 8.8 times)
• Both capital management ratios are well
within the Group’s banking covenants.
CommentaryUS$m
Pro forma2014
Pro forma 2013
EBITDA 20.7 17.5
Non-Cash items in EBITDA 0.8 1.2
Change in working capital (2.4) 0.5
Operating free cash flow before capital expenditure 19.1 19.2
Acquisition of property, plant and equipment (6.7) (5.2)
Operating free cash flow after capital expenditure 12.4 14.1
Cash conversion ratio 60% 81%
Capital Management Ratios 2014 2013
Net debt US$31.5M US$32.3M
Leverage ratio* 1.5 1.8
Interest Cover# 10.4 x 8.8 x
* Net Debt/Pro forma EBITDA# Pro forma EBITDA / Net finance costs
For
per
sona
l use
onl
y

M&A Activities
For
per
sona
l use
onl
y

16
Acquisition of Geolink Satellite Services
Acquired Geolink Satellite Services (GSS) on 24
February 2015 for EUR7.4M. The transaction is
subject to regulatory approval in France.
GSS brings us service capabilities and
experience in over 20 African countries, as well
as expertise servicing the key energy and
maritime sectors
– The African continent is key for the Energy sector and is a gap in
SpeedCast capabilities
– SpeedCast is experiencing a growing number of requests for
services in Africa from our APAC customers
– The African continent continues to experience good VSAT growth
and thus represents a new potential source of growth for
SpeedCast.
Cost synergies expected, as well as significant
opportunities for revenue synergies
Acquisition is accretive to EPS in year 1 pre-cost
synergies
The transaction will be financed by existing debt
facility
Remote sites connected by Geolink across Africa
For
per
sona
l use
onl
y

17
Acquisition of Geolink Satellite Services
GSS generates EUR9.7M sales, focused on the African continent where the
company serves European and African Enterprise customers in over 20
countries.
Good customer base in key verticals: oil & gas, maritime, NGO/Government
Interesting expertise and technology servicing the media industry
Pool of L-band customers with candidates for VSAT upgrades
Track record of strong EBITDA growth over the past 3 years resulting from
improving network efficiency and migration of L-band customers to VSAT.
For
per
sona
l use
onl
y

Growth Strategy & Outlook
For
per
sona
l use
onl
y

19
Multiple levers driving sustainable growth
Unchanged growth focused strategy
Strong underlying fundamentals High growth end markets
Underlying market growth
Strategic acquisitions /
bolt-ons in a fragmented market
Highly fragmented markets Track record of M&A execution Cost and revenue synergies
Market share gains in targeted verticals Maritime Energy Partnerships with global telecom operators
Geographic and customer diversification /
penetration
Strong strategic position in Asia Pacific from which to grow Existing satellite coverage in Africa and Middle East—following
Asia -Pacific customers wherever they operate Aeronautical market taking off
Continued product innovation and value-added
services In-house product and software development capabilities Established partnerships with technology vendors
19
For
per
sona
l use
onl
y
20
2015 outlook
Reconfirm IPO prospectus forecast to 30 June 2015
Double-digit organic service revenue growth expected to be
sustained through 2015, driven by continued trends in Maritime and
emerging markets and initial gains in the Energy vertical following
some strong initial wins in the first two months of the year
Afghanistan revenue decline expected to slow down in 2015;
potential new opportunities in the Middle East
Year of building the foundations for strong market share gain in the
Energy sector in 2016 and beyond
Sustained double-digit EBITDA growth as a result of synergies and
continued operational leverage
Continued exploration of strategic M&A opportunities
For
per
sona
l use
onl
y

21
SpeedCast Vision
What SpeedCast will look like in three years time ?
Undisputed leader in satellite service provision in
the Asia Pacific region
Top 5 global player
Top 3 global maritime player
Top 3 global energy player
21
For
per
sona
l use
onl
y

22
Q&AF
or p
erso
nal u
se o
nly

Appendix
For
per
sona
l use
onl
y

SpeedCast Overview
For
per
sona
l use
onl
y

25
Designs, implements, integrates, operates and maintains predominantly satellite–based communication networks
Serves over 1,000 customers across over 3,000 terrestrial sites, predominantly in Asia Pacific, and approximately 1,700 offshore rigs and vessels with satellite services
Operates a communications network with global reach, comprised of leased space segment on 41 different satellites and utilizing 28 teleports
A leading operator in the Asia Pacific region and the global maritime industry — headquartered in Hong Kong
Focuses on tailored solutions to five customer segments: telecom, maritime, natural resources, government & NGO, and enterprise
Overview of SpeedCast
A leading provider of satellite-based communication networks and services in the Asia Pacific region and the global maritime industry
For
per
sona
l use
onl
y

26
Key highlights
Strong competitive position
5
A strong and sustainable competitive position
– Global network and infrastructure footprint and relationships
– Established brand and reputation
– Economies of scale
Strong track record of growth
2
A strong track record of revenue and earnings growth
– 30% FY2011-FY2014 pro forma EBITDA CAGR
High operating leverage and benefits from increasing scale
– Increase in EBITDA margins in FY2011 (11%) to FY2014 (17%)
Fragmented industry dynamics
4
SpeedCast operates in highly fragmented markets, comprised largely of providers focused on either specific countries or particular customer segments
SpeedCast considers that it is well positioned to benefit from future strategic acquisition opportunities as they arise
Demonstrated track record of successful
integration of acquisitions 3
Demonstrated ability to Successsfully integrate acquisitions and drive capability and scale benefits
– Three material acquisitions (ASC/Elektrikom/Pactel) in 2012 and 2013 and two small bolt-ons in 2014
Strong underlying fundamentals and high
growth end markets
1
Growing internet usage globally and additional bandwidth requirements
Increasing automation and sophistication of mission critical systems, emergence of the digital oil field
Growing focus from governments and international organisations to bridge the "digital divide"
Regulatory and operational requirements in maritime driving adoption of services
Highly experienced management team
6
Led by PJ Beylier, who has been with SpeedCast for 14 years, including 10 years as Chief Executive Officer
For
per
sona
l use
onl
y

27
Satellite service providers are a critical link in the
satellite industry value chain
Satellite service providers
Design, source, install, configure, integrate, operate and maintain the components required to provide a satellite communications solution to end users
Consumer market
customers
Satellite operators
Natural resources
Telecom EnterpriseBroadcasters
Distributors/ network
integrators
Government and NGO
Maritime
Pay-television platforms
Broadband platforms
Application developers
Equipment/ hardware
manufacturers
Fibre owners/ operators
Teleport owners/ operators
Technology vendors
End users
Satellite industry value chain
For
per
sona
l use
onl
y

28
Carrier grade, high quality global network
One of the largest buyers of satellite capacity in Asia Pacific. Bandwidth requirements are actively managed and scale drives significant operating efficiency.
41 satellites within our network
28 teleport locations
15 sales and support centers
Customers in over 60 countries
SpeedCast's satellite network, teleports and offices
28
For
per
sona
l use
onl
y

29
A focus on five key customer verticals
The common theme across verticals — increasing demand for data connectivity as the way businesses use technology changes
Telecom Maritime Natural
Resources
Government &
NGO
Enterprise
Example
customer
industries
ISPs
Telcos
Resellers
Shipping
Oil & Gas
Government
Yachting
Oil & Gas
Mining
Construction
Engineering
Military &
Defense
Emergency
services
Education
Rural
connectivity
Large
Enterprises
Banking sector
29
For
per
sona
l use
onl
y

Industry Growth Drivers
For
per
sona
l use
onl
y

31
Growing data connectivity requirements and low current VSAT penetration in the maritime sector point to sustained future growth.
Operational requirements
Regulatory requirements
Regular updates of electronic navigation maps
A communication tool to co-ordinate efforts to tackle piracy
On-board IT systems becoming more complex and remote controlling of ship functions growing
Older communication technologies cannot support applications such as video surveillance
Crew welfare
Access to broadband services for social media, entertainment and phone calls important to attract and retain new generation of seafarers
Maritime growth drivers
05,00010,00015,00020,00025,00030,00035,00040,00045,000
2010 2011 2012 2013 2014 2015 2016 2017 2018 2019 2020 2021 2022 2023
Ka-band
Ku-band
C-band
For
per
sona
l use
onl
y

32
Regional Network
Gateway
Broadband Satellite
Drilling Rig
Support
Vessel
Production
Platform
Remote Shore-
based Facility
Submarine
Fiber
Drilling RigLand
Mobile
Radio
Global
Teleport
Infrastructure
Turnkey Managed
Solutions
Corporate Office
Regional
Office
Mobile
Operations
OFFSHORE
LAND
Wireless /
Microwave
Internet Video Fax
PhoneCrew Infotainment
Converged Applications Onsite
Public
Telephone
System
Internet
Private
Networks
Global
Terrestrial
Network
Worldwide POPs
Energy vertical - emergence of the digital oil field
Video Surveillance
Above & Below Decks
Down-hole Drilling InformationRemotely operated
vehicles
Crew Infotainment & Training
Rig Of The Future
Ultra broadband (100Mbs+)
Every IP device connected
Real-time Remote Control
Increased Automation
Faster Decision making
Lower Operations Cost
Safer Work Environment
True end-to-end Communications
into a Managed Network
For
per
sona
l use
onl
y
33
Why energy ? –a powerful additional growth engine
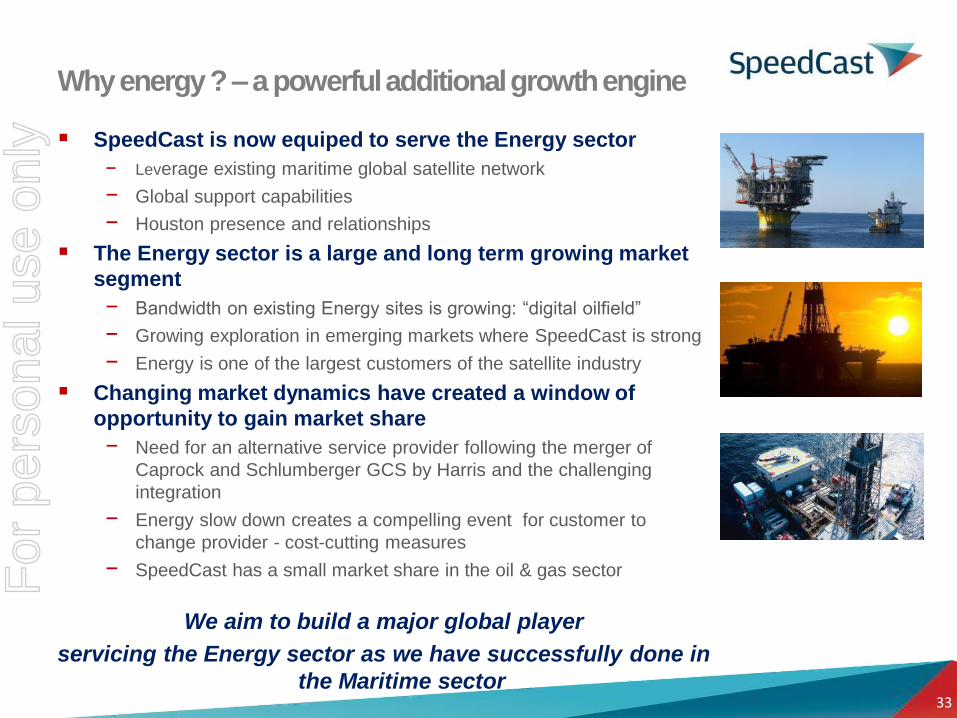
SpeedCast is now equiped to serve the Energy sector
− Leverage existing maritime global satellite network
− Global support capabilities
− Houston presence and relationships
The Energy sector is a large and long term growing market
segment
− Bandwidth on existing Energy sites is growing: “digital oilfield”
− Growing exploration in emerging markets where SpeedCast is strong
− Energy is one of the largest customers of the satellite industry
Changing market dynamics have created a window of
opportunity to gain market share
− Need for an alternative service provider following the merger of
Caprock and Schlumberger GCS by Harris and the challenging
integration
− Energy slow down creates a compelling event for customer to
change provider - cost-cutting measures
− SpeedCast has a small market share in the oil & gas sector
We aim to build a major global player
servicing the Energy sector as we have successfully done in
the Maritime sector
For
per
sona
l use
onl
y

34
Global enterprise VSAT trends
Global satellite enterprise VSAT market forecasted to
be a $6+ billion market in 2016 (includes equipment,
managed services, as well as services revenues.)
The enterprise VSAT market is growing faster than
most other segments of the telecom industry-
traditional telecom wireless and wireline networks and
mobile satellite L-Band solutions.
North American and European markets are mature and
maintain a predominately replacement growth rate,
while Asia-Pacific, Africa and the other world regions
are growing at a rapid rate. Asian Enterprise VSAT
sites growing at 8% CAGR.
Most major vertical markets for this industry are
seeing revenue growth; but maritime, oil and gas, and
cellular backhaul are seeing the most rapid growth.
NSR Broadband Satellite Markets 12th Edition
34
For
per
sona
l use
onl
y

35
Enterprise & emerging markets,
a sustainable growth engine
Major Growth Areas
Cellular backhaul
Satcoms outsourcing for global telcos
Emerging vertical segments: Aero & M2M
Connecting islands
Emerging Asian markets (Myanmar, Vitenam, Indonesia,…)
Geographic expansion – new frontiers (Africa, South America,…)
Trends Supporting Growth
Overall demand for increased bandwidth
Political stability and instability
Enterprise & Emerging Markets
Land revenues outside of maritime/resources
account for 57% of SpeedCast business and
provide a substantial growth opportunity
Aeronautical Satcom In-Service Units by Frequency Band
Source: NSR
For
per
sona
l use
onl
y

FX Analysis
For
per
sona
l use
onl
y
37
FX Analysis
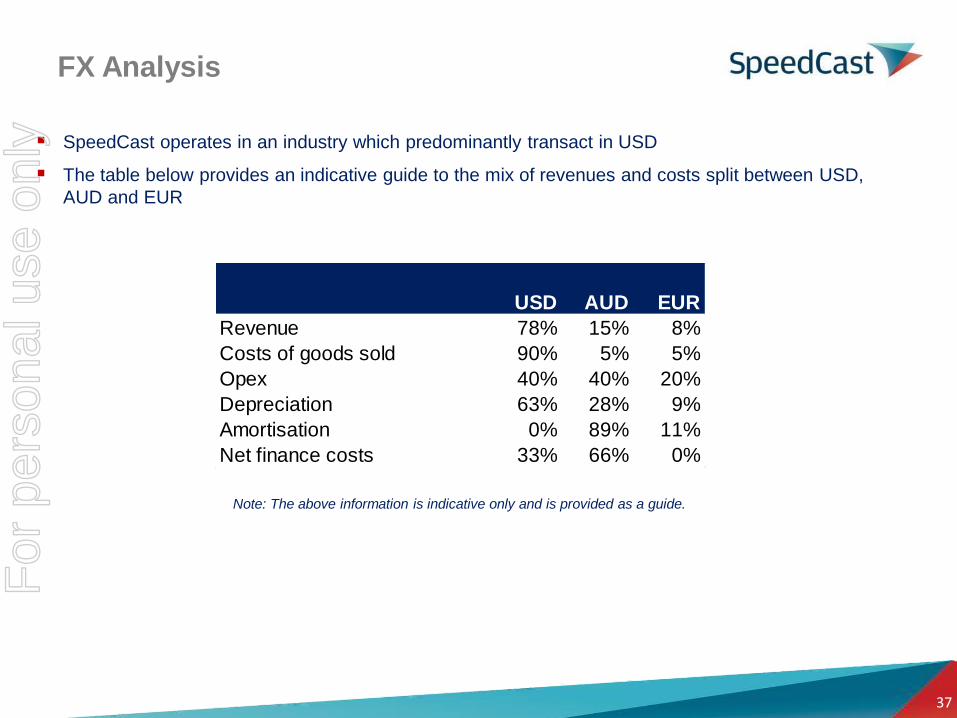
SpeedCast operates in an industry which predominantly transact in USD
The table below provides an indicative guide to the mix of revenues and costs split between USD,
AUD and EUR
Note: The above information is indicative only and is provided as a guide.
USD AUD EUR
Revenue 78% 15% 8%
Costs of goods sold 90% 5% 5%
Opex 40% 40% 20%
Depreciation 63% 28% 9%
Amortisation 0% 89% 11%
Net finance costs 33% 66% 0%
For
per
sona
l use
onl
y

Thank You
For
per
sona
l use
onl
y


