Page 1 Reporting Period 12 months to 31 July 2018 Previous Reporting Period 12 months to 31 July 2017 Amount (m’s) Percentage Change Revenue from ordinary activities NZ$20,438 6% Profit (loss) from ordinary activities after tax attributable to security holder 1 NZ$(196) (126)% Net profit (loss) attributable to security holders NZ$(221) (130)% 1 Net profit attributable to shareholders of the company is equivalent to profit from ordinary activities after tax attributable to shareholders of the company (as required to be disclosed pursuant to Clause 1.2 of Appendix 1 of the Fonterra Shareholders’ Market Listing Rules, and Clause 1.2 of Appendix 1 of the NZX Debt Market Listing Rules). Interim/Final Dividend Amount per Security Imputed Amount per Security No final dividend to be paid $0.00 $0.00 Record Date - Dividend Payment Date - Comments - To be followed by the balance of the information required in the report pursuant to Appendix 1 – Including the Net Tangible Asset amount per security for the current and previous reporting period. For personal use only
Transcript
Page 1
Reporting Period 12 months to 31 July 2018
Previous Reporting Period 12 months to 31 July 2017
Amount
(m’s) Percentage
Change
Revenue from ordinary activities NZ$20,438 6%
Profit (loss) from ordinary activities after tax attributable to security holder1 NZ$(196) (126)%
Net profit (loss) attributable to security holders NZ$(221) (130)% 1 Net profit attributable to shareholders of the company is equivalent to profit from ordinary activities after tax attributable to
shareholders of the company (as required to be disclosed pursuant to Clause 1.2 of Appendix 1 of the Fonterra Shareholders’ Market Listing Rules, and Clause 1.2 of Appendix 1 of the NZX Debt Market Listing Rules).
Interim/Final Dividend Amount per Security Imputed Amount
per Security
No final dividend to be paid $0.00 $0.00
Record Date -
Dividend Payment Date -
Comments -
To be followed by the balance of the information required in the report pursuant to Appendix 1 – Including the Net Tangible Asset amount per security for the current and previous reporting period.
For
per
sona
l use
onl
y
13 September 2018
FONTERRA ANNOUNCES FY18 ANNUAL RESULTS AND OUTLOOK FOR FY19 • Total Cash Payout for 2017/18 season: $6.79
o Farmgate Milk Price $6.69 per kgMS o Dividend of 10 cents per share
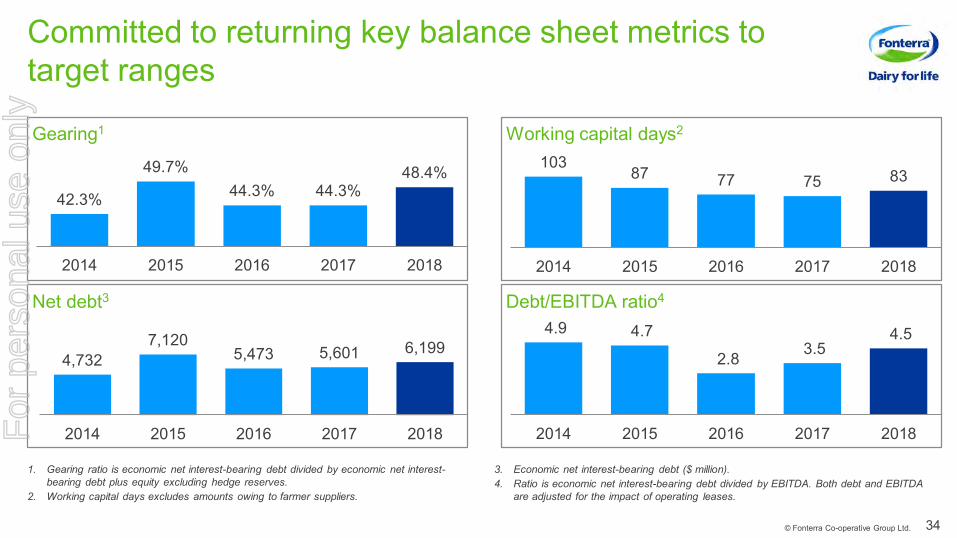
• New Zealand milk collections: 1,505 million kgMS, down 1% • Sales volumes: 22.2 billion Liquid Milk Equivalents (LME), down 3% • Normalised sales revenue: $20.4 billion, up 6% • Net loss after tax: $196 million • Normalised EBIT: $902 million, down 22% • Normalised gross margin: 15.4%, down from 16.9% • Return on capital: 6.3%, down from 8.3% • Normalised earnings per share: 24 cents • Gearing ratio: 48.4%, up from 44.3% • FY19 forecast Farmgate Milk Price: $6.75 per kgMS • FY19 forecast earnings per share range: 25-35 cents
* Non-GAAP measures. Information on the non-GAAP financial information used by Fonterra are found at the end of this document. Today Fonterra announces its FY18 annual results, the plan to improve its business performance and the outlook for FY19. The Co-operative reports a Net Loss After Tax of $196 million. Normalised EBIT was $902 million, down 22%, the Co-operative’s gearing ratio was up from 44.3% last year to 48.4% and return on capital was 6.3%, down from 8.3%. Fonterra CEO Miles Hurrell says the Co-operative’s business performance must improve. “There’s no two ways about it, these results don’t meet the standards we need to live up to. In FY18, we did not meet the promises we made to farmers and unitholders,” says Mr Hurrell. “At our interim results, we expected our performance to be weighted to the second half of the year. We needed to deliver an outstanding third and fourth quarter, after an extremely strong second quarter for sales and earnings – but that didn’t happen.” Mr Hurrell says that in addition to the previously reported $232 million payment to Danone relating to the arbitration, and $439 million write down on Fonterra’s Beingmate investment, there were four main reasons for the Co-operative’s poor earnings performance. “First, forecasting is never easy but ours proved to be too optimistic. Second, butter prices didn’t come down as we anticipated, which impacted our sales volumes and margins. Third, the increase in the forecast Farmgate Milk Price late in the season, while good for farmers, put pressure on our
For
per
sona
l use
onl
y
Fonterra Co-operative Group
Confidential to Fonterra Co-operative Group Page 2
margins. And fourth, operating expenses were up in some parts of the business and, while this was planned, it was also based on delivering higher earnings than we achieved. “Even allowing for the payment to Danone and the write down on Beingmate, which collectively account for 3.2% of the increase in the gearing ratio, our performance is still down on last year.” Mr Hurrell says when looking at the underlying performance of the business, which you can see in the normalised EBIT of $902 million, progress has been made in moving more milk into higher value products. “While sales volumes were down 3% in FY18, a larger proportion of milk was sold through Consumer and Foodservice and Advanced Ingredients. In fact, 45% of our sales volumes were through these businesses and this is up from 42% in FY17, despite the higher input-price environment. “Our Consumer and Foodservice business grew in all regions, except Oceania, with our strongest growth in Greater China. Of particular note, our Consumer business in China broke even this year, two years ahead of schedule. A big contributor to this success is the popularity of Anchor, which is now the number one brand of imported UHT milk in both online and offline sales in China. “Despite this progress, performance across the Co-operative was below our expectations. Based on this, the Board has decided to limit our dividend to just the 10 cents paid in April and has confirmed the final Farmgate Milk Price for the 2017/18 season at $6.69 per kgMS,” added Mr Hurrell. Plan to lift Fonterra’s business performance Mr Hurrell says these results are not just numbers – they’re the livelihoods of the Co-operative’s farmers and their families and the investment of unitholders. “There are people depending on us – farmers, unitholders and employees who want to be part of a successful Co-operative. We are putting in place a clear plan for how we are going to lift Fonterra’s performance. It relies on us doing a number of things differently. Fonterra’s Board and Management has outlined a plan based on three immediate actions: 1. Taking stock of the business – Fonterra will re-evaluate all investments, major assets and
partnerships to ensure they still meet the Co-operative’s needs today. This will involve a thorough analysis of whether they directly support the strategy, are hitting their target return on capital and whether it can scale them up and grow more value over the next two-three years. This will start with a strategic review of the Co-operative’s investment in Beingmate.
2. Getting the basics right – Fonterra has already begun taking action and fixing the businesses that are not performing. The level of financial discipline will be lifted throughout the Co-operative so debt can be reduced and return on capital improved.
3. Ensuring more accurate forecasting – the business will be run on more realistic forecasts
with a clear line of sight on potential opportunities as well as the risks. It will also be clear on its assumptions, so farmers and unitholders know exactly where they stand and can make the decisions that are right for them and their businesses.
Outlook for 2019 The forecast Farmgate Milk Price for the 2018/19 season is held at the $6.75 per kgMS Fonterra announced at the end of August and the Co-operative’s forecast earnings per share range for FY19 is 25-35 cents. At $6.75 per kgMS the forecast Farmgate Milk Price for the 2018/19 season is the third consecutive year of strong milk prices. That’s good for farmers and for rural economies where farmers spend 46 cents of every dollar they earn.
For
per
sona
l use
onl
y
Fonterra Co-operative Group
Confidential to Fonterra Co-operative Group Page 3
Chairman John Monaghan says the Co-operative is being clear with farmers and unitholders on what it will take for the Co-operative to achieve the forecast earnings guidance. “For the first time we are sharing some business unit specific forecasts. Among others, these see the Ingredients and Consumer and Foodservice businesses achieving an EBIT of between $850 million and $950 million, and between $540 million and $590 million, respectively.” “FY19 is about lifting the performance of our Co-operative. “We are taking a close look at the Co-operative’s current portfolio and direction to see where change is needed to do things faster, reduce costs and deliver higher returns on our capital investments. “This includes an assessment of all of the Co-operative’s investments, major assets and partnerships against our strategy and target return on capital. You can expect to see strict discipline around cost control and respect for farmers’ and unitholders’ invested capital. That’s our priority.” Click here to view Fonterra’s Annual Results presentation and Annual Report. Visit the Annual Results multimedia page to access B-roll and five short, downloadable audio grabs of Chairman John Monaghan, CEO Miles Hurrell and CFO Marc Rivers talking about aspects of this announcement. Non-GAAP financial information Fonterra uses several non-GAAP measures when discussing financial performance. These measures include normalised segment earnings, normalised EBIT, EBIT, normalisation adjustments and payout. These are non-GAAP financial measures and are not defined by NZ IFRS. Management believes that these measures provide useful information as they provide valuable insight on the underlying performance of the business. They are used internally to evaluate the underlying performance of business units and to analyse trends. These measures are not uniformly defined or utilised by all companies. Accordingly, these measures may not be comparable with similarly titled measures used by other companies. Non-GAAP financial measures should not be viewed in isolation nor considered as a substitute for measures reported in accordance with NZ IFRS. These non-GAAP measures are not subject to audit unless they are included in Fonterra’s annual financial statements. Definitions of the non-GAAP measures used by Fonterra, and reconciliations of the NZ IFRS measures to the non-GAAP measures can be found on page 106 and 107 of Fonterra’s Annual Report that is available on Fonterra’s website.
For further information contact: Fonterra Communications 24-hour media line Phone: +64 21 507 072 About Fonterra
We’re a global dairy nutrition company owned by 10,000 farmers and their families. We’ve built our expertise on the legacy of the thousands of farmers who’ve made New Zealand a world leader in dairy. With a can-do attitude and a collaborative spirit, we’re a world leading dairy exporter. Our 22,000 people share the goodness of dairy nutrition with the world through our innovative consumer, foodservice and ingredient solutions brands, and our farming and processing operations across four continents.
If you no longer wish to receive media releases from Fonterra, please click here to opt out.
1 Includes Intangibles and Equity Accounted Investments
million kgMS
Normalised Earnings Per Share
24 cents
Return on Capital1
6.3%
per
For
per
sona
l use
onl
y
02Day in the life of our Co-operativePage 02
14Letter from our Chairman Page 14
Letter from our CEO Page 16
Making change, with purpose Page 18
Our Ambition Page 20
Where they know us Page 22
Our year in review Page 24
26Healthy environments and strong communities Page 26
Nutrition – what we sell Page 28
Environment Page 30
Community Page 32
34Co-operative solutions Page 34
Working for our farmers Page 36
Farmer spotlightPage 38
Honour Roll for Milk Quality ExcellencePage 40
CONTENTS
Our
Sto
ries
Our
Co-
oper
ativ
e
Our
Sus
tain
abili
ty
Our
Far
mer
s
Font
erra
use
s sev
eral
non
-GA
AP
mea
sure
s whe
n di
scus
sing
fi na
ncia
l per
form
ance
. Th
ese
mea
sure
s inc
lude
nor
mal
ised
seg
men
t ear
ning
s, no
rmal
ised
EBI
T, EB
IT, n
orm
alis
atio
n ad
just
men
ts a
nd p
ayou
t. Th
ese
are
non-
GA
AP
fi nan
cial
mea
sure
s and
are
not
defi
ned
by
NZ
IFRS
. Man
agem
ent b
elie
ves t
hat t
hese
mea
sure
s pro
vide
use
ful i
nfor
mat
ion
as th
ey
prov
ide
valu
able
insi
ght o
n th
e un
derly
ing
perf
orm
ance
of t
he b
usin
ess.
They
are
use
d in
tern
ally
to e
valu
ate
the
unde
rlyin
g pe
rfor
man
ce o
f bus
ines
s uni
ts a
nd to
ana
lyse
tren
ds.
Thes
e m
easu
res a
re n
ot u
nifo
rmly
defi
ned
or u
tilis
ed b
y al
l com
pani
es. A
ccor
ding
ly, t
hese
mea
sure
s m
ay n
ot b
e co
mpa
rabl
e w
ith s
imila
rly ti
tled
mea
sure
s us
ed b
y ot
her c
ompa
nies
. N
on-G
AA
P fi n
anci
al m
easu
res
shou
ld n
ot b
e vi
ewed
in is
olat
ion
nor c
onsi
dere
d as
a
subs
titut
e fo
r mea
sure
s re
port
ed in
acc
orda
nce
with
NZ
IFRS
. The
se n
on-G
AA
P m
easu
res
are
not s
ubje
ct to
aud
it un
less
they
are
incl
uded
in F
onte
rra’
s an
nual
fi na
ncia
l sta
tem
ents
.
Plea
se re
fer t
o pa
ge 10
6 fo
r the
reco
ncili
atio
n of
the
NZ
IFRS
mea
sure
s to
the
non-
GA
AP
mea
sure
s an
d pa
ge 10
7 fo
r defi
niti
ons
of th
e no
n-G
AA
P m
easu
res
used
by
Font
erra
.
For
per
sona
l use
onl
y
42Employee spotlight Page 42
Our Board Page 44
Our Management Team Page 46
48Group fi nancial metrics Page 48
Group Overview Page 50
Ingredients Page 54
Consumer and Foodservice Page 56
China Farms Page 60
Historical Financial Summary Page 62
70Corporate Governance Page 70
84Summary Financial StatementsPage 84
108DirectoryPage 108
Our
Peo
ple
Our
Per
form
ance
Our
Cor
pora
te G
over
nanc
e
Our
Dire
ctor
y
Our
Fin
anci
al S
umm
ary
For
per
sona
l use
onl
y
OUR STORY STARTS HERE
FONTERRA ANNUAL REPORT 201802
For
per
sona
l use
onl
y
P R O D U C T I O N
1,505m kgMS
Our home is New Zealand, where we’ve been dairy farming for almost 150 years. Our location makes us unique. We’re the first country to see the sunrise every morning and we’re one of the best places to produce dairy in the world.
Our grass fed farming model puts New Zealand dairy in high demand around the world. This year, our 10,000 farming families produced 1,505 million kilograms of milk solids (kgMS).
FA
RM
40
93
1 S
TR
AT
FO
RD
, T
AR
AN
AK
I
Matt and Kathryn Roberts
Farmer ow
ners since 2008
FONTERRA ANNUAL REPORT 2018 03
For
per
sona
l use
onl
y
About half of every dollar a farmer earns is spent in their local community.
H E L P I N G T H E C O M M U N I T Y
Our farmers’ hard work makes a significant contribution to regional New Zealand and to the national economy. This year, our farmers earned $6.69 for every kilogram of milk solids they produced.
F A R M G A T E M I L K P R I C E
$6.69 kgMS
46cents
per
FA
RM
34
41
0
SO
UT
HE
RN
S
OU
TH
LA
ND
Scott McKenzie, G
reenbush Farm
Farmer ow
ners since July 2008
FONTERRA ANNUAL REPORT 201804
For
per
sona
l use
onl
y
FA
RM
71
28
4
PU
KE
KO
HE
Steve and Catherine Liefting, farm
er owners since 2012,
their son Drew
is pictured here
FA
RM
79
14
9 R
EP
OR
OA
Luana and AJ Axtens
Farmer ow
ners since 1999
FONTERRA ANNUAL REPORT 2018 05
For
per
sona
l use
onl
y
Our country’s environment is precious and a big part of our national identity. Along with our farmers, Fonterra wants to leave things better than we found them for generations to come.
That’s why we’ve signed a pledge, committing to make New Zealand rivers swimmable for our children and grandchildren. It’s also why we have a pathway mapped out with the New Zealand Government to achieve net zero emissions across our manufacturing sites by 2050 and climate neutral growth for on-farm emissions in New Zealand by 2030 from a 2015 baseline.
% O F F O N T E R R A F A R M E R S
W H O R E P O R T O N N I T R O G E N
20
18
20
17
20
16
20
15
20
14
20
13
34
59
76
86
95 9
7
FONTERRA ANNUAL REPORT 201806
For
per
sona
l use
onl
y
LI
VI
NG
WA
TE
R
TA
RA
NA
KI
Now
ell’s Lakes in Taranaki are a signifi cant w
etland on one of our W
hareroa farms and are m
anaged as a joint Fonterra/Com
munity project
FA
RM
47
87
0P
AT
OK
A, H
AW
KE
S B
AY
Nick D
awson
Farmer ow
ner since 2004
FONTERRA ANNUAL REPORT 2018 07
For
per
sona
l use
onl
y
We add the most value possible to our farmers’ milk. Since the 2016 financial year, we’ve invested in eight new, resource-efficient plants and lines that have increased our ability to process more volumes of milk into consumer and foodservice products.
C O M M I S S I O N E D / D U E T O B E C O M M I S S I O N E D
FY16 New sliced cheese at Eltham
FY17 New UHT line at Waitoa
FY18New cream cheese and mini dish butter at Te RapaTwo new UHT lines at Waitoa
FY19 New cream cheese plant at DarfieldThird mozzarella line at ClandeboyeNew butter line commissioned at Edgecumbe to meet global demand
DA
RF
IE
LD
PL
AN
T C
AN
TE
RB
UR
Y
Our advanced plant at D
arfield started production this year and is set to m
anufacture 24,000 M
T of cream cheese annually
FONTERRA ANNUAL REPORT 201808
For
per
sona
l use
onl
y
WA
IT
OA
UH
T P
LA
NT
WA
IKA
TO
Waitoa U
HT can pack 14 containers
per day which are shipped to C
hina, Taiw
an and the Philippines
FONTERRA ANNUAL REPORT 2018 09
For
per
sona
l use
onl
y
We provide great nutrition through well-known brands like AnchorTM and MainlandTM. At Fonterra we really do believe that dairy makes a difference to people’s lives.
Our Fonterra Milk for Schools programme operates in more than 70% of all New Zealand primary schools.
F O N T E R R A M I L K F O R S C H O O L S
70%
FONTERRA ANNUAL REPORT 201810
For
per
sona
l use
onl
y
TA
UW
HA
RE
SC
HO
OL
HA
MIL
TO
N
Richie McCaw
helping with recycling
Fonterra Milk for Schools packs
FONTERRA ANNUAL REPORT 2018 11
For
per
sona
l use
onl
y
About 95% of our farmers’ milk is exported from New Zealand. It’s used by customers and consumers in so many ways.
By taking New Zealand milk to the world our farmers are helping contribute about $8 billion back into the New Zealand economy every year.
M I L K E X P O R T S
95%
FONTERRA ANNUAL REPORT 201812
For
per
sona
l use
onl
y
SH
AN
GH
AI
Our A
nchor TM UH
T milk
is a popular everyday nutritional drink in China
NI
GE
RI
A
Our aff ordable, vitam
in-enriched m
ilk powder is ideal
for markets such as N
igeria w
here daily income is low
and aff ordability is param
ount
FONTERRA ANNUAL REPORT 2018 13
For
per
sona
l use
onl
y
We haven’t met all of the commitments we’ve made to our farmers and unit holders this year. It’s not the fi rst time, but we’re determined to make sure it is the last.
Before we talk about the future, let’s look at the commitments we have met.
The $6.79 total payout is the third highest in the last decade. It represents more than $10 billion paid to our farmers and a much-needed cash injection into our rural communities.
Our Consumer business in China broke-even for the fi rst time, two years ahead of expectation.
This year, 45% of our farmers’ milk went into higher-value products, such as medical nutrition products, cooking creams and fl avoured milk with 40% less added sugar.
With the support of our Co-op’s Sustainable Dairying Advisors, 1,011 farms now have a Farm Environment Plan to help improve environmental outcomes.
Our Global Operations business has committed to net zero emissions across our manufacturing sites by 2050 to help New Zealand meet its climate change commitments.
More than 140,000 primary school children received free milk through our Milk for Schools programme every school day this year.
We can be proud of those achievements, while acknowledging that we didn’t get everything right.
The previously reported $232 million in payments related to our arbitration with Danone, following the 2013 WPC80 precautionary recall, took 10 cents off our earnings guidance.
Beingmate’s unacceptable performance over the year has been frustrating.
The value of our Beingmate investment is now $204 million. Beingmate has recently appointed a new, independent General Manager and announced a modest net profi t at its half year fi nancial result. We know our farmers and unitholders expect a return on capital on every investment and we continue to work closely with the team in China to get the best possible result for the Co-op.
Our farmers rely on accurate forecasting when planning within their own businesses. Our decision to update our earnings guidance and reduce our 2017/18 forecast Farmgate Milk Price late in the year was frustrating but necessary to protect the balance sheet.
In hindsight, our second half year earnings forecast was too bullish. We had just completed one of our best single quarter performances and your Board and senior management pushed the business to repeat that eff ort in the last two quarters. We simply didn’t deliver across almost every part of the business.
Better accuracy in our earnings forecasts is an obvious priority for us in 2019.
Leadership changesIn March, we announced that CEO Theo Spierings would leave the Co-op. It’s a conversation that the Board had been having with Theo for a few months and we agreed that after seven years it was the right time for Theo to move on.
LETTER FROM THE CHAIRMAN
There’s a saying in sport that you’re only as good as your last game. This year’s result tells us we have plenty to work on to make the grade.
Meeting our commitments
John Monaghan
Chairm
an
FONTERRA ANNUAL REPORT 201814
For
per
sona
l use
onl
y
Theo leaves us as a friend of Fonterra. Under his leadership we have a built a China business with an annual revenue of $4 billion, our Foodservice business - which was in its infancy when Theo took over - is now in total a $2 billion a year operation, and we have new partnerships with the world’s biggest online sellers, including Alibaba.
John Wilson’s decision to stand down as Chairman after a health scare and to retire from the Board in November was unexpected, but ultimately the right decision for John, Belinda and their family.
John has made an important contribution to the New Zealand dairy industry over more than 20 years. He’s worked tirelessly on behalf of his fellow farmers within the Co-op and defended our corner on regular trade missions and policy discussions across the fi elds of science, innovation, and environmental sustainability.
Looking ahead to FY19These changes in leadership have given us cause to take stock of where we are as a Co-op. At its core, our business is in good heart. But we can always do better and it’s time for a refresh in a number of areas.
We are taking a close look at the Co-op’s current portfolio and direction to see where change is needed to do things faster, reduce costs, and deliver higher returns on our capital investments.
This includes an assessment of all of the Co-op’s investments, major assets and partnerships against our strategy and target return on capital. An investment we are currently looking at all options on is Beingmate in China.
We have reduced the number of Board working groups to focus our eff ort on guiding, challenging and mentoring the senior management team. They in turn will be taking more accountability for the day-to-day delivery of performance.
Our $6.75 per kgMS forecast Farmgate Milk Price for the 2018/19 season is the third consecutive year of strong milk prices. That’s good for farmers and for rural economies where farmers spend 46 cents of every dollar they earn. For our business, it means another year of higher input costs and that is refl ected in our FY19 earnings guidance of 25 – 35 cents.
We will continue to focus on our strategy of moving more milk into higher value products. You can also expect to see strict discipline around cost control and more respect for our farmers’ and unitholders’ invested capital.
Our Co-op has a proud history. It’s built off the back of the hard graft and quality milk of the farming families that own it, and by the team of people that turns up to work each day to do its best by those families, maximising the value of their milk.
Your Board and Management know that we need to do a better job at holding up our end.
That’s our priority.
John Monaghan
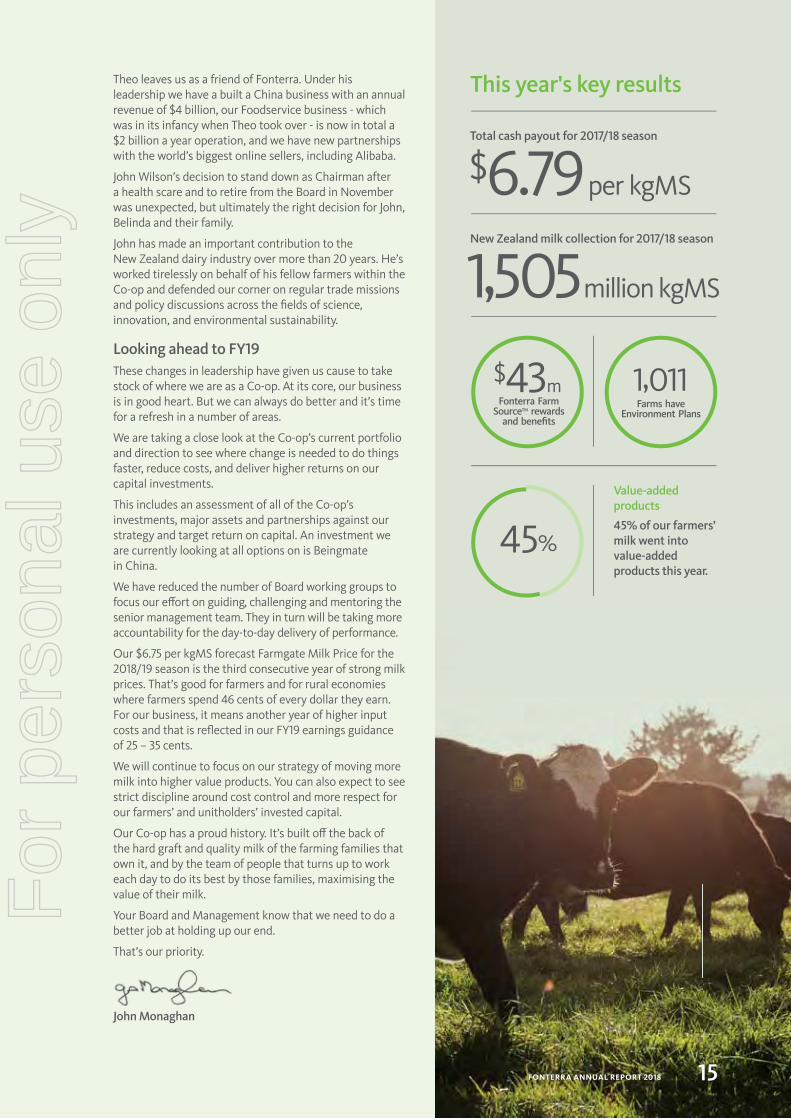
This year's key results
Total cash payout for 2017/18 season
$6.79 per kgMS
New Zealand milk collection for 2017/18 season
1,505 million kgMS
$43mFonterra Farm
SourceTM rewards and benefi ts
1,011Farms have
Environment Plans
45% of our farmers’ milk went into value-added products this year.
There’s no two ways about it, these results are disappointing and they simply don’t meet the promise we made. I would like to briefl y answer three questions to help explain what went wrong, highlight where things are going well and, most importantly, step through what we will be doing diff erently in FY19.
Where did we get it wrong?We entered the second half of this year expecting our performance to be weighted to the second half. The reality is, for this to have happened we needed to deliver an outstanding third and fourth quarter after what had been an extremely strong second quarter for sales and earnings. Unfortunately, this didn’t eventuate.
Forecasting is never easy, but ours wasn’t on the mark and proved to be optimistic. Butter prices didn’t come down as we anticipated, which impacted our sales volumes and margins. The increase in the forecast Farmgate Milk Price late in the season, while good for farmers, put pressure on our margins. And our operating costs went up because of higher costs in our Ingredients business, including some one-off s. We also had additional costs for new category growth and higher costs in Australia as we expanded our business. In addition, we had higher IT and R&D expenditure to support future development. While we had planned for these costs to be up in FY18, we had also planned for our earnings to be higher.
All of this happened in a year which was already challenging because of the $232 million payment to Danone and the $439 million write down of our investment in Beingmate.
If we hadn’t had these one-off events our performance would still have been down on last year but not by as much. It’s for this reason we look at our normalised EBIT of $902 million – it gives us a more meaningful comparison of our operating performance to compare one year to another.
Where did we get it right?When we look at our normalised EBIT and the underlying performance of our business we can see progress has been made in putting more of our farmers' milk into higher value products. Not as much as we wanted but still defi nite progress.
Sales volumes were down 3% in FY18 but what is promising is that a larger proportion was sold in Consumer, Foodservice and Advanced Ingredients – our value-add businesses where we get higher gross margins. In fact, 45% of the milk we sold was through these businesses and this is up from 42% in FY17.
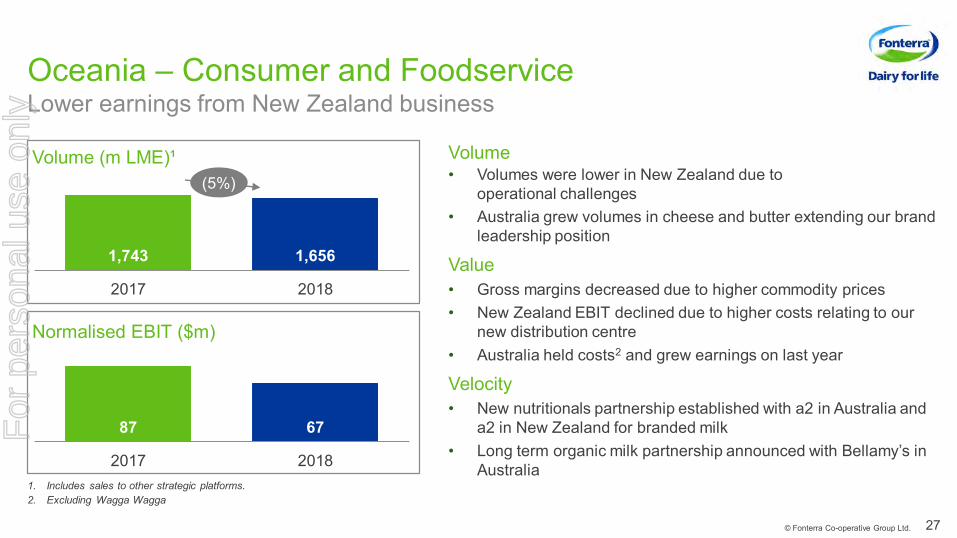
Consumer volumes were broadly fl at, but Foodservice volumes were up 6% and across the two we added an additional 131 million litres of Liquid Milk Equivalent (LME). The slowdown in growth we saw in FY18 was mainly due to higher prices, selling less butter and more cream in Foodservice and the underperformance of our New Zealand Consumer business.
We grew our businesses in all other regions with our strongest growth in Greater China. In fact, our Consumer business in China broke even this year, two years ahead of our original seven-year target.
I’m going to get straight to the point, we have not delivered on the commitments we made to farmers and unitholders in the 2018 fi nancial year (FY18). The headline fi nancial numbers speak for themselves.
Improving our performance
Miles H
urrellC
hief Executive Offi cer
FONTERRA ANNUAL REPORT 201816
For
per
sona
l use
onl
y
A big contributor to this success is the sheer popularity of AnchorTM, both online and offl ine, as a trusted brand of premium dairy.
Higher ingredient prices saw Consumer and Foodservice’s input costs increase by $626 million. Through our pricing strategies and brand strength we were able to pass through $551 million of these costs in our products’ prices – so, while it was not the full amount, it was still signifi cant. We always need to be mindful in our pricing that there is a limit to what customers and consumers are prepared to pay before they start looking at cheaper alternatives to dairy and other supply sources.
What’s next?I’ve had a hard look at our performance from the last fi ve years. While our Farmgate Milk Price has improved, many of our measures are not tracking in the right direction. You can see this on page 48 and 49 in this report.
One of the reasons I took on this job is because I understand these results aren’t just numbers – they’re the livelihoods of our farmers and their families. There are people depending on us and I want to contribute to their lives.
I’m committed and energised to turn these results around – and so too is my team. I’ve set out a clear plan for how we are going to lift our performance. It relies on us doing the following:
1. Taking stock of the business – We will re-evaluate all investments, major assets and partnerships, including our Beingmate investment, to ensure they still meet the Co-operative’s needs today. This will involve a thorough analysis of whether they directly support the strategy, are hitting their target return on capital and whether we can scale them up and grow more value over the next two to three years.
2. Getting the basics right – We have already begun getting on and fi xing the businesses that are not performing. The level of fi nancial discipline will be lifted throughout the Co-operative so debt can be reduced and return on capital improved.
3. Ensuring more accurate forecasting – The business will be run on realistic forecasts with a clear line of sight on potential opportunities as well as the risks. We will also be more transparent in our assumptions so farmers and unit holders know exactly where they stand and can make the decisions that are right for them and their businesses.
We have a lot of work ahead of us and a lot of ground to make up. But that is my job for 2019 and I, along with my team, will do everything in my control to make that happen.
Miles Hurrell
Key performance metrics
China Consumer broke even this year, two years ahead of original seven-year plan.
Net Loss After Tax
$196 million
Normalised EBIT
$902 million
Net Debt/EBITDA ratio
4.5 up from 3.5
Normalised operating expenses
$2,496 million
22%
7%
down from 16.9%
Normalised gross margin
15.4%down from
8.3%
Return on Capital
6.3%
FONTERRA ANNUAL REPORT 2018 17
For
per
sona
l use
onl
y
“ We do not have a purpose statement that expresses our reason for being and the diff erence we make. We need a true north that connects and provides a sense of belonging and inspiration for the diverse people that make up our Co-operative.” – Duncan Coull
From many angles – shareholder, council, board and management – it became clear we needed to take stock on the future direction of our Co-op. So we have been working hard, together, to define our purpose and vision for Fonterra’s next stage, focussing on a simple challenge:
OUR CO-OPERATIVE
Farmer Shareholders Richard Cookson, WaikatoPaul Marshall, FiordlandRichard Stalker, North CanterburyJudy Garshaw, PukekoheSheree Ditchfield, Southland Rachel Haddrell, Maungaturoto (also a Fonterra employee)
Fonterra EmployeesTui Williams, Team Leader, Farm Source™ StoresRachel Irwin, Farmer Engagement SpecialistTeresa Smyth, Group Marketing Manger, IdentityWendy Paul, Director, Advocacy Tom Newitt, Manager, Sustainable TransformationAlison Brewer, General Manager, Shareholders' Council
Who’s making this happen for us
Making change, with purpose
18
For
per
sona
l use
onl
y
Who we have spoken toPeople we have engaged with to gain insights into "why we exist".
• My Connect Conference
• Online survey• 200+ regional
meetings all around the country
• Young Farmers Forum
• Understanding Your Co-operative
• Dairy Women's Network (SI)
• Ma-ori shareholders
Over 2,000 farmers via:
• An online global survey
Over 3,300 global employees via:
+ industry bodies and other key stakeholders
customers160+
NZ Public via RepZ
700+Plus previous insights from:
• We have tested our initial six Purpose Themes with 235 diverse people
• We have narrowed down to a few options• These will be tested widely in
September and October• We plan to launch our new Purpose
before the end of 2018
Process and key milestones from here
• Shareholders' Council• Board
Governance:• Fonterra
Management Team
What gets you up in the morning?
What makes you feel inspired?
What makes you feel you belong somewhere or to something?
What is the legacy that you want Fonterra to create?
• Togetherness• People• Land
• Care• Future
We exist to: 1. Support our farmers and rural communities.2. Create a sustainable dairy industry.3. Contribute to a better world for
myself, my family, my children.4. Be part of successfully taking New Zealand
dairy to the world.
Questions we asked
We heard our new Purpose must refl ect
Top answers we heard
19FONTERRA ANNUAL REPORT 2018
For
per
sona
l use
onl
y
SustainableCo-opImproving health and nutrition, creating prosperity for our farmers and communities, and achieving a healthy environment.
InnovativeCo-opPreparing to lead in the face of fast-moving trends, sudden swings in customer behaviour and unprecedented changes in technology.
Focussed on achieving our ambitionWe do this through our strategy of converting more milk into higher returning products. We are working towards three horizons and have made progress on all three this year.
GR
OW
TH
OUR CO-OPERATIVE
StrongCo-opContinuing our eff orts to remain a Strong Co-op. This earns us the right and means to invest for our future.
paid to farmers for the 2017/18 season, includes Farmgate Milk Price and Dividend.
$10.3billion
FONTERRA ANNUAL REPORT 201820
For
per
sona
l use
onl
y
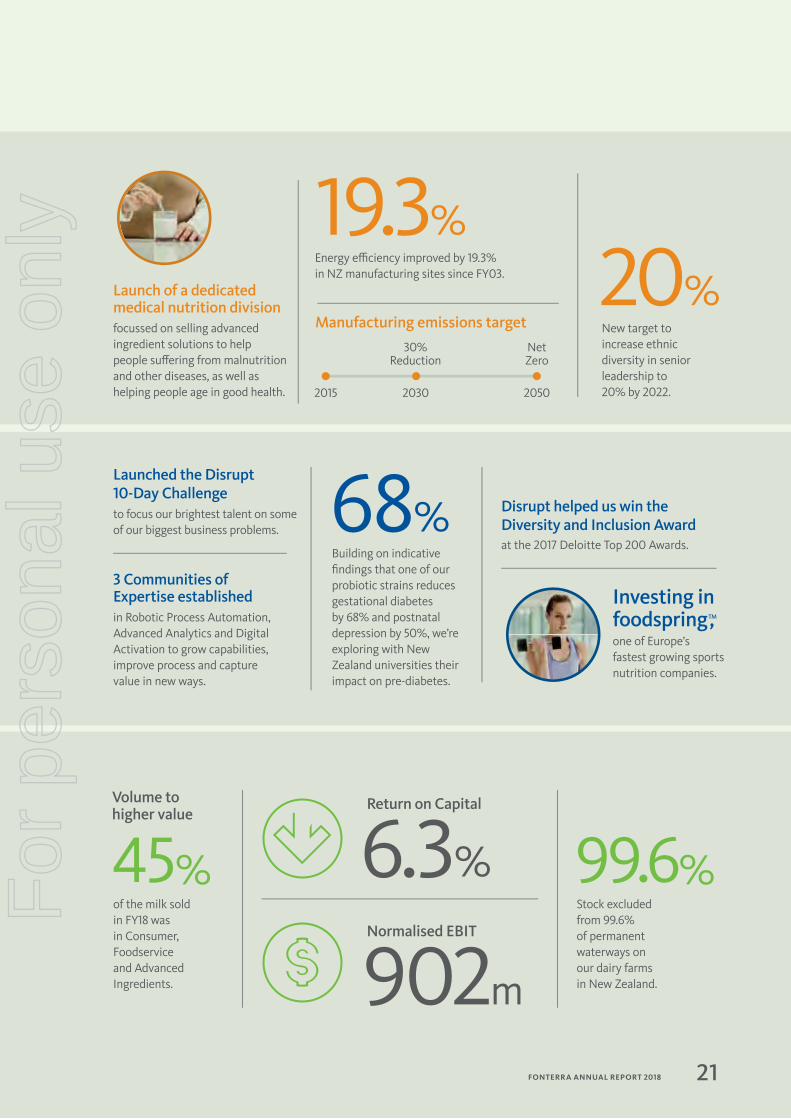
one of Europe’s fastest growing sports nutrition companies.
Investing infoodspringTM,
Launched the Disrupt 10-Day Challenge to focus our brightest talent on some of our biggest business problems.
3 Communities of Expertise established in Robotic Process Automation, Advanced Analytics and Digital Activation to grow capabilities, improve process and capture value in new ways.
Launch of a dedicated medical nutrition division focussed on selling advanced ingredient solutions to help people suff ering from malnutrition and other diseases, as well as helping people age in good health.
New target to increase ethnic diversity in senior leadership to 20% by 2022.
20%
19.3%Energy effi ciency improved by 19.3% in NZ manufacturing sites since FY03.
2015 2050
Net Zero
2030
30% Reduction
Manufacturing emissions target
Stock excluded from 99.6% of permanent waterways on our dairy farms in New Zealand.
Volume to higher value
Normalised EBIT
902m
Return on Capital
6.3%of the milk sold in FY18 was in Consumer, Foodservice and Advanced Ingredients.
45%
Building on indicative fi ndings that one of our probiotic strains reduces gestational diabetes by 68% and postnatal depression by 50%, we’re exploring with New Zealand universities their impact on pre-diabetes.
Disrupt helped us win the Diversity and Inclusion Award at the 2017 Deloitte Top 200 Awards.
68%
99.6%
FONTERRA ANNUAL REPORT 2018 21
For
per
sona
l use
onl
y
92Employees
$793 MillionRevenue
United States
4,003Employees
$2.27 Billion Revenue
7 Manufacturing Sites
Latin America(Chile, Brazil, Venezuela)
$793m
OUR CO-OPERATIVE
Where they know usFrom the South Pacifi c, we sell dairy products and ingredients to 138 markets around the world.To stay ahead on the global stage we need our farmers' high quality milk, kiwi ingenuity, breakthroughs in dairy nutrition, a great team and the scale to punch above our weight. It can be tricky from New Zealand to make it internationally but we’ve managed to do it and this means we can take our farmers’ milk to the world and bring the value back home.
$2.27b
Markets we export to.
$20.4b
Total Revenue
22,358Total Employees
FONTERRA ANNUAL REPORT 201822
For
per
sona
l use
onl
y
12,298Employees
$2.08 Billion Revenue
30 Manufacturing Sites
New Zealand
1,697Employees
$3.98 Billion Revenue
7 Farms
China
1,432Employees
$1.84 Billion Revenue
7 Manufacturing Sites
Australia
2,392Employees
$5.68 Billion Revenue
4 Manufacturing Sites
Rest of Asia
136Employees
$681 Million Revenue
1Manufacturing Site
Europe
$1.84b
$2.08b
$3.98b
$5.68b
$681m
5.68
$3.12b
Rest of World
308Employees
$3.12 Billion Revenue
2 Manufacturing Sites
FONTERRA ANNUAL REPORT 2018 23
For
per
sona
l use
onl
y
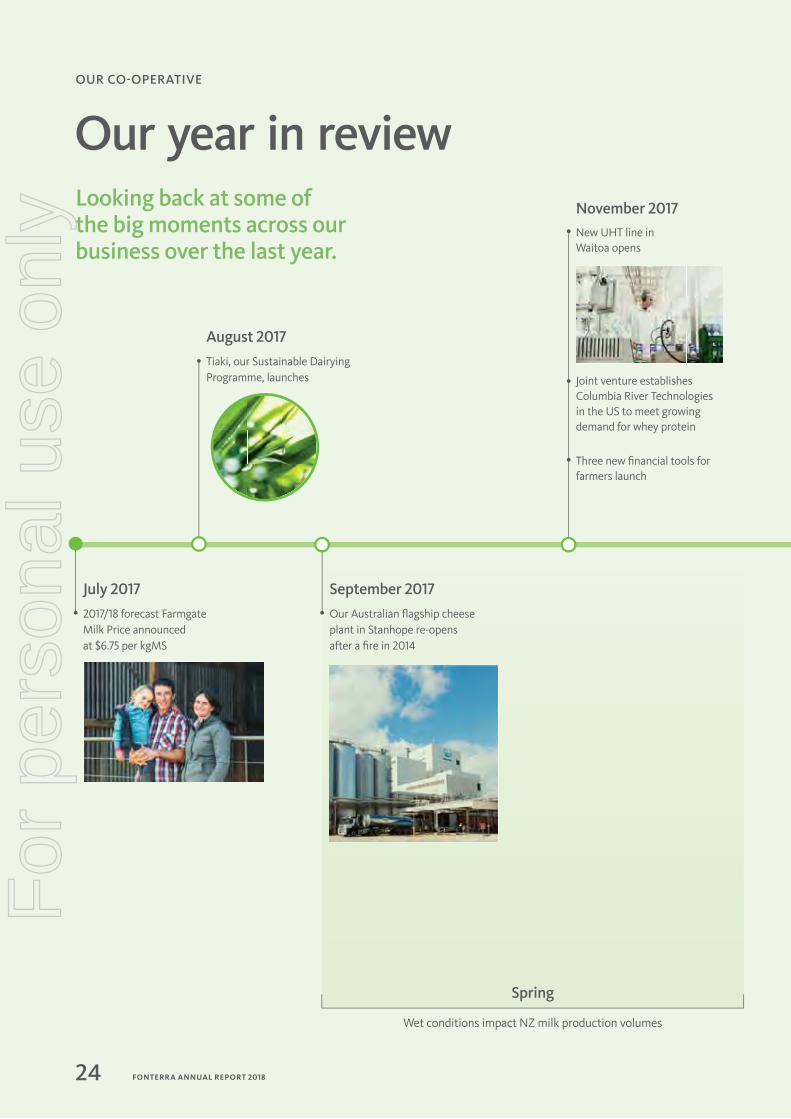
OUR CO-OPERATIVE
Our year in reviewLooking back at some of the big moments across our business over the last year.
November 2017New UHT line in Waitoa opens
Joint venture establishes Columbia River Technologies in the US to meet growing demand for whey protein
Three new fi nancial tools for farmers launch
July 20172017/18 forecast Farmgate Milk Price announced at $6.75 per kgMS
September 2017Our Australian fl agship cheese plant in Stanhope re-opens after a fi re in 2014
August 2017Tiaki, our Sustainable Dairying Programme, launches
Spring
Wet conditions impact NZ milk production volumes
FONTERRA ANNUAL REPORT 201824
For
per
sona
l use
onl
y
February 2018Number of properties impacted by the spread of Mycoplasma bovis increases
Hema Dairy Fresh Milk hits the shelves of Alibaba’s retail stores in China to meet rising demand for premium fresh products
Partnership with the a2 Milk Company forms the basis of our fi rst commercial production of a2 milk™
May 2018Construction begins on new Brightwater co-fi red wood biomass burner
2017/18 forecast Farmgate Milk Price raised to $6.75 per kgMS
August 20182017/18 forecast Farmgate Milk Price revised down to $6.70 per kgMS and indicated full year dividend likely to be the 10 cents already paid
July 2018New butter line at Edgecumbe to meet global consumer demand
March 2018Investment in Beingmate downgrade and 10 cent interim dividend announced
Fonterra Milk for Schools celebrates its fi fth year and 100 million packs of milk enjoyed
December 2017Danone arbitration result
Farmers participate in Open Gates event and our fi rst Sustainability Report launches
2017/18 forecast Farmgate Milk Price revised down to $6.40 per kgMS
Foodservice business tops $2 billion in annual revenue to become New Zealand’s sixth biggest export business
Summer Autumn
Dry summer in some regions Good autumn leads to a surge in production at the end of the season
100m
FONTERRA ANNUAL REPORT 2018 25
For
per
sona
l use
onl
y
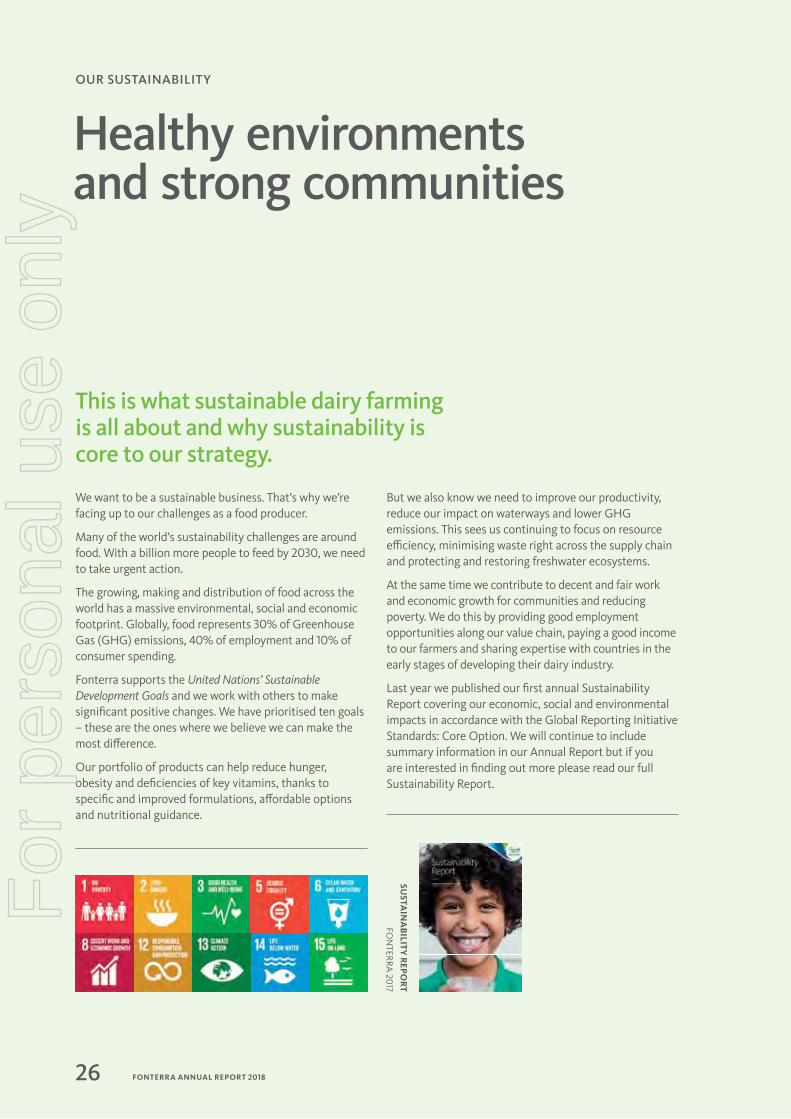
OUR SUSTAINABILITY
We want to be a sustainable business. That’s why we’re facing up to our challenges as a food producer.
Many of the world’s sustainability challenges are around food. With a billion more people to feed by 2030, we need to take urgent action.
The growing, making and distribution of food across the world has a massive environmental, social and economic footprint. Globally, food represents 30% of Greenhouse Gas (GHG) emissions, 40% of employment and 10% of consumer spending.
Fonterra supports the United Nations’ Sustainable Development Goals and we work with others to make signifi cant positive changes. We have prioritised ten goals – these are the ones where we believe we can make the most diff erence.
Our portfolio of products can help reduce hunger, obesity and defi ciencies of key vitamins, thanks to specifi c and improved formulations, aff ordable options and nutritional guidance.
But we also know we need to improve our productivity, reduce our impact on waterways and lower GHG emissions. This sees us continuing to focus on resource effi ciency, minimising waste right across the supply chain and protecting and restoring freshwater ecosystems.
At the same time we contribute to decent and fair work and economic growth for communities and reducing poverty. We do this by providing good employment opportunities along our value chain, paying a good income to our farmers and sharing expertise with countries in the early stages of developing their dairy industry.
Last year we published our fi rst annual Sustainability Report covering our economic, social and environmental impacts in accordance with the Global Reporting Initiative Standards: Core Option. We will continue to include summary information in our Annual Report but if you are interested in fi nding out more please read our full Sustainability Report.
This is what sustainable dairy farming is all about and why sustainability is core to our strategy.
Healthy environments and strong communities
SUSTA
INA
BILITY
REP
OR
T
FON
TERRA 20
17
FONTERRA ANNUAL REPORT 201826
For
per
sona
l use
onl
y
Launched AnmumTM Materna
Eliminated single-use plastic bagsFrom Farm SourceTM stores (see page 34)
Promoting a healthy and safe working environmentTotal recordable injury frequency rate (TRIFR) is 6.1 per million hours worked (see page 81)
New diversity targets, 50% women in senior leadership by 2022Developing a diverse, skilled and agile workforce(see page 72)
No added sugars formulation in Malaysia
NutritionImproving health and wellbeing through the products and services we deliver
EnvironmentAchieving a healthy environment for farming and society
CommunityDelivering prosperity for our farmers and wider communities
Improved water effi ciency at Pahiatua by 64% since FY15 (see page 30)64%
FONTERRA ANNUAL REPORT 2018 27
For
per
sona
l use
onl
y
Nutrition – What we sell
Malaysia has launched a new Anlene with MoveMaxTM and MFGM-ActiveTM for bone, joints and muscle health. Now with no added sugars and more protein.
Movemax ready-to-drink. Our total AnleneTM brand relaunched in Thailand with upgraded formulation for bones, joints and muscle health.
NZMP was awarded eight medals at the International Cheese Awards, one of the world’s most prestigious cheese competitions. Gold medals went to NZMP’s Epicure cheese, made at Lichfi eld and its Mild Cheddar, made at Wynyard in Tasmania. NZMP also won two silver and four bronze awards.
AnchorTM Blue Top milk continues to be New Zealand’s favourite branded milk – with Kiwis drinking around 55 million litres in the last year.
The number of experts we employ at our world class Research and Development Centre to make the best and most innovative products possible.
Dairy is packed full of goodness. It provides energy and high-quality protein which helps grow and repair muscles. It also helps meet the body’s needs for calcium, phosphorus, potassium and vitamin B2, B12 and Vitamin A. Our farmers’ milk is helping improve health and wellbeing for people around the world. Here’s a snapshot of how we helped this year.
55mlitres
310
8
OUR SUSTAINABILITY
BodiologyOur new All-In-One Supplement helps support, rebuild and repair joints, muscles and bones together as one system to help keep adult bodies active.
FONTERRA ANNUAL REPORT 201828
For
per
sona
l use
onl
y
88%MoreChoice
40% less added sugar Primo’s new formula is helping Kiwis consume less added sugar.
AnchorTMAnchorTMAnchor Life Forti� ed Low Fat Milk PowderFirst specialised milk powder in Sri Lanka with added plant sterols to focus on blood cholesterol reduction.
a2 Milk™ by AnchorTM
is giving consumers more choice.
Our AnchorTM Protein+ increased AnchorTM yoghurt sales by 88% in New Zealand.
Launched our Red Cow Rasa Padama in Sri Lanka, an aff ordable skimmed milk mix.
Our innovative SureProteinTM
Fast Milk Protein is an advanced milk protein that helps maximise the benefi ts of exercise to keep people active and healthy.
Going DigitalIn the spirit of going digital, AnchorTM Full Cream Milk Powder was launched in conjunction with World Milk Day as our fi rst AnchorTM milk off ering for consumers in Indonesia in an exclusive partnership with Lazada, Southeast Asia’s number one e-commerce marketplace.
Anmum MaternaTM
Launched no added sugars formulation in Malaysia. It is the only maternal milk to be fortifi ed with probiotic DR10TM to support good gut health.
FONTERRA ANNUAL REPORT 2018 29
For
per
sona
l use
onl
y
Environment
Healthy freshwater and ecosystems are essential to the long-term success of our business, and to the communities where we live, work and farm.
FarmingIn New Zealand our commitment to keep cows out of waterways on dairy farms has been delivered.
Our focus now is on Farm Environment Plans (FEPs) and at the end of FY18 there were 1,011 Fonterra farms with an FEP. Read more about our Tiaki Sustainable Dairying programme in the Our Co-op section.
ManufacturingOur Pahiatua site is in a sensitive water zone, both for the availability of groundwater and the discharge of wastewater. By capturing the water evaporated as steam from milk as it is dried into powder, we can condense it and use it instead of using ground water. Since FY15 we have improved water effi ciency at Pahiatua by 64%. With changes made this year, we expect savings of about 500,000 litres per day during the peak season for FY19.
Sustainable CatchmentsOur Living Water partnership with the Department of Conservation is focussed on fi ve catchments to identify game-changing and scalable solutions that demonstrate dairying and freshwater can thrive together. Living Water is currently working with 39 other groups and organisations and 92 Fonterra dairy farms.
We are now extending our involvement to support farmer and community action across a further 50 catchments in New Zealand.
Water
Our farmers have fenced 99.6% of permanent waterways and installed bridges or culverts at 99.9% of regular crossings
enhanced through protection, restoration and pest control
99.6%
5,823ha
OUR SUSTAINABILITY
FONTERRA ANNUAL REPORT 201830
For
per
sona
l use
onl
y
Fonterra recognises climate change as a signifi cant environmental, economic and social challenge and we support a transition to a low emissions global economy.
Farming
Based on recently completed analysis, the average carbon footprint of our New Zealand milk (excluding land-use change) has been trending down since the 2010/11 season. This improvement has been driven primarily by increased cow productivity and supported by a reduction in supplementary feed imported onto farm.
This year, as part of the New Zealand Dairy Action for Climate Change Plan, in conjunction with Dairy NZ, we have also completed a pilot with more than 100 farmers to provide them with individual GHG reports. This will allow them to monitor their own progress over time.
Climate change
Achieve climate neutral growth for on-farm GHG emissions in New Zealand by 2030 from a 2015 baseline
Achieve net zero emissions for our global manufacturing operations by 2050
Manufacturing
Through our long-running focus on energy effi ciency in New Zealand we have achieved a 19.3% reduction in energy intensity since 2003, against a target of 20% by 2020. That is equivalent this year to saving enough energy to power over 220,000 households in New Zealand.
We are also progressing changes to alternative energy sources and we have committed to divesting any coal mining interests by 2025. Renewable alternatives are not readily available but we are investigating a combination of wood biomass and more use of electricity.
At our Brightwater site, we are converting the boiler to co-fi re wood biomass with coal, due to go live in October 2018. The co-fi ring is estimated to reduce factory emissions by about 2,400 tonnes CO2-e per year or the equivalent of taking about 530 cars off the road.
FONTERRA ANNUAL REPORT 2018 31
For
per
sona
l use
onl
y
We are supporting farmers in key markets around the world to produce dairy more sustainably, by improving feed production, animal health and milk quality, and facilitating demand.
Dairy Development
In-school Programmes
Indonesia
In addition to our dairy scholarship programme, we have launched a dairy cluster in West Sumatra. Supported by local government and working in partnership with the local dairy co-operative, we are training farmers on good practices and training local catering staff on using fresh milk as an alternative ingredient.
Farmers open their gates to New Zealanders
In December, nearly 40 Fonterra farmers opened their gates so New Zealanders had the opportunity to learn about how Fonterra farmers care for waterways and what happens on a dairy farm. Over 4,000 New Zealanders came and got a fi rst-hand look at how a dairy farm operates.
KickStart Breakfast
This year, KickStart Breakfast grew to 976 clubs and served more than 125,000 breakfasts every school week.
Chile
Our fi rst group of nine young Chilean farmers have completed one year of paid, hands-on experience in New Zealand, learning skills from leading farmers.
Fonterra Milk for SchoolsWith more than 1,420 schools and 140,000 children taking part, we had a lot of fun this year celebrating our fi fth birthday and our 100 millionth serve.
Sri Lanka
In addition to providing development support for farmers we launched exciting variants to our fl avoured milk and yoghurts range to increase demand for their local milk.
CommunityOUR SUSTAINABILITY
FONTERRA ANNUAL REPORT 201832
For
per
sona
l use
onl
y
To help create vibrant communities around the world, we provide fi nancial support through the Fonterra Grass Roots Fund and other activities in the countries where we operate.
This year in New Zealand, Australia and Sri Lanka, the Fonterra Grass Roots Fund helped 696 initiatives, contributing $770,000 through grants and equipment donations. In New Zealand, we have provided fi nancial grants, and by buying in bulk, we have also been able to provide at lower cost more than 10,000 high visibility vests and 25 defi brillators directly to local communities.
Fonterra Grass Roots Fund and other community development
Since 2017 in Australia, we have supported 95 initiatives across Victoria and Tasmania. This year recipients included primary schools, volunteer fi re brigades, surf lifesaving and sports clubs.
Helping provide access to clean water and sanitation has remained our focus in Sri Lanka. This year it is estimated that more than 8,500 people, mainly children, have benefi ted from upgraded infrastructure.
In Greater China, we have introduced a new scholarship scheme to help with the further education of children of workers at our China farms. This year 14 scholarships were awarded.
For 18 years, SoproleTM has supported school sports across the full length of Chile. An estimated 1.5 million people benefi t from the support and a further education scholarship is also awarded for the top participant in each discipline.
In Australia, we support Foodbank, Australia’s largest hunger relief organisation and in 2017 we donated over 260,000 meals. We also support other similar food bank initiatives throughout the world.
1. Children at Moragahahena Maha Vidyalaya school celebrate the upgrade of clean water facilities in Sri Lanka.
2. Paeroa Land Search and Rescue inNew Zealand used their grant to buy rescue equipment including 10 torches with a 350-metre range.
3. Top participant in volleyball, Camila Gómez receives SoproleTM educational scholarship from Gustavo Rencoret, Senior Corporate Counsel, Soprole, in Chile.
1. 2.
3.
4.
6.
5.
4. Kamo Volunteer Fire Brigade in New Zealand used their grant to buy more powerful saws.
5. Laga Haitong, manager of our Cowbell Farm, in China, presents scholarships to the fi rst successful applicants at the farm.
6. The Fonterra Australia team helping at FareShare food kitchen.
FONTERRA ANNUAL REPORT 2018 33
For
per
sona
l use
onl
y
OUR FARMERS
There’s lots of competition for milk off farms and we never take our farmers’ loyalty for granted. We work hard every day to deliver them more value beyond the milk cheque.
Co-operative solutions
We all want a strong and enduring Co-op, for us and future generations. To achieve that, we must all have a stronger sense of belonging to our Co-op and a clearer direction for the future. Farmers have told us this is what they want.
More than 5,300 of our farmers and employees have provided their thoughts to a working group of the Fonterra Shareholders’ Council, with support from the Board, to review Fonterra’s purpose. This spring, the Co-op will review that feedback and test some new concepts so a renewed purpose can be introduced across the Co-op before the end of the year.
We have asked our farmers how can we make things better. We've heard that it’s important we provide fl exible supply options for young farmers, growth farmers and farmers nearing retirement who are working towards succession.
This work falls under three main areas: supporting farm fi nancial performance, connecting people with our Co-op, and on-farm advice and support. We have good progress to report.
Farm Source™
Every year we aim to provide the most competitive pricing for farming supplies and reward farmers for their loyalty to our Farm Source™ stores through deals and discounts. This year our farmers earned $12.6 million Farm Source™ Rewards Dollars.
We provided $19.3 million in discounts for everyday farming supplies and used our buying power to save farmers $6.7 million on fuel and another $1.5 million on power. A deal with Mazda saw 208 vehicles purchased with a combined discount of $2.9 million.
Our stores are working to become more sustainable, eliminating the use of approximately 365,000 plastic bags annually and are looking at other initiatives such as selling fence posts made from recycled plastic.
New fi nancial toolsFlexible fi nancial tools are one way we encourage new farmers into our Co-op and provide fi nancial fl exibility for our existing farmer owners.
We made more progress this year, introducing four new fi nancial tools to help make it easier for farmers to share-up and run their farms. These include providing fi nancing to help with compliance which frees up other money for purchasing shares.
These new tools are in addition to Invest as you Earn, Dividend Reinvestment Plan and Share-up Over Time.
FONTERRA ANNUAL REPORT 201834
For
per
sona
l use
onl
y
Farm Source™
Financial fl exibility
Provided in discounts for everyday farming supplies.
Saved on power
Saved on fuel
We have four new fi nancial tools to help our farmers
Our buying power is making savings for farmers
$6.7m
$19.3m
$1.5m
The Strike Price ContractAllows farmers to buy more shares only when the Farmgate Milk Price goes over the Strike Price.
Smart FinanceProvides low-interest fi nancing to farmers wanting to make their farms more sustainable.
Rewards Dollars for SharesWill allow farmers to use their Rewards Dollars accrued at the Farm Source™ store to purchase shares.
Contract Fee for UnitsRecognises that farmers supplying under a Share-up Over Time contract are on their way to becoming shareholders and defers the contract fee to a Trust. The Trust will invest in Units and these will be returned to the farmer when they transition to a shareholder.
FONTERRA ANNUAL REPORT 2018 35
For
per
sona
l use
onl
y
Supporting sustainable dairyingMilk is the life blood of our Co-op. It is vital we maintain our farmers’ ability to operate profi table, productive farms which meet rising community expectations and more demanding regulations.
Through our Tiaki programme, Fonterra farmers have access to world-class technology, reporting and a range of services to support sustainable farming.
This includes our Sustainable Dairying Advisors (SDAs) who support our farmers in implementing good environment practice on farm. This year we have grown our number of SDAs to 23, with a goal to expanding the number to 29 by 2020. This growth is driven by demand, as our SDAs work closely with farmers and support their environmental sustainability. At the end of FY18, 1,011 farms had Farm Environmental Plans (FEPs).
These plans assess the environmental eff ects and risks associated with farming activities and provide strategies to help individual farms meet their regional requirements, and business and sustainability goals. The FEPs delivered by our SDAs are at no additional cost to Fonterra farmers, saving each an average of $3,500.
Regional councils have recognised the value of the Co-op’s FEP template. For example, Environment Canterbury (ECan) approved it for farmers to use to meet the requirements of the Canterbury Land & Water Regional Plan (LWRP).
When the going got toughAmong other on-farm challenges this year, farmers faced fl oods, droughts, Cyclone Gita and Mycoplasma bovis (M.bovis). Our regional teams rolled up their sleeves to help our farmers and local communities. Here are a few examples:
• When fl ood waters rose in the Lower South Island at the end of winter, our Emergency Response Team (ERT), crews from the Edendale site and the Farm SourceTM team pitched in to help farmers clean up and get ready for calving which was rapidly approaching.
• The ERT was deployed in Taranaki to ensure farms had water and helped to clear farm races, remove fallen trees and repair sheds after Cyclone Gita brought gale-force winds.
• After major slips on Takaka Hill cut off access to Golden Bay, the Co-op organised an emergency barge to get additional tankers to the Takaka site to transport cream out and bring in emergency food, fuel, and essential supplies.
• While M.bovis poses no risk to milk quality or food safety, the Co-op worked with Government, sector groups, and other dairy companies to minimise the serious animal and farmer welfare implications. With signifi cant eff ort by the Farm Source™ network and tanker operators, the Co-op coordinated the testing of every herd supplying milk and organised more than 60 farmer meetings. We placed a number of employees directly into the national response and we also lead an Industry Working Group to coordinate and support industry eff orts to help farmers.
Working for our farmersOUR FARMERS
Farm Environment Plans
Sustainable Dairying Advisors
231,011
Saved on service fees
$3.3m
Our tanker on the barge heading for Golden Bay
FONTERRA ANNUAL REPORT 201836
For
per
sona
l use
onl
y
Face-to-face with farmersOur regional network is designed to ensure we have face to face contact with our farmers
Farmers visited the Fonterra head offi ce
More than 70 farmers participated in our off shore study programmes to China
Site tours attended by farmers and our neighbours from rural communities
Water
Fat Evaluation Index Grading System
On-farm technology
Interim results
Webinars viewed over 3,300 times:
1,20050
Connecting with our farmers
More digital, more convenientOur farmers are fast digital adopters with our smartphone apps being used to help run operations on more than 90% of our farms. We continue to enhance the off ering and this year launched the digital version of the Dairy Diary farmers use to help track food safety and quality compliance. More than 2,500 Fonterra farms have already downloaded the app, opting for the digital version instead of the paper-based system. The digital version, available in the hand and on the spot, makes compliance easier.
On average, farmers that access our apps or website on their mobile device do so fi ve days a week
Of our farmers use our smartphone apps
90%
Farmers attended the inaugural My Connect Conference630
Events, including Interim Results meetings, M.bovis town halls, nitrogen pages drop-in days and Farm Source™ store supplier nights
850
FONTERRA ANNUAL REPORT 2018 37
For
per
sona
l use
onl
y
OUR FARMERS
Farmer spotlight
New Zealand Share Farmer of the Year Dan and Gina DuncanNorthland’s Dan and Gina Duncan were declared NZ Share Farmer of the Year.
New Zealand Dairy Manager of the Year Gerard BoerjanGerard Boerjan from Takapau was named NZ Dairy Manager of the Year.
Responsible Dairying Award Wynn and Tracy BrownWynn and Tracy Brown from Matamata took home the new “Responsible Dairying Award” which recognises dairy farmers who are demonstrating leadership in their approach to dairying, have proven results and are respected by their farming peers and their community.
Regional New Zealand Dairy Industry Awards won by Fonterra farmers
Regional Ballance Farm Environment Awards won by Fonterra farmers
Our Co-op takes huge pride in the achievements of our farmers
Our farmers have outdone themselves, winning two of three national titles of the NZ Dairy Industry Awards.
29 of 33
6 of 11
FONTERRA ANNUAL REPORT 201838
For
per
sona
l use
onl
y
Dairy Woman of the Year Loshni ManikamAll three fi nalists in the Dairy Woman of the Year Award were Fonterra farmers and the title was taken home by Southland farmer and dairy leadership coach Loshni Manikam. Other fi nalists were Tracey Collis from Eketahuna and Rachel Baker from Hawke’s Bay.
Māori Excellence in Farming Award Onuku Māori Lands TrustBay of Plenty-based Onuku Māori Lands Trust won the 2018 Ahuwhenua Trophy for Māori Excellence in Farming — Moyra Bramley, Chairwoman, was on hand to accept the award.
Young Māori Farmer Award Harepaora NgaheaFarm Manager Harepaora Ngahea from Te Teko won the Ahuwhenua Young Māori Farmer Award.
FONTERRA ANNUAL REPORT 2018 39
For
per
sona
l use
onl
y
Legend
Achievement
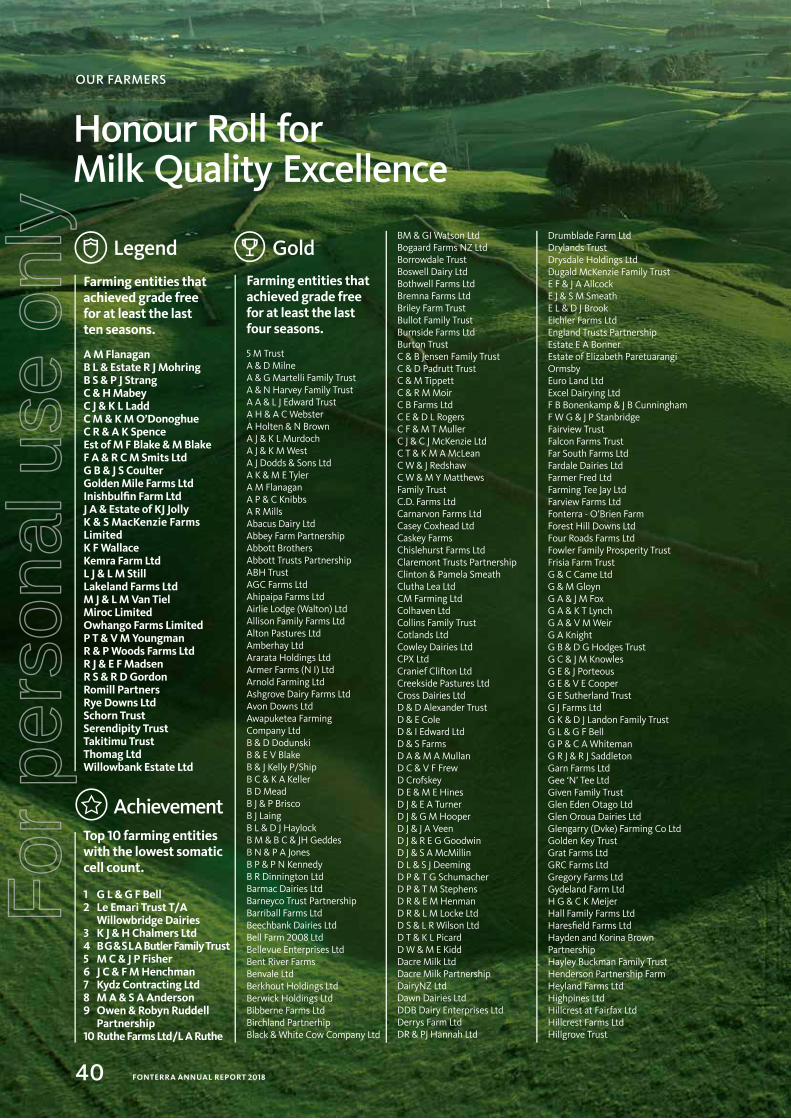
GoldFarming entities that achieved grade free for at least the last four seasons.
5 M TrustA & D MilneA & G Martelli Family TrustA & N Harvey Family TrustA A & L J Edward TrustA H & A C WebsterA Holten & N BrownA J & K L MurdochA J & K M WestA J Dodds & Sons LtdA K & M E TylerA M FlanaganA P & C KnibbsA R MillsAbacus Dairy LtdAbbey Farm PartnershipAbbott BrothersAbbott Trusts PartnershipABH TrustAGC Farms LtdAhipaipa Farms LtdAirlie Lodge (Walton) LtdAllison Family Farms LtdAlton Pastures LtdAmberhay LtdArarata Holdings LtdArmer Farms (N I) LtdArnold Farming LtdAshgrove Dairy Farms LtdAvon Downs LtdAwapuketea Farming Company LtdB & D DodunskiB & E V BlakeB & J Kelly P/ShipB C & K A KellerB D MeadB J & P BriscoB J LaingB L & D J HaylockB M & B C & JH GeddesB N & P A JonesB P & P N KennedyB R Dinnington LtdBarmac Dairies LtdBarneyco Trust PartnershipBarriball Farms LtdBeechbank Dairies LtdBell Farm 2008 LtdBellevue Enterprises LtdBent River FarmsBenvale LtdBerkhout Holdings LtdBerwick Holdings LtdBibberne Farms LtdBirchland PartnerhipBlack & White Cow Company Ltd
Farming entities that achieved grade free for at least the last ten seasons.
A M FlanaganB L & Estate R J MohringB S & P J StrangC & H MabeyC J & K L LaddC M & K M O’DonoghueC R & A K SpenceEst of M F Blake & M BlakeF A & R C M Smits LtdG B & J S CoulterGolden Mile Farms LtdInishbul� n Farm LtdJ A & Estate of KJ JollyK & S MacKenzie Farms LimitedK F WallaceKemra Farm LtdL J & L M StillLakeland Farms LtdM J & L M Van TielMiroc LimitedOwhango Farms LimitedP T & V M YoungmanR & P Woods Farms LtdR J & E F MadsenR S & R D GordonRomill PartnersRye Downs LtdSchorn TrustSerendipity TrustTakitimu TrustThomag LtdWillowbank Estate Ltd
BM & GI Watson LtdBogaard Farms NZ LtdBorrowdale TrustBoswell Dairy LtdBothwell Farms LtdBremna Farms LtdBriley Farm TrustBullot Family TrustBurnside Farms LtdBurton TrustC & B Jensen Family TrustC & D Padrutt TrustC & M TippettC & R M MoirC B Farms LtdC E & D L RogersC F & M T MullerC J & C J McKenzie LtdC T & K M A McLeanC W & J RedshawC W & M Y Matthews Family TrustC.D. Farms LtdCarnarvon Farms LtdCasey Coxhead LtdCaskey FarmsChislehurst Farms LtdClaremont Trusts PartnershipClinton & Pamela SmeathClutha Lea LtdCM Farming LtdColhaven LtdCollins Family TrustCotlands LtdCowley Dairies LtdCPX LtdCranief Clifton LtdCreekside Pastures LtdCross Dairies LtdD & D Alexander TrustD & E ColeD & I Edward LtdD & S FarmsD A & M A MullanD C & V F FrewD CrofskeyD E & M E HinesD J & E A TurnerD J & G M HooperD J & J A VeenD J & R E G GoodwinD J & S A McMillinD L & S J DeemingD P & T G SchumacherD P & T M StephensD R & E M HenmanD R & L M Locke LtdD S & L R Wilson LtdD T & K L PicardD W & M E KiddDacre Milk LtdDacre Milk PartnershipDairyNZ LtdDawn Dairies LtdDDB Dairy Enterprises LtdDerrys Farm LtdDR & PJ Hannah Ltd
Drumblade Farm LtdDrylands TrustDrysdale Holdings LtdDugald McKenzie Family TrustE F & J A AllcockE J & S M SmeathE L & D J BrookEichler Farms LtdEngland Trusts PartnershipEstate E A BonnerEstate of Elizabeth Paretuarangi OrmsbyEuro Land LtdExcel Dairying LtdF B Bonenkamp & J B CunninghamF W G & J P StanbridgeFairview TrustFalcon Farms TrustFar South Farms LtdFardale Dairies LtdFarmer Fred LtdFarming Tee Jay LtdFarview Farms LtdFonterra - O’Brien FarmForest Hill Downs LtdFour Roads Farms LtdFowler Family Prosperity TrustFrisia Farm TrustG & C Came LtdG & M GloynG A & J M FoxG A & K T LynchG A & V M WeirG A KnightG B & D G Hodges TrustG C & J M KnowlesG E & J PorteousG E & V E CooperG E Sutherland TrustG J Farms LtdG K & D J Landon Family TrustG L & G F BellG P & C A WhitemanG R J & R J SaddletonGarn Farms LtdGee ‘N’ Tee LtdGiven Family TrustGlen Eden Otago LtdGlen Oroua Dairies LtdGlengarry (Dvke) Farming Co LtdGolden Key TrustGrat Farms LtdGRC Farms LtdGregory Farms LtdGydeland Farm LtdH G & C K MeijerHall Family Farms LtdHaresfi eld Farms LtdHayden and Korina Brown PartnershipHayley Buckman Family TrustHenderson Partnership FarmHeyland Farms LtdHighpines LtdHillcrest at Fairfax LtdHillcrest Farms LtdHillgrove Trust
OUR FARMERS
Honour Roll for Milk Quality Excellence
Top 10 farming entities with the lowest somatic cell count.
1 G L & G F Bell 2 Le Emari Trust T/A Willowbridge Dairies 3 K J & H Chalmers Ltd 4 B G & S L A Butler Family Trust 5 M C & J P Fisher 6 J C & F M Henchman 7 Kydz Contracting Ltd 8 M A & S A Anderson 9 Owen & Robyn Ruddell
Partnership 10 Ruthe Farms Ltd/L A Ruthe
FONTERRA ANNUAL REPORT 201840
For
per
sona
l use
onl
y
To qualify, farms must have supplied 45 days or more in each season.
Hines Family TrustHoogeveen Farms LtdHoward Farm LtdHuntly Road Dairies LtdHutton Farm Holdings LtdI Hampton & A GolvinI J Sutherland PartnershipInterlaken Farms LtdJ & J Anderson Family Trust PartnershipJ & LM Van BurgstedenJ A & J H HineJ B & L M Suisted LtdJ B & S M DuynhovenJ E & C T BrienJ E & D M CooperJ H & H R SmythJ L & H M CoatsworthJ L & K S Gwerder Family TrustJ L & M A CookeJ L Hooper & A L RobertsonJ M & T M Van HoutJ M De RenzyJ P & M J HorganJ R & A T M HaleJ W & A M SteeghsJ W PrictorJames LyttleJames MartelliJanssen NZ LtdJascas TrustJaska Farm TrustJayland PartnershipJC Beattie TrustJDQ LtdJerzey Rock Farm LtdJJ & AB Roskam LtdJM Cross & LA HazeltonJohnson Farm Co. LtdK B & K R WhitemanK B Olesen & R J StephensK J & H Chalmers LtdK J & J B ArgyleK J & M T Dwyer Trusts P/SK R & S M RooneyK W & D M BlackstockK W & D R Lowe Family TrustKaimai Dairy LtdKainui Peatlands LtdKaipara View Farming LtdKalman Farms Trusts P/ShipKauri Falls Investments LtdKerenui LtdKevin Fleming LtdKieran McErlean TrustKim Steff ert Family TrustKing’s Junction LtdKnockinnon Farm TrustKywaybre Farms LtdL J & M PrictorL J HodgesL.G. & J.M. Morris LtdLaing Dairy LtdLawson Road Farm LtdLesdale Friesians LtdLizlyn Dairies LtdLockerbie Farms 2001 Ltd
Longacre Properties LtdLord & Veltman LtdLudell LtdLudimac Dairying LtdLutz Farming Company LtdLynton Dairy LtdM & A Schrader Family TrustM & C O’Grady LtdM & J Barker TrustM C & J P FisherM E Hunt & Son LtdM G & A M HurleyM I & P M Stevenson Family Trusts P/shipM J & A S Taylor Family TrustM J & S D HopsonM J & T M DaviesM J & W P Van VeenM J Diprose LtdM J McDowallM J Murray & Estate of A B MurrayMaken Milk LtdMalandra Downs LtdManuka Ridge LtdMark A Mullan TrustMarua PartnershipMary Allen Farm LtdMatricksen Ag Holdings LtdMattajude Family TrustMaude Peak Farm TrustMavora Farms LtdMaxlands Farms LtdMcCullough Family 2008 LtdMcFetridge Farms LtdMcGee PartnershipMcGowan-Weake PartnershipMead Family Farm LtdMembury Oak Farm LtdMeyer Family TrustMilestone TrustMilkwell LtdMitchells Milky Way LtdMJ & KL Family TrustMolehill Farm LtdMorrison Farms LtdMR & TJ Frost LtdMu Kau LtdMudspring Farms LtdN A & K M McCollN R & K L GaskinN R & L A FoxNB & LJ Crosbie LtdNgahape Valley Farm LtdNgutunui Dairies LtdNorth Star Farming LtdNR Ensor LtdOhtawa Farms LtdOkapua Farming Company LtdO’Reilly Family TrustOtira Farm LtdOtu Creek Farm LtdP & T & S & Y ThompsonP A HoogeveenP D & J M BishP D & S S SharpeP G & D J Collins
P G & D M DombroskiP H & W F IornsP H S & P C ByfordP J & M L CotterP L & R E BerrymanP R & V P DawsonP V & P G Mullin TrustParkhill Farms LtdPerlow Dairies LtdPharlee TrustPhimister Farming LtdPiwakawaka Farm TrustPJ Nelson Farming LtdPlacement Services LtdPort Molyneux Dairies LtdPuketi Farming Enterprises LtdPuniho 606 PartnershipQuirke Family TrustR & A Tait T/A Black Cow DairiesR & K Houghton Family TrustR & S SinghR A & J L HamiltonR A F & J R ClubbR F & C L Lansdaal LtdR J TroughtonR N CornesR T & E A Brown LtdR W & R R O’BrienR W & W J Cudby Family TrustR.L. Mathis LtdRainbowcreek Farms LtdRelyt Farm LtdRich Feet LtdRiver Heights LtdRiverside Farms (Taranaki) LtdRiverview Farms 2001 LtdRiverview TrustRK & A Hines LtdRKW PartnershipRodney G & S J JoblinRogers Farming LtdRV & LH Kokich Farms LtdRyelands Farm Company LtdS & S IornsS A & J L EnglandS B & Y M ThompsonS England & P WalkerS G & B L ThirkellS G McKenzieS L & J P VincentS M SheadSabin & Co LtdSean McErlean TrustSeven of Nine LtdShabict LtdShawlink LtdShenandoah TrustSilvacrest Farms LtdSilverdene Farms (2000) LtdSim Brothers LtdSim Family Farms LtdSisley Farms LtdSlatz TrustSomerset TrustSpringpark Farms 2008 LtdSteff ert Farms LtdStephen Zink
Steven Bennett Family TrustStoneyburn Dairy LtdT & C Brown LtdT & K Rae Family TrustT D & J A RhindT R D ReesbyTamatea Farms LtdTawa Land Company LtdTayco Farm LtdTe Ngutu Land Holding Co LtdTe Repo Farms LtdTeaghlach TrustTelesis TrustThe Adare Company LtdThe D & A Roberts Family TrustThe Goble 2000 TrustThe Herewahine TrustThe Hyjinks TrustThe Red Cow Company LtdThe Taieri Dairy Company LtdTrimor LtdTrinity Lands LtdTrustees Kokako StationTuki Tuki Awa LtdTW Langford Family TrustTwo Name Farming LtdUp At 5 LtdV E & D M GrantVale Green Services LtdVan Rossum LtdVBI LtdVentura Dairies LtdW & C Candy TrustW B Scott Family TrustW B WoutersW Dreadon & K Barnett-DreadonW G & M D OrrW J & J G Pile Family TrustW R & Z W KiteW.A & H.R Simpson Farming LtdWaicola Holdings LtdWainui DairiesWaiotu Farms LtdWaiparu Farm LtdWaiparu Holdings LtdWaipiata TrustWaituna Investments LtdWallace Johnstone LtdWalters Holdings (2008) LtdWards Schrader Trusts PartnershipWebber & Maxwell PartnershipWebber Farm LtdWest Mains Farm LtdWestmeath TrustWhakahora Farm LtdWhakanui Farms LtdWhakanui Stud LtdWhenuakura Farm LtdWichland Farms LtdWillcox Farms LtdWillowfi elds LtdWillowhaugh Enterprises LtdWindy Ridge (Fleming) LtdWP & A MooreWylam Dene Farms Ltd
Our farmers are committed to milk quality excellence, year-after-year, ensuring that we collect the best possible milk. In addition to the honour roll below, we also acknowledge the eff ort of all Grade Free, Merit and Achievement recipients. Our farmers are our greatest assets.
FONTERRA ANNUAL REPORT 2018 41
For
per
sona
l use
onl
y
OUR PEOPLE
Employee spotlight
Palatasa HaveaPrincipal Research ScientistFonterra Research and Development Centre, Palmerston North
As a 17-year-old student attempting to pass Year 10 for the third year in a row, Palatasa (Tasa) Havea never imagined that one day he’d be granted one of New Zealand’s top honours.
Fast forward a few decades and Tasa’s work, both as a scientist and as a leader in his community, was recognised when he was made a member of the New Zealand Order of Merit for his services to the Pacifi c community and the dairy industry.
It’s believed Tasa is Tonga’s fi rst food science PhD. His work as a principal research scientist at Fonterra’s Research and Development Centre has resulted in ten patents for the Co-op. He’s played a vital role in pioneering the use of whey protein in a range of products that is returning hundreds of millions of dollars to the New Zealand economy.
Deeply involved in his local community, Tasa has also worked alongside the New Zealand Government for many years bringing about policies and funding to support Pacifi c Island people to reach their potential.
10Tasa’s research has resulted in ten patents for the Co-op.
Tasa is now a member of the New Zealand Order of Merit.
It is believed Tasa is Tonga’s fi rst food science PhD.
Tasa’s work with whey protein is returning hundreds of millions of dollars to the New Zealand economy.
FONTERRA ANNUAL REPORT 201842
For
per
sona
l use
onl
y
Stirling teamSouth OtagoA site at the bottom of the South Island but on top of their game, Stirling is focussed on being the most productive site in the country.
The 110-person South Otago team has been working hard to deliver sustainable change over many years across all parts of the site, from transport and health and safety to people and customers.
Stirling is one of the most effi cient and productive sites in the country. The team has put every part of its business under a spotlight to deliver increased value. The results are impressive – the site is running for longer, breakdowns are reduced and 1.8 million litres of milk each day during the peak of the season is being turned into some of the world’s most-loved cheeses.
The site boasts a state-of-the-art biological treatment plant which uses natural organisms to treat waste water – the only one of its kind in the Southern Hemisphere. Stirling will also transition from coal to renewable energy as part of our goal to achieve net zero emissions across our sites by 2050.
In light of the team’s hard-won gains, Stirling was awarded two prestigious awards at our 2018 Best Site Cup Awards. These awards recognise the team’s long-term commitment to excellence and creating sustainable change over many years. They also won a silver award with a score of 99.15 out of 100 at the Wisconsin Cheese Awards.
Hema Daily Fresh Milk teamChina Staying ahead of the curve is a tough challenge in fast-changing China. But the launch of Hema Daily Fresh Milk in Shanghai has put our Co-op at the forefront of product innovation.
One step ahead, teams from our Consumer and Foodservice business in China and Food Safety Quality and Technical teams in New Zealand partnered with Alibaba’s innovative retailer Hema Fresh to launch our Co-op’s fi rst fresh milk product in China. From concept to launch in just over three months, the product was developed with incredible speed and relentless focus on food safety and quality. Each bottle is on sale for just a day and delivered to the consumer within 30 minutes of an order.
Hema Daily Fresh is the fi rst step in our Co-op selling fresh milk in China. Sourced directly from the Co-op’s farm hub in Hebei province, the range capitalises on rising domestic demand for higher-quality fresh products, as part of the ‘premiumisation’ of China’s consumer market.
FONTERRA ANNUAL REPORT 2018 43
For
per
sona
l use
onl
y
John Wilson
Ashley W
aughScott St JohnD
onna Smit
Nicola Shadbolt
Andrew
Macfarlane
Simon Israel
Bruce H
assallB
rent Goldsack
Clinton D
inesJohn M
onaghan
1. 2. 3. 4. 5. 6. 7. 8. 9. 10. 11.
1
62
3
5
11
9
10
8
7
4
OUR PEOPLE
Board of Directors
FONTERRA ANNUAL REPORT 201844
For
per
sona
l use
onl
y
1. John MonaghanBoard Responsibilites Farmer-elected Director, Chairman, Chair of the Co-operative Relations Committee, Member of the People, Culture and Safety Committee and the Nominations CommitteeTerm of Offi ce Elected 2008, last re-elected 2017John Monaghan was elected to the Fonterra Board in 2008 and became Chairman in 2018. Prior to joining the Fonterra Board John was Chairman of the Fonterra Shareholders’ Council and the inaugural Chair of the Governance Development Programme. He is also a director of Centre Port Limited and Centre Port Properties Limited. He holds a number of farming directorships and is a trustee of the Wairarapa Irrigation Trust. John has dairy farming interests in the Wairarapa and Otago regions. John has taken a lead role in representing Fonterra’s interests on global trade issues and has strong networks domestically and internationally with key stakeholders.
2. Clinton DinesBoard Responsibilites Appointed Director, Member of the People, Culture and Safety Committee, Risk Committee and the Nominations CommitteeTerm of Offi ce Appointed 2015Clinton was appointed to the Fonterra Board in 2015. Clinton lived and worked in China for 36 years, 21 of which as President of BHP Billiton’s China business. He has extensive experience as an executive in China and Asia businesses and has had an active career as a Non-Executive Director, currently serving on the Boards of North Queensland Airports and Zanaga Iron Ore. He was Executive Chairman of Caledonia Asia from 2010 to 2013, an investment group in Asia, and is a Partner in Moreton Bay Partners, a strategic advisory fi rm based in Brisbane. He is an Adjunct Professor at Griffi th University’s Asia Institute and is a Member of the Griffi th University Council. Clinton has extensive experience as a senior executive in China and Asia businesses, including global manufacturing and commodity businesses.BA (Modern Asian Studies, Gri� th), CIM, INSEAD
3. Brent GoldsackBoard Responsibilites Farmer-elected Director, Member of the Co-operative Relations Committee, the Risk Committee and the Milk Price Panel. Term of Offi ce Elected 2017Brent Goldsack was elected to the Fonterra Board in 2017. Brent had a 25-year career in both New Zealand and abroad in various corporate advisory roles, including being a Partner at PwC for more than 12 years. Brent is a Chartered Accountant.Brent serves on the Boards of Canterbury Grasslands Limited, Waitomo Petroleum Group Limited and its subsidiaries and The New Zealand Fieldays Society. Brent is actively involved as a shareholder of three dairy operations in the Waikato and has shareholding interests in two other dairy farms with operations in both New Zealand and the United States. Brent is also the General Manager of a 3,000 cow dairy operation. In addition to his strong fi nancial skills and knowledge, Brent has particular expertise in Fonterra’s Farmgate Milk Price and the drivers of the Co-operative’s earnings.BCA, CA
4. Bruce HassallBoard Responsibilites Appointed Director, Chair of the Audit and Finance Committee and the Nominations Committee, Member of the Risk Committee and the Milk Price Panel and is an observer on the People, Culture and Safety Committee.Term of Offi ce Appointed 2017Bruce Hassall was appointed to the Fonterra Board in 2017. Bruce is a Chartered Accountant and has had a 35-year career at PwC, including holding the position of Chief Executive Offi cer of the New Zealand practice from 2009 to 2016. Bruce is Chairman of The Farmers Trading Company Limited, Prolife Foods Limited and Fletcher Building Limited (with eff ect 1 September 2018) and serves as a director on the Board of Bank of New Zealand. He is a member of the University of Auckland Business School Advisory Board and was a founding Board Member of the New Zealand China Council. Bruce has extensive experience in fi nancial reporting information system processes, risk management, business acquisitions, capital raising and IPOs across listed and private companies.BCom, FCA (CAANZ)
5. Simon IsraelBoard Responsibilites Appointed Director, Member of the People, Culture and Safety CommitteeTerm of Offi ce Appointed 2013Simon Israel was appointed to the Fonterra Board in 2013. Simon currently chairs the Boards of Singapore Telecommunications Limited and Singapore Post Limited and is a member of the Westpac Asia Advisory Board. He was an Executive Director of Temasek Holdings for six years and President from 2010 to 2011. Simon was a director of Fraser & Neave, Neptune Orient Lines, Asia Pacifi c Breweries, Griffi n Foods, CapitaLand and Frucor Beverage Group. He had 10 years’ experience in the dairy industry with Danone as a Senior Vice President and member of the Group Executive Committee. He was conferred Knight in the Legion of Honour by the French Government in 2007. He had 10 years’ experience in Danone, a global consumer-oriented company, as a Senior Vice President and member of the Group Executive Committee.DipBusStud
6. Andrew MacfarlaneBoard Responsibilites Farmer-elected Director, Member of the Audit and Finance Committee, Co-operative Relations Committee and the Nominations Committee.Term of Offi ce Elected 2017Andy Macfarlane was elected to the Fonterra Board in 2017. Andy was a farm management consultant for 38 years. He is a Councillor of Lincoln University and a Director of Ngai Tahu Farming and ANZCO.Andy is an active member of the International Farm Management Association (IFMA), Global Dairy Farmers and New Zealand Institute of Primary Industry Management (NZIPIM). He is the Past President of the NZIPIM and chaired Deer Industry New Zealand for seven years. Andy began farming in 1989 and lives near Ashburton. Andy has shareholding interests in the South Island. Andy has a strong understanding of the governance of research and development and innovation, and has a particular interest in the strategic use of technology in the dairy industry.B.Agr.Sc
7. Nicola Shadbolt ONZMBoard Responsibilites Farmer-elected Director, Member of the Audit and Finance Committee and the Risk CommitteeTerm of Offi ce Elected 2009, last re-elected 2015Nicola Shadbolt was elected to the Fonterra Board in 2009 and serves on the Board of the Manager of the Fonterra Shareholders’ Fund. Nicola has worked in government, agribusiness, consultancy and academia and is now a Professor of Farm and Agribusiness Management. She serves on the board of the International Food & Agribusiness Association and, as chair, on a large dairy farming business. Nicola was made an Offi cer of the New Zealand Order of Merit for services to agribusiness in 2018. Nicola lives in the Manawatu, the base for her four farming and forestry equity partnerships, which include two dairy farms. Nicola’s expertise across international agribusiness sectors includes a strong focus on the crucial role that science and sustainability play in creating enduring value for Fonterra, its owners and New Zealand.B.Sc(Hons), M.AgrSc(Hons), DipBusStud (Accountancy), FNZIPIM (Reg), FAICD, INSEAD IDP-C
8. Donna SmitBoard Responsibilites Farmer-elected Director, Member of the Audit and Finance Committee and the Co-operative Relations CommitteeTerm of Offi ce Elected 2016Donna Smit was elected to the Fonterra Board in December 2016. Donna lives and farms at Edgecumbe, and has built and owns seven dairy farms in Eastern Bay of Plenty and Oamaru. Donna is a Director of Ballance Agri Nutrients and Kiwifruit Equities Limited and a Trustee of the Dairy Women’s Network. Donna is a Chartered Accountant and was a company administrator at kiwifruit Co-operative EastPack for 24 years. Donna’s strong focus on fi nancial and risk management has been built through her extensive business experience and fi nancial background, and complements her deep dairy farming experience.CA
9. Scott St John Board Responsibilites Appointed Director, Chair of the Milk Price Panel and Member of the Audit and Finance Committee Term of Offi ce Appointed 2016Scott St John was appointed to the Fonterra Board in 2016 and serves on the Board of the Manager of the Fonterra Shareholders’ Fund. He was the CEO of First NZ Capital (FNZC) for 15 years, stepping down from that role in early 2017. Scott has served on the Council of the University of Auckland since 2009 and was appointed Chancellor in 2017. He is a Director of Fisher and Paykel Healthcare and chairs their Audit and Risk Committee. Scott also serves on the Board of Mercury NZ Limited and NEXT Foundation. Previous roles have included Chairman of the Securities Industries Association, and membership of both the Capital Markets Development Taskforce, and the Financial Markets Authority Establishment Board. B.Com, Diploma of Business
10. Ashley WaughBoard Responsibilites Farmer-elected Director, Chair of the Risk Committee, Member of the Audit and Finance Committee and the People Culture and Safety CommitteeTerm of Offi ce Elected 2015Ashley Waugh was elected to the Fonterra Board in 2015. Ashley serves on the Board of Seeka Limited and the Colonial Motor Company Limited. He previously chaired the Board of Moa Group Limited. Ashley spent ten years with The New Zealand Dairy Board followed by eight years with National Foods in Australia including the last four years as Chief Executive Offi cer. Ashley lives on his dairy farm near Te Awamutu and has shareholding interests in Puke Roha Limited in Pokuru. Ashley has had hands-on experience as a leader of a consumer brands business and a track record of value creation, which underpins his expertise and interest in fi nancial discipline and risk management.BBS
11. John WilsonBoard Responsibilites Farmer-elected Director, Chair of the People, Culture and Safety CommitteeTerm of Offi ce Elected 2003, last re-elected 2015John Wilson was elected to the Fonterra Board in 2003 and became Chairman in 2012, stepping down in July 2018. Previously he served as the inaugural Chairman of the Fonterra Shareholders’ Council. John is a director of Turners & Growers Limited and the Hugh Green Group and its subsidiary companies. John also serves on the Executive Board of the New Zealand China Council. He is a chartered member of the Institute of Directors in New Zealand. John lives on his dairy farm near Te Awamutu and jointly owns a dairy farming business based near Geraldine, South Canterbury. John’s governance and leadership experience of diverse and complex businesses, includes co-operatives, extensive family and farming businesses, business councils and global industry bodies.B.Agr.Sc
FONTERRA ANNUAL REPORT 2018 45
For
per
sona
l use
onl
y
Mark V
an ZonM
ike Cronin
Kelvin Wickham
Judith Swales
Robert Spurway
Lukas ParaviciniM
arc Rivers
Miles H
urrell
1. 2. 3. 4. 5. 6. 7. 8.
1
6
5
2
23
4
5
7
8
OUR PEOPLE
Management Team
FONTERRA ANNUAL REPORT 201846
For
per
sona
l use
onl
y
1. Miles HurrellChief Executive Offi cerIn August 2018, Miles Hurrell was appointed as Chief Executive Offi cer. In Miles’ most recent position as Chief Operating Offi cer, Farm Source,™ he led Fonterra’s global Co-operative farming strategy which includes farmer services and engagement, milk sourcing and the chain of 70 Farm Source™ rural retail stores throughout New Zealand. Miles’ 19 years of experience in the dairy industry has spanned four continents. From 2010 to 2014, Miles was General Manager Middle East, Africa, Eastern Europe and Russia. In this position he led a period of sustained growth during a time of political unrest across these regions. He reset the African sales strategy and was a Director of Fonterra’s joint venture with Africa’s largest dairy company, Clover Industries Limited. From 2006 to 2008, Miles oversaw the streamlining of the Co-operative’s European operations before moving to the United States to establish new off shore partnerships. In 2014, Miles was appointed the Co-operative Aff airs Group Director and in 2016 he took up his role with Farm Source. Miles has completed management programmes at INSEAD (International Executive Development), London Business School (Finance), Kellogg’s North Western University (Global Sales) and IMD (marketing). He has also had governance roles with Prolesur, Falcon (China Farms), MyMilk and Global Dairy Platform.
2. Marc Rivers Chief Financial Offi cerMarc Rivers joined Fonterra in February 2018 as the Chief Financial Offi cer, responsible for the Co-operative’s fi nances, procurement and information systems. Marc is an experienced global fi nance executive with strong strategic leadership capability. Prior to joining Fonterra, Marc was the CFO at Roche Pharmaceuticals Division in Switzerland, with oversight of NZ$54 billion in sales including 14 manufacturing sites around the world. His division was responsible for product distribution for 140 countries, focussing on the innovation pipeline and customer and market development. Marc has worked in both emerging and established markets, including China, Japan, Thailand, Europe and the US. Marc has a strong track record and is known for his commitment to leading and developing his people while building diverse and inclusive teams. He has a Bachelor of Arts in International Studies and an International Masters of Business Administration, Finance and German from the University of South Carolina, Columbia USA.
3. Lukas ParaviciniChief Operating Offi cer Global Consumer and FoodserviceLukas Paravicini heads Fonterra’s Global Consumer & Foodservice business whose 11,000 people are committed to bringing dairy nutrition to 80 countries across the world. He fi rst joined Fonterra as CFO in 2013 after a long career with Nestlé where he held a number of senior positions including General Manager for Nestlé Professional Europe, CFO of Nestlé Brazil, Vice President of Global Business Services and CFO of Nestlé Professional, and Nestlé’s globally managed Out-of-Home business. Lukas’ extensive experience in dairy provides him with an in-depth understanding of how dairy can deliver people’s needs for delicious nutritious food. He has lived and worked in some of Fonterra’s most strategically important markets. He holds a Business and Administration degree from the University of Zurich, Switzerland, and speaks fi ve languages.
4. Robert SpurwayChief Operating Offi cer, Global OperationsRobert Spurway joined Fonterra in 2011. As Chief Operating Offi cer, Global Operations, Robert leads Fonterra’s global operations business and is responsible for the Co-operative’s manufacturing and supply chain operations in New Zealand and around the world. In his previous role he was responsible for overseeing milk collection, manufacturing and logistics for the Co-operative’s New Zealand milk supply. Prior to that, he was Fonterra’s South Island Regional Operations Manager. In this role, he oversaw the greenfi eld development of the Co-operative’s Darfi eld site. Robert has more than 25 years’ experience in the food and dairy industries. After managing the Northland Dairy Company’s Dargaville site, he moved to Australia in 1999, where he held various roles in Goodman Fielder Australia. From 2008 to 2011, Robert led two Australian food companies before returning to New Zealand. Robert holds a Bachelor of Engineering (Chemical and Materials).
5. Judith SwalesChief Operating Offi cer - Velocity and Innovation Judith Swales shapes the future of Fonterra by harnessing innovation, emerging technologies, game changing business models and new ways of working, while embedding a performance driven culture. She joined the Co-operative in 2013 as Managing Director Fonterra Oceania, where she led the successful turnaround of the Australian business and oversaw Fonterra Brands New Zealand. The daughter of a milkman, Judith grew up helping her father on his daily milk run.She has extensive experience in senior management and business turnarounds, and prior to joining Fonterra was the Managing Director of Heinz Australia, and CEO and Managing Director of Goodyear Dunlop, Australia and New Zealand. Before coming to Australia in 2001, Judith worked for a number of UK retailers which culminated in her move to Australia as the Managing Director of Angus and Robertson. She has served as a Non-Executive Director on the DuluxGroup Board since April 2011 and is a Director on the Global Dairy Platform Board. Judith has a degree in Microbiology and Virology.
6. Kelvin WickhamChief Operating Offi cer, NZMPKelvin Wickham leads the sales and marketing of all Fonterra ingredients globally, delivering solutions to our global customers, ensuring optimisation of supply and demand, commodity price risk management, and championing the NZMP™ brand. Kelvin has more than 29 years’ experience in the dairy industry and has played a key role in building markets, customer relationships and partnerships. His previous role of President Greater China and India focussed on directing the development of Fonterra’s business in these expanding markets, during which he oversaw a period of rapid growth. Prior to that, Kelvin led Fonterra’s Supplier and External Relations team, and was Managing Director of Fonterra’s Global Trade overseeing the launch of GlobalDairyTrade. From 2005 to 2007 he was the Director of Sales and Operations Planning. Kelvin holds a chemical and materials engineering degree, a Master of Management and a Diploma of Dairy Science and Technology.
7. Mike CroninManaging Director Corporate Aff airsMike is the Managing Director Corporate Aff airs, where he oversees Health, Safety, Resilience and Risk; Legal; Social Responsibility; Governance; Food Safety, Quality and Regulatory Aff airs; Global Stakeholder Aff airs; Communications; Advocacy and Fonterra Brand teams. Mike is also responsible for co-ordinating the CEO’s offi ce, the Fonterra Management Team, and the Fonterra Board.After joining Fonterra in 2002 Mike has worked on many of Fonterra’s most signifi cant projects, including the buyback of the Anchor brand in New Zealand, Trading Among Farmers and the Governance and Representation Review. Prior to 2014, Mike was the General Manager of Strategy Deployment. He was appointed Group Director Governance and Legal before taking on his current role in 2014. Mike has a Bachelor of Laws and Bachelor of Arts from the University of Auckland.
8. Mark Van ZonManaging Director of People and Culture Mark Van Zon was appointed Acting Managing Director of People and Culture in 2018 after Joanne Fair took up a secondment to lead Fonterra Brands New Zealand. Mark oversees the delivery of Fonterra’s people strategy, which includes innovative solutions to attract, develop and retain global talent, and to improve staff engagement across our 22,000 employees. Prior to joining Fonterra in 2017, Mark was based in Seattle and led Starbucks’ international reward team. His overseas experience also includes various Human Resources roles in the Netherlands and UK. Mark is a well-rounded Human Resources leader having worked across a range of industries including logistics, IT and consulting, retail and fast-moving consumer goods. Mark holds a Master of Commerce (Hons) from the University of Auckland.
FONTERRA ANNUAL REPORT 2018 47
For
per
sona
l use
onl
y
OUR PERFORMANCE
Group financial metrics
Milk Collection
2014
1,584
2015
1,614
2016
1,566
2017
1,526
2018
1,505
kgMS (millions)
8.500.10
8.40
2014
4.65
0.25
4.40
2015
4.30
0.40
3.90
2016
0.40
6.52
6.12
2017
6.79
0.10
6.69
2018
Total Cash Payout$ Farmgate Milk Price $ Dividend
Sales Volume (LME bn)1
2014
22.2
21.7
2015
22.8
21.5
2016
23.7
22.4
2017
22.9
21.3
2018
22.2
20.5
3.9 4.5 4.9 5.5 5.6
Ingredients Consumer and Foodservice
1,687
807
2017 20182014
n/a 600
2015
9801,556
2016
Additional Volume to Higher Value2
Cummulative Consumer and Foodservice (LME m)
Cummulative Advanced Ingredients (LME m)
Higher value products3 as % of total LMEs
473
45%42%
These charts have been selected to represent the fi nancial metrics for Fonterra. We have provided an historical summary of our performance which we intend to include in our annual results on an ongoing basis.
1 Does not add to total due to inter-group eliminations. Ingredients include China Farms.
2 Advanced ingredients split only from 2017.
3 Comprises Advanced Ingredients and Consumer and Foodservices products.
FONTERRA ANNUAL REPORT 201848
For
per
sona
l use
onl
y
Normalised EPS and Dividend Yield4
2014
10
1.6%
2015
29
4.4%
2016
49
2017
49
2018
24
EPS (cents) Dividend Yield
7.3%6.7%
1.7%
2015
Return on Capital (including intangibles and EAI5)
2014
4.1%
6.9%
2016
9.2%
2017
8.3%
2018
6.3%
CAPEX6
2014
969
2015
1,531
2016
944
2017
851
2018
861
$ Capex (millions)
Normalised Gross Margin
2014
2,462
0.11
2015
3,332
0.15
2016
3,636
0.15
2017
3,246
0.14
2018
3,152
0.14
$ GM (millions) $ GM/LME
Normalised EBIT$ EBIT (millions) $ EBIT/LME
2014
503
0.02
2015
974
0.04
2016
1,358
0.06
2017
1,155
0.05
2018
902
0.04
Leverage
2014
42.3
4.9x
2015
49.7
4.7x
2016
44.3
2017
44.3
2018
48.4
Gearing % Debt/EBITDA
2.8x3.5x
4.5x
Working Capital Days
2014
103
2015
87
2016
77
2017
75
2018
83
Free Cash Flow
2014
358
2015
–1,372
2016
2,184
2017
670
2018
600
$ Free Cash Flow (millions)
4 FY18 divided over volume weighted average FCG price of $5.84 across the year.
5 Equity accounted investments. 6 Calculated on the accrual basis.
FONTERRA ANNUAL REPORT 2018 49
For
per
sona
l use
onl
y
We continued to shift more volume to higher value products but we had less volume to sell due to record low opening inventories and lower milk collections in New Zealand. Our normalised earnings before interest and tax (EBIT) were down 22% to $902 million, including a downward adjustment to the Farmgate Milk Price of 5 cents per kgMS. The lower EBIT was due to the lower sales volumes, tighter margins due to the higher Farmgate Milk Price, especially the increase late in the season, and higher operating costs. We also had two large one off items, the payment for the Danone arbitration award and Beingmate write-down, that signifi cantly impacted our reported EBIT, which was down 77% to $262 million. Our return on capital was unsatisfactory at 6.3%, down 2% compared to last year.
As a result of this disappointing fi nancial performance, we decided to limit our dividend to just the 10 cents paid in April and reduce the Farmgate Milk Price to strengthen our balance sheet and protect the long-term interests of the Co-operative.
1 This includes the normalisation of Beingmate investment and the Danone arbitration decision.
2 Ratio is economic net interest bearing debt divided by earnings before interest, tax, depreciation and amortisation (EBITDA). Both debt and EBITDA are adjusted for the impact of operating leases.
3 Gearing ratio is economic net interest bearing debt divided by total capital. Total capital is equity excluding the hedge reserves, plus economic net interest bearing debt.
4 Return on capital is calculated as normalised EBIT, less a notional tax charge divided by capital employed. Capital employed includes brands, goodwill and equity-accounted investments. Return on capital, excluding brands, goodwill and equity-accounted investments was 8.0% (31 July 2017: 11.1%).
OUR PERFORMANCE
Group Overview
It was a mixed year for us. On one hand we saw a 9% uplift in the Farmgate Milk Price to $6.69 per kgMS. On the other, our earnings performance was disappointing and well below our targets.
FOR THE YEAR ENDED
NZD MILLION 31 JULY 2018 31 JULY 2017 CHANGE
Volume (LME, billion) 22.2 22.9 (3%)
Volume (000 MT) 4,123 4,180 (1%)
Normalised sales revenue 20,431 19,214 6%
Normalised gross margin 3,152 3,246 (3%)
Normalised gross margin percentage 15.4% 16.9% –
Normalised operating expenses (2,496) (2,335) 7%
Reported EBIT 262 1,120 (77%)
Normalised EBIT1 902 1,155 (22%)
Net fi nance costs (416) (355) 17%
Tax (expense)/credit (42) (20) 115%
Net (loss)/profi t after tax (196) 745 (126%)
Earnings per share (cents) (14) 46 (130%)
Normalised earnings per share (cents) 24 49 (51%)
Dividend per share (cents) 10 40 (75%)
Adjusted debt to EBITDA2 (ratio) 4.5X 3.5X –
Gearing ratio3 48.4% 44.3% –
Return on capital4 6.3% 8.3% –
Free cash fl ow 600 670 (10%)
Capital expenditure 861 851 1%
FONTERRA ANNUAL REPORT 201850
For
per
sona
l use
onl
y
Normalised EBIT
$902 m 22%
Net Loss After Tax
$196 m
Normalised Earnings Per Share
51% 24 cents
Return on Capital
2% 6.3%
FONTERRA ANNUAL REPORT 2018 51
For
per
sona
l use
onl
y
In the 2018 fi nancial year, Fonterra grew total normalised revenue by 6% where higher product pricing off set the decline in overall sales volumes of Liquid Milk Equivalents (LMEs).
Our overall sales volumes of LMEs were down 3% mainly due to the lower sales volumes in our Ingredients business where we had lower opening inventory and lower collections in New Zealand. We continued to sell increased volumes of higher value products with sales of Advanced Ingredients increasing by 334 million LMEs and we also shifted 131 million more LMEs into Consumer and Foodservice. This increased sales volumes in Consumer and Foodservice by 2%, which was below our targets and mainly due to customer demand being impacted by higher prices and increased competition.
Our group normalised gross margin per LME of $0.14 was in line with the previous year. However, the lower sales volumes and higher group operating costs meant normalised EBIT decreased by $253 million to $902 million. After two years of reducing our costs, normalised group operating costs were 7% higher than last year with Ingredients and centrally held costs making up the majority of the increase. In Ingredients we had higher operating costs across the business, including some one-off s. We also had costs for new category growth and higher costs in Australia as we expanded our business. In addition, we had higher IT and R&D expenditure to support the future development of our Co-operative.
In Ingredients, normalised EBIT decreased by 7% to $879 million. Gross margin in New Zealand Ingredients improved on last year but was off set by other parts of Ingredients and as a result normalised gross margin was stable. The higher operating costs resulted in the lower EBIT.
Normalised EBIT for Consumer and Foodservice was down 9% on last year to $525 million1. Higher prices for ingredients, especially for fat products, impacted demand and while we increased prices through our pricing and marketing strategies we were not able to fully recover the higher input costs.
China Farms recorded a direct loss of $9 million for the year. Production, and consequently sales volumes, were down due to some changes in the herd to better match the annual highs and lows in customer demand for milk. We also had to make an unbudgeted investment in our effl uent management to meet discharge standards. Next year we expect volumes to increase and on-farm productivity to improve.
Our Ingredients business is responsible for purchasing the raw milk from the farms and capturing the highest value for this milk, and this resulted in an additional $30 million loss. We are progressing our strategy of moving this milk up the value curve through partnerships with the likes of Hema Fresh, Starbucks, McDonald’s and other Quick Service Restaurants (QSR) channels. At less than 5% of our milk from China Farms, these are still small volumes but our plan is to continue to grow them over time.
OUR PERFORMANCE
Group Overview CONTINUED
Normalised Gross Margin
2014
2,462
0.11
2015
3,332
0.15
2016
3,636
0.15
2017
3,246
0.14
2018
3,152
0.14
$ GM (millions) $ GM/LME
Normalised EBIT$ EBIT (millions) $ EBIT/LME
2014
503
0.02
2015
974
0.04
2016
1,358
0.06
2017
1,155
0.05
2018
902
0.04
1 Normalised EBIT has been restated for FY17 from $614 million to $576 million as we reallocated some group overhead costs to markets.
FONTERRA ANNUAL REPORT 201852
For
per
sona
l use
onl
y
Net fi nance costs were $61 million higher than last year due to higher average borrowings and the one-off $26 million interest payment made to Danone. Our gearing ratio increased to 48.4% from 44.3% last year. This included the result of the Danone arbitration award and impairment of Beingmate, which collectively accounted for 3.2% of the decline. Our working capital days went up by eight days from 75 to 83 because of higher carrying values of inventory and receivables, due to the late season increase in the Farmgate Milk Price. Free cash fl ow, being the cashfl ow that is available to pay interest and dividends, and to reduce debt, decreased by $70 million to $600 million. This was because of lower earnings, and higher working capital and capital expenditure for the year. Our capital expenditure went up to $861 million compared to $851 million last year and included a number of big projects such as construction of a third mozzarella plant at our Clandeboye site, a cream cheese plant at our Darfi eld site and the expansion of our Stanhope plant, which will increase its cheese production capacity by 35,000 metric tonnes.
This was a year of challenging operating performance and we are focussed on improving the business performance of all assets. This combined with strong fi nancial discipline will strengthen the balance sheet and improve the return on invested capital.
Normalised Operating Expenses
$2,496 m 7%
Free Cash Flow
$600 m 10%
Gearing Ratio
4.1% 48.4%
FONTERRA ANNUAL REPORT 2018 53
For
per
sona
l use
onl
y
OUR PERFORMANCE
Ingredients
VolumeMilk collection across New Zealand for the 2017/18 season was 1,505 million kgMS, down 1% compared to the previous season. Diffi cult weather conditions were the prevailing theme this season with some regions hit harder than others. Many North Island and upper South Island farmers experienced extremely wet conditions in spring causing damage to their pasture, stunting both grass growth and supplementary feed production. This was followed, in some regions, by diffi cult dry conditions which aff ected pasture growth across the rest of the season.
In Australia, milk collection for the 2017/2018 season reached 153 million kgMS, 30 million kgMS higher than the 2016/17 season. Strong volume growth in Australia was predominantly due to increased market share as we gained supply from competitors.
Ingredients’ sales volumes were down 4% for the year, driven by the lower opening inventories and the lower collections in New Zealand. This year we increased sales of Advanced Ingredients by 334 million LMEs, which is consistent with our strategy of shifting more of our farmers’ milk into higher value products. The main products that contributed to the increased sales of Advanced Ingredients were premium consumer powders into the Middle East and South East Asia.
1 China raw milk gross margin represents the net benefi t/(loss) from the external sale of milk produced by China Farms and sold to the Ingredients business in China at an internal raw milk price.
2 Normalised EBIT for Ingredients excludes unallocated costs.
3 Return on capital is calculated as normalised EBIT, less a notional tax divided by capital employed. Capital employed includes brands, goodwill and equity-accounted investments. Return on capital, excluding brands, goodwill and equity-accounted investments was 8.2% (31 July 2017: 10.3%).
In our Ingredients business normalised sales revenue increased by 7% where higher sales prices more than off set the lower sales volumes due to record low opening inventory and lower collections. Our total normalised gross margin was in line with last year – however, increased operating costs to achieve these gross margins meant our EBIT declined by 7% to $879 million.
FOR THE YEAR ENDED
NZD MILLION 31 JULY 2018 31 JULY 2017 CHANGE
Volume (LME, billion) 20.5 21.3 (4%)
Volume (’000 MT) 2,986 3,019 (1%)
Normalised sales revenue 16,306 15,266 7%
Normalised total gross margin 1,472 1,473 0%
– New Zealand ingredients 1,346 1,239 9%
Reference products 555 428 30%
Non-reference products 791 811 (2%)
– Australia ingredients 77 78 (1%)
– China raw milk1 (30) (38)
– Other gross margin 79 192 (59%)
Normalised EBIT2 879 943 (7%)
Gross margin ($ per MT) – New Zealand Ingredients
Reference products ($ per MT) 309 232 33%
Non-reference products ($ per MT) 1,275 1,165 9%
Return on capital3 8.3% 9.8% –
Summary Financials
FONTERRA ANNUAL REPORT 201854
For
per
sona
l use
onl
y
FONTERRA ANNUAL REPORT 2018 55
FOR THE YEAR ENDED
NZD MILLION 31 JULY 2018 31 JULY 2017 CHANGE
Production Volume (’000 MT)
Reference products 1,849 1,837 1%
Non-reference products 762 749 2%
Sales Volume (’000 MT)2
Reference products 1,794 1,841 (3%)
Non-reference products 620 696 (11%)
Revenue Per MT (NZD)2
Reference products 4,851 4,262 14%
Non-reference products 5,637 5,567 1%
Added
334 million LMEs to Advanced Ingredients
Normalised Total Gross Margin
$1,472 m in line with 2017
ValueIngredients’ revenues were up 7% on last year due to higher commodity prices and higher sales volumes in Australia, off setting the lower opening inventory and milk collections in New Zealand.
Our New Zealand Ingredients business manufactures fi ve ingredient products that inform the Farmgate Milk Price. These are referred to as reference products, while all other products are referred to as non-reference products. Revenue per metric tonne for reference products was up 14% and remained largely fl at for non-reference products.
Total Ingredients’ normalised gross margin was in line with last year, and includes the adjustment to the milk price of 5 cents per kgMS, benefi tting gross margin by $74 million. This was achieved on a lower sales volume and therefore represents an improved gross margin per LME.
New Zealand Ingredients’ gross margin increased 9% to $1,346 million. Gross margins for reference products were $555 million, or $309 on a per metric tonne basis, which represents an increase of 33%. This included recovering pricing lags from the previous year and is in line with the margin per metric tonne for FY16.
The gross margins for non-reference products were $791 million, down 2% on last year because of lower sales volumes. Gross margin per metric tonne for non-reference products was 9% higher at $1,275.
Australian ingredients' gross margin was in line with last year including a planned 40 cents per kgMS payment to suppliers. EBIT decreased by 44% because last year included some one-off benefi ts that were not repeated this year.
The overall Ingredients’ gross margin was also impacted by a $30 million loss representing the diff erence between the domestic milk price and the internal raw milk price paid to China Farms. Last year this loss was $38 million. We include the China Farms’ volumes and earnings in Ingredients as we use our sales expertise to maximise sales revenue of the raw milk.
The improved gross margin for New Zealand Ingredients was off -set by lower margins in “Other gross margin”. This included a reduction in profi tability from globally sourced products and last year we had a number of one-off benefi ts that were not repeated this year.
Overall, normalised gross margin was in line with last year but our operating costs were higher and there were some one-off s. In addition, we had costs for new category growth and higher costs in Australia as we expanded our business. This resulted in normalised EBIT of $879 million, down 7% on last year.
1 Table excludes bulk liquid milk. The bulk liquid milk volume for the year ended 31 July 2018 was 68,000 MT of kgMS equivalent (year ended 31 July 2017 was 76,000 MT of kgMS equivalent).
2 Revenue and sales volume exclude Foodservice volumes to China, Latin America and Quick Service Restaurant channels. This volume for the year ended 31 July 2018 was 198,000 MT (year ended 31 July 2017 was 143,000 MT).
New Zealand Ingredients’ Revenue and Volume1
FONTERRA ANNUAL REPORT 2018 55
For
per
sona
l use
onl
y
Consumer and FoodserviceOUR PERFORMANCE
We continued to move more volume into our higher value Consumer and Foodservice business where our sales volumes grew by 131 million LMEs, 2% up on last year.
This was less than our targeted growth and was mainly due to higher prices, product mix changes and the underperformance of our New Zealand business. We achieved volume growth in all other regions with the strongest growth from our Greater China business.
Higher ingredient prices meant signifi cantly higher input prices in both our Consumer and Foodservice businesses.
Through our pricing strategies and brand strength our increased prices contributed an additional $551 million to earnings but this was not suffi cient to cover the additional $626 million of costs we incurred from the higher input costs. As a result, our normalised EBIT was down 9% on last year to $525 million1.
1 Normalised EBIT has been restated for FY17 from $614 million to $576 million as we reallocated some group overhead costs to markets.
2 Return on capital is calculated as normalised EBIT, less notional tax charge divided by capital employed. Capital employed includes brands, goodwill and equity-accounted investments. Return on capital, excluding brands, goodwill and equity-accounted investments was 35.1% (31 July 2017: 42.7%).
3 Includes net other operating income, net foreign exchange gains/losses and share of profi t/loss of equity-accounted investees.
FONTERRA ANNUAL REPORT 201856
For
per
sona
l use
onl
y
Greater China
In Greater China our volumes went up 11% driven by strong growth in Mainland China. Consumer volumes increased 24% on last year with strong growth in all Anchor™ products. Based on market share, Anchor™ UHT milk is now the number one imported milk in Mainland China, in both e-commerce and offl ine channels. Foodservice volumes increased 9% on last year with continued momentum in UHT culinary cream through expansion into new cities and our launch of a beverage house channel which includes tea houses that sell tea macchiatos. In Greater China Foodservice there was a signifi cant shift in product mix from butter to culinary UHT creams due to the increase in butter prices. Butter has a high ratio of LMEs per metric tonne so this shift in our product mix was one of the key reasons our LME growth in Greater China was not as high as the previous year.
Latin AmericaLatin America delivered 12 million more LMEs than last year. SoproleTM had another strong year with its volumes up 31 million LMEs which is 7% up on last year. We had lower sales in Venezuela as the socio-economic situation impacted consumer demand and there were also diffi culties accessing the raw ingredients and packaging materials to run the factories at optimal levels. In Brazil there were also diffi cult economic conditions but we were able to keep volumes in line with last year. We were able to extend our leadership positions in the children’s category and in the northeast of Brazil.
AsiaWe had consistent growth across all Asian, Middle East and African markets. Volumes were up by 71 million LMEs, a 4% increase on last year – this includes growth in both Consumer and Foodservice. We achieved our strongest growth in Consumer in Malaysia and Sri Lanka. In Foodservice, the Middle East, Vietnam and Thailand had strong performances with volume growth from butter in the Middle East and cream in Vietnam and Thailand. In Consumer, growth was driven by Fernleaf powders in Malaysia, the launch of our Red Cow brand in Sri Lanka and the Middle East and the re-launch of Anlene™ across the Asian region.
OceaniaVolumes were down 5% because of challenges in our New Zealand business and marginally lower volumes in Australia. New Zealand’s volumes were down 70 million LMEs, 9% lower than last year. This was due to the issues with our move to a new distribution centre, which we highlighted in our interim results, combined with higher prices and changes in consumer preferences. We have now put in place a plan for turning around New Zealand’s performance. In Australia, Foodservice volumes were fl at. Excluding the Wagga Wagga Route business divested in October 2016, Consumer achieved a volume increase versus 2017. This was primarily due to liquid milk, Western Star butter sales and recently launched Western Star cream.
Volume by region
Content for this page in progress
Greater China LME
1,413 million
Latin America LME
747million
Asia LME
1,773 million
Oceania LME
1,656 million
5%
11%
2%
4%
FONTERRA ANNUAL REPORT 2018 57
For
per
sona
l use
onl
y
Consumer and Foodservice CONTINUED
OUR PERFORMANCE
Greater ChinaIn Greater China, we delivered normalised EBIT of $165 million, down 19% on last year’s $204 million. Foodservice margins declined to 15.2% compared to 23.7% last year. The main reason was an increase in input costs as fat prices rose signifi cantly and impacted the profi tability of butter. In addition, there was also increased competition in UHT cream from Europe. Our pricing strategy was set to maintain our market share so we can benefi t from future product price increases. Consumer gross margins were steady, and combined with increased volumes, this business broke-even two years ahead of our business plan. This was achieved through the popularity of Anchor™ UHT milk which holds the number one market share in the imported UHT milk category, for both the online and offl ine channels. In addition, the launch of Anchor™ ambient yoghurt and the Daily Fresh milk range into Alibaba’s new premium food stores, Hema Fresh, contributed to this result.
Latin AmericaLatin America increased EBIT by 29% from $91 million in 2017 to $117 million in 2018. This was driven by another year of solid performance from SoproleTM in the mature cheese and yogurt categories. In addition, Brazil turned around its performance and went from a loss position to breakeven in a challenging economic environment. In Brazil’s children’s category, we grew our market share ahead of our competitors and now hold 32% market share by value. There was a one-off benefi t of around $14 million from restructuring our USD obligations in Venezuela.
AsiaAsia delivered EBIT of $176 million compared to last year’s $194 million, down 10%. In Consumer, our pricing strategies and marketing initiatives enabled us to keep our gross margin percentage in line with last year. However, price controls in some local markets did impact our profi tability because we were not able to fully pass through higher input costs. This impacted us most signifi cantly in Sri Lanka. We launched our Red Cow brand in Sri Lanka and the Middle East to support growth in these regions. The lower price point makes it attractive to customers and contributes to our margin. In Foodservice, we increased our sales volumes by 6% but the higher input costs meant our margins and profi tability were down on last year.
OceaniaOceania delivered EBIT of $67 million, 23% less than last year. This lower profi tability was due to operational challenges in New Zealand which experienced lower margins from the higher than expected costs involved in moving to and starting up our new distribution centre. This also impacted customer service levels and sales volumes, which were down 9% on last year. In addition, butter sales declined because of higher prices. However, in Australia, we were able to maintain our number one market share position in cheese and spreads.
LME (BILLION) NORMALISED EBIT ($M)
YEAR ENDED 31 JULY 2018
YEAR ENDED 31 JULY 2017 CHANGE
YEAR ENDED 31 JULY 2018
YEAR ENDED 31 JULY 2017 CHANGE
Greater China 1.41 1.28 11% 165 204 (19%)
Latin America 0.75 0.74 2% 117 91 29%
Asia 1.77 1.70 4% 176 194 (10%)
Oceania 1.66 1.74 (5%) 67 87 (23%)
Consumer and Foodservice 5.59 5.46 2% 525 576 (9%)
Value by region
Consumer and Foodservice Performance
FONTERRA ANNUAL REPORT 201858
For
per
sona
l use
onl
y
Added
131 million LMEs to Consumer and Foodservice
Latin America EBIT
$117 m 29%
Oceania EBIT
$67 m 23%
FONTERRA ANNUAL REPORT 2018 59
For
per
sona
l use
onl
y
OUR PERFORMANCE
Our farming operations in China are comprised of seven farms across two hubs, producing high quality fresh milk.
China Farms
VolumeYutian is our most established hub with around 17,000 milking cows. Our second hub, Ying, is our newest hub with around 14,000 milking cows.
Excluding one-off milk powder sales in FY17, sales volumes decreased by 12% to 273 million LMEs this year. This was predominantly due to lower production as changes are made to the herd profi le to improve its future productivity. As these changes take eff ect, we expect volumes to increase 10% per annum to reach 370 million LMEs by 2021.
ValueOur strategy for China Farms is to deliver the highest value through integrating them into our Ingredients and Consumer and Foodservice businesses in Greater China. China Farms' partnerships with Hema Fresh, Starbucks, McDonald’s and other QSR channels continue to build positive momentum, as its raw milk goes into higher value channels. At less than 5% of our milk from China Farms these are still small but our plan is to continue to grow them over time.
We also aim to reduce our cost base on an ongoing basis. However, this year several one-off costs to meet discharge standards combined with higher feed costs due to tariff s and higher commodity prices have impacted earnings, resulting in a direct normalised EBIT loss of $9 million. Excluding these one-off s, China Farms have reduced their costs by 6% since 2016 and will continue to focus on improving their cost base through operational and procurement effi ciencies.
Our Ingredients business is responsible for purchasing the raw milk from the farms and capturing the highest value for this milk, and this resulted in an additional $30 million loss.
FONTERRA ANNUAL REPORT 201860
For
per
sona
l use
onl
y
FOR THE YEAR ENDED
NZD MILLION 31 JULY 2018 31 JULY 2017 CHANGE
Volume (LME, billion) 0.3 0.3 (19%)
Volume (000 MT) 22 26 (15%)
Sales revenue 262 269 (3%)
Normalised EBIT (9) 1 (1,734%)
Sales volumes
273 million LMEs
12%1
Costs down 6% since 2016
Launched the Daily Fresh milk range into Alibaba’s new premium food stores, Hema Fresh
1 Excluding one-off milk powder sales in FY17.
FONTERRA ANNUAL REPORT 2018 61
For
per
sona
l use
onl
y
Historical Financial SummaryOUR PERFORMANCE
Market Statistics
JULY 2018 JULY 2017 JULY 2016 JULY 2015 JULY 2014
Fonterra Seasonal Statistics
Total New Zealand milk collected (million litres) 16,932 17,051 17,585 18,143 17,932
1 All season statistics are based on the 12-month milk season of 1 June–31 May.
2 From the beginning of the 2009 season the Farmgate Milk Price has been determined by the Board. In making that determination, the Board takes into account the Farmgate Milk Price calculated in accordance with the principles set out in the Farmgate Milk Price Manual.
3 FY18 dividend over volume weighted average FCG price of $5.84 for the period 1 Aug-31 Jul.
4 Average payout for a 100% share-backed supplier.
5 Retentions are calculated as net profi t after tax attributable to Co-operative shareholders at 31 July divided by the number of shares at 31 May, less dividend per share.
6 Weighted average share price represents the average price Fonterra Co-operative Group shares traded at weighted against the trading volume at each price over the period 1 August-31 July.
7 Source: Fonterra Farmgate Milk Price Statement representing the weighted-average United States Dollar contract prices of Reference Commodity Products.
8 Source: Oceania Export Series, Agricultural Marketing Service, US Department of Agriculture.
9 Fonterra’s average conversion rate is the rate that Fonterra has converted net United States Dollar receipts into New Zealand Dollars based on the hedge cover in place.
10 Includes sales to other strategic platforms. Represents external sales.
11 Normalised earnings before interest, tax, depreciation and amortisation and is calculated as profi t for the period before net fi nance costs, tax, depreciation and amortisation.
12 Represents segment earnings before unallocated fi nance income, fi nance costs and tax. For the years ended 31 July 2016, 2015 and 2014, Greater China has been disclosed separately in alignment with the disclosures in the segment note. For the years ended 31 July 2013 and earlier, Greater China was part of Asia. The year ended 31 July 2015 has been restated to refl ect changes to the organisation of business units that occurred in the year ended 31 July 2016. The year ended 31 July 2014 has been restated to refl ect changes to the organisation of business units that occurred in the year ended 31 July 2015.
13 Normalised Net Profi t after Tax attributable to equity holders of the Parent.
14 Normalised EBITDA divided by sales revenue.
15 Normalised EBIT divided by sales revenue.
16 Normalised net profi t after tax divided by sales revenue.
17 Cash fl ow generated by normal business operations, less net taxes paid.
18 Working Capital is calculated as current trade receivables plus inventories, less current trade payables and accruals. It excludes amounts owing to suppliers and employee entitlements.
19 Economic net interest-bearing debt refl ects total borrowings less cash and cash equivalents and non-current interest-bearing advances adjusted for derivatives used to manage changes in hedged risks.
20 Economic debt to debt plus equity ratio is calculated as economic net interest-bearing debt divided by economic net interest-bearing debt plus equity excluding hedge reserves.
21 Debt payback ratio is economic net interest bearing debt divided by EBITDA. Both debt and EBITDA are adjusted for the impact of operating leases.
22 Capital employed excludes brands, goodwill and equity accounted investments.
23 Capital expenditure comprises purchases of property, plant and equipment and intangible assets, and net purchases of livestock.
24 Return on capital is calculated as normalised EBIT, less a notional tax charge divided by capital employed including brands, goodwill and equity accounted investments.
25 Return on capital is calculated as normalised EBIT, less equity accounted investees’ earnings, less a notional tax charge, divided by capital employed.
26 Figures excludes bulk liquid milk. The bulk liquid milk volume for the year ended 31 July 2018 was 68,000 MT of kgMS equivalent (year ended 31 July 2017 was 76,000 MT of kgMS equivalent).
27 Revenue and sales volume exclude Foodservice volumes to China, Latin America and Quick Service Restaurant channels. This volume for the year ended 31 July 2018 was 198,000 MT (year ended 31 July 2017 was 143,000 MT).
28 Normalised gross margin divided by sales revenue.
29 Normalised EBIT divided by revenue.
30 Adjusted to refl ect normalisation adjustments.
31 Summing of individual numbers from the regional and divisional breakdown may not add up to the totals in each category due to rounding.
32 Includes share of Consumer and Foodservice overhead allocations, the total impact of which is $59 million.
Notes to the Historical Financial Summary
FONTERRA ANNUAL REPORT 2018 69
For
per
sona
l use
onl
y
The Board, Shareholders’ Council and Management of Fonterra consider that strong governance plays a critical role in the success of our Co-operative and are committed to achieving the highest standard of corporate governance, representation and leadership.
Corporate Governance
To support this the Board has developed governance systems that reflect Fonterra’s unique characteristics and requirements as a significant New Zealand based co-operative competing in the global dairy market.
Fonterra continuously reviews its governance representation and leadership to ensure they reflect best practice for our Co-operative.
This Corporate Governance statement is current as at 13 September 2018 and has been approved by the Fonterra Co-operative Group Limited Board.
CHANGES TO THE FONTERRA BOARD
In line with the changes approved by farmer shareholders in October 2016, from 2 November 2017 the number of Directors elected by farmer shareholders (Farmer Directors) on the Board is not more than seven, with not more than four Directors appointed by the Board (Appointed Directors). There were a number of changes to the Fonterra Board during the financial year ending 31 July 2018. In November 2017:
– Mr David Jackson, an Appointed Director, retired and Mr Bruce Hassall was appointed to the Board to fill this vacancy.
– Mr Ian Farrelly’s appointment to the Board completed.
– Ms Leonie Guiney and Mr David McLeod, both Farmer Directors, retired from the Board and Mr Brent Goldsack and Mr Andrew Macfarlane were elected to the Board as Farmer Directors.
OUR CORPORATE GOVERNANCE
COMPLIANCE WITH BEST PRACTICE GOVERNANCE STANDARDS
The Board’s governance framework takes into consideration contemporary standards in New Zealand and Australia, including the principles in the NZX Corporate Governance Code which came into effect for reporting periods from 1 October 2017 (NZX Code).
Fonterra focusses on governance in a way that promotes:• the interests of our farmer shareholders, unitholders
and other key stakeholders
• Fonterra’s Co-operative philosophy, which is largely expressed through our Co-operative principles
• transparency, giving our farmer shareholders, unitholders and other stakeholders the information they need to assess our performance
• effective risk management and compliance to ensure that Fonterra meets its business objectives and all legal and reporting requirements
• an appropriate balance between the roles and responsibilities of the Board and Management
• communication with important stakeholder groups, including farmer shareholders, employees, customers, unitholders, debt investors, governments and the communities Fonterra works in.
FONTERRA ANNUAL REPORT 201870
For
per
sona
l use
onl
y
Principle 1: Code of Ethical BehaviourCODE OF ETHICS
A culture of honesty and integrity is integral to Fonterra’s reputation and commitment to become the world’s most trusted source of dairy nutrition. Fonterra expects its Directors, officers and employees to maintain high ethical standards and to operate ethically and legally in the countries where we do business, underpinned by its four values - especially ‘Do What’s Right’.
Fonterra’s code of ethics is made up of three documents: Code of Business Conduct - The Way We Work, the Board Charter and Fonterra’s Ethical Behaviour Group Policy. These documents set clear expectations for our Directors and employees regarding ethical behaviour including the requirement for honesty and integrity, dealing with conflicts of interest, the use of corporate information and assets and property, giving and receiving gifts, procedures for whistle blowing and managing breaches. All three documents are required to be reviewed and approved annually. The Board has also developed a Code of Conduct for Directors.
The Way We Work also provides practical guidance on how to apply Fonterra’s four values in everyday situations with farmer shareholders, unitholders, customers, suppliers and the wider community.
Fonterra’s Ethical Behaviour Group Policy and The Way We Work are published in multiple languages and are available to all employees on Fonterra’s intranet. As with other Fonterra Group Policies, employee training is included within Fonterra’s global induction programme and annually refreshed. Individuals are assessed to ensure understanding of Group Policies and an annual certification process promotes compliance.
Fonterra funds an independently operated whistle-blowing hotline. The hotline gives individuals a confidential channel (by phone, email, mail, or online) to report concerns about behaviour that is unethical or does not meet the standards described in The Way We Work. This hotline is available in all regions where Fonterra operates. In the 2018 financial year, 42 disclosures were made globally to the hotline. All disclosures were fully investigated, appropriate action taken and timely updates made available to the whistle-blower.
Fonterra operates a Conflict of Interest Register where employees must enter all actual or potential conflict of interests. Fonterra also operates a Gift & Entertainment Register where employees must record all gifts given or received, and hospitality and entertainment with third parties. The Way We Work, the Board Charter and Fonterra’s Ethical Behaviour Group Policy are available on www.fonterra.com.
SECURITIES TRADING POLICY
Fonterra has adopted a Securities Trading Policy that details the rules for trading in shares, capital notes, retail bonds, units, milk price futures and options traded on the NZX and other listed securities of Fonterra or the Fonterra Shareholders’ Fund from time to time. The policy applies to Directors, officers, employees and contractors of the Fonterra Group (globally) and members of the Shareholders’ Council and Milk Price Panel, and is additional to legislative requirements for trading securities in New Zealand and Australia.
The Securities Trading Policy is available, along with other key Group Policies on www.fonterra.com.
All Directors comply with the legislative requirements for disclosing interests in listed voting securities of Fonterra and its related companies.
Principle 2: Board Composition and PerformanceBOARD CHARTER
The Board Charter includes details about the Board composition and procedures including the Chairman’s election and role, the Board’s relationship with Management, incident management engagement, training provided to Directors, and the process for assessing the Board’s performance.
The Charter is reviewed each year. The Board Charter and the Charters of the Board Committees are available on www.fonterra.com.
BOARD APPOINTMENTS
The Constitution of Fonterra provides for not more than 11 Directors and sets out how they are appointed.
In accordance with the Constitution, not more than seven Directors are elected by farmer shareholders from the shareholder base (Farmer Directors), and not more than four Directors are appointed by the Board (Appointed Directors).
The Board is committed to building capabilities and maintaining the highest standards of governance. The Board considers it important that there is a good balance of experience on the Board. A list of attributes that all Directors must be able to demonstrate has been developed by the Board and is reviewed annually.
The Board has also developed a list of skills that the Board believes are required to effectively govern a complex, international co-operative, operating in multiple markets, answering to diverse stakeholders. The skills list is reviewed annually and, if required, updated. The Board then develops a Skills Matrix by assessing the required weighting of each skill against the aggregate skills of the current Board.
The Skills Matrix is used to identify the skills to be targeted in each year, through the Farmer Director election process and in the appointment of the Appointed Directors. The list of attributes and skills, the Skills Matrix and the Board’s targeted skills are published each year as part of the Farmer Director election process to assist potential candidates in assessing their suitability and to assist farmer shareholders when assessing the candidates put forward for election.
Corporate Governance CONTINUED
FONTERRA ANNUAL REPORT 2018 71
For
per
sona
l use
onl
y
A three member Independent Selection Panel recommends appropriate candidates to the Board’s Nominations Committee to be put to farmer shareholders for their consideration to be elected as Farmer Directors. The members of the Independent Selection Panel are all independent of Fonterra. One member is appointed by the Board, one by the Shareholders’ Council and a third appointed by the other two members of the panel. In addition to candidates recommended by the Nominations Committee, there is a self-nomination process where candidates can propose themselves for election as Farmer Directors with the support of 35 shareholders.
The Farmer Directors are elected by postal ballot and online voting by farmer shareholders. The voting packs circulated to all farmer shareholders include biographical information on each candidate including relevant skills and experience. The elections are overseen by the Shareholders’ Council.
The People, Culture and Safety Committee oversees the process for identifying and recommending potential Appointed Directors. Prior to appointment by the Board, the Fonterra Shareholders’ Fund is consulted. The Appointed Directors are ratified by farmer shareholders at the next Annual Meeting.
Appointed Directors are selected to enable the Board to access a full complement of skills and competencies needed to lead an enterprise of Fonterra’s size, global reach and complexity.
They bring to the Board perspectives, experience and skills to complement and enhance the attributes and skills provided by the Farmer Directors.
DIRECTOR INDEPENDENCE
The rules of the Fonterra Shareholders’ Market (FSM Rules) require Fonterra to have a minimum of two Independent Directors or if there are eight or more Directors, three or one-third of the total number of Directors of Fonterra, whichever is greater. With Fonterra’s current Board of 11 Directors, four must be Independent Directors.
In order to be an Independent Director, a Director must not be an executive officer of Fonterra, or have a ‘disqualifying relationship’.
A Director has a disqualifying relationship where he or she has a direct or indirect interest or relationship that could reasonably influence, in a material way, the Director’s decisions in relation to Fonterra. The FSM Rules contain specific examples of what may give rise to a disqualifying relationship. Appointed Directors cannot be shareholders and are expected to maintain independence for the length of their term.
Farmer Directors must be qualified as farmer shareholders under section 12.3 of the Constitution and are therefore not considered Independent Directors.
As at 31 July 2018, Clinton Dines, Bruce Hassall, Simon Israel and Scott St John each did not have (and continue not to have) any disqualifying relationship in relation to Fonterra and were therefore Independent Directors. David Jackson was an Independent Director until his resignation with effect from 2 November 2017.
John Monaghan, who is a Farmer Director, is the Board-elected Chairman.
DISCLOSURE
Information about each Director (including experience, length of service, independence and ownership interests) is disclosed at the end of this section or in the statutory information section of this Annual Review, and is also available on www.fonterra.com.
DIVERSITY & INCLUSION POLICY
Embedding diversity and inclusion in how we think, act and operate enables innovation to flourish throughout Fonterra and is fundamental to delivering our sustainable Co-operative ambition.
Fonterra has published its Diversity and Inclusion Policy on www.fonterra.com and appointed a dedicated Diversity and Inclusion Manager to drive our global strategic framework.
Fonterra’s Diversity and Inclusion Policy has three key areas of focus:
Our People: attracting and selecting, developing and promoting and retaining diverse talent, while avoiding practices that are discriminatory or exclusive.
Our Strategy: ensuring our organisation reflects the diversity of our markets, customers, stakeholders and the communities in which we operate.
Our Identity: respecting, leveraging and embracing the unique skills and diverse perspectives of our people, reflecting a core Fonterra value of ‘Do What’s Right’.
DIVERSITY AND INCLUSION TARGET AND OBJECTIVES
In 2018, Fonterra formalised its commitment to increasing the representation of women and ethnic minorities within senior leadership levels. The Board approved aspirational targets and objectives to increase women in leadership from current levels of around 33% to 50%1 by 2022 and further targeting a mix of 20% ethnic diversity within global leadership levels2.
To achieve our gender and ethnicity targets, the objective of ensuring a balance of 50/50 gender balance which comprises 20% ethnic diversity of candidates for long and short-lists for leadership roles was agreed by the Board. All selection decisions continue to be made on merit.
Approved targets are underpinned by comprehensive metrics that enable regular reporting on progress.
Corporate Governance CONTINUED
1 Our gender targets include a variance of +/- 10% to account for when we have low population sizes i.e.: n<20
2 Ethnic diversity is defined as increased representation from minority groups globally.
OUR CORPORATE GOVERNANCE
FONTERRA ANNUAL REPORT 201872
For
per
sona
l use
onl
y
Corporate Governance CONTINUED
EXECUTIVE LEADERSHIP GENDER COMPOSITION
As at 31 July 2017
FONTERRA MANAGEMENT TEAM GENDER
FTE MALE FEMALE GENDER DIVERSE UNDECLARED
7 6 1 – –
% 86% 14% 0% 0%
As at 31 July 2018The gender composition of Fonterra Management Team members remains unchanged between 2017 and 2018.
FONTERRA MANAGEMENT TEAM GENDER
FTE MALE FEMALE GENDER DIVERSE UNDECLARED
7 6 1 – –
% 86% 14% 0% 0%
BOARD GENDER COMPOSITION
As the majority of Directors are appointed by farmer shareholders through an independent process, the Board has not adopted gender targets for the Board in 2018. The Board remains committed to addressing the gender composition of the Board, including by building a pipeline of Directors through the Fonterra Governance Development Programme and through the independent Farmer Director election process.
As at 31 July 2017
BOARD GENDER
FTE MALE FEMALE GENDER DIVERSE UNDECLARED
12 9 3 – –
% 75% 25% 0% 0%
As at 31 July 2018As at 31 July 2018 the gender composition of Board members comprised two female and nine male Directors.
BOARD GENDER
FTE MALE FEMALE GENDER DIVERSE UNDECLARED
11 9 2 – –
% 82% 18% 0% 0%
ONGOING TRAINING
Following appointment to the Board, Directors undertake an induction programme to familiarise themselves with Fonterra and its global business. Areas covered include:
• business strategy and planning
• an overview of key financial metrics to monitor business performance
• an overview of material areas of the Fonterra business, including through meetings with key executives and visits to key offshore markets
• Fonterra’s Constitution and other governance systems.
Directors are expected to keep themselves abreast of changes and trends in the business, Fonterra’s environment and markets, and the economic, political, social and legal climate generally. The Board holds several workshops on relevant subjects each year, are provided with strategic readings each month and Directors are also expected to keep up to date with governance issues. Board visits to Fonterra’s global businesses occur regularly.
FONTERRA ANNUAL REPORT 2018 73
For
per
sona
l use
onl
y
ASSESS PERFORMANCE
Directors formally assess the performance of the Board each year. A regular programme of peer review of individual Directors occurs as part of an ongoing Director development programme. Directors are also encouraged to attend external development and training programmes. The Shareholders’ Council reviews the Board’s Statement of Intentions against the performance and operation of the Group and reports on this to farmer shareholders annually. The Board is also responsible for reviewing the Chief Executive’s performance.
DIVISION OF ROLES
The Chairperson and Chief Executive roles at Fonterra are not exercised by the same individual.
Principle 3: Board CommitteesFonterra has a number of permanent Board Committees, as detailed below. Additional Board Committees will be formed when it is efficient or necessary to facilitate efficient decision-making by providing for a sub-group of Directors to focus on particular areas or issues and to develop recommendations to the full Board.
The Board Committees have standard ‘Terms of Reference’ and each committee has a charter, which defines the scope and responsibilities of that committee and is approved by the Board each year. The minutes for each of the Board Committees’ meetings are supplied to the Board for review. The charters for each of the Board Committees are available on www.fonterra.com.
COMMITTEE OR GROUP MEMBERSHIP AS AT 31 JULY 2018 PURPOSE
People, Culture and Safety Committee
John Wilson (Chair) Ashley Waugh John Monaghan Simon Israel (Independent)
Clinton Dines (Independent) Bruce Hassall (observer)
To assist the Board in fulfilling its governance responsibilities in relation to the recruitment, retention, remuneration and development of Directors, executives and other employees, and to promote a safe and healthy working environment.
Audit and Finance Committee
Bruce Hassall (Chair and Independent) Andrew Macfarlane Ashley Waugh
Scott St John (Independent) Nicola Shadbolt Donna Smit
To assist the Board in fulfilling its governance responsibilities in relation to Fonterra’s financial reporting, audit activities, treasury matters, financial risk management and internal control frameworks.
Risk Committee Ashley Waugh (Chair) Bruce Hassall (Independent) Brent Goldsack
Nicola Shadbolt Clinton Dines (Independent)
To assist the Board in fulfilling its corporate governance responsibilities relating to Fonterra’s management of key enterprise wide risks. This includes strategic and operational risks, through Fonterra’s risk management framework, the behaviours required of its people and its guidelines, policies and processes for monitoring and mitigating enterprise-wide risks.
Co-operative Relations Committee
John Monaghan (Chair) Andrew Macfarlane
Brent Goldsack Donna Smit
To assist the Board in fulfilling its governance responsibilities in relation to the supply of milk from Fonterra suppliers, and to seek to resolve supplier complaints before reference to the Milk Commissioner.
Nominations Committee
Bruce Hassall (Chair and Independent) Clinton Dines (Independent) Andrew Macfarlane
John Monaghan Duncan Coull (SHC observer) Matthew Pepper (SHC observer)
To recommend to the Board candidates for election as Farmer Directors.
Milk Price Panel Scott St John (Chair and Independent) Bruce Hassall (Independent) Brent Goldsack
Andrew Wallace (Independent) Bill Donaldson
To provide assurances to the Board as to the governance of the Milk Price and the Milk Price Manual, and the proper application of the Milk Price Principles.
Corporate Governance CONTINUED
OUR CORPORATE GOVERNANCE
FONTERRA ANNUAL REPORT 201874
For
per
sona
l use
onl
y
Corporate Governance CONTINUED
BOARD AND COMMITTEE ATTENDANCE
BOARD AUDIT & FINANCE
COMMITTEE
CO-OPERATIVE RELATIONS
COMMITTEE MILK PRICE PANELNOMINATIONS
COMMITTEE
PEOPLE, CULTURE & SAFETY
COMMITTEERISK
COMMITTEE
Eligible to
Attend Attendance Eligible to
Attend Attendance Eligible to
Attend Attendance Eligible to
Attend Attendance Eligible to
Attend Attendance Eligible to
Attend Attendance Eligible to
Attend Attendance
Clinton Dines 18 16 – – – – – – 1 1 8 8 4 4
Ian Farrelly 6 6 1 1 1 1 – – – – – –
Brent Goldsack 12 11 – – 4 4 4 4 – - 2 1
Leonie Guiney 4 4 – – 1 1 – – – – 1 1
Bruce Hassall 12 12 7 7 – – 4 3 7 5 2 2
Simon Israel 18 18 – – – – – – 8 8 – –
David Jackson 6 6 1 1 – – 3 3 1 1 2 2 1 1
David MacLeod 4 4 – – 1 1 – – – – 1 1
Andrew Macfarlane
12 12 5 5 4 3 – – – – – –
John Monaghan 16 15 – – 5 5 – – 8 7 – –
Nicola Shadbolt 18 18 7 6 – – – – 1 1 – – 4 4
Donna Smit 18 18 7 6 4 4 – – – – – –
Scott St John 18 18 7 7 – – 7 7 – – – –
Ashley Waugh 18 16 5 5 1 1 3 2 8 8 2 2
John Wilson 18 18 5 5 – – – – 1 1 8 8 1 1
AUDIT AND FINANCE COMMITTEE
There is an established Audit and Finance Committee as described on the previous page.
The Audit and Finance Committee comprises two Appointed Directors and four Farmer Directors. The committee is chaired by Bruce Hassall, who is an Independent Director and a Fellow of the New Zealand Institute of Chartered Accountants.
MILK PRICE PANEL
The Board has created the Milk Price Panel for the purpose of providing assurances as to the governance of the Farmgate Milk Price and the proper application of the Farmgate Milk Price Manual and the Milk Price Principles.
The Panel does not determine the Farmgate Milk Price, as this is a decision for the Board.
The Dairy Industry Restructuring Act 2001 (New Zealand) requires that the Chair and a majority of the members of the Panel are independent. The Panel consists of two Appointed Directors, one Farmer Director and two appropriately qualified persons nominated by the Shareholders’ Council, at least one of whom must be independent. The Chair must be one of the Appointed Director members. The Panel is currently chaired by Scott St John. Other Board members are Bruce Hassall and Brent Goldsack. The Shareholders’ Council appointees are Andrew Wallace and Bill Donaldson. The Board confirmed that at 31 July 2018, Scott St John, Bruce Hassall and Andrew Wallace are considered to be Independent Members of this Panel.
MAJORITY INDEPENDENT DIRECTORS – AUDIT AND FINANCE COMMITTEE, NOMINATIONS COMMITTEE AND PEOPLE, CULTURE AND SAFETY COMMITTEE
The Audit and Finance Committee, Nominations Committee and People, Culture and Safety Committee committees do not comprise a majority of Independent Directors.
There is currently no headroom for Fonterra, based on having 11 Directors, to have more than four Independent Directors (as prescribed by the FSM Rules), as the Farmer Directors fill each of the seven positions open to them (and as noted above, the Farmer Directors are not considered Independent Directors). Given this, it is difficult for Fonterra to appoint a majority of Independent Directors to these committees without excluding Farmer Directors or significantly increasing the workload of the Independent Directors.
Fonterra does not consider that this is a significant issue, as both the Audit and Finance Committee and the Nominations Committee are chaired by Independent Directors, with the People, Culture and Safety Committee chaired by a Farmer Director. In addition, under the FSM Rules, the Audit and Finance Committee is not required to comprise of a majority of Independent Directors.
Employees attend Audit and Finance Committee and People, Culture and Safety Committee meetings at the request of the Committees.
TAKEOVER OFFER
Given its co-operative structure and the thresholds on share ownership in the Constitution, the Board does not believe that it is necessary to establish protocols for a takeover offer.
FONTERRA ANNUAL REPORT 2018 75
For
per
sona
l use
onl
y
Principle 4: Reporting and Disclosure
DISCLOSURE POLICY
Fonterra is committed to promoting well-informed and efficient markets in its shares, units issued by the Fonterra Shareholders’ Fund and debt securities. The Board has approved a Group Disclosure Policy to ensure compliance with the FSM Rules regarding disclosure. The Group Disclosure Policy governs Fonterra’s communications with investors and market participants, and the disclosure of information relevant to Fonterra. This policy, and the Group Disclosure Standard which gives effect to the policy, are available on www.fonterra.com.
Fonterra has established a Disclosure Committee that holds regular and ad hoc meetings to oversee Fonterra’s continuous disclosure obligations. The members of the Disclosure Committee are the CEO, CFO, Managing Director Corporate Affairs, Director Capital Markets and the Director, Governance.
The Disclosure Committee’s Charter states that the committee has responsibility for overseeing Fonterra’s continuous disclosure obligations and reviewing, monitoring and implementing the Group Disclosure Policy. The Committee maintains a register of continuous disclosure matters and also ensures a consistent and high standard of communication with farmer shareholders, unitholders, other investors and market participants on a timely basis.
The Chairman of the Board, the Chairman of the Audit and Finance Committee and the Chairman of the Milk Price Panel attend the Committee’s meetings to review and approve the release of the Interim and Annual Reports, and on an ad hoc basis to provide input into specific continuous disclosure obligations.
Fonterra and the Manager of the Fonterra Shareholders’ Fund have entered into an arrangement to co-operate with each other and take all steps reasonably required to ensure that information to be disclosed by either of them under the FSM Rules and the listing rules of the NZX or the ASX (as the case may be) is disclosed simultaneously to the Fonterra Shareholders’ Market, the NZX Main Board and the ASX. Fonterra simultaneously discloses relevant information on ASX on behalf of the Fonterra Shareholders' Fund.
WEBSITE DISCLOSURE
At present Fonterra has the following documents available on www.fonterra.com:
• Board Charter
• People, Culture and Safety Committee Charter
• Audit and Finance Committee Charter
• Risk Committee Charter
• Co-operative Relations Committee Charter
• Nominations Committee Charter
• The Way We Work (Code of Business Conduct)
• Group Disclosure Policy and Group Disclosure Standard
• Group Diversity and Inclusion Policy
• Group Environmental Policy
• Group Ethical Behaviour Policy
• Group Privacy Policy
• Group Securities Trading Policy
Fonterra does not have a Director Remuneration Policy for the reasons noted below under the heading ‘Director Remuneration’.
NON-FINANCIAL REPORTING
Fonterra is guided by international best practice and agrees that adoption of internationally recognised reporting frameworks is a good way of allowing users of our disclosure information to more easily compare it with others. For this reason we have adopted the Global Reporting Initiative (GRI) guidelines.
In this Annual Report, we provide coverage of both financial and non-financial matters. Non-financial reporting includes coverage of progress on strategy in the ‘Who is Fonterra” section. High-level consideration of material environmental, social and governance (ESG) factors and practices are included in the ‘Our Sustainability ’ section.
In December 2017 Fonterra issued its first Sustainability Report based upon GRI guidelines to further expand our non-financial disclosure for each financial year. We plan to release our Sustainability Report annually, with the next report due to be issued in November 2018.
Corporate Governance CONTINUED
OUR CORPORATE GOVERNANCE
FONTERRA ANNUAL REPORT 201876
For
per
sona
l use
onl
y
Corporate Governance CONTINUED
Principle 5: RemunerationFonterra’s remuneration framework is designed to attract, retain and motivate high quality Directors and senior management.
DIRECTOR REMUNERATION
The Constitution modifies the discretion of the Board to set remuneration of Directors. In accordance with the Constitution, farmer shareholders elect an independent committee of six farmer shareholders (the Directors’ Remuneration Committee) to consider and make recommendations to the Annual Meeting on remuneration for Farmer Directors, which is required to be approved by farmer shareholders.
The members of the Directors’ Remuneration Committee as at 31 July 2018 were David Gasquoine (Chair), John Gregan, Glenn Holmes, Scott Montgomerie, Stephen Silcock, and Gerard Wolvers.
The Board has full discretion over the remuneration of Appointed Directors with such remuneration not being approved at the Annual Meeting. The Board has historically remunerated Appointed Directors at the same level as Farmer Directors in line with Directors’ Remuneration Committee recommendations.
Given the arrangements outlined above, Fonterra does not have a specific policy for remuneration of Directors.
Directors and employees attend Directors’ Remuneration Committee meetings at the invitation of the Committee.
The details of the Directors’ remuneration are contained on page 58 of the Annual Financial Results for the year ended 31 July 2018.
REMUNERATION OF OUR PEOPLE
Our People, Culture and Safety Committee, that governs the remuneration of management, reviewed and made changes to our remuneration approach to better balance the need to attract and retain talented people, with the need to deliver the highest possible overall returns to our farmers and unitholders.
Key changes made last year were to amend the short-term (STI) and long-term incentive (LTI) Plans to better align them to our overall performance. The details of these programmes are outlined below but it is worth highlighting that the LTI plans are now based on Return on Capital (ROC) and Earnings per Share (EPS) metrics. Some of the outcomes of these changes in FY18 were:
• We did not meet the minimum performance thresholds for the new LTI Plan in FY18 and therefore no LTI payments were earned.
• The result is a 57% year-on-year decrease in total remuneration payments for our CEO and a similar level of decrease for our senior executives.
• For the FY18 performance period outlined in this report, our CEO Theo Spierings will receive total remuneration of $3,545,777 versus $8,320,324 earned in FY17.
REMUNERATION BENCHMARKING
Benchmarking of our remuneration is conducted using independent third-party advisors as appropriate to the market in which our employees work. Where appropriate, Fonterra will use supplementary pay intelligence data.
Pay benchmarking for the CEO, FMT and certain senior roles is conducted using independent third-party remuneration advisers appointed by the Board. Given that the Co-operative’s size and global scale is unique to New Zealand, the peer group for these roles is comprised of 24 Australian listed companies that are more closely matched to the size and complexity and operational scope of Fonterra, allowing a more appropriate benchmarking of senior executive remuneration. The benchmark also reflects that senior positions within Fonterra require global expertise, and are typically recruited from competitive global talent markets, particularly Australia and Asia. Fonterra aims to pay at the median of the benchmark of the given peer group for our senior executives.
Fonterra’s remuneration framework for salaried staff is based on a ‘total remuneration’ approach, which is consistent with best practice globally. This includes base salary, benefits (superannuation and insurance), and variable remuneration (incentives).
Our remuneration levels are independently benchmarked against comparable companies. Adjustments may occur on a cyclical basis, such as an annual salary review, or on an as-needed basis to recognise factors such as additional responsibilities.
The framework is designed to take into account budget targets and restraints, market conditions, internal equity, and governance factors such as local legislation, as well as taking into account individual performance.
Fonterra’s incentive programmes are designed to drive the Co- operative’s performance by:
• Focussing on the Co-operative’s primary objective of maximising returns for its farmer shareholders;
• Promoting collaboration and a one team approach to achieve Fonterra’s goals;
• Establishing targets which are challenging yet achievable; and linked to team (such as business unit) and group performance.
At the end of each financial year, performance is reviewed and incentive payments are approved by the People, Culture and Safety Committee at its discretion. The Board and the Committee retain absolute discretion in respect to payments for all incentive schemes.
EXECUTIVE REMUNERATION AND INCENTIVE PLANS
Fonterra’s remuneration framework for the CEO and members of the FMT is designed to attract and retain key talent while ensuring a strong link between performance and reward. Remuneration for these employees comprises three components: Fixed Remuneration, Short-Term Incentives and Long-Term Incentives. Each of the components are detailed below:
Fixed Remuneration
Fixed Remuneration consists of base salary and benefits. Fixed Reward for the CEO and FMT is generally reviewed on an annual basis, taking into account market relativities and the individual performance of each senior executive. Any Fixed Remuneration changes for the CEO must be approved by the Board.
FONTERRA ANNUAL REPORT 2018 77
For
per
sona
l use
onl
y
Short-Term Incentives
STIs are total at-risk payments that are designed to align and focus the FMT on delivering exceptional results. STI targets are expressed as a percentage of base remuneration. For the CEO and Chief Operating Officers, the STI target is set at 60% of fixed remuneration.
At the beginning of each financial year, the Board agrees the business plan and organisational objectives. These objectives form the basis on which the year’s STI plan is then set. The FY18 STI outcomes for the CEO and FMT are determined by three elements:
• Fonterra Group Performance (Volume, EBIT and an Organisational Efficiency measure)
• Health & Safety and Food Safety & Quality
• Total Farmer Pay-out
A minimum performance threshold must be met for achievement of any of the Group performance elements. The maximum incentive opportunity for CEO and FMT is capped at 200% of individual target pay-out.
The Board retains complete discretion of STI outcomes and may adjust the final outcome as it deems appropriate.
Long-Term Incentives
Fonterra’s LTI is designed to reward the CEO and FMT for delivering successful outcomes for the Co-operative over the long term. LTI targets are expressed as a percentage of base remuneration. The LTI target is set at 60% of fixed remuneration for the CEO. For the Chief Operating Officers, the LTI target is set at 50% of fixed remuneration.
The FY18-20 LTI outcomes for the FMT are determined by two elements:
• Return on Capital including intangibles (NOPAT/Invested Capital)
• Growth in Earnings per Share (EPS)
For any payment to be made, a minimum performance threshold must be met as outlined in the LTI Plan. The maximum incentive opportunity is capped at 200% of individual target pay-out.
The Board retains complete discretion of LTI outcomes and may adjust the final outcome as it deems appropriate
CEO REMUNERATION
This year, Fonterra will report CEO remuneration to reflect both actual remuneration paid in the fiscal year for previous performance, and remuneration earned for performance relating to the current fiscal year. All values are reported in New Zealand Dollars. The information contained in this section relates to Mr Spierings who was in the role of CEO for the duration of FY18.
Corporate Governance CONTINUED
OUR CORPORATE GOVERNANCE
CEO Remuneration Earned for FY18 Performance
‘Remuneration Earned’ aligns remuneration outcomes with performance periods, providing what we believe is a clearer indication of pay for performance. LTI and STI outcomes are listed against the relevant performance period, regardless of when the payment is made. We believe this reporting approach provides the right balance of transparency and disclosure while accurately reflecting the outcomes for a given fiscal year.
1 Represents the FY18 STI outcome. This payment was approved by the Board in September 2018 and will be paid in October 2018.
2 Fonterra’s LTI Plan did not meet minimum performance thresholds in FY18 and therefore no remuneration was earned.
3 Represents a 57% year-on-year decrease in remuneration realised vs FY17.
4 Represents the FY17 Velocity Leadership Incentive outcome.
5 FY17 Total Remuneration Earned.
For FY18, Mr Spierings realised the following compensation:
(a) CEO Fixed Remuneration
Over the course of the FY18 financial year, the CEO earned fixed remuneration of $2,462,800 (unchanged from FY17).
(b) CEO Short-Term Incentive
The STI value of the CEO’s remuneration is set at 60% of fixed remuneration if all targets are achieved.
For the 2018 Financial year, the CEO realised a total STI payment of $979,702 ($1,182,144 in 2017 Financial Year). This is against a target of $1,477,680. The board has approved this STI outcome and payment will be made in October 2018.
(c) CEO Long-Term Incentive
The LTI value of the CEO’s remuneration is set at 60% of fixed remuneration if all targets are achieved.
• FY18 LTI
• FY18-19 LTI
• FY18-20 LTI
• For the 2018 Financial year, the CEO realised a total LTI payment of $0. This is against a target of $1,477,680.
Participation in the FY18-19 and FY18-20 LTI Plan ceases on resignation and any LTI deferrals from these plans are forfeited. The board retains complete discretion over final LTI payments and may adjust the final outcome as it deems appropriate.
FONTERRA ANNUAL REPORT 201878
For
per
sona
l use
onl
y
Corporate Governance CONTINUED
CEO Remuneration Paid within the FY18 fiscal year
‘Remuneration Paid’ is how CEO remuneration has been traditionally reported, reflecting remuneration in the period it is received, rather than the performance period the payment relates to. For example, incentive payments relating to FY17 performance are received and reported in FY18.
REMUNERATION AND INCENTIVE PLANS FOR SALARIED STAFF
Fixed Remuneration
Under our ‘total remuneration’ approach for salaried positions, Fonterra generally aims to pay at the median rate in the markets in which we operate. For roles that are deemed critical or that have a significant influence on business performance, Fonterra may choose to benchmark at the upper quartile rate. This is particularly true for certain international markets where securing key talent can be difficult.
Review of Fixed Remuneration
Fixed remuneration for salaried and waged employees who are not covered by a collective agreement is reviewed annually.
Remuneration for employees who are on collective agreements is negotiated and agreed in partnership with Fonterra’s employee representative organisations and is reviewed in line with the schedules agreed with those employee representative organisations.
Short Term Incentive Plans
The majority of permanent salaried employees in Fonterra participate in an annual short-term incentive (STI) plan. In FY18, this incentive covered approximately 6,000 employees.
The STI plan encourages our people to focus on Fonterra’s strategic objectives within each financial year. At the beginning of each financial year a series of Group and business unit key performance indicators (KPIs) are identified and approved by the People, Culture and Safety Committee.
The KPIs are established every year, but normally include important financial measures (revenue and EBIT), operational efficiency measures, and measures centred around health and safety and food safety and quality.
For a small, targeted group of employees, our STI plan also includes an incentive component that is based on the total available farmer pay-out. This is designed to align the targeted group’s incentive outcomes to that of our farmer shareholders’ financial outcomes.
Some employees who are eligible for the STI plan have a portion of their incentive aligned with their individual performance (typically 50% of the total STI), and others are aligned fully to the relevant Group or business unit KPI scorecard. Senior Management is typically aligned to 100% of Fonterra Group Performance, resulting in their incentives being fully aligned to Fonterra’s outcomes as a business.
Other Incentive Plans
Some business units, both in New Zealand and offshore, use sales incentive plans for our market facing sales and support teams. These are targeted to achieve specific revenue growth outcomes in key markets as well as aligning to our Group and business unit strategic objectives.
Employees in these plans do not, typically, participate in any other short-term incentive plans.
Long Term Incentive Plans
Fonterra offers a Long-Term Incentive (LTI) plan for certain senior executives. This plan is designed to reward and retain key senior executives based on longer-term objectives. The Fonterra Management Team (FMT) is eligible to participate, as well as a selected number of senior executives who lead large functions within our core business units, hold significant profit and loss responsibility, or head significant corporate functions.
The nature of these long-term Incentive plans means that payments can be deferred over multiple time periods. This means that, in any given year, multiple payments may be made for incentives earned in prior years. For purposes of clarification, we have summarised below the LTI Plans that are active or where potential deferred payments are yet to be made.
FONTERRA ANNUAL REPORT 2018 79
For
per
sona
l use
onl
y
Velocity Leadership Incentive (FY16/17)
The Velocity Leadership Incentive (VLI) was the LTI plan in place for FY16 and FY17. It has been discontinued and did not apply in FY18. The VLI was introduced as a targeted two-year plan to accelerate and reward the Fonterra business transformation, which the Co-operative refers to as ‘Velocity’. The FMT, selected senior management, and a small number of employees who led significant work streams in FY16 in support of Velocity were eligible to participate in the VLI.
In FY16 and FY17 Velocity delivered significant benefits across the Farmgate Milk Price, earnings and working capital. In FY17 it also supported a material uplift in Fonterra’s organisational health and employee engagement.
The FY16 VLI was paid in cash with 70% paid following the end of FY16, and the remaining 30% deferred over two years in two payments of 15% - one in FY17 and the other in FY18. On target performance under the FY16 VLI was set at 60% of fixed salary for the CEO, 50% for the FMT, and ranged from 25% to 50% of fixed salary for other participating employees. In FY16, Velocity delivered above expectations in terms of both financial performance arising from efficiency and value creation.
The FY17 VLI payment schedule was changed to a 50% payment following the end of FY17, with the remaining 50% deferred over two years in two payments of 25% - one in FY18 and the other to be in FY19. The payment of the first deferral was dependent on achievement of a stipulated lift in organisational health to recognise the importance of sustainable change. The stipulated organisational health hurdle was met and the first deferral was paid in December 2017.
On target performance under the FY17 VLI was set at 60% of fixed salary for the CEO, 50% of fixed salary for the FMT, and ranged from 25% to 50% of fixed salary for other participating employees.
The People, Culture and Safety Committee governs the VLI plan and approves all results and payments in respect of the VLI.
The Board retains overall discretion in relation to all aspects of the VLI.
FY18–FY20 Long-Term Incentive
In FY18, the People, Culture, and Safety Committee approved a new LTI plan for FY18 to FY20 and beyond.
The change marked a return to a more traditional LTI plan. It is designed to incentivise the FMT and certain senior executives in relation to the achievement of the longer-term strategic objectives of the Co-operative.
This LTI uses two core financial metrics to measure achievement of the Co-operative’s performance. The metrics are Return on Capital (ROC) and Earnings per Share (EPS), both of which are commonly used globally in long term incentive plans. These metrics are important as they directly align to the Co-operative’s performance, and its returns to its farmer shareholders, and are readily measurable. These outcomes sit alongside the Co-operative’s objective of maximising the Farmgate Milk Price in a sustainable manner.
LTI targets are set over a three-year performance period. Assuming performance thresholds have been met at the end of the three-year period, 100% of the resulting outcome is paid in cash in October the following fiscal year.
The FY18-FY20 LTI targets for ROC and EPS were set at the beginning of FY18, with reference to the FY18-FY20 business plan.
The FMT and selected senior executives are eligible to participate. The Board retains overall discretion in relation to all aspects of the FY18-FY20 LTI.
FY18 and FY18-19 Long-Term Incentives
With the introduction of a new LTI structure and the subsequent discontinuation of the VLI, two shorter term ‘bridging’ LTI plans were developed to ensure that Fonterra appropriately incentivises performance over the FY18 and FY18-19 vesting periods.
Both the FY18 and FY18-19 LTI plans are based on the same structure and retain the same measures as the FY18-20 LTI Plan, albeit for a shorter performance period. Targets for these plans were developed with reference to the FY18 and FY19 business plans and were approved by the Board.
For the FY18 and FY18-19 Plans, assuming performance thresholds have been met, 50% of the resulting outcome is paid as cash in October the following fiscal year and 50% is deferred as cash for 12 months. The Board retains overall discretion in relation to all aspects of the FY18 LTI and the FY18-19 LTI, including payment of deferral.
FY19–FY21 Long-Term Incentive
The FY19-21 LTI Plan is based on an identical structure and retains the same measures as the FY18-20 LTI Plan. The FY19-21 LTI Plan targets for ROC and EPS have been set with reference to the FY21 business plan and have been approved by the Board.
The Board retains overall discretion in relation to all aspects of the FY19-FY21 LTI.
Corporate Governance CONTINUED
OUR CORPORATE GOVERNANCE
FONTERRA ANNUAL REPORT 201880
For
per
sona
l use
onl
y
Corporate Governance CONTINUED
Principle 6: Risk Management
RISK MANAGEMENT FRAMEWORK
Fonterra ensures its performance is optimised through the identification and management of the most material risks to the business. The Board receives regular updates from the Risk Committee and reporting on Fonterra’s Risk Management Framework.
Fonterra’s Risk Management Framework is based on a three lines of defence model. Compliance with our Group Policy Framework is a condition of employment at Fonterra, as articulated in our Group Policy Principles. As the first line of defence our people leaders have clear responsibilities for business risk management and to ensure compliance with Group Policy and Standards. Technical functions provide the second line of defence through a range of specialist audit programmes across the business. Our Internal Audit programmes and external and customer audit systems comprise the third line of defence.
Our Risk Management Framework is aligned with international best practice and includes a consistent process that:
• Considers our goals and relevant context
• Identifies any assumptions or uncertainties that could affect achieving our goals
• Prioritises control effort through assessing the potential consequences of a risk materialising, the likelihood of that occurrence
• Considers risk drivers
• Evaluates current controls, their effectiveness and outcome acceptability
• Introduces new controls or action plans to strengthen our position
• Regularly reviews control effectiveness, context changes and resulting exposure.
Fonterra’s Risk Management Policy outlines our risk principles, accountabilities and the requirements for managing and reporting risk within the business. At the highest level, the most material risks to the business are grouped to reflect our focus on people, strategy, and identity.
In the Sustainability section, we provide more detailed information on our risk management approach for health and safety, food safety and quality, environmental and animal welfare risks.
These are reviewed regularly to consider any changes or need to adapt control strategies, through an Integrated Risk Forum that enables key business leaders identified as risk and opportunity guardians to assess and manage current risks and identify and prepare for emerging risks. These matters are reported to, and recorded by, the Risk Committee.
We aim to deepen the understanding, management and reporting of key business risks as well as reporting on emerging risk as part of our approach to strengthening organisational resilience.
HEALTH AND SAFETY
Fonterra is committed to providing a safe and healthy work environment for anyone who is affected by our operations. Continuous health and safety improvement is an integral part of everything we do. Achieving effective health and safety improvement is regarded as essential to our long-term success and an integral part of our values and how we run our business.
We have focussed programmes to address our critical risks and our injury reduction ambitions.
Fonterra’s health and safety performance is measured using a number of reactive and preventive indicators. These include Total Recordable Injury Frequency Rate (TRIFR), number of serious harm injuries and status of self-assurance and internal control Audits conducted throughout the business.
Our TRIFR has increased over the past year from 5.2 to 6.1 with slightly fewer serious harm injuries in FY18 overall compared to FY17.
We remain committed to achieving our longer term TRIFR goal of five which represents world class within our industry group.
Our focus is to continue to track our efforts on a broad range of health and wellbeing programmes to enhance our people care and actively prevent incidents from occurring.
FONTERRA ANNUAL REPORT 2018 81
For
per
sona
l use
onl
y
Principle 7: Auditors
AUDITOR FRAMEWORK
The Audit and Finance Committee is responsible for making recommendations to the Board regarding the appointment of the external auditor. The external auditor is appointed by farmer shareholders at the Annual Meeting.
The Audit and Finance Committee reviews the independence of the auditor and reviews the external audit fees, the terms of engagement and annual audit plan.
Fonterra encourages the rotation of the lead external audit partner in the relationship in accordance with best practice. Fonterra has a Group Audit Independence Policy, for certain activities the auditor may undertake for the Group. This policy is prescriptive as to the types of activities that the auditor may undertake, those the auditor may only undertake with the approval of the Audit and Finance Committee, and the types of activities that are not permitted. The Audit and Finance Committee will not approve the auditor performing any tasks that have the potential to create a conflict except in exceptional circumstances and then only if appropriate safeguards are in place. The Audit and Finance Committee monitors the performance of these additional activities undertaken by the auditor.
The Audit and Finance Committee Chairman communicates regularly with the external auditor and the Audit and Finance Committee meet with the external auditor without Management at least twice a year.
The Audit and Finance Committee is responsible for ensuring that the ability of the auditor to carry out its statutory audit role is not impaired, or could reasonably be perceived to be impaired.
The fees paid to Fonterra’s auditor, PricewaterhouseCoopers are detailed in Note 4 to the Annual Financial Results for the year ended 31 July 2018.
An RFP process is currently underway for the provision of external audit services for the financial year ended 31 July 2020.
The external auditor is required to attend Fonterra’s Annual Meeting and be available to answer questions from farmer shareholders in relation to the audit.
INTERNAL AUDIT
Fonterra’s Internal Audit function provides the Audit and Finance Committee and Management with objective and independent assurances on the design and effectiveness of internal controls.
A close working relationship with Management is critical to ensure Internal Audit remains relevant and provides adequate audit coverage.
Internal Audit supports the achievement of Fonterra’s Group business objectives by:
• Evaluating the effectiveness of risk management, controls and governance processes
• Delivering reasonable assurance over key business risks to the Audit and Finance Committee and Management
• Providing recommendations for control environment improvements
• Executing assignments in compliance with Institute of Internal Audit Standards
The approach to Internal Audit is based on the principle of line management responsibility for risk and controls.
• Management is responsible for implementing, operating and monitoring the system of internal controls to provide reasonable assurance of achieving business objectives.
• Internal Audit is responsible for:
– Delivering a reasonable degree of assurance (as determined by the Audit and Finance Committee) over business risk
– Assisting the business with special reviews or investigations where requested and approved by the Audit and Finance Committee
– Complying with the Internal Audit methodology.
Corporate Governance CONTINUED
OUR CORPORATE GOVERNANCE
FONTERRA ANNUAL REPORT 201882
For
per
sona
l use
onl
y
Corporate Governance CONTINUED
Principle 8: Shareholder Rights and Relations
WEBSITE
Fonterra has a website (www.fonterra.com) where investors and interested stakeholders can access financial and operational information and key corporate governance information about Fonterra as an issuer.
SHAREHOLDERS’ COUNCIL
One of the Board’s most important relationships is with the Shareholders’ Council. The Council, Fonterra’s representative body, which is established under the Fonterra Constitution, is independent of the Board and as at 31 July 2018 comprised 25 farmer shareholders elected as councillors, representing 25 wards across New Zealand. The Shareholders’ Council was created to be the guardian of the Co-operative Principles which apply to the cornerstone activities of the Co-operative. The functions of the Council are set out in the Constitution. The Council reviews the Board’s Statement of Intentions for the performance and operations of the Group and publishes an annual report, commenting on these matters.
The Council, Board and Management have a working interface document which sets out the principles to facilitate the working partnership between the Board, the Council and Management and the way operational issues will be dealt with by the Board and the Council.
The working interface document is available on the Farm Source™ website.
The Council and the Board meet regularly, as do the Chairs of the Board and the Council and the Chairs of their respective Committees.
FARMER COMMUNICATIONS
Fonterra is committed to maintaining and improving communication with its farmer shareholders. An extensive farmer shareholder and supplier relations programme is managed by the Farm Source™ team. Channels for electronic communication are provided through the fonterra.com and Farm Source™ websites and the My Co-op phone application. In addition, Fonterra provides farmer shareholders with the ability to receive communications (such as the Annual Report) from Fonterra electronically.
Fonterra’s communications with farmer shareholders include regular face-to-face meetings, Sky broadcasts, a regular Global Dairy Update, Farm Source™ magazine publication, My Co-op posts and regular emails from the Chairman, CEO and Regional Heads. As described above, Fonterra releases to the relevant stock exchanges all material information, and will comply with the listing rules of the Fonterra Shareholders’ Market with respect to shareholder communications.
FARMER MEETINGS
A schedule of regular meetings with farmer shareholders, sharemilkers and farm workers is held across the country at least twice each year. Often these are run in conjunction with the Shareholders’ Council and Farm Source™ regional teams.
Farmer Directors also regularly attend other farmer meetings during the year on specific topics.
In addition, the Board consults with farmer shareholders on specific issues as they arise.
FONTERRA.COM AND FARM SOURCE™ DIGITAL TOOLS
Presentations on the development of the business are available on the fonterra.com website. The Group also uses email alerts, including regular updates from the Chairman and regular farmer shareholder updates.
The Farm Source™ website enables farmer shareholders, their employees and business partners to transact online with Fonterra and access information and tools on milk production and quality, online statements and up-to-the-minute news and weather. This site is also used to provide information on the business to farmer shareholders.
Fonterra’s My Co-op app provides constantly updated news and information from across the Co-op and the industry including milk price announcements, updates from the Chairman and CEO and rural and regional council news. The On Farm app provides daily milk production and quality information, comparisons against last season volumes, tanker movements, and summary reports of key milk performance information for the last 30 days.
ANNUAL MEETING
The Board views the Annual Meeting of farmer shareholders, which is held at a different venue around New Zealand each year, as an opportunity to communicate directly with farmer shareholders and the Board ensures that adequate time is provided at these meetings for farmer shareholders to raise issues or ask questions from the floor.
Notices of Meetings are sent to farmer shareholders at least ten working days before the meeting.
The Constitution describes the process whereby a farmer shareholder can raise a proposal for discussion or resolution at the next meeting of farmer shareholders at which the farmer shareholder is entitled to vote.
ANNUAL REPORT
The Group’s Annual Report including financial statements and an annual review, together with the half-year reports and other material announcements, are designed to present a balanced and clear view of Fonterra’s activities and prospects and are available on fonterra.com.
OTHER DISCLOSURES
Information on the Group’s performance, annual and half-year financial results, Director changes, and other significant matters, is advised to the market through the NZX and ASX in accordance with the Group Disclosure Policy. Farmer shareholders and other stakeholders receive regular updates on these and other issues relevant to them and all media and market releases are available on fonterra.com.
VOTING
Shareholders have the right to vote on major transactions (as defined in the Companies Act 1993) as well as other major decisions that may change the nature of Fonterra as prescribed by the listing rules of the FSM. In particular, FSM Rule 8.1.1 restricts Fonterra from entering into any transaction (or series of linked or related transactions) which would change the essential nature of the business of Fonterra or in respect of which the gross value is in excess of 50% of the average market capitalisation of Fonterra without the prior approval of Fonterra’s shareholders.
In accordance with the co-operative nature of Fonterra, voting is based on the quantity of milk solids supplied to Fonterra, backed by shares and is not on the principle of one vote per share.
FONTERRA ANNUAL REPORT 2018 83
For
per
sona
l use
onl
y
FONTERRA ANNUAL REPORT 201884
Summary Financial StatementsFOR THE YEAR ENDED 31 JULY 2018
OUR FINANCIALS
Directors’ Statement 85
Income Statement 86
Statement of Comprehensive Income 87
Statement of Financial Position 88
Statement of Changes In Equity 89
Cash Flow Statement 90
Notes to the Summary Financial Statements 91
Independent Auditor’s Report 103
Statutory Information 105
Non-GAAP Measures 106
Glossary 107
Contents
For
per
sona
l use
onl
y
FONTERRA ANNUAL REPORT 2018 85
Directors’ StatementFOR THE YEAR ENDED 31 JULY 2018
The Directors hereby approve and authorise for issue the summary financial statements for the year ended 31 July 2018 presented on pages 85 to 102. For and on behalf of the Board:
JOHN MONAGHAN BRUCE HASSALLChairman Director
12 September 2018 12 September 2018
Fonterra Co-operative Group Limited (Fonterra, the Company or the Co-operative) is a co-operative company incorporated and domiciled in New Zealand. Fonterra is registered under the Companies Act 1993 and the Co-operative Companies Act 1996, and is a FMC Reporting Entity under the Financial Markets Conduct Act 2013. Fonterra is also required to comply with the Dairy Industry Restructuring Act 2001.
These summary financial statements comprise Fonterra and its subsidiaries (together referred to as the Group) and include the Group’s interest in its equity accounted investees after adjustments to align to the accounting policies of the Group. They have been prepared in accordance with Financial Reporting Standard No. 43: Summary Financial Statements and have been extracted from the Group’s full financial statements. The Group’s full financial statements comply with International Financial Reporting Standards. They also comply with New Zealand Equivalents to International Financial Reporting Standards and have been prepared in accordance with Generally Accepted Accounting Practice applicable to for-profit entities.
The Board has elected to present summary financial statements for the year ended 31 July 2018 as part of the Annual Report sent to Shareholders. These summary financial statements include notes setting out key information.
These summary financial statements are presented for the year ended 31 July 2018. The comparative information is for the year ended 31 July 2017. These summary financial statements of the Group have been prepared using the same accounting policies and measurement basis as the Group’s full financial statements for the year ended 31 July 2018.
In the process of applying the Group’s accounting policies, management make a number of judgements, estimates of future events, and assumptions. These are all believed to be reasonable based on the most current set of circumstances available to the Group. Judgements and estimates that have the most significant effect on the amounts recognised in the financial statements for the year ended 31 July 2018 are those used to determine the recoverable amounts of the following assets: the investment in Beingmate (Note 7), the China Farms assets and the goodwill attributed to the consumer and foodservice businesses in New Zealand and Brazil. These matters are also communicated as key audit matters in the audit opinion on the full financial statements.
The full financial statements for the year ended 31 July 2018, approved and authorised for issue by the Board on 12 September 2018, have been audited by PricewaterhouseCoopers and given an unqualified opinion.
The Group is primarily involved in the collection, manufacture and sale of milk and milk-derived products and in fast-moving consumer goods and foodservice businesses. These summary financial statements are presented in New Zealand Dollars ($ or NZD), which is Fonterra’s functional and presentation currency, and rounded to the nearest million, except where otherwise stated.
The summary financial statements cannot be expected to provide as complete an understanding of the financial affairs of the Group as the full financial statements, which are available from Fonterra’s registered office at 109 Fanshawe Street, Auckland, New Zealand or on Fonterra’s website, www.fonterra.com.
For
per
sona
l use
onl
y
FONTERRA ANNUAL REPORT 201886
GROUP $ MILLION
NOTES 31 JULY 2018 31 JULY 2017
Revenue from sale of goods 20,438 19,232
Cost of goods sold 2 (17,279) (15,968)
Gross profit 3,159 3,264
Other operating income 192 190
Selling and marketing expenses (651) (641)
Distribution expenses (572) (550)
Administrative expenses (873) (810)
Other operating expenses (400) (334)
WPC 80 recall costs (196) –
Impairment of equity accounted investees (405) (35)
Net foreign exchange (losses)/gains (12) 29
Share of profit of equity accounted investees 20 7
Profit before net finance costs and tax 262 1,120
Finance income 23 34
Finance costs (439) (389)
Net finance costs (416) (355)
(Loss)/profit before tax (154) 765
Tax expense 9 (42) (20)
(Loss)/profit after tax (196) 745
(Loss)/profit after tax is attributable to:
Equity holders of the Co-operative (221) 734
Non-controlling interests 25 11
(Loss)/profit after tax (196) 745
GROUP $
31 JULY 2018 31 JULY 2017
Earnings per share:
Basic and diluted earnings per share (0.14) 0.46
The accompanying notes form part of the financial statements.
Income StatementFOR THE YEAR ENDED 31 JULY 2018
OUR FINANCIALS
For
per
sona
l use
onl
y
FONTERRA ANNUAL REPORT 2018 87
GROUP $ MILLION
31 JULY 2018 31 JULY 2017
(Loss)/profit after tax (196) 745
Items that may be reclassified subsequently to profit or loss:
Cash flow hedges and other costs of hedging, net of tax (459) 128
Net investment hedges and translation of foreign operations, net of tax 188 (124)
Hyperinflation gains/(losses) attributable to equity holders 17 (1)
Share of equity accounted investees’ movements in reserves – –
Other reserve movements (1) (2)
Total items that may be reclassified subsequently to profit or loss (255) 1
Items that will not be reclassified subsequently to profit or loss:
Net fair value gains on investments in shares 8 2
Foreign currency translation losses attributable to non-controlling interests (2) (3)
Hyperinflation movements attributable to non-controlling interests 12 –
Non-controlling interests other movements – (2)
Total items that will not be reclassified subsequently to profit or loss 18 (3)
Total other comprehensive expense recognised directly in equity (237) (2)
Total comprehensive (expense)/income (433) 743
Total comprehensive (expense)/income is attributable to:
Equity holders of the Co-operative (468) 737
Non-controlling interests 35 6
Total comprehensive (expense)/income (433) 743
Statement of Comprehensive IncomeFOR THE YEAR ENDED 31 JULY 2018
For
per
sona
l use
onl
y
FONTERRA ANNUAL REPORT 201888
GROUP $ MILLION
NOTES 31 JULY 2018 31 JULY 2017
ASSETS
Current assets
Cash and cash equivalents 446 393
Trade and other receivables 2,355 2,303
Inventories 2,917 2,593
Tax receivable 47 32
Derivative financial instruments 59 580
Other current assets 141 181
Total current assets 5,965 6,082
Non-current assets
Property, plant and equipment 6,810 6,391
Equity accounted investments 615 887
Livestock 288 319
Intangible assets 3,227 3,115
Deferred tax assets 583 363
Derivative financial instruments 204 239
Other non-current assets 323 446
Total non-current assets 12,050 11,760
Total assets 18,015 17,842
LIABILITIES
Current liabilities
Bank overdraft 161 11
Borrowings 5 831 1,112
Trade and other payables 2,116 2,117
Owing to suppliers 6 1,579 1,330
Tax payable 35 34
Derivative financial instruments 296 43
Provisions 14 40
Other current liabilities 101 44
Total current liabilities 5,133 4,731
Non-current liabilities
Borrowings 5 5,907 5,151
Derivative financial instruments 480 547
Provisions 130 148
Deferred tax liabilities 5 9
Other non-current liabilities 11 8
Total non-current liabilities 6,533 5,863
Total liabilities 11,666 10,594
Net assets 6,349 7,248
EQUITY
Subscribed equity 5,887 5,858
Retained earnings 934 1,637
Foreign currency translation reserve (364) (552)
Hedge reserves (267) 192
Other reserves 29 5
Total equity attributable to equity holders of the Co-operative 6,219 7,140
Non-controlling interests 130 108
Total equity 6,349 7,248
Statement of Financial PositionAS AT 31 JULY 2018
OUR FINANCIALS
For
per
sona
l use
onl
y
FONTERRA ANNUAL REPORT 2018 89
ATTRIBUTABLE TO EQUITY HOLDERS OF THE CO-OPERATIVE
GROUP $ MILLIONSUBSCRIBED
EQUITYRETAINED
EARNINGS
FOREIGN CURRENCY
TRANSLATION RESERVE
HEDGE RESERVES
OTHER RESERVES TOTAL
NON-CONTROLLING
INTERESTSTOTAL
EQUITY
As at 1 August 2017 5,858 1,637 (552) 192 5 7,140 108 7,248
As at 31 July 2017 5,858 1,637 (552) 192 5 7,140 108 7,248
Statement of Changes in EquityFOR THE YEAR ENDED 31 JULY 2018
For
per
sona
l use
onl
y
FONTERRA ANNUAL REPORT 201890
GROUP $ MILLION
31 JULY 2018 31 JULY 2017
Cash flows from operating activities
Profit before net finance costs and tax 262 1,120
Adjustments for:
Foreign exchange losses/(gains) 239 (1)
Depreciation and amortisation 544 526
Impairment of equity accounted investees 405 35
Other 5 (20)
1,193 540
Decrease/(increase) in working capital:
Inventories (313) (177)
Trade and other receivables 75 (634)
Amounts owing to suppliers 277 745
Payables and accruals 98 (100)
Other movements 42 (48)
Total 179 (214)
Cash generated from operations 1,634 1,446
Net taxes paid (86) (70)
Net cash flows from operating activities 1,548 1,376
Cash flows from investing activities
Cash was provided from: – Proceeds from disposal of property, plant and equipment 26 105 – Proceeds from sale of livestock 79 62 – Co-operative support loans 149 41 – Other cash inflows 13 10
Cash was applied to: – Acquisition of property, plant and equipment (858) (690) – Acquisition of livestock (including rearing costs) (45) (89) – Acquisition of intangible assets (147) (103) – Advances to and investments in equity accounted investees (151) (42)
– Other cash outflows (14) –
Net cash flows from investing activities (948) (706)
Cash flows from financing activities
Cash was provided from: – Proceeds from borrowings 4,334 4,174 – Interest received 18 13 – Other cash inflows – 38
Cash was applied to: – Interest paid (446) (393) – Repayment of borrowings (4,077) (3,968) – Dividends paid to non-controlling interests (27) (28) – Dividends paid to equity holders of the Co-operative (453) (456)
– Other cash outflows (74) (2)
Net cash flows from financing activities (725) (622)
Net (decrease)/increase in cash (125) 48
Opening cash 382 357
Effect of exchange rate changes 28 (23)
Closing cash 285 382
Reconciliation of closing cash balances to the statement of financial position:
Cash and cash equivalents 446 393
Bank overdraft (161) (11)
Closing cash 285 382
Cash Flow StatementFOR THE YEAR ENDED 31 JULY 2018
OUR FINANCIALS
For
per
sona
l use
onl
y
FONTERRA ANNUAL REPORT 2018 91
Notes to the Summary Financial StatementsFOR THE YEAR ENDED 31 JULY 2018
PERFORMANCE
1 SEGMENT REPORTING
The financial information reviewed by the Fonterra Management Team (FMT) has evolved over the past two years to reflect the changes in the management structure to support the operations of the Group. From 1 August 2017 the financial information reviewed by the Fonterra Management Team is solely based on the previously identified ‘strategic platforms’.
a) Operating segmentsOperating segments reflect the way financial information is regularly reviewed by the FMT. The measure of profit or loss used by the FMT to evaluate the underlying performance of operating segments is normalised segment earnings before net finance costs and tax. To enable underlying segment performance to be compared between reporting periods a normalised segment income statement has been presented. Comparative segment income statements have been re-presented on a normalised basis.
Transactions between segments are based on estimated market prices, with the exception of the sale of milk from China Farms to Ingredients. The transfer price used for these transactions is an amount reflective of long-term milk price trends in China.
Unallocated costs represent corporate costs including Corporate Affairs and Group services.
REPORTABLE SEGMENT DESCRIPTION
Ingredients Represents the collection, processing and distribution of the ingredients business in New Zealand, global sales and marketing of New Zealand and non-New Zealand ingredients products, Fonterra Farm Source™ stores, the ingredients business in Australia (including Milk Supply and Manufacturing) and the ingredients business in South America.
Consumer and foodservice
– Oceania Represents the fast-moving consumer goods (FMCG) and foodservice businesses in New Zealand and Australia (including export to the Pacific Islands).
– Asia Represents FMCG and foodservice businesses in Asia (excluding Greater China), Africa and the Middle East.
– Greater China Represents FMCG and foodservice businesses in Greater China.
– Latin America Represents FMCG and foodservice businesses in South America and the Caribbean.
China Farms Represents farming operations in China.
1 Total Group revenue from the sale of goods is $20,438 million. The difference of $7 million relates to the normalisation of time value of options.
2 Of the $439 million normalisation adjustment, $405 million relates to impairment of equity accounted investees and $34 million relates to Fonterra’s equity accounted share of Beingmate’s losses.
3 The $196 million normalisation adjustment relates to operating expenses
4 Of the $5 million normalisation adjustment, $7 million relates to revenue offset by $12 million of net foreign exchange losses.
5 Includes sales to other strategic platforms. Total column represents total external sales.
6 Capital expenditure comprises purchases of property (less specific disposals where there is an obligation to repurchase), plant and equipment and intangible assets, and net purchases of livestock.
7 Capital employed is calculated as the average for the period of; net assets excluding net-interest bearing debt, deferred tax balances and brands, goodwill and equity accounted investments.
Notes to the Summary Financial Statements CONTINUEDFOR THE YEAR ENDED 31 JULY 2018
Share of profit/(loss) of equity accounted investees 47 – – – 4 4 (4) 1 48
Normalised segment earnings before net finance costs and tax 943 87 194 204 91 576 1 (365) 1,155
Normalisation adjustments:
Gain on sale of Darnum manufacturing plant2 42 – – – – – – – 42Reduction in the carrying value of investment in Beingmate3 – – – (76) – (76) – – (76)Time value of options4 (1) – – – – – – – (1)
Segment earnings before net finance costs and tax 984 87 194 128 91 500 1 (365) 1,120
The segment note for the year ended 31 July 2017 has been restated. $42 million of operating expenses and $4 million of other operating income has been reallocated from Unallocated Costs and Eliminations to the Consumer and Foodservice operating segments. The reallocation has been made to better reflect costs in the segment in which they are reported to the FMT, to aid comparability between years.
1 Total Group revenue from the sale of goods is $19,232 million. The difference of $18 million relates to the normalisation of time value of options.
2 The $42 million normalisation adjustment relates to other operating income.
3 Of the $76 million normalisation adjustment, $35 million relates to impairment of equity accounted investees and $41 million relates to Fonterra’s equity accounted share of Beingmate’s losses.
4 Of the $1 million normalisation adjustment, $18 million relates to revenue offset by $19 million of net foreign exchange losses.
5 Includes sales to other strategic platforms. Total column represents total external sales.
6 Capital expenditure comprises purchases of property, plant and equipment and intangible assets, and net purchases of livestock.
7 Capital employed is calculated as the average for the period of; net assets excluding net-interest bearing debt, deferred tax balances and brands, goodwill and equity accounted investments.
Notes to the Summary Financial Statements CONTINUEDFOR THE YEAR ENDED 31 JULY 2018
For
per
sona
l use
onl
y
FONTERRA ANNUAL REPORT 201894
b) Geographical revenue
GROUP $ MILLION
CHINAREST
OF ASIA AUSTRALIANEW
ZEALANDUNITED STATES EUROPE
LATIN AMERICA
REST OF WORLD TOTAL
Geographical segment external revenue:
Year ended 31 July 2018 3,980 5,684 1,836 2,076 793 681 2,272 3,116 20,438
Year ended 31 July 2017 3,383 5,165 1,592 2,056 1,254 838 2,162 2,782 19,232
Revenue is allocated to geographical segments on the basis of the destination of the goods sold.
c) Non-current assets
GROUP $ MILLION
INGREDIENTS OCEANIA ASIAGREATER
CHINALATIN
AMERICATOTAL
GROUP
NEW ZEALAND
REST OF WORLD
NEW ZEALAND AUSTRALIA
Geographical segment non-current assets:
As at 31 July 2018 5,538 467 1,324 928 827 1,127 1,052 11,263
As at 31 July 2017 5,479 347 1,285 840 738 1,481 988 11,158
GROUP $ MILLION
AS AT 31 JULY 2018
AS AT 31 JULY 2017
Reconciliation of geographical segment’s non-current assets to total non-current assets:
Notes to the Summary Financial Statements CONTINUEDFOR THE YEAR ENDED 31 JULY 2018
OUR FINANCIALS
For
per
sona
l use
onl
y
FONTERRA ANNUAL REPORT 2018 95
DEBT AND EQUITY
3 SUBSCRIBED EQUITY INSTRUMENTS
Co-operative shares, including shares held within the GroupCo-operative shares may only be held by a shareholder supplying milk to the Company (farmer shareholder), by former farmer shareholders for up to three seasons after cessation of milk supply, or by Fonterra Farmer Custodian Limited (the Custodian). Voting rights in the Company are dependent on milk supply supported by Co-operative shares¹.
CO-OPERATIVE SHARES (THOUSANDS)
Balance at 1 August 2017 1,606,933
Shares issued under the dividend reinvestment plan² 4,990
Balance at 31 July 2018 1,611,923
Balance at 1 August 2016 1,602,703
Shares issued under the dividend reinvestment plan² 4,230
Balance at 31 July 2017 1,606,933
1 These rights are also attached to vouchers when backed by milk supply (subject to limits).
2 Total value of $29 million (31 July 2017: $25 million)
The rights attaching to Co-operative shares are set out in Fonterra’s Constitution, available in the ‘About Us/Our Governance’ section of Fonterra’s website.
Units in the Fonterra Shareholders’ Fund The Custodian holds legal title of Co-operative shares of which the Economic Rights have been sold to the Fund on trust for the benefit of the Fund. At 31 July 2018, 111,423,603 Co-operative shares (31 July 2017: 126,047,304) were legally owned by the Custodian, on trust for the benefit of the Fund.
UNITS (THOUSANDS)
Balance at 1 August 2017 126,047
Units issued 20,946
Units surrendered (35,569)
Balance at 31 July 2018 111,424
Balance at 1 August 2016 111,992
Units issued 29,933
Units surrendered (15,878)
Balance at 31 July 2017 126,047
The rights attaching to units are set out in the Fonterra Shareholders’ Fund 2018 Annual Report, available in the ‘Investors/Fonterra Shareholder’s Fund’ section of Fonterra’s website.
Capital management and structureThe Board’s objective is to maximise equity holder returns over time by maintaining an optimal capital structure. Trading Among Farmers (TAF) allows shares in Fonterra to be traded between shareholders, on the Fonterra Shareholders’ Market (a private market operated by NZX Limited). The Fund supports this by allowing investors, including farmers, to trade in units backed by Economic Rights in Fonterra. The Fund also allows farmer shareholders to acquire units and exchange them for shares in Fonterra, and to exchange shares for units and dispose of those units on the NZX or ASX.
The Group provides returns to farmer shareholders through a milk price, and to equity holders through dividends and changes in the Company’s share price.
The Fund is subject to the issue and redemption of units at the discretion of Fonterra and Fonterra’s farmer shareholders. Fonterra has an interest in ensuring the stability of the Fund and has established a Fund Size Risk Management Policy, which requires that the number of units on issue remain within specified limits and that within these limits, the number of units is managed appropriately. Fonterra may use a range of measures to ensure the Fund size remains within the specified limits, including introducing or cancelling a dividend reinvestment plan, operating a unit and/or share repurchase programme and issuing new shares.
Notes to the Summary Financial Statements CONTINUEDFOR THE YEAR ENDED 31 JULY 2018
For
per
sona
l use
onl
y
FONTERRA ANNUAL REPORT 201896
4 DIVIDENDS PAID
The Dividend Reinvestment Plan applied to all dividends in the table below.
$ MILLION
DIVIDENDS YEAR ENDED
31 JULY 2018YEAR ENDED
31 JULY 2017
2018 Interim dividend – 10 cents per share1 161 –
2017 Final dividend – 20 cents per share2 321 –
2017 Interim dividend – 20 cents per share3 – 321
2016 Final dividend – 10 cents per share4 – 160
1 Declared on 20 March 2018 and paid on 20 April 2018 to all Co-operative shares on issue at 6 April 2018.
2 Declared on 23 September 2017 and paid on 20 October 2017 to all Co-operative shares on issue at 9 October 2017.
3 Declared on 21 March 2017 and paid on 20 April 2017 to all Co-operative shares on issue at 5 April 2017.
4 Declared on 18 August 2016 and paid on 9 September 2016 to all Co-operative shares on issue at 1 September 2016.
5 BORROWINGS
Economic net interest-bearing debtEconomic net interest-bearing debt reflects the effect of debt hedging in place at balance date.
GROUP $ MILLION
AS AT 31 JULY 2018
AS AT 31 JULY 2017
Net interest-bearing debt position
Total borrowings 6,738 6,263
Cash and cash equivalents (446) (393)
Interest-bearing advances1 (332) (435)
Bank overdraft 161 11
Net interest-bearing debt 6,121 5,446
Value of derivatives used to manage changes in hedged risks on debt instruments 78 155
Economic net interest-bearing debt 6,199 5,601
1 Includes Fonterra Co-operative Support Loan balance of $177 million (31 July 2017: $135 million) which are netted against amounts owing to suppliers.
Notes to the Summary Financial Statements CONTINUEDFOR THE YEAR ENDED 31 JULY 2018
OUR FINANCIALS
For
per
sona
l use
onl
y
FONTERRA ANNUAL REPORT 2018 97
5 BORROWINGS CONTINUED
Total borrowings in the table above are represented by:
Total borrowings3 6,263 4,334 (4,077) 270 (61) 9 6,738
GROUP $ MILLION
BALANCE AS AT 1 AUGUST 2016 PROCEEDS REPAYMENTS
FOREIGN EXCHANGE
MOVEMENTCHANGES IN FAIR
VALUES OTHERBALANCE AS AT
31 JULY 2017
Commercial paper 454 951 (1,249) – – 8 164
Bank loans 879 2,698 (2,713) (10) – – 854
Finance leases1 143 – (6) – – – 137
Capital notes2 35 – – – – – 35
NZX-listed bonds 499 – – – 1 – 500
Medium-term notes 4,342 525 – (138) (158) 2 4,573
Total borrowings3 6,352 4,174 (3,968) (148) (157) 10 6,263
1 Finance leases are secured over the related item of property, plant and equipment.
2 Capital notes are unsecured subordinated borrowings.
3 All other borrowings are unsecured and unsubordinated.
Leverage ratiosThe Board closely monitors the Group’s leverage ratios. The primary ratios monitored by the Board are:
– Debt payback. The debt payback ratios are adjusted for the impact of operating leases. They are calculated as 1. Funds from operations divided by economic net interest-bearing debt, and 2. Economic net interest-bearing debt divided by earnings before interest, tax, depreciation and amortisation (EBITDA).
– Gearing. The gearing ratio is calculated as economic net interest-bearing debt, divided by equity plus economic net interest-bearing debt. Equity is as presented in the statement of financial position, excluding hedge reserves. The gearing ratio as at 31 July 2018 was 48.4 per cent (31 July 2017: 44.3 per cent).
The Group is not subject to externally imposed capital requirements.
Liquidity riskLiquidity risk is the risk that the Group will not be able to meet its financial obligations as they fall due. The Group’s approach to managing liquidity risk is to ensure that it will always have sufficient funds to meet its liabilities when due, under both normal and stressed conditions, without incurring unacceptable losses or risking damage to the Group’s reputation.
The Group has a policy in place to ensure that it has sufficient cash or facilities on demand to meet expected operational expenses for a period of at least 80 days, including the servicing of financial obligations. This excludes the potential impact of extreme circumstances that cannot reasonably be predicted, such as natural disasters. In such situations back-up funding lines are maintained and as set out in the Company’s constitution, the Company can defer payments to farmer shareholders if necessary.
The Group manages its liquidity by retaining cash and marketable securities, the availability of funding from an adequate amount of committed credit facilities and the ability to close out market positions. Fonterra’s funding facilities are reviewed at least annually, which is one of the key financial risk management activities undertaken by the Group to ensure an appropriate maturity profile given the nature of the Group’s business. At balance date the Group had undrawn lines of credit totalling $3,732 million (31 July 2017: $3,811 million).
Liquidity and refinancing risks are also managed by ensuring that Fonterra can maintain access to funding markets throughout the world. To that end, Fonterra maintains debt issuance programmes in a number of key markets and manages relationships with international investors.
Notes to the Summary Financial Statements CONTINUEDFOR THE YEAR ENDED 31 JULY 2018
For
per
sona
l use
onl
y
FONTERRA ANNUAL REPORT 201898
WORKING CAPITAL
6 OWING TO SUPPLIERS
The Board uses its discretion in establishing the rate at which Fonterra will pay suppliers for the milk supplied over the season. This is referred to as the advance rate. The following table provides a breakdown of the advance payments made to suppliers:
GROUP
AS AT 31 JULY 2018
AS AT 31 JULY 2017
Owing to suppliers1 ($ million) 1,579 1,330
Farmgate Milk Price2 (per kgMS) $6.69 $6.12
Of this amount:
– Total advance payments made during the year $5.55 $5.21
– Total owing as at 31 July $1.14 $0.91
Amount advanced during the year as a percentage of the milk price for the season ended 31 May
83% 85%
1 This amount is after offsetting $177 million of Fonterra Co-operative Support Loan repayments relating to the 2017/18 season (31 July 2017: $135 million).
2 Represents the average price for milk supplied on standard terms of supply. The Fonterra Farmgate Milk Price Statement sets out information about the Farmgate Milk Price as calculated in accordance with the Farmgate Milk Price Manual and the price for milk supplied on standard terms. It can be found in the ‘Investors/Farmgate Milk Prices’ section of the Fonterra website.
INVESTMENTS
7 EQUITY ACCOUNTED INVESTMENTS
The Group’s significant equity accounted investments are listed below. The ownership interest in these entities is 51 per cent or less and the Group is not considered to exercise a controlling interest.
Equity accounted investees with different balance dates from that of the Group are due to legislative requirements in the country the entities are domiciled or are aligned with their other investors’ balance dates or to align with the milk season.
OWNERSHIP INTERESTS (%)
EQUITY ACCOUNTED INVESTEE NAMECOUNTRY OF INCORPORATION AND PRINCIPAL PLACE OF BUSINESS
AS AT 31 JULY 2018
AS AT 31 JULY 2017
DMV Fonterra Excipients GmbH & Co. KG Germany 50 50
Beingmate Baby & Child Food Co., Ltd China 18.8 18.8
Falcon Dairy Holdings Limited Hong Kong 51 51
All investees have balance dates of 31 December.
Beingmate Baby & Child Food Co., Ltd. (Beingmate)As part of Fonterra’s long-term investment in the China market Fonterra holds an 18.8 per cent shareholding in Beingmate. The investment is recognised in the Consumer and Foodservice Greater China operating segment. During the year Beingmate’s share price has traded significantly below the share price at the time Fonterra acquired its investment, and also below the base share price used in the valuation assessments at 31 July 2017 and 31 January 2018. As a result, the carrying value of the investment has been assessed for impairment at 31 July 2018. To assess the recoverable amount of the investment a fair value less costs to sell methodology has been applied.
The fair value of the investment has been determined using an estimate of what a market participant would pay for a similar long-term strategic equity stake in Beingmate under current market conditions. The key assumptions used in determining the fair value are the base share price and the net premium above the base share price (acquisition premium) that would be paid for a long-term strategic investment of a similar size. This valuation methodology requires judgement, and is Level 3 in the fair value hierarchy as it is not based on market observable inputs.
Notes to the Summary Financial Statements CONTINUEDFOR THE YEAR ENDED 31 JULY 2018
OUR FINANCIALS
For
per
sona
l use
onl
y
FONTERRA ANNUAL REPORT 2018 99
7 EQUITY ACCOUNTED INVESTMENTS CONTINUED
The assumptions underlying the calculation of the fair value of the 18.8 per cent strategic investment in Beingmate are:
AS AT
RMB PER SHARE31 JULY 2018
AUDITED 31 JANUARY 2018
UNAUDITED31 JULY 2017
AUDITED
Weighted average share price period30 trading days
up to 31 July 201815 trading days from
22 January 2018
30 trading days pre-trading halt date
up to 10 July 2017Weighted average base price 4.91 5.36 13.66Net premium (including costs to sell) 0.48 0.52 2.45Implied value per share 5.39 5.88 16.11
Base share price assumptionFor the year ended 31 July 2018, to remove the impact of market volatility, a 30 trading-day period (20 June 2018 to 31 July 2018) was used to determine the base share price. The closing share price as at 31 July 2018 was RMB5.26 per share. The shares are traded on the Shenzhen stock exchange and accordingly the share price changes regularly, including during the period between balance date and the date these financial statements were authorised for issue. A change in the base share price to RMB4.50 per share would lead to elimination of the $18 million excess of recoverable amount over the carrying amount.
For the six months ended 31 January 2018, to remove the impact of market volatility, a 15 trading-day period immediately after the forecast earnings downgrade announced by Beingmate on the 21 January 2018 was used (22 January 2018 to 9 February 2018). It was appropriate to use information from immediately after the reporting date as the Beingmate share price continued to decline despite no new information being provided to the market. This was considered the most appropriate period as the market had fully reflected the earnings downgrade impact.
For the year ended 31 July 2017, Beingmate shares were on a trading halt from 12 July 2017 to 4 September 2017, therefore in the absence of an active market, the period immediately before the trading halt (26 May to 10 July 2017) was considered the most appropriate period to determine the base price given that during this period the shares traded at a relatively stable range.
Net premium assumptionThe acquisition premium reflects that a market participant would expect to pay a premium above the quoted share price to acquire a long term strategic investment. The premium is determined by considering recent transaction data and the characteristics of the investment and is calculated relative to the base share price.
The amount attributed to the acquisition premium reflects that Beingmate is an established local participant in a growth market and has a number of brands registered under the new regulations effective 1 January 2018. The significant reduction in the acquisition premium from 31 July 2017 reflects the poor financial performance, reduction in market share, and the operational and governance challenges experienced by Beingmate during the year. As at 31 July 2018 the valuation assessment is not sensitive to a reasonable change in the acquisition premium.
Carrying value of the investmentThe carrying value of the investment in Beingmate has reduced from the prior year primarily due to an impairment loss recognised in the 31 January 2018 interim financial statements. As at 31 July 2018 the carrying value of the investment is supported by the fair value assessment therefore no further impairment has been recorded. A reconciliation of the carrying amount of the investment is shown below.
GROUP $ MILLION
AS AT
31 JULY 2018 AUDITED
31 JANUARY 2018 UNAUDITED
31 JULY 2017 AUDITED
Opening balance 617 617 740Share of losses (34) (28) (41)Impairment loss (405) (405) (35)Effect of movement in exchange rates 26 60 (47)
Closing balance 204 244 617
Notes to the Summary Financial Statements CONTINUEDFOR THE YEAR ENDED 31 JULY 2018
For
per
sona
l use
onl
y
FONTERRA ANNUAL REPORT 2018100
FINANCIAL RISK MANAGEMENT
8 FINANCIAL RISK MANAGEMENT
OverviewThe Group’s overall financial risk management programme focuses primarily on maintaining a prudent financial risk profile that provides flexibility to implement the Group’s strategies, while ensuring optimisation of the return on assets. Financial risk management is centralised, which supports compliance with the financial risk management policies and procedures set by the Board.
KEY FINANCIAL RISK MANAGEMENT ACTIVITIES
Market risksThe Group uses various derivative financial instruments to manage its exposure to changes in foreign currency exchange rates, interest rates and commodity prices.
Liquidity riskThe Group actively manages its minimum on-hand cash facilities, access to committed funds and lines of credit and the maturity profile of its financial obligations. For further detail refer to Note 5.
Capital managementThe Group actively manages its capital structure through leverage and coverage ratios. The Fonterra Shareholders’ Fund removes the redemption risk associated with Co-operative shares. For further detail refer to Note 3.
OTHER
9 TAXATION
Taxation – income statementThe total taxation expense in the income statement is summarised as follows:
GROUP $ MILLION
31 JULY 2018 31 JULY 2017
Current tax expense 81 97
Prior period adjustments to current tax (5) (25)
Deferred tax movements:
– Origination and reversal of temporary differences (34) (52)
Tax expense 42 20
Notes to the Summary Financial Statements CONTINUEDFOR THE YEAR ENDED 31 JULY 2018
OUR FINANCIALS
For
per
sona
l use
onl
y
FONTERRA ANNUAL REPORT 2018 101
9 TAXATION CONTINUED
The taxation charge that would arise at the standard rate of corporation tax in New Zealand is reconciled to the tax expense as follows:
GROUP $ MILLION
31 JULY 2018 31 JULY 2017
(Loss)/profit before tax (154) 765
Prima facie tax expense at 28% (43) 214
Add/(deduct) tax effect of:
– Effect of tax rates in foreign jurisdictions (27) (33)
– Non-deductible expenses/additional assessable income 168 54
Tax expense before distributions and deferred tax 69 180
Effective tax rate before distributions and deferred tax1 NA 23.5%
Tax effect of distributions to farmer shareholders (27) (163)
Tax expense before deferred tax 42 17
Effective tax rate before deferred tax1 NA 2.2%
Add/(deduct) tax effect of:
– Origination and reversal of other temporary differences (2) 2
– Losses of overseas Group entities not recognised 2 1
Tax expense 42 20
Effective tax rate1 NA 2.6%
Imputation credits
Imputation credits available for use in subsequent reporting periods 20 20
Tax losses
Gross tax losses available for which no deferred tax asset has been recognised 54 52
1 The effective tax rate is the tax charge on the face of the income statement expressed as a percentage of the profit before tax. For the year ended 31 July 2018 the Group has recorded a net loss before tax, as a result the calculation of an effective tax rate is not applicable.
Notes to the Summary Financial Statements CONTINUEDFOR THE YEAR ENDED 31 JULY 2018
For
per
sona
l use
onl
y
FONTERRA ANNUAL REPORT 2018102
10 CONTINGENT LIABILITIES, PROVISIONS AND COMMITMENTS
Contingent liabilities In the normal course of business, Fonterra, its subsidiaries and equity accounted investees, are exposed to claims and legal proceedings that may in some cases result in costs to the Group.
In early August 2013, Fonterra publicly announced a potential food safety issue with three batches of Whey Protein Concentrate (WPC80) produced at the Hautapu manufacturing site and initiated a precautionary product recall.
In late August 2013, the New Zealand Government confirmed that the Clostridium samples found in WPC80 were not Clostridium botulinum and were not toxigenic, meaning the consumers of products containing the relevant batches of WPC80 were never in danger from Clostridium botulinum.
In January 2014, Danone formally initiated legal proceedings against Fonterra in the High Court of New Zealand and separate Singapore arbitration proceedings against Fonterra in relation to the WPC80 precautionary recall. The New Zealand High Court proceedings have been stayed pending completion of the Singapore arbitration.
On 1 December 2017, the Singapore arbitration panel issued its award (judgement), finding in favour of Danone and ordered Fonterra to pay €105 million ($183 million) in recall costs to Danone.
In addition to the recall costs, Fonterra was also required to pay Danone €29 million ($49 million) representing interest on the award amount and Danone’s costs in connection with the arbitration proceedings. Fonterra paid the award amount in December 2017 and the interest and costs in March 2018.
It is unclear whether Danone will continue to pursue the New Zealand High Court proceedings that were stayed pending the decision in the Singapore arbitration. Due to the uncertainty regarding whether Danone will seek to re-initiate these proceedings, and the nature and scope of these potential proceedings in light of the arbitration findings and award, no amount has been recognised in relation to these proceedings.
There are no additional claims or legal proceedings in respect of this matter that require provision or disclosure in these financial statements.
The Group has no other contingent liabilities as at 31 July 2018 (31 July 2017: nil).
11 NET TANGIBLE ASSETS PER SECURITY
GROUP
AS AT 31 JULY 2018
AS AT 31 JULY 2017
Net tangible assets per security1
$ per listed debt security on issue 5.18 6.86
$ per equity instrument on issue 1.94 2.57
Listed debt securities on issue (million) 603 603
Equity instruments on issue (million) 1,612 1,607
1 Net tangible assets represents total assets less total liabilities less intangible assets.
Notes to the Summary Financial Statements CONTINUEDFOR THE YEAR ENDED 31 JULY 2018
OUR FINANCIALS
For
per
sona
l use
onl
y
FONTERRA ANNUAL REPORT 2018 103
Independent Auditor’s ReportTO THE SHAREHOLDERS OF FONTERRA CO-OPERATIVE GROUP LIMITED
The summary financial statements comprise:
– the statement of financial position as at 31 July 2018;
– the income statement for the year then ended;
– the statement of comprehensive income for the year then ended;
– the statement of changes in equity for the year then ended;
– the cash flow statement for the year then ended; and
– the notes to the summary financial statements.
OUR OPINION
The summary financial statements are derived from the audited financial statements of Fonterra Co-operative Group Limited (the Company), including its controlled entities (the Group) for the year ended 31 July 2018.
In our opinion, the accompanying summary financial statements are consistent, in all material respects, with the audited financial statements, in accordance with FRS-43: Summary Financial Statements issued by the New Zealand Accounting Standards Board.
SUMMARY FINANCIAL STATEMENTS
The summary financial statements do not contain all the disclosures required by New Zealand equivalents to International Financial Reporting Standards (NZ IFRS). Reading the summary financial statements and the auditor’s report thereon, therefore, is not a substitute for reading the audited financial statements and the auditor’s report thereon. The summary financial statements and the audited financial statements do not reflect the effects of events that occurred subsequent to the date of our report on the audited financial statements.
THE AUDITED FINANCIAL STATEMENTS AND OUR REPORT THEREON
We expressed an unmodified audit opinion on the audited financial statements in our report dated 12 September 2018.
That report also includes the communication of key audit matters. Key audit matters are those matters that, in our professional judgement, were of most significance in our audit of the financial statements of the current year.
RESPONSIBILITIES OF THE DIRECTORS FOR THE SUMMARY FINANCIAL STATEMENTS
The Directors are responsible, on behalf of the Company and Group, for the preparation of the summary financial statements in accordance with FRS-43: Summary Financial Statements.
AUDITOR’S RESPONSIBILITY
Our responsibility is to express an opinion on whether the summary financial statements are consistent, in all material respects, with the audited financial statements based on our procedures, which were conducted in accordance with International Standard on Auditing (New Zealand) 810 (Revised), Engagements to Report on Summary Financial Statements.
AUDITOR INDEPENDENCE
We are independent of the Group in accordance with Professional and Ethical Standard 1 (Revised) Code of Ethics for Assurance Practitioners (PES 1) issued by the New Zealand Auditing and Assurance Standards Board and the International Ethics Standards Board for Accountants’ Code of Ethics for Professional Accountants (IESBA Code), and we have fulfilled our other ethical responsibilities in accordance with these requirements.
Bruce Hassall was appointed an Independent Director and Chair of the Audit and Finance Committee (AFC) of the Company on 2 November 2017. Bruce Hassall was Chief Executive Officer of PricewaterhouseCoopers to 30 September 2016 when he retired from the firm. At the time of his appointment, the Board of the Company (the Board) made the decision that Bruce Hassall would not be involved in the appointment of the Group’s auditor or the setting of audit fees for three years from the date of his appointment. Scott St John, Independent Director and member of the AFC, would act as Chair of the AFC for these matters and the Chair of the Board will join the AFC for deliberation. In addition, the engagement partner on the audit has direct access to the Chair of the Board to address any actual or perceived auditor independence threats.
For
per
sona
l use
onl
y
FONTERRA ANNUAL REPORT 2018104
OUR FINANCIALS
Independent Auditor’s Report CONTINUED
Brent Goldsack was appointed a Director of the Company on 2 November 2017. Brent Goldsack retired as a partner of PricewaterhouseCoopers on 22 September 2017. Brent Goldsack was not involved in the provision of any audit services to the Group during his time as a partner of PricewaterhouseCoopers.
Bruce Hassall and Brent Goldsack had no financial relationship with PricewaterhouseCoopers upon their appointment as Directors of the Company.
Our firm carries out assurance services for the Group to assess risks and controls in relation to the Group’s food supply chain as well as other assurance and attestation services. Partners and employees of our firm may deal with the Group on normal terms within the ordinary course of trading activities of the Group.
These matters have not impaired our independence as auditor of the Group.
WHO WE REPORT TO
This report is made solely to the Company’s shareholders, as a body. Our audit work has been undertaken so that we might state those matters which we are required to state to them in an auditor’s report and for no other purpose. To the fullest extent permitted by law, we do not accept or assume responsibility to anyone other than the Company and the Company’s shareholders, as a body, for our audit work, for this report or for the opinions we have formed.
Chartered AccountantsAuckland
12 September 2018
For
per
sona
l use
onl
y
FONTERRA ANNUAL REPORT 2018 105
CURRENT CREDIT RATING STATUS
Standard & Poor’s long term rating for Fonterra is A- with a rating outlook of stable. Fitch’s long and short term default rating is A with a rating outlook of stable. Retail Bonds have been rated the same as the Company’s long term rating by both Standard & Poor’s and Fitch. Capital Notes which are subordinate to other Fonterra debt issued are rated BBB+ by Standard & Poor’s and A- by Fitch.
EXCHANGE RULINGS AND WAIVERS
NZX Limited (NZX) has ruled that Capital Notes do not constitute ‘equity securities’ under the NZX Main Board/Debt Market Listing Rules (‘Rules’). This means that where Capital Notes are quoted on NZX’s Debt Market (‘NZDX’), the Company is not required to comply with certain Rules which apply to an issuer of quoted equity securities.
The Company was issued with a waiver of Rule 11.1.1 to enable it to decline to accept or register transfers of Capital Notes (NZDX listed debt securities FCGHA) if such transfer would result in the transferor holding or continuing to hold Capital Notes with a face value or principal amount of less than $5,000 or if such transfer is for an amount of less than $1,000 or not a multiple thereof. The effect of this waiver is that the minimum holding amount in respect of the Capital Notes will, at all times, be $5,000 in aggregate and can only be transferred in multiples of $1,000.
Fonterra Co-operative Group Limited (Fonterra) was issued with a ruling in respect of Rule 1.7.1(d) of the Fonterra Shareholders’ Market Rules on 27 June 2017 by NZX. The effect of this ruling was to not preclude the appointment of Mr Bruce Hassall to the position of an independent director of Fonterra, by virtue of a child of Mr Hassall being employed in a non-decision making and non-senior role at Fonterra.
Fonterra was issued with a ruling in respect of Rule 5.1.2(c) on 22 November 2016 by NZX. The effect of this ruling is that Fonterra’s internal governance resolutions are considered to be matters that do not require the NZX to approve a notice of meeting under Rule 5.1.1.
Fonterra was issued with a waiver of Rule 3.2.1(c) on 31 August 2016 by the NZX, to the extent that such Rule requires Fonterra to have a minimum of two independent directors or, if Fonterra has eight or more directors, three or one-third of the total number of directors, whichever is greater. This waiver was granted in connection with the resignation of Mr John Waller and applied for a period ending on the earlier of the appointment of a new independent director or three months from the date of the waiver.
NZX TRADING HALTS
No trading halts were placed on Fonterra securities by NZX Regulation in the financial year ended 31 July 2018.
Statutory InformationFOR THE YEAR ENDED 31 JULY 2018
For
per
sona
l use
onl
y
FONTERRA ANNUAL REPORT 2018106
Fonterra uses several non-GAAP measures when discussing financial performance. For further details and definitions of non-GAAP measures used by Fonterra, refer to the glossary on page 107. These are non-GAAP measures and are not prepared in accordance with NZ IFRS.
Management believes that these measures provide useful information as they provide valuable insight on the underlying performance of the business. They may be used internally to evaluate the underlying performance of business units and to analyse trends. These measures are not uniformly defined or utilised by all companies. Accordingly, these measures may not be comparable with similarly titled measures used by other companies. Non-GAAP financial measures should not be viewed in isolation nor considered as a substitute for measures reported in accordance with NZ IFRS.
Reconciliations for the NZ IFRS measures to certain non-GAAP measures referred to by Fonterra are detailed below.
Reconciliation from the NZ IFRS measure of profit for the period to Fonterra’s normalised EBITDA
GROUP $ MILLION
31 JULY 2018 31 JULY 2017
(Loss)/profit for the period (196) 745Add: Depreciation 446 435Add: Amortisation 98 91Add: Net finance costs 416 355Add: Taxation expense 42 20
Total EBITDA 806 1,646
Add/(Less): Time value of options 5 1Add: Reduction in the carrying value of investment in Beingmate 439 76Add: WPC80 recall costs 196 –Less: Gain on sale of Darnum manufacturing plant – (42)
Total normalisation adjustments 640 35
Normalised EBITDA 1,446 1,681
Reconciliation from the NZ IFRS measure of profit for the period to Fonterra’s normalised EBIT
GROUP $ MILLION
31 JULY 2018 31 JULY 2017
(Loss)/profit for the period (196) 745Add: Net finance costs 416 355Add: Taxation expense 42 20
Reconciliation from the NZ IFRS measure of profit for the period to Fonterra’s normalised earnings per share
GROUP $ MILLION
31 JULY 2018 31 JULY 2017
(Loss)/Profit for the period (196) 745Add: Normalisation adjustments (as detailed above) 640 35Add: Normalisation adjustment to net finance costs 26 –(Less)/Add: Tax on normalisation adjustments (63) 12
Total normalised earnings 407 792
Less: Share attributable to non-controlling interests (25) (11)Net normalised earnings attributable to equity holders of the Parent 382 781Weighted average number of shares (thousands of shares) 1,610,005 1,604,744Normalised earnings per share ($) 0.24 0.49
Non-GAAP MeasuresOUR FINANCIALS
For
per
sona
l use
onl
y
FONTERRA ANNUAL REPORT 2018 107
NON-GAAP MEASURES
Fonterra refers to non-GAAP financial measures throughout the Annual Review, and these measures are not prepared in accordance with NZ IFRS. The definitions below explain how Fonterra calculates the non-GAAP measures referred to throughout the Annual Review.
EBIT means earnings before interest and tax and is calculated as profit for the period before net finance costs and tax.
EBITDA means earnings before interest, tax, depreciation and amortisation and is calculated as profit for the period before net finance costs, tax, depreciation and amortisation.
Economic net interest bearing debt means net interest-bearing debt including the effect of debt hedging.
Farmgate Milk Price means the base price that Fonterra pays for milk supplied to it in New Zealand for a season. The season refers to the 12-month milk season of 1 June to 31 May.
Gearing ratio is calculated as economic net interest-bearing debt divided by total capital. Total capital is equity excluding the hedge reserves, plus economic net interest-bearing debt.
Normalisation adjustments means transactions that are unusual by nature and size. Excluding these transactions can assist users with forming a view of the underlying performance of the business. Unusual transactions by nature are the result of specific events or circumstances that are outside the control of the business, or relate to major acquisitions, disposals or divestments, or are not expected to occur frequently. It also includes fair value movements if they are non-cash and have no impact on profit over time. Unusual transactions by size are those that are unusually large in a particular accounting period.
Normalised EBIT means profit for the period before net finance costs and tax, and after normalisation adjustments.
Normalised earnings per share (EPS) means normalised profit after tax attributable to equity holders divided by the weighted average number of shares for the period.
Normalised profit after tax means net profit after tax after normalisation adjustments, and the interest and tax impacts of those normalisation adjustments.
Normalised segment earnings means segmental profit for the period before net finance costs and tax, and after normalisation adjustments.
Payout means the total cash payment to farmer shareholders. It is the sum of the Farmgate Milk Price (kg/MS) and the dividend per share. Both of these components have established policies and procedures in place on how they are determined.
Retentions means net profit after tax attributable to farmer shareholders divided by the number of shares at 31 May, less dividend per share.
Return on capital is calculated as normalised EBIT less equity accounted investees’ earnings divided by capital employed. Capital employed is calculated as the average for the period of: net assets excluding net interest-bearing debt, deferred tax balances and brands, goodwill and equity accounted investments.
Segment earnings means segmental profit for the period before net finance costs and tax.
Working Capital is calculated as current trade receivables plus inventories, less current trade payables and accruals. It excludes amounts owing to suppliers and employee entitlements.
Glossary
For
per
sona
l use
onl
y
FONTERRA ANNUAL REPORT 2018108
FONTERRA BOARD OF DIRECTORS
John MonaghanClinton DinesBrent GoldsackBruce HassallSimon Israel Andrew MacfarlaneNicola ShadboltDonna SmitScott St JohnAshley WaughJohn Wilson
FONTERRA MANAGEMENT TEAM
Miles Hurrell Marc RiversLukas ParaviciniRobert Spurway Judith Swales Kelvin WickhamMike CroninMark Van Zon
REGISTERED OFFICE
Fonterra Co-operative Group LimitedPrivate Bag 92032Auckland 1142 New Zealand109 Fanshawe StreetAuckland Central 1010New ZealandPhone +64 9 374 9000 Fax +64 9 374 9001
This document is printed on environmentally responsible paper stocks.The mix of stocks includes: Cocoon 100% post-consumer waste, certified through FSC® recycled credit program.Sumo, produced using elemental chlorine free (ECF), FSC® certified mixed source pulp from responsible sources, and manufactured under the strict ISO14001.Printed on HP indigo B2 12000 under their C02 carbon neutral good energy initiative.
For
per
sona
l use
onl
y
Annual Financial ResultsFOR THE YEAR ENDED 31 JULY 2018
For
per
sona
l use
onl
y
FONTERRA ANNUAL FINANCIAL RESULTS 2018
Contents
Directors’ Statement 01
Income Statement 02
Statement of Comprehensive Income 03
Statement of Financial Position 04
Statement of Changes in Equity 05
Cash Flow Statement 06
Basis of Preparation 07
Notes to the Financial Statements 09
Independent Auditor’s Report 52
Statutory Information 57
For
per
sona
l use
onl
y
FONTERRA ANNUAL FINANCIAL RESULTS 2018 01
Directors’ StatementFOR THE YEAR ENDED 31 JULY 2018
1 This document, in conjunction with the Fonterra Annual Review 2018, constitutes the 2018 Annual Report to Shareholders of Fonterra Co-operative Group Limited.
The Directors of Fonterra Co-operative Group Limited (Fonterra) present to Shareholders the Annual Report¹ and financial statements for Fonterra and its subsidiaries (together the Group) and the Group’s interest in its equity accounted investments for the year ended 31 July 2018.
The Directors present financial statements for each financial year which fairly present the financial position of the Group and its financial performance and cash flows for that period.
The Directors consider the financial statements of the Group have been prepared using accounting policies which have been consistently applied and supported by reasonable judgements and estimates, and that all relevant financial reporting and accounting standards have been followed.
The Directors believe that proper accounting records have been kept which enable, with reasonable accuracy, the determination of the financial position of the Group and facilitate compliance of the financial statements with the Financial Markets Conduct Act 2013.
The Directors consider that they have taken adequate steps to safeguard the assets of the Group, and to prevent and detect fraud and other irregularities.
The Directors hereby approve and authorise for issue the Annual Report for the year ended 31 July 2018. For and on behalf of the Board:
John Monaghan Bruce HassallChairman Director12 September 2018 12 September 2018
For
per
sona
l use
onl
y
FONTERRA ANNUAL FINANCIAL RESULTS 201802
GROUP $ MILLION
NOTES 31 JULY 2018 31 JULY 2017
Revenue from sale of goods 20,438 19,232
Cost of goods sold 2 (17,279) (15,968)
Gross profit 3,159 3,264
Other operating income 192 190
Selling and marketing expenses (651) (641)
Distribution expenses (572) (550)
Administrative expenses 4 (873) (810)
Other operating expenses 4 (400) (334)
WPC 80 recall costs (196) –
Impairment of equity accounted investees 16 (405) (35)
Net foreign exchange (losses)/gains (12) 29
Share of profit of equity accounted investees 16 20 7
Profit before net finance costs and tax 4 262 1,120
Finance income 8 23 34
Finance costs 8 (439) (389)
Net finance costs (416) (355)
(Loss)/profit before tax (154) 765
Tax expense 18 (42) (20)
(Loss)/profit after tax (196) 745
(Loss)/profit after tax is attributable to:
Equity holders of the Co-operative (221) 734
Non-controlling interests 25 11
(Loss)/profit after tax (196) 745
GROUP $
31 JULY 2018 31 JULY 2017
Earnings per share:
Basic and diluted earnings per share 3 (0.14) 0.46
Income StatementFOR THE YEAR ENDED 31 JULY 2018
For
per
sona
l use
onl
y
FONTERRA ANNUAL FINANCIAL RESULTS 2018 03
GROUP $ MILLION
NOTES 31 JULY 2018 31 JULY 2017
(Loss)/profit after tax (196) 745
Items that may be reclassified subsequently to profit or loss:
Cash flow hedges and other costs of hedging, net of tax (459) 128
Net investment hedges and translation of foreign operations, net of tax 188 (124)
Hyperinflation gains/(losses) attributable to equity holders 17 (1)
Share of equity accounted investees’ movements in reserves 16 – –
Other reserve movements (1) (2)
Total items that may be reclassified subsequently to profit or loss (255) 1
Items that will not be reclassified subsequently to profit or loss:
Net fair value gains on investments in shares 8 2
Foreign currency translation losses attributable to non-controlling interests (2) (3)
Hyperinflation movements attributable to non-controlling interests 12 –
Non-controlling interests other movements – (2)
Total items that will not be reclassified subsequently to profit or loss 18 (3)
Total other comprehensive expense recognised directly in equity (237) (2)
Total comprehensive (expense)/income (433) 743
Total comprehensive (expense)/income is attributable to:
Equity holders of the Co-operative (468) 737
Non-controlling interests 35 6
Total comprehensive (expense)/income (433) 743
Statement of Comprehensive IncomeFOR THE YEAR ENDED 31 JULY 2018
For
per
sona
l use
onl
y
FONTERRA ANNUAL FINANCIAL RESULTS 201804
GROUP $ MILLION
NOTES 31 JULY 2018 31 JULY 2017
ASSETS
Current assets
Cash and cash equivalents 446 393Trade and other receivables 9 2,355 2,303Inventories 10 2,917 2,593Tax receivable 47 32Derivative financial instruments 59 580
As at 31 July 2017 5,858 1,637 (552) 192 5 7,140 108 7,248
Statement of Changes in EquityFOR THE YEAR ENDED 31 JULY 2018
For
per
sona
l use
onl
y
FONTERRA ANNUAL FINANCIAL RESULTS 201806
GROUP $ MILLION
31 JULY 2018 31 JULY 2017
Cash flows from operating activities
Profit before net finance costs and tax 262 1,120Adjustments for:Foreign exchange losses/(gains) 239 (1)Depreciation and amortisation 544 526Impairment of equity accounted investees 405 35
Other 5 (20)
1,193 540Decrease/(increase) in working capital:Inventories (313) (177)Trade and other receivables 75 (634)Amounts owing to suppliers 277 745Payables and accruals 98 (100)
Other movements 42 (48)
Total 179 (214)
Cash generated from operations 1,634 1,446
Net taxes paid (86) (70)
Net cash flows from operating activities 1,548 1,376
Cash flows from investing activitiesCash was provided from:
– Proceeds from disposal of property, plant and equipment 26 105 – Proceeds from sale of livestock 79 62 – Co-operative support loans 149 41 – Other cash inflows 13 10
Cash was applied to: – Acquisition of property, plant and equipment (858) (690) – Acquisition of livestock (including rearing costs) (45) (89) – Acquisition of intangible assets (147) (103) – Advances to and investments in equity accounted investees (151) (42) – Other cash outflows (14) –
Net cash flows from investing activities (948) (706)
Cash flows from financing activitiesCash was provided from:
– Proceeds from borrowings 4,334 4,174 – Interest received 18 13 – Other cash inflows – 38
Cash was applied to: – Interest paid (446) (393) – Repayment of borrowings (4,077) (3,968) – Dividends paid to non-controlling interests (27) (28) – Dividends paid to equity holders of the Co-operative (453) (456) – Other cash outflows (74) (2)
Net cash flows from financing activities (725) (622)
Net (decrease)/increase in cash (125) 48
Opening cash 382 357
Effect of exchange rate changes 28 (23)
Closing cash 285 382
Reconciliation of closing cash balances to the statement of financial position:Cash and cash equivalents 446 393Bank overdraft (161) (11)
Closing cash 285 382
Cash Flow StatementFOR THE YEAR ENDED 31 JULY 2018
For
per
sona
l use
onl
y
FONTERRA ANNUAL FINANCIAL RESULTS 2018 07
Basis of PreparationFOR THE YEAR ENDED 31 JULY 2018
A) GENERAL INFORMATION
Fonterra Co-operative Group Limited (Fonterra, the Company or the Co-operative) is a co-operative company incorporated and domiciled in New Zealand. Fonterra is registered under the Companies Act 1993 and the Co-operative Companies Act 1996, and is a FMC Reporting Entity under the Financial Markets Conduct Act 2013. Fonterra is also required to comply with the Dairy Industry Restructuring Act 2001.
These financial statements comprise Fonterra and its subsidiaries (together referred to as the Group) and the Group’s interest in its equity accounted investees after adjustments to align to the accounting policies of the Group.
The Group operates predominantly in the international dairy industry. The Group is primarily involved in the collection, manufacture and sale of milk and milk-derived products and in fast-moving consumer goods and foodservice businesses.
B) BASIS OF PREPARATION
These financial statements comply with International Financial Reporting Standards (IFRS). These financial statements also comply with New Zealand Equivalents to International Financial Reporting Standards (NZ IFRS) and have been prepared in accordance with Generally Accepted Accounting Practice (GAAP) applicable to for-profit entities.
These financial statements are prepared on a historical cost basis, except for derivative financial instruments, livestock and the hedged risks on certain debt instruments, which are recognised at their fair values.
These financial statements are presented in New Zealand dollars ($ or NZD), which is Fonterra’s functional currency, and rounded to the nearest million, except where otherwise stated.
Significant accounting policies which are relevant to an understanding of the financial statements and summarise the measurement basis used are provided throughout the Notes in green frames.
In the process of applying the Group’s accounting policies, management make a number of judgements, estimates of future events, and assumptions. These are all believed to be reasonable based on the most current set of circumstances available to the Group. Judgements and estimates that have the most significant effect on the amounts recognised in the financial statements are described below and in the following notes:
China Farms assets (Note 13)The recoverable amount of the assets held by the China Farms operating segment is assessed at least annually to ensure they are not impaired. Performing this assessment requires management to estimate the future milk price in China, an asset specific pre-tax discount rate and the terminal growth rate.
Intangible assets (Note 15)The recoverability of the carrying value of goodwill and indefinite life brands is assessed at least annually to ensure they are not impaired. Performing this assessment requires management to estimate future cash flows, pre-tax discount rates and terminal growth rates.
Investment in Beingmate Baby & Child Food Co., Ltd. (Beingmate) (Note 16)The recoverable amount of the investment in Beingmate is determined on a fair value basis using an estimate of what a market participant would pay for a similar long-term strategic equity stake in Beingmate under current market conditions. The key assumptions that management determine in performing the valuation assessment are the base share price and the acquisition premium.
Provisions and contingent liabilities (Note 19)Legal counsel or other experts are consulted on matters that may give rise to a provision or a contingent liability. Estimates and assumptions are made in determining the likelihood, amount and timing of cash outflows when the outcome is uncertain.
Deferred tax assets (Note 18)Deferred tax assets relating to tax losses carried forward can only be recognised if it is probable that they can be used. In assessing the amount of tax losses that can be recognised management has estimated the forecast future taxable profits against which the tax losses carried forward can be utilised.
C) BASIS OF CONSOLIDATION
In preparing these financial statements, subsidiaries are consolidated from the date the Group gains control until the date on which control ceases. The Group’s share of results of equity accounted investments is included in the consolidated financial statements from the date that significant influence or joint control commences, until the date that significant influence or joint control ceases. All intercompany transactions are eliminated.
Translation of the financial statements into NZDThe assets and liabilities of Group companies whose functional currency is not NZD are translated into NZD at the year end exchange rate. The revenue and expenses of these companies are translated into NZD at rates approximating those at the dates of the transactions. Exchange differences arising on this translation are recognised in the foreign currency translation reserve. On disposal or partial disposal of an entity, the related exchange differences that were recorded in equity are recognised in the income statement as part of the gain or loss on sale. The financial statements of a subsidiary in a hyperinflationary economy are translated into NZD at the year end exchange rate. For consolidation, Fonterra translates its operations in Venezuela using the year end exchange rate that is most representative of the entity’s economic circumstances.
For
per
sona
l use
onl
y
FONTERRA ANNUAL FINANCIAL RESULTS 201808
D) NEW AND AMENDED INTERNATIONAL FINANCIAL REPORTING STANDARDS ISSUED BUT NOT YET EFFECTIVE
New and amended standards that could be expected to have a material impact on the Group’s financial statements, which were available for early adoption but have not been adopted, are stated below.
NZ IFRS 15, effective 1 August 2018NZ IFRS 15 Revenue from Contracts with Customers replaces the current guidance on revenue recognition. It requires revenue to be recognised when a customer obtains control of the goods or services, and has the ability to direct the use and obtain the benefits from those goods or services.
Fonterra is not materially impacted by the adoption of NZ IFRS 15.
Management has assessed the effect of applying NZ IFRS 15 through the detailed assessment of significant and more complex contracts across the Group. The majority of revenue earned by the Group is derived from the sale of products. Fonterra’s obligations under the contracts are fulfilled when the product is provided to the customer. Revenue is currently recognised at the time the risks and rewards of ownership of the products passes to the customer. The detailed assessment of contracts performed by management has determined that the customer obtains control of products at the same time as the risks and rewards pass to the customer. This means that for Fonterra there is no change to the timing of revenue recognition under NZ IFRS 15.
In relation to the contract price, the detailed assessment performed by management has not identified any material changes to the accounting for rebates, discounts, or other items of variable consideration.
On transition to NZ IFRS 15 Fonterra will take advantage of the practical expedient to only apply NZ IFRS 15 to contracts that have not been completely fulfilled.
NZ IFRS 16, effective 1 August 2019NZ IFRS 16 Leases replaces the current guidance on lease accounting. It requires a lease liability, reflecting future lease payments, and a ‘right of use asset’ to be recognised for most lease contracts. This includes many of the leases currently classified as operating leases for which no asset or liability is reflected on the statement of financial position under existing accounting rules.
Fonterra has continued to assess the impact of NZ IFRS 16, and established a project to ensure operational readiness. Fonterra has evaluated the transition options and has elected to utilise the modified retrospective approach, which means the cumulative effect of adopting NZ IFRS 16 will be recognised as an adjustment to the opening balance of retained earnings on 1 August 2019 with no restatement of comparative information. Fonterra has also chosen to retain the current accounting treatment for short-term leases and leases of low value assets.
The adoption of NZ IFRS 16 is not expected to have a significant impact on Fonterra’s net profit after tax. However, there will be an increase in profit before net finance costs and tax, because a portion of the lease costs currently reported in cost of goods sold or operating expenses will be recorded as finance costs. On the statement of financial position, many of Fonterra’s current operating leases will be recognised as ‘right of use assets’ and a lease liability. Fonterra’s operating lease commitments at 31 July 2018 are disclosed in Note 19.
There are no other new or amended standards that are issued but not yet effective that are expected to have a material impact on the Group.
Basis of Preparation CONTINUED
FOR THE YEAR ENDED 31 JULY 2018
For
per
sona
l use
onl
y
FONTERRA ANNUAL FINANCIAL RESULTS 2018 09
NOTE PAGE
PERFORMANCE 10
1 Segment reporting 10
2 Cost of goods sold 14
3 Earnings per share 14
4 Profit before net finance costs and tax 14
DEBT AND EQUITY 15
5 Subscribed equity instruments 15
6 Dividends paid 16
7 Borrowings 17
8 Net finance costs 20
WORKING CAPITAL 20
9 Trade and other receivables 20
10 Inventories 21
11 Trade and other payables 22
12 Owing to suppliers 22
LONG-TERM ASSETS 23
13 Property, plant and equipment 23
14 Livestock 25
15 Intangible assets 26
INVESTMENTS 29
16 Equity accounted investments 29
FINANCIAL RISK MANAGEMENT 31
17 Financial risk management 31
OTHER 43
18 Taxation 43
19 Contingent liabilities, provisions and commitments 46
20 Related party transactions 48
21 Subsidiaries 49
22 Net tangible assets per security 51
Notes to the Financial StatementsFOR THE YEAR ENDED 31 JULY 2018
For
per
sona
l use
onl
y
FONTERRA ANNUAL FINANCIAL RESULTS 201810
PERFORMANCE
This section focuses on Fonterra’s financial performance and the returns provided to equity holders.
This section includes the following Notes:
Note 1: Segment reporting
Note 2: Cost of goods sold
Note 3: Earnings per share
Note 4: Profit before net finance costs and tax
1 SEGMENT REPORTING
The financial information reviewed by the Fonterra Management Team (FMT) has evolved over the past two years to reflect the changes in the management structure to support the operations of the Group. From 1 August 2017 the financial information reviewed by the Fonterra Management Team is solely based on the previously identified ‘strategic platforms’.
a) Operating segmentsOperating segments reflect the way financial information is regularly reviewed by the FMT. The measure of profit or loss used by the FMT to evaluate the underlying performance of operating segments is normalised segment earnings before net finance costs and tax. To enable underlying segment performance to be compared between reporting periods a normalised segment income statement has been presented. Comparative segment income statements have been re-presented on a normalised basis.
Transactions between segments are based on estimated market prices, with the exception of the sale of milk from China Farms to Ingredients. The transfer price used for these transactions is an amount reflective of long-term milk price trends in China.
Unallocated costs represent corporate costs including Corporate Affairs and Group services.
REPORTABLE SEGMENT DESCRIPTION
Ingredients Represents the collection, processing and distribution of the ingredients business in New Zealand, global sales and marketing of New Zealand and non-New Zealand ingredients products, Fonterra Farm Source™ stores, the ingredients business in Australia (including Milk Supply and Manufacturing) and the ingredients business in South America.
Consumer and foodservice
– Oceania Represents the fast-moving consumer goods (FMCG) and foodservice businesses in New Zealand and Australia (including export to the Pacific Islands).
– Asia Represents FMCG and foodservice businesses in Asia (excluding Greater China), Africa and the Middle East.
– Greater China Represents FMCG and foodservice businesses in Greater China.
– Latin America Represents FMCG and foodservice businesses in South America and the Caribbean.
China Farms Represents farming operations in China.
1 Total Group revenue from the sale of goods is $20,438 million. The difference of $7 million relates to the normalisation of time value of options.
2 Of the $439 million normalisation adjustment, $405 million relates to impairment of equity accounted investees and $34 million relates to Fonterra’s equity accounted share of Beingmate’s losses.
3 The $196 million normalisation adjustment relates to operating expenses.
4 Of the $5 million normalisation adjustment, $7 million relates to revenue offset by $12 million of net foreign exchange losses.
5 Includes sales to other strategic platforms. Total column represents total external sales.
6 Capital expenditure comprises purchases of property (less specific disposals where there is an obligation to repurchase), plant and equipment and intangible assets, and net purchases of livestock.
7 Capital employed is calculated as the average for the period of: net assets excluding net-interest bearing debt, deferred tax balances and brands, goodwill and equity accounted investments.
The segment note for the year ended 31 July 2017 has been restated. $42 million of operating expenses and $4 million of other operating income has been reallocated from Unallocated Costs and Eliminations to the Consumer and Foodservice operating segments. The reallocation has been made to better reflect costs in the segment in which they are reported to the FMT, to aid comparability between years.
1 Total Group revenue from the sale of goods is $19,232 million. The difference of $18 million relates to the normalisation of time value of options.
2 The $42 million normalisation adjustment relates to other operating income.
3 Of the $76 million normalisation adjustment, $35 million relates to impairment of equity accounted investees and $41 million relates to Fonterra’s equity accounted share of Beingmate’s losses.
4 Of the $1 million normalisation adjustment, $18 million relates to revenue offset by $19 million of net foreign exchange losses.
5 Includes sales to other strategic platforms. Total column represents total external sales.
6 Capital expenditure comprises purchases of property, plant and equipment and intangible assets, and net purchases of livestock.
7 Capital employed is calculated as the average for the period of: net assets excluding net-interest bearing debt, deferred tax balances and brands, goodwill and equity accounted investments.
Notes to the Financial Statements CONTINUED
FOR THE YEAR ENDED 31 JULY 2018
For
per
sona
l use
onl
y
FONTERRA ANNUAL FINANCIAL RESULTS 2018 13
b) Geographical revenue
GROUP $ MILLION
CHINAREST
OF ASIA AUSTRALIANEW
ZEALANDUNITED STATES EUROPE
LATIN AMERICA
REST OF WORLD TOTAL
Geographical segment external revenue:
Year ended 31 July 2018 3,980 5,684 1,836 2,076 793 681 2,272 3,116 20,438
Year ended 31 July 2017 3,383 5,165 1,592 2,056 1,254 838 2,162 2,782 19,232
Revenue is allocated to geographical segments on the basis of the destination of the goods sold.
c) Non-current assets
GROUP $ MILLION
INGREDIENTS OCEANIA ASIAGREATER
CHINALATIN
AMERICATOTAL
GROUP
NEW ZEALAND
REST OF WORLD
NEW ZEALAND AUSTRALIA
Geographical segment non-current assets:
As at 31 July 2018 5,538 467 1,324 928 827 1,127 1,052 11,263
As at 31 July 2017 5,479 347 1,285 840 738 1,481 988 11,158
GROUP $ MILLION
AS AT 31 JULY 2018
AS AT 31 JULY 2017
Reconciliation of geographical segment’s non-current assets to total non-current assets:
Cost of goods sold is primarily made up of New Zealand sourced cost of milk.
New Zealand sourced cost of milk includes the cost of milk supplied by farmer shareholders, supplier premiums paid, and the cost of milk purchased from contract milk suppliers during the financial year.
New Zealand sourced cost of milk supplied by farmer shareholders comprises the volume of milk solids supplied at the Farmgate Milk Price as determined by the Board for the relevant season. In making that determination the Board takes into account the Farmgate Milk Price calculated in accordance with the Farmgate Milk Price Manual, which is independently audited. For the season ended 31 May 2018, the Fonterra Board determined a Farmgate Milk Price lower than that calculated in accordance with the Farmgate Milk Price Manual. The Fonterra Farmgate Milk Price Statement sets out information about the Farmgate Milk Price, and how it is calculated by Fonterra. It can be found in the ‘Investors/Farmgate Milk Prices’ section of the Fonterra website.
Other costs include those costs directly incurred to bring the inventory to its final point of sale location, costs directly related to the sale of the inventory, and costs of additional ancillary services invoiced to the customer.
Notes to the Financial Statements CONTINUED
FOR THE YEAR ENDED 31 JULY 2018
For
per
sona
l use
onl
y
FONTERRA ANNUAL FINANCIAL RESULTS 201814
2 COST OF GOODS SOLD CONTINUED
GROUP $ MILLION
31 JULY 2018 31 JULY 2017
Opening inventory 2,593 2,401
Cost of milk:
– New Zealand sourced 10,115 9,471
– Non-New Zealand sourced 1,245 932
Other costs 6,243 5,757
Closing inventory (2,917) (2,593)
Total cost of goods sold 17,279 15,968
3 EARNINGS PER SHARE
Basic earnings per share is calculated by dividing the profit or loss attributable to equity holders of the Co-operative by the weighted average number of Co-operative shares outstanding during the period.
Diluted earnings per share is determined by adjusting the profit or loss attributable to equity holders of the Co-operative and the weighted average number of Co-operative shares outstanding for the effects of all Co-operative shares with dilutive potential. There were no Co-operative shares with dilutive potential for either of the years presented.
GROUP
31 JULY 2018 31 JULY 2017
Basic and diluted earnings per share attributable to equity holders of the Co-operative ($) (0.14) 0.46
Earnings attributable to equity holders of the Co-operative ($ million) (221) 734
Weighted average number of shares (thousands of shares) 1,610,005 1,604,744
4 PROFIT BEFORE NET FINANCE COSTS AND TAX
GROUP $ MILLION
31 JULY 2018 31 JULY 2017
The following items have been included in profit before net finance costs and tax:
Auditors’ remuneration:
– Fees paid for the audit of the financial statements 6 6
– Fees paid for other services¹ 1 –
Operating lease expense 98 84
Research and development costs 95 81
Donations – 1
Research and development grants received from government (5) (4)
Total employee benefits expense 2,116 1,966
Contributions to defined contribution plans included in employee benefits expense 76 68
1 The Group uses the services of PricewaterhouseCoopers on assignments additional to their statutory audit duties where their expertise and experience with the Group are important and auditor independence is not impaired. Other services include other assurance and attestation services $0.1 million (31 July 2017: $0.2 million) and advisory services of $0.6 million (31 July 2017: nil) relating to Food Trust.
Notes to the Financial Statements CONTINUED
FOR THE YEAR ENDED 31 JULY 2018
For
per
sona
l use
onl
y
FONTERRA ANNUAL FINANCIAL RESULTS 2018 15
Administrative expensesAdministrative expenses include the following costs:
– Staff costs for those staff who are not involved in the manufacture, selling and marketing, or distribution of products.
– Information technology related costs, including licence fees and support costs.
– Travel and entertainment costs.
– Communication costs.
– Professional and administration costs, including insurance and banking costs.
The increase in administrative expenses relates largely to staff and information technology costs which have increased to better support the future development and growth of the Co-operative.
Other operating expensesOther operating expenses include all other expenses that do not directly relate to the following functional areas of the business; manufacturing, distribution, selling and marketing and administration. These include:
– Amortisation of software.
– Research and development costs investing in the future development of the Co-operative.
– Premises and property costs, including associated repairs and maintenance and disposal costs.
– Vehicle costs.
– Utility costs.
In addition to the above, other operating expense also include ‘mark to market’ movements on commodity trading derivatives (where these result in a loss in the period), and other non-recurring costs such as litigation costs.
DEBT AND EQUITY
This section outlines Fonterra’s capital structure and the related financing costs. It also provides details on how the funds that finance current and future activities are raised and on how the Group manages liquidity risk and interest rate risk.
This section includes the following Notes:
Note 5: Subscribed equity instruments
Note 6: Dividends paid
Note 7: Borrowings
Note 8: Net finance costs
5 SUBSCRIBED EQUITY INSTRUMENTS
Subscribed equity instruments comprise Co-operative shares and units in the Fonterra Shareholders’ Fund (the Fund). Incremental costs directly attributable to equity transactions are recognised as a deduction from subscribed equity.
Co-operative shares, including shares held within the GroupCo-operative shares may only be held by a shareholder supplying milk to the Company (farmer shareholder), by former farmer shareholders for up to three seasons after cessation of milk supply, or by Fonterra Farmer Custodian Limited (the Custodian). Voting rights in the Company are dependent on milk supply supported by Co-operative shares.¹
CO-OPERATIVE SHARES (THOUSANDS)
Balance at 1 August 2017 1,606,933
Shares issued under the dividend reinvestment plan² 4,990
Balance at 31 July 2018 1,611,923
Balance at 1 August 2016 1,602,703
Shares issued under the dividend reinvestment plan² 4,230
Balance at 31 July 2017 1,606,933
1 These rights are also attached to vouchers when backed by milk supply (subject to limits).
2 Total value of $29 million (31 July 2017: $25 million).
The rights attaching to Co-operative shares are set out in Fonterra’s Constitution, available in the ‘About Us/Our Governance’ section of Fonterra’s website.
Notes to the Financial Statements CONTINUED
FOR THE YEAR ENDED 31 JULY 2018
For
per
sona
l use
onl
y
FONTERRA ANNUAL FINANCIAL RESULTS 201816
5 SUBSCRIBED EQUITY INSTRUMENTS CONTINUED
Units in the Fonterra Shareholders’ Fund The Custodian holds legal title of Co-operative shares of which the Economic Rights have been sold to the Fund on trust for the benefit of the Fund. At 31 July 2018, 111,423,603 Co-operative shares (31 July 2017: 126,047,304) were legally owned by the Custodian, on trust for the benefit of the Fund.
UNITS (THOUSANDS)
Balance at 1 August 2017 126,047
Units issued 20,946
Units surrendered (35,569)
Balance at 31 July 2018 111,424
Balance at 1 August 2016 111,992
Units issued 29,933
Units surrendered (15,878)
Balance at 31 July 2017 126,047
The rights attaching to units are set out in the Fonterra Shareholders’ Fund 2018 Annual Report, available in the ‘Investors/Fonterra Shareholder’s Fund’ section of Fonterra’s website.
Capital management and structureThe Board’s objective is to maximise equity holder returns over time by maintaining an optimal capital structure. Trading Among Farmers (TAF) allows shares in Fonterra to be traded between shareholders, on the Fonterra Shareholders’ Market (a private market operated by NZX Limited). The Fund supports this by allowing investors, including farmers, to trade in units backed by Economic Rights in Fonterra. The Fund also allows farmer shareholders to acquire units and exchange them for shares in Fonterra, and to exchange shares for units and dispose of those units on the NZX or ASX.
The Group provides returns to farmer shareholders through a milk price, and to equity holders through dividends and changes in the Company’s share price.
The Fund is subject to the issue and redemption of units at the discretion of Fonterra and Fonterra’s farmer shareholders. Fonterra has an interest in ensuring the stability of the Fund and has established a Fund Size Risk Management Policy, which requires that the number of units on issue remain within specified limits and that within these limits, the number of units is managed appropriately. Fonterra may use a range of measures to ensure the Fund size remains within the specified limits, including introducing or cancelling a dividend reinvestment plan, operating a unit and/or share repurchase programme and issuing new shares.
6 DIVIDENDS PAID
All Co-operative shares, including those held by the Custodian on trust for the benefit of the Fund, are eligible to receive dividends if declared by the Board. Dividends paid to the Custodian are passed on to unit holders by the FSF Management Company Limited (the Manager).
Dividends are recognised as a liability in the Group’s financial statements in the period in which they are declared by the Board.
The Dividend Reinvestment Plan applied to all dividends in the table below.
$ MILLION
DIVIDENDS YEAR ENDED
31 JULY 2018YEAR ENDED
31 JULY 2017
2018 Interim dividend – 10 cents per share¹ 161 –
2017 Final dividend – 20 cents per share² 321 –
2017 Interim dividend – 20 cents per share³ – 321
2016 Final dividend – 10 cents per share⁴ – 160
1 Declared on 20 March 2018 and paid on 20 April 2018 to all Co-operative shares on issue at 6 April 2018.
2 Declared on 23 September 2017 and paid on 20 October 2017 to all Co-operative shares on issue at 9 October 2017.
3 Declared on 21 March 2017 and paid on 20 April 2017 to all Co-operative shares on issue at 5 April 2017.
4 Declared on 18 August 2016 and paid on 9 September 2016 to all Co-operative shares on issue at 1 September 2016.
Notes to the Financial Statements CONTINUED
FOR THE YEAR ENDED 31 JULY 2018
For
per
sona
l use
onl
y
FONTERRA ANNUAL FINANCIAL RESULTS 2018 17
7 BORROWINGS
The Group borrows in the form of bonds, bank facilities and other financial instruments. The interest expense incurred on Fonterra’s borrowings is shown in Note 8.
Borrowings are recognised initially at fair value, net of transaction costs incurred. Borrowings are subsequently measured at amortised cost using the effective interest method, with the hedged risks on certain debt instruments measured at fair value. Details of the Group’s hedge accounting policies are included in Note 17 Financial Risk Management.
Economic net interest-bearing debtEconomic net interest-bearing debt reflects the effect of debt hedging in place at balance date.
GROUP $ MILLION
AS AT 31 JULY 2018
AS AT 31 JULY 2017
Net interest-bearing debt position
Total borrowings 6,738 6,263
Cash and cash equivalents (446) (393)
Interest-bearing advances¹ (332) (435)
Bank overdraft 161 11
Net interest-bearing debt 6,121 5,446
Value of derivatives used to manage changes in hedged risks on debt instruments 78 155
Economic net interest-bearing debt 6,199 5,601
1 Includes Fonterra Co-operative Support Loan balance of $177 million (31 July 2017: $135 million) which are netted against amounts owing to suppliers.
Total borrowings in the table above are represented by:
Total borrowings3 6,263 4,334 (4,077) 270 (61) 9 6,738
GROUP $ MILLION
BALANCE AS AT 1 AUGUST 2016 PROCEEDS REPAYMENTS
FOREIGN EXCHANGE MOVEMENT
CHANGES IN FAIR VALUES OTHER
BALANCE AS AT 31 JULY 2017
Commercial paper 454 951 (1,249) – – 8 164
Bank loans 879 2,698 (2,713) (10) – – 854
Finance leases¹ 143 – (6) – – – 137
Capital notes² 35 – – – – – 35
NZX-listed bonds 499 – – – 1 – 500
Medium-term notes 4,342 525 – (138) (158) 2 4,573
Total borrowings3 6,352 4,174 (3,968) (148) (157) 10 6,263
1 Finance leases are secured over the related item of property, plant and equipment (Note 13).
2 Capital notes are unsecured subordinated borrowings.
3 All other borrowings are unsecured and unsubordinated.
Notes to the Financial Statements CONTINUED
FOR THE YEAR ENDED 31 JULY 2018
For
per
sona
l use
onl
y
FONTERRA ANNUAL FINANCIAL RESULTS 201818
7 BORROWINGS CONTINUED
GROUP $ MILLION
AS AT 31 JULY 2018
AS AT 31 JULY 2017
Included within the statement of financial position as follows:
Total current borrowings 831 1,112
Total non-current borrowings 5,907 5,151
Total borrowings 6,738 6,263
Leverage ratiosThe Board closely monitors the Group’s leverage ratios. The primary ratios monitored by the Board are:
– Debt payback. The debt payback ratios are adjusted for the impact of operating leases. They are calculated as 1. Funds from operations divided by economic net interest-bearing debt, and 2. Economic net interest-bearing debt divided by earnings before interest, tax, depreciation and amortisation (EBITDA).
– Gearing. The gearing ratio is calculated as economic net interest-bearing debt, divided by equity plus economic net interest-bearing debt. Equity is as presented in the statement of financial position, excluding hedge reserves. The gearing ratio as at 31 July 2018 was 48.4 per cent (31 July 2017: 44.3 per cent).
The Group is not subject to externally imposed capital requirements.
Finance leases included in total borrowings are represented by:
GROUP $ MILLION
AS AT 31 JULY 2018
AS AT 31 JULY 2017
Finance leases – minimum lease payments
Not later than one year 16 17
Later than one year and not later than five years 131 144
Later than five years 4 5
151 166
Future finance charges on finance leases (20) (29)
Present value of finance leases 131 137
The present value of finance leases is as follows:
Not later than one year 7 6
Later than one year and not later than five years 121 126
Later than five years 3 5
Total present value of finance leases 131 137
Liquidity riskLiquidity risk is the risk that the Group will not be able to meet its financial obligations as they fall due. The Group’s approach to managing liquidity risk is to ensure that it will always have sufficient funds to meet its liabilities when due, under both normal and stressed conditions, without incurring unacceptable losses or risking damage to the Group’s reputation.
The Group has a policy in place to ensure that it has sufficient cash or facilities on demand to meet expected operational expenses for a period of at least 80 days, including the servicing of financial obligations. This excludes the potential impact of extreme circumstances that cannot reasonably be predicted, such as natural disasters. In such situations back-up funding lines are maintained and as set out in the Company’s constitution, the Company can defer payments to farmer shareholders if necessary.
The Group manages its liquidity by retaining cash and marketable securities, the availability of funding from an adequate amount of committed credit facilities and the ability to close out market positions. Fonterra’s funding facilities are reviewed at least annually, which is one of the key financial risk management activities undertaken by the Group to ensure an appropriate maturity profile given the nature of the Group’s business. At balance date the Group had undrawn lines of credit totalling $3,732 million (31 July 2017: $3,811 million).
Liquidity and refinancing risks are also managed by ensuring that Fonterra can maintain access to funding markets throughout the world. To that end, Fonterra maintains debt issuance programmes in a number of key markets and manages relationships with international investors.
Notes to the Financial Statements CONTINUED
FOR THE YEAR ENDED 31 JULY 2018
For
per
sona
l use
onl
y
FONTERRA ANNUAL FINANCIAL RESULTS 2018 19
7 BORROWINGS CONTINUED
Exposure to liquidity riskThe following tables show the timing of the gross contractual cash flows of the Group’s financial instruments.
Total financial instruments (9,216) (10,840) (3,693) (400) (3,462) (3,285)
1 Maximum cash flows under guarantees provided by the Group.
Notes to the Financial Statements CONTINUED
FOR THE YEAR ENDED 31 JULY 2018
For
per
sona
l use
onl
y
FONTERRA ANNUAL FINANCIAL RESULTS 201820
8 NET FINANCE COSTS
Interest income and expense is recognised on an accrual basis in profit or loss, using the effective interest method.
Finance costs also include the changes in fair value relating to derivatives used to manage interest rate risk, and the associated changes in fair value of the borrowings designated in a hedge relationship attributable to the hedged risk. Details of the Group’s hedge accounting policies are included in Note 17 Financial Risk Management.
Fonterra Co-operative Support LoansFonterra Co-operative Support Loans are initially recorded at fair value. As the loans have interest rates that are below market rates, there is a difference between the cash advanced and the loans’ fair value. This difference is recorded within finance costs at the date Fonterra is contractually committed to advance the funds. Finance income is recognised using the notional interest rate implicit in the loans, over the periods until the loans are repaid.
GROUP $ MILLION
31 JULY 2018 31 JULY 2017
Finance income¹ 23 34
Total interest expense at amortised cost² (462) (427)
Changes in fair value relating to:
– Borrowings designated in a hedge relationship 61 157
– Derivatives designated in a hedge relationship (42) (123)
– Derivatives where hedge accounting has not been applied 4 4
Total interest income from fair value movements 23 38
Finance costs (439) (389)
Net finance costs (416) (355)
1 Finance income includes $9 million (31 July 2017: $24 million) relating to the Fonterra Co-operative Support Loans.
2 Includes interest expense of $23 million (31 July 2017: $22 million) relating to derivatives where hedge accounting has not been applied and cash flow hedge effectiveness reclassified to profit or loss.
Interest rate risk Details of how the Group manages interest rate risk is included in Note 17 Financial Risk Management.
WORKING CAPITAL
This section provides information about the primary elements of Fonterra’s working capital. Working capital represents the short-term operating assets and liabilities generated by Fonterra. Movements in these items have a direct impact on the net cash flows generated from operating activities.
This section includes the following Notes:
Note 9: Trade and other receivables
Note 10: Inventories
Note 11: Trade and other payables
Note 12: Owing to suppliers
9 TRADE AND OTHER RECEIVABLES
Revenue from sale of goods is recognised at the fair value of the consideration received or receivable, net of returns, discounts and allowances. Revenue is recognised when the amount can be reliably measured, significant risks and rewards of ownership of the inventory have passed to the buyer, recovery of the consideration is probable, the associated costs and possible return of goods can be estimated reliably, and there is no continuing management involvement with the goods.
Trade receivables are amounts due from customers for goods sold. Trade receivables are recognised initially at their fair value, which is represented by their face value, and subsequently measured at the amount expected to be collected.
Estimates are used in determining the level of receivables that may not be collected. A provision for impairment is established when there is evidence that the Group will not be able to collect all amounts due.
Notes to the Financial Statements CONTINUED
FOR THE YEAR ENDED 31 JULY 2018
For
per
sona
l use
onl
y
FONTERRA ANNUAL FINANCIAL RESULTS 2018 21
GROUP $ MILLION
AS AT 31 JULY 2018
AS AT 31 JULY 2017
Trade receivables 1,987 2,015
Less: provision for impairment of trade receivables (22) (23)
Trade receivables net of provision for impairment 1,965 1,992
Receivables from related parties¹ 52 32
Other receivables 216 162
Total receivables 2,233 2,186
Prepayments 122 117
Total trade and other receivables 2,355 2,303
1 There were no provisions for impairment of receivables from related parties.
Credit risk Details of how the Group manages credit risk is included in Note 17 Financial Risk Management.
The aging profile of the Group’s trade and other receivables (excluding prepayments) is as follows:
GROUP $ MILLION CURRENT
LESS THAN 1 MONTH PAST DUE
MORE THAN 1 MONTH BUT LESS THAN
3 MONTHS PAST DUE
MORE THAN 3 MONTHS
PAST DUE TOTAL
As at 31 July 2018 1,946 147 67 73 2,233
As at 31 July 2017 1,941 168 46 31 2,186
10 INVENTORIES
Inventories are stated at the lower of cost or net realisable value on a first-in-first-out basis.
In the case of manufactured inventories, cost includes all direct costs plus the portion of fixed and variable production overheads incurred in bringing inventories into their present location and condition.
Net realisable value is the estimated selling price, less the costs of completion and selling expenses.
GROUP $ MILLION
AS AT 31 JULY 2018
AS AT 31 JULY 2017
Raw materials 711 680
Finished goods 2,239 1,950
Impairment of finished goods (33) (37)
Total inventories 2,917 2,593
Notes to the Financial Statements CONTINUED
FOR THE YEAR ENDED 31 JULY 2018
For
per
sona
l use
onl
y
FONTERRA ANNUAL FINANCIAL RESULTS 201822
11 TRADE AND OTHER PAYABLES
Trade and other payables, excluding amounts owing to farmer shareholders and New Zealand contract milk suppliers, are recognised at the amount invoiced by the supplier. Due to their short-term nature, they are not discounted.
GROUP $ MILLION
AS AT 31 JULY 2018
AS AT 31 JULY 2017
Trade payables 1,677 1,683
Amounts due to related parties 32 21
Other payables 131 137
Total trade and other payables (excluding employee entitlements) 1,840 1,841
Employee entitlements 276 276
Total trade and other payables 2,116 2,117
12 OWING TO SUPPLIERS
Amounts owing to suppliers are amounts Fonterra owes to farmer shareholders and New Zealand contract milk suppliers for the collection of milk, which includes end of season adjustments, offset by amounts owing from farmer shareholders for goods and services provided to them by Fonterra.
These amounts are recognised at the amount due to the supplier for the milk provided. Due to their short-term nature, they are not discounted.
The Board uses its discretion in establishing the rate at which Fonterra will pay suppliers for the milk supplied over the season. This is referred to as the advance rate. The following table provides a breakdown of the advance payments made to suppliers:
GROUP
AS AT 31 JULY 2018
AS AT 31 JULY 2017
Owing to suppliers1 ($ million) 1,579 1,330
Farmgate Milk Price2 (per kgMS) $6.69 $6.12
Of this amount:
– Total advance payments made during the year $5.55 $5.21
– Total owing as at 31 July $1.14 $0.91
Amount advanced during the year as a percentage of the milk price for the season ended 31 May 83% 85%
1 This amount is after offsetting $177 million Fonterra Co-operative Support Loan repayments relating to the 2017/18 season (31 July 2017: $135 million).
2 Represents the average price for milk supplied on standard terms of supply. The Fonterra Farmgate Milk Price Statement sets out information about the Farmgate Milk Price as calculated in accordance with the Farmgate Milk Price Manual and the price for milk supplied on standard terms. It can be found in the ‘Investors/Farmgate Milk Prices’ section of the Fonterra website.
Notes to the Financial Statements CONTINUED
FOR THE YEAR ENDED 31 JULY 2018
For
per
sona
l use
onl
y
FONTERRA ANNUAL FINANCIAL RESULTS 2018 23
LONG-TERM ASSETS
This section provides information about the investments Fonterra has made in long-term assets to operate the business and generate returns to equity holders. These assets include physical assets such as land and buildings and livestock, and non-physical assets such as brands and goodwill. This section also explains the estimates and judgements applied in the measurement of these assets.
This section includes the following Notes:
Note 13: Property, plant and equipment
Note 14: Livestock
Note 15: Intangible assets
13 PROPERTY, PLANT AND EQUIPMENT
Items of property, plant and equipment are measured at cost less accumulated depreciation and impairment losses. Cost includes the purchase consideration and those costs directly attributable to bringing the asset to the location and condition necessary for its intended use. It also includes financing costs directly attributable to the acquisition, production or construction of the asset. Subsequent costs are capitalised only when it is probable that future economic benefits associated with the item will flow to the Group and the cost of the item can be measured reliably. The carrying amount of any replaced part is derecognised. All other repairs and maintenance costs are charged to the income statement during the financial period in which they are incurred.
The assets’ residual values and useful lives are reviewed and adjusted, where required, each financial year.
Gains and losses on disposals are determined by comparing the disposal proceeds with the carrying amount, and are recognised in the income statement.
DepreciationDepreciation is calculated on a straight line basis to allocate the cost of the asset, less any residual value, over its estimated useful life. The range of estimated useful lives for each class of property, plant and equipment is as follows:
– Land Indefinite
– Buildings and leasehold improvements 15–60 years
– Plant, vehicles and equipment 3–55 years
GROUP $ MILLION
LAND
BUILDINGS AND LEASEHOLD IMPROVEMENTS
PLANT, VEHICLES AND EQUIPMENT
CAPITAL WORK IN PROGRESS TOTAL
As at 31 July 2018
Cost 354 2,787 8,210 721 12,072
Accumulated depreciation and impairment – (1,042) (4,220) – (5,262)
Net book value at 31 July 2018 354 1,745 3,990 721 6,810
As at 31 July 2017
Cost 348 2,644 7,740 535 11,267
Accumulated depreciation and impairment – (953) (3,923) – (4,876)
Net book value at 31 July 2017 348 1,691 3,817 535 6,391
Notes to the Financial Statements CONTINUED
FOR THE YEAR ENDED 31 JULY 2018
For
per
sona
l use
onl
y
FONTERRA ANNUAL FINANCIAL RESULTS 201824
13 PROPERTY, PLANT AND EQUIPMENT CONTINUED
GROUP $ MILLION
LAND
BUILDINGS AND LEASEHOLD
IMPROVEMENTSPLANT, VEHICLES AND EQUIPMENT
CAPITAL WORK IN PROGRESS TOTAL
Net book valueAs at 1 August 2017 348 1,691 3,817 535 6,391Additions¹ – 5 20 756 781Transfer from capital work in progress 12 103 467 (582) –Hyperinflationary movements 8 15 6 7 36Depreciation charge – (93) (351) – (444)Impairment reversal – 4 1 – 5Disposals (14) (9) (9) – (32)Foreign currency translation – 29 39 5 73
As at 31 July 2018 354 1,745 3,990 721 6,810
Net book valueAs at 1 August 2016 339 1,596 3,519 718 6,172Additions¹ 3 13 53 685 754Transfer from capital work in progress 15 205 644 (864) –Hyperinflationary movements 2 4 2 2 10Depreciation charge – (92) (343) – (435)Impairment reversal – 2 – – 2Disposals (8) (9) (29) (2) (48)Foreign currency translation (3) (28) (29) (4) (64)
As at 31 July 2017 348 1,691 3,817 535 6,391
1 Additions include borrowing costs of $8 million (2017: $10 million) capitalised using a weighted average interest rate of 5.52 per cent (2017: 5.85 per cent).
Carrying value of China Farms assetsAs the China Farms operating segment is not achieving positive financial returns, management has performed an impairment test to support the $748 million carrying value of the net assets of China Farms. As at 31 July 2018 the net assets include property, plant and equipment of $480 million, livestock of $280 million and working capital balances.
The impairment test is performed using the same value in use methodology applied to goodwill and indefinite life brands (Note 15). The key assumptions used in the impairment test are the future milk price and the discount rate. The assumptions used in the impairment test are shown below.
– The future milk price of RMB4.0 per kg, which is higher than current market prices, is appropriate to use in the impairment test as it is reflective of long term milk price trends in China.
– The discount rate of 9.1 per cent (31 July 2017: 9.0 per cent) is specific to the underlying assets being tested.
– The future cash flows, based on the strategic business plan, are dependent on the farming operations continuing to achieve further production and cost efficiencies. The long-term growth rate applied to the future cash flows at year five of the forecast is 3.0 per cent (31 July 2017: 2.7 per cent).
Using these assumptions, the recoverable amount of the China Farms assets is equivalent to the carrying amount. Any adverse change in these assumptions would result in an impairment.
The following table shows the sensitivity of the recoverable amount assessment to changes in the key assumptions:
KEY ASSUMPTIONS SENSITIVITY
Future milk price An increase/(decrease) in the milk price of RMB 0.02 per kg would result in an increase/(decrease) in the recoverable amount of $23 million.
Discount rate An increase in the discount rate of 0.5 per cent would result in a decrease in the recoverable amount of $56 million. A decrease in the discount rate of 0.5 per cent would result in an increase in the recoverable amount of $66 million.
Leased assets
Leases of property, plant and equipment where the Group assumes substantially all the risks and rewards of ownership are classified as finance leases.
Assets under finance leases are recognised as property, plant and equipment in the statement of financial position. They are recognised initially at their fair value or, if lower, at the present value of the minimum lease payments. A corresponding liability is established and each lease payment allocated between the liability and interest expense using the effective interest method. The assets recognised are depreciated on the same basis as equivalent property, plant and equipment.
Leases that are not finance leases are classified as operating leases and the leased assets are not recognised on the Group’s statement of financial position. Operating lease payments are recognised as an expense on a straight line basis over the lease term.
Notes to the Financial Statements CONTINUED
FOR THE YEAR ENDED 31 JULY 2018
For
per
sona
l use
onl
y
FONTERRA ANNUAL FINANCIAL RESULTS 2018 25
13 PROPERTY, PLANT AND EQUIPMENT CONTINUED
The net book value of property, plant and equipment subject to finance leases is as follows:
GROUP $ MILLION
AS AT 31 JULY 2018
AS AT 31 JULY 2017
Land 5 5
Building and leasehold improvements 89 93
Plant and equipment 20 22
Net book value of property, plant and equipment subject to finance leases 114 120
14 LIVESTOCK
The Group’s livestock balance primarily comprises dairy cows.
Livestock is measured at fair value less costs to sell, with any resulting gain or loss recognised in the income statement. The Group’s dairy cow herd comprises both young and mature livestock.
Young livestock comprises dairy cows that are intended to be reared to maturity. These cows are held to produce milk or offspring, but have not yet produced their first calf and begun milk production. Costs incurred in rearing young livestock are capitalised to the statement of financial position. The fair value of young livestock is determined using a market approach, adjusted to reflect the age of the herd.
Mature livestock includes dairy cows that have produced their first calf and begun milk production. Costs incurred in relation to mature livestock are recognised in the income statement. The fair value of mature dairy cows is determined using a discounted cash flow methodology. The Group also holds immaterial quantities of other livestock.
The quantity of livestock owned by the Group is presented below:
HEADCOUNT
AS AT 31 JULY 2018
AS AT 31 JULY 2017
Young dairy cows 32,630 46,269
Mature dairy cows 34,561 39,280
Other livestock 3,054 3,664
Total livestock headcount 70,245 89,213
During the year the Group collected 312 million litres of milk (31 July 2017: 318 million litres) from its dairy cows.
The value of livestock at 31 July is as follows:
GROUP $ MILLION
AS AT 31 JULY 2018
AS AT 31 JULY 2017
Opening balance 319 342
Purchase of livestock – 7
Rearing costs of young livestock 45 82
Change in fair value – birth and growth – (5)
Change in fair value – price changes 6 10
Disposal of livestock (107) (98)
Effect of movements in exchange rates 25 (19)
Closing balance 288 319
Represented by:
Young dairy cows 134 160
Mature dairy cows 153 158
Other livestock 1 1
Total livestock at 31 July 288 319
Notes to the Financial Statements CONTINUED
FOR THE YEAR ENDED 31 JULY 2018
For
per
sona
l use
onl
y
FONTERRA ANNUAL FINANCIAL RESULTS 201826
14 LIVESTOCK CONTINUED
Valuation techniques and significant unobservable inputsThe following table shows the relationship between the significant unobservable inputs and fair value measurement for mature livestock:
TYPE VALUATION TECHNIQUESIGNIFICANT UNOBSERVABLE INPUTS RELATIONSHIP BETWEEN KEY UNOBSERVABLE INPUTS AND FAIR VALUE MEASUREMENT
Mature livestock Discounted cash flows Raw milk yield A 5 per cent increase/(decrease) in the raw milk yield would result in a $9 million (31 July 2017: $11 million) increase/(decrease) in fair value.
Milk price A 5 per cent increase/(decrease) in the selling price of milk would result in a $21 million (31 July 2017: $22 million) increase/(decrease) in fair value.
15 INTANGIBLE ASSETS
The significant intangible assets recognised by the Group are goodwill, brands and software assets.
GoodwillGoodwill represents the premium paid by the Group over the fair value of the Group’s share of the net identifiable assets of an acquired subsidiary at the date of acquisition. It is initially recognised at cost and is subsequently measured at cost less accumulated impairment losses.
Goodwill is not amortised it is tested for impairment annually, or more frequently if there is an indicator of impairment.
Brands and other identifiable intangible assetsBrands that are purchased by the Group are initially recognised at cost, or at their fair value if acquired as part of a business combination. They are subsequently measured at cost less amortisation, if they are finite life brands, and accumulated impairment losses.
Indefinite life brands are not amortised. They are tested for impairment annually, or more frequently if there is an indicator of impairment. A brand is determined to have an indefinite life where there is an intention to maintain and support the brand for an indefinite period.
Indefinite life brands that have been impaired are reviewed for possible reversal of impairment annually. A reversal of an impairment loss shall not exceed the carrying amount that would have been recognised had no impairment loss occurred in prior years.
Finite life brands are amortised on a straight line basis over the shorter of their contractual or useful economic life, being 25 years. They are tested for impairment when an indicator of impairment exists.
Software assetsSoftware assets, both purchased and internally developed, are capitalised provided there is an identifiable asset that will generate future economic benefits through cost savings or supporting revenue generation. Subsequent costs are capitalised if they extend the useful life or enhance the functionality of the asset.
Software assets amortised on a straight line basis over their estimated useful lives, being three to 14 years. They are tested for impairment when an indicator of impairment exists.
GROUP $ MILLION
GOODWILL BRANDS SOFTWARESOFTWARE
WIP OTHERTOTAL
INTANGIBLES
As at 31 July 2018
Cost 1,084 1,733 1,403 96 75 4,391
Accumulated amortisation and impairment (3) (95) (1,007) – (59) (1,164)
Net book value at 31 July 2018 1,081 1,638 396 96 16 3,227
As at 31 July 2017
Cost 1,076 1,690 1,223 134 73 4,196
Accumulated amortisation and impairment (3) (114) (910) – (54) (1,081)
Net book value at 31 July 2017 1,073 1,576 313 134 19 3,115
Notes to the Financial Statements CONTINUED
FOR THE YEAR ENDED 31 JULY 2018
For
per
sona
l use
onl
y
FONTERRA ANNUAL FINANCIAL RESULTS 2018 27
15 INTANGIBLE ASSETS CONTINUED
GROUP $ MILLION
GOODWILL BRANDS SOFTWARESOFTWARE
WIP OTHERTOTAL
INTANGIBLES
Net book value
As at 1 August 2017 1,073 1,576 313 134 19 3,115
Additions 1 2 7 130 3 143
Transfer from work in progress – – 167 (167) – –
Amortisation – (2) (92) – (1) (95)
Impairment loss – – – – (5) (5)
Impairment reversal – 22 – – – 22
Disposals – – (2) (1) – (3)
Foreign currency translation 7 40 3 – – 50
As at 31 July 2018 1,081 1,638 396 96 16 3,227
Net book value
As at 1 August 2016 1,079 1,622 354 67 20 3,142
Additions – – 6 107 – 113
Transfer from work in progress – – 40 (40) – –
Amortisation – (3) (87) – (1) (91)
Foreign currency translation (6) (43) – – – (49)
As at 31 July 2017 1,073 1,576 313 134 19 3,115
Amortisation is recognised in other operating expenses in the income statement.
Impairment reversal is recognised in other operating income in the income statement.
Impairment testing of goodwill and indefinite life brandsThe following table shows the allocation of goodwill and brands across the Group’s cash generating units (CGUs).
GROUP $ MILLION
AS AT 31 JULY 2018 AS AT 31 JULY 2017
CGU GOODWILL BRANDS1 TOTAL GOODWILL BRANDS¹ TOTAL
Ingredients CGUs 78 120 198 75 120 195
Consumer and Foodservice CGUs
– Australia 138 148 286 135 150 285
– New Zealand 611 393 1,004 611 391 1,002
– Asia 4 703 707 4 624 628
– Brazil² 132 246 378 143 266 409
– Chile 118 27 145 105 24 129
– Other CGUs – 1 1 – 1 1
Total 1,081 1,638 2,719 1,073 1,576 2,649
1 Of the total brands held, 98 per cent have indefinite useful lives (31 July 2017: 99 per cent).
2 This represents Fonterra’s 51 per cent share of goodwill, the remaining 49 per cent is recognised in non-controlling interests.
Impairment testing is performed annually at the same time each year. Where appropriate, based on the market dynamics and go-to-market strategies, impairment testing is performed at a CGU level for both goodwill and indefinite life brands attributed to the CGU.
In completing the impairment testing for CGUs and indefinite life brands, the recoverable amounts are determined on a value in use basis, using a discounted cash flow methodology. The cash flow forecasts are based on the Board approved three-year business plan which has been prepared taking into account past performance as well as forecast future performance supported by strategic initiatives. The long-term growth rate is based on the long-term inflation rate of the jurisdictions where the sales are generated. Other key assumptions are based on external data where possible.
Notes to the Financial Statements CONTINUED
FOR THE YEAR ENDED 31 JULY 2018
For
per
sona
l use
onl
y
FONTERRA ANNUAL FINANCIAL RESULTS 201828
15 INTANGIBLE ASSETS CONTINUED
Consumer and Foodservice New ZealandDuring the year, margin compression and operational challenges have negatively impacted the returns generated by the consumer and foodservice business in New Zealand. These challenges have impacted the forecast cash flows used to support the carrying value of the consumer and foodservice New Zealand CGU.
Fonterra has identified a number of strategic and operational initiatives that will, over time, refocus the business to generate margin growth and improve productivity. These initiatives are underway however their long-term nature means that not all the benefits are expected to be realised within the three-year business plan timeframe.
As a result, the business plan has been extended to a five-year forecast period. The cash flow forecast shows a higher rate of growth in years four and five compared to years one to three, as the benefits of the strategic and operational initiatives identified are achieved.
The margin growth and productivity improvements in years four and five are determined by assessing the expected financial impact of the initiatives identified based on past experience, the competitive landscape and market opportunities.
The key assumptions used in the impairment test and the sensitivity of the valuation to those assumptions is shown below. A change in any of the key assumptions by the amount shown in the table below would lead to elimination of the $94 million excess of recoverable amount over carrying amount.
KEY ASSUMPTIONS VALUE ATTRIBUTED SENSITIVITY
Revenue growth (5-year Culmulative Average Growth Rate (CAGR)) 4.3 per cent Decrease by 54 basis points
Productivity savings per year (5-year average) $8 million Decrease by $2 million per annum
Operating expense increase (5-year CAGR) 1.8 per cent Increase by 77 basis points
The long-term growth rate applied to the future cash flows at year five of the forecast is 2.4 per cent (31 July 2017: 2.1 per cent). The discount rate applied is 8.1 per cent (31 July 2017: 8.1 per cent).
Consumer and Foodservice BrazilThe goodwill balance attributable to the consumer and foodservice business in Brazil arose in the financial year ended 31 July 2015 when Fonterra acquired a controlling interest of DPA Brazil.
Since that time the economy in Brazil has been challenging. During the year, the economy has shown signs of a slow recovery from the economic downturn, however there has been further retraction in the chilled dairy category.
Notwithstanding the challenging economic environment, the cash flow forecast used to support the carrying value of the consumer and foodservice business in Brazil shows significant growth in each year of the three-year business plan. This growth is supported by the strategic business plan and associated initiatives. Due to the long-term nature of many of the initiatives and the timing of the expected economic recovery, the forecast period has been extended to five years.
A forecast growth rate that includes volume growth plus inflation has been applied to the forecast cash flows in years six to 10 of the impairment model. This growth is aligned to the timing of the expected economic recovery in Brazil.
The key assumptions used in the impairment test and the sensitivity of the valuation to those assumptions is shown below. A change in either of the key assumptions by the amount shown in the table below would lead to elimination of the $124 million excess of recoverable amount over carrying amount. The achievement of the net sales growth is dependent on the continued economic recovery in Brazil.
KEY ASSUMPTIONS VALUE ATTRIBUTED SENSITIVITY
Revenue growth (year 1 to year 3 CAGR) 9.6 per cent Decrease by 166 basis points
Productivity savings per year (year 1 to year 3 average) $10 million Decrease by $3 million per annum
The long-term growth rate applied to the future cash flows at year ten of the forecast is 4.5 per cent (31 July 2017: 4.5 per cent). The discount rate applied is 10.9 per cent (31 July 2017: 12.4 per cent).
Consumer and Foodservice AsiaFor brands held in the Consumer and Foodservice business in Asia the recoverable amount is in excess of the carrying amount and reasonably possible changes in assumptions would not result in erosion of the excess. The average long-term growth rate applied to the future cash flows is 2.9 per cent (31 July 2017: 3.1 per cent) and the average discount rate applied is 9.2 per cent (31 July 2017: 9.2 per cent).
Notes to the Financial Statements CONTINUED
FOR THE YEAR ENDED 31 JULY 2018
For
per
sona
l use
onl
y
FONTERRA ANNUAL FINANCIAL RESULTS 2018 29
INVESTMENTS
This section provides information about Fonterra’s interest in equity accounted investments.
This section includes the following Note:
Note 16: Equity accounted investments
16 EQUITY ACCOUNTED INVESTMENTS
Associates and joint venturesAssociates are those entities in which the Group has significant influence, but not control or joint control, over the financial and operating policies. Joint ventures are those arrangements in which the Group has contractually agreed to share control and where the Group has rights to the net assets rather than rights to the assets and obligations for the liabilities.
For joint ventures and associates the Group applies the equity method of accounting. Under the equity method, the Group recognises its initial investment at cost (including any goodwill identified on acquisition) and subsequently adjusts this for its share of the entities’ profits or losses. The Group’s share of profits and losses are recognised in the income statement and its share of movements in other comprehensive income is recognised in other comprehensive income. Dividends received from equity accounted investees reduce the carrying amount of the investment.
When the Group’s share of losses exceeds its interest in an equity accounted investee, the carrying amount of that interest is reduced to nil and no further losses are recognised except to the extent the Group has an obligation or has made payments on behalf of the investee.
The Group determines at each reporting date whether there is any objective evidence that its investments in equity accounted investees are impaired. If this is the case, the Group recognises any impairment in the income statement.
The Group’s significant equity accounted investments are listed below. The ownership interest in these entities is 51 per cent or less and the Group is not considered to exercise a controlling interest.
Equity accounted investees with different balance dates from that of the Group are due to legislative requirements in the country the entities are domiciled or are aligned with their other investors’ balance dates or to align with the milk season.
OWNERSHIP INTERESTS (%)
EQUITY ACCOUNTED INVESTEE NAMECOUNTRY OF INCORPORATION AND PRINCIPAL PLACE OF BUSINESS
AS AT 31 JULY 2018
AS AT 31 JULY 2017
DMV Fonterra Excipients GmbH & Co. KG Germany 50 50
Beingmate Baby & Child Food Co., Ltd China 18.8 18.8
Falcon Dairy Holdings Limited Hong Kong 51 51
All investees have balance dates of 31 December.
Carrying amountsThe Group holds investments in a number of joint ventures and associates. The aggregate amount of the Group’s share of these equity accounted investments is included in the table below:
GROUP $ MILLION
ASSOCIATES JOINT VENTURES TOTAL
AS AT 31 JULY 2018
AS AT 31 JULY 2017
AS AT 31 JULY 2018
AS AT 31 JULY 2017
AS AT 31 JULY 2018
AS AT 31 JULY 2017
Carrying amount of investment 241 617 374 270 615 887
Profit/(loss) from continuing operations (35) (42) 55 49 20 7
Other comprehensive income – – – – – –
Total comprehensive income (35) (42) 55 49 20 7
The Group has provided financial guarantees to certain equity accounted investees as set out in Note 20.
There are no contingent liabilities relating to the Group’s interests in joint ventures or equity accounted investees.
Notes to the Financial Statements CONTINUED
FOR THE YEAR ENDED 31 JULY 2018
For
per
sona
l use
onl
y
FONTERRA ANNUAL FINANCIAL RESULTS 201830
16 EQUITY ACCOUNTED INVESTMENTS CONTINUED
Beingmate Baby & Child Food Co., Ltd. (Beingmate)As part of Fonterra’s long-term investment in the China market Fonterra holds an 18.8 per cent shareholding in Beingmate. The investment is recognised in the Consumer and Foodservice Greater China operating segment. During the year Beingmate’s share price has traded significantly below the share price at the time Fonterra acquired its investment, and also below the base share price used in the valuation assessments at 31 July 2017 and 31 January 2018. As a result, the carrying value of the investment has been assessed for impairment at 31 July 2018. To assess the recoverable amount of the investment a fair value less costs to sell methodology has been applied.
The fair value of the investment has been determined using an estimate of what a market participant would pay for a similar long-term strategic equity stake in Beingmate under current market conditions. The key assumptions used in determining the fair value are the base share price and the net premium above the base share price (acquisition premium) that would be paid for a long-term strategic investment of a similar size. This valuation methodology requires judgement, and is Level 3 in the fair value hierarchy as it is not based on market observable inputs.
The assumptions underlying the calculation of the fair value of the 18.8 per cent strategic investment in Beingmate are:
AS AT
RMB PER SHARE31 JULY 2018
AUDITED 31 JANUARY 2018
UNAUDITED31 JULY 2017
AUDITED
Weighted average share price period30 trading days
up to 31 July 201815 trading days from
22 January 2018
30 trading days pre-trading halt date
up to 10 July 2017
Weighted average base price 4.91 5.36 13.66
Net premium (including costs to sell) 0.48 0.52 2.45
Implied value per share 5.39 5.88 16.11
Base share price assumptionFor the year ended 31 July 2018, to remove the impact of market volatility, a 30 trading-day period (20 June 2018 to 31 July 2018) was used to determine the base share price. The closing share price as at 31 July 2018 was RMB5.26 per share. The shares are traded on the Shenzhen stock exchange and accordingly the share price changes regularly, including during the period between balance date and the date these financial statements were authorised for issue. A change in the base share price to RMB4.50 per share would lead to elimination of the $18 million excess of recoverable amount over the carrying amount.
For the six months ended 31 January 2018, to remove the impact of market volatility, a 15 trading-day period immediately after the forecast earnings downgrade announced by Beingmate on the 21 January 2018 was used (22 January 2018 to 9 February 2018). It was appropriate to use information from immediately after the reporting date as the Beingmate share price continued to decline despite no new information being provided to the market. This was considered the most appropriate period as the market had fully reflected the earnings downgrade impact.
For the year ended 31 July 2017, Beingmate shares were on a trading halt from 12 July 2017 to 4 September 2017, therefore in the absence of an active market, the period immediately before the trading halt (26 May to 10 July 2017) was considered the most appropriate period to determine the base price given that during this period the shares traded at a relatively stable range.
Net premium assumptionThe acquisition premium reflects that a market participant would expect to pay a premium above the quoted share price to acquire a long-term strategic investment. The premium is determined by considering recent transaction data and the characteristics of the investment and is calculated relative to the base share price.
The amount attributed to the acquisition premium reflects that Beingmate is an established local participant in a growth market and has a number of brands registered under the new regulations effective 1 January 2018. The significant reduction in the acquisition premium from 31 July 2017 reflects the poor financial performance, reduction in market share, and the operational and governance challenges experienced by Beingmate during the year. As at 31 July 2018 the valuation assessment is not sensitive to a reasonable change in the acquisition premium.
Carrying value of the investmentThe carrying value of the investment in Beingmate has reduced from the prior year primarily due to an impairment loss recognised in the 31 January 2018 interim financial statements. As at 31 July 2018 the carrying value of the investment is supported by the fair value assessment therefore no further impairment has been recorded. A reconciliation of the carrying amount of the investment is shown below.
GROUP $ MILLION
AS AT
31 JULY 2018 AUDITED
31 JANUARY 2018 UNAUDITED
31 JULY 2017 AUDITED
Opening balance 617 617 740Share of losses (34) (28) (41)Impairment loss (405) (405) (35)Effect of movement in exchange rates 26 60 (47)
Closing balance 204 244 617
Notes to the Financial Statements CONTINUED
FOR THE YEAR ENDED 31 JULY 2018
For
per
sona
l use
onl
y
FONTERRA ANNUAL FINANCIAL RESULTS 2018 31
FINANCIAL RISK MANAGEMENT
This section outlines the key risk management activities undertaken to manage the Group’s exposure to financial risk.
This section includes the following Note:
Note 17: Financial Risk Management
17 FINANCIAL RISK MANAGEMENT
Financial risks faced by the GroupThe Group’s overall financial risk management programme focuses primarily on maintaining a prudent financial risk profile that provides flexibility to implement the Group’s strategies, while ensuring optimisation of the return on assets. Financial risk management is centralised, which supports compliance with the financial risk management policies and procedures set by the Board.
A summary of the financial risks that impact the Group, how these risks are managed, and other disclosures included in the financial risk management note is presented below.
FINANCIAL RISK/DISCLOSURE ITEM DESCRIPTION MANAGEMENT OF RISK
Market Risks
Foreign exchange risk (Section a)
Impact from changes in foreign exchange rates
Foreign currency transactionsFor foreign currency transactions the Group uses foreign currency forward contracts and foreign currency options to manage foreign exchange risk.
Foreign operationsFor investments in foreign operations the Group uses foreign currency denominated borrowings and foreign currency swaps to manage foreign exchange risk.
Foreign currency denominated borrowingsFor foreign currency denominated borrowings the Group uses cross-currency interest rate swaps to manage foreign exchange and interest rate risk combined.
Interest rate risk (Section b)
Impact from changes in interest rates The Group uses interest rate swaps to achieve a target ratio of fixed and floating rate exposure on its borrowings.
Commodity price risk (Section c)
Impact from changes in commodity prices The Group uses commodity derivatives to manage its exposure to commodity price risk. The Group also uses its product mix and sales contract terms to manage the impact of changes in dairy commodity prices on its earnings.
Sensitivity analysis of changes in market risks (Section d)
Sensitivity of the Group’s reported profit and equity to changes in market risks
Impact to reserves in equity (Section e)
Movements in the Group’s hedge reserves and foreign currency translation reserve
Other Risks
Credit risk (Section f)
Risk of loss to the Group due to customer or counterparty default
The Group sets minimum credit quality requirements, credit limits and uses other credit mitigation tools to manage its credit risk.
Liquidity risk (Note 7)
Risk that the Group will be unable to meet its financial obligations as they fall due
The Group actively manages its minimum on-hand cash facilities, access to committed funds and lines of credit and the maturity profile of its financial obligations.
Fair value measurement (Section g)
Assets and liabilities measured or disclosed at fair value
Offsetting of financial assets and liabilities (Section h)
Financial asset and financial liability balances that are offset in the balance sheet
Capital management and structure (Note 5)
The Group’s capital structure The Group actively manages its capital structure through leverage and coverage ratios. The Fonterra Shareholders’ Fund removes the redemption risk associated with Co-operative shares.
Notes to the Financial Statements CONTINUED
FOR THE YEAR ENDED 31 JULY 2018
For
per
sona
l use
onl
y
FONTERRA ANNUAL FINANCIAL RESULTS 201832
17 FINANCIAL RISK MANAGEMENT CONTINUED
Derivative financial instruments and hedge accounting
Derivatives are measured at fair value. Refer to Section 17g) Fair value measurement for details on how fair value is determined.
The resulting gain or loss on re-measurement is recognised in the income statement immediately, unless the derivative is designated into an effective hedge relationship as a hedging instrument, in which case the timing of recognition in the income statement depends on the nature of the designated hedge relationship.
The Group may designate derivatives as: – Fair value hedges (where the derivative is used to manage the variability in the fair value of recognised assets and liabilities);
– Cash flow hedges (where the derivative is used to manage the variability in cash flows relating to recognised liabilities or forecast transactions); or
– Net investment hedges (where borrowings or derivatives are used to manage the risk of fluctuation in the translated value of its foreign operations).
Hedge accounting is discontinued when the hedging instrument expires, is terminated, is exercised, or no longer qualifies for hedge accounting.
Fair value hedgesFor fair value hedges the following are recognised in the income statement:
– the change in fair value of the hedging instruments; and
– the change in the fair value of the underlying hedged item attributable to the hedged risk.
If the hedge no longer meets the criteria for hedge accounting, hedge accounting is discontinued. The fair value adjustment to the carrying amount of the hedged item upon discontinuance is amortised and recognised in the income statement over the remaining term of the original hedge.
Cash flow hedgesThe effective portion of changes in the fair value of the hedging instruments are recognised in other comprehensive income and accumulated in a separate reserve in equity. Subsequently the cumulative amount is transferred to the income statement when the underlying transactions are recognised in the income statement.
The ineffective portion of changes in the fair value of the hedging instruments are recognised immediately in the income statement.
If the hedge no longer meets the criteria for hedge accounting, hedge accounting is discontinued. The cumulative gain or loss previously recognised in other comprehensive income remains there until the forecast transaction occurs, or is immediately recognised in the income statement if the transaction is no longer expected to occur.
Net investment hedgesThe effective portion of changes in the fair value of the hedging instruments are recognised in other comprehensive income and transferred to ‘Net foreign exchange losses’ in the income statement when the foreign operation is disposed of or sold.
The ineffective portion of changes in the fair value of the hedging instruments are recognised immediately in ‘Net foreign exchange losses’ in the income statement.
Costs of hedgingThe change in fair value of a hedging instrument relating to the time-value of foreign currency options, and the foreign currency basis component of cross-currency interest rate swaps are recognised in other comprehensive income and accumulated in a separate reserve in equity. Subsequently, the cumulative amount is transferred to the income statement at the same time as the hedged item impacts the income statement.
a) Foreign exchange risk
Nature and exposure of foreign exchange risk
Net foreign exchange gains or lossesForeign currency transactions are translated using the exchange rate at the dates of transactions. Monetary assets and liabilities denominated in foreign currencies are translated using the exchange rate at balance date.
Any resulting foreign exchange gains and losses are recognised in the income statement, except when they relate to hedged items or hedging instruments designated in a cash flow hedge or net investment hedge relationship.
The Group is exposed to foreign exchange risk through transactions denominated in foreign currencies and the translation of foreign currency denominated balances. The amounts shown below represent the Group’s exposure to foreign currency before applying the risk management strategies:
– The Group’s foreign currency transactions are predominantly denominated in United States Dollars.
– The Group has net investments in foreign operations of $5,679 million (31 July 2017: $5,518 million). This amount is before considering borrowings held by the Group in the same currency as the investment.
– The Group has borrowings denominated in foreign currency of $4,682 million (31 July 2017: $4,672 million).
Notes to the Financial Statements CONTINUED
FOR THE YEAR ENDED 31 JULY 2018
For
per
sona
l use
onl
y
FONTERRA ANNUAL FINANCIAL RESULTS 2018 33
17 FINANCIAL RISK MANAGEMENT CONTINUED
How foreign exchange risk is managed
Forecast foreign currency transactionsThe Group enters into foreign currency forward contracts and foreign currency option contracts for the following items:
– forecast cash receipts from sales for a period of up to 18 months within limits approved by the Board; and
– up to 100 per cent of other forecast foreign currency transactions.
The Group applies cash flow hedge accounting where derivatives are used to manage foreign exchange risk on forecast foreign currency transactions. The amount and maturity of the derivative and the forecast transaction is aligned to ensure that the hedge relationship remains effective, with any undesignated costs of hedging accounted for separately.
The effect of the Group’s application of hedge accounting in managing foreign exchange risk related to forecast foreign currency transactions is presented in the table below.
2 Year-to-date amounts recognised during the year.
3 Nominal amount represents forecast foreign currency transactions in cash flow hedge relationships, translated into New Zealand Dollars using the exchange rate at balance date.
2 Year-to-date amounts recognised during the year.
3 Nominal amount represents forecast foreign currency transactions in cash flow hedge relationships, translated into New Zealand Dollars using the exchange rate at balance date.
4 Recognised in revenue.
Net investments in foreign operationsThe Group’s net investments are designated in hedge relationships to the extent of:
– borrowings denominated in the same foreign currency; and
– foreign currency swaps directly attributed to the net investment.
Hedge ineffectiveness arises if the carrying amount of the net investment falls below the amount of the designated hedging instruments.
Notes to the Financial Statements CONTINUED
FOR THE YEAR ENDED 31 JULY 2018
For
per
sona
l use
onl
y
FONTERRA ANNUAL FINANCIAL RESULTS 201834
17 FINANCIAL RISK MANAGEMENT CONTINUED
The effect of the Group’s hedge accounting policy in managing foreign exchange risk related to the Group’s net investments in foreign operations is presented in the table below:
GROUP $ MILLION
AS AT 31 JULY 2018 YEAR ENDED 31 JULY 2018
CARRYING AMOUNTNOMINAL AMOUNT HEDGE EFFECTIVENESS
HEDGED NET INVESTMENTS AND HEDGING INSTRUMENTS USED
AMOUNT OF NET INVESTMENT
HEDGED¹
FOREIGN CURRENCY
BORROWINGS
FOREIGN CURRENCY
SWAPS²
NET INVESTMENT GAIN/(LOSS) RECOGNISED IN OTHER
COMPREHENSIVE INCOME
BORROWING/SWAPS GAIN/(LOSS) RECOGNISED IN OTHER
COMPREHENSIVE INCOME
Net investment hedging
United States Dollar-denominated Maturity of borrowings: 22-35 months 136 (136) – (12) 12
Australian Dollar-denominated Maturity of borrowings: 35-112 months 521 (521) – (7) 7
Chinese Renminbi-denominated Maturity of borrowings: 18 months Maturity of swaps: 1-4 months 341 (247) (94) (24) 24
Hong Kong Dollar-denominated Maturity of borrowings: 10 months 36 (36) – – –
Total 1,076 (982) (94) (30) 30
1 The carrying amount of the net investment designated into a net investment hedge relationship.
2 The carrying amount of foreign currency swaps at balance date is $3 million, and is presented within derivative assets.
Borrowings denominated in foreign currencyThe Group’s policy is to maintain its net exposure to a foreign currency within predefined limits.
To the extent the Group has monetary assets in the same foreign currency as the borrowing, the Group has a reduced exposure to foreign exchange risk. The foreign currency gains and losses relating to these balances is off-set in net foreign exchange gains/(losses) in the income statement.
To manage the net exposure to foreign currency borrowings, the Group enters into cross currency interest rate swaps (CCIRS). CCIRS are used to manage the combined foreign exchange risk and interest rate risk as they swap fixed rate foreign currency borrowings and interest payments into equivalent New Zealand Dollar-denominated amounts of principal with floating interest rates.
Notes to the Financial Statements CONTINUED
FOR THE YEAR ENDED 31 JULY 2018
For
per
sona
l use
onl
y
FONTERRA ANNUAL FINANCIAL RESULTS 2018 35
17 FINANCIAL RISK MANAGEMENT CONTINUED
The Group applies hedge accounting to foreign currency denominated borrowings that are managed by CCIRS. The hedge relationship may be designated into separate cash flow hedges and fair value hedges to manage the different components of foreign currency and interest rate risk:
– fair value hedge relationship where CCIRS are used to manage the interest rate and foreign currency risk in relation to foreign currency denominated borrowings with fixed interest rates.
– cash flow hedge relationship where CCIRS are used to manage the variability in cash flows arising from interest rate movements on floating interest rate payments and foreign exchange movements on payments of principal and interest.
Hedge ineffectiveness arises predominantly from changes in counterparty credit risk and cross currency basis spreads.
The effect of the Group’s hedge accounting policies in managing both its foreign exchange risk and interest rate risk related to borrowings denominated in foreign currency is presented in the table below.
GROUP $ MILLION
AS AT 31 JULY 2018¹ YEAR ENDED 31 JULY 2018²
CARRYING AMOUNT
CHANGE IN VALUE USED
TO CALCULATE HEDGE
EFFECTIVENESS
HEDGE EFFECTIVENESS IN RESERVES
HEDGE EFFECTIVENESS
HEDGE INEFFECTIVENESS
HEDGING INSTRUMENTS USEDNOMINAL AMOUNT³
DERIVATIVE ASSETS
DERIVATIVE LIABILITIES
ACCUMULATED COST OF
HEDGINGCASH FLOW
HEDGE (OCI)
CASH FLOW HEDGE
RECLASSIFIED TO INCOME
STATEMENT4
FAIR VALUE HEDGE
(INCOME STATEMENT)
GAIN/(LOSS)4
RECOGNISED IN INCOME
STATEMENT GAIN/(LOSS)4
Cash flow hedging and fair value hedging
Cross-currency interest rate swaps
USD 893 105 (7) – 76 (4) 3 27 9
Maturity: 98-145 months Weighted average interest rate: floating Weighted average NZD:USD rate: 0.7841
GBP 623 64 (261) – (213) 20 – 27 (4)
Maturity: 65 months Weighted average interest rate: floating Weighted average NZD:GBP rate: 0.3610
EUR 386 25 – (7) 31 36 (38) 3 –
Maturity: 76 months Weighted average interest rate: floating Weighted average NZD:EUR rate: 0.6559
Fair value hedging 31 6 – – 6 NA NA 2 20
Maturity: 35 months Weighted average interest rate: floating Weighted average NZD:USD rate: 0.8160
Total 200 (268) (7) (100) 52 (35) 59 25
1 Life-to-date amounts as at balance date.
2 Year-to-date amounts recognised during the year.
3 Nominal amount is the face value, converted using the weighted average foreign exchange rate, of foreign denominated borrowings in hedge relationships. For those borrowings in fair value hedges, the carrying amount includes the life-to-date fair value hedge adjustment which increases borrowings by $18 million.
4 Recognised in net finance costs and net foreign exchange gains/(losses).
Notes to the Financial Statements CONTINUED
FOR THE YEAR ENDED 31 JULY 2018
For
per
sona
l use
onl
y
FONTERRA ANNUAL FINANCIAL RESULTS 201836
17 FINANCIAL RISK MANAGEMENT CONTINUED
GROUP $ MILLION
AS AT 31 JULY 2017¹ YEAR ENDED 31 JULY 2017²
CARRYING AMOUNT
CHANGE IN VALUE USED
TO CALCULATE HEDGE
EFFECTIVENESS
HEDGE EFFECTIVENESS IN RESERVES
HEDGE EFFECTIVENESS
HEDGE INEFFECTIVENESS
HEDGING INSTRUMENTS USEDNOMINAL AMOUNT³
DERIVATIVE ASSETS
DERIVATIVE LIABILITIES
ACCUMULATED COST OF
HEDGINGCASH FLOW
HEDGE (OCI)
CASH FLOW HEDGE
RECLASSIFIED TO INCOME STATEMENT4
FAIR VALUE HEDGE
(INCOME STATEMENT)
GAIN/(LOSS)4
RECOGNISED IN INCOME STATEMENT
GAIN/(LOSS)4
Cash flow hedging and fair value hedging
Cross-currency interest rate swaps
USD 893 83 (18) – 44 2 3 (87) 6
Maturity: 110-157 months Weighted average interest rate: floating Weighted average NZD:USD rate: 0.7841
GBP 623 79 (319) – (260) (19) 20 (27) (8)
Maturity: 77 months Weighted average interest rate: floating Weighted average NZD:GBP rate: 0.3610
EUR 386 – (16) (5) (8) 1 (11) (9) (3)
Maturity: 88 months Weighted average interest rate: floating Weighted average NZD:EUR rate: 0.6559
Fair value hedging 356 19 – – 19 NA NA (19) 6
Maturity: 10-47 months Weighted average interest rate: floating Weighted average NZD:USD rate: 0.7733
Total 181 (353) (5) (205) (16) 12 (142) 1
1 Life-to-date amounts as at balance date.
2 Year-to-date amounts recognised during the year.
3 Nominal amount is the face value, converted using the weighted average foreign exchange rate, of foreign denominated borrowings in hedge relationships. For those borrowings in fair value hedges, the carrying amount includes the life-to-date fair value hedge adjustment which increases borrowings by $82 million.
4 Recognised in net finance costs and net foreign exchange gains/(losses).
Notes to the Financial Statements CONTINUED
FOR THE YEAR ENDED 31 JULY 2018
For
per
sona
l use
onl
y
FONTERRA ANNUAL FINANCIAL RESULTS 2018 37
17 FINANCIAL RISK MANAGEMENT CONTINUED
Receivables and payables denominated in foreign currencyThe Group enters into foreign currency forward contracts and foreign currency option contracts for 100 per cent of the net foreign currency receivables and payables.
Derivatives used to hedge the changes in the value of foreign currency receivables and payables are not hedge accounted. Changes in the fair value of these derivatives provide an off-set to the change in the value of foreign currency receivables and payables recognised in the income statement. These are recognised within net foreign exchange gains and losses in the income statement.
Net foreign exchange gains and losses in the income statementThe table below provides a breakdown of the net foreign exchange gains and losses recognised in the income statement.
GROUP $ MILLION
31 JULY 2018 31 JULY 2017
Relationships where fair value hedge accounting has been applied
Net foreign exchange (losses)/gains attributable to:
– Foreign currency denominated payables and borrowings (302) 125
– Derivatives (135) 135
– Other net foreign exchange (losses)/gains (1) 1
Net foreign exchange (losses)/gains (12) 29
b) Interest rate risk
Nature and exposure of interest rate risk to the GroupThe Group is exposed to interest rate risk on its interest-bearing borrowings, included within economic net interest-bearing debt (refer Note 7).
Changes in market interest rates expose the Group to:
– changes in the fair value of borrowings subject to fixed interest rates (fair value risk); and
– changes in future interest payments on borrowings subject to floating interest rates (cash flow risk).
How the Group manages its exposure to interest rate risk The Group’s policy is to maintain a target ratio of fixed and floating interest rate exposure. To achieve this the Group considers its forecast debt over a specified time horizon and manages the interest rate exposure by:
– issuing fixed rate debt; and
– entering into interest rate swaps (IRS).
The Group applies hedge accounting to the borrowings and the associated IRS, for movements in benchmark market interest rates (i.e. excluding any margin component).
Hedge ineffectiveness arises in relation to IRS that have been designated to hedge relationships after their initial recognition. The ineffectiveness for these hedges will continue until maturity.
In specific situations, where changes in the fair value of fixed-to-floating IRS provide an off-set to the changes in the fair value of other associated floating-to-fixed IRS, hedge accounting is not applied. The changes in fair values of these IRS off-set each other and are recognised within net finance costs in the income statement.
Notes to the Financial Statements CONTINUED
FOR THE YEAR ENDED 31 JULY 2018
For
per
sona
l use
onl
y
FONTERRA ANNUAL FINANCIAL RESULTS 201838
17 FINANCIAL RISK MANAGEMENT CONTINUED
The effect of the Group’s hedge accounting policies in managing interest rate risk is presented in the table below.
GROUP $ MILLION
AS AT 31 JULY 2018¹ YEAR ENDED 31 JULY 2018²
CARRYING AMOUNT
CHANGE IN VALUE USED TO
CALCULATE HEDGE EFFECTIVENESS
HEDGE EFFECTIVENESS IN RESERVES
HEDGE EFFECTIVENESS
HEDGE INEFFECTIVENESS
HEDGING INSTRUMENTS USEDNOMINAL AMOUNT³
DERIVATIVE ASSETS
DERIVATIVE LIABILITIES
CASH FLOW HEDGE (OCI)
CASH FLOW HEDGE
RECLASSIFIED TO THE INCOME
STATEMENT4
FAIR VALUE HEDGE
(INCOME STATEMENT)
GAIN/(LOSS)4
RECOGNISED IN THE INCOME
STATEMENTGAIN/(LOSS)4
Cash flow hedging
Interest rate swaps
Maturity: 1-74 months Weighted average interest rate: 4.22% 3,491 – (173) 23 (32) – NA 17
Fair value hedging
Interest rate swaps on NZD borrowings
Maturity: 22-56 months Weighted average interest rate: floating 225 4 – (6) NA NA 3 –Interest rate swaps on AUD borrowings
Maturity: 95-112 months Weighted average interest rate: floating 521 – (15) (12) NA NA – –
Total 4 (188) 5 (32) – 3 17
GROUP $ MILLION
AS AT 31 JULY 2017¹ YEAR ENDED 31 JULY 2017²
CARRYING AMOUNT
CHANGE IN VALUE USED TO
CALCULATE HEDGE EFFECTIVENESS
HEDGE EFFECTIVENESS IN RESERVES
HEDGE EFFECTIVENESS
HEDGE INEFFECTIVENESS
HEDGING INSTRUMENTS USEDNOMINAL AMOUNT³
DERIVATIVE ASSETS
DERIVATIVE LIABILITIES
CASH FLOW HEDGE (OCI)
CASH FLOW HEDGE
RECLASSIFIED TO THE INCOME
STATEMENT4
FAIR VALUE HEDGE
(INCOME STATEMENT)
GAIN/(LOSS)4
RECOGNISED IN THE INCOME
STATEMENT GAIN/(LOSS)4
Cash flow hedging
Interest rate swaps
Maturity: 4-86 months Weighted average interest rate: 4.36% 3,935 1 (178) 38 1 41 NA 37
Fair value hedging
Interest rate swaps on NZD borrowings
Maturity: 3-68 months Weighted average interest rate: floating 575 4 – (9) NA NA (5) (4)Interest rate swaps on AUD borrowings
Maturity: 107 months Weighted average interest rate: floating 191 – (12) (12) NA NA (10) –
Total 5 (190) 17 1 41 (15) 33
1 Life-to-date amounts as at balance date.
2 Year-to-date amounts recognised during the year.
3 The nominal amount represents the principal amount of outstanding or forecast borrowings designated in hedge relationships. For those borrowings in fair value hedges, the carrying amount includes the life-to-date fair value hedge adjustment which reduces borrowings by $13 million (2017: $15 million).
4 Recognised in net finance costs.
Notes to the Financial Statements CONTINUED
FOR THE YEAR ENDED 31 JULY 2018
For
per
sona
l use
onl
y
FONTERRA ANNUAL FINANCIAL RESULTS 2018 39
17 FINANCIAL RISK MANAGEMENT CONTINUED
c) Commodity price risk
Nature and exposure of commodity price risk to the GroupThe Group is exposed to dairy commodity price risk through changes in selling prices and the cost of milk. In addition, the Group is a large purchaser of electricity, diesel and sugar and is exposed to changes in the cost of these commodities.
How the Group manages its exposure to commodity price risk
Dairy commodity price riskThe Group manages its exposure to dairy commodity price risk by:
– determining the most appropriate mix of products to manufacture based on the supply curve and global demand for dairy products;
– governing the length and terms of sales contracts so that sales revenue is reflective of current market prices and is, where possible, linked to GlobalDairyTrade (GDT) prices; and
– using dairy commodity derivative contracts to obtain an optimal price for future sales. The markets for dairy commodity derivatives are relatively limited, which reduces the ability to manage earnings volatility. As markets for these derivatives grow the use of dairy commodity derivatives to manage dairy commodity price risk may increase.
Other commodity price riskThe Group manages its exposure to other commodity price risk through the use of derivative contracts to hedge the cost of electricity, diesel and sugar.
Hedge accountingHedge accounting is not applied to commodity derivatives. Changes in the fair value of commodity derivative contracts are recognised within other operating income/(expenses) in the income statement.
d) Sensitivity analysis of changes in market risksThe table below presents the effect on profit for the year and equity at the reporting date if various market rates had been higher or lower with all other variables held constant.
The sensitivity thresholds used represent reasonably possible changes in market rates.
GROUP $ MILLION
31 JULY 2018 31 JULY 2017
EQUITY PROFIT EQUITY PROFIT
Foreign currency rates
10% strengthening of the NZD 140 (8) 138 4
10% weakening of the NZD (153) 2 (115) 8
Interest rates
100 basis point increase 64 5 68 5
100 basis point decrease (59) (18) (66) (21)
Dairy commodity prices
10% increase – 28 – 15
10% decrease – (28) – (15)
Interest rate cash flow sensitivity analysisA change in interest rates would also impact floating rate interest payments and receipts on the Group’s borrowings and derivatives held at balance date.
The impact of a change in interest rates on one year contracted cash flows is shown below:
GROUP $ MILLION
31 JULY 2018 31 JULY 2017
100 basis point increase in interest rates (6) (3)
100 basis point decrease in interest rates 6 3
Notes to the Financial Statements CONTINUED
FOR THE YEAR ENDED 31 JULY 2018
For
per
sona
l use
onl
y
FONTERRA ANNUAL FINANCIAL RESULTS 201840
17 FINANCIAL RISK MANAGEMENT CONTINUED
e) Impact to reserves in equityThe impact of the Group’s hedge accounting policies on the reserves in equity is presented in the tables below:
Hedge reserves
GROUP $ MILLION
AS AT 31 JULY 2018
AS AT 31 JULY 2017
Opening balance 192 64
Movements attributable to cash flow hedges
Change in value of effective derivative hedging instruments (603) 450
Reclassifications to the income statement:
– As hedged transactions occurred (4) (277)
Net change in the cost of hedging reserve (31) 6
Tax expense/(credit) 179 (51)
Total movement (459) 128
Closing balance¹ (267) 192
1 Included in the closing balance of the hedge reserves is $30 million (31 July 2017: $32 million) relating to hedge relationships for which hedge accounting is no longer applied.
Foreign currency translation reserve
GROUP $ MILLION
AS AT 31 JULY 2018
AS AT 31 JULY 2017
Opening balance (552) (428)
Movements attributable to net investments in foreign operations and net investment hedges
Net translation gain/(loss) on:
– Borrowings and derivative hedging instruments 17 30
– Net investments in foreign operations 164 (143)
Reclassifications to the income statement:
– Upon disposal of foreign operations 2 (2)
Tax expense/(credit) 5 (9)
Total movement 188 (124)
Closing balance² (364) (552)
2 Included in the closing balance of the foreign currency translation reserve is $35 million (31 July 2017: $35 million) relating to hedge relationships for which hedge accounting is no longer applied.
f) Credit risk
Nature and exposure of credit risk to the GroupCredit risk is the risk of loss to the Group due to customer or counterparty default on the Group’s receivable balances. The Group’s maximum exposure to credit risk is represented by the carrying amounts of cash and cash equivalents, trade and other receivables, derivative assets, and other investments and receivables.
The Group has no undue concentrations of credit risk.
How the Group manages its exposure to credit risk The Group’s policy is to actively manage its exposure to credit risk by:
– using financial counterparties that have a credit rating of at least ‘A-’ from Standard & Poor’s (or equivalent) for derivative contracts, cash and cash equivalents and other investment balances;
– using commodity counterparties that have a credit rating of at least ‘BBB-’ from Standard & Poor’s (or equivalent) for derivative contracts; and
– applying credit limits, and credit mitigation tools, such as letters of credit.
Trade and other receivable balances are included in Note 9 Trade and other receivables.
Notes to the Financial Statements CONTINUED
FOR THE YEAR ENDED 31 JULY 2018
For
per
sona
l use
onl
y
FONTERRA ANNUAL FINANCIAL RESULTS 2018 41
17 FINANCIAL RISK MANAGEMENT CONTINUED
g) Fair value measurement
Valuation techniques for determining fair valuesThe fair value is the price that would be received to sell an asset, or paid to transfer a liability, in an orderly transaction between market participants at the measurement date.
The fair values of financial assets and liabilities are calculated by reference to quoted market prices where that is possible. A market is regarded as active if quoted prices are readily and regularly available from an exchange, dealer, broker, industry group, pricing service or regulatory agency, and those prices represent actual and regularly occurring market transactions on an arm’s length basis.
If quoted market prices are not available, the methodology used to calculate the fair values of financial assets and liabilities is to identify the expected cash flows under the terms of each specific contract and then discount these values back to the present value. These models use as their basis independently sourced market data where it is available and rely as little as possible on entity-specific estimates.
The calculation of the fair value of financial instruments reflects the impact of credit risk where applicable.
Specific valuation techniques used to value financial instruments include:
– the fair value of foreign exchange contracts is determined using observable currency exchange rates, option volatilities and interest rate yield curves;
– the fair value of interest rate contracts is calculated as the present value of the estimated future cash flows based on observable interest rate yield curves;
– the fair value of commodity contracts that are not exchange traded is determined by calculating the present value of estimated future cash flows based on observable quoted prices for similar instruments; and
– the fair value on the hedged risks of borrowings and long-term advances that are not exchange traded is calculated as the present value of the estimated future cash flows based on observable interest rate yield curves.
Fair value hierarchyThe fair value hierarchy described below is used to provide an indication of the level of estimation or judgement required in determining fair value:
– Level 1: Quoted prices (unadjusted) in active markets for identical assets or liabilities.
– Level 2: Inputs other than quoted prices included within Level 1 that are observable for the asset or liability either directly (i.e. as prices) or indirectly (i.e. derived from prices).
– Level 3: Inputs for the assets or liabilities that are not based on observable market data (unobservable inputs).
The following table shows the fair value hierarchy for assets and liabilities measured at fair value on the statement of financial position:
GROUP $ MILLION
LEVEL 1 LEVEL 2 LEVEL 3
AS AT 31 JULY 2018
AS AT 31 JULY 2017
AS AT 31 JULY 2018
AS AT 31 JULY 2017
AS AT 31 JULY 2018
AS AT 31 JULY 2017
Derivative assets
– Commodity derivatives 15 30 3 1 – –
– Foreign exchange derivatives – – 45 595 – –
– Interest rate derivatives¹ – – 200 193 – –
Derivative liabilities
– Commodity derivatives (12) (7) (2) (2) – –
– Foreign exchange derivatives – – (308) (24) – –
– Interest rate derivatives¹ – – (454) (557) – –
Investments in shares 13 10 16 – 6 9
Livestock – – – – 288 319
Fair value 16 33 (500) 206 294 328
1 Includes cross-currency interest rate swaps.
Notes to the Financial Statements CONTINUED
FOR THE YEAR ENDED 31 JULY 2018
For
per
sona
l use
onl
y
FONTERRA ANNUAL FINANCIAL RESULTS 201842
17 FINANCIAL RISK MANAGEMENT CONTINUED
The following table shows the fair value hierarchy for each class of financial asset and liability where the carrying value in the statement of financial position differs from the fair value:
Financial assets and liabilities are offset and the net amount reported in the statement of financial position where there currently is a legally enforceable right to set off the recognised amounts and there is an intention to settle on a net basis or realise the asset and settle the liability simultaneously.
The Group enters into various master netting arrangements or similar agreements that do not meet the criteria for offsetting in the statement of financial position but still allow for the related amounts to be offset in certain circumstances. These principally relate to derivative transactions under ISDA (International Swap and Derivative Association) agreements where each party has the option to settle amounts on a net basis in the event of default of the other party.
The table below sets out the financial assets and financial liabilities subject to offsetting, enforceable master netting arrangements and other agreements.
GROUP $ MILLION
AMOUNTS OFFSET IN THE STATEMENT OF FINANCIAL POSITION
Derivative financial assets 963 (144) 819 (411) 408Trade and other receivables (excluding prepayments) 2,900 (714) 2,186 – 2,186
3,863 (858) 3,005 (411) 2,594
Derivative financial liabilities (734) 144 (590) 292 (298)Trade and other payables (excluding employee entitlements) (2,340) 499 (1,841) – (1,841)
Owing to suppliers (1,545) 215 (1,330) – (1,330)
Borrowings (6,263) – (6,263) 119 (6,144)
(10,882) 858 (10,024) 411 (9,613)
31 July 2017 (7,019) – (7,019) – (7,019)
Notes to the Financial Statements CONTINUED
FOR THE YEAR ENDED 31 JULY 2018
For
per
sona
l use
onl
y
FONTERRA ANNUAL FINANCIAL RESULTS 2018 43
OTHER
This section contains additional notes and disclosures that aid in understanding Fonterra’s position and performance but do not form part of the primary sections.
This section includes the following Notes:
Note 18: Taxation
Note 19: Contingent liabilities, provisions and commitments
Note 20: Related party transactions
Note 21: Subsidiaries
Note 22: Net tangible assets per security
18 TAXATION
Tax expense comprises current and deferred tax. Tax expense, including the tax consequences of distributions to farmer shareholders, is recognised in the income statement. The tax consequences of distributions to farmer shareholders are recognised in the year to which the distribution relates. Other than distributions to farmer shareholders, tax consequences of items recognised directly in equity are also recognised in equity.
Current tax is the expected tax payable or receivable on the taxable income or loss for the year, using tax rates enacted or substantively enacted at the balance date, and any adjustment to tax payable or receivable in respect of previous years.
Deferred tax arises due to certain temporary differences between the carrying amounts of assets and liabilities for financial reporting purposes and those for taxation purposes. Deferred tax is measured at the tax rate that is expected to apply to the temporary differences when they reverse, based on laws that have been enacted or substantively enacted by the balance date.
Deferred tax is not recognised on the following temporary differences:
– the initial recognition of goodwill;
– the initial recognition of assets and liabilities in a transaction that is not a business combination and that affects neither accounting nor taxable profit; and
– differences relating to investments in subsidiaries and equity accounted investees to the extent that the timing of the reversal is controlled by the Group and it is probable that they will not reverse in the foreseeable future.
Deferred tax assets are recognised to the extent it is probable that future taxable profits will be available against which the temporary differences can be utilised.
a) Taxation – income statement
The total taxation expense in the income statement is summarised as follows:
GROUP $ MILLION
31 JULY 2018 31 JULY 2017
Current tax expense 81 97
Prior period adjustments to current tax (5) (25)
Deferred tax movements:
– Origination and reversal of temporary differences (34) (52)
Tax expense 42 20
Notes to the Financial Statements CONTINUED
FOR THE YEAR ENDED 31 JULY 2018
For
per
sona
l use
onl
y
FONTERRA ANNUAL FINANCIAL RESULTS 201844
18 TAXATION CONTINUED
The taxation charge that would arise at the standard rate of corporation tax in New Zealand is reconciled to the tax expense as follows:
GROUP $ MILLION
31 JULY 2018 31 JULY 2017
(Loss)/profit before tax (154) 765
Prima facie tax expense at 28% (43) 214
Add/(deduct) tax effect of:
– Effect of tax rates in foreign jurisdictions (27) (33)
– Non-deductible expenses/additional assessable income 168 54
Tax expense before distributions and deferred tax 69 180
Effective tax rate before distributions and deferred tax1 NA 23.5%
Tax effect of distributions to farmer shareholders (27) (163)
Tax expense before deferred tax 42 17
Effective tax rate before deferred tax1 NA 2.2%
Add/(deduct) tax effect of:
– Origination and reversal of other temporary differences (2) 2
– Losses of overseas Group entities not recognised 2 1
Tax expense 42 20
Effective tax rate1 NA 2.6%
Imputation credits
Imputation credits available for use in subsequent reporting periods 20 20
Tax losses
Gross tax losses available for which no deferred tax asset has been recognised 54 52
1 The effective tax rate is the tax charge on the face of the income statement expressed as a percentage of the profit before tax. For the year ended 31 July 2018 the Group has recorded a net loss before tax, as a result the calculation of an effective tax rate is not applicable.
Notes to the Financial Statements CONTINUED
FOR THE YEAR ENDED 31 JULY 2018
For
per
sona
l use
onl
y
FONTERRA ANNUAL FINANCIAL RESULTS 2018 45
18 TAXATION CONTINUED
b) Taxation – statement of financial positionThe table below outlines the deferred tax assets and liabilities that are recognised in the statement of financial position, together with movements in the year:
GROUP $ MILLION
AS AT 31 JULY 2018
AS AT 31 JULY 2017
Deferred tax
Property, plant and equipment (37) (3)
Intangible assets (540) (519)
Derivative financial instruments 97 (84)
Employee entitlements 75 75
Inventories 30 31
Receivables, payables and provisions 56 58
New Zealand tax losses 554 486
Offshore tax losses 311 289
Other 32 21
Total deferred tax 578 354
Movements for the year
Opening balance 354 366
Recognised in the income statement 34 52
Recognised directly in other comprehensive income 181 (60)
Foreign currency translation 9 (4)
Closing balance 578 354
Included within the statement of financial position as follows:
Deferred tax assets 583 363
Deferred tax liabilities (5) (9)
Total deferred tax 578 354
New Zealand tax lossesIn prior years the New Zealand tax consolidated group generated taxable income and utilised tax losses, however a taxable loss is reported in the current year. The deferred tax asset relating to New Zealand tax losses of $554 million (31 July 2017: $486 million) has been recognised on the basis that taxable income will be generated in the future against which the tax loses can be utilised.
The key assumptions in the assessment of future taxable income are New Zealand earnings, and the tax-deductible dividend. The estimate of New Zealand earnings is based on past performance of the New Zealand tax consolidated group relative to the overall Group. This ratio has been applied to the profit before tax forecast in the Group’s three-year business plan. No earnings growth has been included in the assessment after the business plan period. The tax-deductible dividend assumption is based on the Group’s dividend policy.
Changes in the key assumptions used impact the expected time horizon for utilisation of the tax losses.
Offshore tax lossesDeferred tax assets relating to tax losses carried forward of $253 million (31 July 2017: $540 million) are recognised by offshore entities that reported a taxable loss in either the current or prior year.
Gross tax losses of $54 million (31 July 2017: $52 million) relating to offshore entities have not been recognised as they may not be utilised.
Deferred tax liabilitiesThe Group has not recognised deferred tax liabilities in respect of unremitted earnings that are considered indefinitely reinvested in foreign subsidiaries. As at 31 July 2018, these earnings amount to $1,089 million (31 July 2017: $893 million). These could be subject to withholding and other taxes on remittance.
Notes to the Financial Statements CONTINUED
FOR THE YEAR ENDED 31 JULY 2018
For
per
sona
l use
onl
y
FONTERRA ANNUAL FINANCIAL RESULTS 201846
19 CONTINGENT LIABILITIES, PROVISIONS AND COMMITMENTS
Contingent liabilities In the normal course of business, Fonterra, its subsidiaries and equity accounted investees, are exposed to claims and legal proceedings that may in some cases result in costs to the Group.
In early August 2013, Fonterra publicly announced a potential food safety issue with three batches of Whey Protein Concentrate (WPC80) produced at the Hautapu manufacturing site and initiated a precautionary product recall.
In late August 2013, the New Zealand Government confirmed that the Clostridium samples found in WPC80 were not Clostridium botulinum and were not toxigenic, meaning the consumers of products containing the relevant batches of WPC80 were never in danger from Clostridium botulinum.
In January 2014, Danone formally initiated legal proceedings against Fonterra in the High Court of New Zealand and separate Singapore arbitration proceedings against Fonterra in relation to the WPC80 precautionary recall. The New Zealand High Court proceedings have been stayed pending completion of the Singapore arbitration.
On 1 December 2017, the Singapore arbitration panel issued its award (judgement), finding in favour of Danone and ordered Fonterra to pay €105 million ($183 million) in recall costs to Danone.
In addition to the recall costs, Fonterra was also required to pay Danone €29 million ($49 million) representing interest on the award amount and Danone’s costs in connection with the arbitration proceedings. Fonterra paid the award amount in December 2017 and the interest and costs in March 2018.
It is unclear whether Danone will continue to pursue the New Zealand High Court proceedings that were stayed pending the decision in the Singapore arbitration. Due to the uncertainty regarding whether Danone will seek to re-initiate these proceedings, and the nature and scope of these potential proceedings in light of the arbitration findings and award, no amount has been recognised in relation to these proceedings.
There are no additional claims or legal proceedings in respect of this matter that require provision or disclosure in these financial statements.
The Group has no other contingent liabilities as at 31 July 2018 (31 July 2017: nil).
Provisions
Provisions are recognised in the statement of financial position only where the Group has a present legal or constructive obligation as a result of a past event, when it is probable, being more likely than not, that an outflow of resources will be required to settle the obligation, and a reliable estimate of the amount can be made.
GROUP $ MILLION
EMPLOYEE RELATED PROVISIONS
LEGAL CLAIMS PROVISIONS
OTHER PROVISIONS
TOTAL PROVISIONS
As at 1 August 2017 84 72 32 188
Additional provisions 16 231 13 260
Unused amounts reversed (9) (16) (12) (37)
Charged to income statement 7 215 1 223
Charged to equity (2) – – (2)
Utilised during the year (14) (242) (7) (263)
Transfer to other class of provision 1 11 (12) –
Foreign currency translation 1 (3) – (2)
As at 31 July 2018 77 53 14 144
Included within the statement of financial position as follows:
Current liabilities 14
Non-current liabilities 130
Total provisions 144
Notes to the Financial Statements CONTINUED
FOR THE YEAR ENDED 31 JULY 2018
For
per
sona
l use
onl
y
FONTERRA ANNUAL FINANCIAL RESULTS 2018 47
19 CONTINGENT LIABILITIES, PROVISIONS AND COMMITMENTS CONTINUED
GROUP $ MILLION
EMPLOYEE RELATED PROVISIONS
LEGAL CLAIMS PROVISIONS
OTHER PROVISIONS
TOTAL PROVISIONS
As at 1 August 2016 79 80 40 199
Additional provisions 12 – 11 23
Unused amounts reversed (2) (7) (4) (13)
Charged to income statement 10 (7) 7 10
Utilised during the year (5) (1) (15) (21)
As at 31 July 2017 84 72 32 188
Included within the statement of financial position as follows:
Current liabilities 40
Non-current liabilities 148
Total provisions 188
The nature of the provisions are:
– Employee related provisions include defined benefit scheme obligations, other obligations that fall due on termination of employment, and long term employee benefits. The timing and amount of settlement is uncertain as it primarily depends on decisions relating to the employment of relevant employees;
– Legal claims provisions include obligations relating to tax, customs and duties and legal matters arising in the normal course of business. The timing and amount of settlement is uncertain as it depends on the outcome of a number of judicial proceedings; and
– Other provisions relate to product quality claims and other claims arising in the normal course of business. The timing and amount of settlement is uncertain as it depends on the outcome of the commercial negotiations relating to each individual claim.
Commitments
a) Capital commitmentsCapital expenditure contracted for at balance date but not recognised in the financial statements are as follows:
GROUP $ MILLION
AS AT 31 JULY 2018
AS AT 31 JULY 2017
Buildings 17 63
Plant, vehicles and equipment 132 172
Software 6 20
Total commitments 155 255
b) Operating lease commitmentsThe Group leases premises, plant and equipment. The future aggregate minimum lease payments under non-cancellable operating leases are as follows:
GROUP $ MILLION
AS AT 31 JULY 2018
AS AT 31 JULY 2017
Less than one year 116 116
One to five years 237 224
Greater than five years 140 170
Total operating lease commitments 493 510
Notes to the Financial Statements CONTINUED
FOR THE YEAR ENDED 31 JULY 2018
For
per
sona
l use
onl
y
FONTERRA ANNUAL FINANCIAL RESULTS 201848
20 RELATED PARTY TRANSACTIONS
Equity accounted investees and key management personnel are related parties of the Group. Key management personnel comprises the Board and the Fonterra Management Team.
The transactions with related parties that were entered into during the year, and the year end balances that arose from those transactions are shown below:
Key management personnel remuneration
GROUP $ MILLION
31 JULY 2018 31 JULY 2017
Short-term employee benefits 12 11
Long-term employee benefits 7 10
Directors’ remuneration 3 3
Total key management personnel remuneration 22 24
Transactions with related parties during the yearTransactions with related parties are under normal trade terms.
GROUP $ MILLION
31 JULY 2018 31 JULY 2017
Equity accounted investees
Revenue from the sale of goods¹ 116 90
Sale of services² 7 7
Royalty and other income 10 2
Dividends received 56 22
Interest income from financing arrangements 2 –
Purchases of goods³ (37) (5)
Purchases of services⁴ (143) (158)
Key management personnel
Purchases of goods⁵ (119) (121)
Co-operative support loans 4 –
Dividends paid (6) (6)
1 Goods sold are primarily commodity products.
2 Services provided include management fees.
3 Goods purchased are primarily commodity products.
4 Services provided are primarily freight services.
5 Purchases from key management personnel primarily relate to milk supplied by farmer shareholder Directors.
Notes to the Financial Statements CONTINUED
FOR THE YEAR ENDED 31 JULY 2018
For
per
sona
l use
onl
y
FONTERRA ANNUAL FINANCIAL RESULTS 2018 49
20 RELATED PARTY TRANSACTIONS CONTINUED
Outstanding balances with related parties
GROUP $ MILLION
AS AT 31 JULY 2018
AS AT 31 JULY 2017
Equity accounted investees
Total receivables arising from the sale or purchase of goods or services¹ 52 22
Total receivables arising from financing arrangements² 86 61
Total payables arising from the sale or purchase of goods or services (32) (21)
Total payables arising from financing arrangements (1) (2)
Key management personnel
Total payables arising from the sale or purchase of goods or services³ (21) (17)
Total receivables arising from Co-operative support loans 2 5
1 There were no material provisions for impairment on the receivables from related parties.
2 Loans to related parties other than equity accounted investees are unsecured and repayable in cash on demand. Loans to equity accounted investees are unsecured and repayable over varying terms of between three years and nine years.
3 Payables to key management personnel relate to amounts owing for milk supplied by farmer shareholder Directors.
Financial guaranteesThe Group has provided financial guarantees for several equity accounted investees. The aggregate drawn down amount of equity accounted investees’ liabilities for which the Group is jointly and severally liable is nil (31 July 2017: nil).
Transactions with related entitiesAs part of the administration of Trading Among Farmers, Fonterra entered into an Authorised Fund Contract to provide administrative services in relation to the Fund and meet the operating expenses of the Fund. In addition, Fonterra has agreed to provide corporate facilities, support functions and other services at no cost to the Fund.
CommitmentsIn addition to the transactions disclosed above, the Group has prospective commitments with related parties including contracts with equity accounted investees for the supply of dairy products and energy, and the provision of various management services.
21 SUBSIDIARIES
Subsidiaries are entities controlled by the Group. Subsidiaries are consolidated from the date the Group gains control until the date on which control ceases.
Non-controlling interests are allocated their share of profit after tax in the income statement and are presented within equity in the statement of financial position separately from equity attributable to equity holders. The effect of all transactions with non-controlling interests that change the Group’s ownership interest but do not result in a change in control are recorded in equity. Where control is lost, the remaining interest in the investment is remeasured to fair value and any surplus or deficit arising from that remeasurement is recognised in the income statement.
The Group’s subsidiaries are involved in the marketing, distribution, processing, technology or financing of dairy products. All Group subsidiaries have a balance date of 31 July unless otherwise indicated. Subsidiaries with different balance dates from that of the Group are due to legislative requirements in the country the entities are domiciled.
The Group holds investments in certain countries that have some limited restrictions on the repatriation of funds back to New Zealand. This does not result in any significant restriction on the flow of funds for the Group.
Notes to the Financial Statements CONTINUED
FOR THE YEAR ENDED 31 JULY 2018
For
per
sona
l use
onl
y
FONTERRA ANNUAL FINANCIAL RESULTS 201850
21 SUBSIDIARIES CONTINUED
The significant subsidiaries of the Group are listed below:
OWNERSHIP INTERESTS (%)
SUBSIDIARY NAMECOUNTRY OF INCORPORATION
AND PRINCIPAL PLACE OF BUSINESSAS AT
31 JULY 2018AS AT
31 JULY 2017
Fonterra Australia Pty Limited Australia 100 100
Fonterra Brands (Australia) Pty Limited Australia 100 100
Dairy Partners Americas Brasil Limitada¹ Brazil 51 51
Comercial Santa Elena S.A.¹ Chile 99.9 99.9
Soprole S.A.¹ Chile 99.9 99.9
Prolesur S.A.¹ Chile 86.26 86.18
Fonterra Commercial Trading (Shanghai) Company Limited¹ China 100 100
Fonterra (Yutian) Dairy Farm Co. Limited¹ China 100 100
Fonterra (Ying) Dairy Company Limited¹ China 100 100
Fonterra Brands (Hong Kong) Limited Hong Kong 100 100
Fonterra Brands Indonesia, PT Indonesia 100 100
Fonterra Brands (Malaysia) Sdn Bhd Malaysia 100 100
Fonterra Brands Lanka (Private) Limited Sri Lanka 100 100
Fonterra Middle East FZE UAE 100 100
Fonterra (USA) Inc. United States 100 100
Corporación Inlaca CA Venezuela 60 60
1 Balance date 31 December.
The Group’s ownership interest of the following entities is 50 per cent or less. However, they have been consolidated on the basis that the Group controls them through its exposure or rights to variable returns and the power to affect those returns.
OWNERSHIP INTERESTS (%)
OVERSEAS SUBSIDIARIES 50% OR LESS OWNERSHIPCOUNTRY OF INCORPORATION
AND PRINCIPAL PLACE OF BUSINESSAS AT
31 JULY 2018AS AT
31 JULY 2017
Fonterra (Japan) Limited Japan 50 50
Fonterra Brands (Middle East) L.L.C. UAE 49 49
In addition to the entities above, Fonterra controls the Fonterra Shareholders’ Fund and Fonterra Farmer Custodian Limited and consolidates these two entities. The trustees of the Fonterra Farmer Custodian Trust own the legal title to all of the shares of the Custodian. The Fund is a managed investment scheme with an independent trustee. In concluding that the Group controls the Fund and the Custodian, the Directors took into consideration that they form an integral part of the structure and operation of Trading Among Farmers.
Notes to the Financial Statements CONTINUED
FOR THE YEAR ENDED 31 JULY 2018
For
per
sona
l use
onl
y
FONTERRA ANNUAL FINANCIAL RESULTS 2018 51
22 NET TANGIBLE ASSETS PER SECURITY
GROUP
AS AT 31 JULY 2018
AS AT 31 JULY 2017
Net tangible assets per security¹
$ per listed debt security on issue 5.18 6.86
$ per equity instrument on issue 1.94 2.57
Listed debt securities on issue (million) 603 603
Equity instruments on issue (million) 1,612 1,607
1 Net tangible assets represents total assets less total liabilities less intangible assets.
Notes to the Financial Statements CONTINUED
FOR THE YEAR ENDED 31 JULY 2018
For
per
sona
l use
onl
y
FONTERRA ANNUAL FINANCIAL RESULTS 201852
Independent Auditor’s Report
TO THE SHAREHOLDERS OF FONTERRA CO-OPERATIVE GROUP LIMITED
The financial statements comprise: – the statement of financial position as at 31 July 2018;
– the income statement for the year then ended;
– the statement of comprehensive income for the year then ended;
– the statement of changes in equity for the year then ended;
– the cash flow statement for the year then ended; and
– the notes to the financial statements, which include significant accounting policies.
OUR OPINION
In our opinion, the financial statements of Fonterra Co-operative Group Limited (the Company), including its controlled entities (the Group), present fairly, in all material respects, the financial position of the Group as at 31 July 2018, its financial performance and its cash flows for the year then ended in accordance with New Zealand Equivalents to International Financial Reporting Standards (NZ IFRS) and International Financial Reporting Standards (IFRS).
BASIS FOR OPINION
We conducted our audit in accordance with International Standards on Auditing (New Zealand) (ISAs NZ) and International Standards on Auditing (ISAs). Our responsibilities under those standards are further described in the Auditor’s responsibilities for the audit of the financial statements section of our report.
We believe that the audit evidence we have obtained is sufficient and appropriate to provide a basis for our opinion.
AUDITOR INDEPENDENCE
We are independent of the Group in accordance with Professional and Ethical Standard 1 (Revised) Code of Ethics for Assurance Practitioners (PES 1) issued by the New Zealand Auditing and Assurance Standards Board and the International Ethics Standards Board for Accountants’ Code of Ethics for Professional Accountants (IESBA Code), and we have fulfilled our other ethical responsibilities in accordance with these requirements.
Bruce Hassall was appointed an Independent Director and Chair of the Audit and Finance Committee (AFC) of the Company on 2 November 2017. Bruce Hassall was Chief Executive Officer of PricewaterhouseCoopers to 30 September 2016 when he retired from the firm. At the time of his appointment, the Board of the Company (the Board) made the decision that Bruce Hassall would not be involved in the appointment of the Group’s auditor or the setting of audit fees for three years from the date of his appointment. Scott St John, Independent Director and member of the AFC, would act as Chair of the AFC for these matters and the Chair of the Board will join the AFC for deliberation. In addition, the engagement partner on the audit has direct access to the Chair of the Board to address any actual or perceived auditor independence threats.
Brent Goldsack was appointed a Director of the Company on 2 November 2017. Brent Goldsack retired as a partner of PricewaterhouseCoopers on 22 September 2017. Brent Goldsack was not involved in the provision of any audit services to the Group during his time as a partner of PricewaterhouseCoopers.
Bruce Hassall and Brent Goldsack had no financial relationship with PricewaterhouseCoopers upon their appointment as Directors of the Company.
Our firm carries out assurance services for the Group to assess risks and controls in relation to the Group’s food supply chain as well as other assurance and attestation services. Partners and employees of our firm may deal with the Group on normal terms within the ordinary course of trading activities of the Group.
These matters have not impaired our independence as auditor of the Group.
OUR AUDIT APPROACH
OverviewAn audit is designed to obtain reasonable assurance whether the financial statements are free from material misstatement.
Overall Group materiality: $35 million, which represents approximately 5% of the three-year average net profit before tax.
The Group's net profit before tax is subject to volatility due to fluctuations in the Farmgate Milk Price, commodity prices and foreign exchange rates. Using a three-year average net profit before tax provides a more stable basis for establishing our materiality. We used this benchmark because, in our view, it is the benchmark against which the performance of the Group is measured by users.
We have determined that there are three key audit matters:
– Recoverability of the carrying value of goodwill and indefinite life brands for the Consumer and Foodservice businesses in Brazil and New Zealand;
– Investment in Beingmate Baby & Child Food Co., Ltd. (Beingmate); and
– Carrying value of China Farms assets.
For
per
sona
l use
onl
y
FONTERRA ANNUAL FINANCIAL RESULTS 2018 53
Independent Auditor’s Report CONTINUED
MATERIALITY
The scope of our audit was influenced by our application of materiality.
Based on our professional judgement, we determined certain quantitative thresholds for materiality, including the overall Group materiality for the financial statements as a whole as set out above. These, together with qualitative considerations, helped us to determine the scope of our audit, the nature, timing and extent of our audit procedures and to evaluate the effect of misstatements, both individually and in aggregate on the financial statements as a whole.
AUDIT SCOPE
We designed our audit by assessing the risks of material misstatement in the financial statements and our application of materiality. In particular, we focused on areas where significant judgements, estimates and assumptions have been made by the Directors surrounding future events which are inherently uncertain. As in all of our audits, we also addressed the risk of management override of internal controls including among other matters, consideration of whether there was evidence of bias that represented a risk of material misstatement due to fraud.
We tailored the scope of our audit in order to perform sufficient work to enable us to provide an opinion on the financial statements as a whole, taking into account the structure of the Group, the accounting processes and controls, and the industry and strategic markets in which the Group operates. The Group has six reportable segments that reflect the Group’s management and reporting structure as viewed by the Company’s Management Team. The financial statements are a consolidation of 150 subsidiaries and 16 equity accounted investees, comprising the Group’s collection, processing and distribution of New Zealand milk, global sales and marketing of New Zealand and non-New Zealand ingredients products, Fonterra Farm Source stores, Quick Service Restaurant businesses, Global Brands and Nutrition, Co-operative Affairs, Group Services, fast-moving consumer goods, ingredients, foodservice, and farming businesses.
Of the Group’s 150 subsidiaries and 16 equity accounted investees we identified 9 subsidiaries that, due to their financially significant contribution as well as strategic importance to the Group’s overall results, required a full-scope audit. In addition, we also performed specific audit procedures on certain balances and transactions of other subsidiaries. Audits of each subsidiary are performed at a materiality level calculated with reference to a proportion of Group materiality relative to the financial scale of the business concerned.
In establishing the overall approach to the Group audit, we determined the type of work to be performed at the subsidiaries by us, as the Group engagement team, or by component auditors from other PwC network firms operating under our instruction. Where the work was performed by component auditors, we determined the level of involvement we needed to have in the audit work at those subsidiaries to be able to conclude whether sufficient appropriate audit evidence had been obtained to provide a basis for our opinion on the financial statements as a whole. This, together with additional procedures performed at the Group level, provided us with the audit evidence we needed for our opinion on the financial statements as a whole.
New Zealand sourced cost of milk supplied by farmer shareholders comprises the volume of milk solids supplied at the Farmgate Milk Price as determined by the Board of Directors for the relevant season. In making that determination the Board takes into account the Farmgate Milk Price calculated in accordance with the Farmgate Milk Price Manual, which is independently audited. The Fonterra Farmgate Milk Price Statement sets out information about the Farmgate Milk Price, and how it is calculated by Fonterra. It can be found in the ‘Investors/Farmgate Milk Prices’ section of the Company’s website.
For
per
sona
l use
onl
y
FONTERRA ANNUAL FINANCIAL RESULTS 201854
Independent Auditor’s Report CONTINUED
KEY AUDIT MATTERS
Key audit matters are those matters that, in our professional judgement, were of most significance in our audit of the financial statements of the current year. These matters were addressed in the context of our audit of the financial statements as a whole, and in forming our opinion thereon, and we do not provide a separate opinion on these matters.
Key audit matter How our audit addressed the key audit matter
1. Recoverability of the carrying value of goodwill and indefinite life brands for the Consumer and Foodservice businesses in Brazil and New Zealand
Indefinite life intangible assets (goodwill and brands) are disclosed within note 15 (pages 26 to 28) of the financial statements.
Management tests for impairment of these assets on an annual basis by performing a value in use assessment using a discounted cash flow model based on forecast future performance. The recoverability of these assets are therefore dependent on achieving sufficient future cash flows.
Forecast cash flows are judgemental and influenced by factors such as regulatory and economic environments. As these assets are spread across a broad range of economic markets, there are a number of different factors and judgements that can influence the impairment assessment.
The preparation of forecast cash flows also requires the application of significant judgement over key assumptions such as revenue growth, productivity savings, other costs impacting earnings, discount rates, and long-term growth rates.
Consumer and Foodservice Brazil:The economy and the Consumer and Foodservice business in Brazil are slowly recovering from an economic downturn. Our audit focused on the Consumer and Foodservice Brazil cash generating unit (CGU) impairment assessment.
The carrying value of the indefinite lived intangible assets held in the Brazil CGU amounts to $378 million, which represents approximately 14% of the Group’s indefinite life intangible assets.
Consumer and Foodservice New Zealand:Due to significant operational challenges during the past two financial years impacting the current performance and potential future cash flows of this business, our audit focused on the Consumer and Foodservice New Zealand CGU impairment assessment.
The carrying value of the indefinite lived intangible assets held in the New Zealand CGU amounts to $1,004 million, which represents approximately 37% of the Group’s indefinite life intangible assets.
We performed the following audit procedures in relation to the Brazil and New Zealand CGU impairment assessments:
– held discussions with management and understood the processes undertaken and basis for determining key assumptions in preparing the forecast cash flows;
– evaluated the assumptions and methodologies used; and
– challenged management on key assumptions, including earnings growth, discount rates and long-term growth rates.
In relation to forecast cash flows for those CGUs we performed the following procedures:
– compared these cash flows to the three year Fonterra Board approved business plan and understood the processes undertaken by the Directors to approve the plan;
– understood and assessed growth rates applied to the forecast cash flows beyond the business plan which has a combination of continued growth from strategic initiatives and industry forecasts;
– understood the differences between historical and budgeted performance to assess the accuracy of the budgeting process in previous years and considered the impact on forecast earnings; and
– understood and assessed the commercial prospects of achieving key strategic and operational initiatives and future plans in the Brazil and New Zealand CGUs given that impairment assessments are most sensitive to cash flows from these initiatives, by agreeing these to detailed supporting analyses prepared by management.
In relation to discount rates and long-term growth rates, we assessed the economic and industry forecasts in those markets, and cost of capital and other inputs to comparable organisations globally.
We have developed independent point estimates and derived a range of acceptable outcomes by considering the level of estimation uncertainty inherent in the Brazilian and New Zealand markets respectively to evaluate management’s value in use assessment.
We also considered the appropriateness of disclosures in relation to intangible assets.
For
per
sona
l use
onl
y
FONTERRA ANNUAL FINANCIAL RESULTS 2018 55
Independent Auditor’s Report CONTINUED
KEY AUDIT MATTERS CONTINUED
Key audit matter How our audit addressed the key audit matter
As disclosed in the basis of preparation (page 7) and within note 16 (pages 29 to 30) of the financial statements, the Group holds an 18.8% share in Beingmate, an entity listed on the Shenzhen Stock Exchange. The entity is an equity accounted investee.
Beingmate’s share price has continued to trade below both the share price at the time the Group acquired its investment and the base share price used in the impairment assessment at 31 July 2017. As a result an impairment loss of $405 million was recognised in the period (after share of losses of $34 million and foreign currency translation movements of $26 million).
A fair value less cost to sell methodology was used to determine the recoverable amount of the investment and the associated impairment loss which was recognised at 31 January 2018.
The carrying value of the investment in Beingmate at year end is supported by an impairment assessment performed as at 31 July 2018.
Our audit procedures in relation to the Group’s investment in Beingmate considered the carrying value of the investment at 31 July 2018, in particular, the determination of the base share price and the determination of the premium above the base share price which a market participant might pay to acquire a long-term strategic investment of a similar size to Beingmate (the net premium).
In relation to the net premium, we performed the following audit procedures:
– understood considerations and assumptions applied in deriving the net premium, including benefits from the long-term strategic investment;
– considered the impact of Beingmate’s reported losses for the financial year ended 31 December 2017, and the results for the half year ended 30 June 2018 on the net premium; and
– compared the net premium against comparable market acquisition premia where strategic market penetration and synergies were evidenced.
In respect of the base share price, we assessed the appropriateness and sensitivity of using a 30 day volume weighted average share price (VWAP).
We independently developed a range of acceptable outcomes by incorporating estimation uncertainty appropriate for the market. Based on our work, the valuation of Beingmate fell within the range of reasonable outcomes we considered.
We also considered the appropriateness of disclosures in relation to the Group’s investment in Beingmate.
Key audit matter How our audit addressed the key audit matter
3. Carrying value of China Farms assets
As disclosed within note 13 (page 24) of the financial statements, an impairment assessment was performed on the China Farms assets to support its carrying value.
Management determined the recoverable amount of the China Farms assets by estimating its value in use.
Our audit focused on this area as there is limited headroom and a number of judgements are made in forecasting China milk prices and determining an appropriate discount rate to be applied.
We performed the following audit procedures in relation to the China Farms assets impairment assessment:
– held discussions with management and understood the processes undertaken and basis for determining key assumptions in preparing the forecast cash flows; and
– challenged management on key assumptions, including forecast China milk prices and discount rates.
The forecast cash flows are highly sensitive to forecast China milk prices. A marginal decline in forecast China milk prices will result in an impairment. In relation to the forecast cash flows we have:
– compared forecast cash flows to the three year Fonterra Board approved business plan and understood the processes undertaken by the Directors to approve the plan;
– understood the difference between historical and budgeted performance to assess the accuracy of the budgeting process in previous years and considered the impact on forecast earnings; and
– compared management’s assumption of forecast China milk prices against the average selling price achieved during the year, as well as to forecast China milk price assumptions observable from other market participants.
We evaluated the discount rate with the assistance of our auditor’s valuation expert and compared the inputs to comparable organisations globally.
We developed an independent point estimate and derived a range of acceptable outcomes by considering the level of estimation uncertainty inherent in the Chinese market, with the assistance of our auditor’s valuation experts, to evaluate management’s value in use assessment.
We also considered the appropriateness of disclosures in relation to the impairment assessment of the China Farms assets.
For
per
sona
l use
onl
y
FONTERRA ANNUAL FINANCIAL RESULTS 201856
Independent Auditor’s Report CONTINUED
INFORMATION OTHER THAN THE FINANCIAL STATEMENTS AND AUDITOR’S REPORT
The Directors are responsible for the Annual Report. Our opinion on the financial statements does not cover the other information included in the Annual Report and we do not, and will not, express any form of assurance conclusion on the other information.
In connection with our audit of the financial statements, our responsibility is to read the other information in the Annual Report and, in doing so, consider whether the other information is materially inconsistent with the financial statements or our knowledge obtained in the audit, or otherwise appears to be materially misstated. If, based on the work we have performed on the other information that we obtained prior to the date of this auditor’s report, we conclude that there is a material misstatement of this other information, we are required to report that fact. We have nothing to report in this regard.
RESPONSIBILITIES OF THE DIRECTORS FOR THE FINANCIAL STATEMENTS
The Directors are responsible, on behalf of the Company, for the preparation and fair presentation of the financial statements in accordance with NZ IFRS and IFRS, and for such internal control as the Directors determine is necessary to enable the preparation of financial statements that are free from material misstatement, whether due to fraud or error.
In preparing the financial statements, the Directors are responsible for assessing the Group’s ability to continue as a going concern, disclosing, as applicable, matters related to going concern and using the going concern basis of accounting unless the Directors either intend to liquidate the Group or to cease operations, or have no realistic alternative but to do so.
AUDITOR’S RESPONSIBILITIES FOR THE AUDIT OF THE FINANCIAL STATEMENTS
Our objectives are to obtain reasonable assurance about whether the financial statements, as a whole, are free from material misstatement, whether due to fraud or error, and to issue an auditor’s report that includes our opinion. Reasonable assurance is a high level of assurance, but is not a guarantee that an audit conducted in accordance with ISAs NZ and ISAs will always detect a material misstatement when it exists. Misstatements can arise from fraud or error and are considered material if, individually or in the aggregate, they could reasonably be expected to influence the economic decisions of users taken on the basis of these financial statements.
A further description of our responsibilities for the audit of the financial statements is located at the External Reporting Board’s website at: https://www.xrb.govt.nz/standards-for-assurance-practitioners/auditors-responsibilities/audit-report-1/
This description forms part of our auditor’s report.
WHO WE REPORT TO
This report is made solely to the Company’s shareholders, as a body. Our audit work has been undertaken so that we might state those matters which we are required to state to them in an auditor’s report and for no other purpose. To the fullest extent permitted by law, we do not accept or assume responsibility to anyone other than the Company and the Company’s shareholders, as a body, for our audit work, for this report or for the opinions we have formed.
The engagement partner on the audit resulting in this independent auditor’s report is Jonathan Skilton.
For and on behalf of:
Chartered AccountantsAuckland 12 September 2018
For
per
sona
l use
onl
y
FONTERRA ANNUAL FINANCIAL RESULTS 2018 57
Statutory InformationFOR THE YEAR ENDED 31 JULY 2018
EQUITY SECURITIES HELD AT BALANCE DATE
In accordance with Rules of the Fonterra Shareholders’ Market (FSM) Rule 9.4.4(c), the following table identifies the Equity Securities in which each Director has a Relevant Interest as at 31 July 2018.
UNITS ISSUED BY THE FONTERRA SHAREHOLDERS’ FUND¹ CO-OPERATIVE SHARES
Brent Goldsack – 280,029
Andrew Macfarlane 122,150 813,301
John Monaghan – 140,179
Nicola Shadbolt 11,000 375,705
Donna Smit 11,819 1,187,862
Ashley Waugh – 115,812
John Wilson – 4,577,543
1 Units issued by the Fonterra Shareholders’ Fund may be converted to Co-operative shares.
A ‘Relevant Interest’ in Fonterra securities which is required to be disclosed is explicitly defined in the Financial Markets Conduct Act 2013.
To qualify as a Farmer Elected Director under the Fonterra Constitution a person must be a shareholder, a shareholder of a company that is a shareholder, a member of a partnership that is a shareholder, or have a legal or beneficial interest in, or a right or entitlement to participate directly in the distributions of, a body corporate that is a shareholder of Fonterra.
Given the variety of ways that farmer shareholders can organise their interests, it is possible for Fonterra Elected Directors to have an interest in Fonterra shares without this being a ‘Relevant Interest’ as defined in the Financial Markets Conduct Act 2013.
All current Elected Directors have relevant interests in Fonterra shares, some also have interests in Fonterra shares which are not within the definition of ‘Relevant Interest’ in the Financial Markets Conduct Act 2013 and those interests are not disclosed above.
CO-OPERATIVE STATUS
In accordance with section 10 of the Co-operative Companies Act 1996, the Directors of Fonterra unanimously resolved on 22 August 2018 that the Company was, for the year ended 31 July 2018 a co-operative company. The opinion was based upon the fact that:
• Throughout that period the principal activities of the Company have been the activities stated in clause 1.3 of the Company’s constitution:
– the manufacture and sale of butter, cheese, dried milk, casein, or any other product derived from milk or milk solids supplied to the Company by its shareholders;
– the sale to any person of milk or milk solids supplied to the Company by its shareholders;
– the collection, treatment, and distribution for human consumption of milk or cream supplied to the Company by its shareholders.
• Each of the Company’s principal activities are co-operative activities (as defined in section 3 of the Co-operative Companies Act 1996).
• Throughout that period not less than 60 per cent of the voting rights attaching to shares in the Company have been held by transacting shareholders (as defined in section 4 of the Co-operative Companies Act 1996).
For
per
sona
l use
onl
y
FONTERRA ANNUAL FINANCIAL RESULTS 201858
REMUNERATION OF DIRECTORS
The total remuneration and value of other benefits received by each Director in the 12-month period from 1 August 2017 to 31 July 2018 are scheduled below:
BOARD FEES
COMMITTEE CHAIR FEES
TRAVEL ALLOWANCE
TOTAL REMUNERATION ($)
Clinton Dines 172,474 172,474
Ian Farrelly 42,519 42,519
Brent Goldsack 130,994 130,994
Leonie Guiney 42,519 42,519
Bruce Hassall (Chair of the Audit and Finance Committee, part year) 130,994 25,742 156,736
Simon Israel 172,474 110,000 282,474
David Jackson (Chair of the Audit and Finance Committee, part year) 42,519 7,750 50,269
Andrew Macfarlane 130,994 130,994
David MacLeod 42,519 42,519
John Monaghan (Chair of the Co-operative Relations Committee) 172,474 33,989 206,463
Nicola Shadbolt (Chair of the Risk Committee, part year) 172,474 25,239 197,713
Donna Smit 172,474 172,474
Scott St John (Chair of the Milk Price Panel) 172,474 33,989 206,463
Ashley Waugh (Chair of the Risk Committee, part year) 172,474 8,750 181,224
John Wilson (Chairman of the Board of Directors) 423,685 423,685
1 The Board has approved the payment to Mr Israel of a travel allowance of $10,000 per meeting to travel to and from New Zealand to attend Board meetings.
SUBSIDIARY COMPANY DIRECTORS
The following companies were subsidiaries of Fonterra as at 31 July 2018. Directors as at that date are listed; those who resigned during the year are denoted with an R. Alternate Directors are denoted with an A.
Canpac International Limited: G A Duncan, M R Spiers (R), P D Wynen
Dairy Industry Superannuation Scheme Trustee Limited: M A Apiata-Wade, B J Kerr, T P McGuinness, D W C Scott, A K Williams, P D Wynen, A J Lawton
Fonterra (Delegated Compliance Trading Services) Limited: G A Duncan, S D T Till
Fonterra (International) Limited: G A Duncan, C E Rowe
Fonterra (Kotahi) Limited: M E Leslie (R), R J Spurway, R G Carlyle
Fonterra (Middle East) Limited: G A Duncan, P D Washer
Fonterra (New Zealand) Limited: G A Duncan, C E Rowe
Fonterra (North Asia) Limited: G A Duncan, S D T Till
Fonterra Brands (New Zealand) Limited: M R Cronin, L M Clement (R), J C M Fair
Fonterra Brands (Tip Top Investments) Limited: G A Duncan, K M Turner
Fonterra Brands (Tip Top) Limited: M R Cronin, L M Clement (R), J C M Fair
Fonterra Commodities Limited: G A Duncan, B M Turner
Fonterra Dairy Solutions Limited: G A Duncan, R McNickle
Fonterra Equities Limited: G A Duncan, S D T Till
Fonterra Farming Ventures Limited: G A Duncan, J P Minkhorst (R), M W Hurrell
Fonterra Finance Corporation Limited: G A Duncan, S D T Till
Fonterra Holdings (Americas) Limited: G A Duncan, R M Kennerley (R), B Mealings
Fonterra Holdings (Brazil) Limited: G A Duncan, R M Kennerley (R), B Mealings
Fonterra Holdings (Venezuela) Limited: G A Duncan, R M Kennerley (R), B Mealings
Fonterra Ingredients Limited: G A Duncan, L J Paravicini
Fonterra Limited: K A Wickham, R J Spurway
Fonterra PGGRC Limited: G A Duncan, J P Minkhorst (R), M Piper
Fonterra TM Limited: G A Duncan, S D T Till
Glencoal Energy Limited: G A Duncan, M R Spiers (R), P D Wynen
GlobalDairyTrade Holdings Limited: G A Duncan, L J Paravicini
Kotahi GP Limited: M E Leslie (R), R J Spurway, R M Kennerley (R), G P Howie (R), D G Boulton, J C M Fair, R G Carlyle, B Mealings
MIH Limited: G A Duncan, J P Minkhorst (R), M W Hurrell
Milktest GP Limited: P G Brown, M E Leslie, R G Townshend, T A Winter, P D S Grave, J T Powell (R), R A McPhillips
MyMilk Limited: M W Hurrell, R M Kennerley (R), B Mealings
New Zealand Dairy Board: G A Duncan, C E Rowe
New Zealand Milk (International) Limited: G A Duncan, L J Paravicini
New Zealand Milk Brands Limited: G A Duncan, S D T Till
NZAgbiz Limited: G A Duncan, J P Minkhorst (R), M W Hurrell
Statutory Information CONTINUED
FOR THE YEAR ENDED 31 JULY 2018
For
per
sona
l use
onl
y
FONTERRA ANNUAL FINANCIAL RESULTS 2018 59
RD1 Limited: J P Minkhorst (R), K M Turner, M W Hurrell (R), R Allen
SAITL Limited: B Greaney (R), M E Leslie, T A Winter
Tangshan Dairy Farm (NZ) Limited: G A Duncan, K A Wickham (R), M R Cronin
Whareroa Co-Generation Limited: G A Duncan, M R Spiers (R), P D Wynen
Anchor Insurance Pte. Limited [Singapore]: L J Paravicini (R), S S Herbert, C L Khoon (A)(R), R M Kennerley (R), B Mealings, G A Duncan, H N Toh (A)
Anmum (Malaysia) Sdn. Bhd. [Malaysia]: J M Porraz (R), J Ling (R), F Spinelli, V Sivaraja, J Oh
Auckland Limited [Barbados]: M F Maldonado, A Turnbull, L Hartmann, F Spinelli, L J Paravicini
Australasian Food Holdings Pty Limited [Australia]: G A Duncan, A Maharaj, R Dedoncker
Bonland Cheese Trading Pty Ltd [Australia]: G A Duncan, A Maharaj, R Dedoncker
Comercial Dos Alamos S.A. [Chile]: J C Petersen, R Waldspurger, M Kunstmann
Comercial Santa Elena S.A. [Chile]: H Covarrubias Lalanne (R), J Barria, E Aldunate, W E Flen Silva
Corporación Inlaca C.A [Venezuela]: M F Maldonado, M M Perez (R), J R Odon (R), F C Ortega, L J Paravicini, J M Pinto
Dairy Enterprises (Chile) Limitada [Chile]: R Sepúlveda Seminario, J P Egaña Bertoglia (A), F Spinelli, G A Duncan, R Lavados (A), P L Linhares (A)
Dairy Enterprises International (Chile) Limited [Cayman Islands]: M P Campbell, G A Duncan
Dairy Partners Americas Brasil Limitada [Brazil]: M J L Barros, L P L Rivero, F A Sporques (R), L Medeiros (R), F Goncalves, D S Oliveira (R), R Gurrero Leal, M Favoretto, F Silveira
Dairy Partners Americas Nordeste-Productos Alimenticios Ltda [Brazil]: M J L Barros, F A Sporques (R), L P L Rivero, L Medeiros (R), F Goncalves, D S Oliveira (R), R Gurrero Leal, M Favoretto, F Silveira
Dairymas (Malaysia) Sdn Bhd [Malaysia]: J M Porraz (R), J Ling (R), F Spinelli, V Sivaraja, J Oh
Darnum Park Pty Ltd [Australia]: G A Duncan, R Dedoncker, A Maharaj
Falcon Dairy Holdings Limited [Hong Kong]: R M Kennerley (R), J F Ginascol, R O Frey, M P Campbell, M W Hurrell
Fast Forward FFW Limited [United Kingdom]: M P Campbell, H Huistra, M Gallagher, A Waugh, K Baine
Fazenda MIH Ltda [Brazil]: M P Bueno, G Nascimento
Fonterra (Brasil) Ltda [Brazil]: M P Bueno, G Nascimento, M J L Barros
Fonterra (Canada), Inc. [Canada]: G A Duncan, B Kipping, B M Ryan, J P Coote
Fonterra (China) Limited [Hong Kong]: G A Duncan, C Zhu, M Namboodiri
Fonterra (CIS) Limited Liability Company [Russian Federation]: M Bates
Fonterra (Europe) Coöperatie U.A. [Netherlands]: G A Duncan, H Huistra, A Wright (R), M Erol
Fonterra (Europe) GmbH [Germany]: A Wright
Fonterra (France) SAS [France]: H Huistra
Fonterra (Ing.) Limited [Mauritius]: G Lee, B M Ryan
Fonterra (Japan) Limited [Japan]: K Kumagai, H Ono, Y Saito, K Ueta (R), B M Ryan, K A Wickham, A Okuyama
Fonterra (Korea) Limited [Korea]: G A Duncan, Y Saito, J Murney
Fonterra (Logistics) Ltd [United Kingdom]: G R Sharma, A Wright (R), M Erol
Fonterra (Mexico) S.A. de C.V. [Mexico]: G A Duncan, L Barona Mariscal (A), F R Camacho (A), J P Coote, J A Del Rio, E P G R Gil (A)
Fonterra (SEA) Pte. Ltd. [Singapore]: H Gowans, A Aggarwal
Fonterra (Thailand) Limited [Thailand]: K Vunthanadit, A Aggarwal
Fonterra (USA) Inc. [United States]: G A Duncan, B M Ryan, J P Coote, N R Christiansen
Fonterra (Ying) Dairy Farm Company Limited [China]: R M Kennerley, G A Duncan, H Berghorst
Fonterra (Yutian) Dairy Farm Company Limited [China]: R M Kennerley, G A Duncan, H Berghorst
Fonterra Argentina S.R.L. [Argentina]: L P Wiener
Fonterra Australia Pty Ltd [Australia]: G A Duncan, R Dedoncker, A Maharaj
Fonterra Beijing Farm Management Consulting Company Limited [China]: R M Kennerley, A van der Nagel, L O’Neil
Fonterra Brands (Asia Holdings) Pte. Ltd [Singapore]: M R Cronin, S I Ahmed, A Dasgupta
Fonterra Brands (Australia) Pty Ltd [Australia]: G A Duncan, R Dedoncker, A Maharaj
Fonterra Brands (Far East) Limited [Hong Kong]: G A Duncan, M Namboodiri (R), S C Deschamps (R), P D Washer
Fonterra Brands (Guangzhou) Ltd [China]: K A Wickham, A R R Kasireddy (R), R M Kennerley (R), T T Lye, P A Turner
Fonterra Brands (Guatemala), S.A. [Guatemala]: A J Cordner, G A Duncan
Fonterra Brands (Hong Kong) Limited [Hong Kong]: G A Duncan, M Namboodiri (R), S C Deschamps (R), P Washer
Fonterra Brands (Malaysia) Sdn Bhd [Malaysia]: J M Porraz (R), J Ling (R), F Spinelli, V Sivaraja, J Oh
Fonterra Brands (New Young) Pte. Ltd. [Singapore]: Y Lin, C Lin, J Ling, S C Deschamps (R), Y Li, A Dasgupta, P D Washer
Fonterra Brands (Singapore) Pte. Ltd [Singapore]: M R Cronin, A Dasgupta
Fonterra Brands (Thailand) Ltd [Thailand]: P A Richards, P Oh (R), F Spinelli, S Totana, S Pronanut
Fonterra Brands (Viet Nam) Company Limited [Vietnam]: A Renard (R), F Spinelli, P Richards
Fonterra Brands Indonesia, PT [Indonesia]: A Afiffudin (R), M Namjoshi, S R Shashi, D M Infani, J Chow, F Spinelli
Fonterra Brands Lanka (Private) Limited [Sri Lanka]: J H P Gallage, S Sethi, F Spinelli
Fonterra Brands Manufacturing Indonesia, PT [Indonesia]: M A Nasution, T A Siswanto, M Namjoshi, S R Shashi, J Chow, F Spinelli
Fonterra Brands Myanmar Co Ltd [Myanmar]: G A Duncan, P Richards
Fonterra Brands Phils. Inc. [Philippines]: L T Barin, R A Mendoza, E T Ogsimer (R), S Choo (R), M T Boness, F Spinelli, L De Velez, R Cook
Fonterra Chile SpA R Sepulveda Seminario, F Spinelli, G A Duncan, J P Egana Bertoglia (A), R Lavados (A), P L Linhares (A)
Fonterra Commercial Trading (Shanghai) Company Limited [China]: G A Duncan, R Allen, J Ruan, S C R Deschamps (R), C Zhu, P D Washer
Statutory InformationFOR THE YEAR ENDED 31 JULY 2018
For
per
sona
l use
onl
y
FONTERRA ANNUAL FINANCIAL RESULTS 201860
Fonterra Egypt Limited [Egypt]: G A Duncan, A Anwar
Fonterra Europe Manufacturing B.V. [Netherlands]: H Berghorst (R), C E Rowe, D Crabbe
Fonterra Europe Manufacturing Holding B.V. [Netherlands]: G A Duncan, H Huistra
Fonterra Foodservices (USA), Inc. [United States]: G A Duncan, J P Coote, N R Christiansen
Fonterra Global Business Services Asia Sdn Bhd [Malaysia]: J Ling (R), J M Porraz (R), V Sivaraja, J Oh
Fonterra India Private Limited [India]: K M Turner, H D Gowans, S G Matthews
Fonterra Ingredients Australia Pty Ltd [Australia]: G A Duncan, A Maharaj, R Dedoncker
Fonterra Investments Netherlands Coöperatie U.A. [Netherlands]: H Huistra, B M Ryan (R), G A Duncan
Fonterra Middle East FZE [United Arab Emirates]: G A Duncan, A M Fitzsimmons
Fonterra MIH Holdings Brasil Ltda [Brazil]: M P Bueno, G Nascimento
Fonterra Milk Australia Pty Ltd [Australia]: G A Duncan, A Maharaj, R Dedoncker
Fonterra Tangshan Dairy Farm (HK) Limited [Hong Kong]: R M Kennerley (R), H Berghorst, M W Hurrell
Fonterra Venezuela, S.A. [Venezuela]: F C Ortega Becea, G A Duncan, M M Perez
Inversiones Dairy Enterprises S.A. [Chile]: J P Egaña Bertoglia (A), R Sepúlveda Seminario, F Spinelli, R Lavados (A), P L Linhares (A), G A Duncan
Key Ingredients, Inc. [United States]: G A Duncan, B M Ryan, J P Coote, N R Christiansen
Lactaid Holdings Ltd [Barbados]: M F Maldonado, A D Turnbull, L Hartmann, F Spinelli, L J Paravicini
Lacven Corp [Barbados]: M F Maldonado, A Turnbull, L Hartmann, L J Paravicini, F Spinelli
Milk Products Holdings (Middle East) EC [Bahrain]: G A Duncan, A Fitzsimmons (R), F Spinelli, G Amade
Milk Products Holdings (North America) Inc. [United States]: B M Ryan, J P Coote, N R Christiansen
New Tai Milk Products Co Ltd [Taiwan]: C Lee, G Lee, M Lee, B M Ryan, J H Priem (R), K Lee, K A Wickham, T Chow
New Zealand Milk (Australasia) Pty Ltd [Australia]: G A Duncan, A Maharaj, R Dedoncker
New Zealand Milk (Barbados) Ltd [Barbados]: G A Duncan, F Spinelli
New Zealand Milk (LATAM) Ltd [Bermuda]: G A Duncan, F Spinelli
New Zealand Milk Products (Ethiopia) SC [Ethiopia]: A Fitzsimmons (R), M Woodward, A B Abubeker, M B Abubeker, F Spinelli, G Amade
Newdale Dairies (Private) Limited [Sri Lanka]: J H P Gallage, S Sethi, F Spinelli
NZMP (AEM) Ltd [United Kingdom]: G R Sharma, A Wright (R), M Erol
NZMP Fonterra Nigeria Limited [Nigeria]: G A Duncan, H Huistra
Pure Source Dairy Farm Company Limited [Hong Kong]: R M Kennerley (R), J F Ginascol, Y Chen (R), H Berghorst, M W Hurrell, D LiYan
Sociedad Agrícola y Lechera Praderas Australes S.A. (“Pradesur”) [Chile]: J C Petersen, R Waldspurger, M Kunstmann
Sociedad Procesadora de Leche Del Sur S.A. [Chile]: E Alcalde Undurraga (A), J Milic Barros, A J R Valente Vias (R), G Varela (R), J M Alcalde Undurraga (A), G Jiménez Barahona (A)(R), J P Matus Pickering (A)(R), S Oddo Gómez (A), C Perez-Cotapos Subercaseaux (A), J P Egana Bertoglia (A)(R), T Walker Prieto, R Lavados McKenzie (A), M W Hurrell, A Tagle, S Diez Arriagada, J C M Fair, G Grez Jordan (A), A Montaner (A), C Herrera Barriga (A)
Solid Fresh Food & Beverage (M) Sdn. Bhd. [Malaysia]: J M Porraz, J Ling, F Spinelli
Soprole Inversiones SA [Chile]: J R Valente Vias (R), G Varela Alfonso (R), S Diez Arriagada (A)(R), C Herrera Barriga (A)(R), R Sepúlveda Seminario (A), R Tisi Lanchares (A)(R), L J Paravicini, F Spinelli, P L Linhares (A), R Carneiro, H Covarrubias Lalanne, J P Egana, J P Matus Pickering (A), J C Sanchez (A), J A Parodi (A)
Soprole S.A. [Chile]: J R Valente Vias (R), G Varela Alfonso (R), C Herrera Barriga (A)(R), R Sepúlveda Seminario (A), R A Tisi Lanchares (A)(R), S Diez Arriagada (A)(R), L J Paravicini, R Carneiro, F Spinelli, P L Linhares (A), J P Matus Pickering, H Covarrubias Lalanne, J P Egana (A), J C Sanchez (A), J A Parodi (A)
Tangshan Fonterra Dairy Farm Ltd [China]: R M Kennerley (R), G A Duncan, H Berghorst, Q Jiang, M W Hurrell
Unifood Holding B.V. [The Netherlands]: H Huistra, M Bates, M Ivanov, A Sirotinin
Unifood LLC [Russian Federation]: H Huistra, M Bates, M Ivanov, A Sirotinin
United Milk Tasmania Pty Limited [Australia]: G A Duncan, A Maharaj, R Dedoncker
REMUNERATION FRAMEWORK
A well-designed remuneration framework helps the Co-operative attract and retain talent, and both motivates and recognises the role our people play in the success of the Co-operative.
Fonterra’s remuneration framework for salaried staff is based on a ‘total remuneration’ approach, which is consistent with best practice globally. This includes base salary, benefits (superannuation and insurance), and variable remuneration (incentives).
The amounts we pay to our employees are benchmarked against comparable companies in relevant markets, using information obtained from independent remuneration consultants. Adjustments to packages may occur on a cyclical basis, such as an annual salary review, or on an as-needed basis to recognise additional responsibilities.
The framework is designed to take into account budget targets and restraints, market conditions, internal equity, and governance factors such as local legislation, as well as taking into account individual performance.
Fonterra’s incentive programmes are designed to drive the Co-operative’s performance by:
• Focusing on the Co-operative’s primary objective of maximising returns for its farmer shareholders;
• Promoting collaboration and a one team approach to achieve Fonterra’s goals;
• Establishing targets which are challenging yet achievable; and linked to team (such as business unit) and group performance.
At the end of each financial year, performance is reviewed and incentive payments are approved by the People, Culture and Safety (“PCS”) Committee at its discretion. The Committee retains absolute discretion in respect to payments for all incentive schemes.
Further detail on Fonterra’s remuneration framework can be found in the Corporate Governance section of the Annual Review on page 70.
Statutory Information CONTINUED
FOR THE YEAR ENDED 31 JULY 2018
For
per
sona
l use
onl
y
FONTERRA ANNUAL FINANCIAL RESULTS 2018 61
EMPLOYEE REMUNERATION
The Group operates in a number of countries where remuneration market levels differ widely. During the year ended 31 July 2018, the number of employees, not being Directors of Fonterra, who received remuneration, incentives, and other benefits (including superannuation and allowances etc) exceeding $100,000 was as follows:
1 Includes employees employed in New Zealand during the reporting period.
2 Includes employees employed in an offshore operation during the reporting period. Amounts paid in foreign currency have been translated at the average conversion rate for the period. As Fonterra has a significant offshore population, the number of offshore employees exceeding the fixed figure of $100,000 increases if the New Zealand dollar currency weakens significantly. Should the New Zealand dollar strengthen against those markets’ currencies, these same individuals may not be reported in future lists.
3 Cessations include employees that have been terminated or retired during the period. The amounts paid to former employees include salary and bonuses for the current period, prior period bonuses that have been paid in the current period (which were accrued at 31 July 2017) and termination entitlements including those arising from employment arrangements entered into by legacy companies prior to the formation of Fonterra.
Standard & Poor’s long term rating for Fonterra is A- with a rating outlook of stable. Fitch’s long and short term default rating is A with a rating outlook of stable. Retail Bonds have been rated the same as the Company’s long term rating by both Standard & Poor’s and Fitch. Capital Notes which are subordinate to other Fonterra debt issued are rated BBB+ by Standard & Poor’s and A- by Fitch.
EXCHANGE RULINGS AND WAIVERS
NZX Limited (NZX) has ruled that Capital Notes do not constitute ‘equity securities’ under the NZX Main Board/Debt Market Listing Rules (‘Rules’). This means that where Capital Notes are quoted on NZX’s Debt Market (‘NZDX’), the Company is not required to comply with certain Rules which apply to an issuer of quoted equity securities.
The Company was issued with a waiver of Rule 11.1.1 to enable it to decline to accept or register transfers of Capital Notes (NZDX listed debt securities FCGHA) if such transfer would result in the transferor holding or continuing to hold Capital Notes with a face value or principal amount of less than $5,000 or if such transfer is for an amount of less than $1,000 or not a multiple thereof. The effect of this waiver is that the minimum holding amount in respect of the Capital Notes will at all times be $5,000 in aggregate and can only be transferred in multiples of $1,000.
Fonterra Co-operative Group Limited (Fonterra) was issued with a ruling in respect of Rule 1.7.1(d) of the Fonterra Shareholders’ Market Rules on 27 June 2017 by NZX. The effect of this ruling was to not preclude the appointment of Mr Bruce Hassall to the position of an Independent Director of Fonterra by virtue of a child of Mr Hassall being employed in a non-decision making and non-senior role at Fonterra.
Fonterra was issued with a ruling in respect of Rule 5.1.2(c) on 22 November 2016 by NZX. The effect of this ruling is that Fonterra’s internal governance resolutions are considered to be matters that do not require the NZX to approve a notice of meeting under Rule 5.1.1.
Fonterra was issued with a waiver of Rule 3.2.1(c) on 31 August 2016 by the NZX, to the extent that such Rule requires Fonterra to have a minimum of two Independent Directors or, if Fonterra has eight or more Directors, three or one-third of the total number of Directors, whichever is greater. This waiver was granted in connection with the resignation of Mr John Waller and applied for a period ending on the earlier of the appointment of a new Independent Director or three months from the date of the waiver.
NZX TRADING HALTS
No trading halts were placed on Fonterra securities by NZX Regulation in the financial year ended 31 July 2018.
STOCK EXCHANGE LISTINGS
Fonterra’s co-operative shares are listed and quoted on the Fonterra Shareholders’ Market (operated by NZX Limited for Fonterra) under the code ‘FCG’. Fonterra has two issues of retail bonds listed and quoted on the NZDX under the codes ‘FCG030’ and ‘FCG040’. Fonterra also has an issue of capital notes listed and quoted on NZDX under the code ‘FCGHA’ and a Euro Medium Term Note Programme listed on the Singapore Stock Exchange.
As at 31 July 2018 there were 1,611,922,916 Fonterra Co-operative shares on issue.
Statutory Information CONTINUED
FOR THE YEAR ENDED 31 JULY 2018
For
per
sona
l use
onl
y
FONTERRA ANNUAL FINANCIAL RESULTS 2018 63
ANALYSIS OF SHAREHOLDING
Analysis of Fonterra’s shareholding as at 31 July 2018:
1 The FSM Rules, which reflect the rules of the NZX Main Board, require that Fonterra’s annual report contain the names and holdings of persons having the 20 largest holdings of Fonterra shares on the register of Fonterra as at a date not earlier than two months before the date of the publication of the annual report. The list above complies with the FSM Rules and sets out the list of the 20 largest shareholders on the register as at the appropriate date. There is a separate requirement in the FSM Rules to disclose in the annual report those persons who have a ‘Relevant Interest’ (as defined in the Financial Markets Conduct Act 2013) in Fonterra shares in excess of five per cent, where this information has been provided to Fonterra. Accordingly, the list of the 20 largest holdings of Fonterra shares is not required to show, and does not purport to show, the top 20 holdings of ‘Relevant Interests’ in Fonterra shares which may be owned or controlled by a person or entity and their associated entities. Other people or entities may have ‘Relevant Interests’ in a greater number of Fonterra shares than those listed above. However, it is not possible for Fonterra to accurately determine those interests, nor is it a requirement of the FSM Rules for those interests to be reported in the annual report, except where Fonterra has been advised that a person has a ‘Relevant Interest’ in excess of the five per cent threshold.
Substantial Product HoldersAccording to notices given to the Company under the Financial Markets Conduct Act 2013, as at 31 July 2018, the substantial product holders in the Company and their relevant interests are noted below. The total number of Co-operative shares on issue as at 31 July 2018 was 1,611,922,916.
SUBSTANTIAL PRODUCT HOLDERSNUMBER OF VOTING
SECURITIESDATE OF MOST
RECENT NOTICE
Fonterra Farmer Custodian Limited 111,816,183 30 July 2018
FSF Management Company Limited 111,735,183 30 July 2018
More than one ‘Relevant Interest’ can exist in the same voting financial products. Fonterra Farmer Custodian Limited holds Fonterra shares for the Fonterra Shareholders’ Fund, of which FSF Management Company Limited is the manager. These two notices therefore refer to substantially the same Fonterra shares. The Custodian also holds some Fonterra shares for the Registered Volume Provider in respect of the Fonterra Shareholders’ Fund.
Statutory Information CONTINUED
FOR THE YEAR ENDED 31 JULY 2018
For
per
sona
l use
onl
y
FONTERRA ANNUAL FINANCIAL RESULTS 201864
FCG Fonterra Co-operative SharesAnalysis of Fonterra Co-operative Shares as at 31 July 2018:
FROM –TO HOLDER COUNT % HOLDING QUANTITY %
1–50,000 1,310 13.16 36,451,498 2.26
50,001–100,000 2,731 27.44 208,651,759 12.94
100,001–200,000 3,487 35.04 490,879,992 30.45
200,001–400,000 1,984 19.94 538,870,378 33.44
400,001 and over 440 4.42 337,069,289 20.91
ANALYSIS OF CAPITAL NOTE AND RETAIL BOND HOLDING
Analysis of Fonterra’s Capital Note Holding as at 7 August 2018:
FCGHA Capital Notes
FROM –TO HOLDER COUNT % HOLDING QUANTITY %
1–1,000 9 1.28 3,974 0.00
1,001–5,000 25 3.55 66,584 0.07
5,001–10,000 236 33.47 1,681,621 1.64
10,001–100,000 403 57.16 11,362,094 11.08
100,001 and over 32 4.54 89,404,981 87.21
100,001 and over includes Fonterra Co-operative Group Limited’s holding of 67,435,575.
Analysis of Fonterra’s Retail Bond Holding as at 7 August 2018:
FCG030 $350 million Retail Bond issue
FROM –TO HOLDER COUNT % HOLDING QUANTITY %
5,000–9,999 40 6.97 233,000 0.07
10,000–49,999 280 48.78 6,243,000 1.78
50,000–99,999 71 12.37 4,292,000 1.23
100,000–999,999 161 28.05 53,904,000 15.40
1,000,000 and over 22 3.83 285,328,000 81.52
FCG040 $150 million Retail Bond issue
FROM –TO HOLDER COUNT % HOLDING QUANTITY %
5,000–9,999 61 9.84 353,000 0.24
10,000–49,999 395 63.71 8,308,000 5.54
50,000–99,999 78 12.58 4,635,000 3.09
100,000–999,999 71 11.45 15,701,000 10.47
1,000,000 and over 15 2.42 121,003,000 80.66
Statutory Information CONTINUED
FOR THE YEAR ENDED 31 JULY 2018
For
per
sona
l use
onl
y
FONTERRA ANNUAL FINANCIAL RESULTS 2018 65
ENTRIES IN THE INTERESTS REGISTER
Directors’ interests in transactions
General disclosures of interestThe following general disclosures of interest were made in the period from 1 August 2017 to 31 July 2018:
Clinton Dines Non-executive Director of Port of Newcastle and Centaur Resources. Ceased to be a non-executive Director of Aurecon Group.
Brent Goldsack Director of Waitomo Petroleum Limited, Waitomo Energy Limited, Waitomo Group Limited, Kiwi Fuels Limited, Waitomo Land Limited, Kiwi Transactions Limited, and National Fieldays Society Limited. Director and shareholder of Canterbury Grasslands Limited. Shareholder of Kakepuku Farms Limited Partnership and Longfields Investments Limited. Indirect shareholder of DairyGold Limited, Goldcar Dairy Holdings Limited, Ballance Agri-Nutrients Limited and Livestock Improvement Corporation. Indirect Partner in CoLab Dairy Partners General Partnership. Financial interests jointly with associated persons in Ngarua Dairy Limited and Kakepuku Farms Limited Partnership. General Manager of Kiwitahi Pastoral and One Bird Partnership.
Bruce Hassall Chairman of The Farmers Trading Company Limited, Prolife Foods Limited, BNZ Insurance Services Limited and BNZ Life Insurance Limited. Director of Bank of New Zealand, Fletcher Building Limited and Fletcher Building Industries Limited. Director and shareholder of Marivan Holdings Limited. Shareholder of Mangatarata Stations (Number 3) Limited, RPF Investments Limited and Sumpter Baughen Chartered Accountants. Trustee of Kristiansund Investments Trust. Member of the University of Auckland Business School Advisory Board. Advised of appointment to Chairman of Fletcher Building Limited and Fletcher Building Industries Limited, effective 1 September 2018. Ceased to be Chairman of BNZ Insurance Services Limited and BNZ Life Insurance Limited, effective 2 August 2018.
Andrew Macfarlane Director of AgResearch, Ngai Tahu Farming Limited, Riverbank Farm (Ashburton) Limited, Broadfields Farm (Ash) Limited, MRB Securities Limited, ANZCO Foods Limited, ANZCO Farmer Nominee Limited, Deer Improvement Limited and Kintore Farms Limited. Relevant interest in the Deebury Partnership and its associated entities. Director and shareholder of Pencarrow Farm Limited, Windwhistle Pastoral Limited, M.R.B Trustees Limited and Macfarlane Rural Business Limited. Councillor at Lincoln University. Ceased to be a Director of AgResearch.
John Monaghan Ceased to be a Director and shareholder of Monloy Farm.
Donna Smit Ceased to be a Trustee of the Taratahi Agricultural Training Centre (Wairarapa) Trust Board.
Scott St John Director of Mercury NZ Limited.
Ashley Waugh Ceased to be Chairman of Moa Group Limited.
John Wilson Director of Arranmore Developments Limited, Ballintoy Developments Limited, Castlederg Limited, Castle Finance Limited, Castle Investments Limited, Clendon Properties Limited, Donegal Farm Limited, Emerald Downs Limited, Hammond & McIntyre Limited, Hugh Green Energy Limited, Hugh Green Properties Limited, Hugh Green Limited, Hugh Green Contractors Limited, Hugh Green Residential Limited, Kerrykeel Farm Limited, Kilmacrennan Livestock Limited, Livestock Mart Auctions Limited, Mangatangi River Rock Limited, Montclare Holdings Limited, Okura Estates Limited, Raphoe Farms Limited, Rowberry Holdings Limited, St Michaels Farm Limited, Arranmore Properties Limited, Convoy Residential Limited, Derryveagh Developments Limited, Drumkeen Country Estate Limited, Ducansa Holdings Limited, Gateway Auckland Limited, Glenfin Holdings Limited, Liscooley Estates Limited, Moira Farm Limited, Mongorry Farms Limited, Pomona Holdings Limited, Raphoe Holdings Limited, Castlefinn Developments Limited, Greerton Holdings Limited, Donegal Residential Limited. Ceased to be Director of Scott Milktech Limited, MilkTech Limited, Edge Landscaping Limited. Ceased to be a Director of Turner and Growers Limited (effective August 2018). Ceased to be a limited Partner of Lochan Mor LP.
During the financial year there were no notices from Directors requesting to disclose or use information received in their capacity as Directors which would not otherwise have been available to them.
Statutory Information CONTINUED
FOR THE YEAR ENDED 31 JULY 2018
For
per
sona
l use
onl
y
FONTERRA ANNUAL FINANCIAL RESULTS 201866
Securities dealings of Directors
The following entries were made in the Interests Register during the year.
New disclosures
Directors disclosed the following holdings of Co-operative shares during the year:
RELEVANT INTERESTS IN CO-OPERATIVE SHARES
Andrew Macfarlane (on appointment 2 November 2017) 813,301
Brent Goldsack (on appointment 2 November 2017) 276,936
Directors disclosed the following holdings of Units during the year:
RELEVANT INTERESTS IN UNITS
Andrew Macfarlane (on appointment 2 November 2017) 120,000
During the year, Directors disclosed in respect of section 148(2) of the Companies Act 1993 and/or section 297 of the Financial Markets Conduct Act 2013 that they (or their associated persons) acquired or disposed of a relevant interest in financial products as follows:
Co-operative share transactions
DIRECTORNUMBER OF
SECURITIES ACQUIREDNUMBER OF
SECURITIES DISPOSEDCONSIDERATION
$ DATE
Donna Smit – 283,9251 – October 2017
Donna Smit 89,7422 89,7422 – 28 November 2017
John Wilson 63,8322 63,8322 – 10 November 2017
John Wilson 11,6242 11,6242 – 15 November 2017
John Wilson 53,843 – 338,772 16 November 2017
Nicola Shadbolt 9,000 – 57,510 30 January 2018
Brent Goldsack 3,093 – 19,021 12 February 2018
Donna Smit 14,198 – 81,354 27 April 2018
1 Shares disposed of as a result of ceased interests.
2 Transfers between related entities.
Unit transactions
DIRECTORNUMBER OF
SECURITIES ACQUIREDNUMBER OF
SECURITIES DISPOSEDCONSIDERATION
$ DATE
Nicola Shadbolt 11,000 – 63,250 18 April 2018
Donna Smit 2,502 – 14,286 27 April 2018
Retail Bond transactionsThere were no transactions by Directors (or their associated persons) in Retail Bonds reported during the period from 1 August 2017 to 31 July 2018. No current holdings of Retail Bonds have been advised by Directors (or their associated persons).
Capital Note transactionsThere were no transactions by Directors (or their associated persons) in Capital Notes reported during the period from 1 August 2017 to 31 July 2018. No current holdings of Capital Notes have been advised by Directors (or their associated persons).
Statutory Information CONTINUED
FOR THE YEAR ENDED 31 JULY 2018
For
per
sona
l use
onl
y
FONTERRA ANNUAL FINANCIAL RESULTS 2018 67
Statutory Information CONTINUED
FOR THE YEAR ENDED 31 JULY 2018
Directors’ remunerationThe Directors’ Remuneration Committee, comprising six shareholders elected in accordance with the Constitution, makes recommendations for shareholder approval as to the level of Directors’ fees.
At the Annual Meeting of shareholders held on 2 November 2017, shareholders approved, on the recommendation of the Directors’ Remuneration Committee, the following amounts of remuneration to apply to Elected Directors from the date of that Annual Meeting of shareholders.
Chairman $430,000 p.a.
Directors $175,000 p.a.
Discretionary additional payments to the Chair of permanent Board Committees (except if the Chair is the Fonterra Chairman) $35,000 p.a.
The Board has approved payment of the discretionary additional payment, at the prevailing approved rate, to the Chair of permanent Board Committees.
The Board has discretion to set the fees for Directors appointed under clause 12.4 of the Constitution (Appointed Directors). In the period to 31 July 2018 the Board applied the same remuneration levels as above to the Appointed Directors.
The Board has approved the payment to Mr Israel of a travel allowance of $10,000 per meeting for travel to and from New Zealand to attend Board meetings.
Fees paid by subsidiary or associate companies in respect of Fonterra Directors or employees appointed by Fonterra as Directors of those companies are payable directly to Fonterra.
Directors’ indemnity and insuranceFonterra has given indemnities to, and has effected insurance for, Directors and executives of the Company and its related companies, in accordance with section 162 of the Companies Act 1993, and clause 35 of Fonterra’s Constitution, which, except for specific matters that are expressly excluded, indemnify and insure Directors and executives against monetary losses as a result of actions undertaken by them in the course of their duties. Among the matters specifically excluded are penalties and fines that may be imposed for breaches of law.
This presentation may contain forward-looking statements and projections. There can be no certainty of outcome in relation to the matters to which the forward-looking statements and projections relate. These forward-looking statements and projections involveknown and unknown risks, uncertainties, assumptions and other important factors that could cause the actual outcomes to be materially different from the events or results expressed or implied by such statements and projections. Those risks, uncertainties, assumptions and other important factors are not all within the control of Fonterra Co-operative Group Limited (Fonterra) and itssubsidiaries (the Fonterra Group) and cannot be predicted by the Fonterra Group.
While all reasonable care has been taken in the preparation of this presentation none of Fonterra or any of its respective subsidiaries, affiliates and associated companies (or any of their respective officers, employees or agents) (Relevant Persons) makes any representation, assurance or guarantee as to the accuracy or completeness of any information in this presentation or likelihood of fulfilment of any forward-looking statement or projection or any outcomes expressed or implied in any forward-looking statement or projection. The forward-looking statements and projections in this report reflect views held only at the date of this presentation.
Statements about past performance are not necessarily indicative of future performance.
Except as required by applicable law or any applicable Listing Rules, the Relevant Persons disclaim any obligation or undertaking to update any information in this presentation.
This presentation does not constitute investment advice, or an inducement, recommendation or offer to buy or sell any securities in Fonterra or the Fonterra Shareholders’ Fund.F
Reported a net lossDue to lower operating earnings, higher funding costs and one-offs
1. Movements in the items are on an EBIT basis.2. Movements in the items have been adjusted for the impact of minority interests of $10m on operating earnings and $4m on interest and tax to put on a comparable basis with NPAT.3. Other includes $25m minority interests share of FY18 NPAT and ($4m) time value of options.4. Danone arbitration decision includes $26m finance costs and $62m tax credit.5. Beingmate investment includes $405m impairment and $34m share of operating losses.
• Reported net loss of $196 million, this includes a 5 cent reduction in the Farmgate Milk Price
• EBIT1,2, before Milk Price adjustment, down $337 million on last year
• Funding costs and tax are up $136 million on last year
• One-offs of Beingmate impairment and Danone arbitration decision reduce net earnings by $599 million
• Normalisations are done to better reflect ongoing business performance
Disappointing earnings performanceMargin pressure, higher costs and one-offs
GROSS MARGIN¹
$3,152M3%
REVENUE
$20.4B6%
VOLUME
22.2B LME3%
ANNUAL DIVIDEND
10CPSYIELD 1.7%3
NORMALISED EBIT2
$902M22%
OPEX1
$2,496M7%
NET PROFIT AFTER TAX
$(196)M126%, EPS (14)c
NORMALISED NPAT2
$382M51%, EPS¹ 24c
IngredientsVolume (LME)4 20.5B
Gross Margin (%)¹ 9.0%Normalised EBIT $879M
Return on Capital6 8.3%
Consumer and FoodserviceVolume (LME)4 5.6B
Gross Margin (%)¹ 23.6%Normalised EBIT $525M
Return on Capital6 8.3%
China FarmsVolume (LME)5 0.3B
Gross Margin (%)¹ 2.1%Normalised EBIT $(9)M
75%
1. Reflect normalisation adjustments.2. Attributable to equity holders.3. FY18 divided over volume weighted average FCG price of $5.84 across the year.4. Includes inter-company sales.
5. Prior year volumes include 26m LME of milk powders not included this year.6. Return on Capital (ROC) includes goodwill, brands and equity accounted investments.
Excluding goodwill, brands and equity accounted investments ROC was 8.2% in Ingredients and 35.1% in Consumer and Foodservice.
Value creation not satisfactoryRequires improved performance and better use of capital
$861MCAPEX
1%
83 DAYSWORKING CAPITAL
8 days
$2,496MOPEX2
7%
15.4%GROSS MARGIN2
Down from 16.9%
$902MNORMALISED EBIT2
22%
6.3%RETURN ON CAPITAL
Down from 8.3%$6.2BNET DEBT3
Up 11%
Return
Capital
1. Return on Capital (ROC) includes goodwill, brands and equity accounted investments. Excluding goodwill, brands and equity accounted investments ROC was 8.0% in FY18 and 11.1% in FY17.
2. Reflect normalisation adjustments.3. Economic net interest-bearing debt.
1. Total available for pay-out = Forecast Farmgate Milk Price + Forecast Earnings Per Share (EPS) of 25-35 cents. For farm budgeting purposes the likely dividend will be calculated in accordance with Fonterra policy of paying out 65-75 per cent of adjusted net profit after tax over time.
Note: Farmgate Milk Price: $ per kgMS; Dividend: $ per share
Strong WMP and butter prices increased Farmgate Milk Price
Note: All prices in US dollars per MT. All percentages within the wheel refer to the commodity weighting of the Farmgate Milk Price ManualSource: Milk Price Statement
• The Farmgate Milk Price Manual calculates a 10% uplift for FY18 vs. FY17
• This increase is driven by WMP, Butter and AMF
• Prices vary from the GDT spot market because the Milk Price Manual takes into account a combination of GDT and off-GDT sales
• The Milk Price Manual calculates a volume weighted price, based on when volumes are shipped
Note: All 12-month figures are rolling 12 months compared to previous comparable period: Australia (Jun), EU (Jun), United States (Jun), China (Mar), Asia (Apr), Middle East & Africa (Apr), Latin America (Apr)Source: Government milk production statistics; GTIS trade data; Fonterra analysis
Russia
EU’s largest dairy export market – trade embargo remains
• Farmgate Milk Price Manual reinforces competitive milk price– Since 2009: added 52 cents per
kgMS in total• Transparent Farmgate Milk Price
and demand-led strategy strengthened cash pay-out
0.3
0.5
Aug- 17 Sep- 17 Oct -17 Nov- 17 Dec- 17 Jan -18 Feb- 18 Ma r- 18 Apr- 18 Ma y-1 8 Jun -18 Jul- 18
0
0.2
0.4
0.6
0.8
1990 1994 1998 2002 2006 2010 2014 2018
Globally competitive cash pay-out
EU USNZGlobal Milk Prices (USD / litre)
Source: DairyNZ (NZ to May 2014); Fonterra announced payout (milk price and dividend) (NZ from June 2014); USDA; European Milk Market Observatory (Netherlands milk price). Prices are adjusted to a milk composition of 3.5% protein and 4.2% fat and for spot exchange rates.
1. Includes sales to other strategic platforms.Note: Normalised EBIT has been restated for FY17 from $614 million to $576 million as we reallocated some Group overhead costs to Consumer and Foodservice markets.
Consumer and FoodserviceShifting volume to higher value but higher fat prices impacted margins
• Additional 131m LMEs shifted to higher value products, increasing sales volume by 2%
• Oceania volumes down 5% because of underperformance from our New Zealand business
• Strong foodservice growth in China
Value• Higher fat prices pressure margins
– Achieved price increases of $551 million but not sufficient to offset higher costs of $626 million
• Successfully retained market share in Greater China
Velocity• Brazil improved performance in tough economic conditions• Australian performance on target
Latin America – Consumer and FoodserviceGrowth in EBIT with a challenging macro-environment in some markets
• Soprole continues to have strong growth, up 7%• Volumes across Brazil and Venezuela impacted by a challenging
economic environment
Value• The only region to deliver growth in EBIT• Soprole maintained earnings by optimizing product mix• The economic environment remains fragile in Venezuela. One-off
benefit from restructure of USD obligations
Velocity• Process improvements in both manufacturing and supply chain in
Brazil and Chile have resulted in cost efficiencies in FY18
Note: Reference products are products used in the calculation of the Farmgate Milk Price – WMP, SMP, BMP, Butter, AMF; Milk solids used in the products sold were 997m kgMS reference and 328m kgMS non-reference (year ended 31 July 2017 was 1,061m kgMS reference and 441m non-reference); Excludes bulk liquid milk volumes of 68,000 MT of kgMS equivalent (year ended 31 July 2017 was 76,000 MT); Excludes Foodservice volumes to China, Latin America and Quick Service Restaurants of 198,000 MT (year ended 31 July 2017 was 143,000 MT)
Base PricePrices used by Fonterra’s sales team as referenced against GDT prices and other relevant benchmarks
DIRADairy Industry Restructuring Act 2001 (New Zealand)
GDTGlobalDairyTrade, the online provider of the twice monthly global auctions of dairy ingredients
Gearing RatioEconomic net interest bearing debt divided by economic net interest bearing debt plus equity excluding cash-flow hedge reserves
Farmgate Milk PriceThe price for milk supplied in New Zealand to Fonterra by farmer shareholders
Fluid and Fresh DairyThe Fonterra grouping of skim milk, whole milk and cream – pasteurised or UHT processed, concentrated milk products and yoghurt
LME (Liquid Milk Equivalent)A standard measure of the amount of milk (in litres) allocated to each product based on the amount of fat and protein in the product relative to the amount of fat and protein in standardised raw milk
kgMSKilogram of milk solids, the measure of the amount of fat and protein in the milk supplied to Fonterra
Non-Reference ProductsAll dairy products, except for Reference, produced by the NZ Ingredients business
Price AchievementRevenue achieved over the base price less incremental supply chain costs above those set out in the Milk Price model
Reference ProductsThe dairy products used in the calculation of the Farmgate Milk Price, which are currently WMP, SMP, BMP, butter and AMF
Regulated ReturnThe earnings component of Milk Price generated from a WACC return on an assumed asset base
SeasonNew Zealand: A period of 12 months to 31 May in each year
Australia: A period of 12 months to 30 June in each year
SMPSkim Milk Powder
Stream ReturnsThe gross margin differential between Non-Reference Product streams and the WMP stream (based on base prices)
IngredientsThe Ingredients platform comprises bulk and specialty dairy products such as milk powders, dairy fats, cheese and proteins manufactured in New Zealand, Australia, Europe and Latin America, or sourced through our global network, and sold to food producers and distributors in over 140 countries. It also includes Fonterra Farm Source™ retail stores.
ConsumerThe Consumer platform comprises branded consumer products, such as powders, yoghurts, milk, butter, and cheese. Base products are sourced from the ingredients business and manufactured into higher-value consumer dairy products.
FoodserviceThe Foodservice platform comprises a range of branded products and solutions for commercial kitchens, including bakery butter, culinary creams, and cheeses.
China FarmsThe China Farms platform comprises the farming operations in China, which produce high quality fresh milk for the Chinese market.
For
per
sona
l use
onl
y
Farmgate Milk Price StatementFOR THE SEASON ENDED 31 MAY 2018
For
per
sona
l use
onl
y
FONTERRA FARMGATE MILK PRICE STATEMENT 2018
Contents
Introduction 01
Farmgate Milk Price for the 2018 Season 02
Milk Price Adjustment 02
Farmgate Milk Price Overview 03
Farmgate Milk Price Revenue and Costs 05
Milk Supply, Production and Sales Volumes 05
Prices 06
Lactose 07
Farmgate Milk Price Cash Costs 07
Farmgate Milk Price Capital Costs 08
Calculation of Benchmark Weighted Average Cost of Capital (WACC) 08
Farmgate Milk Price Manual Changes 09
Changes in Approach to the Calculation 10
Cumulative Impact of Changes in Methodology Between 2009 and 2018 Seasons 11
Approach 11
Changes Impacting on Net Revenue 11
Changes Impacting on Cash Costs 11
Changes Impacting on Capital Costs 11
Appendix 1 12
Farmgate Milk Price Overview
Appendix 2 14
Independent Assurance Report
Attachment 1 15
Milk Supplied and Production Volumes
Attachment 2 16
Sales Volumes
Attachment 3 17
Average Number of Months Prior to Shipment that Prices were Struck
Attachment 4 19
Average USD Prices
Attachment 5 20
Average USD:NZD Conversion and Spot Rates
Glossary 21For
per
sona
l use
onl
y
01FONTERRA FARMGATE MILK PRICE STATEMENT 2018
The primary purpose of this Statement is to help Fonterra farmer shareholders, unit holders in the Fonterra Shareholders’ Fund, and other interested parties better understand the Farmgate Milk Price.
This Farmgate Milk Price Statement:• sets out information about the Farmgate Milk Price and outlines
the way that Fonterra Co-operative Group Limited (Fonterra) has calculated the Farmgate Milk Price for the milk season that ended on 31 May 2018 (2018 Season); and
• explains that Fonterra has paid a Final Farmgate Milk Price that differs from the Farmgate Milk Price calculated under the Farmgate Milk Price Manual.
The appendices provide an overview of the Farmgate Milk Price and a report by Fonterra’s external auditors that confirms that the aggregate amount available to pay for New Zealand supplied milk for the 2018 Season has been derived in accordance with the Principles, Methodologies and Detailed Rules in Fonterra’s Farmgate Milk Price Manual, dated 1 August 2017.
Five attachments provide further detail for the past three seasons on the most significant factors that affect the Farmgate Milk Price. A glossary of the terms used completes the report.1
Fonterra has also released as an adjunct to this Statement an unaudited Microsoft Excel-based financial model that shows how the information set out in the Statement has been used to calculate the Farmgate Milk Price for the 2018 Season.
Numbers in this Statement have been rounded and, as a result, some tables may not exactly total or sum to 100 per cent.2 The information on the Farmgate Milk Price presented in this Statement is based on data used within the Milk Price Model, not Fonterra’s actual data.
A Farmgate Milk Price Statement is made available each year with Fonterra’s annual results on www.fonterra.com.
Introduction
1 Capitalised terms in this Statement are defined in the glossary.
2 Percentage changes shown in tables in this Statement have been calculated by reference to the underlying data, and may differ from percentage movements between the rounded data presented in the tables.
For
per
sona
l use
onl
y
02 FONTERRA FARMGATE MILK PRICE STATEMENT 2018
This section sets out the Announced Farmgate Milk Price for the 2018 Season, comprising the Farmgate Milk Price calculated under the Manual, less the Milk Price Adjustment.
The Manual sets out the methodology for determining the base amount to be paid by Fonterra for milk supplied to Fonterra in New Zealand in a season. Fonterra’s Milk Price Panel advises the Fonterra Board on matters concerning the Manual, including the calculation of the Farmgate Milk Price.
The Farmgate Milk Price is defined as the average price paid by Fonterra for each kilogram of milk solids (kgMS) supplied by farmer shareholders under Fonterra’s standard terms of supply.3 For the 2018 Season, the Farmgate Milk Price calculated under the Manual is NZD$6.74.
MILK PRICE ADJUSTMENT
The Fonterra Board has adjusted the Farmgate Milk Price calculated under the Manual downwards by NZD$0.05 (the Milk Price Adjustment), resulting in a Final Farmgate Milk Price for the 2018 Season of NZD$6.69. The Board has made this decision with a view to ensuring that Fonterra is able to maintain a strong balance sheet. The higher Milk Price in the 2018 Season has put pressure on Fonterra’s earnings, and therefore its balance sheet in a year which was already challenging due to the arbitration award payment to Danone and impairment of Fonterra’s Beingmate investment. The Board made this decision in the best long-term interests of the Co-operative.
Farmgate Milk Price for the 2018 Season
FARMGATE MILK PRICE CALCULATED UNDER THE MANUAL
$6.74kgMS
MILK PRICE ADJUSTMENT
$0.05kgMS
ANNOUNCED FARMGATE MILK PRICE
$6.69kgMS
3 In previous seasons the term Farmgate Milk Price was used to describe both the aggregate amount available to pay for milk supplied to Fonterra in New Zealand (as recommended by the Milk Price Panel to the Board), which in the 2018 Season was NZD$10.153 billion, and the amount calculated by dividing this aggregate amount by total milk supplied. This amount is typically slightly different to the average price paid for milk supplied on standard terms. As explained on page 9, the Manual has been amended with effect from the 2019 Season to make clearer the calculations and processes used to determine the average price paid for milk supplied on standard terms, and to align terminology (particularly the term Farmgate Milk Price) with common usage. Since these changes are presentational, and do not impact on the actual amounts paid to farmers, we have used the new terminology in this Statement.
per
per
per
For
per
sona
l use
onl
y
03FONTERRA FARMGATE MILK PRICE STATEMENT 2018
Table 1 summarises the key components of the Farmgate Milk Price for the milk supplied in the 2016, 2017 and 2018 Seasons.
The Manual determines the Aggregate Farmgate Milk Price. For the 2018 Season, the Aggregate Farmgate Milk Price was NZD$10.142 billion. The Aggregate Farmgate Milk Price is divided by Fonterra’s total New Zealand milk supply (1.505 billion kgMS) resulting in a Farmgate Milk Price of NZD$6.74. The Aggregate Farmgate Milk Price is determined by:
1. Calculating the total amount available to pay for milk supplied to Fonterra in New Zealand, other than premiums that exceed those that a commodity processor would be willing to pay. This aggregate amount, which was NZD$10.153 billion for the 2018 Season, is the Aggregate Commodity Milk Payments Amount.
2. Deducting premiums (offset by any discounts) for milk not supplied on standard terms, such as Winter Milk and contract milk, to the extent those premiums would have been paid by a commodity-only processor. These are Additional Commodity Milk Payments.
3. Adding or deducting adjustments made to payments for milk supplied on standard terms, such as the net amount of demerit deductions for milk quality issues. These are Standard Supply Adjustments.
Additional Commodity Milk Payments and Standard Supply Adjustments (11) (13)
Aggregate Farmgate Milk Price 10,142 9,336 6,101
Million kgMS 1,505 1,526 1,566
Farmgate Milk Price calculated under the Manual (NZD$ per kgMS)5 6.74 6.12 3.90
The cost of New Zealand-sourced milk disclosed in Fonterra’s financial statements for the year ended 31 July 2018 is NZD$10.115 billion. The difference between this amount and the Aggregate Farmgate Milk Price calculated under the Manual of NZD$10.142 billion primarily reflects the following four factors: • The aggregate amount for the Milk Price Adjustment.
• The financial statements report the cost of milk acquired during the financial year comprising the 12 months ended 31 July 2018. In contrast, the Aggregate Farmgate Milk Price for the season relates to milk supplied in respect of the 12 month season ended 31 May 2018.
• The Milk Price Manual determines the aggregate amount that a manufacturer of commodity milk powders will be willing to pay for the milk supplied to Fonterra. A commodity processor would not pay premiums for milk sourced specifically for value-add applications, such as organic milk, or pay as high a premium for Winter Milk that an integrated processor such as Fonterra would pay. The aggregate amount of premiums that exceed the amount a commodity processor would be willing to pay are a cost of New Zealand-sourced milk for Fonterra.
• The net amount of Additional Commodity Milk Payments and Standard Supply Adjustments.
4 Includes depreciation, tax and capital charge on fixed assets and net working capital.
5 Table 1 and Figure 1 are consistent with prior year disclosures. In the 2017 Season, we defined for the first time the Farmgate Milk Price as the average price paid for milk supplied on standard terms of supply. In 2016, the corresponding amount was NZD$3.89.
For
per
sona
l use
onl
y
04 FONTERRA FARMGATE MILK PRICE STATEMENT 2018
The most significant factor that affects the Farmgate Milk Price from season to season is revenue.
Figure 1 below shows that changes in the Farmgate Milk Price over the past three seasons have been driven mainly by changes in commodity prices converted into NZD.
The first three subsections below describe the key factors that influence revenue, while the subsequent two subsections describe the key factors influencing cash costs and capital costs, respectively.
0.00
2.00
4.00
6.00
8.00
10.00
2017 SEASON 2016 SEASON
NZD$ per kgMS
2018 SEASON
5.64 1.16
0.58
8.45 1.16
0.540.01 0.05
0.016.74 6.69
7.86 1.16
0.576.12
3.90
Additional Commodity Milk Payments and Standard Supply Adjustments
Milk Price Adjustment
Milk Price Capital Costs
Milk Price Cash Costs
Farmgate Milk Price Announced Farmgate Milk PriceNet Revenue
FIGURE 1: CHANGES IN THE FARMGATE MILK PRICE SEASONS: 2016 – 2018
Farmgate Milk Price Overview CONTINUED
For
per
sona
l use
onl
y
05FONTERRA FARMGATE MILK PRICE STATEMENT 2018
Farmgate Milk Price Revenue and Costs
MILK SUPPLY, PRODUCTION AND SALES VOLUMES
Farmgate Milk Price Revenue varies according to the volume of milk supplied during the season, product mix, sales volumes and prices in NZD. Farmgate Milk Price Revenue is the most significant driver of the Farmgate Milk Price.
Figure 2 shows the relationship between when milk is collected during a season (the blue line), the volume of products manufactured from that milk (the grey line) and when that product is shipped (the green line). The key points to note are as follows:• Milk supplied during the 2018 Season comprised 1.505 billion kgMS.
Attachment 1 provides information on milk supplied every quarter for each of the past three seasons.
• This amount of milk is assumed to be converted into Reference Commodity Products. The mix between the various products that goes into the Farmgate Milk Price is aligned to Fonterra’s actual mix between Whole Milk Powder (WMP) and Skim Milk Powder (SMP), and between butter and Anhydrous Milk Fat (AMF) (production of Buttermilk Powder (BMP) is a residual amount). Attachment 1 provides Farmgate Milk Price production by quarter for each Reference Commodity Product for the past three seasons.
• Sales volumes reflect the pattern of Fonterra’s actual shipments of Reference Commodity Products manufactured from milk supplied during the season. Figure 2 shows the lag between production and shipment as well as the fact that minimal milk is supplied in June and July. These factors mean that shipments of products manufactured from milk collected in a season (beginning 1 June) do not normally commence until August at the earliest. Shipments are normally complete by the end of October in the following year, again as illustrated in Figure 3.
Attachment 2 sets out sales volumes by quarter for each of the past three seasons.
Revenues are recognised when sales are invoiced, at the time of shipment. Sales prices included in the Farmgate Milk Price are always set prior to the month of shipment, primarily via Global Dairy Trade (GDT) events. Figure 3 shows the average lag between when prices are struck and when product is shipped.
This matches Fonterra’s actual average lag for product that is sold on terms that are typical for the sale of commodity products from New Zealand. To ensure that this is the case, contracts with more than five months between when a price is set and shipment occurs are not taken into account in determining shipment prices.6
Attachment 3 sets out the average number of months prior to shipment that prices were struck for each quarter over the past three seasons. Attachment 3 also sets out the average percentage of sales contracted in each month prior to shipment in the past three seasons.
FIGURE 2: TIMING OF SUPPLY, PRODUCTION AND SALES VOLUMES
FIGURE 3: AVERAGE LAG BETWEEN WHEN PRICES WERE STRUCK AND SHIPMENT
6 For each of the 2016, 2017 and 2018 Seasons, approximately 5 per cent of Fonterra’s sales of Reference Commodity Products were sold under contracts with more than 5 months between the price being set and shipment occurring.
TABLE 2: WEIGHTED AVERAGE USD CONTRACT PRICE 2016-2018 SEASONS
WEIGHTED AVERAGE PRICE (USD) PER MT
2018 2017 2016 2018/2017 % CHANGE
2017/2016 % CHANGE
WMP 3,091 2,854 2,111 8.3% 35.2%
SMP 1,968 2,216 1,803 -11.2% 22.9%
Butter 5,575 4,221 2,830 32.1% 49.2%
AMF 6,474 5,076 3,227 27.5% 57.3%
BMP 2,057 2,211 1,723 -6.9% 28.3%
9.7% 36.1%
PRICES
The weighted average monthly prices used to calculate Farmgate Milk Price Revenue reflect prices actually achieved by Fonterra on the sale of commodity product on GDT, and on the sale of commodity product with similar specifications at current market prices established on arm’s length terms to customers in freely contestable global markets.
Detailed rules in the Manual dictate which contracts can be taken into account. Contracts that are excluded, for example, include sales to Fonterra subsidiaries.
Between the 2012 and 2016 Seasons, GDT was the sole source of prices for WMP, SMP and AMF, and was a primary reference point for BMP and butter. Off-GDT contracts Fonterra entered into were also used to establish prices for butter and BMP.
Since the 2017 Season, off-GDT contracts have also been used to establish prices for WMP, SMP and AMF. The relevant contracts are for product of a similar specification and sold on similar terms to product sold on GDT. For the 2018 Season, the inclusion of off-GDT sales of WMP, SMP and AMF resulted in an increase of NZD 8 cents per kgMS.
Attachment 1 highlights that WMP, SMP and AMF (2,569,000 MT) accounted for 89 per cent of the Farmgate Milk Price production of Reference Commodity Products (2,886,000 MT).
The average shipment prices incorporate provisions for the lower prices received for ‘downgrade product’. These are products that do not meet manufacturing specifications, some of which may only be suitable for use as stock feed.
Table 2 above shows the weighted average USD contract prices of Reference Commodity Products for the past three seasons. It shows that prices for the Reference Commodity Products increased on average by 9.7 per cent between the 2017 Season and the 2018 Season, compared to an increase of 36.1 per cent between the 2016 Season and the 2017 Season. Average USD prices per MT for each Reference Commodity Product by quarter for the past three seasons are set out in Attachment 4.
2018 SEASON AVERAGE PRICES WERE HIGHER THAN 2017 SEASON BY
9.7%The Manual provides for the conversion of notional USD Farmgate Milk Price receipts to NZD for each month at the average rate at which Fonterra converts its USD-equivalent foreign currency receipts for the month, taking into account the costs and benefits of Fonterra’s hedging activities. Fonterra’s policy is to hedge 100 per cent of net recognised foreign currency trade receivables and payables. It also requires hedging of forecast cash receipts from sales for a period of up to 18 months within limits approved by Fonterra’s Board. Fonterra uses forward foreign exchange contracts and currency options to hedge its foreign exchange risk.
Fonterra’s hedging policy is designed to provide certainty and to reduce the impact on the Farmgate Milk Price of volatility in the NZD, and results in the spot exchange rate at a point in time being reflected in the hedged conversion rate over the subsequent 18 months.
Fonterra’s hedging policy resulted in an average foreign exchange conversion rate for the 2018 Season of USD:NZD 0.7074 against an average spot rate of USD:NZD 0.7039. This resulted in a decrease in the Farmgate Milk Price of 5 cents relative to translation at the spot exchange rate. In comparison:• In the 2017 Season, hedging activities resulted in an increase in the
Farmgate Milk Price of 28 cents relative to translation at the spot exchange rate.
• In the 2016 Season, hedging activities resulted in a decrease in the Farmgate Milk Price of 21 cents relative to translation at the spot exchange rate.
Attachment 5 on page 20 shows the average foreign exchange conversion rate (USD:NZD) for the Farmgate Milk Price Revenue for each quarter in the 2016 to 2018 Seasons, based on Fonterra’s actual hedging contracts in place, compared to the weighted average spot exchange rate for the quarter.
As at 31 July 2018, Fonterra had foreign exchange contracts in place for approximately 73 per cent of the USD-equivalent operating cash flow exposure expected to impact on the Farmgate Milk Price for the 2019 Season. If the balance was hedged based on a spot exchange rate of 0.68217, the average USD:NZD conversion rate would be 70 cents.8
7 The spot exchange rate at 9am on 31 July 2018, the last working day of Fonterra’s 2018 financial year.
8 Fonterra uses currency options as well as forward foreign exchange contracts to hedge its foreign currency receipts. Use of options means the average hedged conversion rate may vary with the spot exchange rate.
Farmgate Milk Price Revenue and Costs CONTINUED
For
per
sona
l use
onl
y
07FONTERRA FARMGATE MILK PRICE STATEMENT 2018
LACTOSE
Lactose is used as an ingredient in the manufacture of WMP, SMP and BMP to achieve a standard protein composition aligned to internationally recognised specifications. Most of the lactose content of milk powders is obtained from the milk supplied to Fonterra. However, a portion is purchased at international prices. Because the cost of purchased lactose depends on global prices and the exchange rate, it is presented in Table 1 as a deduction from Farmgate Milk Price Revenue.
Table 3 provides the basis for the cost of purchased lactose in the 2018, 2017 and 2016 Seasons.
TABLE 3: PURCHASED LACTOSE AND PRICE
SEASON 2018 2017 20162018/2017
% CHANGE2017/2016
% CHANGE
Purchased Lactose (000 MT) 342 351 350 -2.6% 0.5%
Average Price (USD) per MT 908 809 640 12.3% 26.3%
Total Lactose Purchases (USD$m) 311 284 224 9.5% 26.9%
9 Volume Impact considers only the change to milk solids collected in the 2018 Season on the 2017 Season cost base.
FIGURE 4: SOURCES OF MOVEMENTS IN AVERAGE CASH COSTS
0.900
0.950
1.000
1.050
1.100
1.150
1.200
F18One-O�Cost/PriceMovements
VolumeImpact
F17
NZD$ per kgMS
1.1561.1650.001 0.004 0.012
FARMGATE MILK PRICE CASH COSTS
Farmgate Milk Price Cash Costs reflect:• Fonterra’s actual collection costs, and supply chain costs
benchmarked to Fonterra’s actual costs.
• Costs associated with modern plants with sufficient capacity to process all milk collected by Fonterra, located on more than 20 reference manufacturing sites (most of which contain multiple plants) with associated overhead costs. The costs of operating these plants are based on daily processing capacities that match Fonterra’s averages, and on operating parameters that reflect manufacturers’ specifications and Fonterra’s per-unit costs.
• Overhead and selling costs that are typical of a commodity-only business that sells product from New Zealand. Overhead costs are calculated by reference to Fonterra’s actual costs, but exclude costs that are attributable to the much broader scope of Fonterra’s business. Selling costs reflect the cost of selling product on GDT and through the relevant off-GDT channels, having regard to the volume of product assumed to be sold through each sales channel.
Figure 4 and Table 4 summarise the major categories of cash costs and the sources of movements in each category between the 2017 and 2018 Seasons.
The movements in costs are inclusive of the following:• Milk supply decreased by 1.4 per cent in the 2018 Season compared
to the 2017 Season. This resulted in a net increase in costs of 0.1 cents per kgMS, comprising the net impact of fixed costs being spread across lower supply, offset by a reduction in costs due to a different product mix.
• Costs decreased by an average of 0.4 cents per kgMS, due to the net impact of price movements and cost saving initiatives.
• An allowance for one-off costs of NZD$10 million, or 0.7 cents per kgMS, compared to net one-off benefits of NZD$8 million in the 2017 Season.
Farmgate Milk Price Revenue and Costs CONTINUED
For
per
sona
l use
onl
y
08 FONTERRA FARMGATE MILK PRICE STATEMENT 2018
FARMGATE MILK PRICE CAPITAL COSTS
The Milk Price Model uses ‘standard’ plants to calculate both operating and plant-related capital costs. These plants have capacities that approximate Fonterra’s average daily capacities for each type of plant and reflect current technology of the type typically employed across the industry.10
The standard plants are smaller than Fonterra’s newest large manufacturing plants, such as the drier installed at Fonterra’s Darfield Site in Canterbury in 2013 and the drier installed at Lichfield in 2016, but are larger and more efficient than Fonterra’s older smaller plants.
The basis for deriving the benchmark depreciation, tax costs and capital charge is set out in detail in the Manual. In broad terms:• The capital charge on fixed assets is designed to recover the full cost
(through a depreciation charge) of the manufacturing and other assets required to manufacture Reference Commodity Products over the assets’ economic lives, and to generate a return at the benchmark Weighted Average Cost of Capital (WACC, see below) on the undepreciated balance each year.
• The capital charge is calculated in a manner that results in it growing each year approximately in line with capital goods inflation, as long as the WACC does not change. This means that changes in the average age of the asset base do not result in material year-on-year movements in the capital charge, and therefore in the Farmgate Milk Price.
• The Farmgate Milk Price cost base also includes a provision for a capital charge on the monthly net working capital balances implied by the sale and manufacture of the Reference Commodity Products, and by the phasing of Fonterra’s payments for milk to its suppliers. Each of these items varies somewhat between years, resulting in some annual variation in this element of the capital charge.
• The WACC used to determine the capital charge is specified on an after-tax basis, so the Farmgate Milk Price cost base includes a separate provision for corporate tax. This amount is a relatively constant proportion of the WACC charges on fixed assets and net working capital each year.
Table 5 shows the capital costs and the total book value of the Farmgate Milk Price fixed asset base and monthly average net working capital for the 2018, 2017 and 2016 Seasons.
Two matters are relevant to a comparison of capital costs between the 2018 and 2017 Seasons:• In the 2018 Season, the WACC was 5.4 per cent, down from
5.6 per cent in 2017. By itself, this change resulted in a reduction of NZD$14 million in the capital charge on fixed assets, a reduction of NZD$1 million in the charge on net working capital, and a reduction of NZD$6 million in the tax charge, partially offset by a higher depreciation of NZD$4 million.
• NZD$10 million of the reduction in the WACC charge on net working capital between 2017 and 2018 is attributable to the later timing, on average, of payments for milk in 2018 relative to 2017, which resulted in lower average net working capital. The balance of the reduction in the WACC charge on net working capital is mainly attributable to updated assumptions regarding average payment days for receivable and payable balances.
10 The average daily processing capacity of the standard WMP and SMP plants installed prior to the 2013 Season is approximately 1.9 million litres. Incremental and replacement WMP and SMP plants incorporated in the asset base since the 2013 Season have an average daily processing capacity of approximately 2.5 million litres, equivalent to the plants installed by Fonterra at Darfield in 2011 and Pahiatua in 2015.
11 See, for example, http://www.comcom.govt.nz/regulated-industries/input-methodologies-2/input-methodologies-review/cost-of-capital-im-review/
CALCULATION OF BENCHMARK WEIGHTED AVERAGE COST OF CAPITAL (WACC)
The WACC used to determine the Fixed Asset Capital Charges and the Net Working Capital Charge is calculated using the ‘simplified Brennan Lally’ methodology employed by the Commerce Commission.11 The methodology applied through to the 2011 Season provided for input parameters into the WACC to be updated every four years. Consequently, the WACC was held constant at 8.5 per cent between the 2009 and 2011 Seasons, and reflected market interest rates as of mid-2008. From the 2012 Season, the methodology was revised to be based on rolling five-year averages of market interest rates, including the five-year New Zealand Government stock rate, resulting in a reduction in the WACC from 7.7 per cent for the 2012 Season to 6.8 per cent for the 2014 Season.
In the 2015 Season, the WACC methodology was changed to incorporate a ‘specific risk premium’ of 0.15 per cent and a reduction in the asset beta from 0.45 to 0.38, on the basis of a review by an independent expert, Associate Professor Alastair Marsden of the University of Auckland. At the request of the Commerce Commission Dr Marsden undertook further analysis in the 2016, 2017 and 2018 Seasons, the result of which was to confirm his previous recommendation. The 2018 Season WACC was 5.4 per cent and the 2019 Season WACC as calculated under the existing methodology and assumptions will be 5.3 per cent, both reflecting further reductions in five-year average government stock rates.
TABLE 5: CAPITAL COSTS, BOOK VALUE OF FIXED ASSET BASE AND AVERAGE NET WORKING CAPITAL
NZD$ MILLION 2018 2017 2016
WACC rate % (post-tax) 5.4% 5.6% 5.9%
Depreciation 262 265 266
WACC charge – fixed assets 374 398 407
WACC charge – net working capital 36 55 73
Tax 144 155 169
Total capital costs 817 873 915
Total fixed assets (book value) 7,021 7,195 6,961
Average Net Working Capital 729 913 1,308
Farmgate Milk Price Revenue and Costs CONTINUED
For
per
sona
l use
onl
y
09FONTERRA FARMGATE MILK PRICE STATEMENT 2018
Farmgate Milk Price Manual Changes
Since the Manual was introduced in the 2009 Season, various minor refinements have been made as practical issues were identified and addressed. Such refinements are to be expected given the importance to Fonterra of ensuring the Farmgate Milk Price approach is robust. Any modification to the Manual is required to be consistent with the Milk Price Principles which are set out in both the Manual and Fonterra’s Constitution.
The Manual itself also allows for adjustments to various parameters. An example of this is the Detailed Rule that allows for the addition of new Reference Commodity Products if certain conditions established in the Manual are met.12 The Manual also provides for reviews of various aspects of the Manual to be carried out at least once every four years. These reviews can result in changes to the application of rules in the Manual or inputs into the Farmgate Milk Price. A review of overhead costs was undertaken in the 2015 and 2016 Seasons and the results were incorporated into the 2016 Farmgate Milk Price. A further review will be undertaken in the 2019 Season and the results will be incorporated in the 2020 Farmgate Milk Price.
As noted in Appendix 1, the Commerce Commission’s final report on the 2017/18 Manual was released on 15 December 2017.
The Board approved a number of amendments to the Manual in July 2018, which will take effect from the 2019 Season. The updated version of the Manual is available on www.fonterra.com. None of the amendments have any impact on the quantum of the Farmgate Milk Price.
The only substantive amendments were focused on creating better alignment between the Manual and the terminology used by Fonterra in other contexts with respect to communications around the Milk Price.
For the 2019 Season, the Manual has been updated to explicitly define the Farmgate Milk Price as the average price paid for milk supplied on standard terms of supply, and to provide that this amount is calculated as follows:
1. The aggregate amount calculated under the Manual, now defined as the Aggregate Commodity Milk Payments Amount.
2. Less the net amount of all premiums and discounts, calculated relative to the Farmgate Milk Price, applied to payments for milk supplied other than on standard terms of supply where (and to the extent) the Panel determines it would be commercially appropriate for the Notional Commodity Business to source that milk on the relevant terms for conversion into RCPs (Additional Commodity Milk Payments). Amounts currently captured under this definition would include the portion of Winter Milk premiums funded from the Milk Price and discounts for contract milk.
3. Plus the net amount arising from adjustments to payments for milk supplied under Fonterra’s standard terms of supply, such as where milk quality demerits have been applied (Standard Supply Adjustments).
4. Equals the Aggregate Farmgate Milk Price.
The Farmgate Milk Price is then defined as the Aggregate Farmgate Milk Price divided by total kilograms of milk solids supplied to Fonterra.
The amendments also codify in the Manual the Panel’s responsibility for determining which payments for milk should not be funded from the Aggregate Commodity Milk Payments Amount. These payments primarily comprise the portion of payments for milk explicitly sourced for the manufacture of value-add products, such as organic products, to the extent the total payment for the milk exceeds the amount a commodity processor would rationally pay if the milk was acquired for the production of RCPs.
12 Rule 3 in Part B of the Manual.
For
per
sona
l use
onl
y
10 FONTERRA FARMGATE MILK PRICE STATEMENT 2018
Changes in Approachto the Calculation
Fonterra included in the 2015 Manual an undertaking to disclose any changes to the application of the Manual that result in materially different values of any input into the Farmgate Milk Price calculation.
There were no changes in the application of the Manual for the 2018 Season that resulted in materially different values of inputs into the Farmgate Milk Price calculation.
For
per
sona
l use
onl
y
11FONTERRA FARMGATE MILK PRICE STATEMENT 2018
Changes in matters under Fonterra’s control – the Manual and the calculation methodology – and the external environment have resulted in a significant ‘structural’ increase in the Farmgate Milk Price since its introduction in the 2009 Season. Indicatively, if the approaches used in 2009 to determine key inputs into the Farmgate Milk Price were still used today, the Farmgate Milk Price calculated under the Manual for the 2018 Season would have been only NZD$6.23.
Since 2012 Fonterra has set out in the Farmgate Milk Price Statement the impact of significant changes in calculation methodology and to the Manual on the Farmgate Milk Price for that year. The cumulative impact on the 2018 Season Farmgate Milk Price of a number of significant changes made since the 2009 Season is approximately 29.6 cents per kgMS. The most significant drivers of this 29.6 cents per kgMS impact are:• Changes impacting on net revenue.
• Changes impacting on cash costs.
• Changes impacting on capital costs.
More information about each of those three drivers is set out later in this section.
In addition, the significant reduction in market interest rates since 2008, which has resulted in a reduction in the WACC, coupled with the reduction in the company tax rate in 2012 to 28 per cent, has resulted in a further increase of approximately 22.2 cents per kgMS in the Farmgate Milk Price for 2018, relative to the inputs used in 2009.
APPROACH
To estimate the impact on the Farmgate Milk Price of various changes made over time to the calculation methodology, we populated the financial model used to calculate the Farmgate Milk Price for the 2018 Season with the values of key variables (adjusted where relevant for inflation) used to determine the Farmgate Milk Price for the 2009 Season. Key limitations of this approach include:• The precise impact of a number of changes depends on a number
of factors that vary across years, including commodity prices, the volume of milk collected and product mix. Consequently, the values reported below should be regarded as being indicative only.
• For inputs that are derived from Fonterra’s actual revenue or costs, the analysis does not capture the impact of any changes in Fonterra’s performance impacting on the value of those inputs.
• We have not attempted to estimate the 2018-equivalent values of all inputs into the 2009 Season Farmgate Milk Price.13 The impact of extending the analysis to include these inputs could go in either direction.
• The analysis does not capture the impact of the growth in milk collected by Fonterra, from 1.281 billion kgMS in the 2009 Season to 1.505 billion kgMS in 2018.14
CHANGES IMPACTING ON NET REVENUE
Three categories of changes have resulted in increases in the amount of net revenue per kgMS, at a given level of commodity prices and foreign exchange. The net impact of these changes on the 2018 Farmgate Milk Price, relative to the corresponding 2009 values, is an increase of 13.7 cents per kgMS.15 These are:• Improvements in assumed yields and losses, including lactose losses.
• A reduction in the percentage of product that is assumed to be ‘downgraded’ and sold at lower prices.
• The incorporation of margins between the cost to Fonterra and amounts charged to customers for services such as ocean freight and minor variations in product composition relative to ‘base’ composition.
CHANGES IMPACTING ON CASH COSTS
Changes in the calculation methodology have resulted in a net reduction of 9.7 cents in cash costs per kgMS, relative to 2009.
The most significant of these changes related to:• A revised approach to setting sales costs in 2010, which implies
a 10.4 cents per kgMS reduction in sales costs, relative to the previous approach, in 2018.
• Structural increases in repairs and maintenance costs (3.4 cents per kgMS) and energy costs (1.2 cents per kgMS), reflecting a change in maintenance policy and various revisions to energy usage assumptions.
• A net 3.9 cents per kgMS decrease in the allowances for various manufacturing costs and the lower labour costs associated with the manufacturing plants assumed to be installed from 2012 onward.
CHANGES IMPACTING ON CAPITAL COSTS
Three key structural changes have been made to the approach taken to setting inputs into the calculation of capital costs. The net impact of these changes is a 6.2 cents per kgMS increase in the Farmgate Milk Price, relative to the 2009 methodology. These are:• The reduction in 2015 in the asset beta from 0.45 to 0.38, partially
offset by the introduction of a specific risk premium of 0.15, following an independent review by Dr Alastair Marsden, and the inclusion in 2013 of an allowance for debt issuance costs. The impact of these changes in 2018 is an increase of 1.3 cents per kgMS.
• The alignment, first undertaken in 2013, of key working capital assumptions to values actually achieved by Fonterra with respect to sales and purchases relevant to the Farmgate Milk Price. Relative to the assumptions employed in 2009, the current assumptions imply lower working capital costs of 3.2 cents per kgMS.
• Various changes in capital cost inputs, implying a net decrease in capital costs of 1.7 cents per kgMS.
13 The focus is on changes considered significant, either due to the magnitude of the change or because the issue has been the subject of particular focus by the Commerce Commission in the course of its annual reviews under subpart 5A of DIRA, such as inputs into the WACC.
14 Indicatively, the increase in milk supply has resulted in a further increase in the Farmgate Milk Price of approximately 7 - 9 cents per kgMS, due to fixed costs being spread across higher milk volumes. Equivalently, the 2018 Season Farmgate Milk Price would have been only around NZD$6.14 - NZD$6.16 if milk supply, as well as the calculation methodology and interest rates, had remained at its 2009 Season level.
15 We have not included the impact of the inclusion in 2017 of certain off-GDT sales of WMP, SMP and AMF as discussed on page 6 as off-GDT sales of those products were also included in the 2009 Milk Price.
Cumulative Impact of Changes in Methodology Between 2009 and 2018 Seasons
For
per
sona
l use
onl
y
12 FONTERRA FARMGATE MILK PRICE STATEMENT 2018
Appendix 1:Farmgate Milk Price Overview
16 From the 2017 Season, a mixture of on-GDT and off-GDT prices were used for all Reference Commodity Product prices.
RATIONALE FOR FARMGATE MILK PRICE
Fonterra currently collects around 82 per cent of New Zealand’s milk production. Because Fonterra purchases such a large proportion of New Zealand’s total milk, there is no ‘market price’ for milk that is independent of the price paid by Fonterra. As a result, since its formation in 2001, Fonterra has calculated a Farmgate Milk Price that enables total returns to be allocated between payments for milk and returns on the capital invested by Fonterra farmer shareholders and by unit holders in the Fonterra Shareholders’ Fund.
FARMGATE MILK PRICE METHODOLOGY
The Farmgate Milk Price has been calculated in accordance with the Manual by:• Determining the revenue that Fonterra would earn if the equivalent
of all the milk Fonterra collects were converted into commodity specifications of WMP and SMP, and their by-products, which are butter, AMF and BMP. These products are referred to in the Manual as ‘Reference Commodity Products’. Prices reflect USD prices achieved on the twice-monthly GDT trading events, or prices achieved by Fonterra in off-GDT sales, all of which use the most recent relevant GDT price as a key reference point. Selling prices are converted to NZD using Fonterra’s actual average monthly foreign exchange conversion rate.16
• Deducting costs, including the cost of transporting raw milk to factories, and the cost of efficiently manufacturing Reference Commodity Products and then transporting them to the point of export from New Zealand, along with selling and administration expenses. These costs also include amounts for depreciation of fixed assets and an appropriate return on investment, including investment in working capital.
The balance comprises the Farmgate Milk Price. While this is an aggregate amount, it is usually referred to on the basis of a Farmgate Milk Price per kgMS.
RATIONALE FOR REFERENCE COMMODITY PRODUCTS
Manufacture of the Reference Commodity Products comprised approximately 72 per cent of Fonterra’s total New Zealand ingredients production in the 2018 Season.
Almost all additional milk collected over the past decade in New Zealand by Fonterra and its competitors has been used to make milk powders. Because returns from the sale of milk powders and their by-products represent the ‘marginal’ returns that would drive the price of milk in a competitive market in New Zealand, the Farmgate Milk Price is based on these products. Returns from non-powder commodities, such as cheese and casein, have largely been irrelevant in driving investment in the dairy industry over the past 10 years and are therefore not taken into account in determining the Farmgate Milk Price.
The Farmgate Milk Price approach does not include any returns earned by Fonterra from specialised ingredients and consumer branded products. These types of products earn premiums over the returns to standard commodity ingredients. It is therefore appropriate that these premiums are recognised in Fonterra’s earnings rather than in the Farmgate Milk Price.
FARMGATE MILK PRICE GOVERNANCE
The Fonterra Board sets the total amount to be paid by Fonterra for all milk supplied to it in New Zealand in each season. For the 2018 Season, this is made up of the Aggregate Commodity Milk Payments Amount and the aggregate amount of premiums that exceed the amount a commodity processor would be willing to pay for milk sourced specifically for value-add applications.
Both Fonterra’s Constitution and the Dairy Industry Restructuring Act (2001) (DIRA) require Fonterra to maintain the Manual, which sets out Fonterra’s policies and methodology for determining the Farmgate Milk Price. The Manual must reflect the Milk Price Principles set out in Fonterra’s Constitution. The Farmgate Milk Price has been calculated in accordance with the Manual since the start of the 2009 Season.
The Fonterra Board has established a robust governance structure to oversee the setting of the Farmgate Milk Price, which comprises the elements illustrated in the diagram on page 13.
1 MILK PRICE PANEL
The Milk Price Panel plays a key role in overseeing the integrity of the Farmgate Milk Price. It has five members. Two are Fonterra-appointed directors (one of whom is the Chair), one is a Fonterra farmer-elected director and two are appropriately qualified nominees of the Fonterra Shareholders’ Council.
The current members of the Panel are: Scott St John (Chair) and Bruce Hassall, who are appointed Fonterra directors; Brent Goldsack, who is a farmer-elected Fonterra director; and Andrew Wallace and Bill Donaldson, who are nominees of the Fonterra Shareholders’ Council.
The Panel oversees the governance of the Farmgate Milk Price and the Manual, including changes to the Manual and verification by independent external experts of key parameters (such as resource usage rates, product yields and fixed manufacturing costs).
For
per
sona
l use
onl
y
13FONTERRA FARMGATE MILK PRICE STATEMENT 2018
The Panel is responsible for:• Overseeing the calculation of the Farmgate Milk Price and
making a recommendation on it to the Fonterra Board.
• Providing recommendations to the Fonterra Board on changes to the Manual.
• Providing assurance to the Fonterra Board that the Farmgate Milk Price has been calculated each year in accordance with the Manual.
The Fonterra Board is responsible for the forecast of the annual Farmgate Milk Price.
2 MILK PRICE GROUP
The Milk Price Group is a working group established by Fonterra. The Head of the Milk Price Group is independent of Fonterra’s management and reports directly to the Chair of the Milk Price Panel. The role of the Milk Price Group includes:• Ensuring that the Farmgate Milk Price is calculated in accordance
with the Manual and making recommendations in respect of the Farmgate Milk Price to the Panel.
• Considering any proposed amendments to the Manual, including those the Milk Price Group itself considers are appropriate, and ensuring they are in accordance with the Milk Price Principles in Fonterra’s Constitution.
• Providing assurance to the Fonterra Board over the calculation of the forecast of the Farmgate Milk Price.
• Managing engagement with external reviewers.
• Engaging with the Commerce Commission, including to ensure full disclosure of all material aspects of the Farmgate Milk Price derivation each year.
The functions of the Milk Price Group are contracted out to Ernst & Young and other technical experts who are not employees of Fonterra.
3 EXTERNAL REVIEWERS
External reviewers provide expert advice on various inputs, as well as assurance over the accuracy of financial models. In addition, they participate in reviews of key parameters of the Farmgate Milk Price at regular intervals (which can be up to four years).
EXTERNAL AUDITOR
The external auditor audits the Farmgate Milk Price each year and provides assurance that the Farmgate Milk Price has been determined in accordance with the Milk Price Principles, Methodologies and Detailed Rules of the Farmgate Milk Price Manual. Fonterra’s external auditor is PricewaterhouseCoopers.
Subpart 5A of DIRA, which was passed into law in July 2012, gives the Commerce Commission an oversight role with respect to Fonterra’s Farmgate Milk Price.
The purpose of Subpart 5A is to promote the setting of a Farmgate Milk Price that provides an incentive to Fonterra to operate efficiently, while providing for contestability in the market for the purchase of milk from farmers (section 150A). Each year, the Commission is required to review and report on the extent to which the Manual and Fonterra’s actual Farmgate Milk Price are consistent with this purpose:• The Commerce Commission’s final report on the Manual for the
2017/18 Season was released on 15 December 2017 and can be found at https://comcom.govt.nz/regulated-industries/dairy/milk-price-manual-and-calculation/milk-price-manual/milk-price-manual-201718-season
• The final report on the F18 Farmgate Milk Price calculation was released on 14 September 2018 and can be found at https://comcom.govt.nz/regulated-industries/dairy/milk-price-manual-and-calculation/milk-price-calculation/milk-price-calculation-201718-season
6 INTERNAL AUDIT
Fonterra’s internal audit team provides assurance over the processes and controls relating to Fonterra data used in the calculation of the Farmgate Milk Price.
7 FONTERRA SENIOR MANAGERS
Fonterra senior managers provide internal oversight of the calculation of the actual and forecast Farmgate Milk Price in accordance with the Manual and detailed models and procedures.
EXTERNAL2
Milk Price Group
3External Reviewers
4External Auditor
INTERNAL7
Fonterra Senior Managers
6Internal Audit
5Commerce Commission
BOARD MAKES DECISIONS ON THE RECOMMENDATIONS OF THE MILK PRICE PANEL
MILK PRICE PANEL1
2 x Appointed Fonterra Directors (one being Chair)
1 x Fonterra Farmer Director
2 x Shareholder Council Appointees+
Farmgate Milk Price Manual
Appendix 1:Farmgate Milk Price Overview CONTINUED
Source: Fonterra
4
For
per
sona
l use
onl
y
14 FONTERRA FARMGATE MILK PRICE STATEMENT 2018
Appendix 2:Independent Assurance ReportTO THE DIRECTORS OF FONTERRA CO-OPERATIVE GROUP LIMITED
Scope We have audited the application of the Principles, Methodologies and Detailed Rules as defined in the Farmgate Milk Price Manual of 1 August 2017 (the Manual) by the Milk Price Group (MPG) in deriving the ‘aggregate amount available to pay’ for New Zealand supplied milk for the season ended 31 May 2018 of NZ$10.153 billion, which is referred to as the Aggregate Commodity Milk Payments Amount in the Farmgate Milk Price Statement. We have confirmed the balances contained in the Farmgate Milk Price Statement for the season ended 31 May 2018 (the Farmgate Milk Price Statement) are correctly extracted from the calculation of the Farmgate Milk Price.
Information other than our scope and the assurance report The Directors are responsible for the Farmgate Milk Price Statement. Our opinion on the Farmgate Milk Price Statement does not cover information other than the balances we confirm have been correctly extracted from the calculation of the Farmgate Milk Price and we do not express any form of assurance conclusions on the other information.In connection with our scope, our responsibility is to read the other information and, in doing so, consider whether the other information is materially inconsistent with the Farmgate Milk Price Statement or our knowledge obtained in the audit, or otherwise appears to be materially misstated. If, based on the work we have performed on the other information that we obtained prior to the date of this assurance report, we conclude that there is a material misstatement of this other information, we are required to report that fact. We have nothing to report in this regard.
Milk Price Group’s Responsibilities The MPG are responsible for the calculation of the Farmgate Milk Price based upon the Manual, ensuring the Farmgate Milk Price has been derived in accordance with the Principles, Methodologies and Detailed Rules set out in the Manual. The MPG is also responsible for the preparation of the Farmgate Milk Price Statement.
Our Independence and Quality ControlWe have complied with the independence and other ethical requirements of Professional and Ethical Standard 1 (Revised) issued by the New Zealand Auditing and Assurance Standards Board, which is founded on the fundamental principles of integrity, objectivity, professional competence and due care, confidentiality and professional behaviour. The firm applies Professional and Ethical Standard 3 (Amended) and accordingly maintains a comprehensive system of quality control including documented policies and procedures regarding compliance with ethical requirements, professional standards, and applicable legal and regulatory requirements. Bruce Hassall was appointed an Independent Director and Chair of the Audit and Finance Committee of Fonterra Co-operative Group Limited (Fonterra) on 2 November 2017 and appointed a member of the Milk Price Panel on 7 December 2017. Bruce Hassall was Chief Executive Officer of PricewaterhouseCoopers to 30 September 2016 when he retired from the firm. Brent Goldsack was appointed a Director of Fonterra on 2 November 2017 and a member of the Milk Price Panel on 13 December 2017. Brent Goldsack retired as a partner of PricewaterhouseCoopers on 22 September 2017. Brent Goldsack was not involved in the provision of any audit services to Fonterra during his time as a partner of PricewaterhouseCoopers.Bruce Hassall and Brent Goldsack had no financial relationship with PricewaterhouseCoopers upon their appointment as Directors of Fonterra and members of the Milk Price Panel. The engagement partner on the audit has direct access to the Chair of the Milk Price Panel, Scott St John, to address any actual or perceived auditor independence threats.Our firm carries out assurance services for Fonterra to assess food fraud risks and controls in relation to Fonterra’s food supply chain, as well as other assurance and attestation services. Partners and employees of our firm may deal with Fonterra on normal terms within the ordinary course of trading activities of Fonterra.These matters have not impaired our independence as auditor of Fonterra.
Independent Auditors’ Responsibilities We are responsible for expressing an independent opinion on whether the MPG has complied, in all material respects, with the Principles, Methodologies and Detailed Rules set out in the Manual in deriving the Farmgate Milk Price, and that the balances, in all material respects, in the Farmgate Milk Price Statement have been correctly extracted from those calculations, and reporting our opinion to you.We conducted our independent assurance engagement in accordance with ISAE (NZ) 3000 Assurance Engagements Other than Audits or Reviews of Historical Financial Information and SAE 3100 Compliance Engagements issued in New Zealand. Those standards require that we comply with ethical requirements and plan and perform our procedures to obtain reasonable assurance about whether, the MPG has complied, in all material respects, with Principles, Methodologies and Detailed Rules of the Manual in deriving the Farmgate Milk Price, and that the balances, in all material respects, in the Farmgate Milk Price Statement have been correctly extracted from those calculations.
Inherent LimitationsOur engagement includes examining, on a test basis, evidence relevant to the amounts used to derive the Farmgate Milk Price and the balances in the Farmgate Milk Price Statement. It also includes assessing the significant assumptions, estimates and judgements made by the MPG in the calculation of the Farmgate Milk Price and ensuring the Principles, Methodologies and Detailed Rules applied are consistent with those set out in the Manual. Because of the inherent limitations, it is possible that fraud, error or non-compliance may occur and not be detected. As the procedures performed are undertaken on a test basis, our assurance engagement cannot be relied on to detect all instances where the Principles, Methodologies and Detailed Rules set out in the Manual have not been complied with. Our opinion expressed in this report has been formed on that basis.
Independent Assurance Opinion In our opinion the MPG has complied, in all material respects, with the Principles, Methodologies and Detailed Rules in the Manual in deriving the ‘aggregate amount available to pay’ for New Zealand supplied milk for the season ended 31 May 2018 of NZ$10.153 billion, which is referred to as the Aggregate Commodity Milk Payments Amount in the Farmgate Milk Price Statement. We have confirmed the balances contained in this Farmgate Milk Price Statement for the season ended 31 May 2018 are correctly extracted, in all material respects, from the Farmgate Milk Price calculation.
Restriction on Distribution or UseThis report is made solely to the Directors. Our report has been prepared at the request of the Directors and for no other purpose. To the fullest extent permitted by law we do not accept or assume responsibility to anyone other than Fonterra for this report, or for the opinions we have formed.
PricewaterhouseCoopers Auckland, New Zealand 12 September 2018
For
per
sona
l use
onl
y
15FONTERRA FARMGATE MILK PRICE STATEMENT 2018
Attachment 1: Milk Supplied and Production Volumes
2018 SEASONMILK SUPPLIED (MILLION kgMS) PRODUCTION (000 MT) OF FINISHED PRODUCT
WMP SMP BUTTER AMF BMP TOTAL
Jun 17 to Aug 17 122 152 48 15 15 5 235
Sep 17 to Nov 17 579 714 228 101 50 21 1,114
Dec 17 to Feb 18 470 537 204 96 42 20 899
Mar 18 to May 18 334 452 98 47 28 13 639
Total 1,505 1,856 577 258 136 59 2,886
2017 SEASONMILK SUPPLIED (MILLION kgMS) PRODUCTION (000 MT) OF FINISHED PRODUCT
WMP SMP BUTTER AMF BMP TOTAL
Jun 16 to Aug 16 122 134 59 16 19 5 234
Sep 16 to Nov 16 573 668 250 98 59 23 1,098
Dec 16 to Feb 17 500 604 200 88 46 20 957
Mar 17 to May 17 331 421 110 54 30 14 630
Total 1,526 1,826 619 256 154 63 2,918
2016 SEASONMILK SUPPLIED (MILLION kgMS) PRODUCTION (000 MT) OF FINISHED PRODUCT
WMP SMP BUTTER AMF BMP TOTAL
Jun 15 to Aug 15 127 165 44 11 18 5 243
Sep 15 to Nov 15 609 727 255 99 64 24 1,169
Dec 15 to Feb 16 515 587 225 100 49 22 984
Mar 16 to May 16 315 382 115 51 35 15 597
Total 1,566 1,862 639 261 166 65 2,993
For
per
sona
l use
onl
y
16 FONTERRA FARMGATE MILK PRICE STATEMENT 2018
2018 SEASON SHIPMENTS (000 MT) OF FINISHED PRODUCT
WMP SMP BUTTER AMF BMP TOTAL SALES
Aug 17 to Oct 17 217 81 18 15 9 340
Nov 17 to Jan 18 654 227 77 31 19 1,007
Feb 18 to Apr 18 476 146 69 32 16 739
May 18 to Jul 18 448 104 73 52 13 691
Aug 18 to Oct 18 61 19 22 5 2 109
Total 1,856 577 258 136 59 2,886
2017 SEASON SHIPMENTS (000 MT) OF FINISHED PRODUCT
WMP SMP BUTTER AMF BMP TOTAL SALES
Aug 16 to Oct 16 257 104 27 30 2 419
Nov 16 to Jan 17 616 222 86 50 17 991
Feb 17 to Apr 17 405 115 62 29 16 628
May 17 to Jul 17 485 155 59 39 24 761
Aug 17 to Oct 17 62 24 23 6 3 118
Total 1,826 619 256 154 63 2,918
2016 SEASON SHIPMENTS (000 MT) OF FINISHED PRODUCT
WMP SMP BUTTER AMF BMP TOTAL SALES
Aug 15 to Oct 15 195 31 14 16 0 255
Nov 15 to Jan 16 712 281 94 71 25 1,184
Feb 16 to Apr 16 413 147 58 27 13 658
May 16 to Jul 16 447 147 65 41 19 720
Aug 16 to Oct 16 94 33 29 11 9 176
Total 1,862 639 261 166 65 2,993
Attachment 2: Sales Volumes
For
per
sona
l use
onl
y
17FONTERRA FARMGATE MILK PRICE STATEMENT 2018
Attachment 3: Average Number of Months Prior to Shipment that Prices were Struck
2018 SEASON AVERAGE NUMBER OF MONTHS PRIOR TO SHIPMENT
WMP SMP BUTTER AMF BMP
Aug 17 to Oct 17 2.9 3.1 3.2 2.8 3.6
Nov 17 to Jan 18 2.7 3.0 2.7 2.8 2.6
Feb 18 to Apr 18 3.0 3.1 2.7 2.5 3.2
May 18 to Jul 18 2.5 2.8 2.5 2.4 2.4
Aug 18 to Oct 18 2.9 3.1 2.7 3.1 4.0
2.7 3.0 2.7 2.6 2.9
2017 SEASON AVERAGE NUMBER OF MONTHS PRIOR TO SHIPMENT
WMP SMP BUTTER AMF BMP
Aug 16 to Oct 16 2.9 3.2 3.0 2.8 2.7
Nov 16 to Jan 17 3.1 3.1 3.2 3.1 2.6
Feb 17 to Apr 17 2.6 2.9 2.9 2.8 2.4
May 17 to Jul 17 2.6 2.5 2.5 2.6 2.7
Aug 17 to Oct 17 3.7 3.8 3.1 3.7 3.6
2.9 3.0 2.9 2.9 2.7
2016 SEASON AVERAGE NUMBER OF MONTHS PRIOR TO SHIPMENT
WMP SMP BUTTER AMF BMP
Aug 15 to Oct 15 3.1 2.7 2.8 2.8 N/A17
Nov 15 to Jan 16 3.1 3.4 2.8 3.3 3.3
Feb 16 to Apr 16 2.8 3.0 2.9 2.7 2.6
May 16 to Jul 16 2.9 2.8 2.6 2.6 3.2
Aug 16 to Oct 16 2.9 2.9 2.9 3.3 2.9
3.0 3.1 2.8 3.0 3.0
The tables on the next page supplement those above by providing information on the average percentages of sales contracted in each of months 1 to 5 prior to shipment in the 2016 to 2018 Seasons.
17 Not applicable: No BMP sales informed the Farmgate Milk Price Revenue in this quarter.
For
per
sona
l use
onl
y
18 FONTERRA FARMGATE MILK PRICE STATEMENT 2018
AVERAGE % OF SALES CONTRACTED IN EACH MONTH PRIOR TO SHIPMENT
2018 SEASON AVERAGE PERCENTAGE OF SALES CONTRACTED IN EACH OF MONTHS 1-5 PRIOR TO SHIPMENT
WMP SMP BUTTER AMF BMP
1 12% 7% 16% 16% 12%
2 35% 33% 36% 35% 36%
3 25% 27% 22% 29% 23%
4 18% 21% 18% 13% 12%
5 9% 13% 10% 7% 17%
2017 SEASON AVERAGE PERCENTAGE OF SALES CONTRACTED IN EACH OF MONTHS 1-5 PRIOR TO SHIPMENT
WMP SMP BUTTER AMF BMP
1 11% 9% 9% 10% 11%
2 31% 31% 29% 29% 33%
3 29% 27% 29% 32% 37%
4 18% 19% 18% 20% 18%
5 11% 13% 14% 9% 1%
2016 SEASON AVERAGE PERCENTAGE OF SALES CONTRACTED IN EACH OF MONTHS 1-5 PRIOR TO SHIPMENT
WMP SMP BUTTER AMF BMP
1 8% 6% 7% 10% 7%
2 33% 29% 37% 33% 32%
3 28% 28% 32% 28% 24%
4 19% 24% 17% 19% 29%
5 13% 13% 6% 11% 8%
Attachment 3: Average Number of Months Prior to Shipment that Prices were Struck CONTINUED
For
per
sona
l use
onl
y
19FONTERRA FARMGATE MILK PRICE STATEMENT 2018
2018 SEASON USD PER MT OF FINISHED PRODUCT
SHIPMENT PERIOD WMP SMP BUTTER AMF BMP
Aug 17 to Oct 17 3,172 2,080 5,848 6,574 2,186
Nov 17 to Jan 18 3,058 1,971 5,886 6,644 1,996
Feb 18 to Apr 18 2,937 1,859 5,303 6,637 2,007
May 18 to Jul 18 3,244 2,006 5,461 6,266 2,113
Aug 18 to Oct 18 3,233 2,078 5,494 6,252 2,041
3,091 1,968 5,575 6,474 2,057
Full season GDT-only prices18 3,056 1,951 5,464 6,422 2,038
2017 SEASON USD PER MT OF FINISHED PRODUCT
SHIPMENT PERIOD WMP SMP BUTTER AMF BMP
Aug 16 to Oct 16 2,271 1,919 2,936 3,840 1,767
Nov 16 to Jan 17 2,709 2,236 3,589 4,655 2,338
Feb 17 to Apr 17 3,250 2,576 4,388 5,497 2,656
May 17 to Jul 17 3,005 2,135 5,016 6,073 1,900
Aug 17 to Oct 17 2,951 2,102 5,601 6,270 1,909
2,854 2,216 4,221 5,076 2,211
Full season GDT-only prices 2,837 2,188 4,184 4,977 2,172
2016 SEASON USD PER MT OF FINISHED PRODUCT
SHIPMENT PERIOD WMP SMP BUTTER AMF BMP
Aug 15 to Oct 15 1,957 1,480 2,467 2,732 N/A19
Nov 15 to Jan 16 2,093 1,789 2,769 3,093 1,868
Feb 16 to Apr 16 2,239 1,950 3,000 3,654 1,732
May 16 to Jul 16 2,065 1,765 2,832 3,331 1,567
Aug 16 to Oct 16 2,221 1,732 2,853 3,374 1,632
2,111 1,803 2,830 3,227 1,723
Attachment 4: Average USD Prices
18 Full season GDT-only prices were disclosed for the first time for the 2017 Season, following the inclusion of off-GDT sales of WMP, SMP and AMF in the Farmgate Milk Price. Quarterly prices are the total weighted average prices informing the Farmgate Milk Price, consistent with prior season disclosures.
19 Not applicable: No BMP sales informed the Farmgate Milk Price Revenue in this quarter.
For
per
sona
l use
onl
y
20 FONTERRA FARMGATE MILK PRICE STATEMENT 2018
Note that the spot data is based on the weighted average conversion rate that would have been achieved if the revenue collected during the shipping period was converted at the average spot rate in the month of collection. Certain average spot exchange rate figures for the 2017 Season differ from those disclosed in the 2017 Farmgate Milk Price Statement, as forecast exchange rates have been replaced with actual exchange rates.
2018 SEASONFONTERRA’S AVERAGE
CONVERSION RATE SPOT EXCHANGE RATE
Aug 17 to Oct 17 0.6988 0.6968
Nov 17 to Jan 18 0.7097 0.7147
Feb 18 to Apr 18 0.7112 0.7172
May 18 to Jul 18 0.7050 0.6853
Aug 18 to Oct 18 0.7061 0.682120
Revenue-weighted annual average 0.7074 0.7039
2017 SEASONFONTERRA’S AVERAGE
CONVERSION RATE SPOT EXCHANGE RATE
Aug 16 to Oct 16 0.6766 0.7156
Nov 16 to Jan 17 0.6830 0.7117
Feb 17 to Apr 17 0.6922 0.6978
May 17 to Jul 17 0.7071 0.7293
Aug 17 to Oct 17 0.7136 0.7173
Revenue-weighted annual average 0.6924 0.7137
2016 SEASONFONTERRA’S AVERAGE
CONVERSION RATE SPOT EXCHANGE RATE
Aug 15 to Oct 15 0.7359 0.6581
Nov 15 to Jan 16 0.7231 0.6637
Feb 16 to Apr 16 0.7076 0.6803
May 16 to Jul 16 0.6849 0.7130
Aug 16 to Oct 16 0.6790 0.7275
Revenue-weighted annual average 0.7082 0.6820
Attachment 5: Average USD:NZD Conversion and Spot Rates
20 The spot exchange rate for the period from August to October 2018 equals the spot rate at 9am on 31 July 2018, the last working day of Fonterra’s 2018 financial year.
For
per
sona
l use
onl
y
21FONTERRA FARMGATE MILK PRICE STATEMENT 2018
Glossary
In this Statement, unless the context otherwise requires, the following terms have the meanings set out next to them:
Additional Commodity Milk Payments Amount is defined in the Manual for the 2019 Season.
Aggregate Commodity Milk Payments are defined in the Manual for the 2019 Season.
Aggregate Farmgate Milk Price is defined in the Manual for the 2019 Season.
AMF means anhydrous milk fat.
BMP means buttermilk powder.
Detailed Rules means the detailed rules for calculating the Farmgate Milk Price as set out in the Manual.
DIRA means the Dairy Industry Restructuring Act 2001, which authorised Fonterra’s formation and regulates its activities.
Farmgate Milk Price means Fonterra’s Farmgate Milk Price as determined under the Manual for the 2019 Season.
Farmgate Milk Price Capital Costs are defined in the Manual.
Farmgate Milk Price Cash Costs are defined in the Manual.
Farmgate Milk Price Manual or Manual means Fonterra’s Farmgate Milk Price Manual which is available on www.fonterra.com.
Farmgate Milk Price Revenue is defined in the Manual.
Final Farmgate Milk Price means the aggregate amount approved by Fonterra’s Board as payment for milk supplied in the 2018 Season.
Financial Year means Fonterra’s financial year, which runs from 1 August to the following 31 July.
Fixed Asset Capital Charges are defined in the Manual.
Fonterra means Fonterra Co-operative Group Limited.
Global Dairy Trade or GDT means the electronic auction platform that is used to sell commodity dairy products.
kgMS means kilograms of milk solids.
Methodologies means the methodologies for calculating the Farmgate Milk Price as set out in the Manual.
Milk Price Adjustment means the difference between the Farmgate Milk Price and the Final Farmgate Milk Price for the 2018 Season.
Milk Price Model means the model used to calculate the Farmgate Milk Price set out in the Manual.
Milk Price Principles or Principles means the Milk Price Principles set out in Fonterra’s Constitution.
MT means metric tonnes.
Net Working Capital Charges are defined in the Manual.
NZD means New Zealand dollars.
Reference Commodity Products or RCP means the commodity products used to calculate the Farmgate Milk Price, comprising WMP, SMP, BMP, AMF and butter.
Season means the 12-month period from 1 June to the following 31 May.
SMP means skim milk powder.
Standard Supply Adjustments are defined in the Manual for the 2019 Season.
USD means United States dollars.
Winter Milk means milk supplied by farmers in the months of May, June and July.
WMP means whole milk powder.
For
per
sona
l use
onl
y
Fonterra Co-operative Group Limited Private Bag 92032, Auckland 1142, New Zealand64 9 374 9000 (Phone) 64 9 374 9001 (Fax)Shareholder And Supplier Services Freephone 0800 65 65 68For global locations visit www.fonterra.com