117
For personal use only
For
per
sona
l use
onl
y
Our mission is to improve patients’ lives by providing solutions that will allow a deeperunderstanding of the human body and theimportance of fluid status and tissue analysis.
For
per
sona
l use
onl
y
3
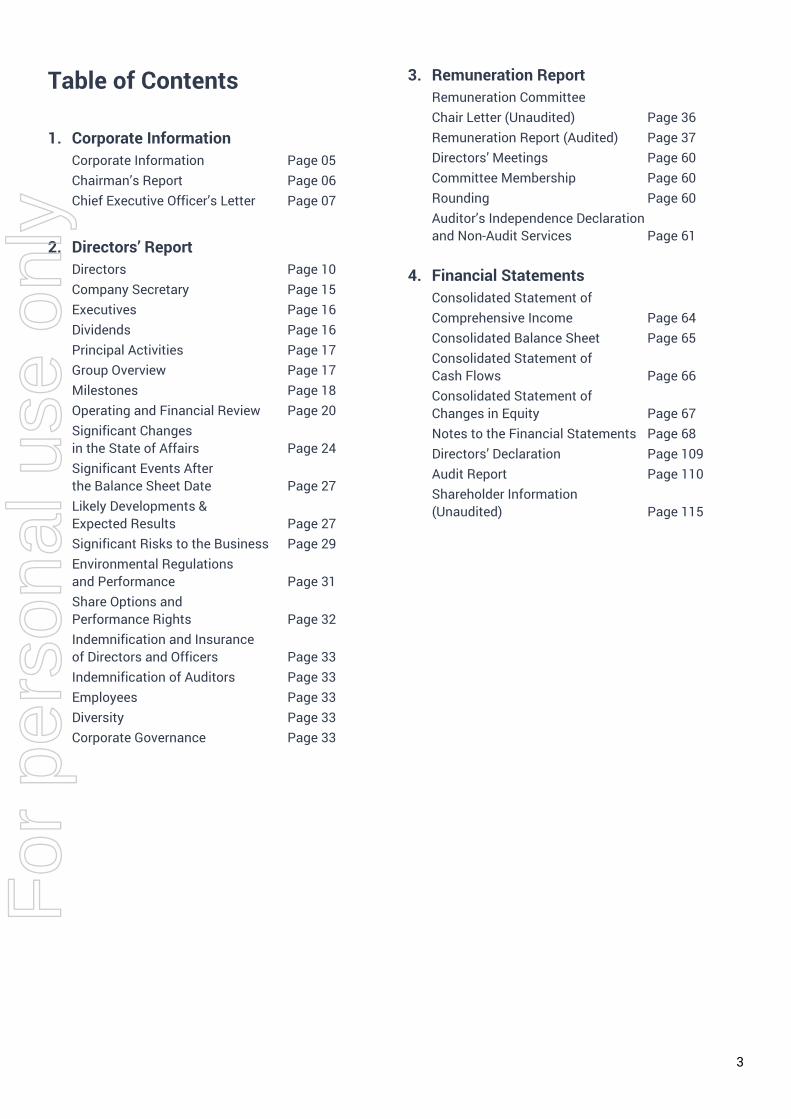
Table of Contents
1. Corporate InformationCorporate Information Page 05 Chairman’s Report Page 06 Chief Executive Officer’s Letter Page 07
2. Directors’ ReportDirectors Page 10 Company Secretary Page 15 Executives Page 16 Dividends Page 16 Principal Activities Page 17 Group Overview Page 17 Milestones Page 18 Operating and Financial Review Page 20 Significant Changesin the State of Affairs Page 24Significant Events Afterthe Balance Sheet Date Page 27Likely Developments &Expected Results Page 27Significant Risks to the Business Page 29Environmental Regulationsand Performance Page 31Share Options andPerformance Rights Page 32Indemnification and Insuranceof Directors and Officers Page 33 Indemnification of Auditors Page 33 Employees Page 33 Diversity Page 33 Corporate Governance Page 33
3. Remuneration ReportRemuneration CommitteeChair Letter (Unaudited) Page 36 Remuneration Report (Audited) Page 37 Directors’ Meetings Page 60 Committee Membership Page 60 Rounding Page 60 Auditor’s Independence Declarationand Non-Audit Services Page 61
4. Financial StatementsConsolidated Statement ofComprehensive Income Page 64 Consolidated Balance Sheet Page 65 Consolidated Statement ofCash Flows Page 66Consolidated Statement ofChanges in Equity Page 67Notes to the Financial Statements Page 68Directors’ Declaration Page 109 Audit Report Page 110 Shareholder Information(Unaudited) Page 115
For
per
sona
l use
onl
y
For
per
sona
l use
onl
y
5
Corporate Information This financial report covers the consolidated entity comprising ImpediMed Limited (the “Parent” or “Company”) with its wholly owned subsidiaries (the “Group”). The Parent’s functional and presentation currency and the Group’s presentation currency is the Australian dollar (AUD or $). Certain prior year amounts have been reclassified for consistency with the current year presentation.
A description of the Group’s operations and of its principal activities is included in the operating and financial review in the Directors’ Report. The Directors’ Report is not part of the financial report.
Directors
Non-Executive Directors
S Ward, Chairman
J Downes
G Goetzke
R Graham
A Patel
D Williams
Managing Director
R Carreon, Managing Director and CEO
Company Secretary
L Ralph
Registered Office Unit 1, 50 Parker Court Pinkenba QLD 4008
Principal Places of Business US Headquarters 5900 Pasteur Court, Suite 125 Carlsbad CA 92008 Phone: +1 760 585 2100
AU Headquarters Unit 1, 50 Parker Court Pinkenba QLD 4008 Phone: +61 7 3860 3700
Share Register Link Market Services Level 21 10 Eagle Street Brisbane QLD 4000 Phone: +61 7 3320 2200
ImpediMed Limited shares are listed on the Australian Securities Exchange (ASX): ASX code “IPD”.
Website www.impedimed.com
Solicitors Johnson Winter & Slattery Level 25, 20 Bond Street Sydney NSW 2000
Sheppard Mullin Richter & Hampton LLP 12275 El Camino Real Suite 200 San Diego CA 92130 USA
Bankers Commonwealth Bank of Australia 240 Queen Street Brisbane QLD 4000
Bank of America 701 B Street Suite 2300 San Diego CA 92101 USA
Auditors Ernst & Young Level 51, 111 Eagle Street Brisbane QLD 4000
Remuneration Advisors to the Board of Directors Willis Towers Watson 300 S. Grand Avenue Los Angeles CA 90071 US
For
per
sona
l use
onl
y
6
Chairman’s Report
Scott Ward Chairman of the Board
On behalf of ImpediMed’s Board of Directors and Management, I am pleased to present the Annual Report for ImpediMed Limited for financial year 2019.
This has been a transformative year for the Company, as we continue our evolution to a connected digital health platform through SOZO. The Company continued to execute on its strategy by achieving a number of important milestones during the year, which Richard Carreon will describe in detail in his CEO Letter.
First Strike – 2018 Remuneration Report The Board and the Remuneration Committee have focused on responding to items raised by the “first strike” against the 2018 Remuneration Report. The Board has adopted an equity remuneration model which conserves the Group’s cash, provides incentive to recruit and retain executives and better aligns compensation with the interests of the shareholders. In addition, we are working to improve both the communications and messaging regarding remuneration for directors and Executive KMP to provide greater transparency to our shareholders. A full description of the key actions taken by the Board to address the items raised by the first strike are described in further detail in the Remuneration Report.
Board Composition I am pleased that we have a strong Board of Directors at ImpediMed. Over the past few years, we have added several new Board Members with strong core competencies in business management, finance, accounting, digital health, reimbursement and healthcare economics.
Taken in total, our Board has the experience and skill necessary to assure sound governance while also providing effective support and guidance for management as, together, we build ImpediMed into a high growth, global medical technology company.
ImpediMed’s Corporate Governance Statement, which accompanies the release of the Annual Report, outlines the corporate governance practices currently in place for the Company and also addresses the 3rd Edition of the ASX Corporate Governance Council’s Corporate Governance Principles and Recommendations (ASX Recommendations). The Board continues to review the governance framework and practices of the Company to ensure they meet the interests of shareholders and other stakeholders.
Gratitude On behalf of our entire Board, I would like to extend our gratitude to all of our ImpediMed employees for their dedication to our company and their passionate commitment to the patients that we serve.
We also extend our thanks and congratulations to our Managing Director and CEO, Rick Carreon, and the Management Team. Under Rick’s leadership, ImpediMed has transformed into a Mission driven, patient-centric company focused on the development and commercialisation of SOZO bioimpedance spectroscopy for the early detection of lymphoedema and fluid status monitoring of heart failure patients.
And finally, thank you to our shareholders for your ongoing support. We look to the future with a sense of determination and enthusiasm as we focus on driving adoption of our technology and building sustainable revenue growth through our subscription business model. As always, we look forward to engaging with you throughout the year and at our 2019 Annual General Meeting.
Sincerely,
Scott R. Ward Chairman
For
per
sona
l use
onl
y
7
Chief Executive Officer’s Letter
Richard Carreon, Managing Director and Chief Executive Officer
Dear Shareholders,
This financial year marked a critical turning point for the company. The first-year data from the PREVENT Trial was released in May, showing a 95% reduction in the progression of lymphoedema. We successfully transitioned our capital-intensive business to Software as a Service (SaaS), with more than 55% of our revenue generated from this model. Finally, more than 50,000 patient measurements have been clinically assessed utilising our SOZO® Digital Health Platform.
Having built a strong foundation of more than 400 SOZO Digital Health Platforms in the market, we enter financial year 2020 with a clear focus on accelerating the commercialisation of our lymphoedema business.
Revenue and Key Metrics Total recognised revenue increased over 25% year-over-year to $4.2 million for financial year 2019 (2018: $3.3 million). The increase in medical revenue was a result of the shift of the business to a Software as a Service (SaaS) revenue model in conjunction with the introduction of the SOZO Digital Health Platform.
We introduced SOZO to the US market in financial year 2018, and since the launch, we have grown the Contracted Revenue Pipeline revenue to $8.7 million (2018: $3.5 million) and Annual Recurring Revenue to $3.4 million (2018: $1.3 million). We are very encouraged by the positive reception of SOZO and the feedback we are receiving from clinicians.
The SOZO Digital Health Platform gives us the ability to continue to increase contract value for each customer over time by the addition of incremental SOZO indications and modules.
Cash on hand at 30 June 2019 was $11.3 million, and net cash used in operating activities was $19.6 million for the financial year. Including the net proceeds from the $13.9 million Non-Renounceable Entitlement Offer that closed in July, the Group remains in a strong position to invest in the areas critical for the sustained acceleration of revenue growth over the course of financial year 2020.
We will continue to update you on the progress of our business, and we look forward to having you join us in financial year 2020 as we continue to report on the expansion and acceleration of our SOZO Digital Health Platform.
Significant Body of Clinical Evidence We continued to effectively build a substantial body of clinical evidence, which will further drive adoption of our technology throughout the financial year 2020.
The pre-specified interim analysis of the PREVENT Trial was presented at the American Society of Breast Surgeons Annual Meeting, and the peer-reviewed manuscript was published in the Annals of Surgical Oncology in May 2019. The PREVENT Trial is a multi-centre, prospective, randomised controlled trial, the largest trial undertaken in lymphoedema prevention. The presentation and publication of data from the PREVENT Trial was a significant milestone for the Group and supports the use of L-Dex® for early detection of lymphoedema for breast cancer patients.
Multiple, independent, investigator-led clinical studies have reported significantly lower rates of clinical grade lymphoedema by monitoring patients with L-Dex and intervening. These studies have monitored over 1,400 patients, utilising prospective screening and intervention for breast cancer related lymphoedema.
We have been working with world-leading institutions on several heart failure (HF) studies, with initial data being presented at the World Congress of Heart Disease and at the American Heart Congress - DVD during financial year 2019. In addition, during financial year 2019 we initiated a more extensive multi-centre study of approximately 200 patients. We will meet with the Principal Investigators and the Heart Failure Advisory Board in the first half of financial year 2020 for a comprehensive review of the data to-date and develop next steps. Also, we are expanding the heart failure opportunity to include those with implantable devices, for which we expect regulatory clearance in financial year 2020.
Reimbursement and Guidelines In January 2015, a dedicated Category I CPT® Code, 93702, for L-Dex came into effect in the US market, under which physicians and clinics in the US can seek reimbursement from Medicare and private payors.
For
per
sona
l use
onl
y

8
The expansion of published industry guidelines will also be a catalyst for ImpediMed in the coming year, with a number of guidelines issued in financial year 2019:
• New England Journal of Medicine Clinical Practicearticle by Dr. Rockson recommends quarterly BISmeasures
• NAPBC follow National Lymphoedema Networkguidance (including BIS as a tool to diagnose BCRL)
• eviCore Clinical Guidelines for Physical andOccupational Therapy Services - BIS is a validatedtool for diagnosing lymphoedema
• Lymphatic Education & Research Network Centers of Excellence – BIS recommended as a riskassessment tool
In addition, an application earlier in the year was submitted for the inclusion of a formalised lymphoedema testing protocol in the National Comprehensive Cancer Network Guidelines (NCCN Guidelines®). A second application was recently submitted for the inclusion of BIS technology for the detection of sub-clinical lymphoedema. Also, we have requested a Technical Review of our BIS technology, and we have had a number of meetings with private payors requesting payment for our CPT® Code 93702. ImpediMed is building a compelling case for private payors to initiate payments in financial year 2020, and we expect the introduction of private payors would further drive the acceleration of our business. We believe our SOZO Digital Health Platform is uniquely positioned to replace current monitoring methods through our precise, non-invasive, and cost-effective technology. We are excited about the significant progress we have made in optimising outcomes for the management of cancer and HF patients. We believe in the coming years we will make even greater strides and look forward to having you join us on that journey.
Thank You Thank you again to our Shareholders for your continued support. We look forward to delivering on our milestones and updating you on key metrics throughout the coming year.
As always, my sincere thank you goes out to all our ImpediMed team members and their families.
Yours sincerely,
Richard Carreon Managing Director and Chief Executive Officer
For
per
sona
l use
onl
y
For
per
sona
l use
onl
y
10
Directors
Scott Ward MS, BSc Non-Executive Chairman
Scott Ward was appointed Chairman on 15 November 2017 and serves on the Nomination Committee. Scott is the Chairman of the Board, President and CEO of Cardiovascular Systems Inc.
Scott has over 35+ years of experience in the healthcare industry, including nearly 30 years at Medtronic, Inc. He was the Senior Vice President and President of the CardioVascular business of Medtronic
Inc., responsible for all worldwide operations of the CardioVascular Business including the Coronary, Peripheral, Endovascular, Structural Heart Disease and Revascularization and Surgical Therapies businesses. Previously, Scott served as Senior Vice President and President of Medtronic Neurological and Diabetes, with responsibility for the global Neurological, Neurologic Technologies, Diabetes, Gastroenterology and Urology businesses; Vice President and General Manager of the Medtronic Drug Delivery Business; and Director of Medtronic NeuroVentures. Scott is also the Founder of Raymond Holdings, LLC a firm with activities in venture capital, strategy and transactional advisory services. He holds a B.S. in genetics and cell biology and an M.S. in toxicology, both from the University of Minnesota.
Scott’s 35+ years of experience in the healthcare industry, including his significant leadership experience of public medical device companies and his prior service on the boards of public medical device companies, make him a valuable contributor to the Board.
Listed company directorships held since 1 July 2016:
Company Name Appointed Retired / Resigned
ImpediMed Limited July-13 - Cardiovascular Systems Incorporated (i) November-13 -
(i) US-based publicly traded company.
For
per
sona
l use
onl
y
11
Judith Downes BA(Hons), DipEd, GradDipBus(Acct), FAICD, FCPA, FCA Non-Executive Director
Judith Downes was appointed to the Board in April 2017, chairs the Audit and Risk Management Committee and serves on the Nomination Committee.
Judith brings over 25 years of accounting and senior management expertise to the Board with a strong
focus on financial management and audit and risk management, with large ASX listed companies. During her executive career, she held the roles of CFO at Alumina Limited (ASX: AWC) and as CFO/COO of Institutional Division, ANZ Banking Group Limited (ASX: ANZ).
Judith currently serves as Board Chairman of Bank Australia Limited, as an Honorary Fellow of the University of Melbourne’s Faculty of Business and Economics and as a Director of CleanTeQ Holdings Limited.
She is a Fellow of the CPA, Chartered Accountants Australia and New Zealand, and Australian Institute of Company Directors. Judith is also a past member of the University of Melbourne’s finance committee.
Judith has significant experience in corporate governance, debt and equity raisings, financial reporting and Australian listing rules.
Listed company directorships held since 1 July 2016:
Company Name Appointed Retired / Resigned
ImpediMed Limited April-17 - CleanTeQ Holdings Limited October-18 -
Gary Goetzke Juris Doctorate Non-Executive Director
Gary Goetzke was appointed to the board in August 2016 and serves on the Remuneration and Nomination
Committees. He is currently the Principle and Chief Executive Officer of Compass Medical Advisors, LLC.
Gary has spent 20 years in senior management positions of three medical device companies where he led efforts in pursuing global coverage and payment policy for a variety of medical device therapies in the areas of cardiology, neurology, urology, pelvic health, wound care, orthopaedics, ENT and sleep. Gary is currently the Asia Pacific & Japan Business Leader for a global medical device company focused on the treatment of sleep apnea, in addition to serving as President and Chief Executive Officer of Compass Medical Advisors, LLC, an enterprise focused on developing regulatory, clinical and reimbursement-related mobile APPs for the medical device industry. Gary also serves as an Advisory Board Member for the Center for College Sleep.
Listed company directorships held since 1 July 2016:
Company Name Appointed Retired / Resigned
ImpediMed Limited August-16 -
For
per
sona
l use
onl
y
12
Robert Graham AO, FAA, FAHMS, MBBS, MD, FRACP, FACP, FAHA, GAICD Non-Executive Director
Dr Graham was appointed to the board in November 2017 and serves on the Remuneration and Nomination Committees.
He received his medical training at the University of New South Wales, Australia, where he is now the Des Renford Professor of Medicine, (UNSW). He has been the inaugural Executive Director, Victor Chang Cardiac Research Institute (VCCRI), Sydney, Australia, since returning to Australia in 1994 after 17 years working in the US at the University of Texas Southwestern Medical School, Dallas; the Massachusetts General Hospital, Harvard Medical School; the Massachusetts Institute of Technology, and the Cleveland Clinic Foundation and Case Western Reserve University School of Medicine.
Listed company directorships held since 1 July 2016:
Company Name Appointed Retired / Resigned
ImpediMed Limited November-17 -
Amit Patel MBA, BME Non-Executive Director Amit Patel was appointed to the Board in March 2017 and serves on the Audit and Risk Management and Nomination Committees.
Amit is a Co-Founder and CEO of Murata Vios (formerly Vios Medical), which has created an FDA-cleared patient management platform that integrates IoT-
based monitoring, remote care services, and big data analytics to alleviate gaps in patient vigilance across in-hospital and home environments. Vios is currently commercialising its monitoring and services solution across major hospital systems in the US and India. Vios Medical was acquired by Murata Manufacturing in October of 2017.
Prior to founding Vios, Amit was with HeartFlow where he created a joint go-to-market strategy with GE Healthcare’s imaging division, managed the DeFACTO clinical study across multiple UK sites, and developed a health economic story for the NHS. Prior to HeartFlow, Amit was with Medtronic’s Corporate Development group and was responsible for acquisitions, minority investments, and joint ventures spanning existing businesses and strategic whitespace areas. Amit has an MBA from Stanford University and a Bachelors of Biomedical Engineering from the University of Minnesota.
Listed company directorships held since 1 July 2016:
Company Name Appointed Retired / Resigned
ImpediMed Limited March-17 -
For
per
sona
l use
onl
y
13
Donald Williams BAcy, CPA Non-Executive Director
Donald Williams was appointed to the Board in March 2017, chairs the Remuneration Committee and serves on the Audit and Risk Management and Nomination Committees.
Don has more than 35 years in leadership roles as a Certified Public Accountant (CPA) and an accredited public company director, serving the life science,
biotech, and medical device industries. Don has significant experience assisting companies and management teams with initial public offerings, complex business challenges and analysis of financial reporting matters. His breadth of experience includes a diverse set of growing domestic and international companies including venture financings, public equity offerings, public debt offerings, mergers and acquisitions, and interaction with the US Securities and Exchange Commission and Public Company Accounting Oversight Board.
While at both Ernst & Young and Grant Thornton, Don was focused on the Life Sciences Industry. For over 15 years, he directed Ernst & Young’s Venture Capital and Emerging Growth Markets in the Southeast Market and in the Pacific Southwest Market. During his seven years at Grant Thornton he was the National Leader of the United States Life Sciences Industry. His oversight of the National Life Sciences Industry included setting strategy, establishing the sales and marketing plan and oversight of industry operations.
Listed company directorships held since 1 July 2016:
Company Name Appointed Retired / Resigned
ImpediMed Limited March-17 -
Adhera Therapeutics, Inc. (i) (ii) September-14 -
Akari Therapeutics (i) June-16 -
Alphatec Holdings Inc (i) May-15 -
Marina Biotech Inc (i) September-14 -
(i) US-based publicly traded company. (ii) Adhera Therapeutics, Inc. changed its name from Marina Biotech, Inc. in October 2018.
For
per
sona
l use
onl
y
14
Richard Carreon Executive Director
Richard Carreon was appointed to the Board as Executive Director in May 2015. Rick joined ImpediMed in July 2012 as President and CEO.
Rick has more than 30 years of experience in management, sales and marketing, spanning the consumer products and medical technology industries. Rick has more than a decade of executive experience working for Medtronic, a leading global
manufacturer of cutting-edge medical devices, and therapies. His roles at Medtronic included Vice President, US Cardiovascular Commercial Operations; Vice President of Sales – Structural Heart; Vice President of Sales and Marketing Medtronic Gastroenterology and Urology; and Vice President of Sales – The Americas.
Rick has a strong sales background, extensive marketing strategy and execution experience, and a proven track record of success. He is renowned for building start-up and high-growth ventures, turning around strategic business units, penetrating new markets and delivering strong and sustainable profits, revenues and market share value. At Medtronic, Rick led strategic direction and tactical planning for several sales organizations within Medtronic’s $1.1B Cardiovascular Sector. Rick was handpicked to lead the start-up of Medtronic Gastroenterology and Urology, a high-risk business venture, growing revenues threefold, and building that venture into the fastest growing business in Medtronic.
Listed company directorships held since 1 July 2016:
Company Name Appointed Retired / Resigned
ImpediMed Limited May-15 -
For
per
sona
l use
onl
y
15
Interest in the Shares and Options of the Group and Related Body Corporate
As at the date of this report, the interests of the current Directors in ImpediMed Limited were:
Director Title Ordinary Shares S Ward Chairman 250,000 J Downes (i) Non-Executive Director 110,134 G Goetzke Non-Executive Director 242,000 R Graham Non-Executive Director - A Patel Non-Executive Director 88,000 D Williams Non-Executive Director 130,000 R Carreon Executive Director 1,008,591
(i) J Downes’ shareholdings include 27,534 shares acquired in July 2019 as part of the Group’s Non-Renounceable Entitlement Offer.
Company Secretary
Leanne Ralph Company Secretary
Leanne Ralph was appointed to the position of Company Secretary in January 2015. Leanne has over 15 years of experience in company secretarial roles and holds this position for a number of ASX-listed entities. Leanne is a Fellow of the Governance Institute of Australia and a Graduate Member of the Australian Institute of Company Directors.
For
per
sona
l use
onl
y

16
Executives
Frank Vicini Morten Vigeland Shashi Tripathi Chief Medical Officer Chief Financial Officer Chief Technology Officer
David Adams Catherine Kingsford Dennis Schlaht Senior Vice President Operations Senior Vice President Medical Affairs Senior Vice President R&D and and Strategic Planning Technology
DividendsNo dividends were paid or proposed to be paid to shareholders for the year ended 30 June 2019.
For
per
sona
l use
onl
y
17
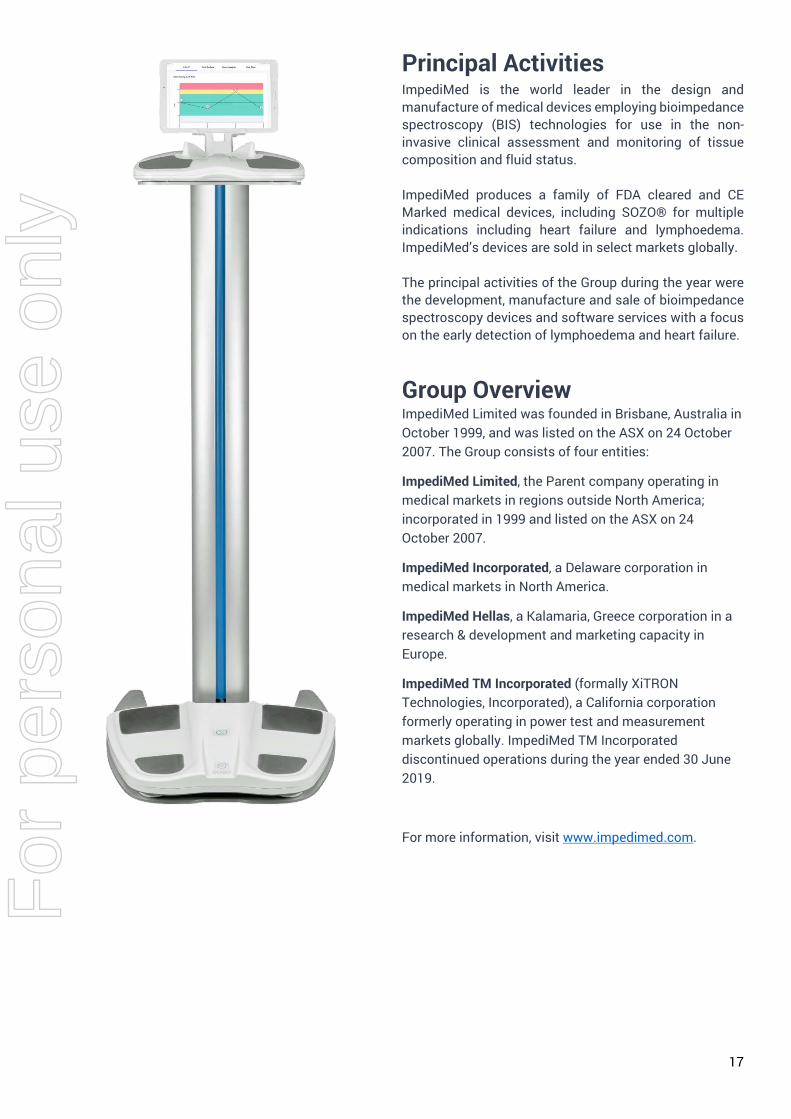
Principal Activities ImpediMed is the world leader in the design and manufacture of medical devices employing bioimpedance spectroscopy (BIS) technologies for use in the non-invasive clinical assessment and monitoring of tissue composition and fluid status.
ImpediMed produces a family of FDA cleared and CE Marked medical devices, including SOZO® for multiple indications including heart failure and lymphoedema. ImpediMed’s devices are sold in select markets globally.
The principal activities of the Group during the year were the development, manufacture and sale of bioimpedance spectroscopy devices and software services with a focus on the early detection of lymphoedema and heart failure.
Group Overview ImpediMed Limited was founded in Brisbane, Australia in October 1999, and was listed on the ASX on 24 October 2007. The Group consists of four entities:
ImpediMed Limited, the Parent company operating in medical markets in regions outside North America; incorporated in 1999 and listed on the ASX on 24 October 2007.
ImpediMed Incorporated, a Delaware corporation in medical markets in North America.
ImpediMed Hellas, a Kalamaria, Greece corporation in a research & development and marketing capacity in Europe.
ImpediMed TM Incorporated (formally XiTRON Technologies, Incorporated), a California corporation formerly operating in power test and measurement markets globally. ImpediMed TM Incorporated discontinued operations during the year ended 30 June 2019.
For more information, visit www.impedimed.com.
For
per
sona
l use
onl
y
18
Milestones 27 June 2019 Successful $13.9 Million Fully Underwritten Non-Renounceable Entitlement Offer The Entitlement Offer was completed in July 2019. Proceeds from the entitlement offer will be applied to fund growth initiatives and general working capital.
6 May 2019
Publication of the Peer-reviewed Manuscript of the PREVENT Interim Analysis Prevent Interim Results – “Practice Changing”
Sheila H. Ridner, PhD, RN, FAAN, the principal investigator of PREVENT and the Martha Rivers Ingram Professor of Nursing at Vanderbilt University School of Nursing, delivered the interim results at a podium presentation during the 20th Annual Scientific Meeting of American Society of Breast Surgeons (ASBrS), in Dallas, Texas on Friday 3 May 2019.
The paper concluded that “the results of this interim analysis demonstrate that patients undergoing surveillance with BIS had reduced but non-statistically significant reductions in the rates of progression requiring CDP compared with TM. These results are currently supportive of the need for subclinical detection and early intervention for patients with BCRL with a 10% absolute reduction and a 67% relative reduction in the rates of CDP. Further data with a longer follow-up than in this study is expected in the years to come and will strengthen these early, positive, practice–changing results.”
The manuscript was published in the Annals of Surgical Oncology, the most cited surgical oncology journal and one of the most cited surgical journals in the world. A copy of the manuscript is available at:
https://link.springer.com/article/10.1245%2Fs10434-019-07344-5
Abbreviations BCRL Breast cancer related lymphoedema BIS Bioimpedance spectroscopy CDP Complex decongestive physiotherapy TM Tape measure
3 May 2019 The American Society of Breast Surgeons (ASBrS) Issued a Press Release and the Abstract Submitted on the Interim Results of the PREVENT Trial
Expert commentary provided by Dr Julie A. Margenthaler, MD, FACS, Washington University School of Medicine, ASBrS Communications Committee Chair stated: “Lymphedema represents a significant morbidity for patients who experience it. This study demonstrates that bioimpedance spectroscopy can identify early signs of lymphoedema so that interventions can be taken to prevent progression. This is an important step in improving the lives of our breast cancer survivors.”
2 April 2019 ImpediMed Becomes Business Associate-Compliant with Launch of Third Generation SOZO Software 3.0 The new software offers a new interface that is easier to navigate, while providing the highest level of security and privacy of patient data in a cloud-based solution. It also offers additional security features for both hospital administrators and clinical users in compliance with the Health Insurance Portability and Accountability Act (HIPAA), allowing customers to collect pertinent patient information during each SOZO test in accordance with HIPAA security and privacy rules.
The new software will be more powerful and significantly streamline the installation and maintenance process by moving all data handling, storage, and analysis to a Cloud-based service.
16 January 2019 ImpediMed Receives Ascension National Purchasing Agreement This agreement allows the 151 Ascension hospitals to take advantage of pre-negotiated pricing and streamlined IT integration of the SOZO platform. Ascension is the largest non-profit health system in the US and the largest Catholic health system in the world. F
or p
erso
nal u
se o
nly
19
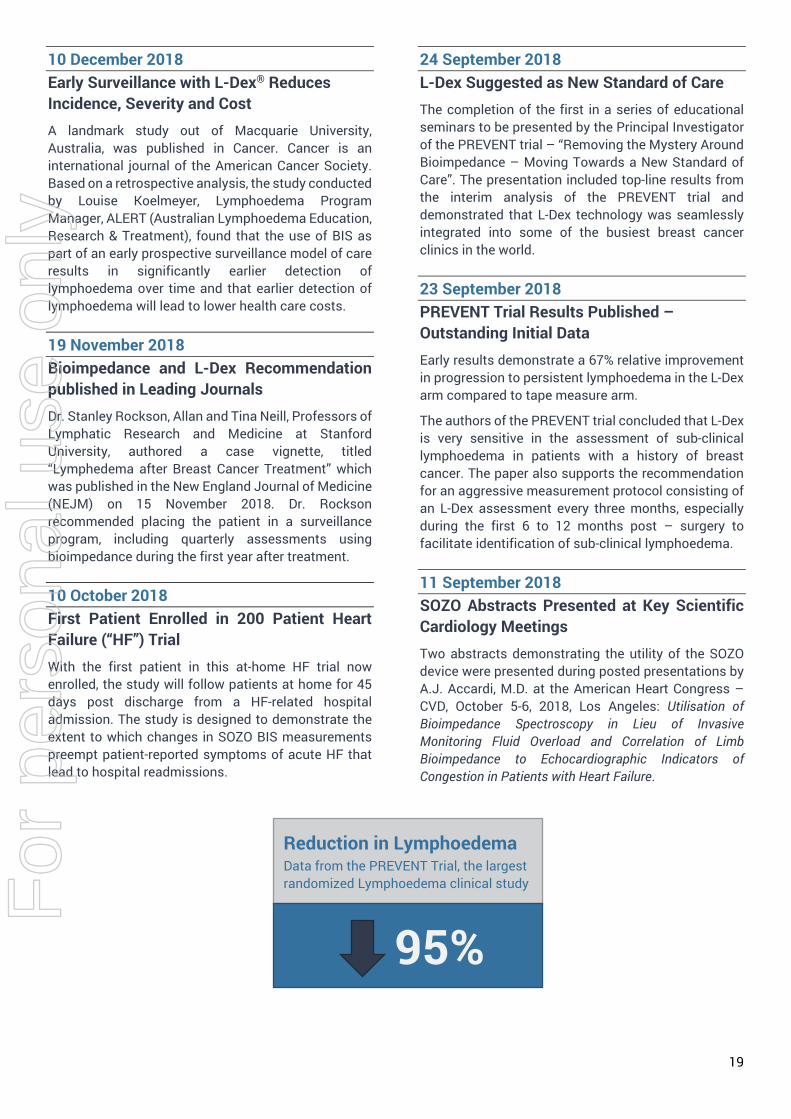
10 December 2018 Early Surveillance with L-Dex® Reduces Incidence, Severity and Cost A landmark study out of Macquarie University, Australia, was published in Cancer. Cancer is an international journal of the American Cancer Society. Based on a retrospective analysis, the study conducted by Louise Koelmeyer, Lymphoedema Program Manager, ALERT (Australian Lymphoedema Education, Research & Treatment), found that the use of BIS as part of an early prospective surveillance model of care results in significantly earlier detection of lymphoedema over time and that earlier detection of lymphoedema will lead to lower health care costs.
19 November 2018 Bioimpedance and L-Dex Recommendation published in Leading Journals Dr. Stanley Rockson, Allan and Tina Neill, Professors of Lymphatic Research and Medicine at Stanford University, authored a case vignette, titled “Lymphedema after Breast Cancer Treatment” which was published in the New England Journal of Medicine (NEJM) on 15 November 2018. Dr. Rockson recommended placing the patient in a surveillance program, including quarterly assessments using bioimpedance during the first year after treatment.
10 October 2018 First Patient Enrolled in 200 Patient Heart Failure (“HF”) Trial With the first patient in this at-home HF trial now enrolled, the study will follow patients at home for 45 days post discharge from a HF-related hospital admission. The study is designed to demonstrate the extent to which changes in SOZO BIS measurements preempt patient-reported symptoms of acute HF that lead to hospital readmissions.
24 September 2018 L-Dex Suggested as New Standard of Care The completion of the first in a series of educational seminars to be presented by the Principal Investigator of the PREVENT trial – “Removing the Mystery Around Bioimpedance – Moving Towards a New Standard of Care”. The presentation included top-line results from the interim analysis of the PREVENT trial and demonstrated that L-Dex technology was seamlessly integrated into some of the busiest breast cancer clinics in the world.
23 September 2018 PREVENT Trial Results Published – Outstanding Initial Data Early results demonstrate a 67% relative improvement in progression to persistent lymphoedema in the L-Dex arm compared to tape measure arm.
The authors of the PREVENT trial concluded that L-Dex is very sensitive in the assessment of sub-clinical lymphoedema in patients with a history of breast cancer. The paper also supports the recommendation for an aggressive measurement protocol consisting of an L-Dex assessment every three months, especially during the first 6 to 12 months post – surgery to facilitate identification of sub-clinical lymphoedema.
11 September 2018 SOZO Abstracts Presented at Key Scientific Cardiology Meetings Two abstracts demonstrating the utility of the SOZO device were presented during posted presentations by A.J. Accardi, M.D. at the American Heart Congress – CVD, October 5-6, 2018, Los Angeles: Utilisation of Bioimpedance Spectroscopy in Lieu of Invasive Monitoring Fluid Overload and Correlation of Limb Bioimpedance to Echocardiographic Indicators of Congestion in Patients with Heart Failure.
Reduction in Lymphoedema Data from the PREVENT Trial, the largest randomized Lymphoedema clinical study
95% For
per
sona
l use
onl
y

20
Operating and Financial Review Operating Results for the Year
Revenue and SaaS Financial Metrics SOZO Revenue for the current period was $2.3 million (30 June 2018: $0.7 million), an increase of 229% over the previous corresponding period. This increase in revenue was attributable to SOZO commercialisation efforts in the US and included both the upfront SOZO device revenue and the recurring subscription revenue streams.
Of the SOZO revenue, $1.6 million related to recurring subscription revenue streams (30 June 2018: $0.1
million), a significant increase over the previous corresponding period.
Total Revenue for the current period was $4.2 million (30 June 2018: $3.3 million), an increase of over 25% from the previous corresponding period. The increase in revenue was attributable to SOZO, as mentioned above, but was offset by a decrease in legacy consumables revenue as the existing customer base transitioned to the SOZO platform.
At 30 June 2019, there were 401 SOZO units in the market (30 June 2018: 202), representing a 99% increase in the number of units in the market year-over-year.
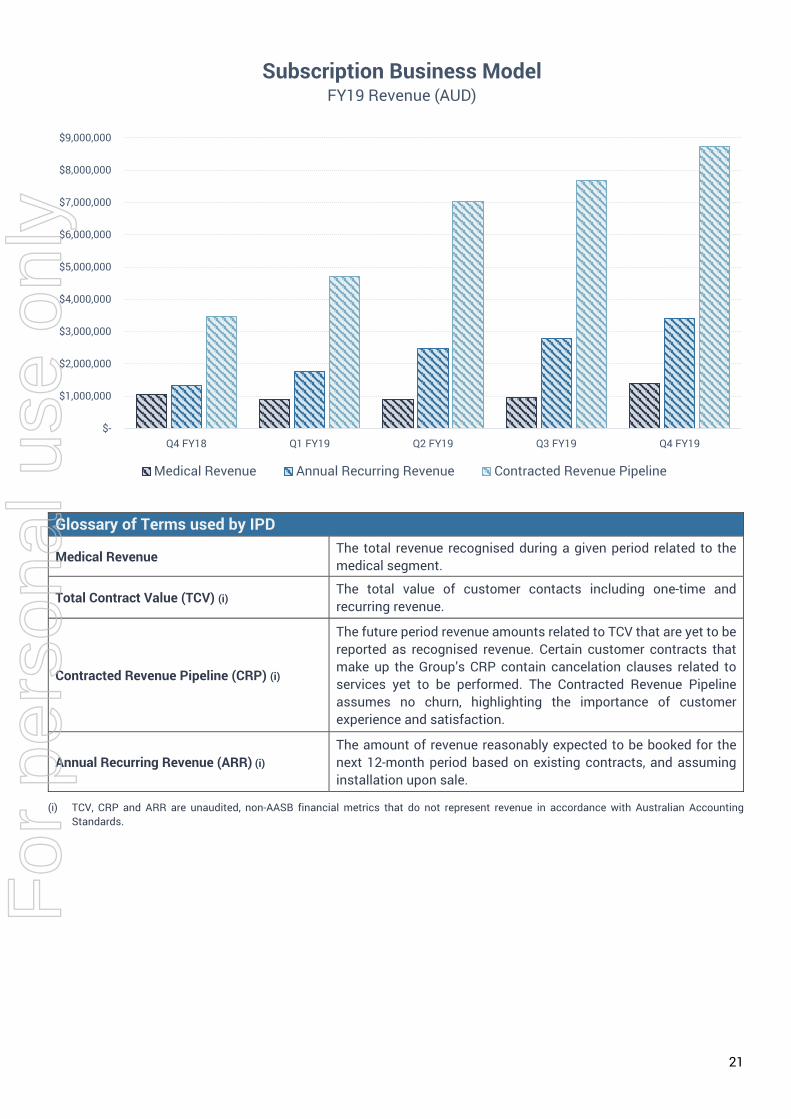
In addition to revenue recognised during the current period, the Contracted Revenue Pipeline (CRP) at 30 June 2019 totaled $8.7 million (30 June 2018: $3.5
million), an increase of 149%, as the majority of the revenue associated with these SOZO units will be recognised over the lives of the respective contracts.
Annual Recurring Revenue (ARR) at 30 June 2019 totaled $3.4 million (30 June 2018: $1.3 million), an increase of 162%.
$-
$1,000,000
$2,000,000
$3,000,000
$4,000,000
$5,000,000
FY'17 FY'18 FY'19
Reported Medical RevenueSOZO and Legacy (AUD)
Legacy SOZO
For
per
sona
l use
onl
y
21
Glossary of Terms used by IPD
Medical Revenue The total revenue recognised during a given period related to the medical segment.
Total Contract Value (TCV) (i) The total value of customer contacts including one-time and recurring revenue.
Contracted Revenue Pipeline (CRP) (i)
The future period revenue amounts related to TCV that are yet to be reported as recognised revenue. Certain customer contracts that make up the Group’s CRP contain cancelation clauses related to services yet to be performed. The Contracted Revenue Pipeline assumes no churn, highlighting the importance of customer experience and satisfaction.
Annual Recurring Revenue (ARR) (i) The amount of revenue reasonably expected to be booked for the next 12-month period based on existing contracts, and assuming installation upon sale.
(i) TCV, CRP and ARR are unaudited, non-AASB financial metrics that do not represent revenue in accordance with Australian Accounting Standards.
$-
$1,000,000
$2,000,000
$3,000,000
$4,000,000
$5,000,000
$6,000,000
$7,000,000
$8,000,000
$9,000,000
Q4 FY18 Q1 FY19 Q2 FY19 Q3 FY19 Q4 FY19
Subscription Business ModelFY19 Revenue (AUD)
Medical Revenue Annual Recurring Revenue Contracted Revenue Pipeline
For
per
sona
l use
onl
y
22
Operating Results – Investing in Large, Growing Markets Net loss for the period was $24.1 million (2018: $27.4 million). The loss from continuing operations after income tax was $24.0 million (2018: $27.2 million). The decreased loss from continuing operations, when compared with the prior year, is primarily attributed to an increase in gross margin of $0.6 million, increased capitalised software development costs of $2.2 million, decreased impairment expenses of $1.1 million, and overall financial discipline across all departments.
Cost of goods sold for the current period were $1.3 million (30 June 2018: $1.0 million). The increase is primarily attributable to an increase in the number of SOZO device sales in the current period compared to the prior period.
Gross margin percentage for the Group was 70% for the current period (2018: 71%). This is reflective of the transition to the sale of SOZO as the main product offering of the Group and the additional one-time costs associated with converting the existing legacy customer base to SOZO. The gross margin percentage related to the SOZO product offering is expected to increase over the course of the next twelve months as the revenue streams related to the subscription-based services become an increasingly larger portion of the Group’s revenue.
Salaries and benefits for the period ended 30 June 2019 totaled $15.8 million (30 June 2018 $16.4 million), a decrease of 4%. The decrease was primarily attributable to certain employee costs capitalised as software development costs related to the next generation SOZO software (SOZO version 3.0) and a slightly reduced headcount compared to the prior period.
Share-based payments for the period ended 30 June 2019 totaled $2.8 million (30 June 2018 $3.3 million), a decrease of 15%. This decrease was related to the Group not issuing existing employees option awards during the year ended 30 June 2019. No long-term incentive (LTI) equity awards were made to Executives or employees during the 2019 financial year, except in relation to new hire grants to certain employees. Please see SECTION 7 of the Remuneration Report for more details on LTI equity.
Administration and governance costs for the period ended 30 June 2019 totaled $2.4 million (30 June 2018 $3.3 million), a decrease of 27%. This decrease is primarily attributable to inventory impairment costs related to the Group’s legacy devices in the prior period that were not necessary in the current financial year.
Consultants and professional fees for the period ended 30 June 2019 totaled $2.1 million (30 June 2018 $3.2 million), a decrease of 34%. The decrease is primarily attributable to overall financial discipline by the Group, including reduced executive, sales, and marketing consulting expenses not critical to the organization’s success during the 2019 financial year.
For
per
sona
l use
onl
y
For
per
sona
l use
onl
y
24
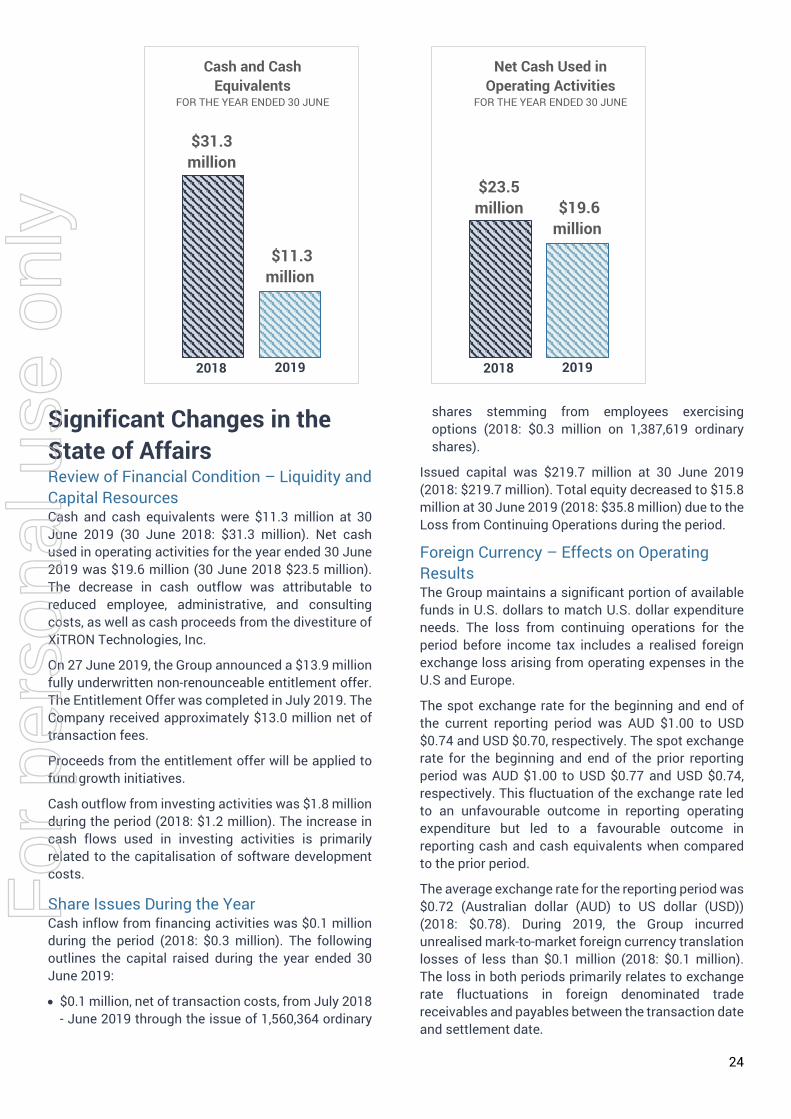
Significant Changes in the State of Affairs Review of Financial Condition – Liquidity and Capital Resources Cash and cash equivalents were $11.3 million at 30 June 2019 (30 June 2018: $31.3 million). Net cash used in operating activities for the year ended 30 June 2019 was $19.6 million (30 June 2018 $23.5 million). The decrease in cash outflow was attributable to reduced employee, administrative, and consulting costs, as well as cash proceeds from the divestiture of XiTRON Technologies, Inc.
On 27 June 2019, the Group announced a $13.9 million fully underwritten non-renounceable entitlement offer. The Entitlement Offer was completed in July 2019. The Company received approximately $13.0 million net of transaction fees.
Proceeds from the entitlement offer will be applied to fund growth initiatives.
Cash outflow from investing activities was $1.8 million during the period (2018: $1.2 million). The increase in cash flows used in investing activities is primarily related to the capitalisation of software development costs.
Share Issues During the Year Cash inflow from financing activities was $0.1 million during the period (2018: $0.3 million). The following outlines the capital raised during the year ended 30 June 2019:
• $0.1 million, net of transaction costs, from July 2018- June 2019 through the issue of 1,560,364 ordinary
shares stemming from employees exercising options (2018: $0.3 million on 1,387,619 ordinary shares).
Issued capital was $219.7 million at 30 June 2019 (2018: $219.7 million). Total equity decreased to $15.8 million at 30 June 2019 (2018: $35.8 million) due to the Loss from Continuing Operations during the period.
Foreign Currency – Effects on Operating Results The Group maintains a significant portion of available funds in U.S. dollars to match U.S. dollar expenditure needs. The loss from continuing operations for the period before income tax includes a realised foreign exchange loss arising from operating expenses in the U.S and Europe.
The spot exchange rate for the beginning and end of the current reporting period was AUD $1.00 to USD $0.74 and USD $0.70, respectively. The spot exchange rate for the beginning and end of the prior reporting period was AUD $1.00 to USD $0.77 and USD $0.74, respectively. This fluctuation of the exchange rate led to an unfavourable outcome in reporting operating expenditure but led to a favourable outcome in reporting cash and cash equivalents when compared to the prior period.
The average exchange rate for the reporting period was $0.72 (Australian dollar (AUD) to US dollar (USD)) (2018: $0.78). During 2019, the Group incurred unrealised mark-to-market foreign currency translation losses of less than $0.1 million (2018: $0.1 million). The loss in both periods primarily relates to exchange rate fluctuations in foreign denominated trade receivables and payables between the transaction date and settlement date.
$31.3million
$11.3 million
Cash and Cash Equivalents
FOR THE YEAR ENDED 30 JUNE
2018 2019
$23.5million $19.6
million
Net Cash Used in Operating Activities
FOR THE YEAR ENDED 30 JUNE
2018 2019
For
per
sona
l use
onl
y
25
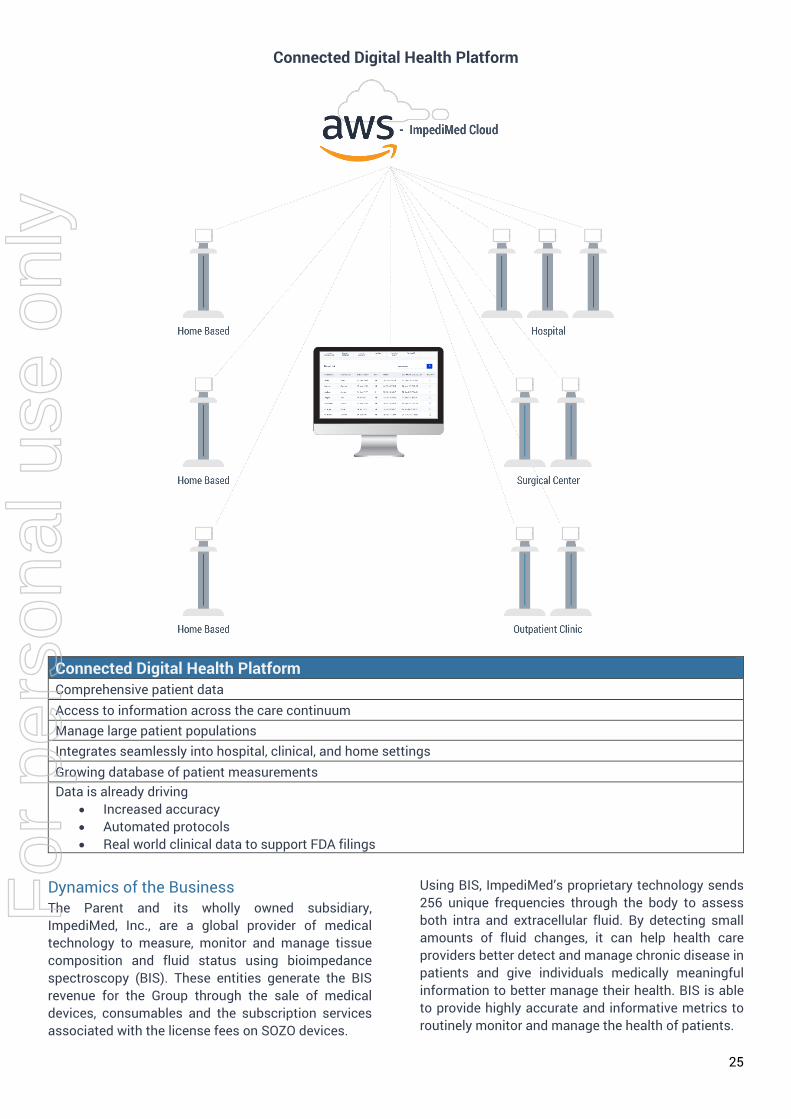
Connected Digital Health Platform
Connected Digital Health Platform Comprehensive patient data Access to information across the care continuum Manage large patient populations Integrates seamlessly into hospital, clinical, and home settings Growing database of patient measurements Data is already driving
• Increased accuracy• Automated protocols• Real world clinical data to support FDA filings
Dynamics of the Business The Parent and its wholly owned subsidiary, ImpediMed, Inc., are a global provider of medical technology to measure, monitor and manage tissue composition and fluid status using bioimpedance spectroscopy (BIS). These entities generate the BIS revenue for the Group through the sale of medical devices, consumables and the subscription services associated with the license fees on SOZO devices.
Using BIS, ImpediMed’s proprietary technology sends 256 unique frequencies through the body to assess both intra and extracellular fluid. By detecting small amounts of fluid changes, it can help health care providers better detect and manage chronic disease in patients and give individuals medically meaningful information to better manage their health. BIS is able to provide highly accurate and informative metrics to routinely monitor and manage the health of patients.
For
per
sona
l use
onl
y
26
During the period, the Group sold its products and subscription services through a mix of employed sales representatives and independent distributors. In the U.S. lymphoedema market, the Group has an employed, direct sales force that focuses on the sale of SOZO devices and the associated subscription services related to the unilateral and bilateral indications.
SOZO – Connected Digital Health Platform SOZO is a highly disruptive technology offering a highly scalable business model. SOZO provides a cloud-based software solution to hospital systems, clinicians and patients that allows access to comprehensive patient data and digital health-information across the care continuum. With seamless integration into hospitals, clinical and home settings, the technology platform allows for ease of management of large patient populations.
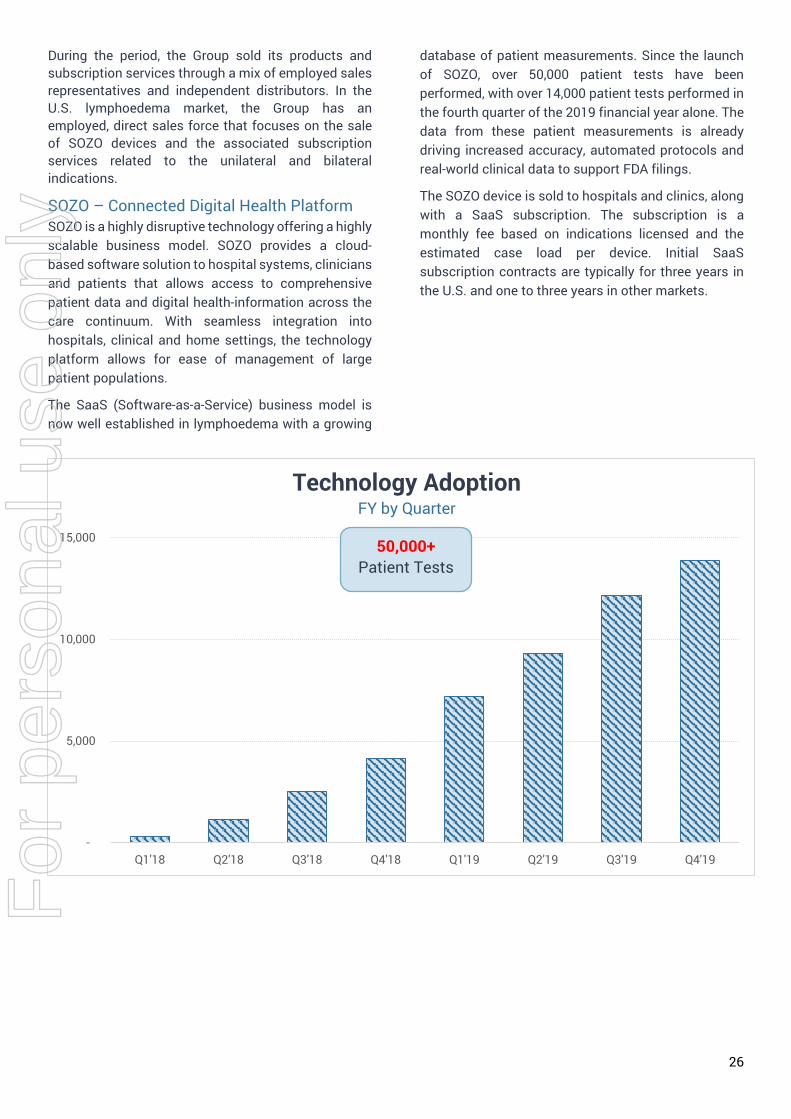
The SaaS (Software-as-a-Service) business model is now well established in lymphoedema with a growing
database of patient measurements. Since the launch of SOZO, over 50,000 patient tests have been performed, with over 14,000 patient tests performed in the fourth quarter of the 2019 financial year alone. The data from these patient measurements is already driving increased accuracy, automated protocols and real-world clinical data to support FDA filings.
The SOZO device is sold to hospitals and clinics, along with a SaaS subscription. The subscription is a monthly fee based on indications licensed and the estimated case load per device. Initial SaaS subscription contracts are typically for three years in the U.S. and one to three years in other markets.
-
5,000
10,000
15,000
Q1'18 Q2'18 Q3'18 Q4'18 Q1'19 Q2'19 Q3'19 Q4'19
Technology AdoptionFY by Quarter
50,000+ Patient Tests
For
per
sona
l use
onl
y
27
Significant Events after the Balance Sheet Date 19 July 2019 Completion of the $13.9 Million Fully Underwritten Non-Renounceable Entitlement Offer The Group announced the completion of its fully underwritten non-renounceable entitlement offer on 19 July 2019. Under the Entitlement Offer, eligible shareholders were invited to subscribe for one (1) new share (“New Share”) for every three (3) shares in the Company of which they were the registered holder, at an issue price of $0.11 per New Share.
In accordance with the ASX Listing Rules, ImpediMed advised that it received valid applications under the Entitlement Offer for approximately 88,249,289 New Shares in ImpediMed (to raise approximately $9.7 million).
The balance of 38,353,639 New Shares, being shares not subscribed for by eligible shareholders in accordance with their pro rata entitlements under the Entitlement Offer, were issued under the underwriting arrangements described in the Offer Booklet.
The New Shares were issued on 24 July 2019.
Proceeds from the Entitlement Offer will be applied to fund growth initiatives.
Likely Developments & Expected Results The following are areas of focus for the Group, as well as likely developments expected to impact the Group’s financial results in the near-term:
Continued Strong Growth in SOZO SaaS Subscription based Business Cancer Survivorship and L-Dex Cancer and its treatments have a huge impact on the body that often affects the quality of life after the disease. There are 1.8 million new cases of cancer each year and over 15.5 million living cancer survivors in the US. There are more than 5.5 million U.S. patients suffering from persistent cancer-related lymphoedema as a result of their cancer treatment, making up an annual addressable market of over $2 billion.
Lymphoedema is a leading post-surgical complication for many cancer patients that greatly impacts quality of life and it is one of the most feared consequences of cancer survivorship. ImpediMed’s L-Dex technology provides a simple and accurate measurement of fluid
in limbs, which allows early detection and intervention. L-Dex is the only technology that can detect the onset of lymphoedema at a subclinical stage. If detected at this stage, the progression of lymphoedema can be prevented, and often reversed. Data from the PREVENT Trial, the largest randomised lymphoedema clinical study, has shown a 95% reduction in lymphoedema.
The Group expects to focus its U.S. commercialisation efforts over the next twelve months on a national Lymphoedema Prevention Program (“LPP”) aimed at transforming patient care through the prevention of cancer-related lymphoedema. The LPP will be a complete solution for cancer-related lymphoedema prevention, incorporating ‘best practices’ from the growing number of top cancer centres currently utilising SOZO’s L-Dex technology. A key initiative of the programme will be focused on changing hospital protocols that involve testing only high-risk patients, in order to maximise patient outcomes and ensure that all patients are tested throughout the continuum of care.
The Group expects that success in the Lymphoedema Prevention Program will result in larger multi-unit SOZO sales to new hospital systems and additional SOZO units being sold into existing hospital systems. The programme is expected to also lead to optimised usage and adoption of the technology from clinicians, thus resulting in strong SOZO revenue growth over the next twelve months.
Revenue Growth – Expanded Footprint In the 2019 financial year, the Group converted the majority of its existing L-Dex users over to SOZO. With over 400 SOZO units sold worldwide as of 30 June 2019, the Group has a strong base-business from which will allow continued SOZO license fee revenue to be generated over the next twelve months.
The Group believes that the challenges related to transitioning to a SaaS business model are now primarily complete and expects that the combination of a strong base business and continued SOZO sales will lead to accelerated revenue growth over the next twelve months.
For
per
sona
l use
onl
y
28
FY20 Market Guidance for Revenue
Guidance
Low Midrange High Midrange Growth vs. FY19
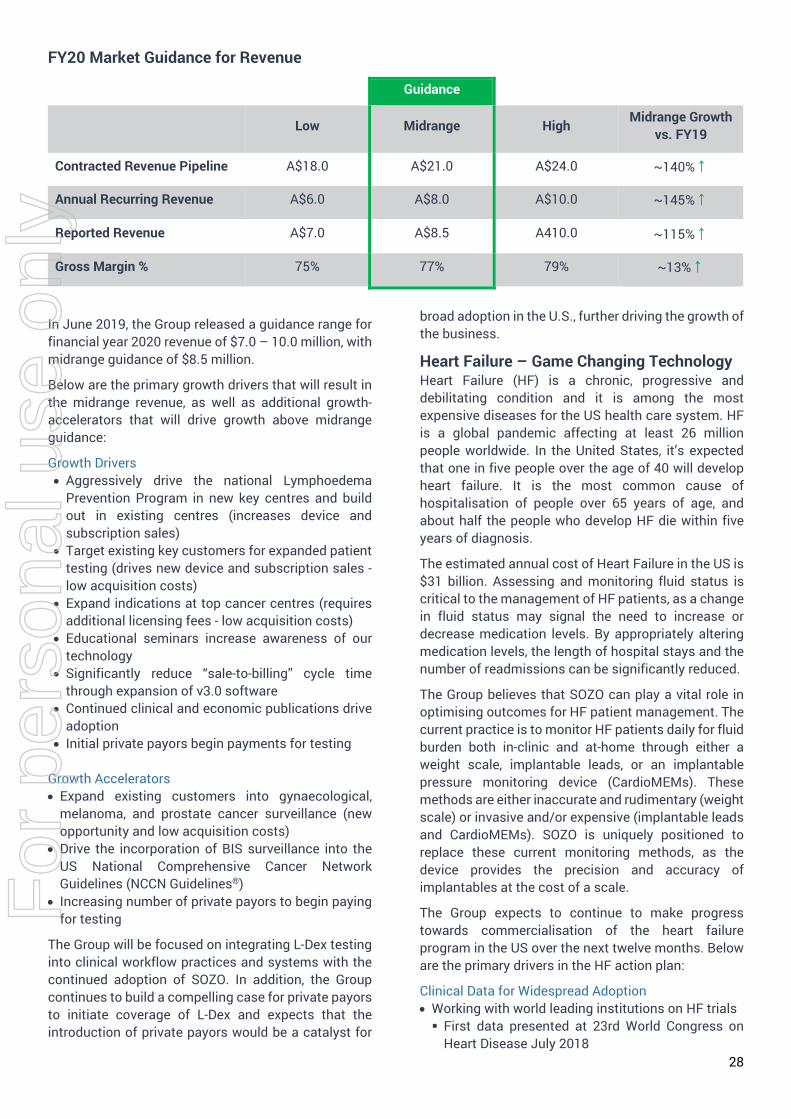
Contracted Revenue Pipeline A$18.0 A$21.0 A$24.0 ~140%↑
Annual Recurring Revenue A$6.0 A$8.0 A$10.0 ~145%↑
Reported Revenue A$7.0 A$8.5 A410.0 ~115%↑
Gross Margin % 75% 77% 79% ~13%↑
In June 2019, the Group released a guidance range for financial year 2020 revenue of $7.0 – 10.0 million, with midrange guidance of $8.5 million.
Below are the primary growth drivers that will result in the midrange revenue, as well as additional growth-accelerators that will drive growth above midrange guidance:
Growth Drivers • Aggressively drive the national Lymphoedema
Prevention Program in new key centres and build out in existing centres (increases device and subscription sales)
• Target existing key customers for expanded patienttesting (drives new device and subscription sales - low acquisition costs)
• Expand indications at top cancer centres (requiresadditional licensing fees - low acquisition costs)
• Educational seminars increase awareness of ourtechnology
• Significantly reduce “sale-to-billing” cycle timethrough expansion of v3.0 software
• Continued clinical and economic publications driveadoption
• Initial private payors begin payments for testing
Growth Accelerators • Expand existing customers into gynaecological,
melanoma, and prostate cancer surveillance (new opportunity and low acquisition costs)
• Drive the incorporation of BIS surveillance into theUS National Comprehensive Cancer Network Guidelines (NCCN Guidelines®)
• Increasing number of private payors to begin payingfor testing
The Group will be focused on integrating L-Dex testing into clinical workflow practices and systems with the continued adoption of SOZO. In addition, the Group continues to build a compelling case for private payors to initiate coverage of L-Dex and expects that the introduction of private payors would be a catalyst for
broad adoption in the U.S., further driving the growth of the business.
Heart Failure – Game Changing Technology Heart Failure (HF) is a chronic, progressive and debilitating condition and it is among the most expensive diseases for the US health care system. HF is a global pandemic affecting at least 26 million people worldwide. In the United States, it’s expected that one in five people over the age of 40 will develop heart failure. It is the most common cause of hospitalisation of people over 65 years of age, and about half the people who develop HF die within five years of diagnosis.
The estimated annual cost of Heart Failure in the US is $31 billion. Assessing and monitoring fluid status is critical to the management of HF patients, as a change in fluid status may signal the need to increase or decrease medication levels. By appropriately altering medication levels, the length of hospital stays and the number of readmissions can be significantly reduced.
The Group believes that SOZO can play a vital role in optimising outcomes for HF patient management. The current practice is to monitor HF patients daily for fluid burden both in-clinic and at-home through either a weight scale, implantable leads, or an implantable pressure monitoring device (CardioMEMs). These methods are either inaccurate and rudimentary (weight scale) or invasive and/or expensive (implantable leads and CardioMEMs). SOZO is uniquely positioned to replace these current monitoring methods, as the device provides the precision and accuracy of implantables at the cost of a scale.
The Group expects to continue to make progress towards commercialisation of the heart failure program in the US over the next twelve months. Below are the primary drivers in the HF action plan:
Clinical Data for Widespread Adoption • Working with world leading institutions on HF trials First data presented at 23rd World Congress on
Heart Disease July 2018
For
per
sona
l use
onl
y

29
Correlation case study and clinical utility of SOZOto monitor HF patients presented at AmericanHeart Congress - CVD
• Data from initial HF studies has led to initiation oflarger multi-centre study
• Study commenced; first patient enrolled 9 October2018 ~200 patients - actively enroling Fluid measurements during hospitalisation for HF
and daily for 45 days after discharge (at-home) Principal Investigator meeting schedule for early
August to review data and publication strategy Heart Failure advisory board meeting to include
other world thought leaders scheduled forSeptember at the 2019 Heart Failure Society ofAmerica meeting. Full review of all clinical dataand next steps.
Regulatory • Expanding heart failure opportunity to include those
with implantable devices. Expect regulatoryclearance by end of CY’19
Favourable Reimbursement and Guidelines Regime • Reimbursement established to pay providers to
remotely manage patients• Current guidelines in place for daily monitoring of
Class III patients for fluid burden
SOZO Regulatory Milestones • CE Mark granted June 2017• FDA 510(k) clearance for fluid monitoring of patients
living with HF achieved December 2017
Significant Risks to the Business The Group has a formal written Risk Management Policy that is published on ImpediMed’s website.
Framework The identification and proper management of risk within the Group is an important priority for the Board and Management. The Board monitors risk within the Group to ensure high standards of operational quality and compliance with the Group’s approved strategies, policies and procedures. It ensures the Board is aware of any material risk issues and assesses the viability of the Group’s operations.
The Group continues a proactive approach to risk management. Management, together with the Board and the Audit & Risk Management Committee, continually assess the key risks and their potential effect on the business. The Group undergoes, at minimum, an annual review of the risk management framework to determine whether there have been any changes in material business risks faced by the entity.
Significant Risks During the financial year, the Group identified the following risks as major risks to the business in the foreseeable future:
• The availability of capital resources• The retention and hiring of key personnel• The strength of the Group’s Intellectual Property (IP)
portfolio• The progress and/or outcome of clinical trials• The adoption of the Group’s technology• The risk of not meeting continuous disclosure
obligations• The progress of new product and software
development• The risk related to product liability, privacy laws and
cyber-security breaches• The effective management of the Group’s supply
chain• The effect of changes in laws, healthcare policy and
other regulatory issues• Brand and reputation risks
Assessment These risks are not ranked in any order of importance or timeframe. The intention of the Group’s risk management framework is to identify risks to allow the Group to plan, assess and execute its strategies. Risk monitoring and assessment activities are designed to reduce, or otherwise manage, risk to levels that are acceptable to the Board and Management. The Board and Management must be kept fully informed in relation to all risk to ensure that the correct decisions in the best interests of the Group are made and that its strategic plans are realised.
The availability of Capital Resources In assessing the availability of capital resources, the Group is continuing to manage its cash position carefully under its operating plan and longer-term strategic plan. The Group may find additional sources of financing and/or raise additional capital if needed. If ImpediMed is unable to obtain additional funds when required, the Group may be forced to delay, reduce the scope of, or eliminate one or more clinical trials, product and software development or commercialisation efforts.
The Retention and Hiring of Key Personnel In assessing the retention and hiring of key personnel, the Group is continuing to consult with remuneration consultants to review the competitiveness of remuneration packages for current and future key management personnel. The Group may or may not be able to retain or hire key personnel based upon its remuneration structure. Details of retention and hiring policies of the Group are set out in the Remuneration Report.
For
per
sona
l use
onl
y
30
The Strength of the Group’s Intellectual Property (IP) Portfolio In assessing the strength of the Group’s Intellectual Property, the Group continues to consult with IP attorneys on the landscape of the Group’s portfolio. The Group uses patents or trademarks to protect its technology and applications from unauthorised use by third parties. The term of patents may expire or may be challenged, invalidated or circumvented. The Group is relying on its patents for commercial protection for its devices.
The Progress and/or Outcome of Clinical Trials In assessing the progress and/or outcomes of clinical trials, the Group continuously monitors key clinical trials which have been published and evaluates potential areas of further research. The outcomes of clinical trials may or may not be favourable.
The Adoption of the Group’s Technology In assessing the adoption of our technology, the Group is focused on developing a model for practice integration, in both L-Dex and future applications, for all existing and new accounts. This, together with acceptance of a Software as a Service (SaaS) subscription business model, evaluating the cost of the technology, fit of the technology, inclusion on guidelines, and reimbursement/payment levels for the technology, will all play a part in determining the future growth of the business.
In particular, ImpediMed is requesting inclusion of a formalised testing protocol and BIS technology for lymphoedema prevention in the NCCN Guidelines. Whilst ImpediMed believes there is a compelling case for inclusion in the NCCN Guidelines and for private health insurers to make payments on claims in the 2019 financial year, there is no guarantee that this will occur.
The commercial success of ImpediMed’s products is also substantially dependent on achieving acceptable payment levels to medical providers to support pricing strategies for L-Dex and additional indications and uses for SOZO. Whether acceptable third-party payments and reimbursement levels are available from government bodies, private health insurers and other third parties will be reliant on clinical data, industry guidelines and health economic arguments.
The Risk of Not Meeting Continuous Disclosure Obligations In assessing continuous disclosure obligation risks, failure to disclose material information or to disclose incorrect information or correct information in an incorrect manner is a potential risk. The Group continuously monitors the business for material information required to be disclosed and conducts
regular Management and Board meetings to discuss business progress and activities.
The Progress of New Product and Software Development In assessing the progress of new product and software development, the Group must assess the impact that investing in product and software development has on the business.
Developing software and technology, particularly in the medical sector, is expensive and often involves an extended period of time to achieve a return on investment. An important aspect of ImpediMed’s business is to continue to invest in innovation and related product development opportunities. ImpediMed believes that it must continue to dedicate resources to ImpediMed’s innovation efforts to develop ImpediMed’s product offering and to maintain ImpediMed’s competitive position. ImpediMed may not however, receive benefits from these investments for several years or may not receive benefits from these investments at all.
The Group also runs the risk of not meeting timelines or not making the right product that addresses customer and market needs. The Group follows a defined design control process and monitors projects to ensure that they are staffed correctly, while also conducting usability studies to determine customer and patient needs. The Group must also assess the risk related to failing to achieve and maintain software products, which could result in recalls or withdrawals, product shortages, delays or failures in software delivery or other problems that could seriously harm ImpediMed’s business.
The Risk Related to Product Liability, Privacy Laws and Cyber-security Breaches In assessing the risk related to product liability and cyber security, the Group conducts extensive safety and penetration testing of new and current technology and regularly reviews customer complaints through its quality procedures and system.
The risk is present that ImpediMed’s products could:
1) Cause harm or injury to users,2) Be used off label,3) Require a recall, or4) Result in a breach to digital assets such as
cyber security data.
ImpediMed relies on third party cloud computing and other information technology systems, especially for SOZO. Interruption, compromise to or failure of these systems may affect ImpediMed’s ability to service its customers effectively. ImpediMed is vulnerable to data
For
per
sona
l use
onl
y
31
breaches by employees and others with both permitted and unauthorised access which poses a risk that sensitive data may be exposed to the public or be permanently lost. A breach in security of, or a significant disruption in, ImpediMed’s information technology systems could adversely affect ImpediMed’s operating results, financial condition, reputation and brand.
Privacy laws around the world continue to develop and impose greater burdens on businesses when dealing with personally identifiable information. The laws are designed to give greater protections to data owners, improve transparency and require businesses to develop better privacy practices and security processes. Failure to do so can result in pecuniary penalties, negative publicity, damage to brand and a requirement to improve processes and controls, each of which, if they were to happen, could adversely affect ImpediMed’s operating results, financial condition, reputation and brand.
The Effective Management of the Group’s Supply Chain In assessing the effective management of the Group’s supply chain, the Group must assess the risk of not having enough product to meet demand due to product shortages or supply chain issues. The Group manages the supply chain through sales and operation planning and sustaining engineering, as well as through long-term strategic product pipeline planning.
The Effect of Changes in Laws, Healthcare Policy and Other Regulatory Issues In assessing the effect of changes in laws, healthcare policy and other regulatory issues, the Group must assess the effect that unforeseen changes in laws and government policy could have in relation to material and unforeseen changes to:
1) Licensing and clearance requirements;2) Regulations relating to clinical trials;3) Manufacturing;4) Product clearance; or5) Pricing, including any tariffs and/or taxes.
Changes in laws healthcare policy and other regulatory issues could materially impact ImpediMed’s operations, assets, contracts and profitability.
Brand and Reputation Risks In assessing brand and reputation risks, the Group must assess the adverse effect that reputation damage or negative publicity could have on ImpediMed or its products as it relates to the Group’s customer relationships, general business and ultimately its financial performance.
The Board, in conjunction with Management, has established and implemented a system for identifying, assessing, monitoring and managing material risk throughout the organisation. The Board has identified what are believed to be the highest perceived risks to the business and will continue to monitor these risks to make decisions in the best interest of the Group.
Environmental Regulations and Performance The Group’s activities are subject to licenses and regulations under environmental laws that apply in the jurisdictions of its operations. These licenses specify limits for and regulate the management of moving to components free of hazardous substances.
The Group is supporting the global move towards components free of hazardous substances in its device electronics and is working with its contract manufacturers to identify replacement parts, where necessary, to substitute into its device designs.
There have been no significant known breaches of the license conditions or other environmental regulations. ImpediMed has an environmental health and safety management system, which includes regular monitoring, periodic auditing and reporting within the Group.
The system is designed to continually improve ImpediMed’s performance and systems with training, regular review, improvement plans and corrective action as priorities.
For
per
sona
l use
onl
y
32
Share Options and Performance Rights Details of movements during the year related to options and performance rights for key management personnel are set out in the Remuneration Report.
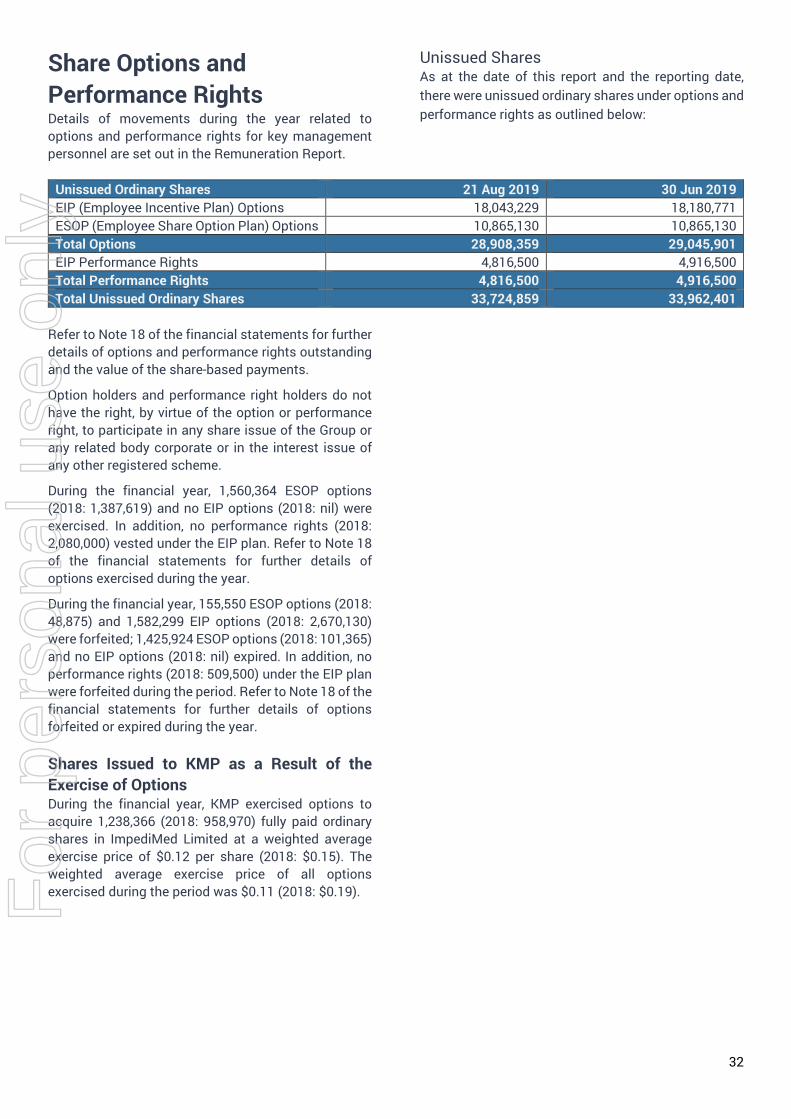
Unissued Shares As at the date of this report and the reporting date, there were unissued ordinary shares under options and performance rights as outlined below:
Unissued Ordinary Shares 21 Aug 2019 30 Jun 2019 EIP (Employee Incentive Plan) Options 18,043,229 18,180,771 ESOP (Employee Share Option Plan) Options 10,865,130 10,865,130 Total Options 28,908,359 29,045,901 EIP Performance Rights 4,816,500 4,916,500 Total Performance Rights 4,816,500 4,916,500 Total Unissued Ordinary Shares 33,724,859 33,962,401
Refer to Note 18 of the financial statements for further details of options and performance rights outstanding and the value of the share-based payments.
Option holders and performance right holders do not have the right, by virtue of the option or performance right, to participate in any share issue of the Group or any related body corporate or in the interest issue of any other registered scheme.
During the financial year, 1,560,364 ESOP options (2018: 1,387,619) and no EIP options (2018: nil) were exercised. In addition, no performance rights (2018: 2,080,000) vested under the EIP plan. Refer to Note 18 of the financial statements for further details of options exercised during the year.
During the financial year, 155,550 ESOP options (2018: 48,875) and 1,582,299 EIP options (2018: 2,670,130) were forfeited; 1,425,924 ESOP options (2018: 101,365) and no EIP options (2018: nil) expired. In addition, no performance rights (2018: 509,500) under the EIP plan were forfeited during the period. Refer to Note 18 of the financial statements for further details of options forfeited or expired during the year.
Shares Issued to KMP as a Result of the Exercise of Options During the financial year, KMP exercised options to acquire 1,238,366 (2018: 958,970) fully paid ordinary shares in ImpediMed Limited at a weighted average exercise price of $0.12 per share (2018: $0.15). The weighted average exercise price of all options exercised during the period was $0.11 (2018: $0.19). F
or p
erso
nal u
se o
nly
33
Indemnification and Insurance of Directors and Officers The Group insured its Directors, Secretary and Executive Officers for the financial year ended 30 June 2019. Under the Group’s Directors’ and Officers’ Liability Insurance Policy, the Group cannot release to any third party or otherwise publish details of the nature of the liabilities insured by the policy or the amount of the premium.
To the extent permitted by law and subject to the restrictions in section 199A and 199B of the Corporations Act 2001, the Group indemnifies every person who is or has been an officer of the Group against any liability (other than for legal costs) incurred by that person as an officer of the Group where the Group requested the officer to accept appointment as Director or Executive.
To the extent permitted by law and subject to the restrictions in sections 199A and 199B of the Corporations Act 2001, the Group indemnifies every person who is or has been an officer of the Group against reasonable legal costs incurred in defending an action for a liability incurred by that person as an officer of the Group.
Indemnification of Auditors To the extent permitted by law, the Group has agreed to indemnify its auditors, Ernst & Young, as part of the terms of its audit engagement agreement against claims by third parties arising from the audit (for an unspecified amount). No payment has been made to indemnify Ernst & Young during or since the financial year.
Employees As at 30 June 2019, ImpediMed and its subsidiaries had a total of 67 full and part-time employees (2018: 68 employees).
Diversity The Group has a formal written Diversity Policy that is published on ImpediMed’s website.
The Board adopted an updated Diversity Policy on 8 March 2017. The Board has the role of overseeing the implementation of this policy and assessing progress in achieving its objectives.
Diversity refers to characteristics that make individuals different from each other. Diversity encompasses differences in backgrounds and
experiences, and differences in approach and viewpoints. It includes factors such as gender, age, ethnicity, cultural background, language, disability and other areas of potential difference.
The diversity policy defines the initiatives that assist the Group in maintaining and improving the diversity of its workforce. To the extent practicable, the Group will address the recommendations and guidance provided in the ASX Corporate Governance Council’s Corporate Governance Principles and Recommendations (ASX Principles).
ImpediMed’s Commitment to Workplace Diversity The Group is committed to creating and ensuring a diverse work environment in which everyone is treated fairly and with respect and where everyone feels responsible for the reputation and performance of ImpediMed. The Board and Management of ImpediMed believe that ImpediMed’s commitment to this policy contributes to achieving corporate objectives and embeds the importance and value of diversity within the culture of the Group.
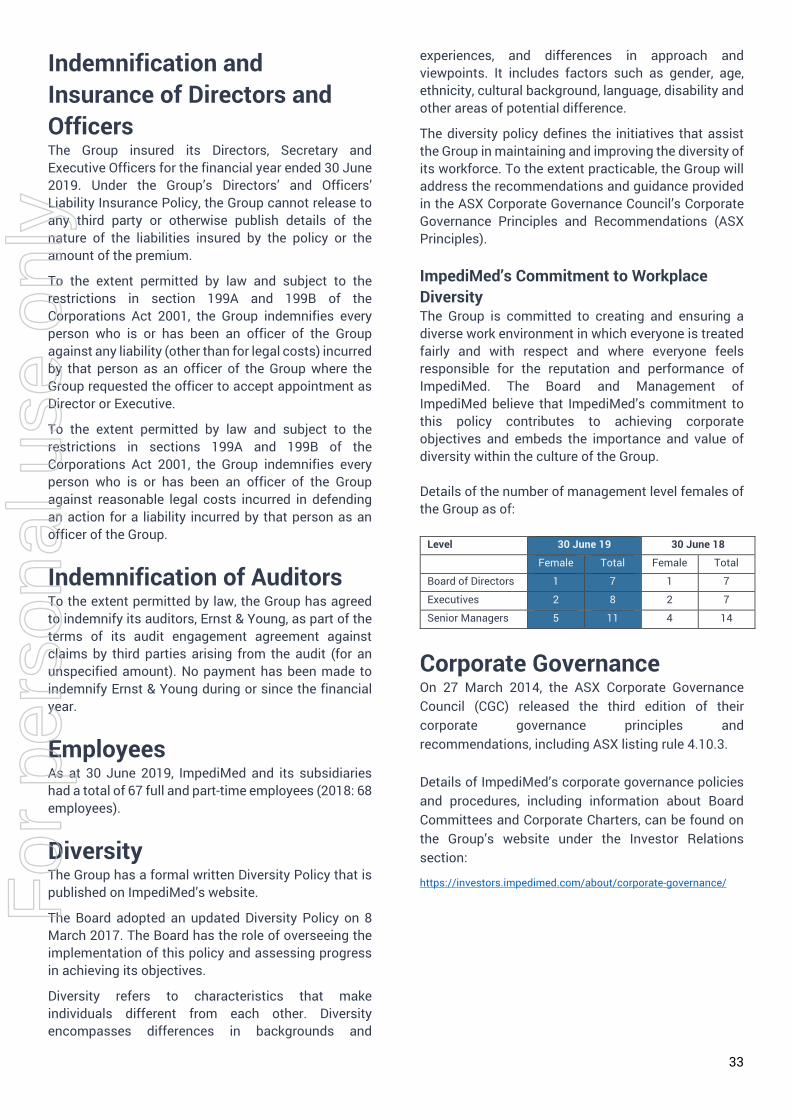
Details of the number of management level females of the Group as of:
Level 30 June 19 30 June 18
Female Total Female Total
Board of Directors 1 7 1 7
Executives 2 8 2 7
Senior Managers 5 11 4 14
Corporate Governance On 27 March 2014, the ASX Corporate Governance Council (CGC) released the third edition of their corporate governance principles and recommendations, including ASX listing rule 4.10.3.
Details of ImpediMed’s corporate governance policies and procedures, including information about Board Committees and Corporate Charters, can be found on the Group’s website under the Investor Relations section:
https://investors.impedimed.com/about/corporate-governance/ For
per
sona
l use
onl
y
For
per
sona
l use
onl
y
35
Remuneration Report This Remuneration Report outlines the remuneration arrangements for the Key Management Personnel (“KMP”) of the Group in accordance with the requirements of the Corporations Act 2001 (the Act) and its Regulations.
The report is structured into the following sections:
CONTENTS
SECTION 1 Introduction and Remuneration Committee Chair Letter Page 36
SECTION 2 Key Management Personnel (KMP) Page 39
SECTION 3 Remuneration Governance Page 39
SECTION 4 Consequence of Performance on Shareholder Value Page 41
SECTION 5 Executive Remuneration Philosophy and Strategy Page 41
SECTION 6 Remuneration of Non-Executive Directors (NED) Page 42
SECTION 7 Remuneration of Executives Page 43
SECTION 8 Executive Contractual Arrangements Page 52
SECTION 9 Managing Director and CEO (MD/CEO) Remuneration Page 53
SECTION 10 Statutory Tables Page 54
SECTION 11 Executive Comparator Group List Page 59
Definitions
Key Management Personnel (KMP)
Persons having authority and responsibility for planning, directing and controlling the activities of the Group, directly or indirectly, including any Director (whether Executive or otherwise) of the Group. KMP of the Group consists of Non-Executive Directors (NEDs), Executive Directors (EDs), and Executives. Refer to SECTION 2 of this report for a full list of the Group’s KMP.
Non-Executive Directors Directors of the Group that are not acting in an executive capacity.
Executive Director Is a Director of the Group that is also acting in an executive capacity. The Managing Director and CEO (MD/CEO) of the Group is considered an Officer of the Group and an Executive Director.
Executives Individuals defined as KMP that are Officers of the Group and not Non-Executive Directors of the Group.
For
per
sona
l use
onl
y
36
SECTION 1 Remuneration Committee Chair Letter
Dear Shareholder,
On behalf of the Board, I present ImpediMed’s Remuneration Report for financial year 2019.
The Group ended the financial year with over 400 SOZO units sold since launch, grew SOZO revenues by 164%, crossed the milestone of greater than 50% of revenues being generated from SOZO contracts and reported Total Contracted Revenue Pipeline of more than $8.7 million. This successful growth was partially the result of the Group announcing late in financial year 2019, the release of SOZO v3.0 software and the SOZO platform becoming Business Associate—compliant. In addition to these strong operational accomplishments, the Group also announced the long-awaited pre-specified interim results of its PREVENT trial which were presented at the 2019 Annual Meeting of the American Society of Breast Surgeons and published in the Annals of Surgical Oncology. Management also progressed the Heart Failure Program via a Peer-reviewed manuscript and poster focused on the use of BIS to aid in the monitoring of Heart Failure.
Despite the operational and development successes, the Board and executive team were not satisfied with the capital market’s reaction and the decrease in share value during financial year 2019. To better align Executive KMP remuneration with shareholder return, the MD/CEO recommended that the Executive KMP long-term incentive compensation be reduced to zero for financial year 2019. In addition to better aligning Executive KMP remuneration with performance and shareholders, the foregoing of long-term incentive shares by Executive KMPs ensured there would be an adequate option pool to recruit and retain new employees. After careful consideration, the Remuneration Committee and Board approved the recommendation made by the MD/CEO.
Throughout financial year 2019 and looking forward into financial year 2020, the Board and Remuneration Committee have been focused on responding to items raised by the “first strike” against the 2018
Remuneration Report. Section 1.1 of the Remuneration Report accompanying this letter sets out the action we have taken in response to the concerns expressed by shareholders in 2018. We are working to improve both the communications and messaging regarding remuneration for directors and Executive KMP to provide greater transparency to our shareholders.
To reinforce the compensation adjustment made to the LTIs during financial year 2019, the Remuneration Committee continues to focus on ways to both conserve the Group’s cash resources and at the same time, move the MD/CEO, CFO and NEDs to an equity remuneration model which better aligns with the risks and rewards of the shareholders.
The Remuneration Committee is recommending, for the financial year 2020 that the MD/CEO and CFO exchange 20% of their cash base salary for equity shares of the Group. The Remuneration Committee is also recommending that the NEDs exchange 100% of their cash Board fees for equity shares of the Group. The reduced cash remuneration outlays will allow management to better focus the Group’s cash resources on growing and retaining its highly talented employee pool and advancing its development programs. Increasing the equity holdings of the MD/CEO, CFO and NEDs will better align them with the risks and rewards of our shareholders.
The Board, supported by the Remuneration Committee, is committed to good governance in remuneration and to ensuring that the Group’s policies and practices are fair, competitive and responsible. The Board is also committed to open dialogue with shareholders and ensuring transparent communication of remuneration arrangements.
We look forward to the year ahead and are grateful for your continued support.
Don Williams, Non-Executive Director Chair, Remuneration Committee
For
per
sona
l use
onl
y
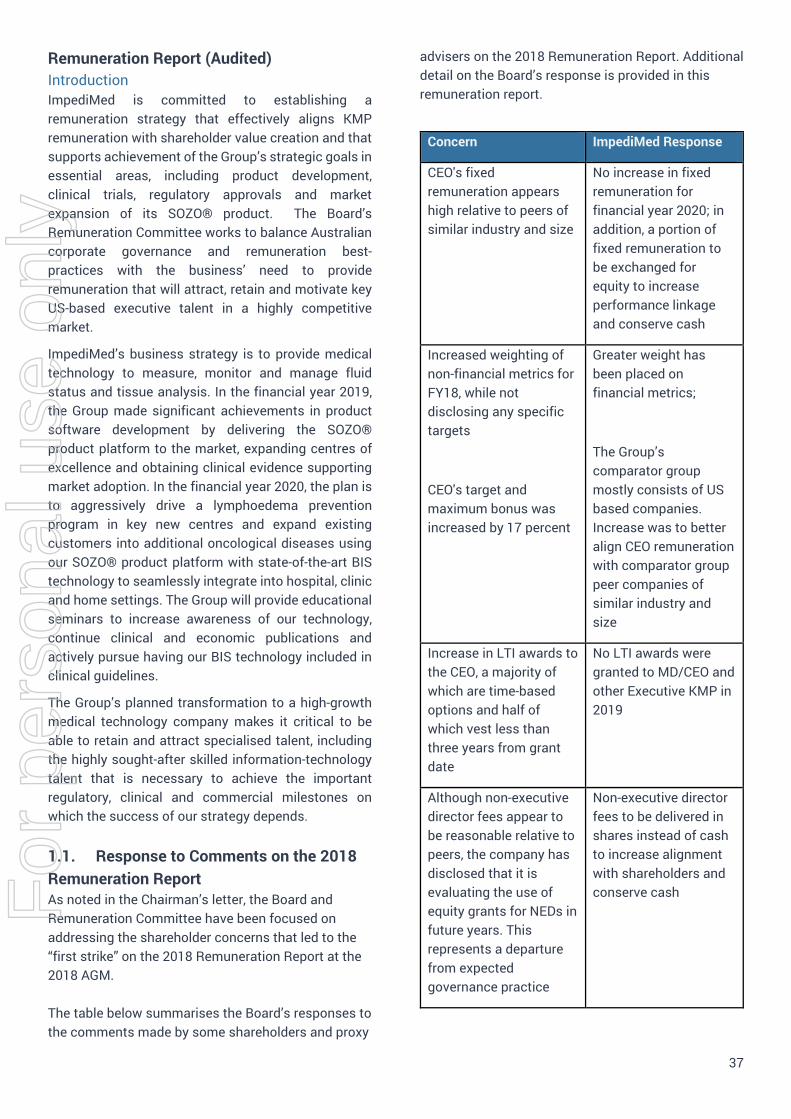
37
Remuneration Report (Audited) Introduction ImpediMed is committed to establishing a remuneration strategy that effectively aligns KMP remuneration with shareholder value creation and that supports achievement of the Group’s strategic goals in essential areas, including product development, clinical trials, regulatory approvals and market expansion of its SOZO® product. The Board’s Remuneration Committee works to balance Australian corporate governance and remuneration best-practices with the business’ need to provide remuneration that will attract, retain and motivate key US-based executive talent in a highly competitive market.
ImpediMed’s business strategy is to provide medical technology to measure, monitor and manage fluid status and tissue analysis. In the financial year 2019, the Group made significant achievements in product software development by delivering the SOZO® product platform to the market, expanding centres of excellence and obtaining clinical evidence supporting market adoption. In the financial year 2020, the plan is to aggressively drive a lymphoedema prevention program in key new centres and expand existing customers into additional oncological diseases using our SOZO® product platform with state-of-the-art BIS technology to seamlessly integrate into hospital, clinic and home settings. The Group will provide educational seminars to increase awareness of our technology, continue clinical and economic publications and actively pursue having our BIS technology included in clinical guidelines.
The Group’s planned transformation to a high-growth medical technology company makes it critical to be able to retain and attract specialised talent, including the highly sought-after skilled information-technology talent that is necessary to achieve the important regulatory, clinical and commercial milestones on which the success of our strategy depends.
1.1. Response to Comments on the 2018 Remuneration Report As noted in the Chairman’s letter, the Board and Remuneration Committee have been focused on addressing the shareholder concerns that led to the “first strike” on the 2018 Remuneration Report at the 2018 AGM.
The table below summarises the Board’s responses to the comments made by some shareholders and proxy
advisers on the 2018 Remuneration Report. Additional detail on the Board’s response is provided in this remuneration report.
Concern ImpediMed Response
CEO's fixed remuneration appears high relative to peers of similar industry and size
No increase in fixed remuneration for financial year 2020; in addition, a portion of fixed remuneration to be exchanged for equity to increase performance linkage and conserve cash
Increased weighting of non-financial metrics for FY18, while not disclosing any specific targets
CEO's target and maximum bonus was increased by 17 percent
Greater weight has been placed on financial metrics;
The Group’s comparator group mostly consists of US based companies. Increase was to better align CEO remuneration with comparator group peer companies of similar industry and size
Increase in LTI awards to the CEO, a majority of which are time-based options and half of which vest less than three years from grant date
No LTI awards were granted to MD/CEO and other Executive KMP in 2019
Although non-executive director fees appear to be reasonable relative to peers, the company has disclosed that it is evaluating the use of equity grants for NEDs in future years. This represents a departure from expected governance practice
Non-executive director fees to be delivered in shares instead of cash to increase alignment with shareholders and conserve cash F
or p
erso
nal u
se o
nly
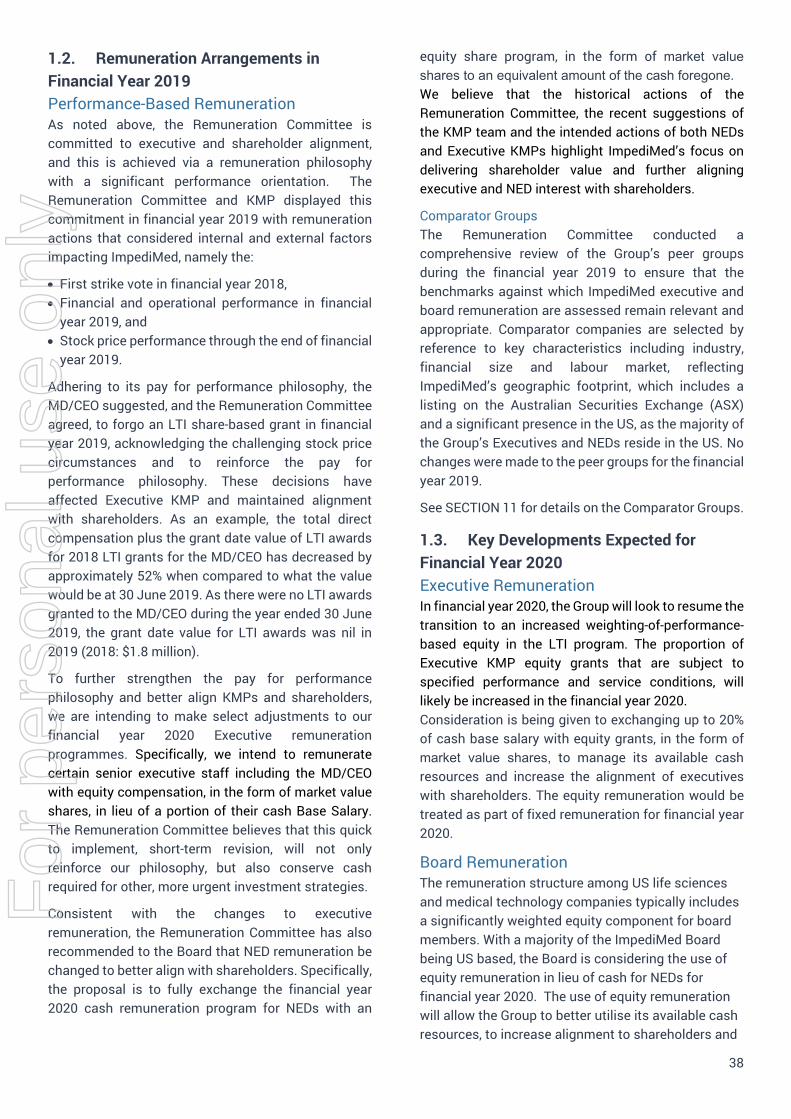
38
1.2. Remuneration Arrangements in Financial Year 2019 Performance-Based Remuneration As noted above, the Remuneration Committee is committed to executive and shareholder alignment, and this is achieved via a remuneration philosophy with a significant performance orientation. The Remuneration Committee and KMP displayed this commitment in financial year 2019 with remuneration actions that considered internal and external factors impacting ImpediMed, namely the:
First strike vote in financial year 2018, Financial and operational performance in financial
year 2019, and Stock price performance through the end of financial
year 2019.
Adhering to its pay for performance philosophy, the MD/CEO suggested, and the Remuneration Committee agreed, to forgo an LTI share-based grant in financial year 2019, acknowledging the challenging stock price circumstances and to reinforce the pay for performance philosophy. These decisions have affected Executive KMP and maintained alignment with shareholders. As an example, the total direct compensation plus the grant date value of LTI awards for 2018 LTI grants for the MD/CEO has decreased by approximately 52% when compared to what the value would be at 30 June 2019. As there were no LTI awards granted to the MD/CEO during the year ended 30 June 2019, the grant date value for LTI awards was nil in 2019 (2018: $1.8 million).
To further strengthen the pay for performance philosophy and better align KMPs and shareholders, we are intending to make select adjustments to our financial year 2020 Executive remuneration programmes. Specifically, we intend to remunerate certain senior executive staff including the MD/CEO with equity compensation, in the form of market value shares, in lieu of a portion of their cash Base Salary. The Remuneration Committee believes that this quick to implement, short-term revision, will not only reinforce our philosophy, but also conserve cash required for other, more urgent investment strategies.
Consistent with the changes to executive remuneration, the Remuneration Committee has also recommended to the Board that NED remuneration be changed to better align with shareholders. Specifically, the proposal is to fully exchange the financial year 2020 cash remuneration program for NEDs with an
equity share program, in the form of market value
shares to an equivalent amount of the cash foregone. We believe that the historical actions of the Remuneration Committee, the recent suggestions of the KMP team and the intended actions of both NEDs and Executive KMPs highlight ImpediMed’s focus on delivering shareholder value and further aligning executive and NED interest with shareholders.
Comparator Groups The Remuneration Committee conducted a comprehensive review of the Group’s peer groups during the financial year 2019 to ensure that the benchmarks against which ImpediMed executive and board remuneration are assessed remain relevant and appropriate. Comparator companies are selected by reference to key characteristics including industry, financial size and labour market, reflecting ImpediMed’s geographic footprint, which includes a listing on the Australian Securities Exchange (ASX) and a significant presence in the US, as the majority of the Group’s Executives and NEDs reside in the US. No changes were made to the peer groups for the financial year 2019.
See SECTION 11 for details on the Comparator Groups.
1.3. Key Developments Expected for Financial Year 2020 Executive Remuneration In financial year 2020, the Group will look to resume the transition to an increased weighting-of-performance-based equity in the LTI program. The proportion of Executive KMP equity grants that are subject to specified performance and service conditions, will likely be increased in the financial year 2020. Consideration is being given to exchanging up to 20% of cash base salary with equity grants, in the form of market value shares, to manage its available cash resources and increase the alignment of executives with shareholders. The equity remuneration would be treated as part of fixed remuneration for financial year 2020.
Board Remuneration The remuneration structure among US life sciences and medical technology companies typically includes a significantly weighted equity component for board members. With a majority of the ImpediMed Board being US based, the Board is considering the use of equity remuneration in lieu of cash for NEDs for financial year 2020. The use of equity remuneration will allow the Group to better utilise its available cash resources, to increase alignment to shareholders and
For
per
sona
l use
onl
y
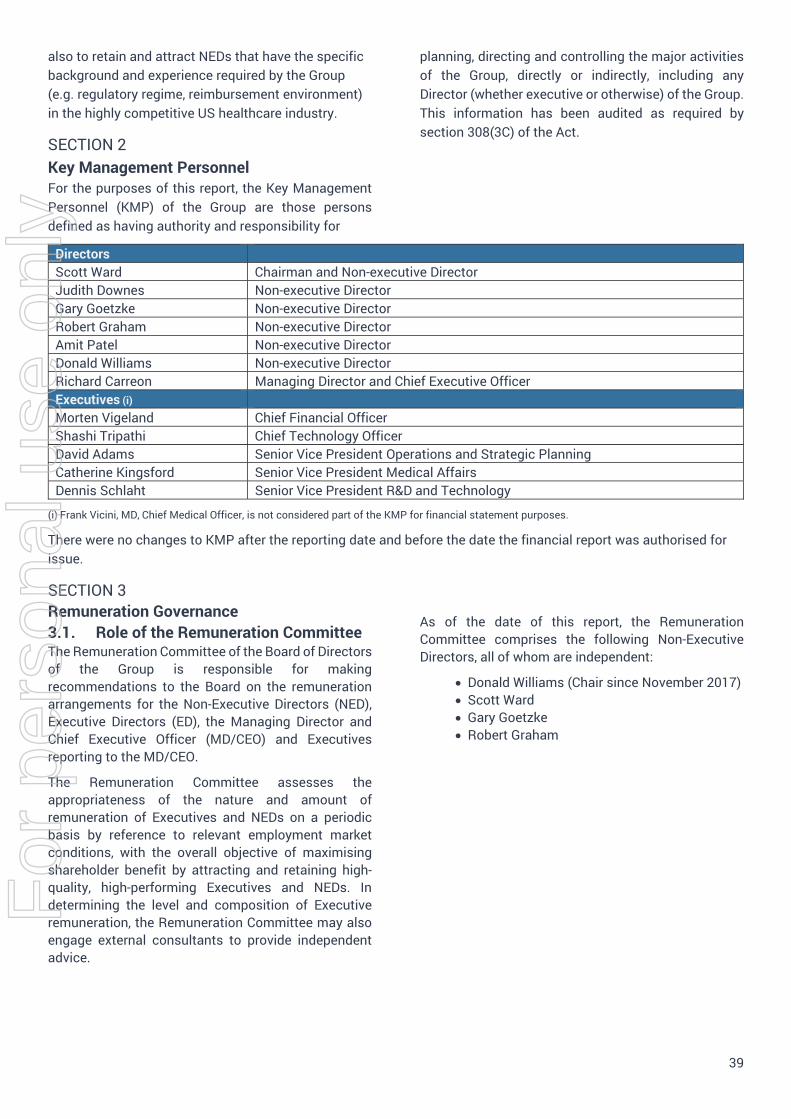
39
also to retain and attract NEDs that have the specific background and experience required by the Group (e.g. regulatory regime, reimbursement environment) in the highly competitive US healthcare industry.
SECTION 2 Key Management Personnel For the purposes of this report, the Key Management Personnel (KMP) of the Group are those persons defined as having authority and responsibility for
planning, directing and controlling the major activities of the Group, directly or indirectly, including any Director (whether executive or otherwise) of the Group. This information has been audited as required by section 308(3C) of the Act.
Directors Scott Ward Chairman and Non-executive Director Judith Downes Non-executive Director Gary Goetzke Non-executive Director Robert Graham Non-executive Director Amit Patel Non-executive Director Donald Williams Non-executive Director Richard Carreon Managing Director and Chief Executive Officer Executives (i) Morten Vigeland Chief Financial Officer Shashi Tripathi Chief Technology Officer David Adams Senior Vice President Operations and Strategic Planning Catherine Kingsford Senior Vice President Medical Affairs Dennis Schlaht Senior Vice President R&D and Technology
(i) Frank Vicini, MD, Chief Medical Officer, is not considered part of the KMP for financial statement purposes.
There were no changes to KMP after the reporting date and before the date the financial report was authorised for issue.
SECTION 3 Remuneration Governance 3.1. Role of the Remuneration Committee The Remuneration Committee of the Board of Directors of the Group is responsible for making recommendations to the Board on the remuneration arrangements for the Non-Executive Directors (NED), Executive Directors (ED), the Managing Director and Chief Executive Officer (MD/CEO) and Executives reporting to the MD/CEO.
The Remuneration Committee assesses the appropriateness of the nature and amount of remuneration of Executives and NEDs on a periodic basis by reference to relevant employment market conditions, with the overall objective of maximising shareholder benefit by attracting and retaining high-quality, high-performing Executives and NEDs. In determining the level and composition of Executive remuneration, the Remuneration Committee may also engage external consultants to provide independent advice.
As of the date of this report, the Remuneration Committee comprises the following Non-Executive Directors, all of whom are independent:
Donald Williams (Chair since November 2017) Scott Ward Gary Goetzke Robert Graham
For
per
sona
l use
onl
y
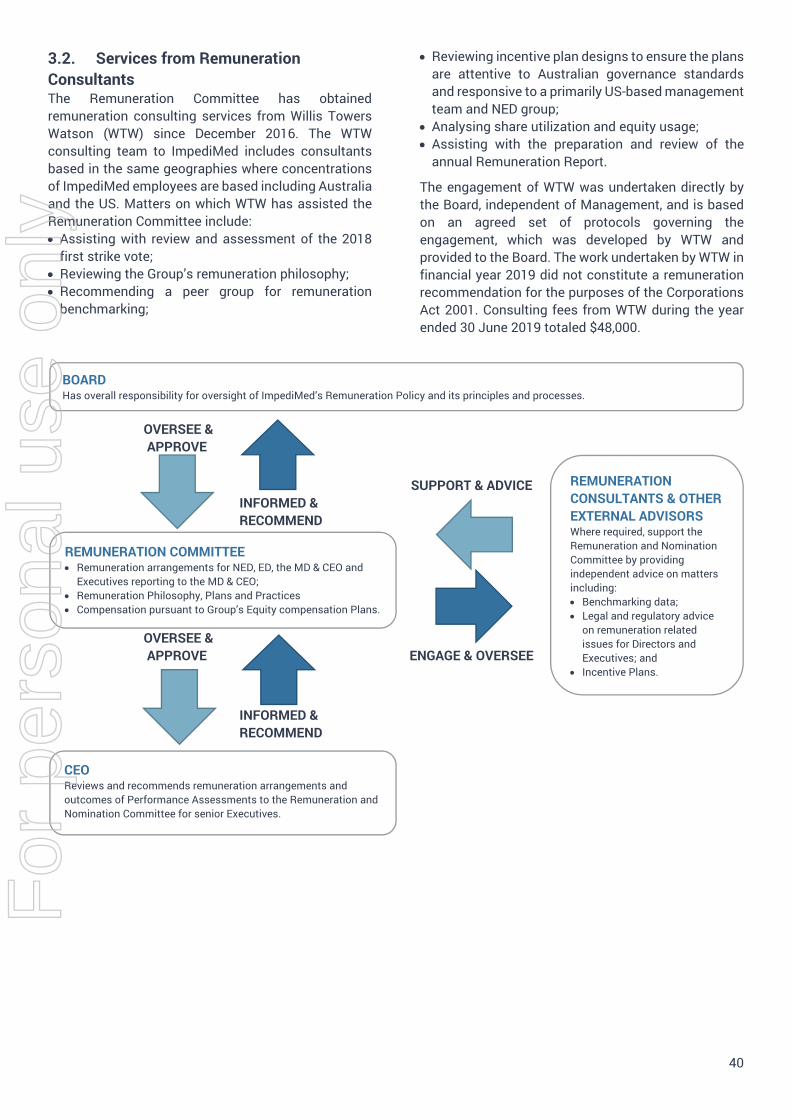
40
3.2. Services from Remuneration Consultants The Remuneration Committee has obtained remuneration consulting services from Willis Towers Watson (WTW) since December 2016. The WTW consulting team to ImpediMed includes consultants based in the same geographies where concentrations of ImpediMed employees are based including Australia and the US. Matters on which WTW has assisted the Remuneration Committee include: Assisting with review and assessment of the 2018
first strike vote; Reviewing the Group’s remuneration philosophy; Recommending a peer group for remuneration
benchmarking;
Reviewing incentive plan designs to ensure the plansare attentive to Australian governance standardsand responsive to a primarily US-based managementteam and NED group;
Analysing share utilization and equity usage; Assisting with the preparation and review of the
annual Remuneration Report.
The engagement of WTW was undertaken directly by the Board, independent of Management, and is based on an agreed set of protocols governing the engagement, which was developed by WTW and provided to the Board. The work undertaken by WTW in financial year 2019 did not constitute a remuneration recommendation for the purposes of the Corporations Act 2001. Consulting fees from WTW during the year ended 30 June 2019 totaled $48,000.
OVERSEE & APPROVE
SUPPORT & ADVICE INFORMED & RECOMMEND
OVERSEE & APPROVE ENGAGE & OVERSEE
INFORMED & RECOMMEND
BOARD Has overall responsibility for oversight of ImpediMed’s Remuneration Policy and its principles and processes.
REMUNERATION COMMITTEE Remuneration arrangements for NED, ED, the MD & CEO and
Executives reporting to the MD & CEO; Remuneration Philosophy, Plans and Practices Compensation pursuant to Group’s Equity compensation Plans.
REMUNERATION CONSULTANTS & OTHER EXTERNAL ADVISORS Where required, support the Remuneration and Nomination Committee by providing independent advice on matters including: Benchmarking data; Legal and regulatory advice
on remuneration relatedissues for Directors andExecutives; and
Incentive Plans.
CEO Reviews and recommends remuneration arrangements and outcomes of Performance Assessments to the Remuneration and Nomination Committee for senior Executives.
For
per
sona
l use
onl
y
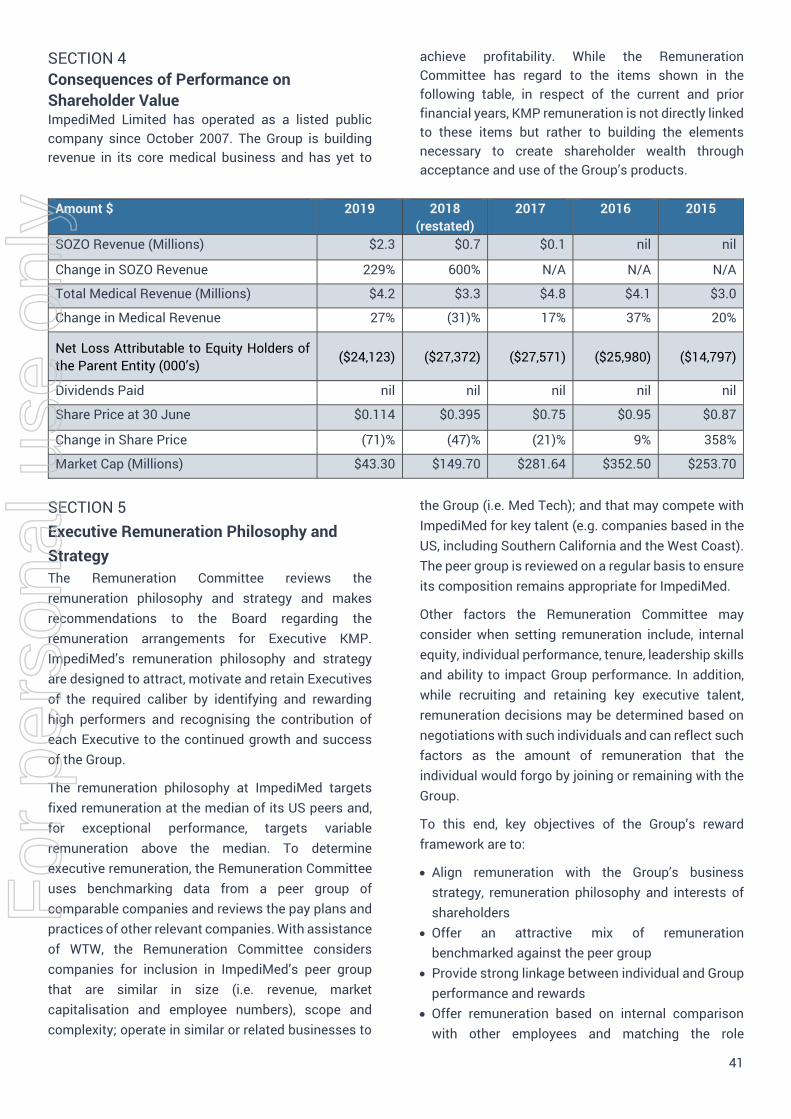
41
SECTION 4 Consequences of Performance on Shareholder Value ImpediMed Limited has operated as a listed public company since October 2007. The Group is building revenue in its core medical business and has yet to
achieve profitability. While the Remuneration Committee has regard to the items shown in the following table, in respect of the current and prior financial years, KMP remuneration is not directly linked to these items but rather to building the elements necessary to create shareholder wealth through acceptance and use of the Group’s products.
Amount $ 2019 2018 (restated)
2017 2016 2015
SOZO Revenue (Millions) $2.3 $0.7 $0.1 nil nil
Change in SOZO Revenue 229% 600% N/A N/A N/A
Total Medical Revenue (Millions) $4.2 $3.3 $4.8 $4.1 $3.0
Change in Medical Revenue 27% (31)% 17% 37% 20%
Net Loss Attributable to Equity Holders of the Parent Entity (000’s) ($24,123) ($27,372) ($27,571) ($25,980) ($14,797)
Dividends Paid nil nil nil nil nil
Share Price at 30 June $0.114 $0.395 $0.75 $0.95 $0.87
Change in Share Price (71)% (47)% (21)% 9% 358%
Market Cap (Millions) $43.30 $149.70 $281.64 $352.50 $253.70
SECTION 5 Executive Remuneration Philosophy and Strategy The Remuneration Committee reviews the remuneration philosophy and strategy and makes recommendations to the Board regarding the remuneration arrangements for Executive KMP. ImpediMed’s remuneration philosophy and strategy are designed to attract, motivate and retain Executives of the required caliber by identifying and rewarding high performers and recognising the contribution of each Executive to the continued growth and success of the Group.
The remuneration philosophy at ImpediMed targets fixed remuneration at the median of its US peers and, for exceptional performance, targets variable remuneration above the median. To determine executive remuneration, the Remuneration Committee uses benchmarking data from a peer group of comparable companies and reviews the pay plans and practices of other relevant companies. With assistance of WTW, the Remuneration Committee considers companies for inclusion in ImpediMed’s peer group that are similar in size (i.e. revenue, market capitalisation and employee numbers), scope and complexity; operate in similar or related businesses to
the Group (i.e. Med Tech); and that may compete with ImpediMed for key talent (e.g. companies based in the US, including Southern California and the West Coast). The peer group is reviewed on a regular basis to ensure its composition remains appropriate for ImpediMed.
Other factors the Remuneration Committee may consider when setting remuneration include, internal equity, individual performance, tenure, leadership skills and ability to impact Group performance. In addition, while recruiting and retaining key executive talent, remuneration decisions may be determined based on negotiations with such individuals and can reflect such factors as the amount of remuneration that the individual would forgo by joining or remaining with the Group.
To this end, key objectives of the Group’s reward framework are to:
Align remuneration with the Group’s businessstrategy, remuneration philosophy and interests ofshareholders
Offer an attractive mix of remunerationbenchmarked against the peer group
Provide strong linkage between individual and Groupperformance and rewards
Offer remuneration based on internal comparisonwith other employees and matching the role
For
per
sona
l use
onl
y
42
requirements with the skills, experience and responsibilities of individual executives. Support the corporate mission statement, values and policies through recruiting, organising and managing high achieving individuals committed to the Group’s success
While continuing to pursue this remuneration strategy, the Remuneration Committee and Board vary arrangements as needed to meet immediate priorities. During financial year 2019, for example, as recommended by the MD/CEO, planned LTI equity awards were not made to Executive KMP.
In addition, for financial year 2020, consideration is being given to providing up to 20% of the base salary of Executive KMP in the form of equity, in the form of market value shares. This quick-to-implement modification to the historical cash-based salary will allow greater flexibility to manage available cash resources and increase the alignment of executives’ remuneration to shareholders’ expectations.
SECTION 6 Remuneration of Non-Executive Directors (NEDs) The Remuneration Committee considers the level of remuneration required to attract and retain highly qualified Non-Executive Directors with the necessary skills and experience for the Group’s board. This remuneration is reviewed annually with regard to market practice and NED duties, responsibilities and accountability. This remuneration was reviewed in 2019 relative to similarly sized ASX-listed companies in the healthcare sector, as well as medical technology companies in the US, given NED membership is currently 67% US and 33% Australian.
NED fees are determined within an aggregate Directors’ fee pool, approved by shareholders at the annual general meeting (AGM). The maximum aggregate remuneration approved in 2015 was $800,000. The sum of NED fees, including committee-related fees paid in 2019, was $619,235 (2018: $586,931).
A majority of Board members are based in the US where the healthcare industry is highly competitive and typically structures remuneration so that it is
heavy weighting toward equity. To assist the company in managing its available cash resources, increase the alignment of the NED remuneration with shareholders’ interests and ensure that NED remuneration is attractive in both Australia and the US, for financial year 2020, consideration is being given to providing NED remuneration in the form of equity, in the form of market value shares, in lieu of cash. The Group’s current NED remuneration is positioned around the lower quartile of the US peer group, with the lack of equity contributing to this lower competitive positioning.
Table 10.1 shows individual Director fees paid during the financial year ended 30 June 2019.
For
per
sona
l use
onl
y
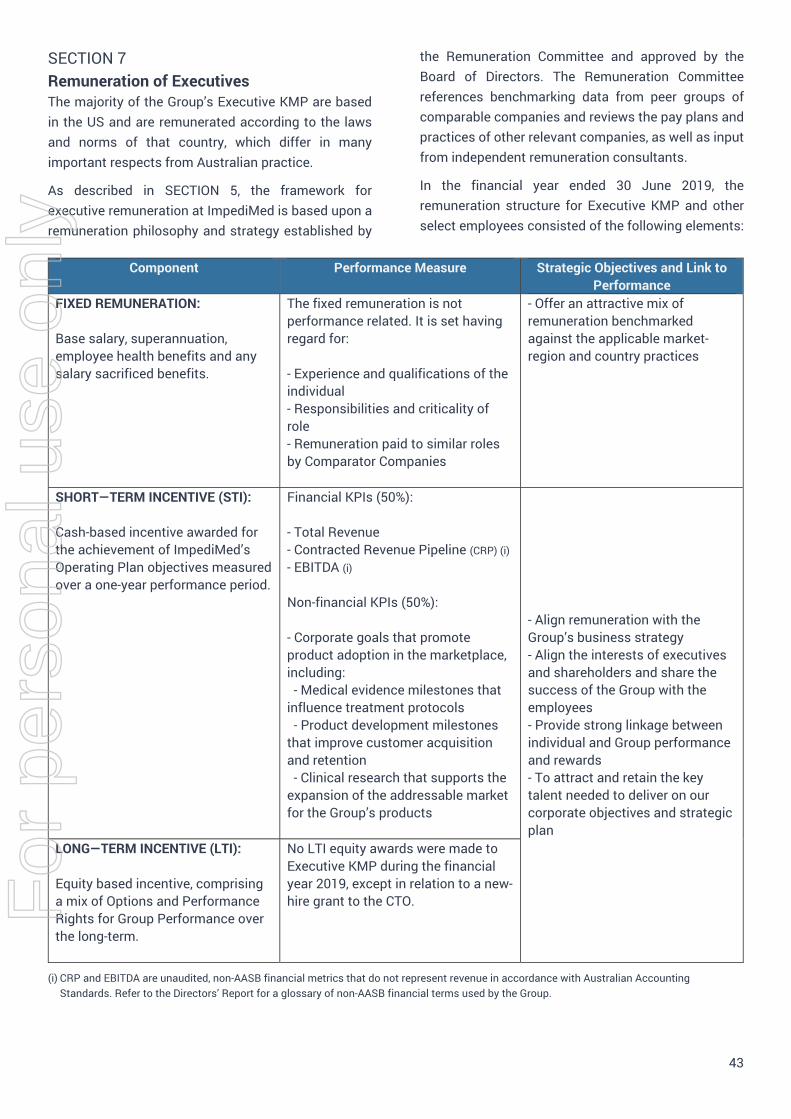
43
SECTION 7 Remuneration of Executives The majority of the Group’s Executive KMP are based in the US and are remunerated according to the laws and norms of that country, which differ in many important respects from Australian practice.
As described in SECTION 5, the framework for executive remuneration at ImpediMed is based upon a remuneration philosophy and strategy established by
the Remuneration Committee and approved by the Board of Directors. The Remuneration Committee references benchmarking data from peer groups of comparable companies and reviews the pay plans and practices of other relevant companies, as well as input from independent remuneration consultants.
In the financial year ended 30 June 2019, the remuneration structure for Executive KMP and other select employees consisted of the following elements:
Component Performance Measure Strategic Objectives and Link to Performance
FIXED REMUNERATION:
Base salary, superannuation, employee health benefits and any salary sacrificed benefits.
The fixed remuneration is not performance related. It is set having regard for:
- Experience and qualifications of the individual - Responsibilities and criticality of role - Remuneration paid to similar roles by Comparator Companies
- Offer an attractive mix of remuneration benchmarked against the applicable market-region and country practices
SHORT—TERM INCENTIVE (STI):
Cash-based incentive awarded for the achievement of ImpediMed’s Operating Plan objectives measured over a one-year performance period.
Financial KPIs (50%):
- Total Revenue - Contracted Revenue Pipeline (CRP) (i) - EBITDA (i)
Non-financial KPIs (50%):
- Corporate goals that promote product adoption in the marketplace, including: - Medical evidence milestones that influence treatment protocols - Product development milestones that improve customer acquisition and retention - Clinical research that supports the expansion of the addressable market for the Group’s products
- Align remuneration with the Group’s business strategy - Align the interests of executives and shareholders and share the success of the Group with the employees - Provide strong linkage between individual and Group performance and rewards - To attract and retain the key talent needed to deliver on our corporate objectives and strategic plan
LONG—TERM INCENTIVE (LTI):
Equity based incentive, comprising a mix of Options and Performance Rights for Group Performance over the long-term.
No LTI equity awards were made to Executive KMP during the financial year 2019, except in relation to a new-hire grant to the CTO.
(i) CRP and EBITDA are unaudited, non-AASB financial metrics that do not represent revenue in accordance with Australian Accounting Standards. Refer to the Directors’ Report for a glossary of non-AASB financial terms used by the Group.
For
per
sona
l use
onl
y

44
7.1. Fixed Remuneration Fixed remuneration consists of base salary, superannuation and other entitlement benefits that vary by state or country. Fixed remuneration is not “at risk” as it does not vary with the performance of the Group.
Fixed remuneration is not automatically increased but is reviewed annually, to ensure it remains competitive.
As described in SECTION 5, fixed remuneration for Executives is determined based upon bench-marking data from a peer group of comparable companies. In addition to reviewing benchmarking survey data, when setting fixed remuneration for any given role, the Remuneration Committee has regard to the experience, qualifications and skill set of the individual, as well as the responsibilities and criticality of the role.
As noted above, consideration is being given to exchanging up to 20% of the base salary for Executive KMP with equity. Any such equity awards will be treated as part of fixed remuneration.
For
per
sona
l use
onl
y
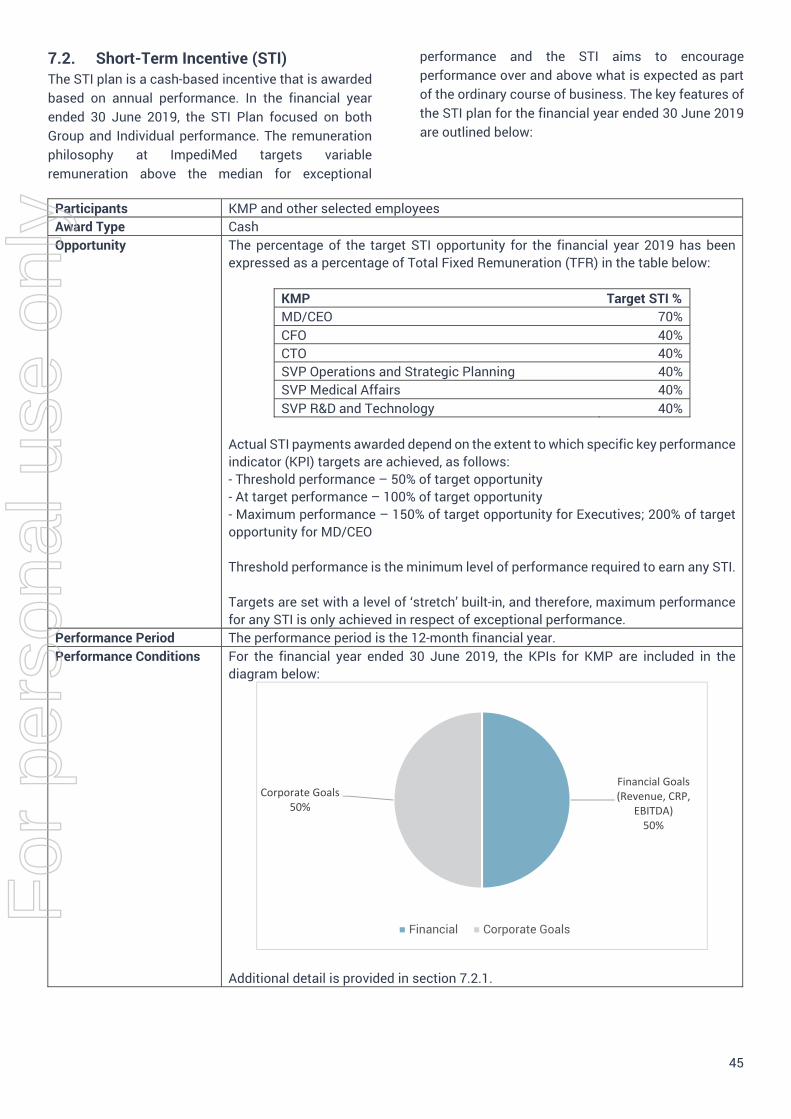
45
7.2. Short-Term Incentive (STI) The STI plan is a cash-based incentive that is awarded based on annual performance. In the financial year ended 30 June 2019, the STI Plan focused on both Group and Individual performance. The remuneration philosophy at ImpediMed targets variable remuneration above the median for exceptional
performance and the STI aims to encourage performance over and above what is expected as part of the ordinary course of business. The key features of the STI plan for the financial year ended 30 June 2019 are outlined below:
Participants KMP and other selected employees Award Type Cash Opportunity The percentage of the target STI opportunity for the financial year 2019 has been
expressed as a percentage of Total Fixed Remuneration (TFR) in the table below:
KMP Target STI % MD/CEO 70% CFO 40% CTO 40% SVP Operations and Strategic Planning 40% SVP Medical Affairs 40% SVP R&D and Technology 40%
Actual STI payments awarded depend on the extent to which specific key performance indicator (KPI) targets are achieved, as follows: - Threshold performance – 50% of target opportunity - At target performance – 100% of target opportunity - Maximum performance – 150% of target opportunity for Executives; 200% of target opportunity for MD/CEO
Threshold performance is the minimum level of performance required to earn any STI.
Targets are set with a level of ‘stretch’ built-in, and therefore, maximum performance for any STI is only achieved in respect of exceptional performance.
Performance Period The performance period is the 12-month financial year. Performance Conditions For the financial year ended 30 June 2019, the KPIs for KMP are included in the
diagram below:
Additional detail is provided in section 7.2.1.
Financial Goals(Revenue, CRP,
EBITDA)50%
Corporate Goals50%
Financial Corporate Goals
For
per
sona
l use
onl
y
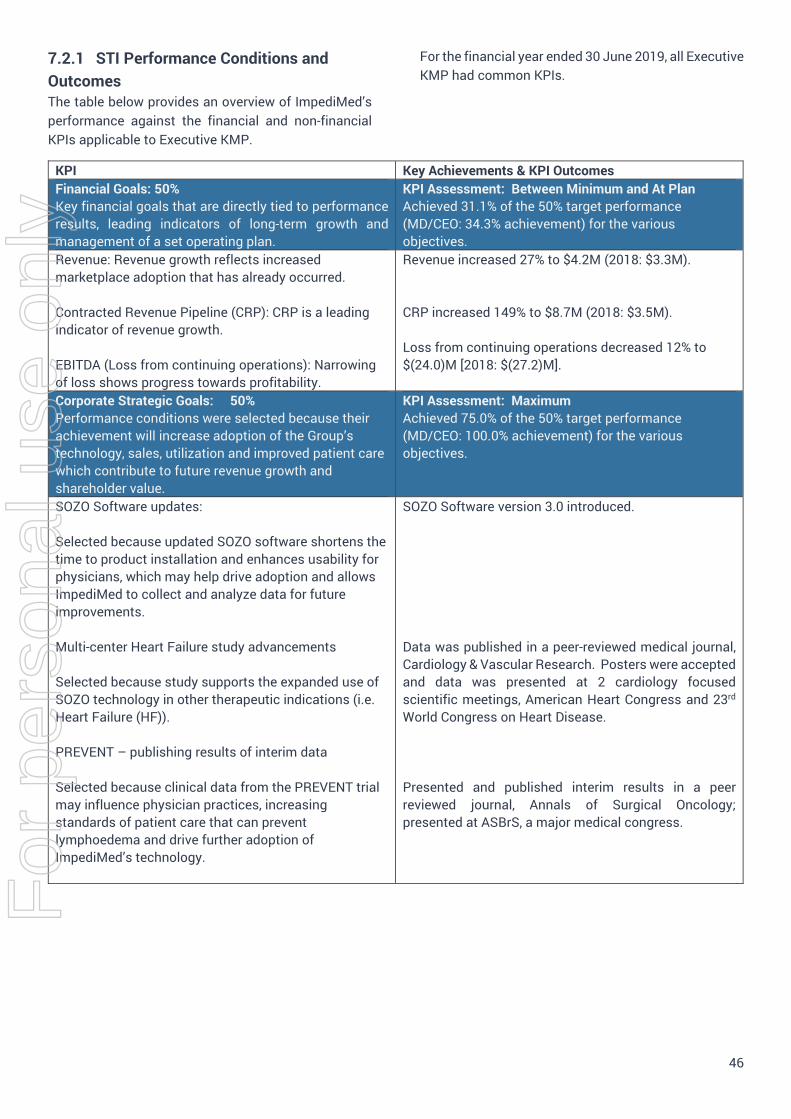
46
7.2.1 STI Performance Conditions and Outcomes The table below provides an overview of ImpediMed’s performance against the financial and non-financial KPIs applicable to Executive KMP.
For the financial year ended 30 June 2019, all Executive KMP had common KPIs.
KPI Key Achievements & KPI Outcomes Financial Goals: 50% Key financial goals that are directly tied to performance results, leading indicators of long-term growth and management of a set operating plan.
KPI Assessment: Between Minimum and At Plan Achieved 31.1% of the 50% target performance (MD/CEO: 34.3% achievement) for the various objectives.
Revenue: Revenue growth reflects increased marketplace adoption that has already occurred.
Contracted Revenue Pipeline (CRP): CRP is a leading indicator of revenue growth.
EBITDA (Loss from continuing operations): Narrowing of loss shows progress towards profitability.
Revenue increased 27% to $4.2M (2018: $3.3M).
CRP increased 149% to $8.7M (2018: $3.5M).
Loss from continuing operations decreased 12% to $(24.0)M [2018: $(27.2)M].
Corporate Strategic Goals: 50% Performance conditions were selected because their achievement will increase adoption of the Group’s technology, sales, utilization and improved patient care which contribute to future revenue growth and shareholder value.
KPI Assessment: Maximum Achieved 75.0% of the 50% target performance (MD/CEO: 100.0% achievement) for the various objectives.
SOZO Software updates:
Selected because updated SOZO software shortens the time to product installation and enhances usability for physicians, which may help drive adoption and allows ImpediMed to collect and analyze data for future improvements.
Multi-center Heart Failure study advancements
Selected because study supports the expanded use of SOZO technology in other therapeutic indications (i.e. Heart Failure (HF)).
PREVENT – publishing results of interim data
Selected because clinical data from the PREVENT trial may influence physician practices, increasing standards of patient care that can prevent lymphoedema and drive further adoption of ImpediMed’s technology.
SOZO Software version 3.0 introduced.
Data was published in a peer-reviewed medical journal, Cardiology & Vascular Research. Posters were accepted and data was presented at 2 cardiology focused scientific meetings, American Heart Congress and 23rd World Congress on Heart Disease.
Presented and published interim results in a peer reviewed journal, Annals of Surgical Oncology; presented at ASBrS, a major medical congress.
For
per
sona
l use
onl
y
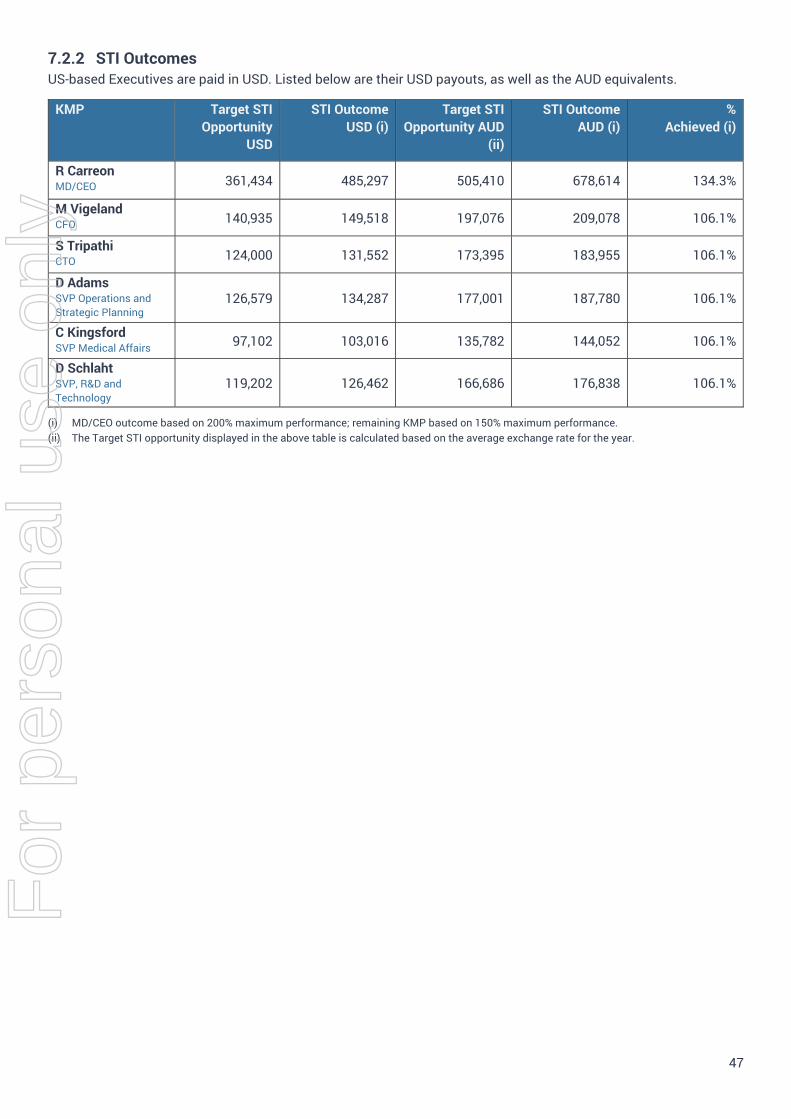
47
7.2.2 STI Outcomes US-based Executives are paid in USD. Listed below are their USD payouts, as well as the AUD equivalents.
KMP Target STI Opportunity
USD
STI Outcome USD (i)
Target STI Opportunity AUD
(ii)
STI Outcome AUD (i)
% Achieved (i)
R Carreon MD/CEO 361,434 485,297 505,410 678,614 134.3%
M Vigeland CFO 140,935 149,518 197,076 209,078 106.1%
S Tripathi CTO 124,000 131,552 173,395 183,955 106.1%
D Adams SVP Operations and Strategic Planning
126,579 134,287 177,001 187,780 106.1%
C Kingsford SVP Medical Affairs 97,102 103,016 135,782 144,052 106.1%
D Schlaht SVP, R&D and Technology
119,202 126,462 166,686 176,838 106.1%
(i) MD/CEO outcome based on 200% maximum performance; remaining KMP based on 150% maximum performance. (ii) The Target STI opportunity displayed in the above table is calculated based on the average exchange rate for the year.
For
per
sona
l use
onl
y
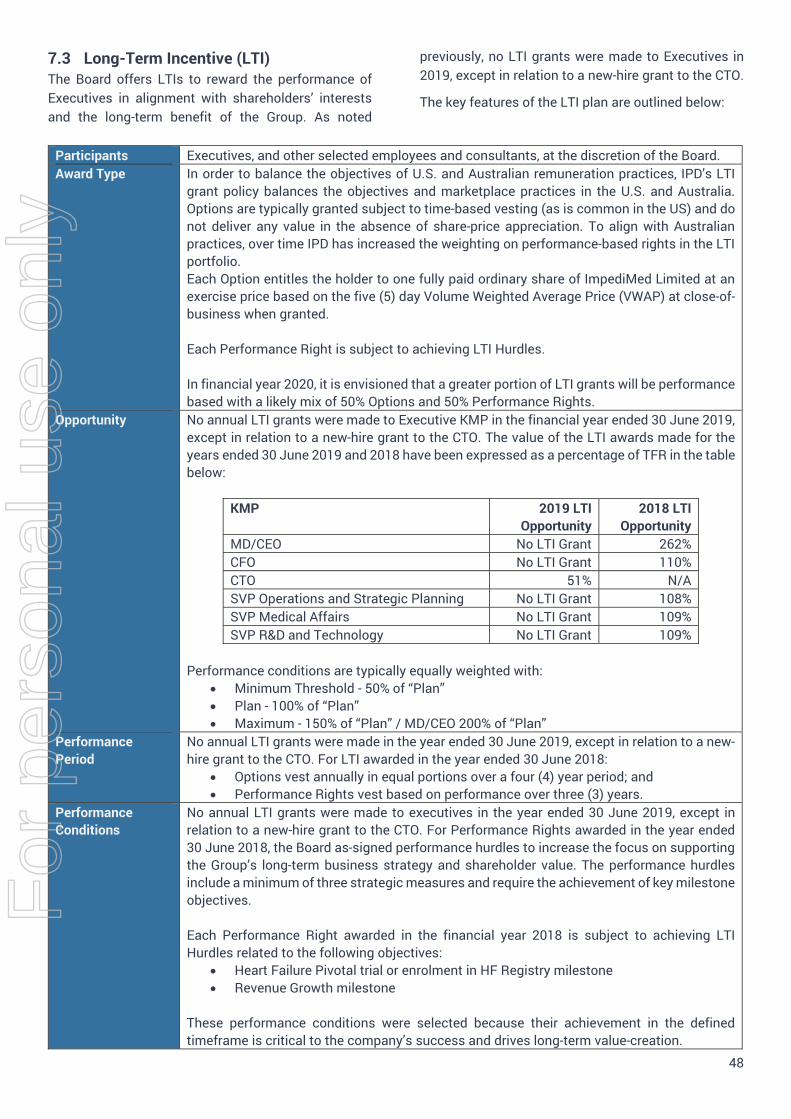
48
7.3 Long-Term Incentive (LTI) The Board offers LTIs to reward the performance of Executives in alignment with shareholders’ interests and the long-term benefit of the Group. As noted
previously, no LTI grants were made to Executives in 2019, except in relation to a new-hire grant to the CTO.
The key features of the LTI plan are outlined below:
Participants Executives, and other selected employees and consultants, at the discretion of the Board. Award Type In order to balance the objectives of U.S. and Australian remuneration practices, IPD’s LTI
grant policy balances the objectives and marketplace practices in the U.S. and Australia. Options are typically granted subject to time-based vesting (as is common in the US) and do not deliver any value in the absence of share-price appreciation. To align with Australian practices, over time IPD has increased the weighting on performance-based rights in the LTI portfolio. Each Option entitles the holder to one fully paid ordinary share of ImpediMed Limited at an exercise price based on the five (5) day Volume Weighted Average Price (VWAP) at close-of-business when granted.
Each Performance Right is subject to achieving LTI Hurdles.
In financial year 2020, it is envisioned that a greater portion of LTI grants will be performance based with a likely mix of 50% Options and 50% Performance Rights.
Opportunity No annual LTI grants were made to Executive KMP in the financial year ended 30 June 2019, except in relation to a new-hire grant to the CTO. The value of the LTI awards made for the years ended 30 June 2019 and 2018 have been expressed as a percentage of TFR in the table below:
KMP 2019 LTIOpportunity
2018 LTI Opportunity
MD/CEO No LTI Grant 262% CFO No LTI Grant 110% CTO 51% N/A SVP Operations and Strategic Planning No LTI Grant 108% SVP Medical Affairs No LTI Grant 109% SVP R&D and Technology No LTI Grant 109%
Performance conditions are typically equally weighted with: Minimum Threshold - 50% of “Plan” Plan - 100% of “Plan” Maximum - 150% of “Plan” / MD/CEO 200% of “Plan”
Performance Period
No annual LTI grants were made in the year ended 30 June 2019, except in relation to a new-hire grant to the CTO. For LTI awarded in the year ended 30 June 2018:
Options vest annually in equal portions over a four (4) year period; and Performance Rights vest based on performance over three (3) years.
Performance Conditions
No annual LTI grants were made to executives in the year ended 30 June 2019, except in relation to a new-hire grant to the CTO. For Performance Rights awarded in the year ended 30 June 2018, the Board as-signed performance hurdles to increase the focus on supporting the Group’s long-term business strategy and shareholder value. The performance hurdles include a minimum of three strategic measures and require the achievement of key milestone objectives.
Each Performance Right awarded in the financial year 2018 is subject to achieving LTI Hurdles related to the following objectives:
Heart Failure Pivotal trial or enrolment in HF Registry milestone Revenue Growth milestone
These performance conditions were selected because their achievement in the defined timeframe is critical to the company’s success and drives long-term value-creation.
For
per
sona
l use
onl
y
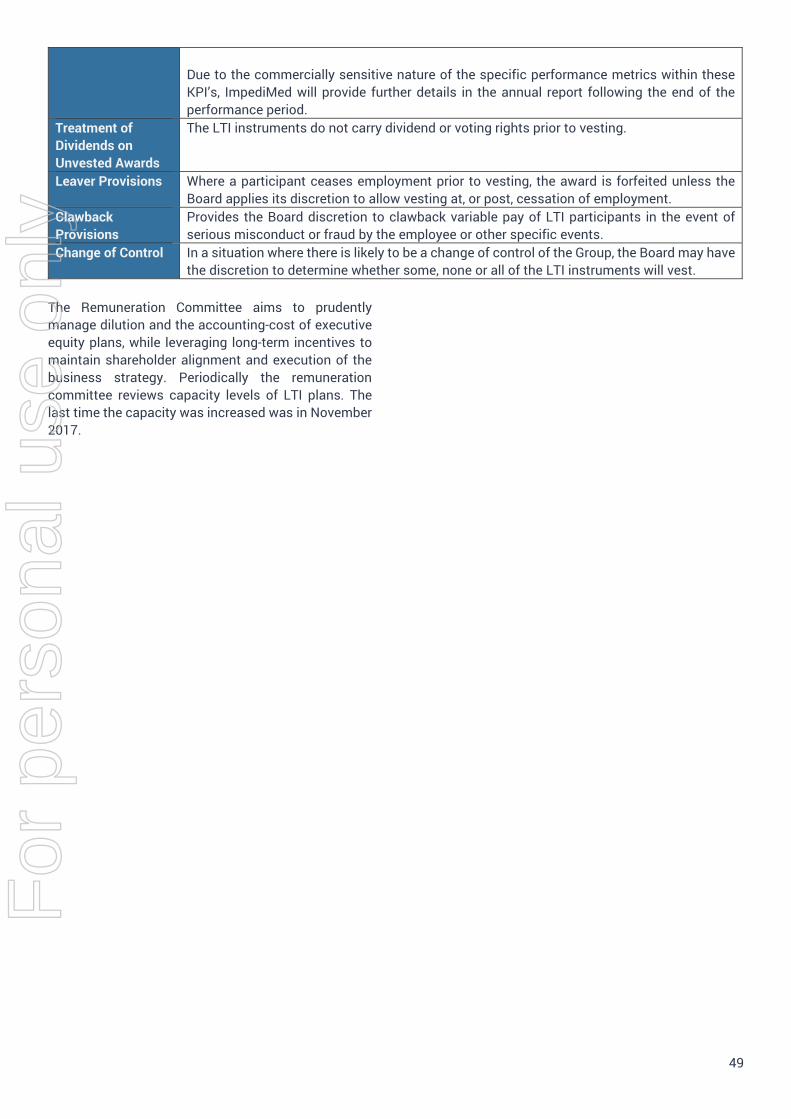
49
Due to the commercially sensitive nature of the specific performance metrics within these KPI’s, ImpediMed will provide further details in the annual report following the end of the performance period.
Treatment of Dividends on Unvested Awards
The LTI instruments do not carry dividend or voting rights prior to vesting.
Leaver Provisions Where a participant ceases employment prior to vesting, the award is forfeited unless the Board applies its discretion to allow vesting at, or post, cessation of employment.
Clawback Provisions
Provides the Board discretion to clawback variable pay of LTI participants in the event of serious misconduct or fraud by the employee or other specific events.
Change of Control In a situation where there is likely to be a change of control of the Group, the Board may have the discretion to determine whether some, none or all of the LTI instruments will vest.
The Remuneration Committee aims to prudently manage dilution and the accounting-cost of executive equity plans, while leveraging long-term incentives to maintain shareholder alignment and execution of the business strategy. Periodically the remuneration committee reviews capacity levels of LTI plans. The last time the capacity was increased was in November 2017.
For
per
sona
l use
onl
y
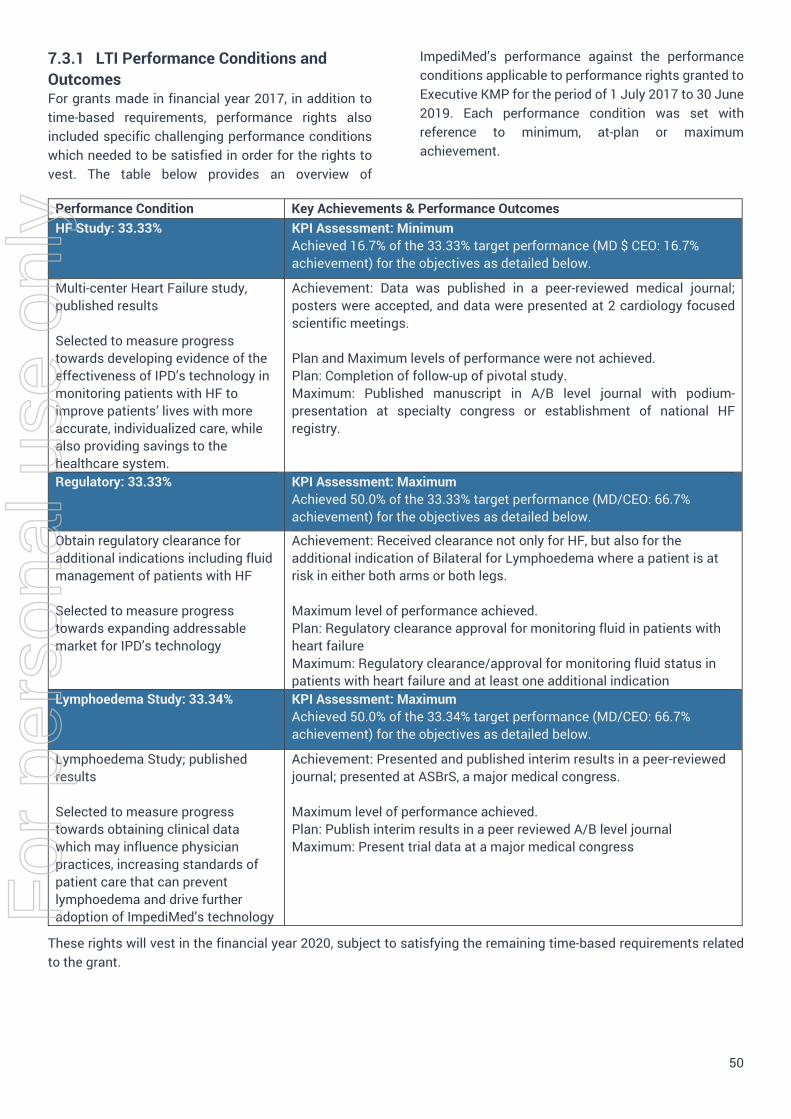
50
7.3.1 LTI Performance Conditions and Outcomes For grants made in financial year 2017, in addition to time-based requirements, performance rights also included specific challenging performance conditions which needed to be satisfied in order for the rights to vest. The table below provides an overview of
ImpediMed’s performance against the performance conditions applicable to performance rights granted to Executive KMP for the period of 1 July 2017 to 30 June 2019. Each performance condition was set with reference to minimum, at-plan or maximum achievement.
Performance Condition Key Achievements & Performance Outcomes HF Study: 33.33% KPI Assessment: Minimum
Achieved 16.7% of the 33.33% target performance (MD $ CEO: 16.7% achievement) for the objectives as detailed below.
Multi-center Heart Failure study, published results
Selected to measure progress towards developing evidence of the effectiveness of IPD’s technology in monitoring patients with HF to improve patients’ lives with more accurate, individualized care, while also providing savings to the healthcare system.
Achievement: Data was published in a peer-reviewed medical journal; posters were accepted, and data were presented at 2 cardiology focused scientific meetings.
Plan and Maximum levels of performance were not achieved. Plan: Completion of follow-up of pivotal study. Maximum: Published manuscript in A/B level journal with podium-presentation at specialty congress or establishment of national HF registry.
Regulatory: 33.33% KPI Assessment: Maximum Achieved 50.0% of the 33.33% target performance (MD/CEO: 66.7% achievement) for the objectives as detailed below.
Obtain regulatory clearance for additional indications including fluid management of patients with HF
Selected to measure progress towards expanding addressable market for IPD’s technology
Achievement: Received clearance not only for HF, but also for the additional indication of Bilateral for Lymphoedema where a patient is at risk in either both arms or both legs.
Maximum level of performance achieved. Plan: Regulatory clearance approval for monitoring fluid in patients with heart failure Maximum: Regulatory clearance/approval for monitoring fluid status in patients with heart failure and at least one additional indication
Lymphoedema Study: 33.34% KPI Assessment: Maximum Achieved 50.0% of the 33.34% target performance (MD/CEO: 66.7% achievement) for the objectives as detailed below.
Lymphoedema Study; published results
Selected to measure progress towards obtaining clinical data which may influence physician practices, increasing standards of patient care that can prevent lymphoedema and drive further adoption of ImpediMed’s technology
Achievement: Presented and published interim results in a peer-reviewed journal; presented at ASBrS, a major medical congress.
Maximum level of performance achieved. Plan: Publish interim results in a peer reviewed A/B level journal Maximum: Present trial data at a major medical congress
These rights will vest in the financial year 2020, subject to satisfying the remaining time-based requirements related to the grant.
For
per
sona
l use
onl
y
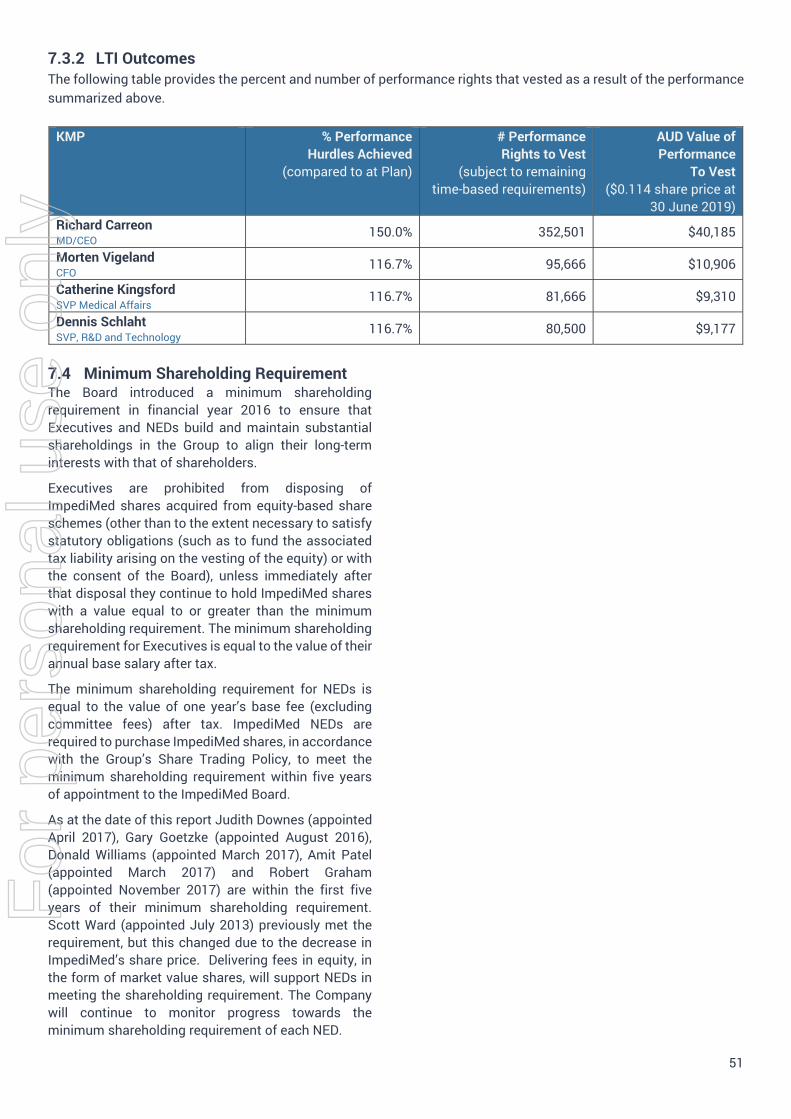
51
7.3.2 LTI Outcomes The following table provides the percent and number of performance rights that vested as a result of the performance summarized above.
KMP % Performance Hurdles Achieved
(compared to at Plan)
# Performance Rights to Vest
(subject to remaining time-based requirements)
AUD Value of Performance
To Vest ($0.114 share price at
30 June 2019) Richard Carreon MD/CEO
150.0% 352,501 $40,185
Morten Vigeland CFO
116.7% 95,666 $10,906
Catherine Kingsford SVP Medical Affairs
116.7% 81,666 $9,310
Dennis Schlaht SVP, R&D and Technology
116.7% 80,500 $9,177
7.4 Minimum Shareholding Requirement The Board introduced a minimum shareholding requirement in financial year 2016 to ensure that Executives and NEDs build and maintain substantial shareholdings in the Group to align their long-term interests with that of shareholders.
Executives are prohibited from disposing of ImpediMed shares acquired from equity-based share schemes (other than to the extent necessary to satisfy statutory obligations (such as to fund the associated tax liability arising on the vesting of the equity) or with the consent of the Board), unless immediately after that disposal they continue to hold ImpediMed shares with a value equal to or greater than the minimum shareholding requirement. The minimum shareholding requirement for Executives is equal to the value of their annual base salary after tax.
The minimum shareholding requirement for NEDs is equal to the value of one year’s base fee (excluding committee fees) after tax. ImpediMed NEDs are required to purchase ImpediMed shares, in accordance with the Group’s Share Trading Policy, to meet the minimum shareholding requirement within five years of appointment to the ImpediMed Board.
As at the date of this report Judith Downes (appointed April 2017), Gary Goetzke (appointed August 2016), Donald Williams (appointed March 2017), Amit Patel (appointed March 2017) and Robert Graham (appointed November 2017) are within the first five years of their minimum shareholding requirement. Scott Ward (appointed July 2013) previously met the requirement, but this changed due to the decrease in ImpediMed’s share price. Delivering fees in equity, in the form of market value shares, will support NEDs in meeting the shareholding requirement. The Company will continue to monitor progress towards the minimum shareholding requirement of each NED.
For
per
sona
l use
onl
y
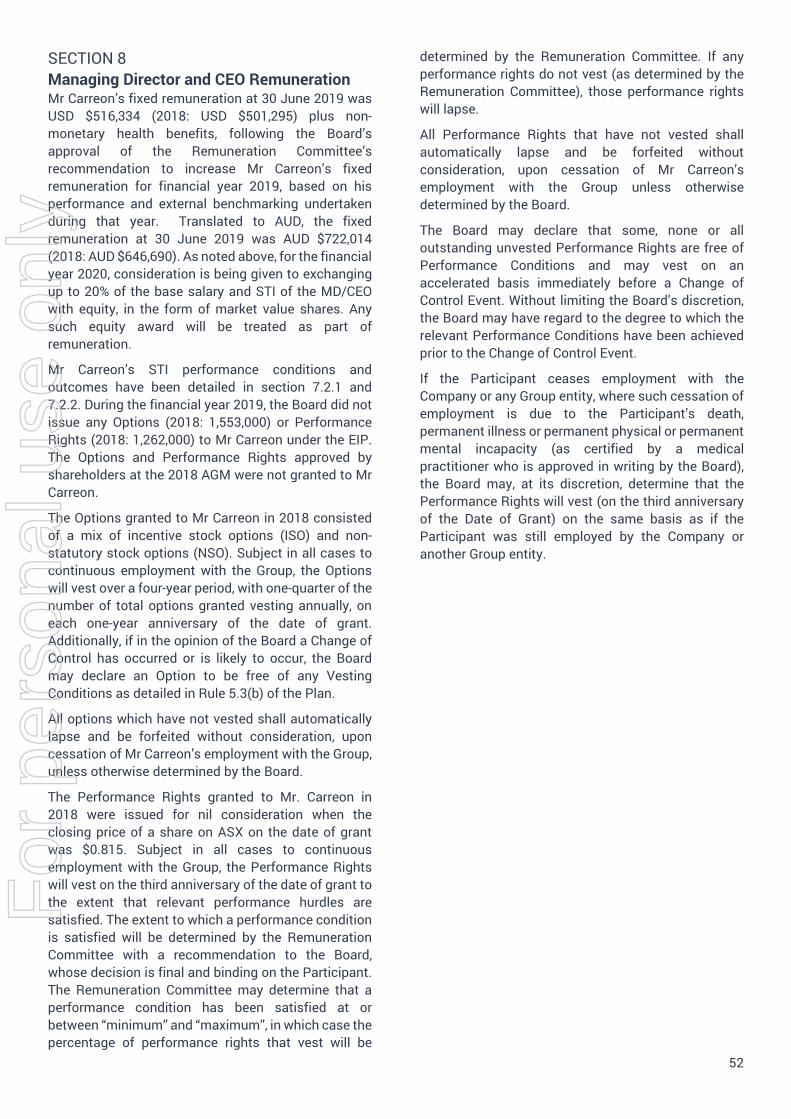
52
SECTION 8 Managing Director and CEO Remuneration Mr Carreon’s fixed remuneration at 30 June 2019 was USD $516,334 (2018: USD $501,295) plus non-monetary health benefits, following the Board’s approval of the Remuneration Committee’s recommendation to increase Mr Carreon’s fixed remuneration for financial year 2019, based on his performance and external benchmarking undertaken during that year. Translated to AUD, the fixed remuneration at 30 June 2019 was AUD $722,014 (2018: AUD $646,690). As noted above, for the financial year 2020, consideration is being given to exchanging up to 20% of the base salary and STI of the MD/CEO with equity, in the form of market value shares. Any such equity award will be treated as part of remuneration.
Mr Carreon’s STI performance conditions and outcomes have been detailed in section 7.2.1 and 7.2.2. During the financial year 2019, the Board did not issue any Options (2018: 1,553,000) or Performance Rights (2018: 1,262,000) to Mr Carreon under the EIP. The Options and Performance Rights approved by shareholders at the 2018 AGM were not granted to Mr Carreon.
The Options granted to Mr Carreon in 2018 consisted of a mix of incentive stock options (ISO) and non-statutory stock options (NSO). Subject in all cases to continuous employment with the Group, the Options will vest over a four-year period, with one-quarter of the number of total options granted vesting annually, on each one-year anniversary of the date of grant. Additionally, if in the opinion of the Board a Change of Control has occurred or is likely to occur, the Board may declare an Option to be free of any Vesting Conditions as detailed in Rule 5.3(b) of the Plan.
All options which have not vested shall automatically lapse and be forfeited without consideration, upon cessation of Mr Carreon’s employment with the Group, unless otherwise determined by the Board.
The Performance Rights granted to Mr. Carreon in 2018 were issued for nil consideration when the closing price of a share on ASX on the date of grant was $0.815. Subject in all cases to continuous employment with the Group, the Performance Rights will vest on the third anniversary of the date of grant to the extent that relevant performance hurdles are satisfied. The extent to which a performance condition is satisfied will be determined by the Remuneration Committee with a recommendation to the Board, whose decision is final and binding on the Participant. The Remuneration Committee may determine that a performance condition has been satisfied at or between “minimum” and “maximum”, in which case the percentage of performance rights that vest will be
determined by the Remuneration Committee. If any performance rights do not vest (as determined by the Remuneration Committee), those performance rights will lapse.
All Performance Rights that have not vested shall automatically lapse and be forfeited without consideration, upon cessation of Mr Carreon’s employment with the Group unless otherwise determined by the Board.
The Board may declare that some, none or all outstanding unvested Performance Rights are free of Performance Conditions and may vest on an accelerated basis immediately before a Change of Control Event. Without limiting the Board’s discretion, the Board may have regard to the degree to which the relevant Performance Conditions have been achieved prior to the Change of Control Event.
If the Participant ceases employment with the Company or any Group entity, where such cessation of employment is due to the Participant’s death, permanent illness or permanent physical or permanent mental incapacity (as certified by a medical practitioner who is approved in writing by the Board), the Board may, at its discretion, determine that the Performance Rights will vest (on the third anniversary of the Date of Grant) on the same basis as if the Participant was still employed by the Company or another Group entity.
For
per
sona
l use
onl
y
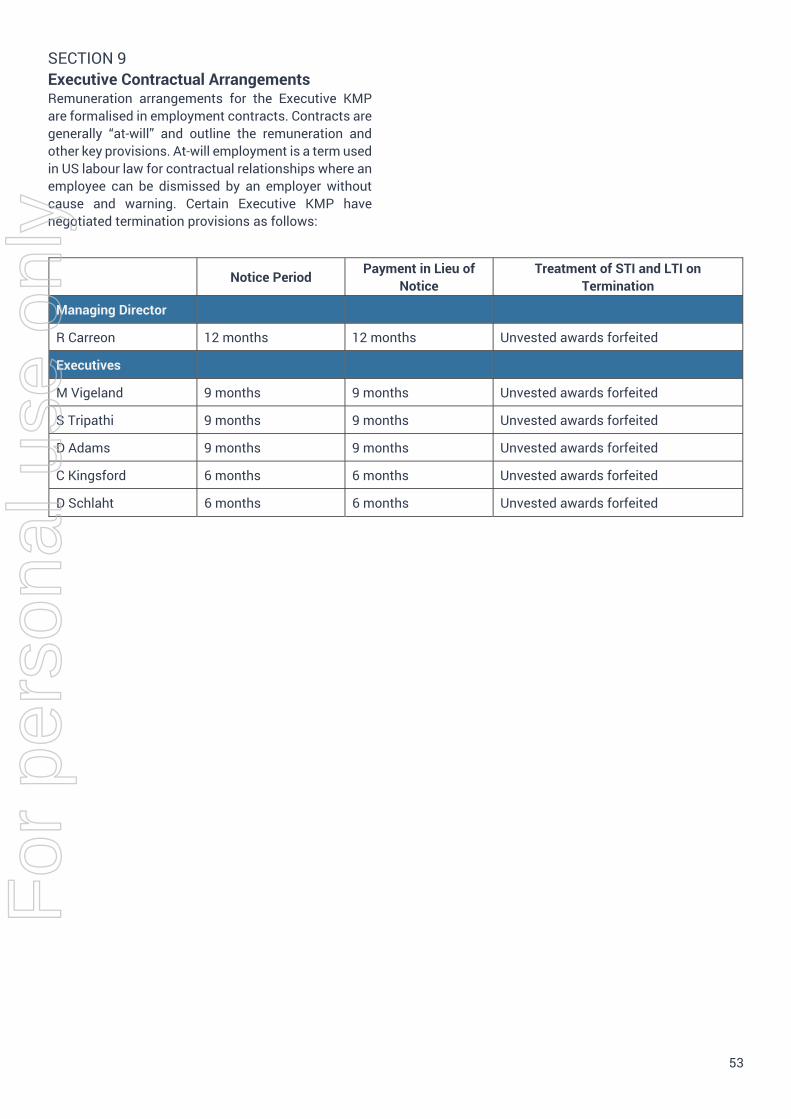
53
SECTION 9 Executive Contractual Arrangements Remuneration arrangements for the Executive KMP are formalised in employment contracts. Contracts are generally “at-will” and outline the remuneration and other key provisions. At-will employment is a term used in US labour law for contractual relationships where an employee can be dismissed by an employer without cause and warning. Certain Executive KMP have negotiated termination provisions as follows:
Notice Period Payment in Lieu of Notice
Treatment of STI and LTI on Termination
Managing Director
R Carreon 12 months 12 months Unvested awards forfeited
Executives
M Vigeland 9 months 9 months Unvested awards forfeited
S Tripathi 9 months 9 months Unvested awards forfeited
D Adams 9 months 9 months Unvested awards forfeited
C Kingsford 6 months 6 months Unvested awards forfeited
D Schlaht 6 months 6 months Unvested awards forfeited
For
per
sona
l use
onl
y
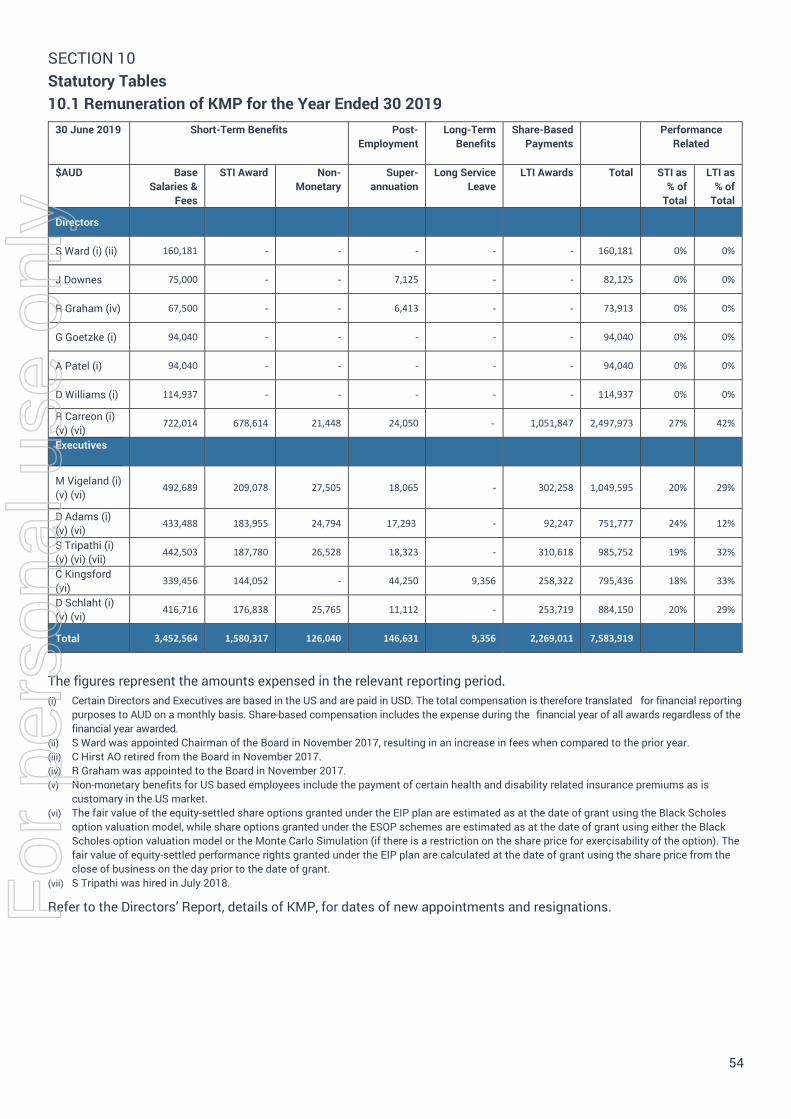
54
SECTION 10 Statutory Tables 10.1 Remuneration of KMP for the Year Ended 30 2019
30 June 2019 Short-Term Benefits Post-Employment
Long-Term Benefits
Share-Based Payments
PerformanceRelated
$AUD Base Salaries &
Fees
STI Award Non-Monetary
Super-annuation
Long Service Leave
LTI Awards Total STI as % of
Total
LTI as % of
Total
Directors
S Ward (i) (ii) 160,181 - - - - - 160,181 0% 0%
J Downes 75,000 - - 7,125 - - 82,125 0% 0%
R Graham (iv) 67,500 - - 6,413 - - 73,913 0% 0%
G Goetzke (i) 94,040 - - - - - 94,040 0% 0%
A Patel (i) 94,040 - - - - - 94,040 0% 0%
D Williams (i) 114,937 - - - - - 114,937 0% 0%
R Carreon (i) (v) (vi)
722,014 678,614 21,448 24,050 - 1,051,847 2,497,973 27% 42%
Executives
M Vigeland (i) (v) (vi)
492,689 209,078 27,505 18,065 - 302,258 1,049,595 20% 29%
D Adams (i) (v) (vi)
433,488 183,955 24,794 17,293 - 92,247 751,777 24% 12%
S Tripathi (i) (v) (vi) (vii)
442,503 187,780 26,528 18,323 - 310,618 985,752 19% 32%
C Kingsford (vi)
339,456 144,052 - 44,250 9,356 258,322 795,436 18% 33%
D Schlaht (i) (v) (vi)
416,716 176,838 25,765 11,112 ‐ 253,719 884,150 20% 29%
Total 3,452,564 1,580,317 126,040 146,631 9,356 2,269,011 7,583,919
The figures represent the amounts expensed in the relevant reporting period. (i) Certain Directors and Executives are based in the US and are paid in USD. The total compensation is therefore translated for financial reporting
purposes to AUD on a monthly basis. Share-based compensation includes the expense during the financial year of all awards regardless of the financial year awarded.
(ii) S Ward was appointed Chairman of the Board in November 2017, resulting in an increase in fees when compared to the prior year. (iii) C Hirst AO retired from the Board in November 2017. (iv) R Graham was appointed to the Board in November 2017. (v) Non-monetary benefits for US based employees include the payment of certain health and disability related insurance premiums as is
customary in the US market. (vi) The fair value of the equity-settled share options granted under the EIP plan are estimated as at the date of grant using the Black Scholes
option valuation model, while share options granted under the ESOP schemes are estimated as at the date of grant using either the Black Scholes option valuation model or the Monte Carlo Simulation (if there is a restriction on the share price for exercisability of the option). The fair value of equity-settled performance rights granted under the EIP plan are calculated at the date of grant using the share price from the close of business on the day prior to the date of grant.
(vii) S Tripathi was hired in July 2018.
Refer to the Directors’ Report, details of KMP, for dates of new appointments and resignations. For
per
sona
l use
onl
y
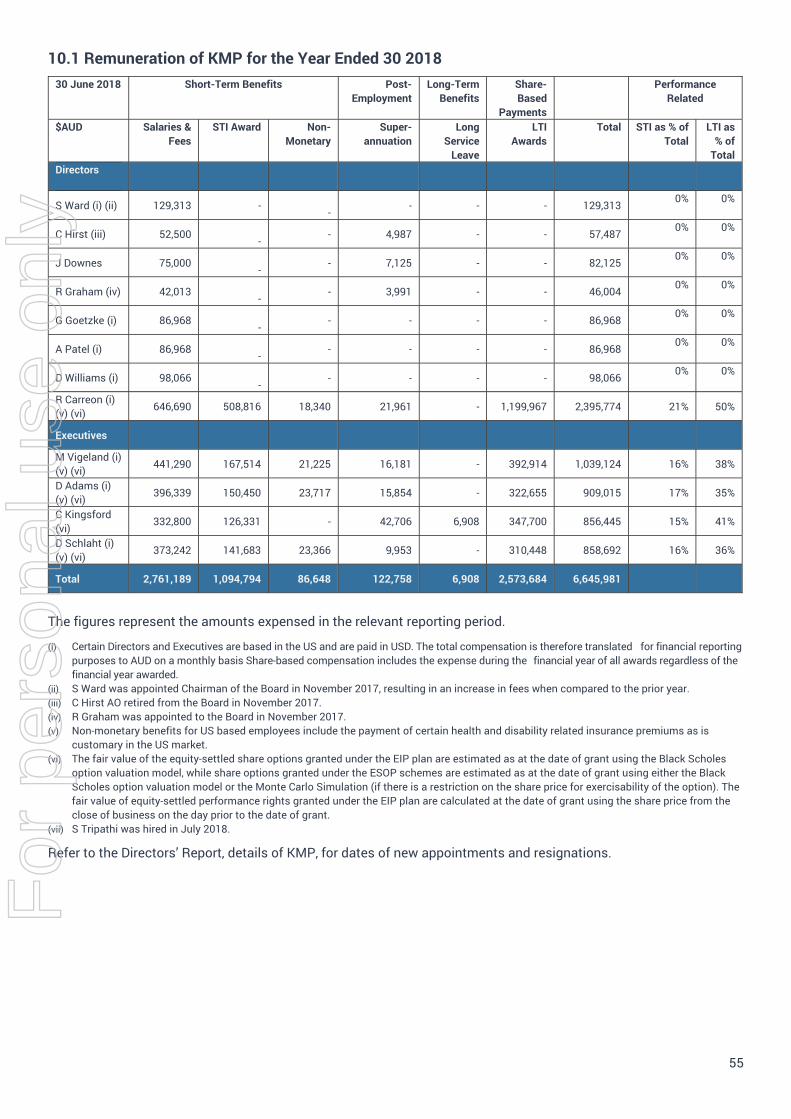
55
10.1 Remuneration of KMP for the Year Ended 30 2018 30 June 2018 Short-Term Benefits Post-
Employment Long-Term
Benefits Share-Based
Payments
PerformanceRelated
$AUD Salaries & Fees
STI Award Non-Monetary
Super-annuation
Long Service
Leave
LTI Awards
Total STI as % of Total
LTI as % of
Total Directors
S Ward (i) (ii) 129,313 - - - - - 129,313 0% 0%
C Hirst (iii) 52,500 - - 4,987 - - 57,487 0% 0%
J Downes 75,000 - - 7,125 - - 82,125 0% 0%
R Graham (iv) 42,013 - - 3,991 - - 46,004 0% 0%
G Goetzke (i) 86,968 - - - - - 86,968 0% 0%
A Patel (i) 86,968 - - - - - 86,968 0% 0%
D Williams (i) 98,066 - - - - - 98,066 0% 0%
R Carreon (i) (v) (vi) 646,690 508,816 18,340 21,961 - 1,199,967 2,395,774 21% 50%
Executives
M Vigeland (i) (v) (vi) 441,290 167,514 21,225 16,181 - 392,914 1,039,124 16% 38%
D Adams (i) (v) (vi) 396,339 150,450 23,717 15,854 - 322,655 909,015 17% 35%
C Kingsford (vi) 332,800 126,331 - 42,706 6,908 347,700 856,445 15% 41%
D Schlaht (i) (v) (vi) 373,242 141,683 23,366 9,953 - 310,448 858,692 16% 36%
Total 2,761,189 1,094,794 86,648 122,758 6,908 2,573,684 6,645,981
The figures represent the amounts expensed in the relevant reporting period.
(i) Certain Directors and Executives are based in the US and are paid in USD. The total compensation is therefore translated for financial reporting purposes to AUD on a monthly basis Share-based compensation includes the expense during the financial year of all awards regardless of the financial year awarded.
(ii) S Ward was appointed Chairman of the Board in November 2017, resulting in an increase in fees when compared to the prior year. (iii) C Hirst AO retired from the Board in November 2017. (iv) R Graham was appointed to the Board in November 2017. (v) Non-monetary benefits for US based employees include the payment of certain health and disability related insurance premiums as is
customary in the US market. (vi) The fair value of the equity-settled share options granted under the EIP plan are estimated as at the date of grant using the Black Scholes
option valuation model, while share options granted under the ESOP schemes are estimated as at the date of grant using either the Black Scholes option valuation model or the Monte Carlo Simulation (if there is a restriction on the share price for exercisability of the option). The fair value of equity-settled performance rights granted under the EIP plan are calculated at the date of grant using the share price from the close of business on the day prior to the date of grant.
(vii) S Tripathi was hired in July 2018.
Refer to the Directors’ Report, details of KMP, for dates of new appointments and resignations.
For
per
sona
l use
onl
y

56
10.2 Remuneration Awards: Granted, Vested, and Lapsed During the Year (A) OPTIONS
30 June 2019 Numbers Grant Date Value per Option at
Grant Date ($)
Exercise Price per
Option ($)
Expiry Date for Option
Vested
Vested Number of
Options this Year (#)
Fair Value of Options
Granted During Year ($)
Number of Options Lapsed
During Year (#)
Executives R Carreon 24-Apr-14 0.1147 0.2100 30-Jun-19 639,222
R Carreon 04-Dec-14 0.3781 0.6900 04-Dec-21 512,000 -
R Carreon 03-Nov-15 0.5906 1.0000 01-Jul-22 128,125 -
R Carreon 14-Nov-16 0.9458 1.4600 14-Nov-23 218,000 -
R Carreon 15-Nov-17 0.4963 0.8150 15-Nov-24 388,250 -
M Vigeland 02-May-11 0.4307 0.6800 31-Dec-18 16,666
M Vigeland 07-Oct-11 0.3567 0.4600 30-Jun-19 25,000
M Vigeland 24-Apr-14 0.1147 0.2100 30-Jun-19 94,950
M Vigeland 04-Dec-14 0.3781 0.6900 04-Dec-21 247,000 -
M Vigeland 01-Jul-15 0.5240 0.8700 01-Jul-22 59,375 -
M Vigeland 25-Oct-16 1.0269 1.6600 25-Oct-23 75,750 -
M Vigeland 15-Nov-17 0.4963 0.8150 15-Nov-24 57,500 -
S Tripathi 515,000 31-Jul-18 0.2258 0.5200 31-Jul-2025 116,292 -
D Adams 14-Nov-16 0.9459 1.4600 14-Nov-23 83,750 -
D Adams 15-Nov-17 0.4963 0.8150 15-Nov-24 119,000 -
C Kingsford 07-Oct-2011 0.3567 0.4600 31-Dec-2018 8,333
C Kingsford 07-Oct-2011 0.3567 0.4600 30-Jun-2019 28,333
C Kingsford 24-Apr-2014 0.1147 0.2100 30-Jun-2019 69,950
C Kingsford 04-Dec-14 0.3781 0.6900 04-Dec-21 104,382 -
C Kingsford 01-Jul-15 0.5240 0.8700 01-Jul-22 46,875 -
C Kingsford 25-Oct-16 1.0269 1.6600 25-Oct-23 65,000 -
C Kingsford 15-Nov-17 0.4963 0.8150 15-Nov-24 102,500 -
D Schlaht 07-Oct-2011 0.3186 0.5000 31-Dec-2018 23,333
D Schlaht 07-Oct-2011 0.3186 0.5000 30-Jun-2019 33,333
D Schlaht 24-Apr-2014 0.1147 0.2100 30-Jun-2019 69,950
D Schlaht 04-Dec-14 0.3781 0.6900 04-Dec-21 163,750 -
D Schlaht 01-Jul-15 0.5240 0.8700 01-Jul-22 34,375 -
D Schlaht 25-Oct-16 1.0269 1.6600 25-Oct-23 64,500 -
D Schlaht 15-Nov-17 0.4963 0.8150 15-Nov-24 112,000 -
Total 515,000 2,582,132 116,292 1,009,070
(B) PERFORMANCE RIGHTS
Granted Terms and Conditions of Each Grant Vested
30 June 2019 Numbers Grant Date Value per Perf Right at Grant Date
($)
Expiry Date for Perf Right Vested During
Year
Number of Perf Rights (#)
Of Perf Rights Granted During
Year ($)
Executives
S Tripathi (i) 310,000 31-Jul-2018 0.4050 31-Jul-2021
Total 310,000
(i) Performance rights granted in financial year 2019 have time and performance-based vesting criteria. Refer to Note 18 for additional information.
For
per
sona
l use
onl
y
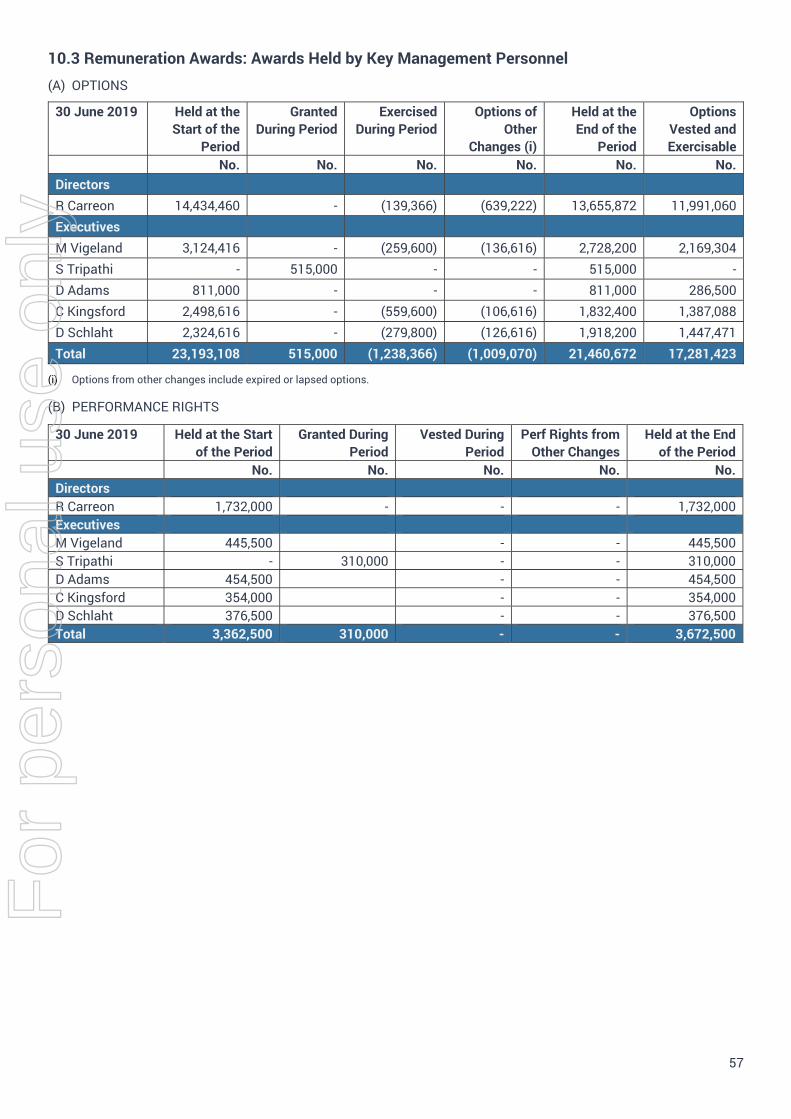
57
10.3 Remuneration Awards: Awards Held by Key Management Personnel (A) OPTIONS
30 June 2019 Held at the Start of the
Period
Granted During Period
Exercised During Period
Options of Other
Changes (i)
Held at the End of the
Period
Options Vested and Exercisable
No. No. No. No. No. No. Directors R Carreon 14,434,460 - (139,366) (639,222) 13,655,872 11,991,060 Executives M Vigeland 3,124,416 - (259,600) (136,616) 2,728,200 2,169,304 S Tripathi - 515,000 - - 515,000 - D Adams 811,000 - - - 811,000 286,500 C Kingsford 2,498,616 - (559,600) (106,616) 1,832,400 1,387,088 D Schlaht 2,324,616 - (279,800) (126,616) 1,918,200 1,447,471 Total 23,193,108 515,000 (1,238,366) (1,009,070) 21,460,672 17,281,423
(i) Options from other changes include expired or lapsed options.
(B) PERFORMANCE RIGHTS
30 June 2019 Held at the Start of the Period
Granted During Period
Vested During Period
Perf Rights from Other Changes
Held at the End of the Period
No. No. No. No. No. Directors R Carreon 1,732,000 - - - 1,732,000 Executives M Vigeland 445,500 - - 445,500 S Tripathi - 310,000 - - 310,000 D Adams 454,500 - - 454,500 C Kingsford 354,000 - - 354,000 D Schlaht 376,500 - - 376,500 Total 3,362,500 310,000 - - 3,672,500
For
per
sona
l use
onl
y
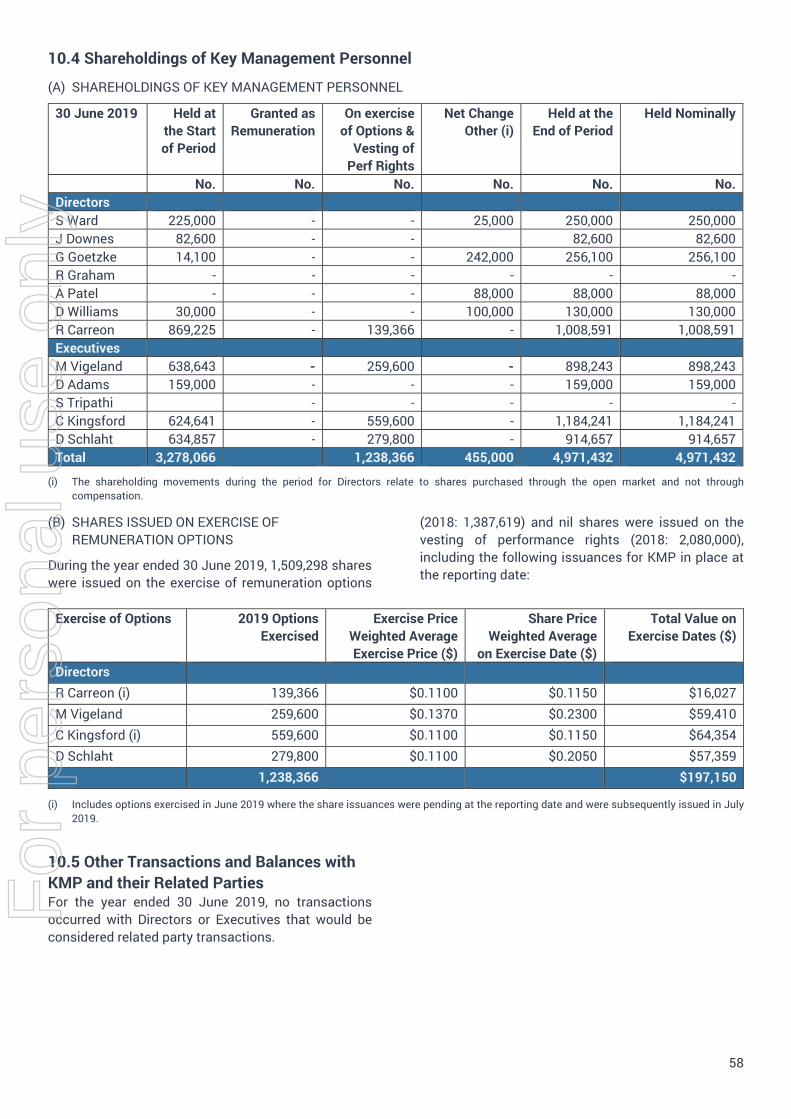
58
10.4 Shareholdings of Key Management Personnel
(A) SHAREHOLDINGS OF KEY MANAGEMENT PERSONNEL
30 June 2019 Held at the Start of Period
Granted as Remuneration
On exercise of Options &
Vesting of Perf Rights
Net Change Other (i)
Held at the End of Period
Held Nominally
No. No. No. No. No. No. Directors S Ward 225,000 - - 25,000 250,000 250,000 J Downes 82,600 - - 82,600 82,600 G Goetzke 14,100 - - 242,000 256,100 256,100 R Graham - - - - - - A Patel - - - 88,000 88,000 88,000 D Williams 30,000 - - 100,000 130,000 130,000 R Carreon 869,225 - 139,366 - 1,008,591 1,008,591 Executives M Vigeland 638,643 - 259,600 - 898,243 898,243 D Adams 159,000 - - - 159,000 159,000 S Tripathi - - - - - C Kingsford 624,641 - 559,600 - 1,184,241 1,184,241 D Schlaht 634,857 - 279,800 - 914,657 914,657 Total 3,278,066 1,238,366 455,000 4,971,432 4,971,432
(i) The shareholding movements during the period for Directors relate to shares purchased through the open market and not through compensation.
(B) SHARES ISSUED ON EXERCISE OF REMUNERATION OPTIONS
During the year ended 30 June 2019, 1,509,298 shares were issued on the exercise of remuneration options
(2018: 1,387,619) and nil shares were issued on the vesting of performance rights (2018: 2,080,000), including the following issuances for KMP in place at the reporting date:
Exercise of Options 2019 Options Exercised
Exercise Price Weighted Average Exercise Price ($)
Share Price Weighted Average
on Exercise Date ($)
Total Value on Exercise Dates ($)
Directors R Carreon (i) 139,366 $0.1100 $0.1150 $16,027 M Vigeland 259,600 $0.1370 $0.2300 $59,410 C Kingsford (i) 559,600 $0.1100 $0.1150 $64,354 D Schlaht 279,800 $0.1100 $0.2050 $57,359
1,238,366 $197,150
(i) Includes options exercised in June 2019 where the share issuances were pending at the reporting date and were subsequently issued in July 2019.
10.5 Other Transactions and Balances with KMP and their Related Parties For the year ended 30 June 2019, no transactions occurred with Directors or Executives that would be considered related party transactions.
For
per
sona
l use
onl
y
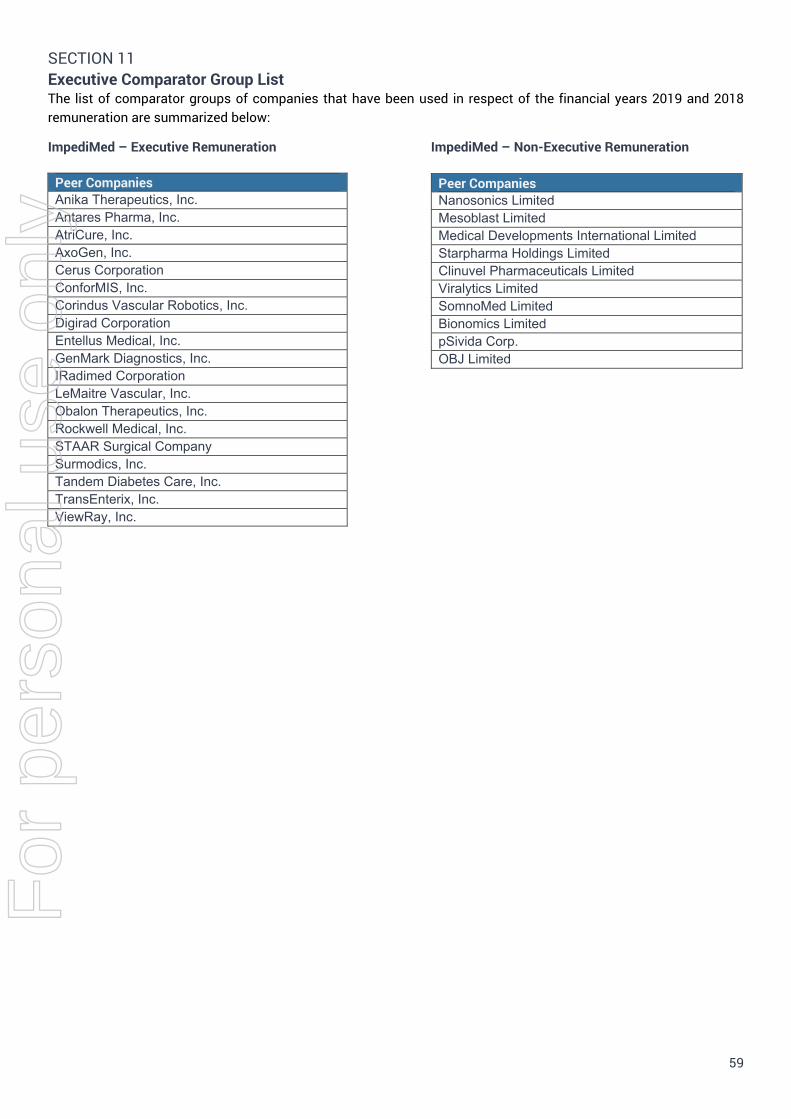
59
SECTION 11 Executive Comparator Group List The list of comparator groups of companies that have been used in respect of the financial years 2019 and 2018 remuneration are summarized below:
ImpediMed – Executive Remuneration ImpediMed – Non-Executive Remuneration
Peer Companies Anika Therapeutics, Inc. Antares Pharma, Inc. AtriCure, Inc. AxoGen, Inc. Cerus Corporation ConforMIS, Inc. Corindus Vascular Robotics, Inc. Digirad Corporation Entellus Medical, Inc. GenMark Diagnostics, Inc. IRadimed Corporation LeMaitre Vascular, Inc. Obalon Therapeutics, Inc. Rockwell Medical, Inc. STAAR Surgical Company Surmodics, Inc. Tandem Diabetes Care, Inc. TransEnterix, Inc. ViewRay, Inc.
Peer Companies Nanosonics Limited Mesoblast Limited Medical Developments International Limited Starpharma Holdings Limited Clinuvel Pharmaceuticals Limited Viralytics Limited SomnoMed Limited Bionomics Limited pSivida Corp. OBJ Limited
For
per
sona
l use
onl
y
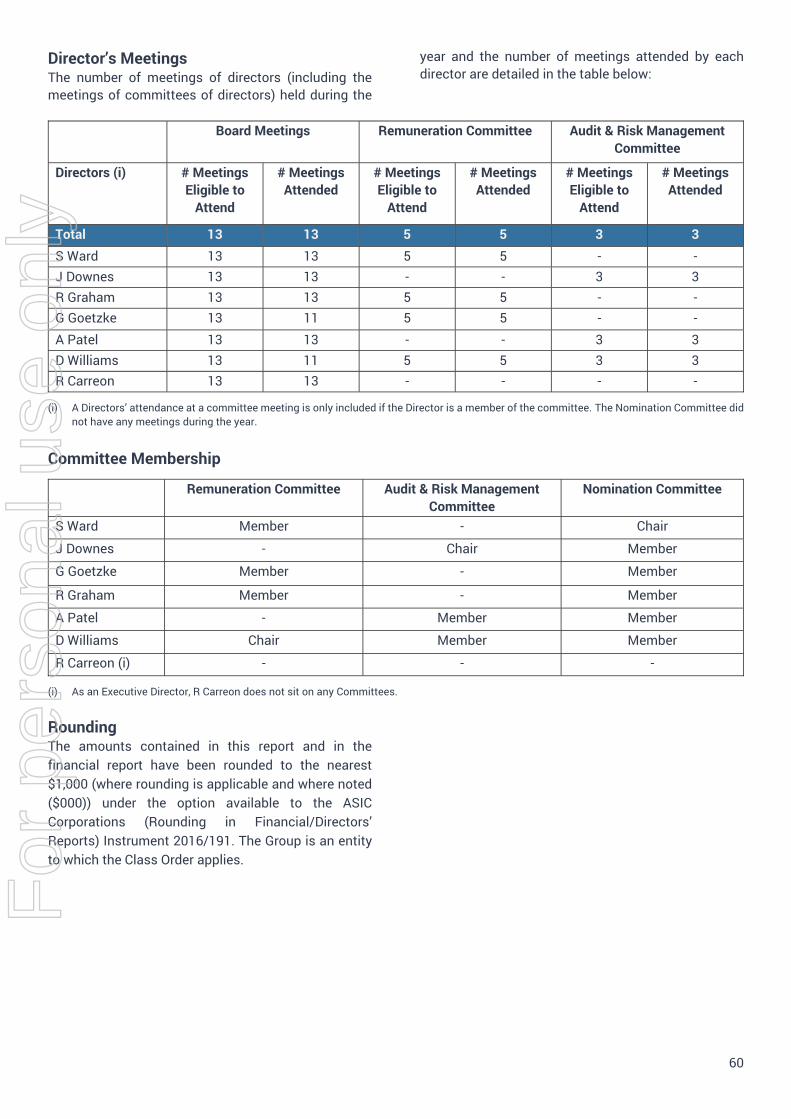
60
Director’s Meetings The number of meetings of directors (including the meetings of committees of directors) held during the
year and the number of meetings attended by each director are detailed in the table below:
Board Meetings Remuneration Committee Audit & Risk Management Committee
Directors (i) # Meetings Eligible to
Attend
# Meetings Attended
# Meetings Eligible to
Attend
# Meetings Attended
# Meetings Eligible to
Attend
# Meetings Attended
Total 13 13 5 5 3 3 S Ward 13 13 5 5 - - J Downes 13 13 - - 3 3 R Graham 13 13 5 5 - - G Goetzke 13 11 5 5 - - A Patel 13 13 - - 3 3 D Williams 13 11 5 5 3 3R Carreon 13 13 - - - -
(i) A Directors’ attendance at a committee meeting is only included if the Director is a member of the committee. The Nomination Committee did not have any meetings during the year.
Committee Membership
Remuneration Committee Audit & Risk Management Committee
Nomination Committee
S Ward Member - Chair
J Downes - Chair Member
G Goetzke Member - Member
R Graham Member - Member
A Patel - Member Member
D Williams Chair Member Member
R Carreon (i) - - -
(i) As an Executive Director, R Carreon does not sit on any Committees.
Rounding The amounts contained in this report and in the financial report have been rounded to the nearest $1,000 (where rounding is applicable and where noted ($000)) under the option available to the ASIC Corporations (Rounding in Financial/Directors’ Reports) Instrument 2016/191. The Group is an entity to which the Class Order applies.
For
per
sona
l use
onl
y

61
Auditor’s Independence Declaration and Non-Audit Services
Auditor’s Independence Declaration The directors received the declaration on page 62 from the auditor of the Company and have resolved the auditor is independent.
Non-Audit Services No non-audit services were provided.
Signed in according with a resolution of the Directors.
Scott R. Ward Judith Downes Chairman Director
21 August 2019
For
per
sona
l use
onl
y
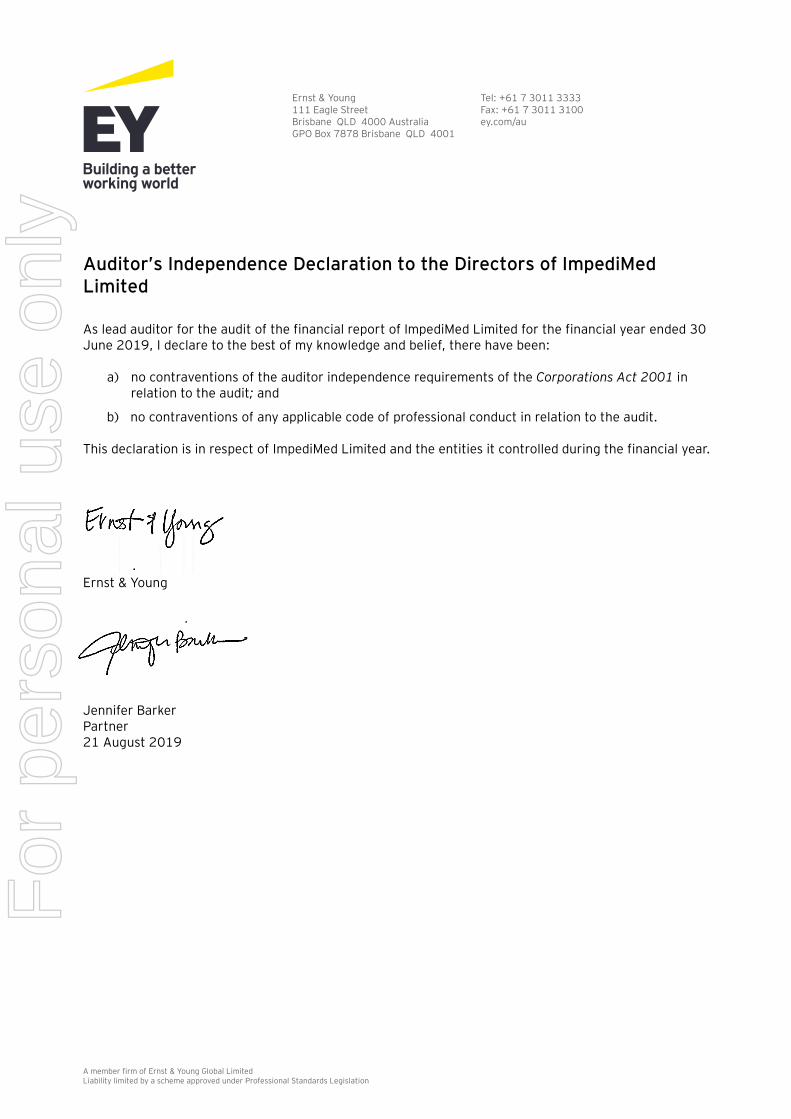
A member firm of Ernst & Young Global Limited Liability limited by a scheme approved under Professional Standards Legislation
Ernst & Young 111 Eagle Street Brisbane QLD 4000 Australia GPO Box 7878 Brisbane QLD 4001
Tel: +61 7 3011 3333 Fax: +61 7 3011 3100 ey.com/au
Auditor’s Independence Declaration to the Directors of ImpediMed Limited
As lead auditor for the audit of the financial report of ImpediMed Limited for the financial year ended 30 June 2019, I declare to the best of my knowledge and belief, there have been:
a) no contraventions of the auditor independence requirements of the Corporations Act 2001 inrelation to the audit; and
b) no contraventions of any applicable code of professional conduct in relation to the audit.
This declaration is in respect of ImpediMed Limited and the entities it controlled during the financial year.
Ernst & Young
Jennifer Barker Partner 21 August 2019
For
per
sona
l use
onl
y
For
per
sona
l use
onl
y
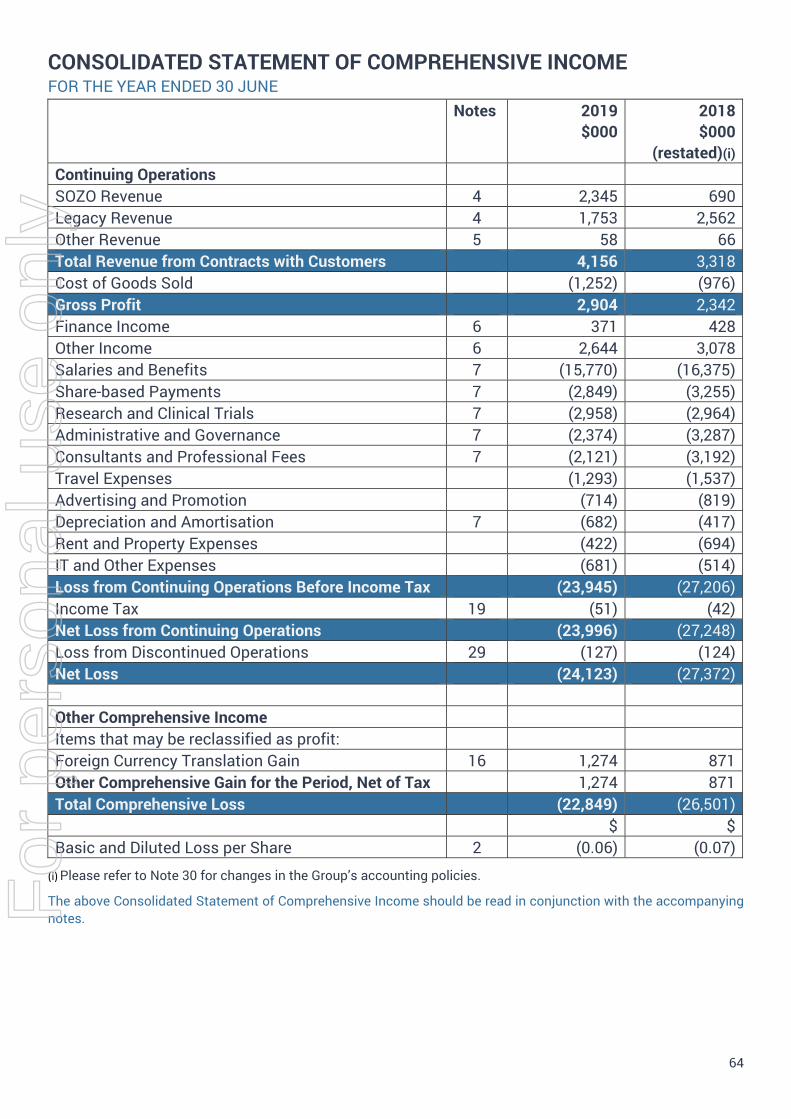
64
CONSOLIDATED STATEMENT OF COMPREHENSIVE INCOME FOR THE YEAR ENDED 30 JUNE
Notes 2019 $000
2018 $000
(restated)(i) Continuing Operations SOZO Revenue 4 2,345 690 Legacy Revenue 4 1,753 2,562 Other Revenue 5 58 66 Total Revenue from Contracts with Customers 4,156 3,318 Cost of Goods Sold (1,252) (976) Gross Profit 2,904 2,342 Finance Income 6 371 428 Other Income 6 2,644 3,078 Salaries and Benefits 7 (15,770) (16,375) Share-based Payments 7 (2,849) (3,255) Research and Clinical Trials 7 (2,958) (2,964) Administrative and Governance 7 (2,374) (3,287) Consultants and Professional Fees 7 (2,121) (3,192) Travel Expenses (1,293) (1,537) Advertising and Promotion (714) (819) Depreciation and Amortisation 7 (682) (417) Rent and Property Expenses (422) (694) IT and Other Expenses (681) (514) Loss from Continuing Operations Before Income Tax (23,945) (27,206) Income Tax 19 (51) (42) Net Loss from Continuing Operations (23,996) (27,248) Loss from Discontinued Operations 29 (127) (124) Net Loss (24,123) (27,372)
Other Comprehensive Income Items that may be reclassified as profit: Foreign Currency Translation Gain 16 1,274 871 Other Comprehensive Gain for the Period, Net of Tax 1,274 871 Total Comprehensive Loss (22,849) (26,501)
$ $ Basic and Diluted Loss per Share 2 (0.06) (0.07)
(i) Please refer to Note 30 for changes in the Group’s accounting policies.
The above Consolidated Statement of Comprehensive Income should be read in conjunction with the accompanying notes. F
or p
erso
nal u
se o
nly
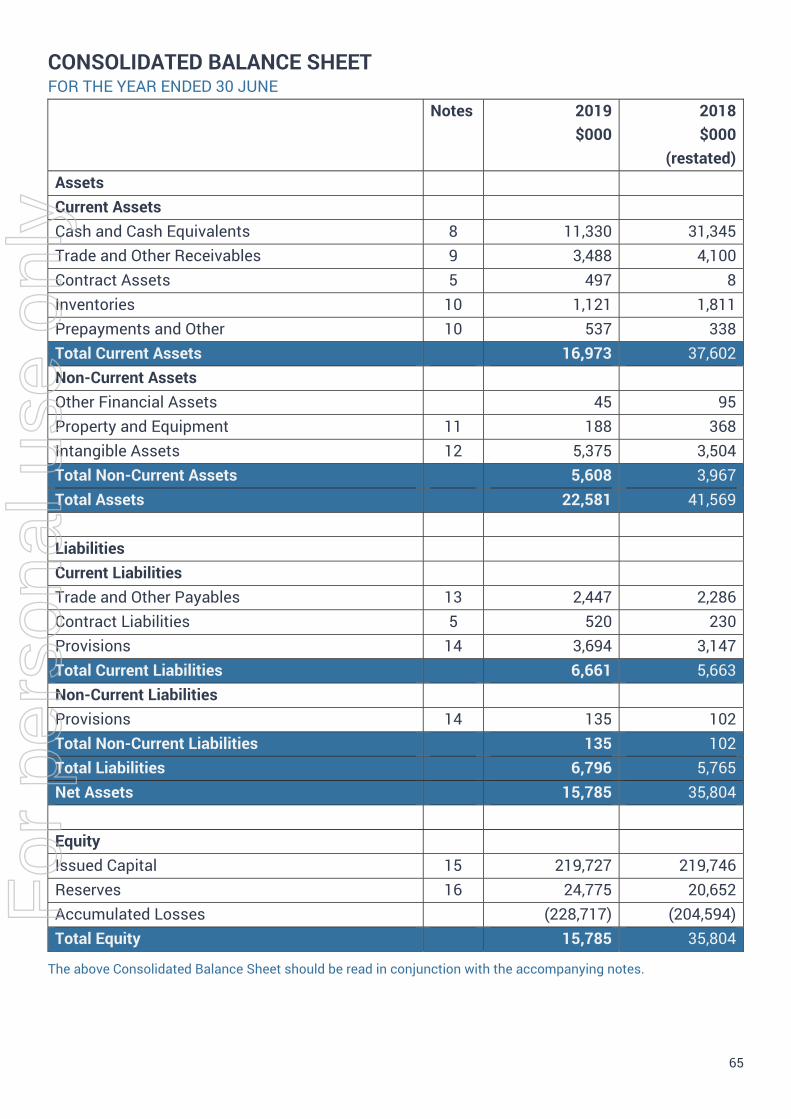
65
CONSOLIDATED BALANCE SHEET FOR THE YEAR ENDED 30 JUNE
Notes 2019 $000
2018 $000
(restated) Assets Current Assets Cash and Cash Equivalents 8 11,330 31,345 Trade and Other Receivables 9 3,488 4,100 Contract Assets 5 497 8 Inventories 10 1,121 1,811 Prepayments and Other 10 537 338 Total Current Assets 16,973 37,602 Non-Current Assets Other Financial Assets 45 95 Property and Equipment 11 188 368 Intangible Assets 12 5,375 3,504 Total Non-Current Assets 5,608 3,967 Total Assets 22,581 41,569
Liabilities Current Liabilities Trade and Other Payables 13 2,447 2,286 Contract Liabilities 5 520 230 Provisions 14 3,694 3,147 Total Current Liabilities 6,661 5,663 Non-Current Liabilities Provisions 14 135 102 Total Non-Current Liabilities 135 102 Total Liabilities 6,796 5,765 Net Assets 15,785 35,804
Equity Issued Capital 15 219,727 219,746 Reserves 16 24,775 20,652 Accumulated Losses (228,717) (204,594) Total Equity 15,785 35,804
The above Consolidated Balance Sheet should be read in conjunction with the accompanying notes.
For
per
sona
l use
onl
y
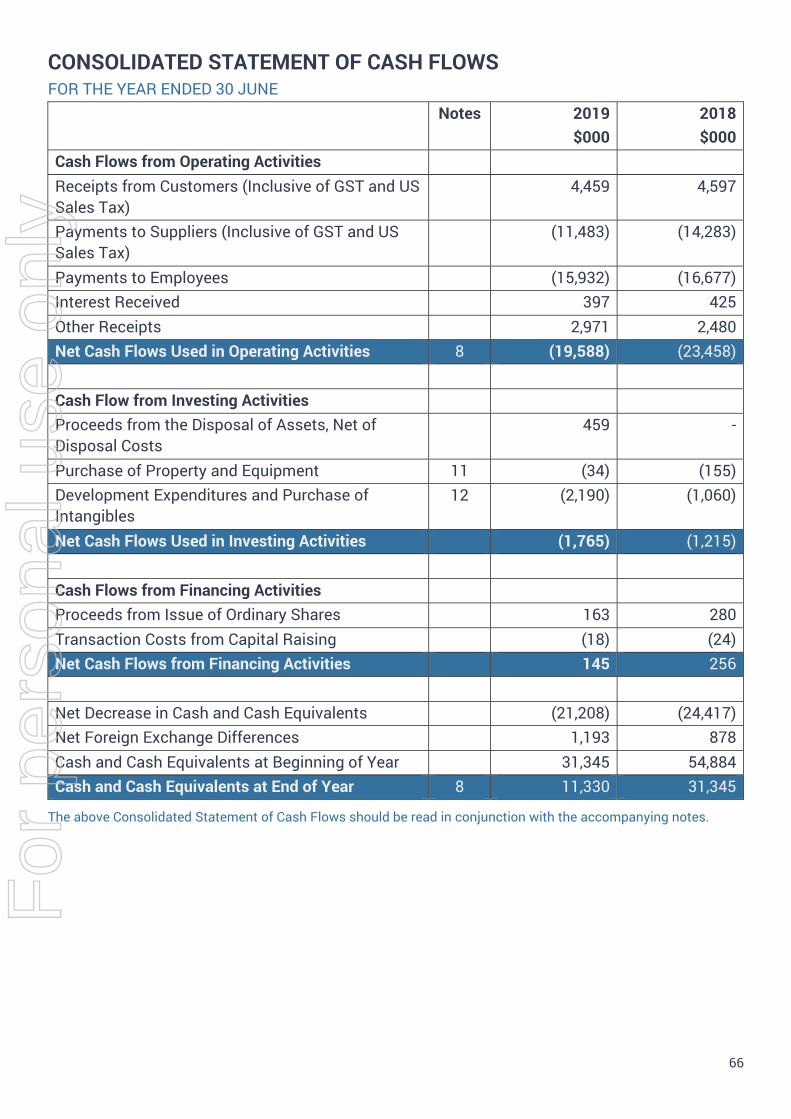
66
CONSOLIDATED STATEMENT OF CASH FLOWS FOR THE YEAR ENDED 30 JUNE
Notes 2019 $000
2018 $000
Cash Flows from Operating Activities Receipts from Customers (Inclusive of GST and US Sales Tax)
4,459 4,597
Payments to Suppliers (Inclusive of GST and US Sales Tax)
(11,483) (14,283)
Payments to Employees (15,932) (16,677) Interest Received 397 425 Other Receipts 2,971 2,480 Net Cash Flows Used in Operating Activities 8 (19,588) (23,458)
Cash Flow from Investing Activities Proceeds from the Disposal of Assets, Net of Disposal Costs
459 -
Purchase of Property and Equipment 11 (34) (155) Development Expenditures and Purchase of Intangibles
12 (2,190) (1,060)
Net Cash Flows Used in Investing Activities (1,765) (1,215)
Cash Flows from Financing Activities Proceeds from Issue of Ordinary Shares 163 280 Transaction Costs from Capital Raising (18) (24) Net Cash Flows from Financing Activities 145 256
Net Decrease in Cash and Cash Equivalents (21,208) (24,417) Net Foreign Exchange Differences 1,193 878 Cash and Cash Equivalents at Beginning of Year 31,345 54,884 Cash and Cash Equivalents at End of Year 8 11,330 31,345
The above Consolidated Statement of Cash Flows should be read in conjunction with the accompanying notes.
For
per
sona
l use
onl
y
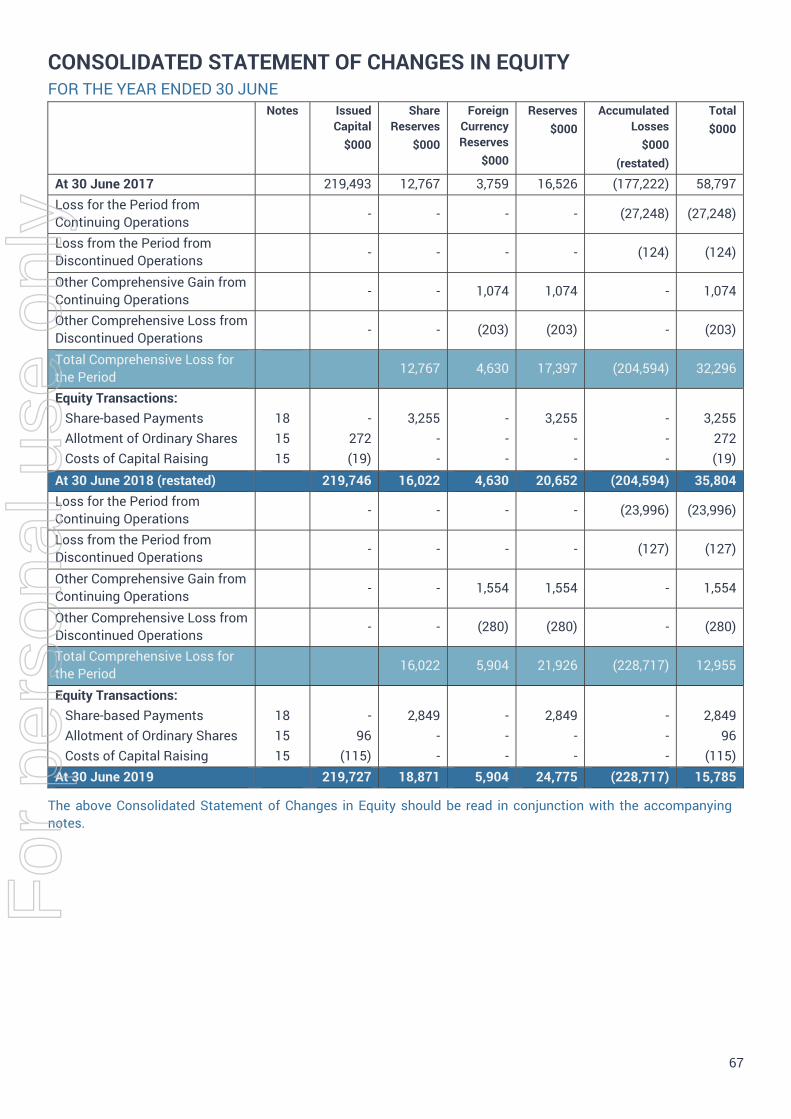
67
CONSOLIDATED STATEMENT OF CHANGES IN EQUITY FOR THE YEAR ENDED 30 JUNE
Notes Issued Capital
$000
Share Reserves
$000
Foreign Currency Reserves
$000
Reserves $000
Accumulated Losses
$000 (restated)
Total $000
At 30 June 2017 219,493 12,767 3,759 16,526 (177,222) 58,797 Loss for the Period from Continuing Operations - - - - (27,248) (27,248)
Loss from the Period from Discontinued Operations - - - - (124) (124)
Other Comprehensive Gain from Continuing Operations - - 1,074 1,074 - 1,074
Other Comprehensive Loss from Discontinued Operations - - (203) (203) - (203)
Total Comprehensive Loss for the Period 12,767 4,630 17,397 (204,594) 32,296
Equity Transactions: Share-based Payments Allotment of Ordinary Shares Costs of Capital Raising
18 15 15
- 272 (19)
3,255 - -
- - -
3,255 - -
- - -
3,255 272 (19)
At 30 June 2018 (restated) 219,746 16,022 4,630 20,652 (204,594) 35,804 Loss for the Period from Continuing Operations - - - - (23,996) (23,996)
Loss from the Period from Discontinued Operations - - - - (127) (127)
Other Comprehensive Gain from Continuing Operations - - 1,554 1,554 - 1,554
Other Comprehensive Loss from Discontinued Operations - - (280) (280) - (280)
Total Comprehensive Loss for the Period 16,022 5,904 21,926 (228,717) 12,955
Equity Transactions: Share-based Payments Allotment of Ordinary Shares Costs of Capital Raising
18 15 15
- 96
(115)
2,849 - -
- - -
2,849 - -
- - -
2,849 96
(115) At 30 June 2019 219,727 18,871 5,904 24,775 (228,717) 15,785
The above Consolidated Statement of Changes in Equity should be read in conjunction with the accompanying notes.
For
per
sona
l use
onl
y

68
NOTES TO THE FINANCIAL STATEMENTS FOR THE YEAR ENDED 30 JUNE 2019
CONTENTS
1. Basis of Preparation Page 69
2. Earnings per Share Page 70
3. Dividends Paid and Proposed Page 70
4. Segment Reporting Page 70
5. Revenue Page 72
6. Finance and Other Income Page 73
7. Expenses Page 74
8. Cash and Cash Equivalents Page 75
9. Trade and Other Receivables Page 75
10. Current Assets – Inventories and Prepayments Page 77
11. Non-current Assets – Property and Equipment Page 78
12. Non-current Assets – Intangible Assets and Goodwill Page 79
13. Current Liabilities – Trade and Other Payables Page 82
14. Provisions Page 83
15. Contributed Equity Page 84
16. Reserves Page 85
17. Key Management Personnel (KMP) Page 86
18. Share-based Payments Plans Page 86
19. Income Tax Page 93
20. Parent Entity Information Page 95
21. Related Party Disclosure Page 96
22. Auditor’s Remuneration Page 96
23. Commitments Page 96
24. Contingencies Page 98
25. Events After the Balance Sheet Date Page 98
26. Financial Risk Management Objectives and Policies Page 99
27. Financial Instruments Page 102
28. Significant Accounting Policies Page 102
29. Discontinued Operations Page 104
30. Changes to the Group’s Accounting Policies Page 104
For
per
sona
l use
onl
y
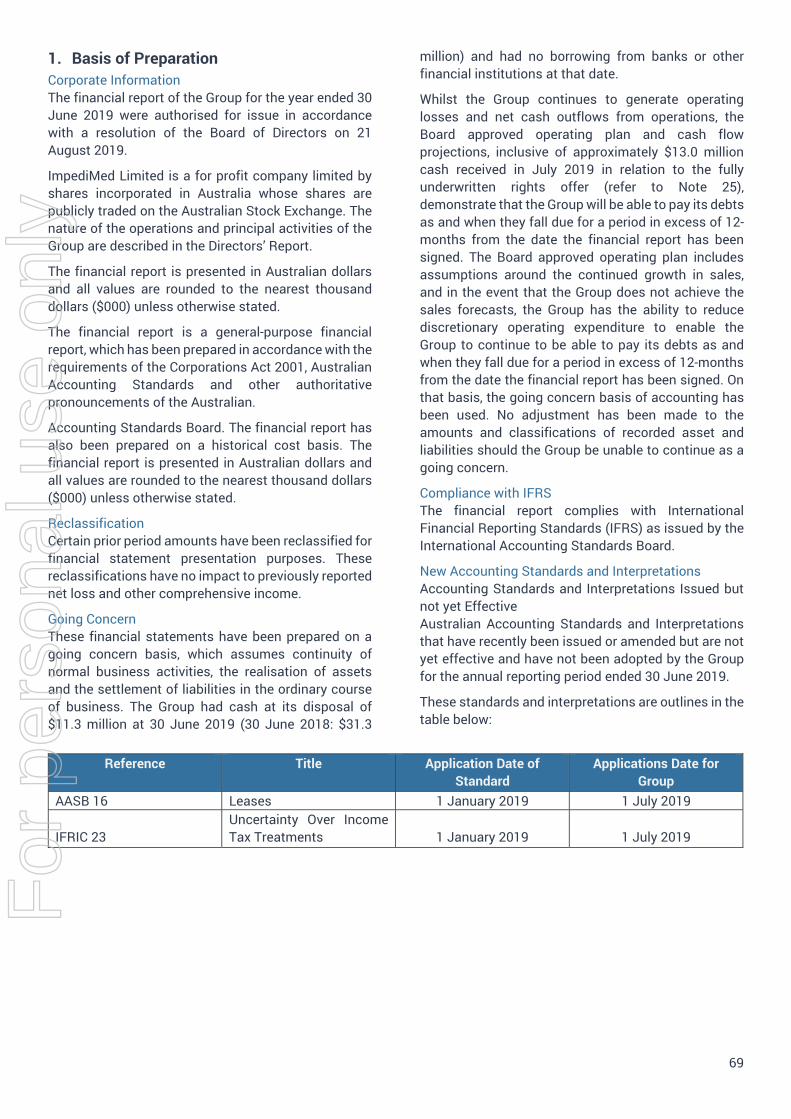
69
1. Basis of PreparationCorporate Information The financial report of the Group for the year ended 30 June 2019 were authorised for issue in accordance with a resolution of the Board of Directors on 21 August 2019.
ImpediMed Limited is a for profit company limited by shares incorporated in Australia whose shares are publicly traded on the Australian Stock Exchange. The nature of the operations and principal activities of the Group are described in the Directors’ Report.
The financial report is presented in Australian dollars and all values are rounded to the nearest thousand dollars ($000) unless otherwise stated.
The financial report is a general-purpose financial report, which has been prepared in accordance with the requirements of the Corporations Act 2001, Australian Accounting Standards and other authoritative pronouncements of the Australian.
Accounting Standards Board. The financial report has also been prepared on a historical cost basis. The financial report is presented in Australian dollars and all values are rounded to the nearest thousand dollars ($000) unless otherwise stated.
Reclassification Certain prior period amounts have been reclassified for financial statement presentation purposes. These reclassifications have no impact to previously reported net loss and other comprehensive income.
Going Concern These financial statements have been prepared on a going concern basis, which assumes continuity of normal business activities, the realisation of assets and the settlement of liabilities in the ordinary course of business. The Group had cash at its disposal of $11.3 million at 30 June 2019 (30 June 2018: $31.3
million) and had no borrowing from banks or other financial institutions at that date.
Whilst the Group continues to generate operating losses and net cash outflows from operations, the Board approved operating plan and cash flow projections, inclusive of approximately $13.0 million cash received in July 2019 in relation to the fully underwritten rights offer (refer to Note 25), demonstrate that the Group will be able to pay its debts as and when they fall due for a period in excess of 12-months from the date the financial report has been signed. The Board approved operating plan includes assumptions around the continued growth in sales, and in the event that the Group does not achieve the sales forecasts, the Group has the ability to reduce discretionary operating expenditure to enable the Group to continue to be able to pay its debts as and when they fall due for a period in excess of 12-months from the date the financial report has been signed. On that basis, the going concern basis of accounting has been used. No adjustment has been made to the amounts and classifications of recorded asset and liabilities should the Group be unable to continue as a going concern.
Compliance with IFRS The financial report complies with International Financial Reporting Standards (IFRS) as issued by the International Accounting Standards Board.
New Accounting Standards and Interpretations Accounting Standards and Interpretations Issued but not yet Effective Australian Accounting Standards and Interpretations that have recently been issued or amended but are not yet effective and have not been adopted by the Group for the annual reporting period ended 30 June 2019.
These standards and interpretations are outlines in the table below:
Reference Title Application Date of Standard
Applications Date for Group
AASB 16 Leases 1 January 2019 1 July 2019
IFRIC 23 Uncertainty Over Income Tax Treatments 1 January 2019 1 July 2019
For
per
sona
l use
onl
y
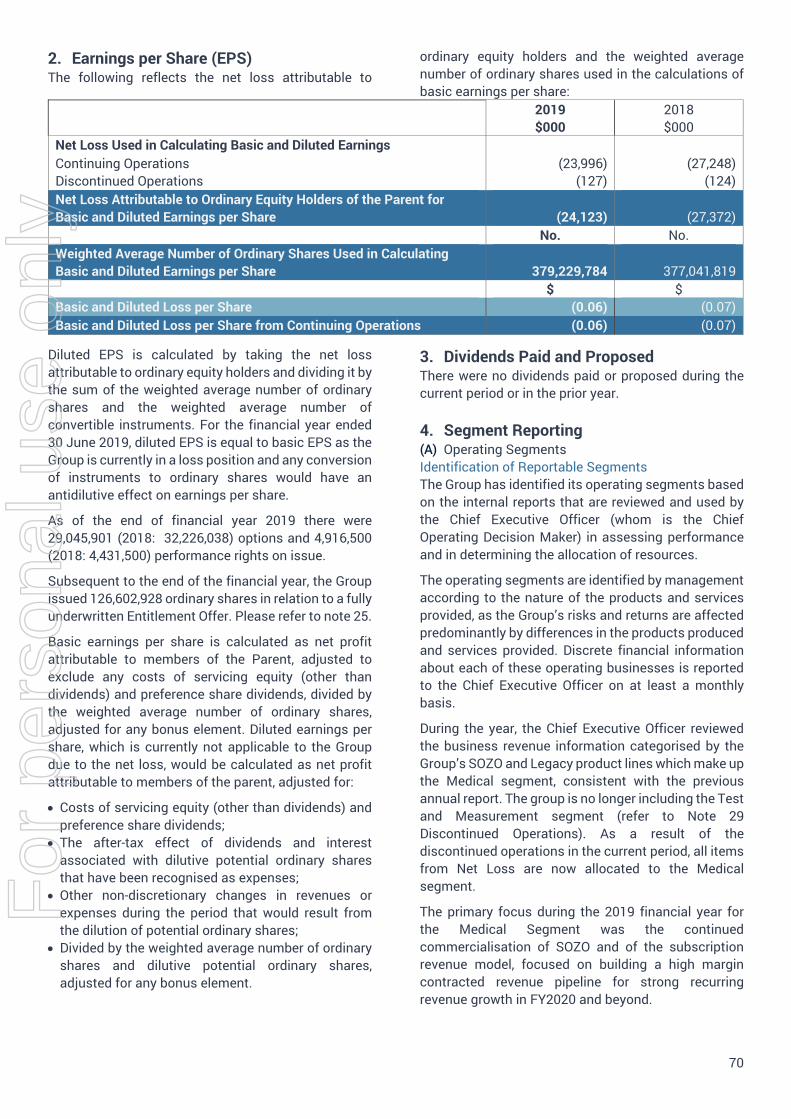
70
2. Earnings per Share (EPS)The following reflects the net loss attributable to
ordinary equity holders and the weighted average number of ordinary shares used in the calculations of basic earnings per share:
2019 $000
2018 $000
Net Loss Used in Calculating Basic and Diluted Earnings Continuing Operations (23,996) (27,248) Discontinued Operations (127) (124) Net Loss Attributable to Ordinary Equity Holders of the Parent for Basic and Diluted Earnings per Share (24,123) (27,372)
No. No. Weighted Average Number of Ordinary Shares Used in Calculating Basic and Diluted Earnings per Share 379,229,784 377,041,819
$ $ Basic and Diluted Loss per Share (0.06) (0.07) Basic and Diluted Loss per Share from Continuing Operations (0.06) (0.07)
Diluted EPS is calculated by taking the net loss attributable to ordinary equity holders and dividing it by the sum of the weighted average number of ordinary shares and the weighted average number of convertible instruments. For the financial year ended 30 June 2019, diluted EPS is equal to basic EPS as the Group is currently in a loss position and any conversion of instruments to ordinary shares would have an antidilutive effect on earnings per share.
As of the end of financial year 2019 there were 29,045,901 (2018: 32,226,038) options and 4,916,500 (2018: 4,431,500) performance rights on issue.
Subsequent to the end of the financial year, the Group issued 126,602,928 ordinary shares in relation to a fully underwritten Entitlement Offer. Please refer to note 25.
Basic earnings per share is calculated as net profit attributable to members of the Parent, adjusted to exclude any costs of servicing equity (other than dividends) and preference share dividends, divided by the weighted average number of ordinary shares, adjusted for any bonus element. Diluted earnings per share, which is currently not applicable to the Group due to the net loss, would be calculated as net profit attributable to members of the parent, adjusted for:
Costs of servicing equity (other than dividends) andpreference share dividends;
The after-tax effect of dividends and interestassociated with dilutive potential ordinary sharesthat have been recognised as expenses;
Other non-discretionary changes in revenues orexpenses during the period that would result fromthe dilution of potential ordinary shares;
Divided by the weighted average number of ordinaryshares and dilutive potential ordinary shares,adjusted for any bonus element.
3. Dividends Paid and ProposedThere were no dividends paid or proposed during the current period or in the prior year.
4. Segment Reporting(A) Operating Segments Identification of Reportable Segments The Group has identified its operating segments based on the internal reports that are reviewed and used by the Chief Executive Officer (whom is the Chief Operating Decision Maker) in assessing performance and in determining the allocation of resources.
The operating segments are identified by management according to the nature of the products and services provided, as the Group’s risks and returns are affected predominantly by differences in the products produced and services provided. Discrete financial information about each of these operating businesses is reported to the Chief Executive Officer on at least a monthly basis.
During the year, the Chief Executive Officer reviewed the business revenue information categorised by the Group’s SOZO and Legacy product lines which make up the Medical segment, consistent with the previous annual report. The group is no longer including the Test and Measurement segment (refer to Note 29 Discontinued Operations). As a result of the discontinued operations in the current period, all items from Net Loss are now allocated to the Medical segment.
The primary focus during the 2019 financial year for the Medical Segment was the continued commercialisation of SOZO and of the subscription revenue model, focused on building a high margin contracted revenue pipeline for strong recurring revenue growth in FY2020 and beyond.
For
per
sona
l use
onl
y
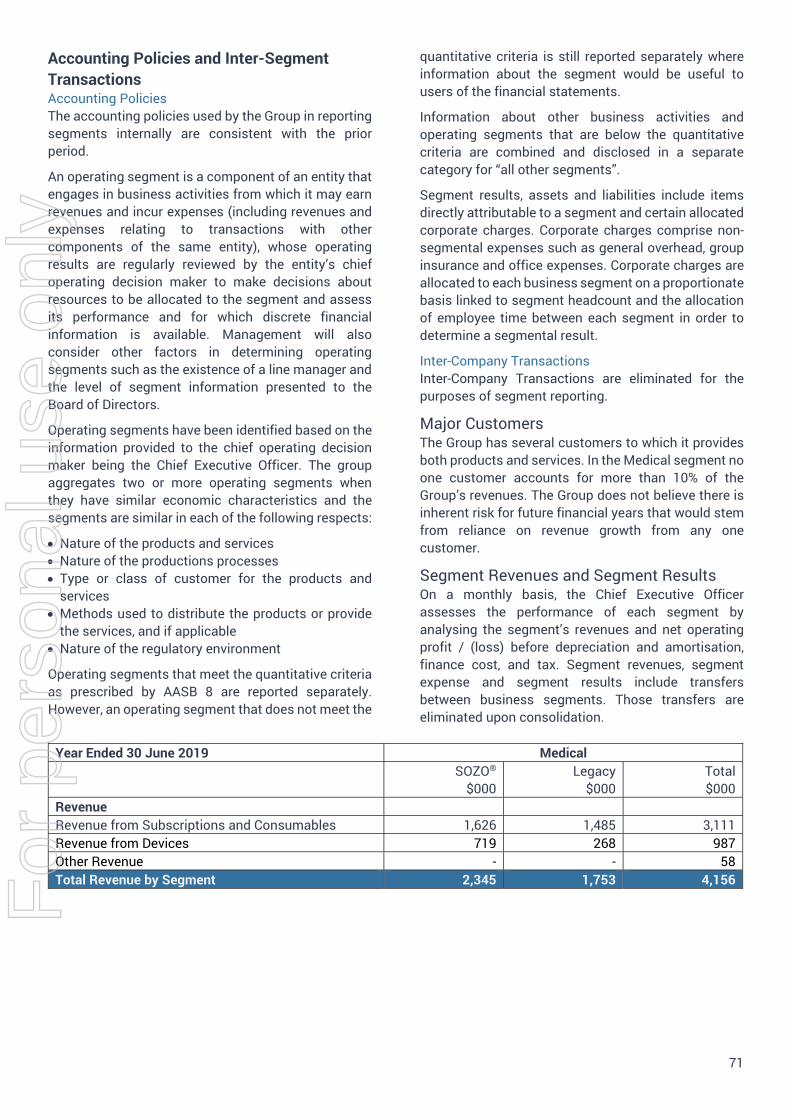
71
Accounting Policies and Inter-Segment Transactions Accounting Policies The accounting policies used by the Group in reporting segments internally are consistent with the prior period.
An operating segment is a component of an entity that engages in business activities from which it may earn revenues and incur expenses (including revenues and expenses relating to transactions with other components of the same entity), whose operating results are regularly reviewed by the entity’s chief operating decision maker to make decisions about resources to be allocated to the segment and assess its performance and for which discrete financial information is available. Management will also consider other factors in determining operating segments such as the existence of a line manager and the level of segment information presented to the Board of Directors.
Operating segments have been identified based on the information provided to the chief operating decision maker being the Chief Executive Officer. The group aggregates two or more operating segments when they have similar economic characteristics and the segments are similar in each of the following respects:
Nature of the products and services Nature of the productions processes Type or class of customer for the products and
services Methods used to distribute the products or provide
the services, and if applicable Nature of the regulatory environment
Operating segments that meet the quantitative criteria as prescribed by AASB 8 are reported separately. However, an operating segment that does not meet the
quantitative criteria is still reported separately where information about the segment would be useful to users of the financial statements.
Information about other business activities and operating segments that are below the quantitative criteria are combined and disclosed in a separate category for “all other segments”.
Segment results, assets and liabilities include items directly attributable to a segment and certain allocated corporate charges. Corporate charges comprise non-segmental expenses such as general overhead, group insurance and office expenses. Corporate charges are allocated to each business segment on a proportionate basis linked to segment headcount and the allocation of employee time between each segment in order to determine a segmental result.
Inter-Company Transactions Inter-Company Transactions are eliminated for the purposes of segment reporting.
Major Customers The Group has several customers to which it provides both products and services. In the Medical segment no one customer accounts for more than 10% of the Group’s revenues. The Group does not believe there is inherent risk for future financial years that would stem from reliance on revenue growth from any one customer.
Segment Revenues and Segment Results On a monthly basis, the Chief Executive Officer assesses the performance of each segment by analysing the segment’s revenues and net operating profit / (loss) before depreciation and amortisation, finance cost, and tax. Segment revenues, segment expense and segment results include transfers between business segments. Those transfers are eliminated upon consolidation.
Year Ended 30 June 2019 Medical SOZO®
$000 Legacy
$000 Total $000
Revenue Revenue from Subscriptions and Consumables 1,626 1,485 3,111 Revenue from Devices 719 268 987 Other Revenue - - 58 Total Revenue by Segment 2,345 1,753 4,156 F
or p
erso
nal u
se o
nly
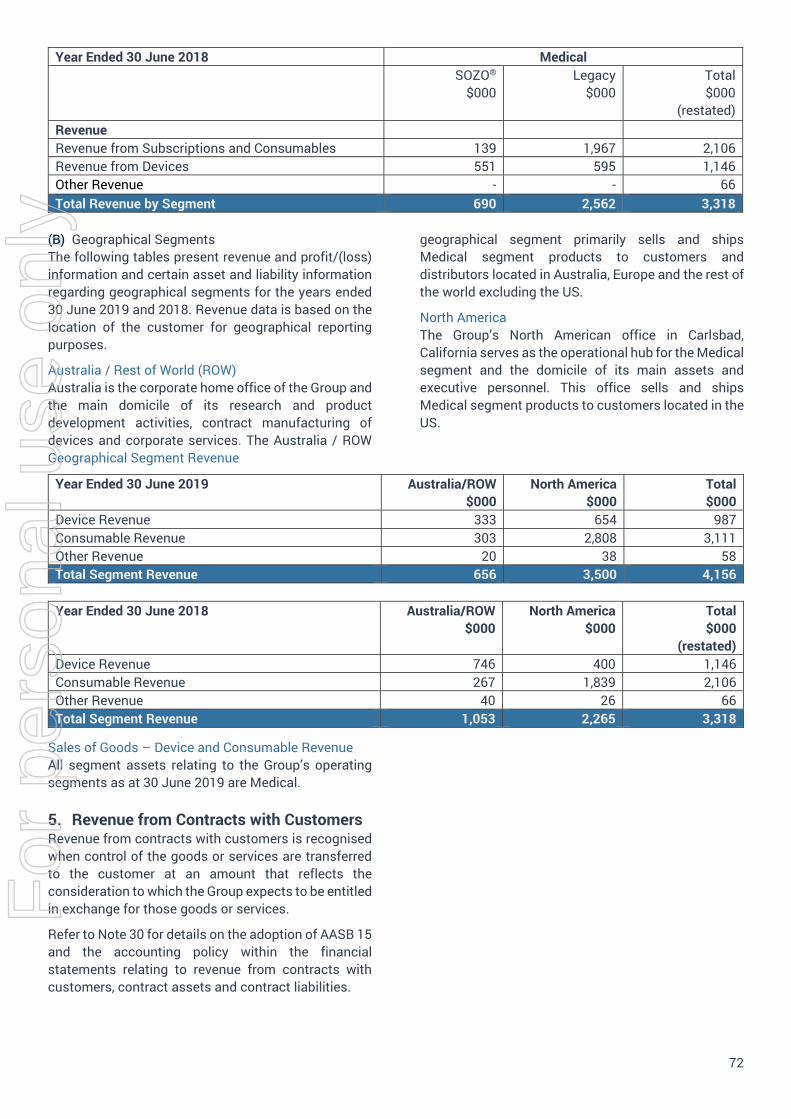
72
Year Ended 30 June 2018 Medical SOZO®
$000 Legacy
$000 Total $000
(restated) Revenue Revenue from Subscriptions and Consumables 139 1,967 2,106 Revenue from Devices 551 595 1,146 Other Revenue - - 66 Total Revenue by Segment 690 2,562 3,318
(B) Geographical Segments The following tables present revenue and profit/(loss) information and certain asset and liability information regarding geographical segments for the years ended 30 June 2019 and 2018. Revenue data is based on the location of the customer for geographical reporting purposes.
Australia / Rest of World (ROW) Australia is the corporate home office of the Group and the main domicile of its research and product development activities, contract manufacturing of devices and corporate services. The Australia / ROW
geographical segment primarily sells and ships Medical segment products to customers and distributors located in Australia, Europe and the rest of the world excluding the US.
North America The Group’s North American office in Carlsbad, California serves as the operational hub for the Medical segment and the domicile of its main assets and executive personnel. This office sells and ships Medical segment products to customers located in the US.
Geographical Segment Revenue
Year Ended 30 June 2019 Australia/ROW $000
North America $000
Total $000
Device Revenue 333 654 987 Consumable Revenue 303 2,808 3,111 Other Revenue 20 38 58 Total Segment Revenue 656 3,500 4,156
Year Ended 30 June 2018 Australia/ROW $000
North America $000
Total $000
(restated) Device Revenue 746 400 1,146 Consumable Revenue 267 1,839 2,106 Other Revenue 40 26 66 Total Segment Revenue 1,053 2,265 3,318
Sales of Goods – Device and Consumable Revenue All segment assets relating to the Group’s operating segments as at 30 June 2019 are Medical.
5. Revenue from Contracts with CustomersRevenue from contracts with customers is recognised when control of the goods or services are transferred to the customer at an amount that reflects the consideration to which the Group expects to be entitled in exchange for those goods or services.
Refer to Note 30 for details on the adoption of AASB 15 and the accounting policy within the financial statements relating to revenue from contracts with customers, contract assets and contract liabilities.
For
per
sona
l use
onl
y
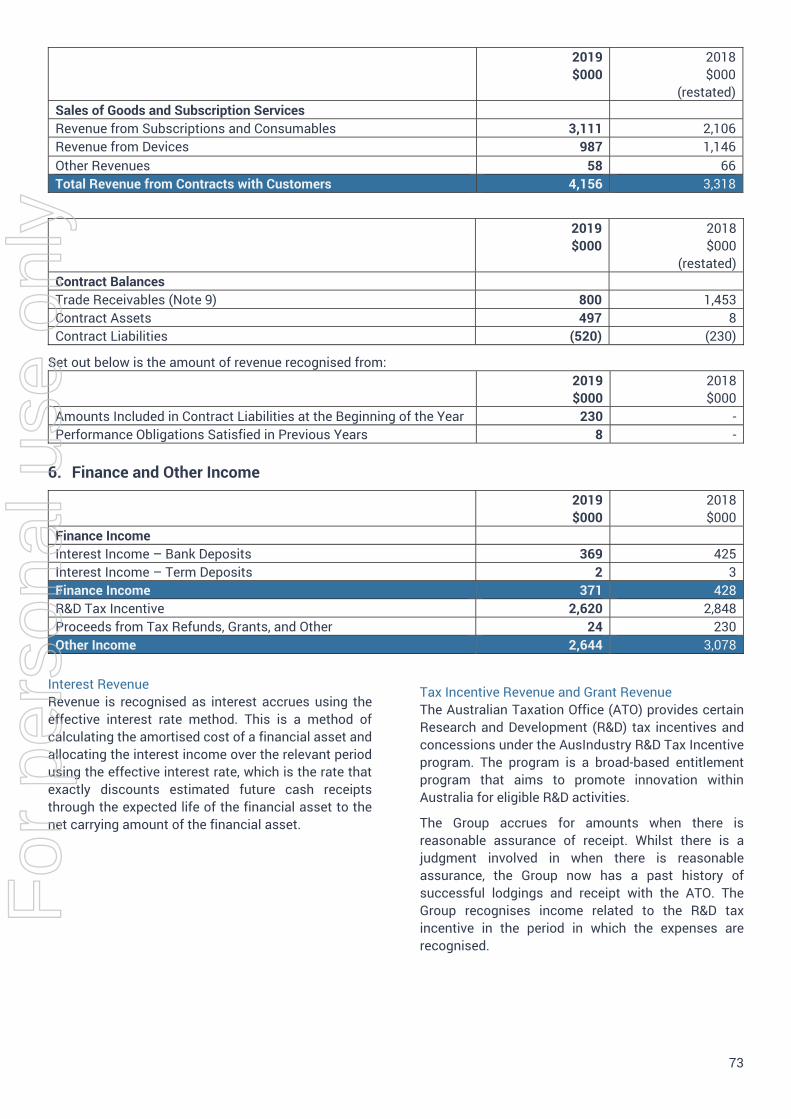
73
2019 $000
2018 $000
(restated) Sales of Goods and Subscription Services Revenue from Subscriptions and Consumables 3,111 2,106 Revenue from Devices 987 1,146 Other Revenues 58 66 Total Revenue from Contracts with Customers 4,156 3,318
2019 $000
2018 $000
(restated) Contract Balances Trade Receivables (Note 9) 800 1,453 Contract Assets 497 8 Contract Liabilities (520) (230)
Set out below is the amount of revenue recognised from: 2019 $000
2018 $000
Amounts Included in Contract Liabilities at the Beginning of the Year 230 - Performance Obligations Satisfied in Previous Years 8 -
6. Finance and Other Income
2019 $000
2018 $000
Finance Income Interest Income – Bank Deposits 369 425 Interest Income – Term Deposits 2 3 Finance Income 371 428 R&D Tax Incentive 2,620 2,848 Proceeds from Tax Refunds, Grants, and Other 24 230 Other Income 2,644 3,078
Interest Revenue Revenue is recognised as interest accrues using the effective interest rate method. This is a method of calculating the amortised cost of a financial asset and allocating the interest income over the relevant period using the effective interest rate, which is the rate that exactly discounts estimated future cash receipts through the expected life of the financial asset to the net carrying amount of the financial asset.
Tax Incentive Revenue and Grant Revenue The Australian Taxation Office (ATO) provides certain Research and Development (R&D) tax incentives and concessions under the AusIndustry R&D Tax Incentive program. The program is a broad-based entitlement program that aims to promote innovation within Australia for eligible R&D activities.
The Group accrues for amounts when there is reasonable assurance of receipt. Whilst there is a judgment involved in when there is reasonable assurance, the Group now has a past history of successful lodgings and receipt with the ATO. The Group recognises income related to the R&D tax incentive in the period in which the expenses are recognised.
For
per
sona
l use
onl
y
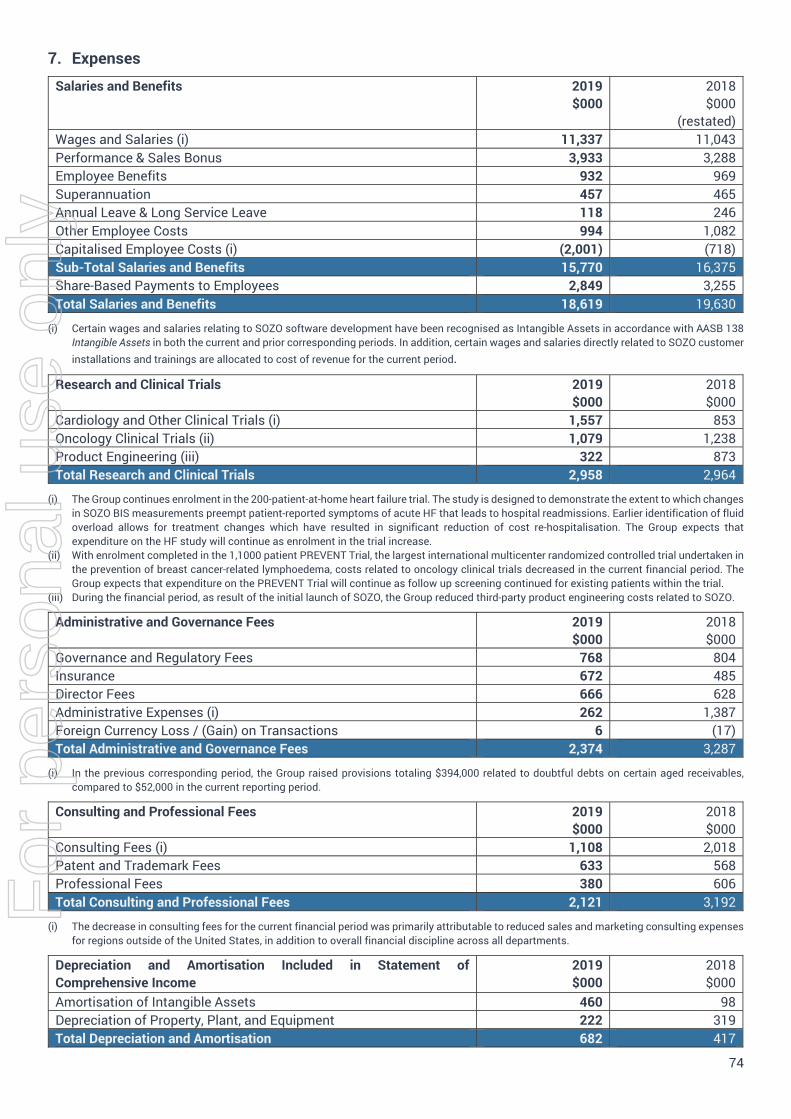
74
7. Expenses
Salaries and Benefits 2019 $000
2018 $000
(restated) Wages and Salaries (i) 11,337 11,043 Performance & Sales Bonus 3,933 3,288 Employee Benefits 932 969 Superannuation 457 465 Annual Leave & Long Service Leave 118 246 Other Employee Costs 994 1,082 Capitalised Employee Costs (i) (2,001) (718) Sub-Total Salaries and Benefits 15,770 16,375 Share-Based Payments to Employees 2,849 3,255 Total Salaries and Benefits 18,619 19,630
(i) Certain wages and salaries relating to SOZO software development have been recognised as Intangible Assets in accordance with AASB 138 Intangible Assets in both the current and prior corresponding periods. In addition, certain wages and salaries directly related to SOZO customer installations and trainings are allocated to cost of revenue for the current period.
Research and Clinical Trials 2019 $000
2018 $000
Cardiology and Other Clinical Trials (i) 1,557 853 Oncology Clinical Trials (ii) 1,079 1,238 Product Engineering (iii) 322 873 Total Research and Clinical Trials 2,958 2,964
(i) The Group continues enrolment in the 200-patient-at-home heart failure trial. The study is designed to demonstrate the extent to which changes in SOZO BIS measurements preempt patient-reported symptoms of acute HF that leads to hospital readmissions. Earlier identification of fluid overload allows for treatment changes which have resulted in significant reduction of cost re-hospitalisation. The Group expects that expenditure on the HF study will continue as enrolment in the trial increase.
(ii) With enrolment completed in the 1,1000 patient PREVENT Trial, the largest international multicenter randomized controlled trial undertaken in the prevention of breast cancer-related lymphoedema, costs related to oncology clinical trials decreased in the current financial period. The Group expects that expenditure on the PREVENT Trial will continue as follow up screening continued for existing patients within the trial.
(iii) During the financial period, as result of the initial launch of SOZO, the Group reduced third-party product engineering costs related to SOZO.
Administrative and Governance Fees 2019 $000
2018 $000
Governance and Regulatory Fees 768 804 Insurance 672 485 Director Fees 666 628 Administrative Expenses (i) 262 1,387 Foreign Currency Loss / (Gain) on Transactions 6 (17) Total Administrative and Governance Fees 2,374 3,287
(i) In the previous corresponding period, the Group raised provisions totaling $394,000 related to doubtful debts on certain aged receivables, compared to $52,000 in the current reporting period.
Consulting and Professional Fees 2019 $000
2018 $000
Consulting Fees (i) 1,108 2,018 Patent and Trademark Fees 633 568 Professional Fees 380 606 Total Consulting and Professional Fees 2,121 3,192
(i) The decrease in consulting fees for the current financial period was primarily attributable to reduced sales and marketing consulting expenses for regions outside of the United States, in addition to overall financial discipline across all departments.
Depreciation and Amortisation Included in Statement of Comprehensive Income
2019 $000
2018 $000
Amortisation of Intangible Assets 460 98 Depreciation of Property, Plant, and Equipment 222 319 Total Depreciation and Amortisation 682 417
For
per
sona
l use
onl
y
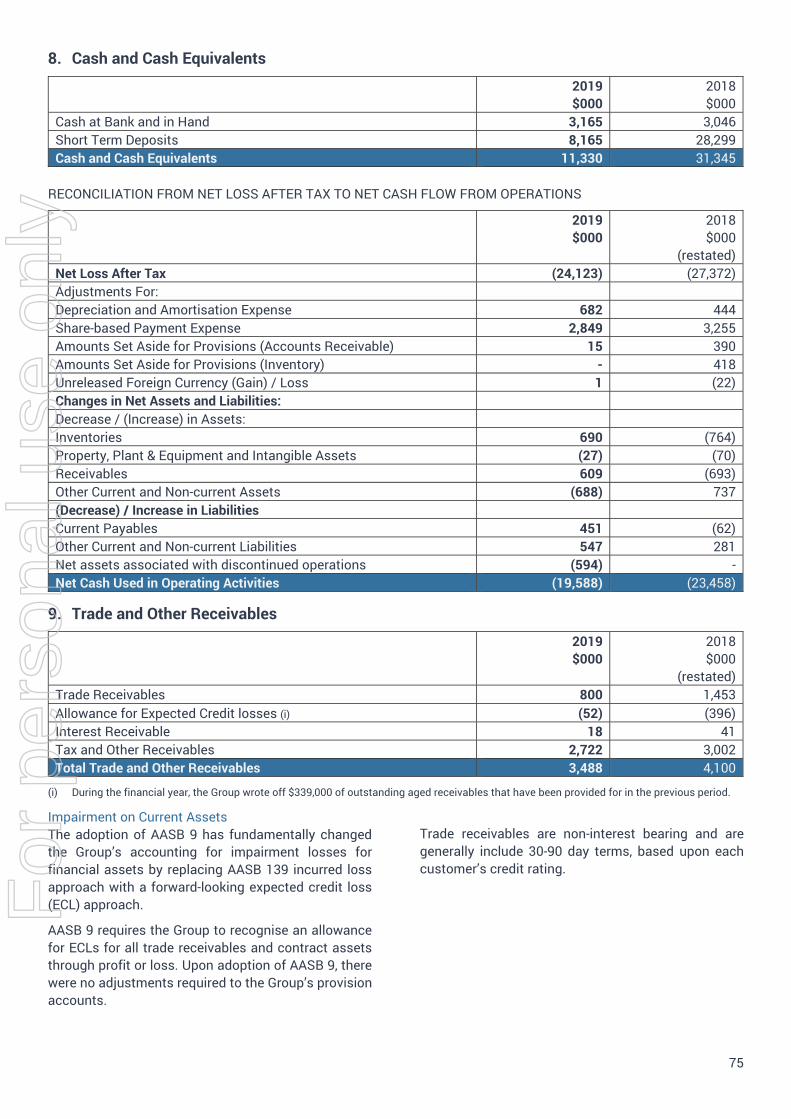
75
8. Cash and Cash Equivalents
2019 $000
2018 $000
Cash at Bank and in Hand 3,165 3,046 Short Term Deposits 8,165 28,299 Cash and Cash Equivalents 11,330 31,345
RECONCILIATION FROM NET LOSS AFTER TAX TO NET CASH FLOW FROM OPERATIONS
2019 $000
2018 $000
(restated) Net Loss After Tax (24,123) (27,372) Adjustments For: Depreciation and Amortisation Expense 682 444 Share-based Payment Expense 2,849 3,255 Amounts Set Aside for Provisions (Accounts Receivable) 15 390 Amounts Set Aside for Provisions (Inventory) - 418 Unreleased Foreign Currency (Gain) / Loss 1 (22) Changes in Net Assets and Liabilities: Decrease / (Increase) in Assets: Inventories 690 (764) Property, Plant & Equipment and Intangible Assets (27) (70) Receivables 609 (693) Other Current and Non-current Assets (688) 737 (Decrease) / Increase in Liabilities Current Payables 451 (62) Other Current and Non-current Liabilities 547 281 Net assets associated with discontinued operations (594) - Net Cash Used in Operating Activities (19,588) (23,458)
9. Trade and Other Receivables
2019 $000
2018 $000
(restated) Trade Receivables 800 1,453 Allowance for Expected Credit losses (i) (52) (396) Interest Receivable 18 41 Tax and Other Receivables 2,722 3,002 Total Trade and Other Receivables 3,488 4,100
(i) During the financial year, the Group wrote off $339,000 of outstanding aged receivables that have been provided for in the previous period.
Impairment on Current Assets The adoption of AASB 9 has fundamentally changed the Group’s accounting for impairment losses for financial assets by replacing AASB 139 incurred loss approach with a forward-looking expected credit loss (ECL) approach.
AASB 9 requires the Group to recognise an allowance for ECLs for all trade receivables and contract assets through profit or loss. Upon adoption of AASB 9, there were no adjustments required to the Group’s provision accounts.
Trade receivables are non-interest bearing and are generally include 30-90 day terms, based upon each customer’s credit rating.
For
per
sona
l use
onl
y
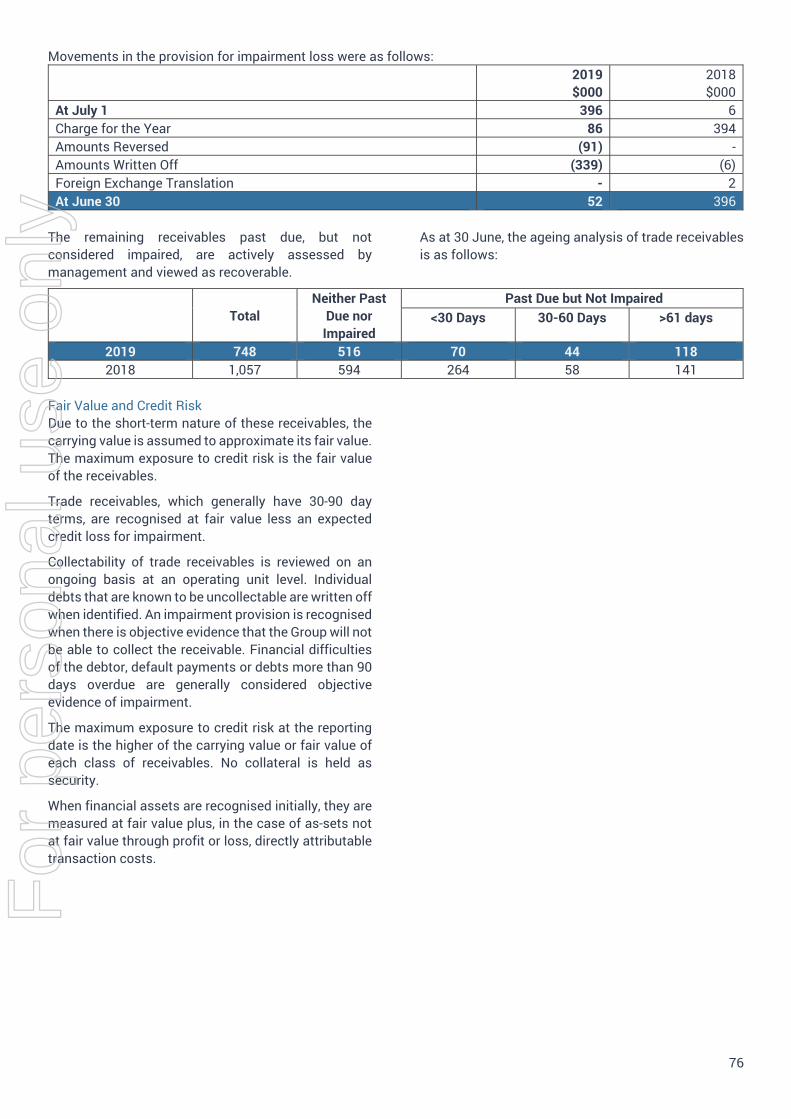
76
Movements in the provision for impairment loss were as follows: 2019 $000
2018 $000
At July 1 396 6 Charge for the Year 86 394 Amounts Reversed (91) - Amounts Written Off (339) (6) Foreign Exchange Translation - 2 At June 30 52 396
The remaining receivables past due, but not considered impaired, are actively assessed by management and viewed as recoverable.
As at 30 June, the ageing analysis of trade receivables is as follows:
Total Neither Past
Due nor Impaired
Past Due but Not Impaired <30 Days 30-60 Days >61 days
2019 748 516 70 44 118 2018 1,057 594 264 58 141
Fair Value and Credit Risk Due to the short-term nature of these receivables, the carrying value is assumed to approximate its fair value. The maximum exposure to credit risk is the fair value of the receivables.
Trade receivables, which generally have 30-90 day terms, are recognised at fair value less an expected credit loss for impairment.
Collectability of trade receivables is reviewed on an ongoing basis at an operating unit level. Individual debts that are known to be uncollectable are written off when identified. An impairment provision is recognised when there is objective evidence that the Group will not be able to collect the receivable. Financial difficulties of the debtor, default payments or debts more than 90 days overdue are generally considered objective evidence of impairment.
The maximum exposure to credit risk at the reporting date is the higher of the carrying value or fair value of each class of receivables. No collateral is held as security.
When financial assets are recognised initially, they are measured at fair value plus, in the case of as-sets not at fair value through profit or loss, directly attributable transaction costs.
For
per
sona
l use
onl
y
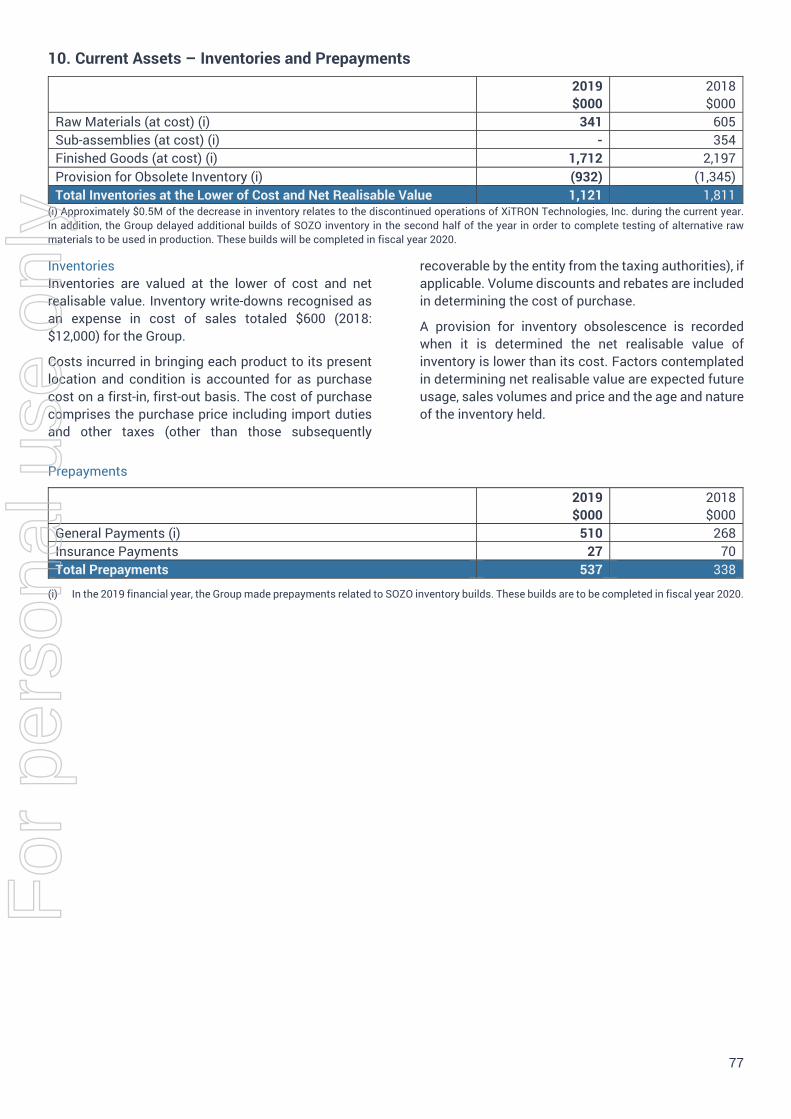
77
10. Current Assets – Inventories and Prepayments
2019 $000
2018 $000
Raw Materials (at cost) (i) 341 605 Sub-assemblies (at cost) (i) - 354 Finished Goods (at cost) (i) 1,712 2,197 Provision for Obsolete Inventory (i) (932) (1,345) Total Inventories at the Lower of Cost and Net Realisable Value 1,121 1,811
(i) Approximately $0.5M of the decrease in inventory relates to the discontinued operations of XiTRON Technologies, Inc. during the current year. In addition, the Group delayed additional builds of SOZO inventory in the second half of the year in order to complete testing of alternative raw materials to be used in production. These builds will be completed in fiscal year 2020.
Inventories Inventories are valued at the lower of cost and net realisable value. Inventory write-downs recognised as an expense in cost of sales totaled $600 (2018: $12,000) for the Group.
Costs incurred in bringing each product to its present location and condition is accounted for as purchase cost on a first-in, first-out basis. The cost of purchase comprises the purchase price including import duties and other taxes (other than those subsequently
recoverable by the entity from the taxing authorities), if applicable. Volume discounts and rebates are included in determining the cost of purchase.
A provision for inventory obsolescence is recorded when it is determined the net realisable value of inventory is lower than its cost. Factors contemplated in determining net realisable value are expected future usage, sales volumes and price and the age and nature of the inventory held.
Prepayments
2019 $000
2018 $000
General Payments (i) 510 268 Insurance Payments 27 70 Total Prepayments 537 338
(i) In the 2019 financial year, the Group made prepayments related to SOZO inventory builds. These builds are to be completed in fiscal year 2020.
For
per
sona
l use
onl
y

78
11. Non-Current Assets – Property and Equipment
Year Ended 30 June 2019 Leased, Demo
& Loan Devices
$000
Leasehold Improvements
$000
Property & Machinery
$000
Computer Equipment
$000
Total $000
At 1 July 2018 Net of Accumulated Depreciation
102 4 154 108 368
Additions - 11 17 4 32 Disposals (18) - - - (18) Transfers from Inventory 30 - - - 30 Depreciation Charge for the Year (i)
(47) (4) (103) (78) (232)
Effect of Foreign Exchange (1) - 4 5 8 At 30 June 2019 Net of Accumulated Depreciation 66 11 72 39 188
At 30 June 2019 Cost 873 162 697 612 2,344 Accumulated Depreciation (807) (151) (625) (573) (2,156) Net Carrying Amount 66 11 72 39 188
Year Ended 30 June 2018 Leased, Demo
& Loan Devices
$000
Leasehold Improvements
$000
Property & Machinery
$000
Computer Equipment
$000
Total $000
At 1 July 2017 Net of Accumulated Depreciation
131 39 189 159 518
Additions - - 149 40 189 Disposals (23) (27) (19) - (69) Transfers from Inventory 78 - - - 78 Depreciation Charge for the Year (i)
(93) (9) (165) (94) (361)
Effect of Foreign Exchange 9 1 - 3 13 At 30 June 2018 Net of Accumulated Depreciation 102 4 154 108 368
At 30 June 2018 Cost 919 179 672 592 2,362 Accumulated Depreciation (817) (175) (518) (484) (1,994) Net Carrying Amount 102 4 154 108 368
(i) Depreciation change for the year includes $10,000 and $16,000 of depreciation expense included in cost of goods sold for the years ending 30 June 2019 and 2018, respectively.
Equipment is stated at historical cost less accumulated depreciation and any accumulated impairment losses. Such cost includes the cost of replacing parts that are eligible for capitalisation when the cost of replacing the parts is incurred. Similarly, when each major inspection is performed, its cost is recognised in the carrying amount of the plant and equipment as a replacement only if it is eligible for capitalisation. All other repairs and maintenance are recognised in profit or loss as incurred.
Depreciation is calculated on a straight line or diminishing value basis over the estimated useful life of the specific assets as follows:
Plant, Machinery and Equipment 1 – 10 years
Devices Under Lease, PSA or Loan 3 years Leasehold Improvements 2 – 5 years
The assets’ residual values, useful lives and amortisation methods are reviewed, and adjusted if appropriate, at each reporting date.
Certain assets classified as Plant, Machinery and Equipment during the year have been determined to have a one-year useful life based on the expected economic life of the assets and are amortised using the straight-line method.
Certain Leasehold improvements capitalised by the Group were calculated to have useful lives that mirror their respective premise leases.
For
per
sona
l use
onl
y
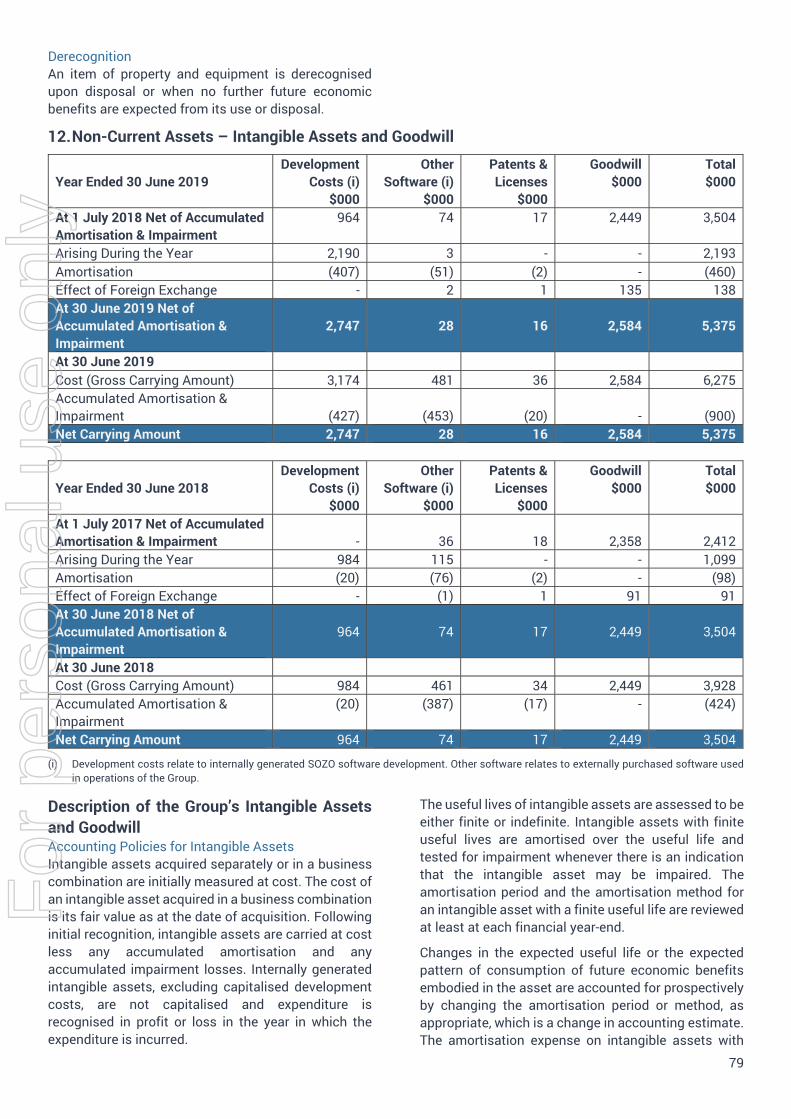
79
Derecognition An item of property and equipment is derecognised upon disposal or when no further future economic benefits are expected from its use or disposal.
12. Non-Current Assets – Intangible Assets and Goodwill
Year Ended 30 June 2019 Development
Costs (i) $000
Other Software (i)
$000
Patents & Licenses
$000
Goodwill $000
Total $000
At 1 July 2018 Net of Accumulated Amortisation & Impairment
964 74 17 2,449 3,504
Arising During the Year 2,190 3 - - 2,193 Amortisation (407) (51) (2) - (460) Effect of Foreign Exchange - 2 1 135 138 At 30 June 2019 Net of Accumulated Amortisation & Impairment
2,747 28 16 2,584 5,375
At 30 June 2019 Cost (Gross Carrying Amount) 3,174 481 36 2,584 6,275 Accumulated Amortisation & Impairment (427) (453) (20) - (900) Net Carrying Amount 2,747 28 16 2,584 5,375
Year Ended 30 June 2018 Development
Costs (i) $000
Other Software (i)
$000
Patents & Licenses
$000
Goodwill $000
Total $000
At 1 July 2017 Net of Accumulated Amortisation & Impairment - 36 18 2,358 2,412 Arising During the Year 984 115 - - 1,099 Amortisation (20) (76) (2) - (98) Effect of Foreign Exchange - (1) 1 91 91 At 30 June 2018 Net of Accumulated Amortisation & Impairment
964 74 17 2,449 3,504
At 30 June 2018 Cost (Gross Carrying Amount) 984 461 34 2,449 3,928 Accumulated Amortisation & Impairment
(20) (387) (17) - (424)
Net Carrying Amount 964 74 17 2,449 3,504
(i) Development costs relate to internally generated SOZO software development. Other software relates to externally purchased software used in operations of the Group.
Description of the Group’s Intangible Assets and Goodwill Accounting Policies for Intangible Assets Intangible assets acquired separately or in a business combination are initially measured at cost. The cost of an intangible asset acquired in a business combination is its fair value as at the date of acquisition. Following initial recognition, intangible assets are carried at cost less any accumulated amortisation and any accumulated impairment losses. Internally generated intangible assets, excluding capitalised development costs, are not capitalised and expenditure is recognised in profit or loss in the year in which the expenditure is incurred.
The useful lives of intangible assets are assessed to be either finite or indefinite. Intangible assets with finite useful lives are amortised over the useful life and tested for impairment whenever there is an indication that the intangible asset may be impaired. The amortisation period and the amortisation method for an intangible asset with a finite useful life are reviewed at least at each financial year-end.
Changes in the expected useful life or the expected pattern of consumption of future economic benefits embodied in the asset are accounted for prospectively by changing the amortisation period or method, as appropriate, which is a change in accounting estimate. The amortisation expense on intangible assets with
For
per
sona
l use
onl
y
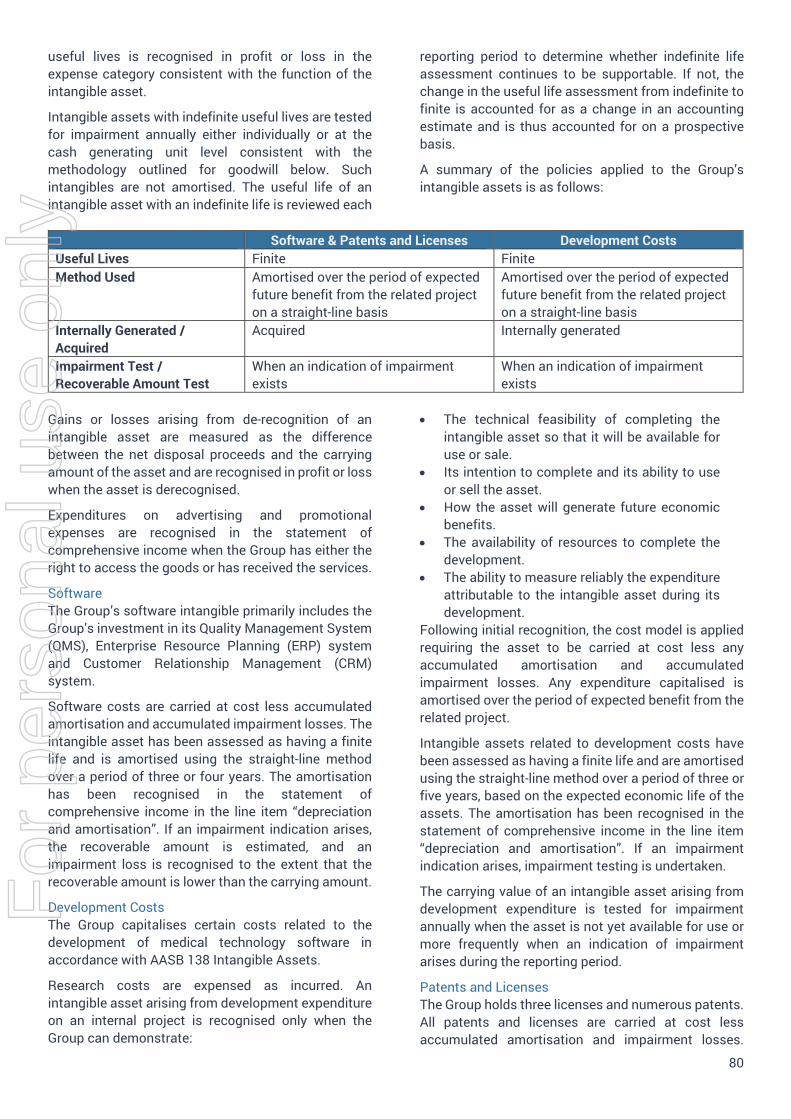
80
useful lives is recognised in profit or loss in the expense category consistent with the function of the intangible asset.
Intangible assets with indefinite useful lives are tested for impairment annually either individually or at the cash generating unit level consistent with the methodology outlined for goodwill below. Such intangibles are not amortised. The useful life of an intangible asset with an indefinite life is reviewed each
reporting period to determine whether indefinite life assessment continues to be supportable. If not, the change in the useful life assessment from indefinite to finite is accounted for as a change in an accounting estimate and is thus accounted for on a prospective basis.
A summary of the policies applied to the Group’s intangible assets is as follows:
Software & Patents and Licenses Development Costs Useful Lives Finite Finite Method Used Amortised over the period of expected
future benefit from the related project on a straight-line basis
Amortised over the period of expected future benefit from the related project on a straight-line basis
Internally Generated / Acquired
Acquired Internally generated
Impairment Test / Recoverable Amount Test
When an indication of impairment exists
When an indication of impairment exists
Gains or losses arising from de-recognition of an intangible asset are measured as the difference between the net disposal proceeds and the carrying amount of the asset and are recognised in profit or loss when the asset is derecognised.
Expenditures on advertising and promotional expenses are recognised in the statement of comprehensive income when the Group has either the right to access the goods or has received the services.
Software The Group’s software intangible primarily includes the Group’s investment in its Quality Management System (QMS), Enterprise Resource Planning (ERP) system and Customer Relationship Management (CRM) system.
Software costs are carried at cost less accumulated amortisation and accumulated impairment losses. The intangible asset has been assessed as having a finite life and is amortised using the straight-line method over a period of three or four years. The amortisation has been recognised in the statement of comprehensive income in the line item “depreciation and amortisation”. If an impairment indication arises, the recoverable amount is estimated, and an impairment loss is recognised to the extent that the recoverable amount is lower than the carrying amount.
Development Costs The Group capitalises certain costs related to the development of medical technology software in accordance with AASB 138 Intangible Assets.
Research costs are expensed as incurred. An intangible asset arising from development expenditure on an internal project is recognised only when the Group can demonstrate:
The technical feasibility of completing theintangible asset so that it will be available foruse or sale.
Its intention to complete and its ability to useor sell the asset.
How the asset will generate future economicbenefits.
The availability of resources to complete thedevelopment.
The ability to measure reliably the expenditureattributable to the intangible asset during itsdevelopment.
Following initial recognition, the cost model is applied requiring the asset to be carried at cost less any accumulated amortisation and accumulated impairment losses. Any expenditure capitalised is amortised over the period of expected benefit from the related project.
Intangible assets related to development costs have been assessed as having a finite life and are amortised using the straight-line method over a period of three or five years, based on the expected economic life of the assets. The amortisation has been recognised in the statement of comprehensive income in the line item “depreciation and amortisation”. If an impairment indication arises, impairment testing is undertaken.
The carrying value of an intangible asset arising from development expenditure is tested for impairment annually when the asset is not yet available for use or more frequently when an indication of impairment arises during the reporting period.
Patents and Licenses The Group holds three licenses and numerous patents. All patents and licenses are carried at cost less accumulated amortisation and impairment losses.
For
per
sona
l use
onl
y
81
These intangible assets have been determined to have a finite life and are amortised using the straight-line method over a useful life of between five and twenty years. The amortisation has been recognised in the statement of comprehensive income in the line item “depreciation and amortisation”. Patents and licenses are subject to impairment testing whenever there is an indication of impairment.
No impairment loss has been recognised for the years ended 30 June 2019 or 2018.
Goodwill Goodwill acquired in a business combination is initially measured at cost of the business combination being the excess of the consideration transferred over the fair value of the Group’s net identifiable assets acquired and liabilities assumed. If this consideration transferred is lower than the fair value of the net identifiable assets of the subsidiary acquired, the difference is recognised in profit and loss.
Following initial recognition, goodwill is measured at cost less any accumulated impairment losses.
For the purpose of impairment testing, goodwill acquired in a business combination is, from the acquisition date, allocated to each of the Group’s cash generating units, or groups of cash generating units, that are expected to benefit from the synergies of the combination, irrespective of whether other assets or liabilities of the Group are assigned to those units or groups of units. Each unit or group of units to which the goodwill is allocated represents the lowest level within the entity at which goodwill is monitored for internal management purposes and is not larger than an operating segment determined in accordance with AASB 8. The goodwill of the Group is allocated to the Medical cash generating unit.
Impairment is determined by assessing the recoverable amount of the cash generating unit or group of cash generating units to which the goodwill relates.
The Group performs its impairment testing as at 30 June each year and more frequently if indicators of impairment exist, using the value in use (VIU), discounted cash flow methodology.
When the recoverable amount of the cash-generating unit or group of cash generating units is less than the carrying amount, an impairment loss is recognised.
Impairment losses recognised for goodwill are not subsequently reversed. When goodwill forms part of a cash generating unit or group of cash generating units and an operation within that unit is disposed of, the goodwill associated with the operation disposed of is included in the carrying amount of the operation when determining the gain or loss on disposal of the
operation. Goodwill disposed of in this manner is measured based on the relative values of the operation disposed of and the portion of the cash generating unit retained.
Impairment Tests for Goodwill and Intangible Assets with Indefinite Useful Lives Description of the Group’s Cash Generating Units (CGUs) At 30 June 2019, the Group has only one CGU, which is the Medical CGU. During the current period, the key focus of the Medical CGU was the sale of devices for the subclinical assessment of lymphoedema in cancer survivors, though it also includes the sale of devices used in body composition, and other areas of fluid status measurement. The Medical CGU is the core business of the Group and the part of the business forecasting substantial growth. There was no impairment in financial years 2019 and 2018.
Relationship of the Intangible Assets with the CGUs The only intangible asset in the Group with an indefinite useful life is goodwill. The goodwill has been allocated to the Medical CGU.
Details of Impairment Testing Impairment testing has been performed by reviewing the carrying amounts of net assets and by calculating the value in use of the CGU.
The market capitalisation of the Group at 30 June 2019 was approximately $43 million, which exceeded the net assets recorded (including goodwill) by approximately $27 million.
The VIU cash flow model is based on a five-year period which analyses the net present value (NPV) of cash flows using a 12.5% discount rate and a 3% long-term growth rate. The short-term cash flows used in the cash flow model are based on budgets and forecasts approved by the Board and consider the size of markets available to the Group. In order to calculate the discount rate for use in the VIU cash flow model, the Group used a weighted average cost of capital (WACC) method. The Group currently has no debt and has created equity by relying upon capital raises for its operating funds. Due to the risk in future cash flows, Management has assessed the breakeven discount rate to be 16.2% at 30 June 2019.
For
per
sona
l use
onl
y
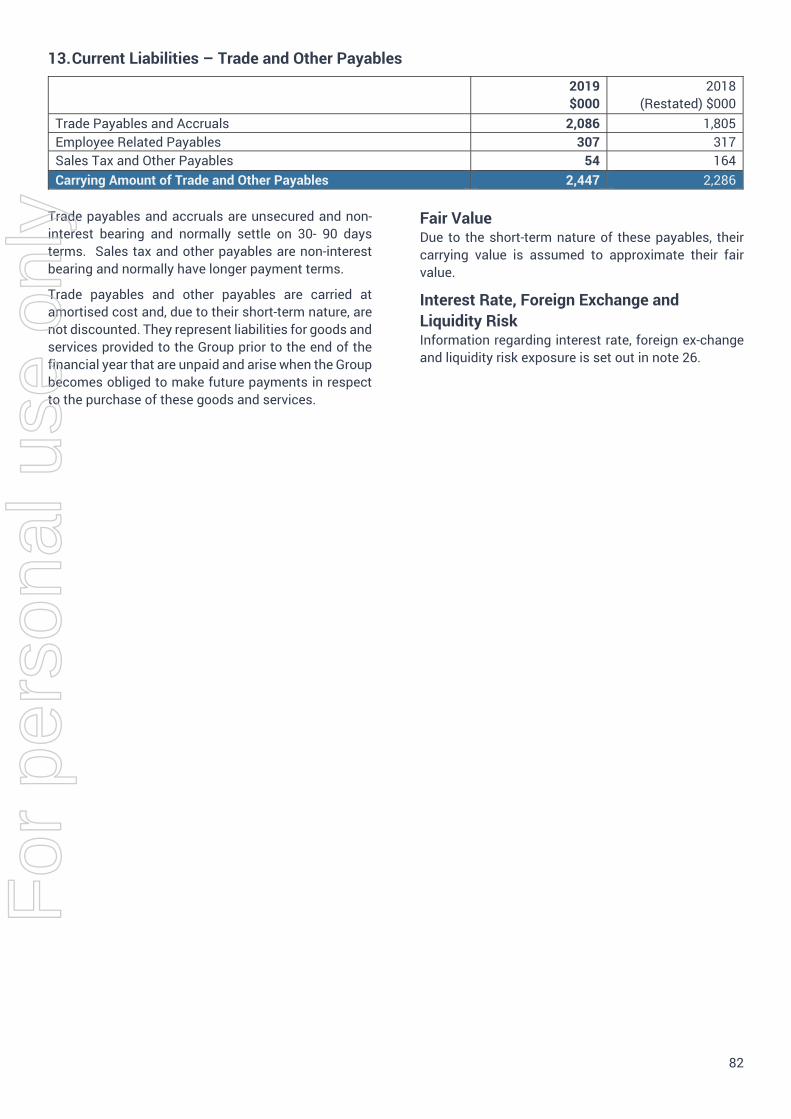
82
13. Current Liabilities – Trade and Other Payables
2019 $000
2018 (Restated) $000
Trade Payables and Accruals 2,086 1,805 Employee Related Payables 307 317 Sales Tax and Other Payables 54 164 Carrying Amount of Trade and Other Payables 2,447 2,286
Trade payables and accruals are unsecured and non-interest bearing and normally settle on 30- 90 days terms. Sales tax and other payables are non-interest bearing and normally have longer payment terms.
Trade payables and other payables are carried at amortised cost and, due to their short-term nature, are not discounted. They represent liabilities for goods and services provided to the Group prior to the end of the financial year that are unpaid and arise when the Group becomes obliged to make future payments in respect to the purchase of these goods and services.
Fair Value Due to the short-term nature of these payables, their carrying value is assumed to approximate their fair value.
Interest Rate, Foreign Exchange and Liquidity Risk Information regarding interest rate, foreign ex-change and liquidity risk exposure is set out in note 26.
For
per
sona
l use
onl
y
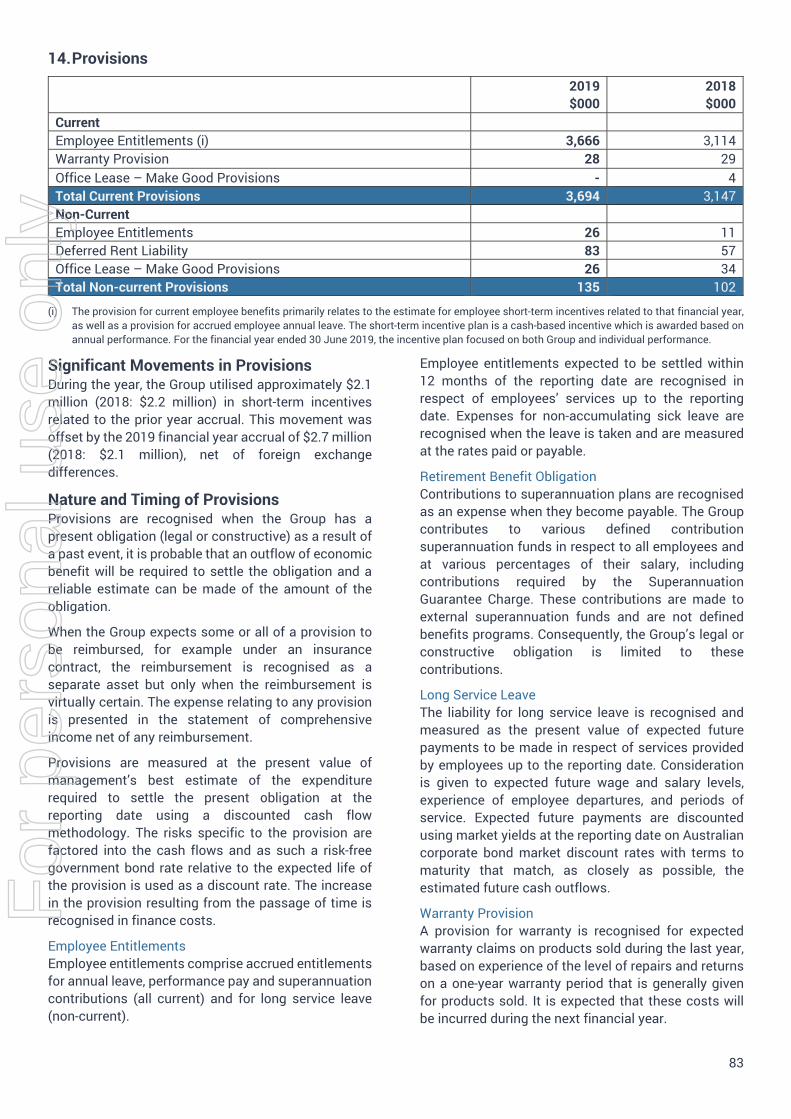
83
14. Provisions
2019 $000
2018 $000
Current Employee Entitlements (i) 3,666 3,114 Warranty Provision 28 29 Office Lease – Make Good Provisions - 4 Total Current Provisions 3,694 3,147 Non-Current Employee Entitlements 26 11 Deferred Rent Liability 83 57 Office Lease – Make Good Provisions 26 34 Total Non-current Provisions 135 102
(i) The provision for current employee benefits primarily relates to the estimate for employee short-term incentives related to that financial year, as well as a provision for accrued employee annual leave. The short-term incentive plan is a cash-based incentive which is awarded based on annual performance. For the financial year ended 30 June 2019, the incentive plan focused on both Group and individual performance.
Significant Movements in Provisions During the year, the Group utilised approximately $2.1 million (2018: $2.2 million) in short-term incentives related to the prior year accrual. This movement was offset by the 2019 financial year accrual of $2.7 million (2018: $2.1 million), net of foreign exchange differences.
Nature and Timing of Provisions Provisions are recognised when the Group has a present obligation (legal or constructive) as a result of a past event, it is probable that an outflow of economic benefit will be required to settle the obligation and a reliable estimate can be made of the amount of the obligation.
When the Group expects some or all of a provision to be reimbursed, for example under an insurance contract, the reimbursement is recognised as a separate asset but only when the reimbursement is virtually certain. The expense relating to any provision is presented in the statement of comprehensive income net of any reimbursement.
Provisions are measured at the present value of management’s best estimate of the expenditure required to settle the present obligation at the reporting date using a discounted cash flow methodology. The risks specific to the provision are factored into the cash flows and as such a risk-free government bond rate relative to the expected life of the provision is used as a discount rate. The increase in the provision resulting from the passage of time is recognised in finance costs.
Employee Entitlements Employee entitlements comprise accrued entitlements for annual leave, performance pay and superannuation contributions (all current) and for long service leave (non-current).
Employee entitlements expected to be settled within 12 months of the reporting date are recognised in respect of employees’ services up to the reporting date. Expenses for non-accumulating sick leave are recognised when the leave is taken and are measured at the rates paid or payable.
Retirement Benefit Obligation Contributions to superannuation plans are recognised as an expense when they become payable. The Group contributes to various defined contribution superannuation funds in respect to all employees and at various percentages of their salary, including contributions required by the Superannuation Guarantee Charge. These contributions are made to external superannuation funds and are not defined benefits programs. Consequently, the Group’s legal or constructive obligation is limited to these contributions.
Long Service Leave The liability for long service leave is recognised and measured as the present value of expected future payments to be made in respect of services provided by employees up to the reporting date. Consideration is given to expected future wage and salary levels, experience of employee departures, and periods of service. Expected future payments are discounted using market yields at the reporting date on Australian corporate bond market discount rates with terms to maturity that match, as closely as possible, the estimated future cash outflows.
Warranty Provision A provision for warranty is recognised for expected warranty claims on products sold during the last year, based on experience of the level of repairs and returns on a one-year warranty period that is generally given for products sold. It is expected that these costs will be incurred during the next financial year.
For
per
sona
l use
onl
y
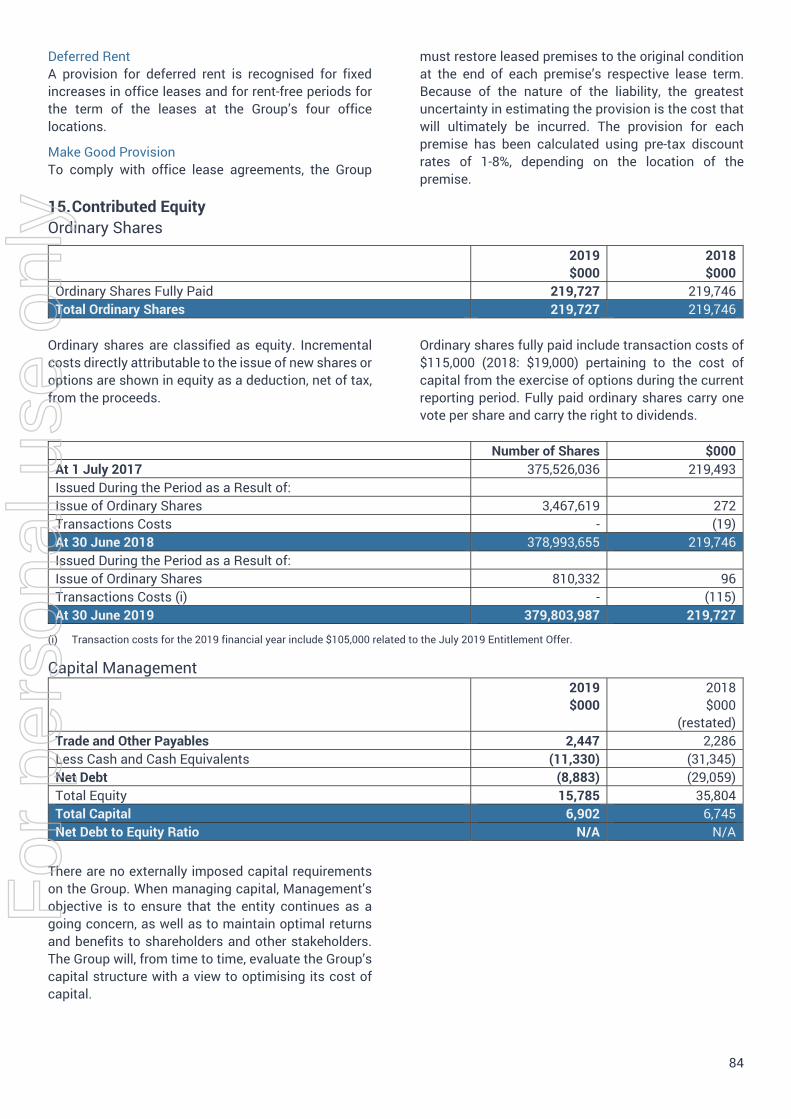
84
Deferred Rent A provision for deferred rent is recognised for fixed increases in office leases and for rent-free periods for the term of the leases at the Group’s four office locations.
Make Good Provision To comply with office lease agreements, the Group
must restore leased premises to the original condition at the end of each premise’s respective lease term. Because of the nature of the liability, the greatest uncertainty in estimating the provision is the cost that will ultimately be incurred. The provision for each premise has been calculated using pre-tax discount rates of 1-8%, depending on the location of the premise.
15. Contributed EquityOrdinary Shares
2019 $000
2018 $000
Ordinary Shares Fully Paid 219,727 219,746 Total Ordinary Shares 219,727 219,746
Ordinary shares are classified as equity. Incremental costs directly attributable to the issue of new shares or options are shown in equity as a deduction, net of tax, from the proceeds.
Ordinary shares fully paid include transaction costs of $115,000 (2018: $19,000) pertaining to the cost of capital from the exercise of options during the current reporting period. Fully paid ordinary shares carry one vote per share and carry the right to dividends.
Number of Shares $000 At 1 July 2017 375,526,036 219,493 Issued During the Period as a Result of: Issue of Ordinary Shares 3,467,619 272 Transactions Costs - (19) At 30 June 2018 378,993,655 219,746 Issued During the Period as a Result of: Issue of Ordinary Shares 810,332 96 Transactions Costs (i) - (115) At 30 June 2019 379,803,987 219,727
(i) Transaction costs for the 2019 financial year include $105,000 related to the July 2019 Entitlement Offer.
Capital Management 2019 $000
2018 $000
(restated) Trade and Other Payables 2,447 2,286 Less Cash and Cash Equivalents (11,330) (31,345) Net Debt (8,883) (29,059) Total Equity 15,785 35,804 Total Capital 6,902 6,745 Net Debt to Equity Ratio N/A N/A
There are no externally imposed capital requirements on the Group. When managing capital, Management’s objective is to ensure that the entity continues as a going concern, as well as to maintain optimal returns and benefits to shareholders and other stakeholders. The Group will, from time to time, evaluate the Group’s capital structure with a view to optimising its cost of capital.
For
per
sona
l use
onl
y
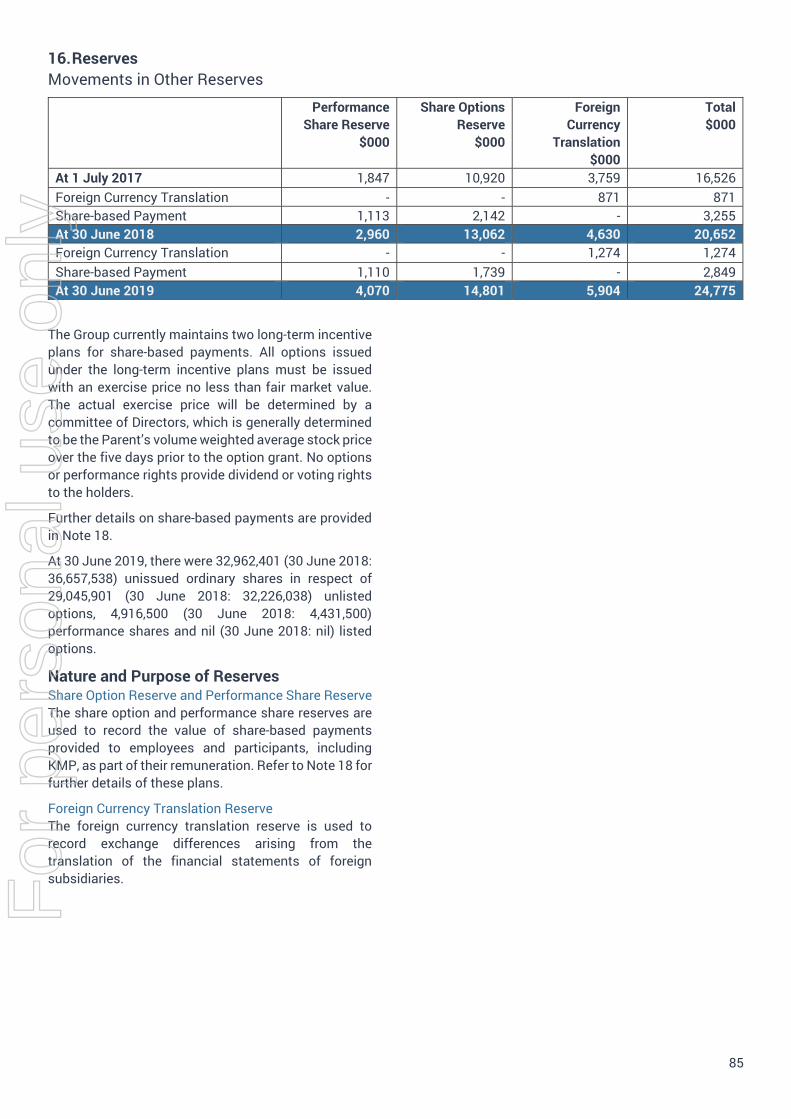
85
16. ReservesMovements in Other Reserves
Performance Share Reserve
$000
Share Options Reserve
$000
Foreign Currency
Translation $000
Total $000
At 1 July 2017 1,847 10,920 3,759 16,526 Foreign Currency Translation - - 871 871 Share-based Payment 1,113 2,142 - 3,255 At 30 June 2018 2,960 13,062 4,630 20,652 Foreign Currency Translation - - 1,274 1,274 Share-based Payment 1,110 1,739 - 2,849 At 30 June 2019 4,070 14,801 5,904 24,775
The Group currently maintains two long-term incentive plans for share-based payments. All options issued under the long-term incentive plans must be issued with an exercise price no less than fair market value. The actual exercise price will be determined by a committee of Directors, which is generally determined to be the Parent’s volume weighted average stock price over the five days prior to the option grant. No options or performance rights provide dividend or voting rights to the holders.
Further details on share-based payments are provided in Note 18.
At 30 June 2019, there were 32,962,401 (30 June 2018: 36,657,538) unissued ordinary shares in respect of 29,045,901 (30 June 2018: 32,226,038) unlisted options, 4,916,500 (30 June 2018: 4,431,500) performance shares and nil (30 June 2018: nil) listed options.
Nature and Purpose of Reserves Share Option Reserve and Performance Share Reserve The share option and performance share reserves are used to record the value of share-based payments provided to employees and participants, including KMP, as part of their remuneration. Refer to Note 18 for further details of these plans.
Foreign Currency Translation Reserve The foreign currency translation reserve is used to record exchange differences arising from the translation of the financial statements of foreign subsidiaries. F
or p
erso
nal u
se o
nly
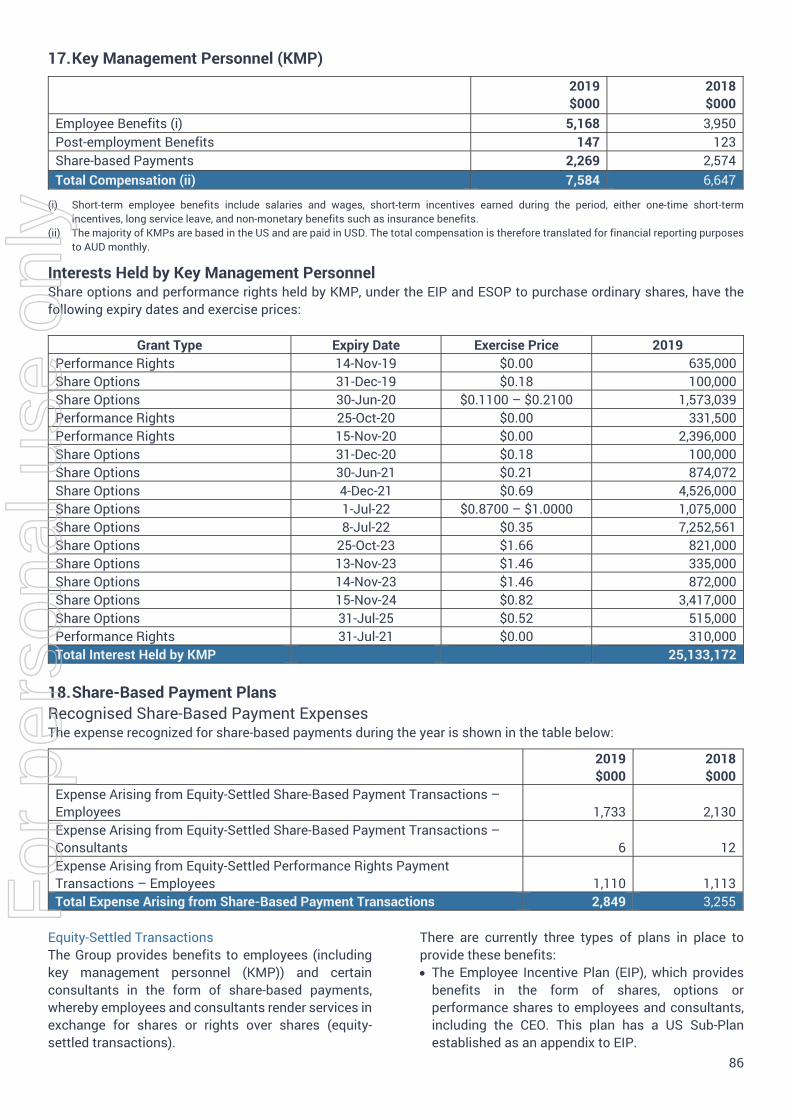
86
17. Key Management Personnel (KMP)
2019 $000
2018 $000
Employee Benefits (i) 5,168 3,950 Post-employment Benefits 147 123 Share-based Payments 2,269 2,574 Total Compensation (ii) 7,584 6,647
(i) Short-term employee benefits include salaries and wages, short-term incentives earned during the period, either one-time short-term incentives, long service leave, and non-monetary benefits such as insurance benefits.
(ii) The majority of KMPs are based in the US and are paid in USD. The total compensation is therefore translated for financial reporting purposes to AUD monthly.
Interests Held by Key Management Personnel Share options and performance rights held by KMP, under the EIP and ESOP to purchase ordinary shares, have the following expiry dates and exercise prices:
Grant Type Expiry Date Exercise Price 2019 Performance Rights 14-Nov-19 $0.00 635,000 Share Options 31-Dec-19 $0.18 100,000 Share Options 30-Jun-20 $0.1100 – $0.2100 1,573,039 Performance Rights 25-Oct-20 $0.00 331,500 Performance Rights 15-Nov-20 $0.00 2,396,000 Share Options 31-Dec-20 $0.18 100,000 Share Options 30-Jun-21 $0.21 874,072 Share Options 4-Dec-21 $0.69 4,526,000 Share Options 1-Jul-22 $0.8700 – $1.0000 1,075,000 Share Options 8-Jul-22 $0.35 7,252,561 Share Options 25-Oct-23 $1.66 821,000 Share Options 13-Nov-23 $1.46 335,000 Share Options 14-Nov-23 $1.46 872,000 Share Options 15-Nov-24 $0.82 3,417,000 Share Options 31-Jul-25 $0.52 515,000 Performance Rights 31-Jul-21 $0.00 310,000 Total Interest Held by KMP 25,133,172
18. Share-Based Payment PlansRecognised Share-Based Payment Expenses The expense recognized for share-based payments during the year is shown in the table below:
2019 $000
2018 $000
Expense Arising from Equity-Settled Share-Based Payment Transactions – Employees 1,733 2,130 Expense Arising from Equity-Settled Share-Based Payment Transactions – Consultants 6 12 Expense Arising from Equity-Settled Performance Rights Payment Transactions – Employees 1,110 1,113 Total Expense Arising from Share-Based Payment Transactions 2,849 3,255
Equity-Settled Transactions The Group provides benefits to employees (including key management personnel (KMP)) and certain consultants in the form of share-based payments, whereby employees and consultants render services in exchange for shares or rights over shares (equity-settled transactions).
There are currently three types of plans in place to provide these benefits: The Employee Incentive Plan (EIP), which provides
benefits in the form of shares, options or performance shares to employees and consultants, including the CEO. This plan has a US Sub-Plan established as an appendix to EIP.
For
per
sona
l use
onl
y
87
The Employee Share Option Plans (ESOP), whichprovides benefits to employees and consultants,including the CEO if he or she is not a member of theBoard of Directors. This Group has two (2) ESOPs –one for US based employees and one for Australianbased employees.
The CEO Option Plan
Further details of the share-based payment plans are described below. During the current financial year, the Group continued to operate under the Employee Incentive Plan (EIP).
Stakeholders and industry participants expect that the Group’s remuneration framework should provide competitive and appropriate remuneration so that the company can attract and retain skilled employees and motivate them to improve Group performance. For all financial year 2019, the Group operated under the Employee Incentive Plan for issuing and maintaining employee share option schemes.
Under the EIP, participants are eligible to receive Shares, Options or Performance Rights, which will help to align the interests of employees (participants) with those of the Group and its Members.
No share options schemes were issued under the ESOP during the year. Outstanding options that reside under the ESOPs remain under that plan, but any outstanding options under the ESOPs that are cancelled or forfeited do not become available under the EIP nor return to the available option pool.
(A) TYPES OF SHARE-BASED PAYMENTS PLANS
Employee Incentive Plan (EIP) On 30 October 2014, the Board resolved to establish the Employee Incentive Plan and the corresponding US Sub-Plan as a means of providing incentives to employees, consultants and executive or non-executive directors of the Group.
Purpose of the EIP and the US Sub-Plan The purpose of the EIP is to provide a long-term incentive for employees to work with commitment toward enhancing the value of the Group and the shares for the benefit of shareholders, as well as to retain and attract employees whose contributions are, or may be, beneficial to the growth and development of the Group.
Issue of Options Excluded from Group’s 15% Limit Under ASX Listing Rule 7.1 Under ASX Listing Rule 7.1, subject to certain exceptions, a company must not issue more than 15% of the company’s total issued capital without shareholder approval. An exception is provided in ASX Listing Rule 7.2 (exception 9) where holders of ordinary securities approve the issue of securities under an
employee incentive scheme as an exception to ASX Listing Rule 7.1.
EIP Plan Terms and Conditions Incentives under the EIP include a Share, an Option, or a Performance Right. Incentives are granted to eligible employees of and collaborators with (collectively known as Participants) the Group at the discretion of the Board of Directors.
In granting the incentives, which are issued for nil consideration, the Directors evaluate potential participants with respect to their abilities, experience, responsibilities and their contribution to the Group.
Unless otherwise determined by the Board, an option incentive held by a Participant will lapse upon the first to occur of:
Its expiry date The Participant failing to meet the Incentive’s
vesting conditions with the prescribed period; If the Participant ceases to be employed by the
Group due to resignation or retirement: For vested options, 30 days after the date of
cessation of employment (or such longer periodas the Board determines);
For unvested Incentives, the date of cessation ofemployment (or such longer period as the Boarddetermines);
If the Participant ceases to be employed by theGroup due to retrenchment, or the Participant’sdeath, permanent illness or permanent physical ormental incapacity (as certified by a medicalpractitioner who is approved in writing by theBoard): For vested options, 12 months after the date of
cessation of employment (or such longer periodas the Board determines); and
For unvested Incentives, the date of cessation ofemployment (or such longer period as the Boarddetermines)
If the Participant ceases to be employed by theGroup for any other reason: For vested incentives, 30 days after the date of
cessation of employment (or such longer periodas the Board determines); and
For unvested incentives, the date of cessation ofemployment (or such longer period as the Boarddetermines)
A determination by the Board that the participant: Has been dismissed or removed from office as
an employee or Director of the Group for anyreason which entitles the Group to dismiss theParticipant without notice, or
Acted fraudulently, dishonestly or in breach ofthe participant’s obligations to the Group.
For
per
sona
l use
onl
y
88
If at any time or times prior to the exercise by the participant or vesting of any outstanding Incentives, there is any reconstruction (including a consolidation, subdivision, reduction, cancellation or return) of the issued capital of the Group, the terms of Incentives and the rights of the participant will be amended by the Board to the extent necessary to comply with the ASX Listing Rules at the time of the reconstruction.
An Incentive is personal to the Participant to whom it was granted, and the Participant may not sell, assign, transfer or otherwise dispose of, or make a declaration of trust in respect of, an Incentive except to an Associate of that Participant. This does not prevent the exercise of the Incentive by the estate of a deceased Participant.
The contractual life of each Incentive granted is specified by the participant’s Incentive agreement. There are no cash settlement alternatives. The Incentive issued under the plan cannot be transferred and are not quoted as tradeable instruments on the ASX.
US Sub-Plan The US Sub-Plan is effective for a period of ten years from the date of its adoption by the Board, unless terminated earlier by the Board. The maximum number of Shares which may be issued under the US Sub-Plan is 15 million Shares.
The exercise price of an Option will not be less than the fair market value of a Share on the date of grant of the Option.
The Group’s obligation to issue securities under the US Sub-Plan is subject to any restrictions in the Corporations Act or the ASX Listing Rules.
Share Options Share options are issued to eligible participants under the EIP. The Group issued 1,547,000 (2018: 7,410,200) share options to participants under the EIP during the current year.
For new and existing employees and consultants, share options issued during the period generally vest on the one-year anniversary of the date of grant or of employment in an amount equal to the product of one-fourth multiplied by the number of total options granted.
In a situation where there is likely to be a change of control of the Group, the Board may have the discretion to determine whether some, none or all of the LTI instruments will vest.
Performance Shares Performance shares (or Performance Rights) are issued to eligible participants under the EIP in recognition of their contribution to the performance of the Group and are often subject to meeting individual
performance hurdles. The Group issued 485,000 (2018: 3,383,000) performance rights to employees under the EIP during the current year.
All performance rights are issued at the discretion of the Board of Directors and are issued for nil consideration. The performance rights granted during the year vest in full on the third anniversary of the grant date. In the event of a change of control, all outstanding unvested performance rights may vest on an accelerated basis immediately.
If the participant ceases employment with the Group where such cessation of employment is due to the participant’s death, permanent illness or permanent physical or permanent mental incapacity (as certified by a medical practitioner who is approved in writing by the Board), the performance rights will fully vest on the third anniversary of the date of grant.
Performance rights which have not vested shall automatically lapse and be forfeited without con-sideration upon cessation of the participant’s employment with the Group.
The fair value of performance shares is measured by using the stock price for ImpediMed Limited as of the close of business on the day prior to the grant date multiplied by the number of eligible shares. The number of eligible shares is measured using a combination of the probability of future service and the achievement of specific goals.
Employee Share Option Plan (ESOP) The Group has two schemes under the ESOP it operated, one for eligible Australian participants and one for eligible US participants. The only outstanding grants for the ESOP were issued prior to 30 October 2014, as no additional awards were issued under the ESOP after the creation of the EIP.
ESOP Schemes Terms and Conditions Share options were granted to participants of the Group at the discretion of the Board of Directors.
When a participant ceases to be eligible to continue participating in the plan prior to vesting their share options, the unvested share options are forfeited. The participant has 30 days to exercise vested options after cession of employment.
In the event of a change of control of the Group, at the discretion of the Board of Directors, all options vest immediately.
The contractual life of each option granted is specified by the stock option agreement not to exceed ten years from the date of grant. There are no cash settlement alternatives. The options issued under the plan cannot be transferred and are not quoted as tradeable instruments on the ASX.
For
per
sona
l use
onl
y
89
Chief Executive Option Plan There were no options issued under the Chief Executive option plan during the current or prior year. All CEO option grants are subject to approval by the shareholders.
Options issued to the CEO were issued under the EIP or ESOP, except for the issuance of 7,252,561 options upon hiring. Those options were issued outside of any existing option schemes upon shareholder approval at the 2012 AGM. For additional information on option
grants, refer to the Managing Director and CEO Remuneration section of the Remuneration Report.
(B) SUMMARY OF OPTIONS AND PERFORMANCE RIGHTS
Employee Incentive Plan (EIP) The following table illustrates the number of shares (Number) and weighted average exercise price (WAEP) of share options under the EIP plans:
SHARE OPTIONS
2019 2018Number WAEP $ Number WAEP $
Balance at the Beginning of the Year 18,216,070 0.89 13,746,000 0.97 Granted During the Year 1,547,000 0.31 7,410,200 0.80 Forfeited During the Year (1,582,299) 0.74 (2,670,130) 1.02 Balance at the End of the Year 18,180,771 0.86 18,216,070 0.89 Exercisable at 30 June 10,237,487 0.86 7,324,236 0.81
PERFORMANCE RIGHTS
2019 2018 Number WAEP $ Number WAEP $
Balance at the Beginning of the Year 4,431,500 - 3,638,000 - Granted During the Year 485,000 - 3,383,000 - Forfeited During the Year - - (509,500) - Exercised During the Year - - (2,080,000) - Balance at the End of the Year 4,916,500 - 4,431,500 - Exercisable at 30 June - - - -
For
per
sona
l use
onl
y
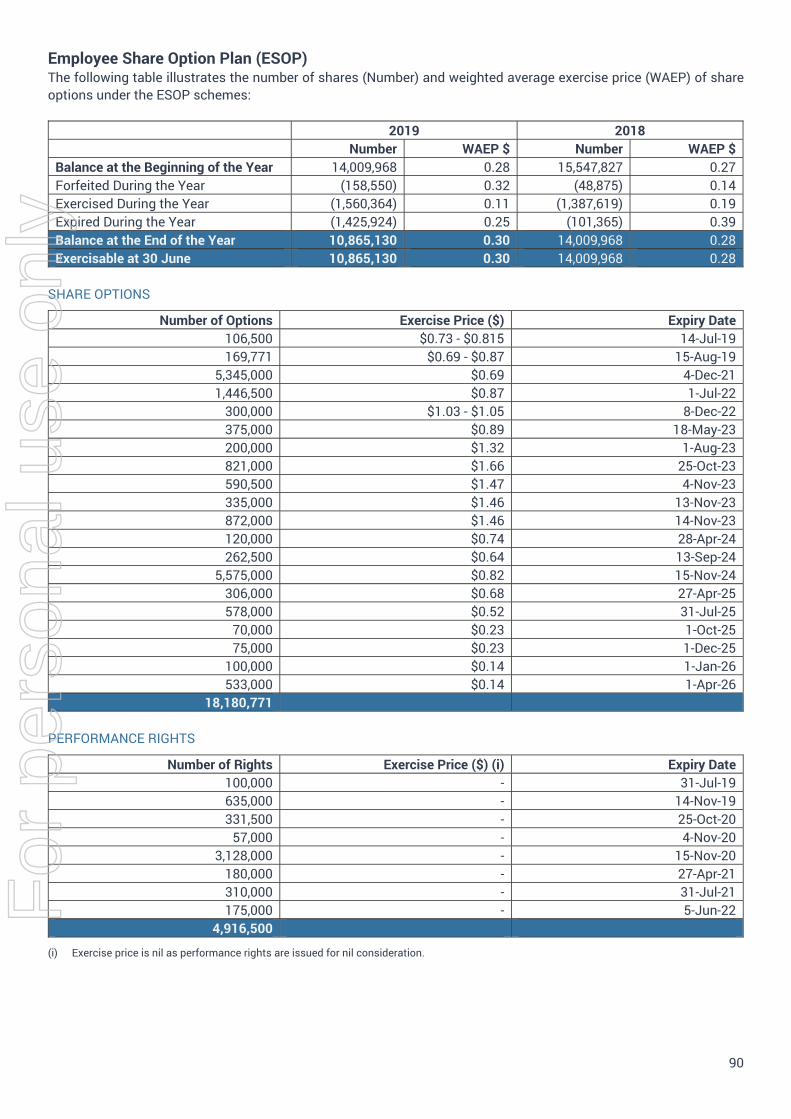
90
Employee Share Option Plan (ESOP) The following table illustrates the number of shares (Number) and weighted average exercise price (WAEP) of share options under the ESOP schemes:
2019 2018 Number WAEP $ Number WAEP $
Balance at the Beginning of the Year 14,009,968 0.28 15,547,827 0.27 Forfeited During the Year (158,550) 0.32 (48,875) 0.14 Exercised During the Year (1,560,364) 0.11 (1,387,619) 0.19 Expired During the Year (1,425,924) 0.25 (101,365) 0.39 Balance at the End of the Year 10,865,130 0.30 14,009,968 0.28 Exercisable at 30 June 10,865,130 0.30 14,009,968 0.28
SHARE OPTIONS
Number of Options Exercise Price ($) Expiry Date 106,500 $0.73 - $0.815 14-Jul-19 169,771 $0.69 - $0.87 15-Aug-19
5,345,000 $0.69 4-Dec-21 1,446,500 $0.87 1-Jul-22
300,000 $1.03 - $1.05 8-Dec-22 375,000 $0.89 18-May-23 200,000 $1.32 1-Aug-23 821,000 $1.66 25-Oct-23 590,500 $1.47 4-Nov-23 335,000 $1.46 13-Nov-23 872,000 $1.46 14-Nov-23 120,000 $0.74 28-Apr-24 262,500 $0.64 13-Sep-24
5,575,000 $0.82 15-Nov-24 306,000 $0.68 27-Apr-25 578,000 $0.52 31-Jul-25
70,000 $0.23 1-Oct-25 75,000 $0.23 1-Dec-25
100,000 $0.14 1-Jan-26 533,000 $0.14 1-Apr-26
18,180,771
PERFORMANCE RIGHTS
Number of Rights Exercise Price ($) (i) Expiry Date 100,000 - 31-Jul-19 635,000 - 14-Nov-19 331,500 - 25-Oct-20
57,000 - 4-Nov-20 3,128,000 - 15-Nov-20
180,000 - 27-Apr-21 310,000 - 31-Jul-21 175,000 - 5-Jun-22
4,916,500
(i) Exercise price is nil as performance rights are issued for nil consideration.
For
per
sona
l use
onl
y
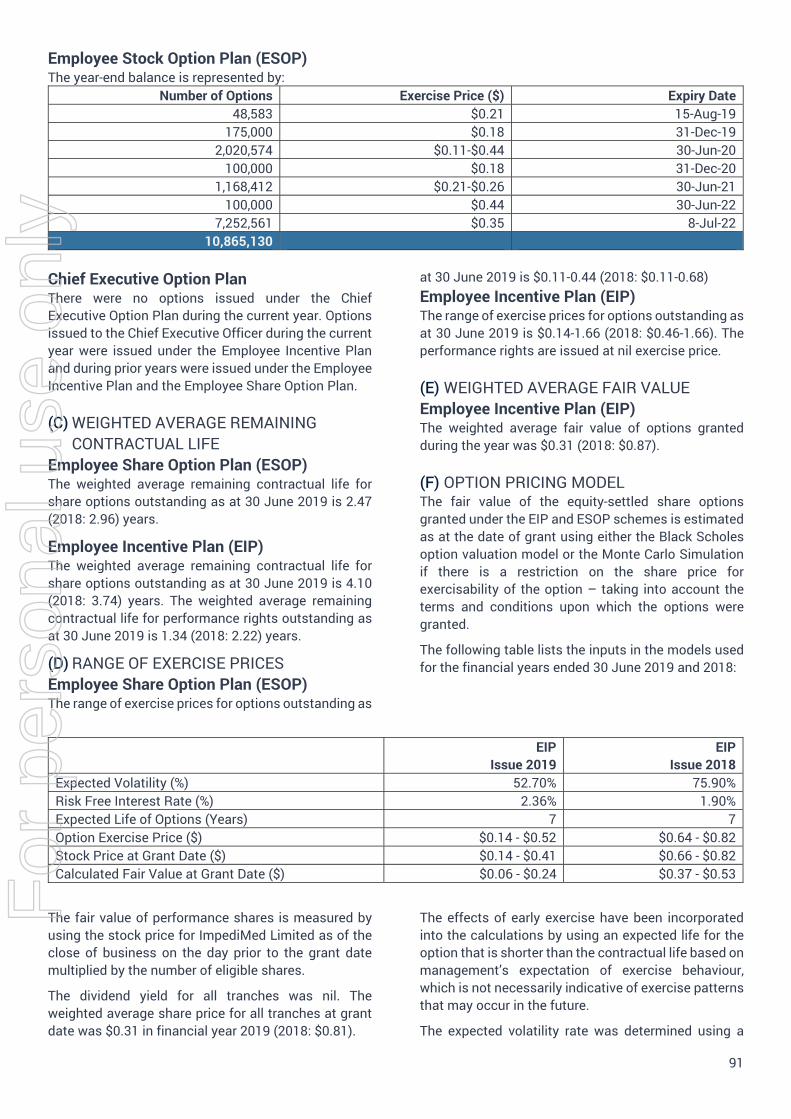
91
Employee Stock Option Plan (ESOP) The year-end balance is represented by:
Number of Options Exercise Price ($) Expiry Date 48,583 $0.21 15-Aug-19
175,000 $0.18 31-Dec-19 2,020,574 $0.11-$0.44 30-Jun-20
100,000 $0.18 31-Dec-20 1,168,412 $0.21-$0.26 30-Jun-21
100,000 $0.44 30-Jun-22 7,252,561 $0.35 8-Jul-22
10,865,130
Chief Executive Option Plan There were no options issued under the Chief Executive Option Plan during the current year. Options issued to the Chief Executive Officer during the current year were issued under the Employee Incentive Plan and during prior years were issued under the Employee Incentive Plan and the Employee Share Option Plan.
(C) WEIGHTED AVERAGE REMAINING CONTRACTUAL LIFE
Employee Share Option Plan (ESOP) The weighted average remaining contractual life for share options outstanding as at 30 June 2019 is 2.47 (2018: 2.96) years.
Employee Incentive Plan (EIP) The weighted average remaining contractual life for share options outstanding as at 30 June 2019 is 4.10 (2018: 3.74) years. The weighted average remaining contractual life for performance rights outstanding as at 30 June 2019 is 1.34 (2018: 2.22) years.
(D) RANGE OF EXERCISE PRICES Employee Share Option Plan (ESOP) The range of exercise prices for options outstanding as
at 30 June 2019 is $0.11-0.44 (2018: $0.11-0.68) Employee Incentive Plan (EIP) The range of exercise prices for options outstanding as at 30 June 2019 is $0.14-1.66 (2018: $0.46-1.66). The performance rights are issued at nil exercise price.
(E) WEIGHTED AVERAGE FAIR VALUE Employee Incentive Plan (EIP) The weighted average fair value of options granted during the year was $0.31 (2018: $0.87).
(F) OPTION PRICING MODEL The fair value of the equity-settled share options granted under the EIP and ESOP schemes is estimated as at the date of grant using either the Black Scholes option valuation model or the Monte Carlo Simulation if there is a restriction on the share price for exercisability of the option – taking into account the terms and conditions upon which the options were granted.
The following table lists the inputs in the models used for the financial years ended 30 June 2019 and 2018:
EIP Issue 2019
EIP Issue 2018
Expected Volatility (%) 52.70% 75.90% Risk Free Interest Rate (%) 2.36% 1.90% Expected Life of Options (Years) 7 7 Option Exercise Price ($) $0.14 - $0.52 $0.64 - $0.82 Stock Price at Grant Date ($) $0.14 - $0.41 $0.66 - $0.82 Calculated Fair Value at Grant Date ($) $0.06 - $0.24 $0.37 - $0.53
The fair value of performance shares is measured by using the stock price for ImpediMed Limited as of the close of business on the day prior to the grant date multiplied by the number of eligible shares.
The dividend yield for all tranches was nil. The weighted average share price for all tranches at grant date was $0.31 in financial year 2019 (2018: $0.81).
The effects of early exercise have been incorporated into the calculations by using an expected life for the option that is shorter than the contractual life based on management’s expectation of exercise behaviour, which is not necessarily indicative of exercise patterns that may occur in the future.
The expected volatility rate was determined using a
For
per
sona
l use
onl
y
92
sample of industry averages based on historical share prices. The resulting expected volatility therefore reflects the assumption that the industry averages are indicative of future trends, which may not necessarily be the actual outcome.
(G) ACCOUNTING POLICIES FOR EQUITY-SETTLED TRANSACTIONS
The cost of equity-settled transactions is measured by reference to the fair value of the equity instruments at the date they are granted. The fair value is determined by a Black-Scholes model, details of which are given in Note 18.
In valuing equity-settled transactions, no account is taken of any vesting conditions, other than conditions linked to the price of the shares of ImpediMed Limited (market conditions) if applicable.
The cost of equity-settled transactions is recognised, together with a corresponding increase in equity, over the period in which the performance and/or service condition are fulfilled (the vesting period), ending on the date on which the relevant employees become fully entitled to the award (the vesting date).
At each subsequent reporting date until vesting, the cumulative charge to the statement of comprehensive income is the product of:
The grant date fair value of the award The current best estimate of the number of awards
that will vest, taking into account such factors asthe likelihood of employee turnover during thevesting period and the likelihood of non-marketperformance conditions being met; and
The expired portion of the vesting period
The charge to the statement of comprehensive income for the period is the cumulative amount as calculated above less the amounts already charged in previous periods. There is a corresponding entry to equity.
Equity-settled awards granted by the Parent to employees of subsidiaries are recognised in the Parent’s separate financial statements as an additional investment in the subsidiary with a corresponding credit to equity. As a result, the expense recognised by ImpediMed Limited in relation to equity-settled awards only represents the expense associated with grants to employees of the parent. The expense recognised by the Group is the total expense associated with all such awards.
Until an award has vested, any amounts recorded are contingent and will be adjusted if more or fewer awards vest than were originally anticipated to do so. Any award subject to a market condition is considered to vest irrespective of whether or not that market condition is fulfilled, provided that all other conditions
are satisfied.
If the terms of an equity-settled award are modified, as a minimum an expense is recognised as if the terms had not been modified. An additional expense is recognised for any modification that increases the total fair value of the share-based payment arrangement, or is otherwise beneficial to the employee, as measured at the date of modification.
During the prior period, certain options of the MD & CEO were modified to amend the terms of the grant. The amendment removed the market-based exercise conditions of the options. Under AASB 2, this change is viewed as a modification which must be accounted for. Specifically, AASB 2 re-quires both the option using the original terms and the option with the modified terms to be fair valued at the modification date. The difference between the valuations is recorded in the profit and loss to the extent the fair value of the modified options is greater. Based on the work performed in the current financial year, no additional expense was recorded for the modification of the MD & CEO’s options, given the fair value of the modified option was not deemed to be greater than the existing option.
For
per
sona
l use
onl
y
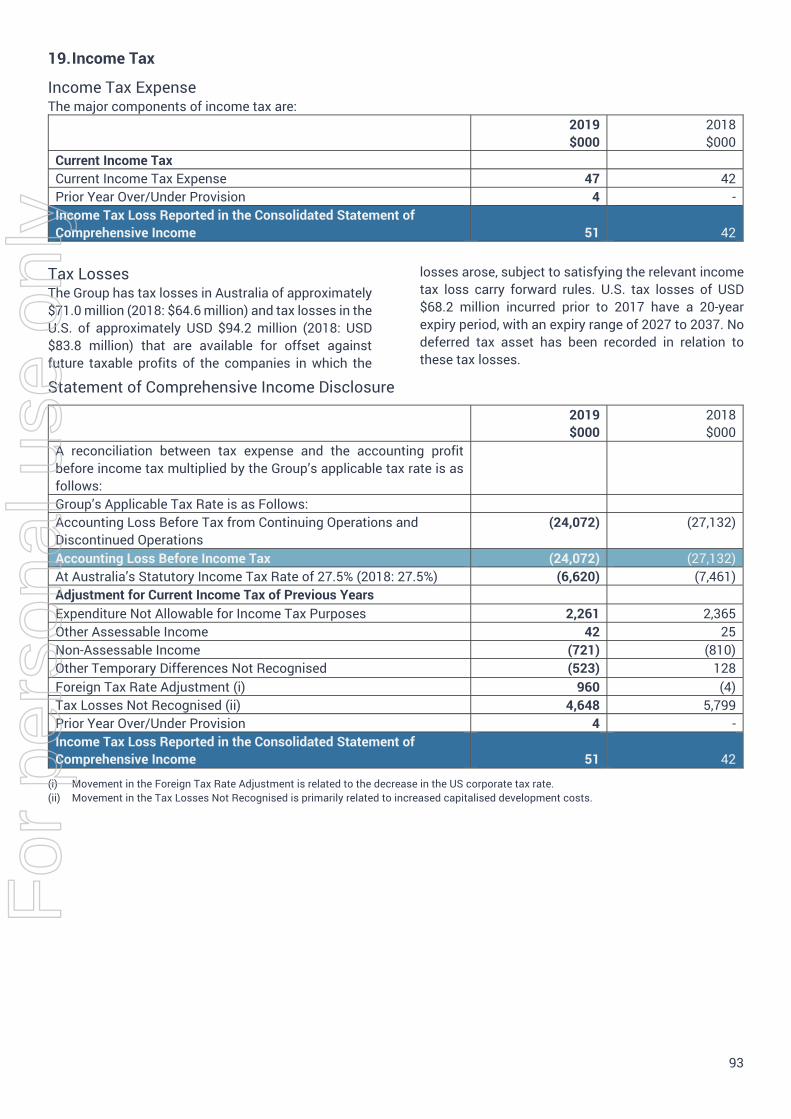
93
19. Income Tax
Income Tax Expense The major components of income tax are:
2019 $000
2018 $000
Current Income Tax Current Income Tax Expense 47 42 Prior Year Over/Under Provision 4 - Income Tax Loss Reported in the Consolidated Statement of Comprehensive Income 51 42
Tax Losses The Group has tax losses in Australia of approximately $71.0 million (2018: $64.6 million) and tax losses in the U.S. of approximately USD $94.2 million (2018: USD $83.8 million) that are available for offset against future taxable profits of the companies in which the
losses arose, subject to satisfying the relevant income tax loss carry forward rules. U.S. tax losses of USD $68.2 million incurred prior to 2017 have a 20-year expiry period, with an expiry range of 2027 to 2037. No deferred tax asset has been recorded in relation to these tax losses.
Statement of Comprehensive Income Disclosure
2019 $000
2018 $000
A reconciliation between tax expense and the accounting profit before income tax multiplied by the Group’s applicable tax rate is as follows: Group’s Applicable Tax Rate is as Follows: Accounting Loss Before Tax from Continuing Operations and Discontinued Operations
(24,072) (27,132)
Accounting Loss Before Income Tax (24,072) (27,132) At Australia’s Statutory Income Tax Rate of 27.5% (2018: 27.5%) (6,620) (7,461) Adjustment for Current Income Tax of Previous Years Expenditure Not Allowable for Income Tax Purposes 2,261 2,365 Other Assessable Income 42 25 Non-Assessable Income (721) (810) Other Temporary Differences Not Recognised (523) 128 Foreign Tax Rate Adjustment (i) 960 (4) Tax Losses Not Recognised (ii) 4,648 5,799 Prior Year Over/Under Provision 4 - Income Tax Loss Reported in the Consolidated Statement of Comprehensive Income 51 42
(i) Movement in the Foreign Tax Rate Adjustment is related to the decrease in the US corporate tax rate. (ii) Movement in the Tax Losses Not Recognised is primarily related to increased capitalised development costs.
For
per
sona
l use
onl
y
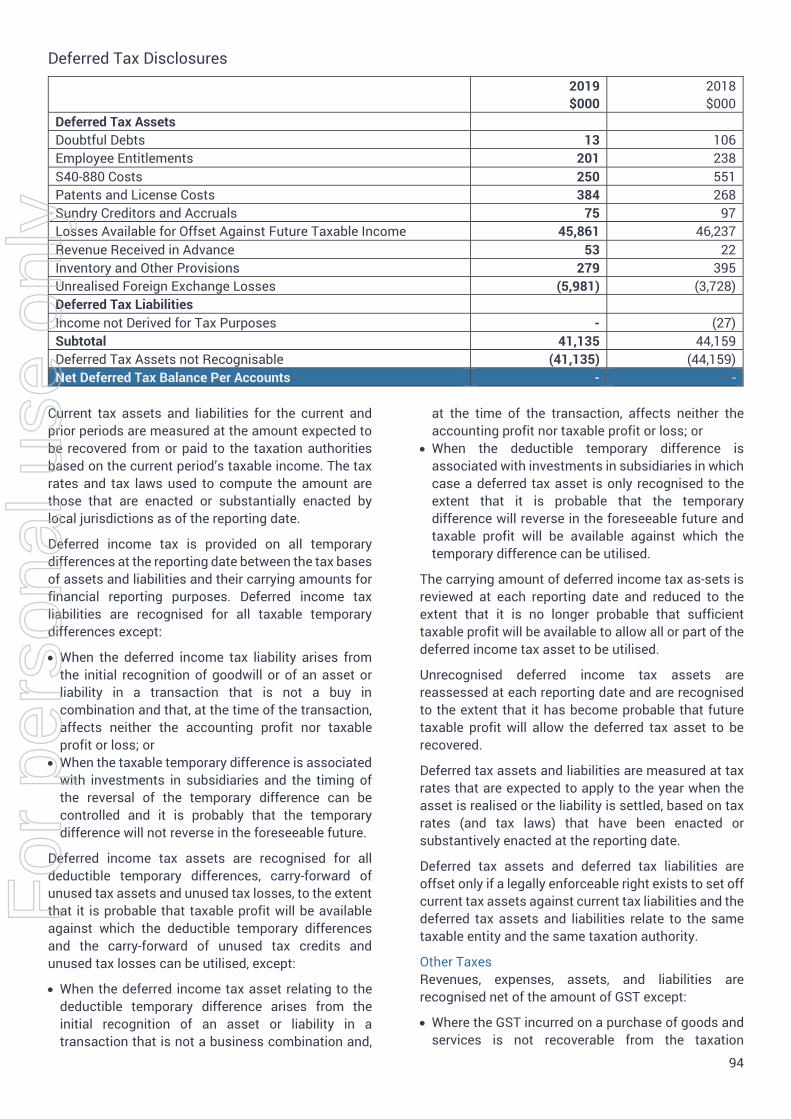
94
Deferred Tax Disclosures
2019 $000
2018 $000
Deferred Tax Assets Doubtful Debts 13 106 Employee Entitlements 201 238 S40-880 Costs 250 551 Patents and License Costs 384 268 Sundry Creditors and Accruals 75 97 Losses Available for Offset Against Future Taxable Income 45,861 46,237 Revenue Received in Advance 53 22 Inventory and Other Provisions 279 395 Unrealised Foreign Exchange Losses (5,981) (3,728) Deferred Tax Liabilities Income not Derived for Tax Purposes - (27) Subtotal 41,135 44,159 Deferred Tax Assets not Recognisable (41,135) (44,159) Net Deferred Tax Balance Per Accounts - -
Current tax assets and liabilities for the current and prior periods are measured at the amount expected to be recovered from or paid to the taxation authorities based on the current period’s taxable income. The tax rates and tax laws used to compute the amount are those that are enacted or substantially enacted by local jurisdictions as of the reporting date.
Deferred income tax is provided on all temporary differences at the reporting date between the tax bases of assets and liabilities and their carrying amounts for financial reporting purposes. Deferred income tax liabilities are recognised for all taxable temporary differences except:
When the deferred income tax liability arises fromthe initial recognition of goodwill or of an asset orliability in a transaction that is not a buy incombination and that, at the time of the transaction,affects neither the accounting profit nor taxableprofit or loss; or
When the taxable temporary difference is associatedwith investments in subsidiaries and the timing ofthe reversal of the temporary difference can becontrolled and it is probably that the temporarydifference will not reverse in the foreseeable future.
Deferred income tax assets are recognised for all deductible temporary differences, carry-forward of unused tax assets and unused tax losses, to the extent that it is probable that taxable profit will be available against which the deductible temporary differences and the carry-forward of unused tax credits and unused tax losses can be utilised, except:
When the deferred income tax asset relating to thedeductible temporary difference arises from theinitial recognition of an asset or liability in atransaction that is not a business combination and,
at the time of the transaction, affects neither the accounting profit nor taxable profit or loss; or
When the deductible temporary difference isassociated with investments in subsidiaries in whichcase a deferred tax asset is only recognised to theextent that it is probable that the temporarydifference will reverse in the foreseeable future andtaxable profit will be available against which thetemporary difference can be utilised.
The carrying amount of deferred income tax as-sets is reviewed at each reporting date and reduced to the extent that it is no longer probable that sufficient taxable profit will be available to allow all or part of the deferred income tax asset to be utilised.
Unrecognised deferred income tax assets are reassessed at each reporting date and are recognised to the extent that it has become probable that future taxable profit will allow the deferred tax asset to be recovered.
Deferred tax assets and liabilities are measured at tax rates that are expected to apply to the year when the asset is realised or the liability is settled, based on tax rates (and tax laws) that have been enacted or substantively enacted at the reporting date.
Deferred tax assets and deferred tax liabilities are offset only if a legally enforceable right exists to set off current tax assets against current tax liabilities and the deferred tax assets and liabilities relate to the same taxable entity and the same taxation authority.
Other Taxes Revenues, expenses, assets, and liabilities are recognised net of the amount of GST except:
Where the GST incurred on a purchase of goods andservices is not recoverable from the taxation
For
per
sona
l use
onl
y
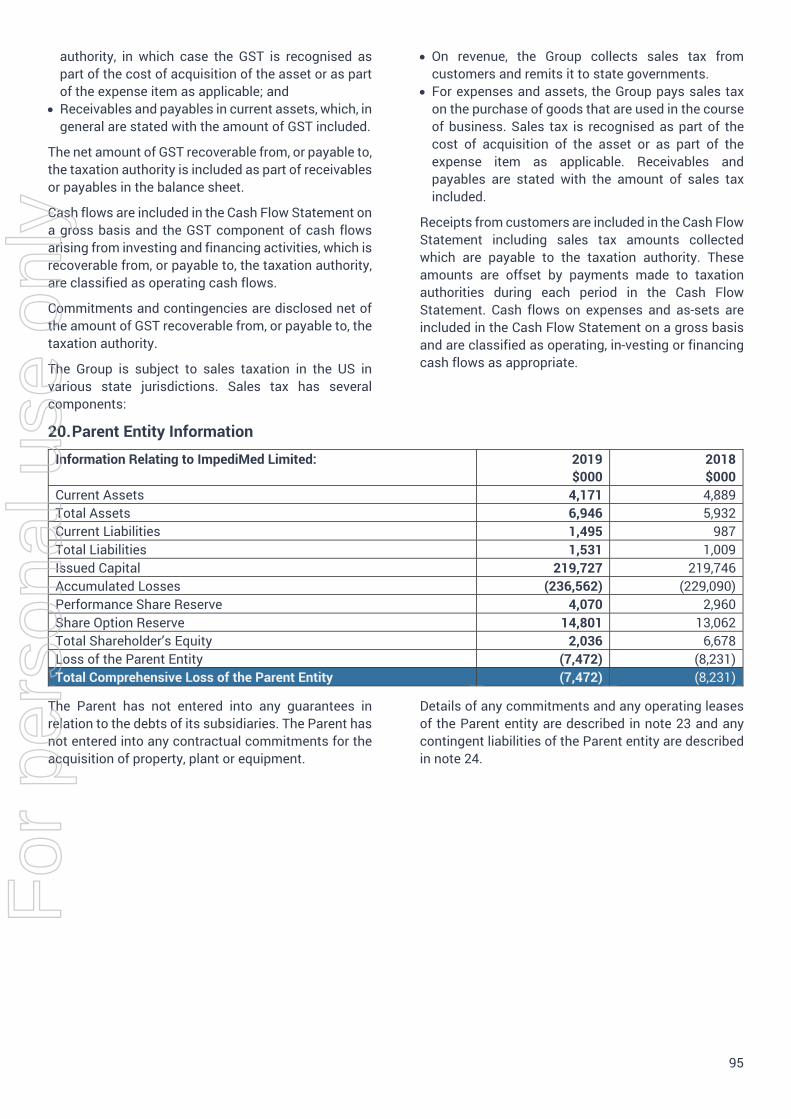
95
authority, in which case the GST is recognised as part of the cost of acquisition of the asset or as part of the expense item as applicable; and
Receivables and payables in current assets, which, in general are stated with the amount of GST included.
The net amount of GST recoverable from, or payable to, the taxation authority is included as part of receivables or payables in the balance sheet.
Cash flows are included in the Cash Flow Statement on a gross basis and the GST component of cash flows arising from investing and financing activities, which is recoverable from, or payable to, the taxation authority, are classified as operating cash flows.
Commitments and contingencies are disclosed net of the amount of GST recoverable from, or payable to, the taxation authority.
The Group is subject to sales taxation in the US in various state jurisdictions. Sales tax has several components:
On revenue, the Group collects sales tax fromcustomers and remits it to state governments.
For expenses and assets, the Group pays sales taxon the purchase of goods that are used in the courseof business. Sales tax is recognised as part of thecost of acquisition of the asset or as part of theexpense item as applicable. Receivables andpayables are stated with the amount of sales taxincluded.
Receipts from customers are included in the Cash Flow Statement including sales tax amounts collected which are payable to the taxation authority. These amounts are offset by payments made to taxation authorities during each period in the Cash Flow Statement. Cash flows on expenses and as-sets are included in the Cash Flow Statement on a gross basis and are classified as operating, in-vesting or financing cash flows as appropriate.
20. Parent Entity Information
Information Relating to ImpediMed Limited: 2019 $000
2018 $000
Current Assets 4,171 4,889 Total Assets 6,946 5,932 Current Liabilities 1,495 987 Total Liabilities 1,531 1,009 Issued Capital 219,727 219,746 Accumulated Losses (236,562) (229,090) Performance Share Reserve 4,070 2,960 Share Option Reserve 14,801 13,062 Total Shareholder’s Equity 2,036 6,678 Loss of the Parent Entity (7,472) (8,231) Total Comprehensive Loss of the Parent Entity (7,472) (8,231)
The Parent has not entered into any guarantees in relation to the debts of its subsidiaries. The Parent has not entered into any contractual commitments for the acquisition of property, plant or equipment.
Details of any commitments and any operating leases of the Parent entity are described in note 23 and any contingent liabilities of the Parent entity are described in note 24.
For
per
sona
l use
onl
y
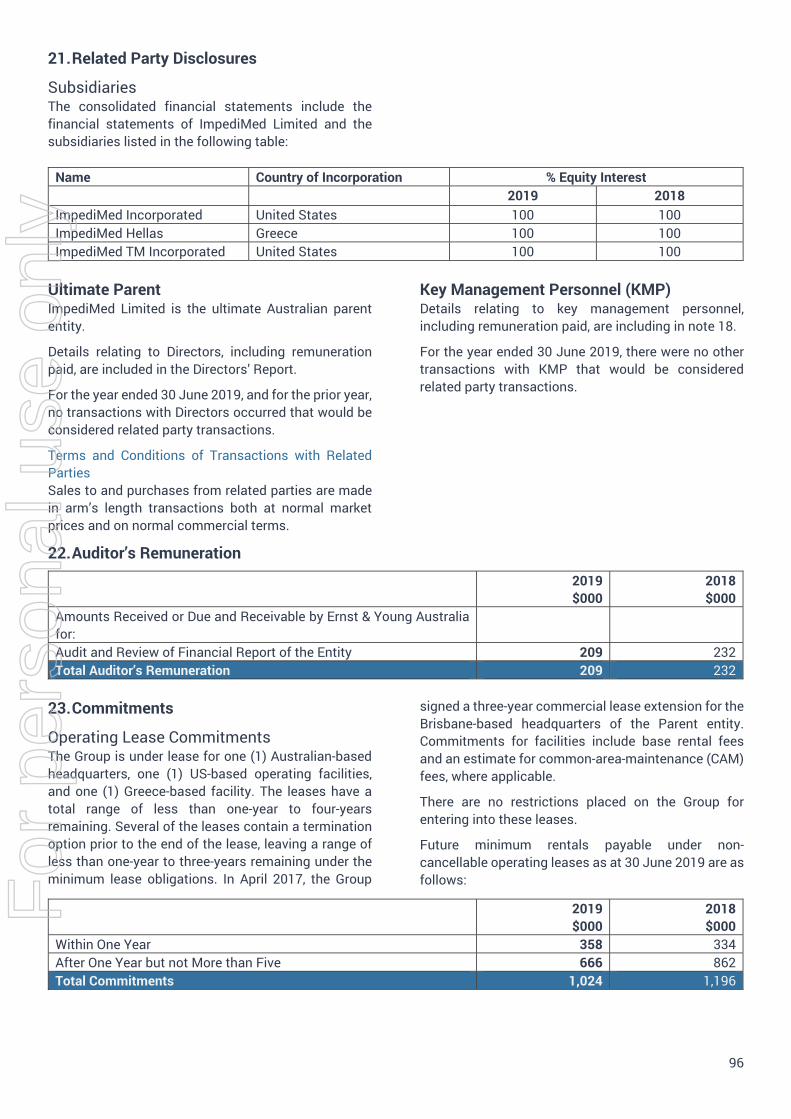
96
21. Related Party Disclosures
Subsidiaries The consolidated financial statements include the financial statements of ImpediMed Limited and the subsidiaries listed in the following table:
Name Country of Incorporation % Equity Interest 2019 2018
ImpediMed Incorporated United States 100 100 ImpediMed Hellas Greece 100 100 ImpediMed TM Incorporated United States 100 100
Ultimate Parent ImpediMed Limited is the ultimate Australian parent entity.
Details relating to Directors, including remuneration paid, are included in the Directors’ Report.
For the year ended 30 June 2019, and for the prior year, no transactions with Directors occurred that would be considered related party transactions.
Terms and Conditions of Transactions with Related Parties Sales to and purchases from related parties are made in arm’s length transactions both at normal market prices and on normal commercial terms.
Key Management Personnel (KMP) Details relating to key management personnel, including remuneration paid, are including in note 18.
For the year ended 30 June 2019, there were no other transactions with KMP that would be considered related party transactions.
22. Auditor’s Remuneration
2019 $000
2018 $000
Amounts Received or Due and Receivable by Ernst & Young Australia for: Audit and Review of Financial Report of the Entity 209 232 Total Auditor’s Remuneration 209 232
23. Commitments
Operating Lease Commitments The Group is under lease for one (1) Australian-based headquarters, one (1) US-based operating facilities, and one (1) Greece-based facility. The leases have a total range of less than one-year to four-years remaining. Several of the leases contain a termination option prior to the end of the lease, leaving a range of less than one-year to three-years remaining under the minimum lease obligations. In April 2017, the Group
signed a three-year commercial lease extension for the Brisbane-based headquarters of the Parent entity. Commitments for facilities include base rental fees and an estimate for common-area-maintenance (CAM) fees, where applicable.
There are no restrictions placed on the Group for entering into these leases.
Future minimum rentals payable under non-cancellable operating leases as at 30 June 2019 are as follows:
2019 $000
2018 $000
Within One Year 358 334 After One Year but not More than Five 666 862 Total Commitments 1,024 1,196
For
per
sona
l use
onl
y
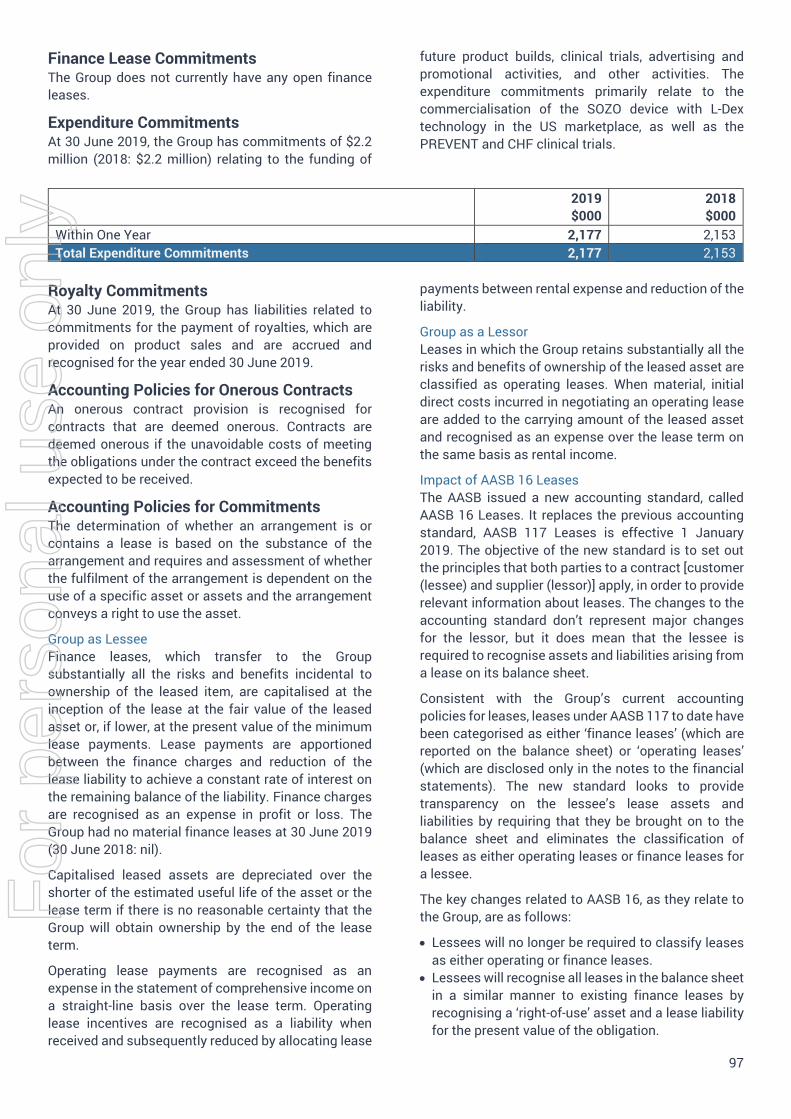
97
Finance Lease Commitments The Group does not currently have any open finance leases.
Expenditure Commitments At 30 June 2019, the Group has commitments of $2.2 million (2018: $2.2 million) relating to the funding of
future product builds, clinical trials, advertising and promotional activities, and other activities. The expenditure commitments primarily relate to the commercialisation of the SOZO device with L-Dex technology in the US marketplace, as well as the PREVENT and CHF clinical trials.
2019 $000
2018 $000
Within One Year 2,177 2,153 Total Expenditure Commitments 2,177 2,153
Royalty Commitments At 30 June 2019, the Group has liabilities related to commitments for the payment of royalties, which are provided on product sales and are accrued and recognised for the year ended 30 June 2019.
Accounting Policies for Onerous Contracts An onerous contract provision is recognised for contracts that are deemed onerous. Contracts are deemed onerous if the unavoidable costs of meeting the obligations under the contract exceed the benefits expected to be received.
Accounting Policies for Commitments The determination of whether an arrangement is or contains a lease is based on the substance of the arrangement and requires and assessment of whether the fulfilment of the arrangement is dependent on the use of a specific asset or assets and the arrangement conveys a right to use the asset.
Group as Lessee Finance leases, which transfer to the Group substantially all the risks and benefits incidental to ownership of the leased item, are capitalised at the inception of the lease at the fair value of the leased asset or, if lower, at the present value of the minimum lease payments. Lease payments are apportioned between the finance charges and reduction of the lease liability to achieve a constant rate of interest on the remaining balance of the liability. Finance charges are recognised as an expense in profit or loss. The Group had no material finance leases at 30 June 2019 (30 June 2018: nil).
Capitalised leased assets are depreciated over the shorter of the estimated useful life of the asset or the lease term if there is no reasonable certainty that the Group will obtain ownership by the end of the lease term.
Operating lease payments are recognised as an expense in the statement of comprehensive income on a straight-line basis over the lease term. Operating lease incentives are recognised as a liability when received and subsequently reduced by allocating lease
payments between rental expense and reduction of the liability.
Group as a Lessor Leases in which the Group retains substantially all the risks and benefits of ownership of the leased asset are classified as operating leases. When material, initial direct costs incurred in negotiating an operating lease are added to the carrying amount of the leased asset and recognised as an expense over the lease term on the same basis as rental income.
Impact of AASB 16 Leases The AASB issued a new accounting standard, called AASB 16 Leases. It replaces the previous accounting standard, AASB 117 Leases is effective 1 January 2019. The objective of the new standard is to set out the principles that both parties to a contract [customer (lessee) and supplier (lessor)] apply, in order to provide relevant information about leases. The changes to the accounting standard don’t represent major changes for the lessor, but it does mean that the lessee is required to recognise assets and liabilities arising from a lease on its balance sheet.
Consistent with the Group’s current accounting policies for leases, leases under AASB 117 to date have been categorised as either ‘finance leases’ (which are reported on the balance sheet) or ‘operating leases’ (which are disclosed only in the notes to the financial statements). The new standard looks to provide transparency on the lessee’s lease assets and liabilities by requiring that they be brought on to the balance sheet and eliminates the classification of leases as either operating leases or finance leases for a lessee.
The key changes related to AASB 16, as they relate to the Group, are as follows:
Lessees will no longer be required to classify leasesas either operating or finance leases.
Lessees will recognise all leases in the balance sheetin a similar manner to existing finance leases byrecognising a ‘right-of-use’ asset and a lease liabilityfor the present value of the obligation.
For
per
sona
l use
onl
y
98
If the lease contract is for a period of 12 months orless, or it is a lease of a low value asset, then thelessee may elect to apply recognition exemption tothis lease. Under this exemption entities canrecognise the lease payments as an expense in profitor loss on either a straight-line basis, or anothersystematic basis that represents the pattern of yourexpected benefits.
Lessees will no longer recognise straight-lineexpenses for operating lease costs. All leases willincur a front-end loaded expense, comprisingdepreciation on the right-of-use asset, and intereston the lease liability.
Lessees will no longer recognise the lease expenseas an operating expense in rent and propertyexpenses. The expense will bedepreciation/amortization and interest in operatingexpenses.
The Group intends to apply the simplified transition approach and will not restate comparative amounts for the year prior to first adoption. The Group expects to use the transition option that measures the right-of-use assets as the amount of the lease liability on adoption.
The Group has determined the estimated impact in relation to the right-of-use assets and lease liabilities will be materially consistent with the undiscounted cashflows in Note 23 Commitments.
24. Contingencies
Legal Claims At 30 June 2019, the Group has no known open claims or lawsuits against it.
Contingent Liabilities The Group had no contingent liabilities as at 30 June 2019 or 2018.
Cross Guarantees As a policy, the Group does not undertake any cross guarantees.
25. Events After the Balance Sheet DateThe Group announced the completion of its fully underwritten non-renounceable entitlement offer on 19 July 2019. Under the Entitlement Offer, eligible shareholders were invited to subscribe for one (1) new share (“New Share”) for every three (3) shares in the Company of which they were the registered holder, at an issue price of $0.11 per New Share.
In accordance with the ASX Listing Rules, ImpediMed advised that it received valid applications under the Entitlement Offer for 88,249,289 new shares in ImpediMed (to raise approximately $9.7 million).
The balance of 38,353,639 new shares, being shares not subscribed for by eligible shareholders in accordance with their pro rata entitlements under the Entitlement Offer, were issued under the underwriting arrangements described in the Offer Booklet.
The new shares were issued on 24 July 2019.
Proceeds from the Entitlement Offer will be applied to fund growth initiatives, including expanding reimbursement and sales and marketing efforts in the US market, software enhancements, heart failure clinical trials and general working capital.
For
per
sona
l use
onl
y
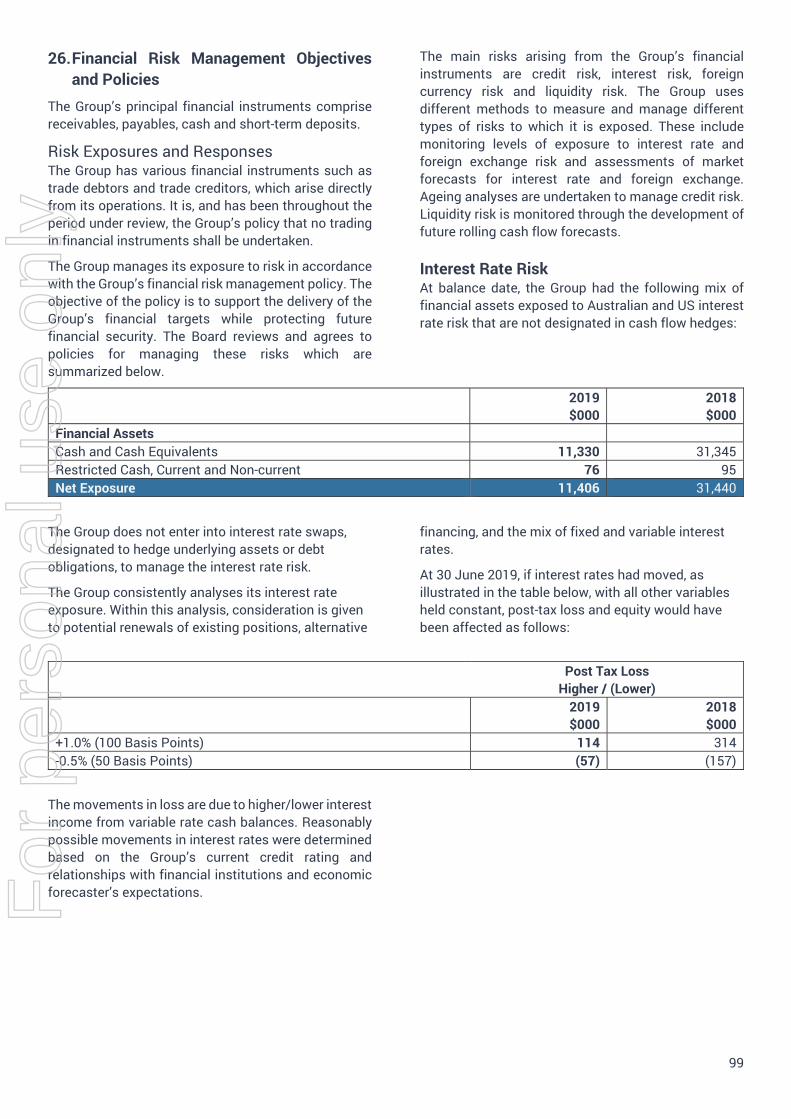
99
26. Financial Risk Management Objectivesand Policies
The Group’s principal financial instruments comprise receivables, payables, cash and short-term deposits.
Risk Exposures and Responses The Group has various financial instruments such as trade debtors and trade creditors, which arise directly from its operations. It is, and has been throughout the period under review, the Group’s policy that no trading in financial instruments shall be undertaken.
The Group manages its exposure to risk in accordance with the Group’s financial risk management policy. The objective of the policy is to support the delivery of the Group’s financial targets while protecting future financial security. The Board reviews and agrees to policies for managing these risks which are summarized below.
The main risks arising from the Group’s financial instruments are credit risk, interest risk, foreign currency risk and liquidity risk. The Group uses different methods to measure and manage different types of risks to which it is exposed. These include monitoring levels of exposure to interest rate and foreign exchange risk and assessments of market forecasts for interest rate and foreign exchange. Ageing analyses are undertaken to manage credit risk. Liquidity risk is monitored through the development of future rolling cash flow forecasts.
Interest Rate Risk At balance date, the Group had the following mix of financial assets exposed to Australian and US interest rate risk that are not designated in cash flow hedges:
2019 $000
2018 $000
Financial Assets Cash and Cash Equivalents 11,330 31,345 Restricted Cash, Current and Non-current 76 95 Net Exposure 11,406 31,440
The Group does not enter into interest rate swaps, designated to hedge underlying assets or debt obligations, to manage the interest rate risk.
The Group consistently analyses its interest rate exposure. Within this analysis, consideration is given to potential renewals of existing positions, alternative
financing, and the mix of fixed and variable interest rates.
At 30 June 2019, if interest rates had moved, as illustrated in the table below, with all other variables held constant, post-tax loss and equity would have been affected as follows:
Post Tax Loss Higher / (Lower)
2019 $000
2018 $000
+1.0% (100 Basis Points) 114 314 -0.5% (50 Basis Points) (57) (157)
The movements in loss are due to higher/lower interest income from variable rate cash balances. Reasonably possible movements in interest rates were determined based on the Group’s current credit rating and relationships with financial institutions and economic forecaster’s expectations. F
or p
erso
nal u
se o
nly

100
Foreign Currency Risk As a result of operations in the US and purchases of inventory denominated in United States dollars (USD), the Group’s balance sheet can be affected by movements in the USD/AUD exchange rates. The Group has transactional currency exposure related to USD, EUR, and GBP resulting from sales activities into the US and Europe.
The Group holds the majority of its funds in the functional currency of the entity where the funds are expected to be spent. Only funds held in the currencies other than an entity’s functional currency are considered at risk of foreign currency are considered at risk of foreign currency fluctuations.
The group does not enter into any forward contracts or any other instrument to hedge the currency exposure, as the Group maintains a significant portion of available funds in USD to match USD expected expenses.
Whilst the Group commenced operations in Europe during the prior year, the amounts that are sensitive to foreign currency risk are deemed immaterial, other than the financial assets denoted.
At 30 June 2019, the Group had the following exposure to foreign currency:
2019 $000
2018 $000
Financial Assets Cash and Cash Equivalents – USD 154 210 Cash and Cash Equivalents – EUR (i) 64 7 Cash and Cash Equivalents – GBP (ii) 3 1 Trade and Other Receivables – USD 10 109 Trade and Other Receivables – EUR (i) 31 -
262 327 Financial Liabilities Trade and Other Payables – USD 54 - Net Exposure 208 327
(i) EUR is Euro (ii) GBP is Great Britain Pound
At 30 June 2019, had the Australian dollar moved against the US dollar, as illustrated in the table below, with all other variables held constant, post-tax loss and equity would have been affected as follows:
Post Tax Loss Higher / (Lower)
2019 $000
2018 $000
AUD to Foreign Currency + 15% (2018: +15%) (27) (41) AUD to Foreign Currency – 15% (2018: –15%) 38 102
Significant assumptions used in the foreign currency exposure sensitivity analysis include the following: Reasonable possible movements in foreign
exchange rates were determined based on review of the last two years’ historical movements and economic forecasters’ expectations.
The reasonably possible movement wascalculated by taking the USD spot rates at balance date, moving this spot rate by the reasonable possible movements and then re-converting the USD into AUD with the “new spot-rate”. This methodology reflects the translation methodology undertaken by the Group.
The net exposure at balance date is representativeof what the Group was and is expecting to be
exposed to in the next twelve months from balance date.
The sensitivity analysis does not include financialinstruments that are non-monetary items as these are not considered to give rise to currency risk.
Sensitivities were only calculated on USD balances in instances where the functional currency is not the USD.
Credit Risk Credit risk arises from the financial assets of the Group, which comprise cash and cash equivalents, trade and other receivables and other financial assets. The Group’s exposure to credit risk arises from potential default of the counter party, with a maximum
For
per
sona
l use
onl
y
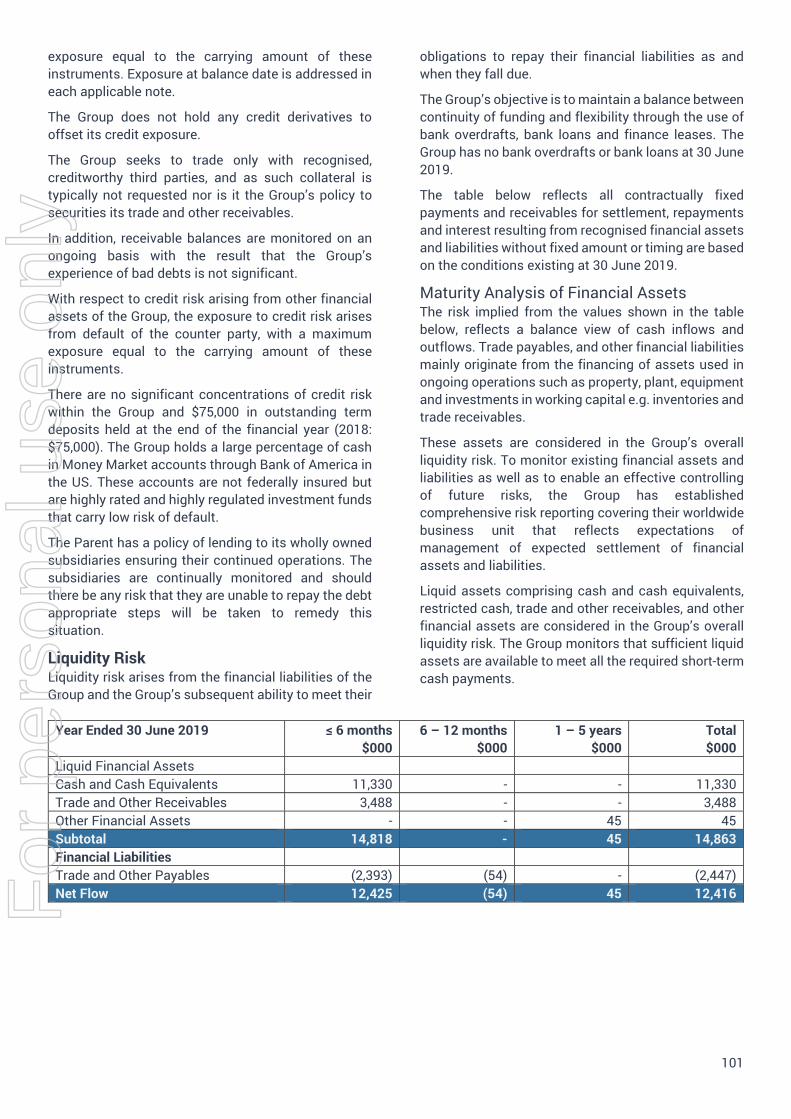
101
exposure equal to the carrying amount of these instruments. Exposure at balance date is addressed in each applicable note.
The Group does not hold any credit derivatives to offset its credit exposure.
The Group seeks to trade only with recognised, creditworthy third parties, and as such collateral is typically not requested nor is it the Group’s policy to securities its trade and other receivables.
In addition, receivable balances are monitored on an ongoing basis with the result that the Group’s experience of bad debts is not significant.
With respect to credit risk arising from other financial assets of the Group, the exposure to credit risk arises from default of the counter party, with a maximum exposure equal to the carrying amount of these instruments.
There are no significant concentrations of credit risk within the Group and $75,000 in outstanding term deposits held at the end of the financial year (2018: $75,000). The Group holds a large percentage of cash in Money Market accounts through Bank of America in the US. These accounts are not federally insured but are highly rated and highly regulated investment funds that carry low risk of default.
The Parent has a policy of lending to its wholly owned subsidiaries ensuring their continued operations. The subsidiaries are continually monitored and should there be any risk that they are unable to repay the debt appropriate steps will be taken to remedy this situation.
Liquidity Risk Liquidity risk arises from the financial liabilities of the Group and the Group’s subsequent ability to meet their
obligations to repay their financial liabilities as and when they fall due.
The Group’s objective is to maintain a balance between continuity of funding and flexibility through the use of bank overdrafts, bank loans and finance leases. The Group has no bank overdrafts or bank loans at 30 June 2019.
The table below reflects all contractually fixed payments and receivables for settlement, repayments and interest resulting from recognised financial assets and liabilities without fixed amount or timing are based on the conditions existing at 30 June 2019.
Maturity Analysis of Financial Assets The risk implied from the values shown in the table below, reflects a balance view of cash inflows and outflows. Trade payables, and other financial liabilities mainly originate from the financing of assets used in ongoing operations such as property, plant, equipment and investments in working capital e.g. inventories and trade receivables.
These assets are considered in the Group’s overall liquidity risk. To monitor existing financial assets and liabilities as well as to enable an effective controlling of future risks, the Group has established comprehensive risk reporting covering their worldwide business unit that reflects expectations of management of expected settlement of financial assets and liabilities.
Liquid assets comprising cash and cash equivalents, restricted cash, trade and other receivables, and other financial assets are considered in the Group’s overall liquidity risk. The Group monitors that sufficient liquid assets are available to meet all the required short-term cash payments.
Year Ended 30 June 2019 ≤ 6 months $000
6 – 12 months $000
1 – 5 years $000
Total $000
Liquid Financial Assets Cash and Cash Equivalents 11,330 - - 11,330 Trade and Other Receivables 3,488 - - 3,488 Other Financial Assets - - 45 45 Subtotal 14,818 - 45 14,863 Financial Liabilities Trade and Other Payables (2,393) (54) - (2,447) Net Flow 12,425 (54) 45 12,416 F
or p
erso
nal u
se o
nly
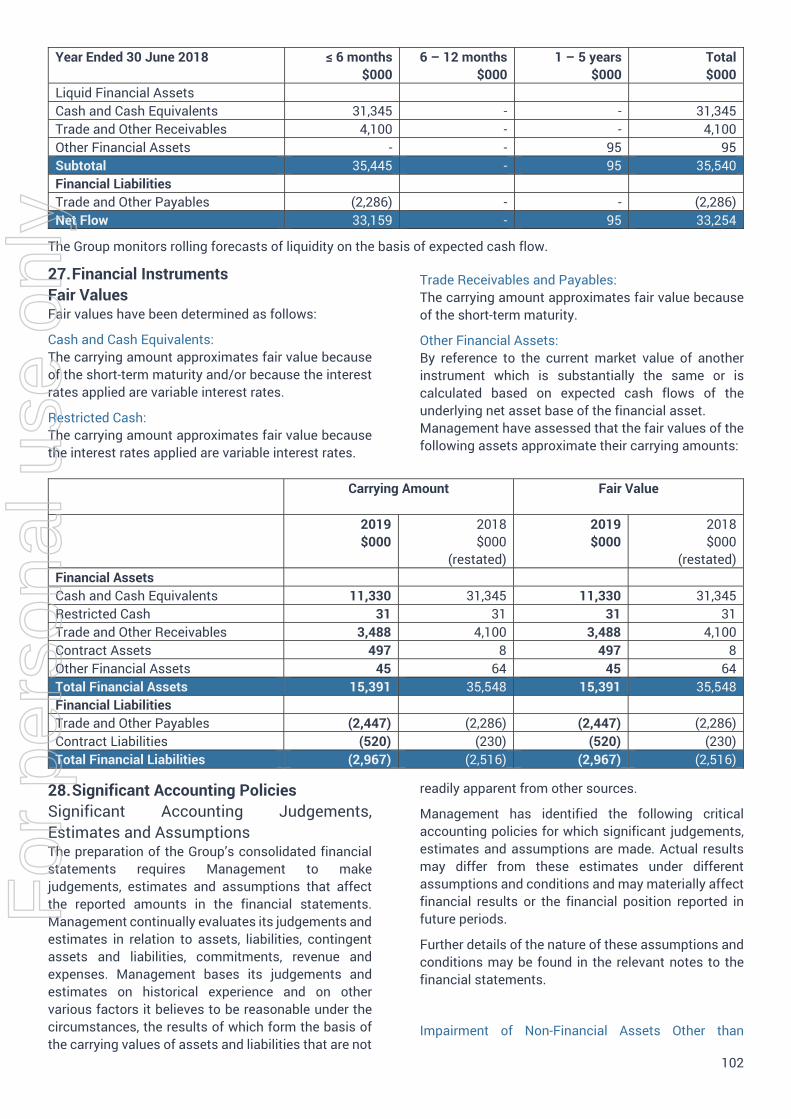
102
Year Ended 30 June 2018 ≤ 6 months $000
6 – 12 months $000
1 – 5 years $000
Total $000
Liquid Financial Assets Cash and Cash Equivalents 31,345 - - 31,345 Trade and Other Receivables 4,100 - - 4,100 Other Financial Assets - - 95 95 Subtotal 35,445 - 95 35,540 Financial Liabilities Trade and Other Payables (2,286) - - (2,286) Net Flow 33,159 - 95 33,254
The Group monitors rolling forecasts of liquidity on the basis of expected cash flow.
27. Financial InstrumentsFair Values Fair values have been determined as follows:
Cash and Cash Equivalents: The carrying amount approximates fair value because of the short-term maturity and/or because the interest rates applied are variable interest rates.
Restricted Cash: The carrying amount approximates fair value because the interest rates applied are variable interest rates.
Trade Receivables and Payables: The carrying amount approximates fair value because of the short-term maturity.
Other Financial Assets: By reference to the current market value of another instrument which is substantially the same or is calculated based on expected cash flows of the underlying net asset base of the financial asset. Management have assessed that the fair values of the following assets approximate their carrying amounts:
Carrying Amount Fair Value
2019 $000
2018 $000
(restated)
2019 $000
2018 $000
(restated) Financial Assets Cash and Cash Equivalents 11,330 31,345 11,330 31,345 Restricted Cash 31 31 31 31 Trade and Other Receivables 3,488 4,100 3,488 4,100 Contract Assets 497 8 497 8 Other Financial Assets 45 64 45 64 Total Financial Assets 15,391 35,548 15,391 35,548 Financial Liabilities Trade and Other Payables (2,447) (2,286) (2,447) (2,286) Contract Liabilities (520) (230) (520) (230) Total Financial Liabilities (2,967) (2,516) (2,967) (2,516)
28. Significant Accounting PoliciesSignificant Accounting Judgements, Estimates and Assumptions The preparation of the Group’s consolidated financial statements requires Management to make judgements, estimates and assumptions that affect the reported amounts in the financial statements. Management continually evaluates its judgements and estimates in relation to assets, liabilities, contingent assets and liabilities, commitments, revenue and expenses. Management bases its judgements and estimates on historical experience and on other various factors it believes to be reasonable under the circumstances, the results of which form the basis of the carrying values of assets and liabilities that are not
readily apparent from other sources.
Management has identified the following critical accounting policies for which significant judgements, estimates and assumptions are made. Actual results may differ from these estimates under different assumptions and conditions and may materially affect financial results or the financial position reported in future periods.
Further details of the nature of these assumptions and conditions may be found in the relevant notes to the financial statements.
Impairment of Non-Financial Assets Other than
For
per
sona
l use
onl
y
103
Goodwill The Group assesses impairment of all assets at each reporting date by evaluating conditions specific to the Group and to the particular asset that may lead to impairment. These include product and manufacturing performance, technology, economic and political environments and future sales expectations. If an impairment trigger exists, the recoverable amount of the asset is determined.
For assets other than inventory, the impairment triggers used by the Group did not show any indication of impairment as at 30 June 2019. As a result, no impairment has been formally estimated and no impairment loss has been recognised for these assets for this financial period. Refer to Note 12 for the complete details regarding impairment testing.
Impairment of Goodwill and Intangibles with Indefinite Useful Lives The Group determines whether goodwill and intangibles with indefinite useful lives are impaired at least on an annual basis. This requires an estimation of the recoverable amount of the cash generating units, using a value in use discounted cash flow methodology, to which the goodwill and intangibles with indefinite useful lives are allocated. Management determined that no impairment loss should be recognised for this financial reporting period. The assumptions used in this estimation of goodwill and intangibles with indefinite useful lives are discussed in Note 12.
Inventory Impairment The Group reviews the value of inventories held to determine if inventories are being held at the lower of cost and net realisable value. This requires a determination by Management of the cost of inventories held and the subsequent recognition of these items as expenses, including any write-down to net realisable value. During the year ended 30 June 2019, there were no write-downs to inventory. During the year ended 30 June 2018, a review showed that due to the commercial availability of SOZO, an obsolescence indicator is likely to be present for legacy BIS measurement devices. An impairment loss of approximately $709,000 was recognised during the period ended 30 June 2018 related to BIS measurement devices and components.
Taxation The Group’s accounting policy for taxation requires management’s judgement as to the types of arrangements considered to be a tax on income in contrast to an operating cost. Judgement is also required in assessing whether deferred tax assets and certain deferred tax liabilities are recognised on the balance sheet. Deferred tax assets, including those arising from un-recouped tax losses, capital losses and
temporary differences, are recognised only where it is considered more likely than not that they will be recovered, which is dependent on the generation of sufficient future taxable profits. Deferred tax liabilities arising from temporary differences in investments, caused principally by retained earnings held in foreign tax jurisdictions, are recognised unless repatriation of retained earnings can be controlled and are not expected to occur in the foreseeable future.
Assumptions about the generation of future taxable profits and repatriation of retained earnings depend on management’s estimates of future cash flows. These depend on estimates of future production and sales volumes, operating costs, capital expenditure, dividends and other capital management transactions. Judgements are also required about the application of income tax legislation. These judgements and assumptions are subject to risk and uncertainty, hence there is a possibility that changes in circumstances will alter expectations, which may impact the amount of deferred tax assets and deferred tax liabilities recognised on the balance sheet and the amount of other tax losses and temporary differences not yet recognised. Refer to Note 19 for the complete details regarding deferred tax assets and deferred tax liabilities.
Development Costs Under AASB 138 Intangible Assets, Management must determine the degree to which items are recognised as intangible assets, whether those items are purchased or self-created (at cost). Items are capitalised, as opposed to expensed, if, and only if (1) it is probable that the future economic benefits that are attributable to the asset will flow to the entity and (2) the cost of the asset can be measured reliably and other criteria outlined in respect of development costs are met.
This requires Management to make judgements as to the probability of future economic benefits of development project costs incurred by the Group, as well as to determine when technical and commercial feasibility of the assets for sale of use have been established.
Research and Development Tax Incentive The Group measures the amount of refund from the Australian Tax Office in relation to the research and development tax incentive on an annual basis. This requires an estimation and judgement by Management of the eligible expenses under the AusIndustry guidelines of self-assessment for the tax credit. Management works in conjunction with registered tax agents and AusIndustry to determine the eligibility of expenses and recognises a receivable and other income when there is reasonable assurance such amounts will be received.
For
per
sona
l use
onl
y
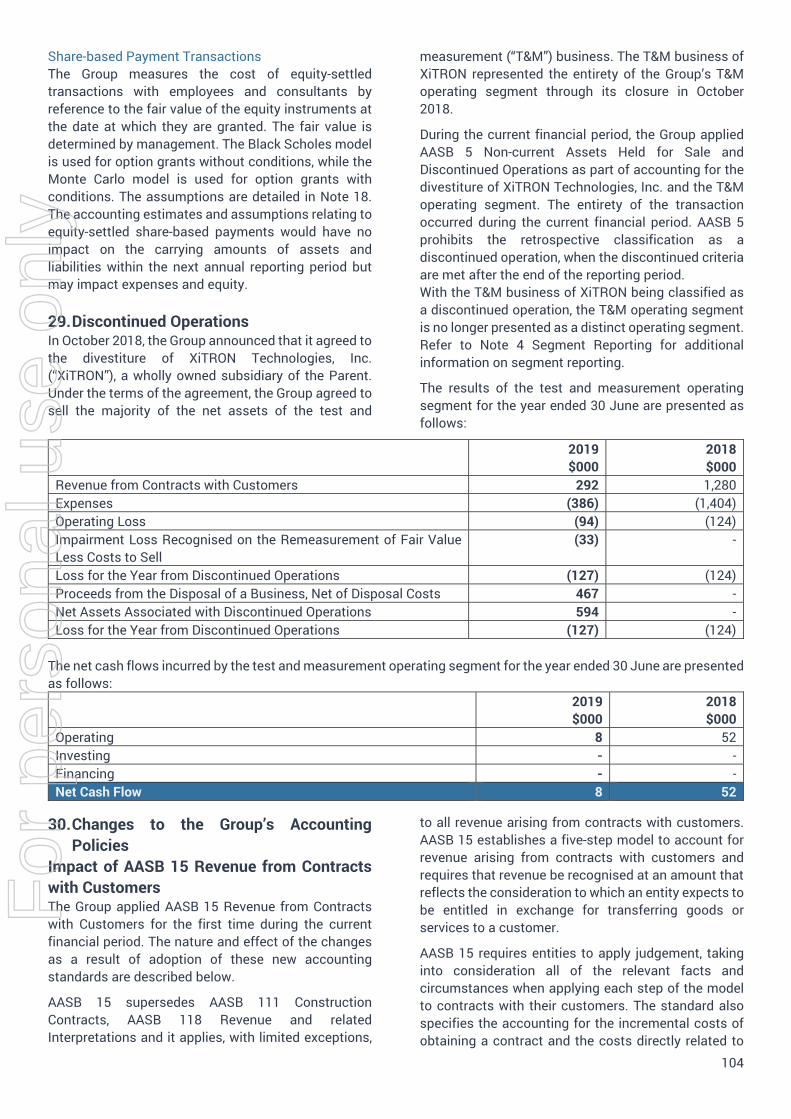
104
Share-based Payment Transactions The Group measures the cost of equity-settled transactions with employees and consultants by reference to the fair value of the equity instruments at the date at which they are granted. The fair value is determined by management. The Black Scholes model is used for option grants without conditions, while the Monte Carlo model is used for option grants with conditions. The assumptions are detailed in Note 18. The accounting estimates and assumptions relating to equity-settled share-based payments would have no impact on the carrying amounts of assets and liabilities within the next annual reporting period but may impact expenses and equity.
29. Discontinued OperationsIn October 2018, the Group announced that it agreed to the divestiture of XiTRON Technologies, Inc. (“XiTRON”), a wholly owned subsidiary of the Parent. Under the terms of the agreement, the Group agreed to sell the majority of the net assets of the test and
measurement (“T&M”) business. The T&M business of XiTRON represented the entirety of the Group’s T&M operating segment through its closure in October 2018.
During the current financial period, the Group applied AASB 5 Non-current Assets Held for Sale and Discontinued Operations as part of accounting for the divestiture of XiTRON Technologies, Inc. and the T&M operating segment. The entirety of the transaction occurred during the current financial period. AASB 5 prohibits the retrospective classification as a discontinued operation, when the discontinued criteria are met after the end of the reporting period. With the T&M business of XiTRON being classified as a discontinued operation, the T&M operating segment is no longer presented as a distinct operating segment. Refer to Note 4 Segment Reporting for additional information on segment reporting.
The results of the test and measurement operating segment for the year ended 30 June are presented as follows:
2019 $000
2018 $000
Revenue from Contracts with Customers 292 1,280 Expenses (386) (1,404) Operating Loss (94) (124) Impairment Loss Recognised on the Remeasurement of Fair Value Less Costs to Sell
(33) -
Loss for the Year from Discontinued Operations (127) (124) Proceeds from the Disposal of a Business, Net of Disposal Costs 467 - Net Assets Associated with Discontinued Operations 594 - Loss for the Year from Discontinued Operations (127) (124)
The net cash flows incurred by the test and measurement operating segment for the year ended 30 June are presented as follows:
2019 $000
2018 $000
Operating 8 52 Investing - - Financing - - Net Cash Flow 8 52
30. Changes to the Group’s AccountingPolicies
Impact of AASB 15 Revenue from Contracts with Customers The Group applied AASB 15 Revenue from Contracts with Customers for the first time during the current financial period. The nature and effect of the changes as a result of adoption of these new accounting standards are described below.
AASB 15 supersedes AASB 111 Construction Contracts, AASB 118 Revenue and related Interpretations and it applies, with limited exceptions,
to all revenue arising from contracts with customers. AASB 15 establishes a five-step model to account for revenue arising from contracts with customers and requires that revenue be recognised at an amount that reflects the consideration to which an entity expects to be entitled in exchange for transferring goods or services to a customer.
AASB 15 requires entities to apply judgement, taking into consideration all of the relevant facts and circumstances when applying each step of the model to contracts with their customers. The standard also specifies the accounting for the incremental costs of obtaining a contract and the costs directly related to
For
per
sona
l use
onl
y
105
fulfilling a contract.
AASB 15 Revenue Recognition Policy (a) Sale of Goods – Device and Consumable Revenue
(Legacy) Revenue from the stand-alone sale of legacy devices and consumables is recognised at the point in time when control of the asset is transferred to the customer, generally on delivery of the devices or consumables, and when there is persuasive evidence, usually in the form of a purchase order or an executed sales agreement with a customer at the time of delivery of the goods to the customer that no further work or processing is required to satisfy the performance obligation, the quantity and quality of the goods has been determined, the price is fixed and generally title has passed (for shipped goods this is the bill of lading date).
The Group considers whether there are other promises in the contract that are separate performance obligations to which a portion of the transaction price needs to be allocated.
(b) SOZO 2.0 – Sale of Device and Subscription Services
The Group enters into contracts with customers for bundled sales of SOZO 2.0 devices and subscription services. The Group has determined that these bundled sales contracts are comprised of two performance obligations because the promises to transfer the SOZO device and provide subscription services for ongoing assessment are capable of being distinct and separately identified.
Accordingly, the Group allocates the transaction price, which may include a discount, based on the relative stand-alone selling prices of the equipment and subscription services.
The transaction price allocated to the SOZO device is recognised at the point in time when control of the asset is transferred to the customer, generally on delivery of the devices in accordance with the contractual terms, and when there is persuasive evidence, usually in the form of a purchase order or an executed sales agreement with a customer at the time of delivery of the goods to the customer that no further work or processing is required to satisfy the performance obligation, the quantity and quality of the goods has been determined, the price is fixed and generally title has passed (for shipped goods this is the bill of lading date).
The revenue from subscription services related to ongoing provision of access to assessment and testing for SOZO is recognised at a point in time based on the enforceable contract value based on the quoted price in the form of a purchase order or an executed sales agreement with a customer.
The Group considers whether there are other promises in the contract that are separate performance obligations to which a portion of the transaction price needs to be allocated.
(c) SOZO 3.0 – Sale of Device and Subscription Services
The Group enters into contracts with customers for bundled sales of SOZO 3.0 devices and subscription services. The Group has determined that these bundled sales contracts are comprised of one performance obligations because the promises to transfer the SOZO device and subscription services for ongoing assessment are not capable of being distinct and separately identified.
Accordingly, the Group allocates the entire transaction price, which may include a discount, to the one performance obligation.
Revenue under these contracts are recongised using the input cost method based on the estimated cost of fulfilling the completion of the promises in accordance with the contractual terms, and when there is persuasive evidence, usually in the form of a purchase order or an executed sales agreement with a customer at the time of delivery of the goods to the customer.
The Group considers whether there are other promises in the contract that are separate performance obligations to which a portion of the transaction price needs to be allocated.
(d) Rendering of Other Services Revenue from the repair of instruments is recognised at the point in time upon completion of the performance obligation, which is typically when the repair has been performed. When the contract outcome cannot be estimated reliably, revenue is recognised only to the extent of the expenses recognised that are recoverable.
During the year ended 30 June 2019 the Group recognised revenue totaling $58,000 (30 June 2018: $66,000) for the rendering of other services.
Key Considerations in the Revenue Policy In determining the transaction price for the subscription services, the Group considers the effect of the following:
(i) Judgements The Group applied the following judgements that significantly affect the determination of the amount and timing of revenue from contracts with customers:
Identifying the number of performance obligationsin a bundled sale of equipment and subscriptionservices under different contractual arrangement forSOZO 2.0 and 3.0. The Group provides devices that
For
per
sona
l use
onl
y
106
are bundled together with the subscription services to a customer. Under the contractual terms the subscription services are a promise to provide ongoing access to assessment and testing services in the future and are part of the negotiated exchange between the Group and the customer. The delivery of those services can vary under the contracts and impacts the determination of performance obligations.
(ii) Significant Financing Component The Group may receive short-term advances from its customers in the form of up-front payment of devices, consumables or advance payment of subscription services. The group has not identified any significant financing components within these advances. Using the practical expedient in AASB 15, the Group does not adjust the promised amount of consideration for the effects of a significant financing component if it expects, at contract inception, that the period between the transfer of the promised good or service to the customer and when the customer pays for that good or service will be one year or less. There was no adjustment made in respect of this in the current or prior periods.
(iii) Warranty Obligations The Group typically provides warranties for general repairs of defects that existed at the time of sale, as required by law. These assurance-type warranties are accounted for under AASB 137 Provisions, Contingent Liabilities and Contingent Assets.
(iv) Incremental Costs of Obtaining a Contract The Group pays sales commission to its employees for each contract that they obtain for bundled sales of SOZO devices and subscription services. The Group has elected to apply the optional practical expedient for costs to obtain a contract which allows the Group to immediately expense sales commissions (included under employee benefits and part of cost of sales) because the amortisation period of the asset that the Group otherwise would have used is one year or less.
(v) Contract Balances Contract Assets A contract asset is the right to consideration in exchange for goods or services transferred to the customer. If the Group performs by transferring goods or services to a customer before the customer pays consideration or before payment is due, a contract asset is recognised for the earned consideration that is conditional.
Trade Receivables A receivable represents the Group’s right to an amount of consideration that is unconditional (i.e., only the passage of time is required before payment of the consideration is due).
Contract Liabilities A contract liability is the obligation to transfer goods or services to a customer for which the Group has received consideration (or an amount of consideration is due) from the customer. If a customer pays consideration before the Group transfers goods or services to the customer, a contract liability is recognised when the payment is made, or the payment is due (whichever is earlier). Contract liabilities are recognised as revenue when the Group completes the performance obligations under the contract.
For
per
sona
l use
onl
y
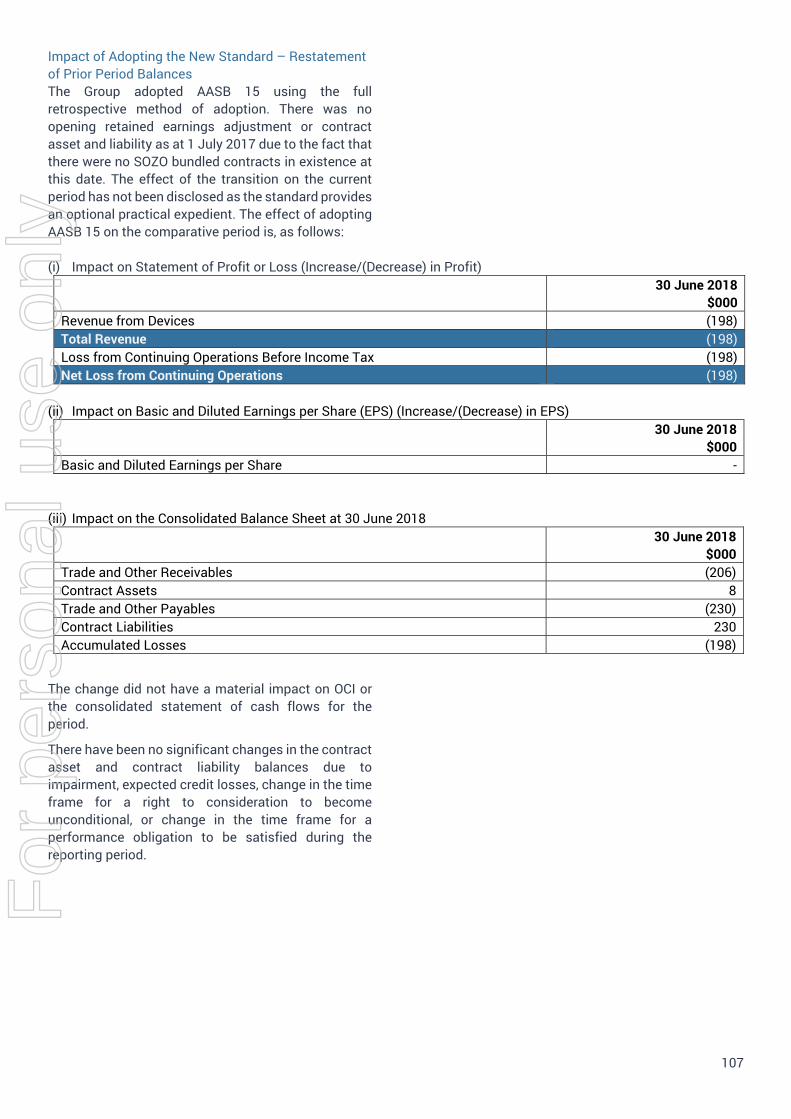
107
Impact of Adopting the New Standard – Restatement of Prior Period Balances The Group adopted AASB 15 using the full retrospective method of adoption. There was no opening retained earnings adjustment or contract asset and liability as at 1 July 2017 due to the fact that there were no SOZO bundled contracts in existence at this date. The effect of the transition on the current period has not been disclosed as the standard provides an optional practical expedient. The effect of adopting AASB 15 on the comparative period is, as follows:
(i) Impact on Statement of Profit or Loss (Increase/(Decrease) in Profit) 30 June 2018
$000 Revenue from Devices (198) Total Revenue (198) Loss from Continuing Operations Before Income Tax (198) Net Loss from Continuing Operations (198)
(ii) Impact on Basic and Diluted Earnings per Share (EPS) (Increase/(Decrease) in EPS) 30 June 2018
$000 Basic and Diluted Earnings per Share -
(iii) Impact on the Consolidated Balance Sheet at 30 June 2018 30 June 2018
$000 Trade and Other Receivables (206) Contract Assets 8 Trade and Other Payables (230) Contract Liabilities 230 Accumulated Losses (198)
The change did not have a material impact on OCI or the consolidated statement of cash flows for the period.
There have been no significant changes in the contract asset and contract liability balances due to impairment, expected credit losses, change in the time frame for a right to consideration to become unconditional, or change in the time frame for a performance obligation to be satisfied during the reporting period.
For
per
sona
l use
onl
y
108
Impact of AASB 9 Financial Instruments The Group applied AASB 9 Financial Instruments for the first time during the current financial period. The nature and effect of the changes as a result of adoption of these new accounting standards are described below.
The majority of the Group’s tangible assets are cash, short term deposits, accounts receivables, and inventory.
The new classification requirements of the standard did not have a material impact on these existing financial assets.
On adoption of the new standard at 1 July 2018, the Group reviewed on transition the effect that any credit loss impact had on trade receivables at 30 June 2018 and determined that AASB 9 did not have a material effect on the Group’s consolidated financial statements compared to the Group’s existing policies on provisioning for doubtful debts on trade receivables.
Impairment of Financial Assets The Group recognises an allowance for expected credit losses (ECLs) for all debt instruments not held at fair value through profit or loss. ECLs are based on the difference between the contractual cash flows due in accordance with the contract and all the cash flows that the Group expects to receive, discounted at an approximation of the original effective interest rate. The expected cash flows will include cash flows from the sale of collateral held or other credit enhancements that are integral to the contractual terms.
ECLs are recognised in two stages. For credit exposures for which there has not been a significant increase in credit risk since initial recognition, ECLs are
provided for credit losses that result from default events that are possible within the next 12-months (a 12-month ECL). For those credit exposures for which there has been a significant increase in credit risk since initial recognition, a loss allowance is required for credit losses expected over the remaining life of the exposure, irrespective of the timing of the default (a lifetime ECL).
For trade receivables and contract assets, the Group applies a simplified approach in calculating ECLs. Therefore, the Group does not track changes in credit risk, but instead recognises a loss allowance based on lifetime ECLs at each reporting date. The Group has established a provision matrix that is based on its historical credit loss experience, adjusted for forward-looking factors specific to the debtors and the economic environment.
Impact of AASB 2016-5 Amendments to Australian Accounting Standards – Classification and Measurement of Share-based Payment Transactions The AASB issued amendments to AASB 2 Share-based Payment that address three main areas: the effects of vesting conditions on the measurement of a cash-settled share-based payment transaction; the classification of a share-based payment transaction with net settlement features for withholding tax obligations; and accounting where a modification to the terms and conditions of a share-based payment transaction changes its classification from cash-settled to equity-settled. The Group has no share-based payment transactions with net settlement features for withholding tax obligations and had not made any modifications to the terms and conditions of its share-based payment transactions. Therefore, these amendments do not have any impact on the Group’s consolidated financial statements.
For
per
sona
l use
onl
y
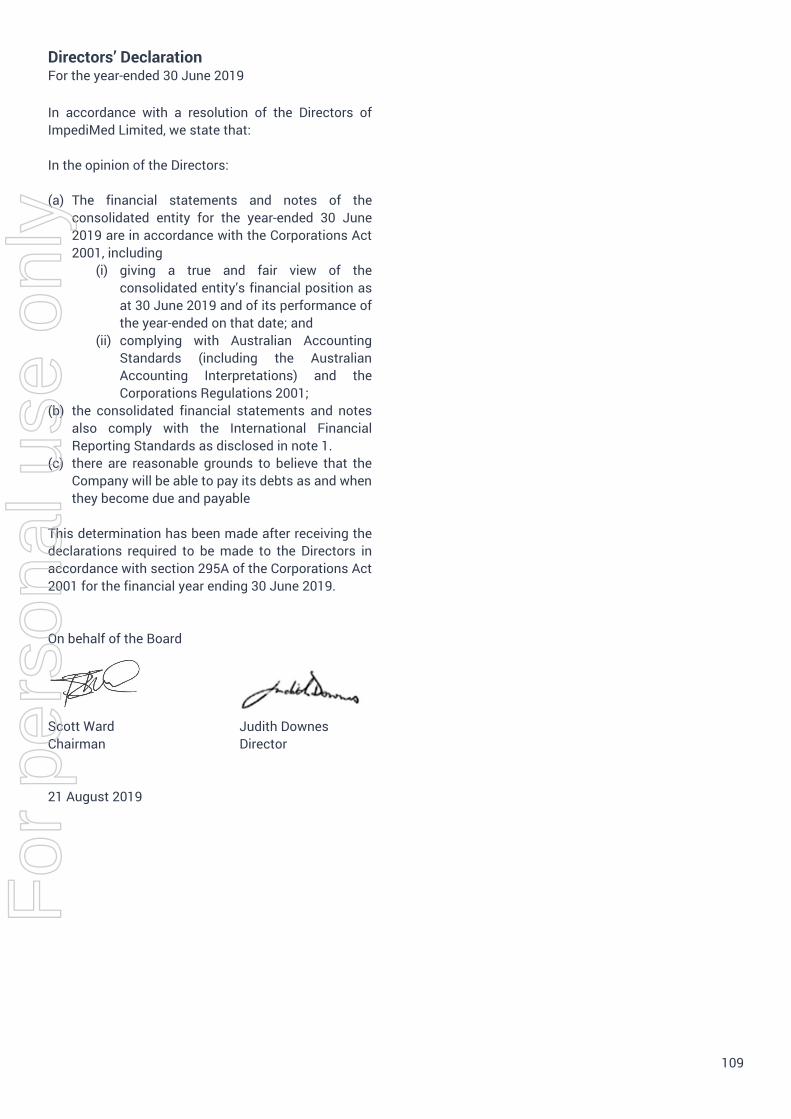
109
Directors’ Declaration For the year-ended 30 June 2019
In accordance with a resolution of the Directors of ImpediMed Limited, we state that:
In the opinion of the Directors:
(a) The financial statements and notes of the consolidated entity for the year-ended 30 June 2019 are in accordance with the Corporations Act 2001, including
(i) giving a true and fair view of the consolidated entity’s financial position as at 30 June 2019 and of its performance of the year-ended on that date; and
(ii) complying with Australian Accounting Standards (including the Australian Accounting Interpretations) and the Corporations Regulations 2001;
(b) the consolidated financial statements and notes also comply with the International Financial Reporting Standards as disclosed in note 1.
(c) there are reasonable grounds to believe that the Company will be able to pay its debts as and when they become due and payable
This determination has been made after receiving the declarations required to be made to the Directors in accordance with section 295A of the Corporations Act 2001 for the financial year ending 30 June 2019.
On behalf of the Board
Scott Ward Judith Downes Chairman Director
21 August 2019
For
per
sona
l use
onl
y
A member firm of Ernst & Young Global Limited Liability limited by a scheme approved under Professional Standards Legislation
Ernst & Young 111 Eagle Street Brisbane QLD 4000 Australia GPO Box 7878 Brisbane QLD 4001
Tel: +61 7 3011 3333 Fax: +61 7 3011 3100 ey.com/au
Independent Auditor's Report to the Members of ImpediMed Limited
Report on the Audit of the Financial Report
Opinion
We have audited the financial report of ImpediMed Limited (the Company) and its subsidiaries (collectively the Group), which comprises the consolidated statement of financial position as at 30 June 2019, the consolidated statement of comprehensive income, consolidated statement of changes in equity and consolidated statement of cash flows for the year then ended, notes to the financial statements, including a summary of significant accounting policies, and the directors' declaration.
In our opinion, the accompanying financial report of the Group is in accordance with the Corporations Act 2001, including:
a) giving a true and fair view of the consolidated financial position of the Group as at 30 June 2019and of its consolidated financial performance for the year ended on that date; and
b) complying with Australian Accounting Standards and the Corporations Regulations 2001.
Basis for Opinion
We conducted our audit in accordance with Australian Auditing Standards. Our responsibilities under those standards are further described in the Auditor’s Responsibilities for the Audit of the Financial Report section of our report. We are independent of the Group in accordance with the auditor independence requirements of the Corporations Act 2001 and the ethical requirements of the Accounting Professional and Ethical Standards Board’s APES 110 Code of Ethics for Professional Accountants (the Code) that are relevant to our audit of the financial report in Australia. We have also fulfilled our other ethical responsibilities in accordance with the Code.
We believe that the audit evidence we have obtained is sufficient and appropriate to provide a basis for our opinion.
Key Audit Matters
Key audit matters are those matters that, in our professional judgment, were of most significance in our audit of the financial report of the current year. These matters were addressed in the context of our audit of the financial report as a whole, and in forming our opinion thereon, but we do not provide a separate opinion on these matters. For each matter below, our description of how our audit addressed the matter is provided in that context.
For
per
sona
l use
onl
y
A member firm of Ernst & Young Global Limited Liability limited by a scheme approved under Professional Standards Legislation
We have fulfilled the responsibilities described in the Auditor’s Responsibilities for the Audit of the Financial Report section of our report, including in relation to these matters. Accordingly, our audit included the performance of procedures designed to respond to our assessment of the risks of material misstatement of the financial report. The results of our audit procedures, including the procedures performed to address the matters below, provide the basis for our audit opinion on the accompanying financial report.
Going Concern
Why significant How our audit addressed the key audit matter
As disclosed in Note 1 of the financial report the Directors concluded that in their opinion despite the Group generating operating losses and net cash outflows for the year, there are reasonable grounds to believe that the Group has the ability to pay its debts as and when they fall due. The financial report has been prepared on a going concern basis.
The going concern assumption is fundamental to the basis of preparation of the financial report.
As the Group has not generated a profit since it started operations and given the judgment involved in preparing cash flow forecasts, we considered this matter and the related disclosures to be a Key Audit Matter.
Our audit procedures included the following:
• Assessed the Directors’ determination and conclusionas to the going concern basis of preparation.
• Considered the operating plans of the Group andevaluated the assumptions made in the cash flowsforecasts on which the Directors’ assessment is based.
• Considered the historical reliability of the Group’scash flow forecasts and agreed the cash flow forecaststo the Board approved operating plan.
• Considered the impact of a range of sensitivities tothe cash flow model.
• Traced to subsequent receipt the cash inflow of$13.167 million from the rights offer completed inJuly 2019.
• Evaluated the adequacy of the Group’s going concernrelated disclosures in the financial report.
Research and development receivable
Why significant How our audit addressed the key audit matter
As outlined in Note 6 Other Income and Expenses, the Group recognised a research & development (R&D) tax incentive totaling $2.620m for the year ended 30 June 2019.
The matter was considered a key audit matter for the following reasons:
• The R&D tax incentive balance is a significantcomponent of income to the Group; and
• As outlined in Note 28 Significant accountingjudgments, estimates and assumptions, there is adegree of judgment involved as to whether theR&D tax incentive meets the recognition criteriaand in determining the measurement of therebate including the assessment of the eligibilityand appropriateness of the apportionment ofeligible expenses based on R&D activitiesundertaken by the Group.
Our audit procedures included the following:
• Assessed the mathematical accuracy of thecalculation of the Group’s claim.
• On a sample basis, agreed expenses claimed to sourcedocumentation, such as payroll information andinvoices.
• Involved our R&D taxation specialists to review theGroup’s R&D claim and to consider whether theGroup’s R&D claim meets the recognition criteria.
• Obtained representations from the Group that theactivities are eligible under the self-assessed R&D TaxIncentive criteria, and for a sample of transactionstested the support for the technical and expenditurecomponents of the R&D tax claim.
• Considered the appropriateness of the disclosures inthe financial report.
For
per
sona
l use
onl
y
A member firm of Ernst & Young Global Limited Liability limited by a scheme approved under Professional Standards Legislation
Revenue recognition
Why significant How our audit addressed the key audit matter
As outlined in Note 30 Changes to the Group’s Accounting Policies, the Group has applied AASB 15 Revenue from Contacts with Customers (AASB 15) for the first time during the current financial period.
The matter was considered a key audit matter due to the Group having a number of different types of revenue, including multi-element arrangements, and the judgements involved in the determination of the performance obligations which impacts the amount and timing of the recognition of revenue from contracts with customers.
Our audit procedures included the following:
• For each material revenue stream, we assessed theGroup’s application of AASB 15, including reviewingthe contractual terms of the different customercontracts and the application of the requirements ofAABS 15.
• Selected a sample of revenue contracts and assessedwhether revenue was recognised in accordance withAASB 15.
• Assessed the adequacy of the financial reportdisclosures included in Note 30 to the financialstatements.
Information Other than the Financial Report and Auditor’s Report Thereon
The directors are responsible for the other information. The other information comprises the information included in the Company’s 2019 Annual Report, but does not include the financial report and our auditor’s report thereon.
Our opinion on the financial report does not cover the other information and accordingly we do not express any form of assurance conclusion thereon, with the exception of the Remuneration Report and our related assurance opinion.
In connection with our audit of the financial report, our responsibility is to read the other information and, in doing so, consider whether the other information is materially inconsistent with the financial report or our knowledge obtained in the audit or otherwise appears to be materially misstated.
If, based on the work we have performed, we conclude that there is a material misstatement of this other information, we are required to report that fact. We have nothing to report in this regard.
Responsibilities of the Directors for the Financial Report
The directors of the Company are responsible for the preparation of the financial report that gives a true and fair view in accordance with Australian Accounting Standards and the Corporations Act 2001 and for such internal control as the directors determine is necessary to enable the preparation of the financial report that gives a true and fair view and is free from material misstatement, whether due to fraud or error.
In preparing the financial report, the directors are responsible for assessing the Group’s ability to continue as a going concern, disclosing, as applicable, matters relating to going concern and using the going concern basis of accounting unless the directors either intend to liquidate the Group or to cease operations, or have no realistic alternative but to do so.
For
per
sona
l use
onl
y
A member firm of Ernst & Young Global Limited Liability limited by a scheme approved under Professional Standards Legislation
Auditor's Responsibilities for the Audit of the Financial Report
Our objectives are to obtain reasonable assurance about whether the financial report as a whole is free from material misstatement, whether due to fraud or error, and to issue an auditor’s report that includes our opinion. Reasonable assurance is a high level of assurance, but is not a guarantee that an audit conducted in accordance with the Australian Auditing Standards will always detect a material misstatement when it exists. Misstatements can arise from fraud or error and are considered material if, individually or in the aggregate, they could reasonably be expected to influence the economic decisions of users taken on the basis of this financial report.
As part of an audit in accordance with the Australian Auditing Standards, we exercise professional judgment and maintain professional scepticism throughout the audit. We also:
• Identify and assess the risks of material misstatement of the financial report, whether due to fraudor error, design and perform audit procedures responsive to those risks, and obtain audit evidencethat is sufficient and appropriate to provide a basis for our opinion. The risk of not detecting amaterial misstatement resulting from fraud is higher than for one resulting from error, as fraudmay involve collusion, forgery, intentional omissions, misrepresentations, or the override ofinternal control.
• Obtain an understanding of internal control relevant to the audit in order to design auditprocedures that are appropriate in the circumstances, but not for the purpose of expressing anopinion on the effectiveness of the Group’s internal control.
• Evaluate the appropriateness of accounting policies used and the reasonableness of accountingestimates and related disclosures made by the directors.
• Conclude on the appropriateness of the directors’ use of the going concern basis of accounting and,based on the audit evidence obtained, whether a material uncertainty exists related to events orconditions that may cast significant doubt on the Group’s ability to continue as a going concern. Ifwe conclude that a material uncertainty exists, we are required to draw attention in our auditor’sreport to the related disclosures in the financial report or, if such disclosures are inadequate, tomodify our opinion. Our conclusions are based on the audit evidence obtained up to the date of ourauditor’s report. However, future events or conditions may cause the Group to cease to continue asa going concern.
• Evaluate the overall presentation, structure and content of the financial report, including thedisclosures, and whether the financial report represents the underlying transactions and events in amanner that achieves fair presentation.
We communicate with the directors regarding, among other matters, the planned scope and timing of the audit and significant audit findings, including any significant deficiencies in internal control that we identify during our audit.
We also provide the directors with a statement that we have complied with relevant ethical requirements regarding independence, and to communicate with them all relationships and other matters that may reasonably be thought to bear on our independence, and where applicable, related safeguards.
For
per
sona
l use
onl
y
A member firm of Ernst & Young Global Limited Liability limited by a scheme approved under Professional Standards Legislation
From the matters communicated to the directors, we determine those matters that were of most significance in the audit of the financial report of the current year and are therefore the key audit matters. We describe these matters in our auditor’s report unless law or regulation precludes public disclosure about the matter or when, in extremely rare circumstances, we determine that a matter should not be communicated in our report because the adverse consequences of doing so would reasonably be expected to outweigh the public interest benefits of such communication.
Report on the Audit of the Remuneration Report
Opinion on the Remuneration Report
We have audited the Remuneration Report included the directors' report for the year ended 30 June 2019.
In our opinion, the Remuneration Report of ImpediMed Limited for the year ended 30 June 2019, complies with section 300A of the Corporations Act 2001.
Responsibilities
The directors of the Company are responsible for the preparation and presentation of the Remuneration Report in accordance with section 300A of the Corporations Act 2001. Our responsibility is to express an opinion on the Remuneration Report, based on our audit conducted in accordance with Australian Auditing Standards.
Ernst & Young
Jennifer Barker Partner Brisbane 21 August 2019 F
or p
erso
nal u
se o
nly
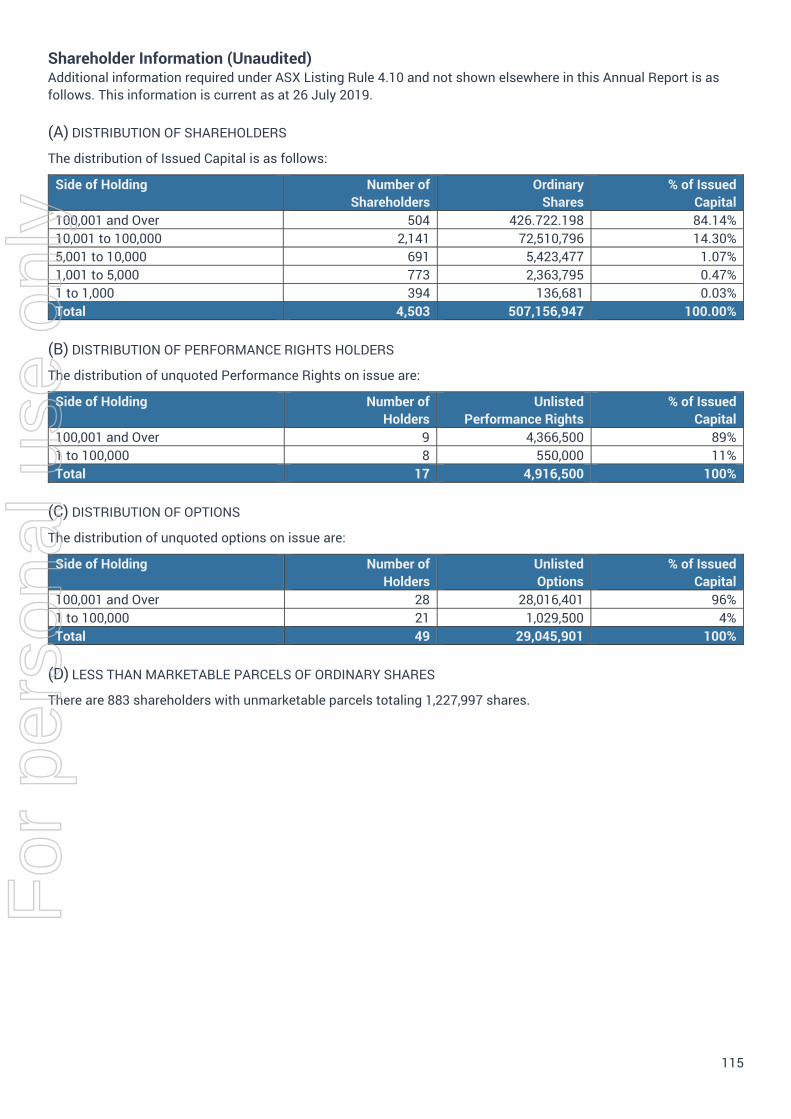
115
Shareholder Information (Unaudited) Additional information required under ASX Listing Rule 4.10 and not shown elsewhere in this Annual Report is as follows. This information is current as at 26 July 2019.
(A) DISTRIBUTION OF SHAREHOLDERS
The distribution of Issued Capital is as follows:
Side of Holding Number of Shareholders
Ordinary Shares
% of Issued Capital
100,001 and Over 504 426.722.198 84.14% 10,001 to 100,000 2,141 72,510,796 14.30% 5,001 to 10,000 691 5,423,477 1.07% 1,001 to 5,000 773 2,363,795 0.47% 1 to 1,000 394 136,681 0.03% Total 4,503 507,156,947 100.00%
(B) DISTRIBUTION OF PERFORMANCE RIGHTS HOLDERS
The distribution of unquoted Performance Rights on issue are:
Side of Holding Number of Holders
Unlisted Performance Rights
% of Issued Capital
100,001 and Over 9 4,366,500 89% 1 to 100,000 8 550,000 11% Total 17 4,916,500 100%
(C) DISTRIBUTION OF OPTIONS
The distribution of unquoted options on issue are:
Side of Holding Number of Holders
Unlisted Options
% of Issued Capital
100,001 and Over 28 28,016,401 96% 1 to 100,000 21 1,029,500 4% Total 49 29,045,901 100%
(D) LESS THAN MARKETABLE PARCELS OF ORDINARY SHARES
There are 883 shareholders with unmarketable parcels totaling 1,227,997 shares.
For
per
sona
l use
onl
y
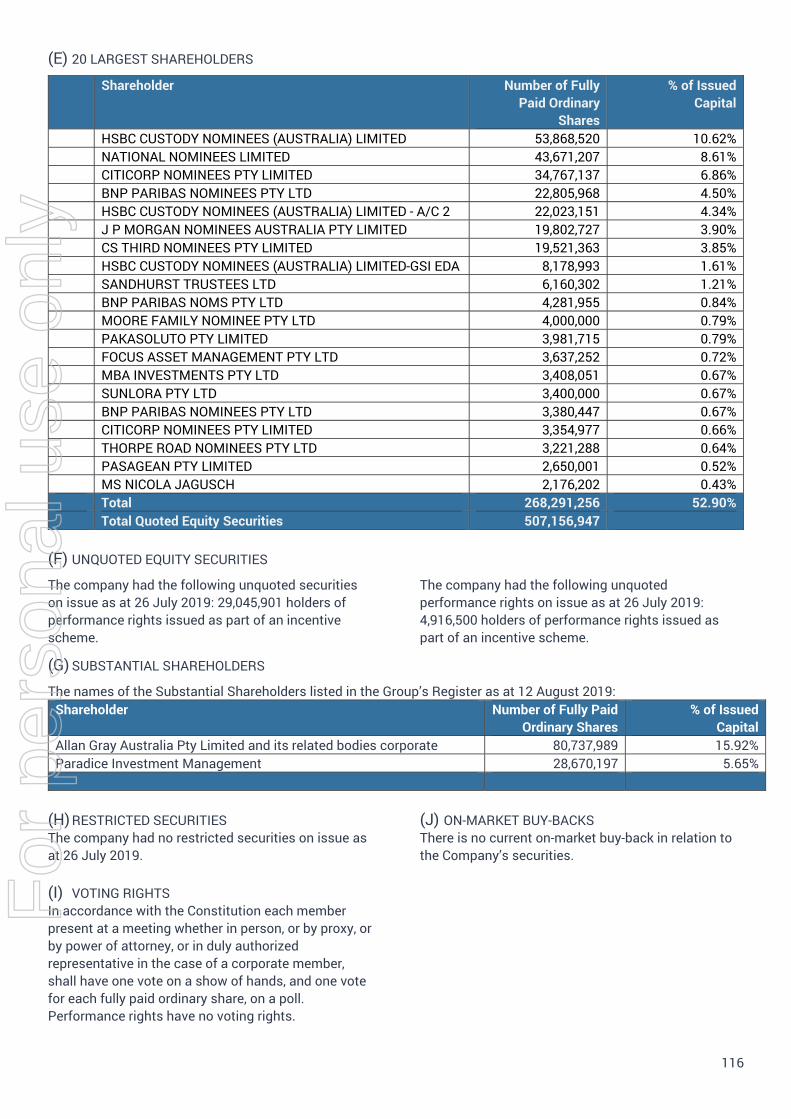
116
(E) 20 LARGEST SHAREHOLDERS
Shareholder Number of Fully Paid Ordinary
Shares
% of Issued Capital
HSBC CUSTODY NOMINEES (AUSTRALIA) LIMITED 53,868,520 10.62% NATIONAL NOMINEES LIMITED 43,671,207 8.61% CITICORP NOMINEES PTY LIMITED 34,767,137 6.86% BNP PARIBAS NOMINEES PTY LTD 22,805,968 4.50% HSBC CUSTODY NOMINEES (AUSTRALIA) LIMITED - A/C 2 22,023,151 4.34% J P MORGAN NOMINEES AUSTRALIA PTY LIMITED 19,802,727 3.90% CS THIRD NOMINEES PTY LIMITED 19,521,363 3.85% HSBC CUSTODY NOMINEES (AUSTRALIA) LIMITED-GSI EDA 8,178,993 1.61% SANDHURST TRUSTEES LTD 6,160,302 1.21% BNP PARIBAS NOMS PTY LTD 4,281,955 0.84% MOORE FAMILY NOMINEE PTY LTD 4,000,000 0.79% PAKASOLUTO PTY LIMITED 3,981,715 0.79% FOCUS ASSET MANAGEMENT PTY LTD 3,637,252 0.72% MBA INVESTMENTS PTY LTD 3,408,051 0.67% SUNLORA PTY LTD 3,400,000 0.67% BNP PARIBAS NOMINEES PTY LTD 3,380,447 0.67% CITICORP NOMINEES PTY LIMITED 3,354,977 0.66% THORPE ROAD NOMINEES PTY LTD 3,221,288 0.64% PASAGEAN PTY LIMITED 2,650,001 0.52% MS NICOLA JAGUSCH 2,176,202 0.43% Total 268,291,256 52.90% Total Quoted Equity Securities 507,156,947
(F) UNQUOTED EQUITY SECURITIES
The company had the following unquoted securities on issue as at 26 July 2019: 29,045,901 holders of performance rights issued as part of an incentive scheme.
The company had the following unquoted performance rights on issue as at 26 July 2019: 4,916,500 holders of performance rights issued as part of an incentive scheme.
(G) SUBSTANTIAL SHAREHOLDERS
The names of the Substantial Shareholders listed in the Group’s Register as at 12 August 2019: Shareholder Number of Fully Paid
Ordinary Shares % of Issued
Capital Allan Gray Australia Pty Limited and its related bodies corporate 80,737,989 15.92% Paradice Investment Management 28,670,197 5.65%
(H) RESTRICTED SECURITIES The company had no restricted securities on issue as at 26 July 2019.
(I) VOTING RIGHTS In accordance with the Constitution each member present at a meeting whether in person, or by proxy, or by power of attorney, or in duly authorized representative in the case of a corporate member, shall have one vote on a show of hands, and one vote for each fully paid ordinary share, on a poll. Performance rights have no voting rights.
(J) ON-MARKET BUY-BACKS There is no current on-market buy-back in relation to the Company’s securities.
For
per
sona
l use
onl
y

For
per
sona
l use
onl
y


