56
For personal use only

For
per
sona
l use
onl
y

1
CONTENTS
Company Directory 1
Chairman’s Report 2
Directors’ Review of Activities 3
Corporate Governance Statement 6
Directors’ Report 10
Consolidated Statement of Comprehensive Income 17
Consolidated Statement of Financial Position 18
Consolidated Statement of Cash Flows 19
Consolidated Statement of Changes in Equity 20
Notes to the Financial Statements 21
Directors’ Declaration 51
Declaration of Auditor’s Independence 52
Independent Auditor’s Report 53
Shareholder Information 55
Tenement Listing 55
Web
www.legendmining.com.au Email
ASX Code LEG – ordinary shares ACN 060 966 145
COMPANY DIRECTORY
ACN 060 966 145 Directors
Michael William Atkins (Chairman) Mark William Wilson (Managing Director) Derek William Waterfield (Executive Director-Technical) Secretary
Dennis Wilkins Registered Office
Level 1 8 Kings Park Road WEST PERTH WA 6005 Telephone: (08) 9212 0600 Facsimile: (08) 9212 0611 Bankers
National Australia Bank 1232 Hay Street WEST PERTH WA 6005 Auditors
Ernst & Young 11 Mounts Bay Road PERTH WA 6000 Home Exchange
Australian Securities Exchange 2 The Esplanade PERTH WA 6000 Share Registry
Advanced Share Registry Services 150 Stirling Highway NEDLANDS WA 6009 Telephone: (08) 9389 8033 Facsimile: (08) 9389 7871 Lawyers
Hilary Macdonald Suite 23, 18 Stirling Highway NEDLANDS, WA 6000F
or p
erso
nal u
se o
nly

CHAIRMAN’S REPORT For the year ended 31 December 2014
2
As advised in the 2013 Annual Report, Legend was successful in reaching agreement with Jindal for the sale of Legend’s Ngovayang Project in Cameroon, culminating with the signing of a share sale agreement on 18 November 2013. I am very pleased that after a long and detailed process, Legend was able to achieve completion of the Jindal Share Sale and Debt Assignment Agreement in August 2014. Agreements of this nature are invariably complex, and in this case involved detailed negotiations and legal input in three countries; Cameroon, India and Australia. I would like to pay tribute to the manner in which this process was conducted, with a great amount of positive and constructive cooperation shown by the Jindal team and the Cameroonian regulatory authorities. I must also congratulate our Perth team, comprising our legal and corporate advisors and the Legend executive led by Managing Director Mark Wilson. The persistence and patience he showed over a long process was outstanding. The outcome for Legend has been very favorable, and we have now received the initial payment of $6million, with a further $6million due for payment in July/August 2015. Legend also stands to receive a further $5.5million on execution of a Mining Convention between Jindal and the Cameroon Government. We have remained in contact with the Jindal management, and with our Cameroonian in-country advisors and reports indicate that work has been progressing well on the Ngovayang Project. This bodes well for the future of the Project and therefore the prospects of Legend receiving this contingent sum of $5.5million. Completion of this sale has left Legend in an excellent position to acquire new projects for the benefit of its shareholders. Legend continues to review a great number of prospective projects. In addition, to complement our investment in Sirius Resources NL, Legend has commenced work on its own exploration licence in the Fraser Range region, and is reviewing other opportunities in the area. Legend’s working capital position at year end, including investments amounted to $11.1million, and with the second payment from Jindal of $6million due in August 2014, Legend is in a strong position for project generation. On behalf of the Board I would like to thank our Managing Director, Mark Wilson, for the effort he put in to bring the Jindal sale to Completion, and to our Perth based team for maintaining a strong, efficient, and lean office and for their work in reviewing a large number of projects with both a strategic and technical perspective.
Michael Atkins Chairman 5 March 2015
For
per
sona
l use
onl
y

DIRECTORS REVIEW For the year ended 31 December 2014
3
FRASER RANGE PROJECT (100% Legend; Nickel-Copper, Gold)
The Fraser Range Project covers 409km2, comprising one granted exploration licence (E28/2342)
and two exploration licence applications (E28/2408 and E28/2415). Tenement E28/2342 is located
220km northeast of Nova and 100km south of Tropicana in the Fraser Range District, see Figure 1.
It is considered prospective for Nova style nickel-copper and Tropicana style structurally controlled
gold mineralisation.
Figure 1: Project Location on Regional Aeromagnetic Image
During 2014 a detailed 50m-line spaced aeromagnetic/radiometric survey was completed over
E28/2342 with the primary aim of identifying mafic/ultramafic intrusives, which are known hosts to
nickel-copper mineralisation. A full interpretation of the aeromagnetic data identified seven priority
targets showing magnetic characteristics of possible intrusive mafic/ultramafic bodies, with several
displaying similarities to Sirius’ (ASX:SIR) Nova deposit.
Legend subsequently undertook an extensive moving loop electromagnetic (“MLEM”) survey
designed to test for bedrock conductors associated with these magnetic features.
A total of six targets were surveyed without defining a significant bedrock conductor warranting drill
testing, see Figure 2. The targets tested had a range of magnetic signatures including two large
complex magnetic features in the south and several smaller more discrete features in the north.
For
per
sona
l use
onl
y

DIRECTORS REVIEW For the year ended 31 December 2014
4
The survey encountered large areas with relatively thick conductive cover, highlighting the
ineffectiveness of surficial sampling and the need for remote geophysical exploration methods.
Figure 2: Targets tested with MLEM on aeromagnetic image
PROJECT GENERATION
Legend is actively seeking new project opportunities or acquisitions both within Australia and
overseas. Over 50 projects were reviewed during the course of 2014, with the primary focus on
gold and nickel-copper, whilst also assessing projects from a broad range of commodities.
Legend’s strong financial position and internal expertise enables the company to contemplate
opportunities ranging from early greenfield stage to more advanced projects requiring evaluation
and feasibility studies.
For
per
sona
l use
onl
y

DIRECTORS REVIEW For the year ended 31 December 2014
5
CAMEROON PROJECT SALE
Legend originally announced to the ASX on 20 November 2013 that it had entered into a Share Sale
and Debt Assignment Agreement with a wholly-owned subsidiary of Jindal Steel and Power Limited
for the sale of its Ngovayang Project in Cameroon.
Following satisfaction of a comprehensive schedule of Conditions Precedent, the completion of the sale was announced on 5 August 2014 with the receipt of the $6,000,000 Tranche 1 payment. Legend is scheduled to receive a total of $17.5M in three tranches as outlined below:
Tranche 1 $6M at completion (received)
Tranche 2 $6M in July/August 2015 (unconditional) as confirmed with Jindal on
18 February 2015
Tranche 3 $5.5M payment following execution of a Mining Convention between Jindal
and the Cameroon Government
Pictured at a 2014 meeting in Cameroon: S M Guillaume A Negou Tela (Camina), Mr Mark Wilson (Legend),
H E Philémon Yang (Prime Minister, Head of Government, Republic of Cameroon), Mr Hervinder Singh (Jindal) and Mr Sushil Gupta (Jindal).
Cancellation of Performance Options
Legend shareholder approval to cancel 800 million Performance Options in the company for the
consideration of $1M was obtained at a company General Meeting held on 19 August 2014. The
Performance Options were originally issued as part consideration for the purchase of the Ngovayang
Iron Project in Cameroon and were formally cancelled on 28 August 2014.
The information in this report that relates to Exploration Results is based on information compiled by Mr Derek Waterfield, a Member of the Australian Institute of Geoscientists and a full time employee of Legend Mining Limited. Mr Waterfield has sufficient experience that is relevant to the styles of mineralisation and types of deposit under consideration, and to the activity being undertaken, to qualify as a Competent Person as defined in the 2012 Edition of the “Australasian Code for Reporting of Exploration Results, Mineral Resources and Ore Reserves” (JORC Code). Mr Waterfield consents to the inclusion in the report of the matters based on his information in the form and context in which it appears.
For
per
sona
l use
onl
y
CORPORATE GOVERNANCE STATEMENT
6
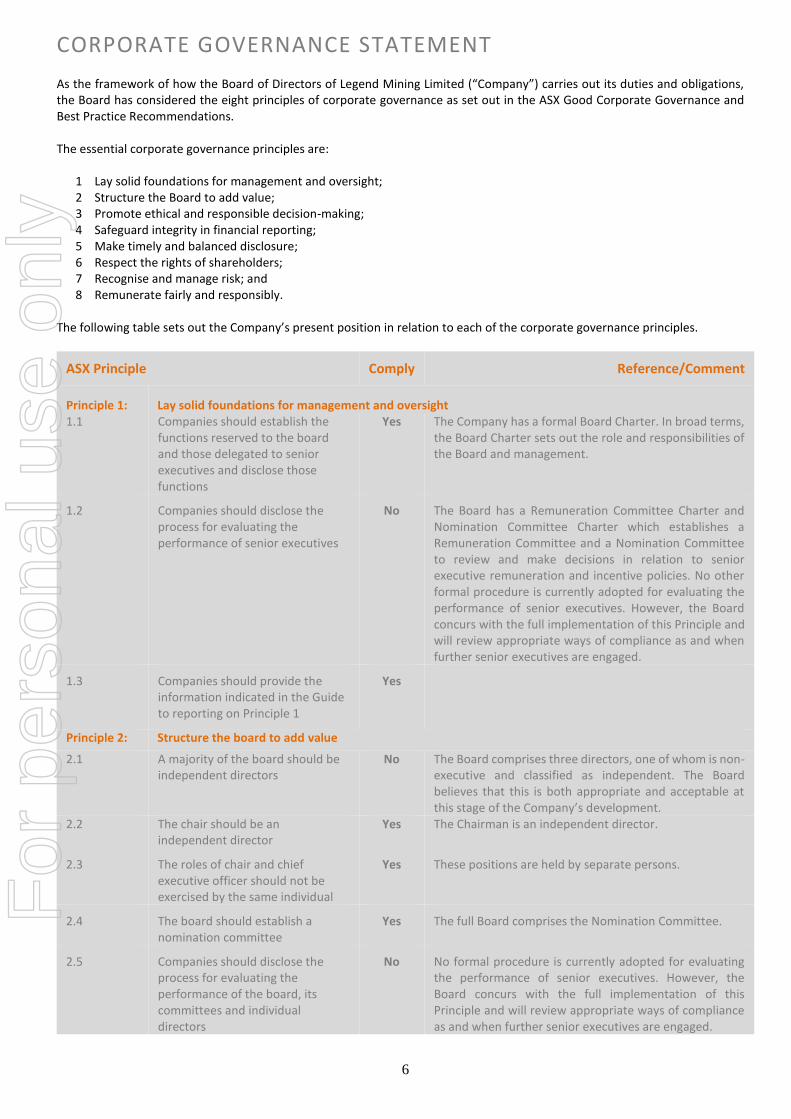
As the framework of how the Board of Directors of Legend Mining Limited (“Company”) carries out its duties and obligations, the Board has considered the eight principles of corporate governance as set out in the ASX Good Corporate Governance and Best Practice Recommendations. The essential corporate governance principles are:
1 Lay solid foundations for management and oversight; 2 Structure the Board to add value; 3 Promote ethical and responsible decision-making; 4 Safeguard integrity in financial reporting; 5 Make timely and balanced disclosure; 6 Respect the rights of shareholders; 7 Recognise and manage risk; and 8 Remunerate fairly and responsibly.
The following table sets out the Company’s present position in relation to each of the corporate governance principles.
ASX Principle Comply Reference/Comment
Principle 1: Lay solid foundations for management and oversight 1.1 Companies should establish the
functions reserved to the board and those delegated to senior executives and disclose those functions
Yes The Company has a formal Board Charter. In broad terms, the Board Charter sets out the role and responsibilities of the Board and management.
1.2 Companies should disclose the process for evaluating the performance of senior executives
No The Board has a Remuneration Committee Charter and Nomination Committee Charter which establishes a Remuneration Committee and a Nomination Committee to review and make decisions in relation to senior executive remuneration and incentive policies. No other formal procedure is currently adopted for evaluating the performance of senior executives. However, the Board concurs with the full implementation of this Principle and will review appropriate ways of compliance as and when further senior executives are engaged.
1.3 Companies should provide the information indicated in the Guide to reporting on Principle 1
Yes
Principle 2: Structure the board to add value
2.1 A majority of the board should be independent directors
No The Board comprises three directors, one of whom is non-executive and classified as independent. The Board believes that this is both appropriate and acceptable at this stage of the Company’s development.
2.2 The chair should be an independent director
Yes The Chairman is an independent director.
2.3 The roles of chair and chief executive officer should not be exercised by the same individual
Yes These positions are held by separate persons.
2.4 The board should establish a nomination committee
Yes The full Board comprises the Nomination Committee.
2.5 Companies should disclose the process for evaluating the performance of the board, its committees and individual directors
No No formal procedure is currently adopted for evaluating the performance of senior executives. However, the Board concurs with the full implementation of this Principle and will review appropriate ways of compliance as and when further senior executives are engaged.
For
per
sona
l use
onl
y

CORPORATE GOVERNANCE STATEMENT
7
ASX Principle Comply Reference/Comment
2.6 Companies should provide the information indicated in the Guide to reporting on Principle 2
Yes The skills and experience of Directors, as well as each Director’s period of office, are set out in the Company’s Annual Report and on its website.
Principle 3: Promote ethical and responsible decision-making
3.1 Companies should establish a code of conduct and disclose the code
Yes The board has established a Code of Conduct which all employees and directors are expected to follow. The code of conduct outlines how the Company expects directors and employees of the Company to behave and conduct business in the workplace.
3.2 Companies should establish a policy concerning diversity and disclose the policy or a summary of that policy. The policy should include requirements for the Board to establish measurable objectives for achieving gender diversity and for the Board to assess annually both the objectives and progress in achieving them
No The Company has established a Diversity Policy. The Company recognises that a diverse and talented workforce is a competitive advantage and encourages a culture that embraces diversity. Given the Company’s size and stage of development as an exploration company, the Board does not think it is yet appropriate to include measurable objectives in relation to gender. As the Company grows and requires more employees, the Company will review this policy and amend as appropriate.
3.3
Companies should disclose in each annual report the measurable objectives for achieving gender diversity set by the Board in accordance with the diversity policy and progress towards achieving them
No The Company has established a Diversity Policy.
3.4 Companies should disclose in each annual report the proportion of women employees in the whole organisation, women in senior executive positions and women on the board.
Yes The Company has one female employee in the Perth office who is in a senior executive position however there are no female representatives on the Board. The Board considers this is not inappropriate
3.5 Companies should provide the information indicated in the Guide to reporting on Principle 3
Yes
Principle 4: Safeguard integrity in financial reporting
4.1 The board should establish an audit committee
Yes
4.2 The audit committee should be structured so that it:
• consists only of non-executive directors
No The full Board comprise the Audit Committee and Risk Committee. The composition of these committees is considered appropriate at this stage of the Company’s development.
• consists of a majority of independent directors
No Refer previous comment.
• is chaired by an independent chair, who is not chair of the board
No The size and composition of the Board prevents membership of the audit committee being structured to comply with this Recommendation. The Board supports the concept proposed by the recommendations and will look to review the composition of this Committee as the Company’s grows.
• has at least three members
For
per
sona
l use
onl
y

CORPORATE GOVERNANCE STATEMENT
8
ASX Principle Comply Reference/Comment
4.3 The audit committee should have a formal charter
Yes
4.4
Companies should provide the information indicated in the Guide to reporting on Principle 4
Yes
Principle 5: Make timely and balanced disclosure
5.1
Companies should establish written policies designed to ensure compliance with ASX Listing Rule disclosure requirements and to ensure accountability at a senior executive level for that compliance
Yes The Company has adopted a formal Continuous Disclosure Policy to ensure that the Company achieves best practice in complying with its continuous disclosure obligations under the Corporations Act and ASX Listing Rules.
5.2 Companies should provide the information indicated in the Guide to reporting on Principle 5
Yes
Principle 6: Respect the rights of shareholders
6.1 Companies should design a communications policy for promoting effective communication with shareholders and encouraging their participation at general meetings
Yes The Company has a Shareholder Communication Policy. The Policy specifically encourages full participation of shareholders at the Annual General Meeting to ensure a high level of accountability and identification with the Company’s strategy and goals. The Shareholder Communication Policy also outlines the various ways in which the Company communicates with shareholders.
6.2 Companies should provide the information indicated in the Guide to reporting on Principle 6
Yes
Principle 7: Recognise and manage risk
7.1 Companies should establish policies for the oversight and management of material business risks
Yes The Company has established a Risk Management Policy which sets out the way the Committee can identify, assess, monitor and change operational, compliance and material business risks.
7.2 The board should require management to design and implement the risk management and internal control system to manage the company’s material business risks and report to it on whether those risks are being managed effectively
No The full Board comprise the Risk Committee. The Committee is responsible for overseeing and approving risk management strategy and policies, internal compliance and non-financial internal control.
7.3 The board should disclose whether it has received assurance from the chief executive officer (or equivalent) and the chief financial officer (or equivalent) that the declaration provided in accordance with section 295A of the Corporations Act is founded on a sound system of risk management and internal control and that the system is operating effectively in all material respects in relation to financial reporting risks
Yes The Board has received the required assurance and declaration.
For
per
sona
l use
onl
y

CORPORATE GOVERNANCE STATEMENT
9
ASX Principle Comply Reference/Comment
7.4 Companies should provide the information indicated in the Guide to reporting on Principle 7
Yes
Principle 8: Remunerate fairly and responsibly
8.1 The board should establish a remuneration committee
Yes The Company has established a Remuneration Committee.
8.2 The remuneration committee should be structured so that it:
• consists of a majority of
independent directors
No The Company has established a Remuneration Committee, comprised of the full Board. The size and composition of the Board prevents membership of the remuneration committee being structured to comply with this Recommendation. The Board supports the concept proposed by the recommendations and will look to review the composition of this Committee as the Company’s grows.
• has at least three members No The size and composition of the Board prevents membership of the remuneration committee being structured to comply with this Recommendation.
• is chaired by an independent
director No The size and composition of the Board prevents
membership of the remuneration committee being structured to comply with this Recommendation. The Board supports the concept proposed by the recommendations and will look to review the composition of this Committee as the Company’s grows.
8.3 Companies should clearly distinguish the structure of non-executive directors’ remuneration from that of executive directors and senior executives
No The Remuneration Committee operates under the Remuneration Committee Charter. The Charter states that no executive is to be directly involved in deciding their own remuneration and that, when making recommendations to the Board, the Committee should clearly distinguish the structure of non-executive directors’ remuneration from that of executive directors.
8.4 Companies should provide the information indicated in the Guide to reporting on Principle 8
Yes
For
per
sona
l use
onl
y

DIRECTORS’ REPORT For the year ended 31 December 2014
10
The Directors submit their report for the year ended 31 December 2014.
1. DIRECTORS
The names and details of the Company’s directors in office during the financial year and until the date of this report are as below. Directors were in office for this entire period unless otherwise stated.
Michael Atkins (Chairman, Non-Executive Director)
Mark Wilson (Managing Director)
Derek Waterfield (Executive Director - Technical)
2. INFORMATION ON DIRECTORS AND COMPANY SECRETARY
Michael Atkins is a Fellow of the Australian Institute of Company Directors.
Mr Atkins was a founding partner of a national Chartered Accounting practice from 1979 to 1987 and was a Fellow of the Institute of Chartered Accountants in Australia between 1984 and 2012.
Between 1987 and 1998 he was involved in the executive management of several publicly listed resource companies with operations in Australia, USA, South East Asia and Africa. From 1990 to 1995 he was managing director and later a non-executive director of Claremont Petroleum NL and Beach Petroleum NL during their reconstruction, and then remained as a non-executive director until 1995. He was also founding executive chairman of Gallery Gold Ltd until 1998, and remained a non-executive director until 2000.
Since February 2011 Mr Atkins has been a Director – Corporate Finance at Patersons Securities Limited where he advises on the formation of, and capital raising for, emerging companies in the Australia resources sector.
He is currently non-executive chairman of Australian listed company Azumah Resources Ltd and non-executive director of SRG Limited.
During the past three years, Mr Atkins has also served as a director of Westgold Resources Ltd (resigned October 2012) and Enterprise Uranium Limited (resigned March 2014), both publicly listed companies
Mark Wilson is a Member of the Institution of Engineers, Australia and a Chartered Professional Engineer with an Associateship in Civil Engineering from Curtin University in Western Australia. He has an extensive business background, mainly in corporate management and project engineering. This has included site management of remote construction projects, ten years of commercial construction as a founding proprietor of a Perth based company and the past twenty years in executive, non-executive, consulting and owner roles in resource focused companies. Mr Wilson is presently a non-executive director of Australian listed company Tanga Resources Limited (appointed 20 June 2014). During the past three years Mr Wilson held the position of non-executive director of Eureka Energy Limited (resigned March 2012).
Derek Waterfield is a Member of the Australian Institute of Geoscientists and a graduate of the University of Queensland (B.Sc. Hons). He has over 25 years experience in gold, base metals, iron ore, nickel and uranium exploration throughout Australia and Cameroon.
He started his career with CRA Exploration Pty Ltd and has held senior exploration leadership positions with Normandy Mining and Newmont Australia, and led the team that discovered the Moolart Well gold deposit in the Duketon Belt 350km north of Kalgoorlie. He was Exploration Manager at Legend Mining for five years managing Legend’s WA and Cameroon projects. More recently he has been Exploration Manager for Enterprise Metals Ltd, responsible for gold, iron ore, uranium and base metal exploration in WA. Mr Waterfield has not held any former public company directorships in the last 3 years.
Dennis Wilkins (Company Secretary) is the founder and principal of DWCorporate Pty Ltd a leading privately held corporate advisory firm servicing the natural resources industry.
Since 1994 he has been a director of, and involved in the executive management of, several publicly listed resource companies with operations in Australia, PNG, Scandinavia and Africa. From 1995 to 2001 he was the Finance Director of Lynas Corporation Ltd during the period when the Mt Weld Rare Earths project was acquired by the group. He was also founding director and advisor to Atlas Iron Limited at the time of Atlas’ initial public offering in 2006.
Since July 2001 Mr Wilkins has been running DWCorporate Pty Ltd where he advises on the formation of, and capital raising for, emerging companies in the Australian resources sector.
He is currently a non-executive director of Australian listed companies A1 Consolidated Gold Limited and Key Petroleum Ltd.
For
per
sona
l use
onl
y

DIRECTORS’ REPORT For the year ended 31 December 2014
11
3. EARNINGS PER SHARE
Basic loss per share: 0.128 cents
Diluted loss per share: 0.128 cents
4. DIVIDENDS
No dividend has been paid or recommended during the financial year.
5. CORPORATE INFORMATION
Corporate Structure
Legend Mining Limited is a company limited by shares that is incorporated and domiciled in Australia. Legend Mining Limited has prepared a consolidated financial report incorporating the entities that it controlled during the financial year, which are outlined in the following illustration of the group’s corporate structure.
Nature of Operations and Principal Activities
The principal activities during the year of the entities within the consolidated entity were:
exploration for nickel, copper, gold and iron deposits in Australia and Cameroon.
Employees
The consolidated entity had a staff of 4 employees at 31 December 2014 (2013: 32 employees).
6. OPERATING AND FINANCIAL REVIEW
Results of Operations
The net loss after income tax of the consolidated entity for the year was $2,618,326 (2013: $38,412,494).
Review of Operations
The Directors’ Review of Activities for the year ended 31 December 2014 is contained on pages 3 to 5 of the Annual Report.
Summarised Operating Results
Impairment of Deferred Exploration Costs: Impairment of deferred expenditure during the year amounted to $1,105,212 and was expensed to the income statement (2013: $36,829,394).
Deferred Exploration Costs: Total deferred expenditure on tenements capitalised during the year amounted to $326,339 (2013: $2,712,353 ).
Legend Mining Limited
100%
Gibson Metals Pty Ltd
100%
Legend Cameroon Pty Ltd
For
per
sona
l use
onl
y

DIRECTORS’ REPORT For the year ended 31 December 2014
12
7. SIGNIFICANT CHANGES IN THE STATE OF AFFAIRS
During 2014 Legend has:
Completed the sale of Legend’s 90% interest in Camina SA, the holding company of the Ngovayang Project in the Republic of Cameroon (the “Transaction”). The sale was implemented by the sale of 100% of Legend’s wholly-owned British Virgin Islands subsidiary, Legend Iron Limited, and transfer of intercompany debts (refer note 11).
Reviewed the carrying value of the Group’s projects in West Africa, and recognised impairment of $1,105,212, prior to completion of the sale.
8. ENVIRONMENTAL REGULATION AND PERFORMANCE
The consolidated entity’s operations are subject to various environmental regulations under both Commonwealth and State legislation in Australia and legislation in Cameroon. The Directors have complied with these regulations and are not aware of any breaches of the legislation during the financial year which are material in nature.
9. LIKELY DEVELOPMENTS AND EXPECTED RESULTS
Likely developments in the operations of the consolidated entity, and expected results of those operations in subsequent financial years have been discussed, where appropriate, in the Chairman’s Report and Review of Activities.
10. SHARE OPTIONS
Unissued shares
As at the date of this report, there were 30,000,000 unissued ordinary shares under options. Refer to note 18 for further details of the options outstanding.
Option holders do not have any right, by virtue of the option, to participate in any share issue of the company or any related body corporate.
Shares issued as a result of the exercise of options
There were no shares issued as a result of the exercise of options during the financial year.
11. SIGNIFICANT EVENTS AFTER THE BALANCE DATE
No matter or circumstance has arisen since the end of the financial year which has significantly affected, or may significantly affect the operations of the Group, the result of those operations, or the state of affairs of the Group in subsequent financial years.
12. INDEMNIFICATION AND INSURANCE OF DIRECTORS AND OFFICERS
The Company has not, during or since the financial year, in respect of any person who is or has been an officer of the Company or a related body corporate:
(i) indemnified or made any relevant agreement for indemnifying against a liability incurred as an officer, including costs and expenses in successfully defending legal proceedings; or
(ii) paid or agreed to pay a premium in respect of a contract insuring against a liability incurred as an officer for the costs or expenses to defend legal proceedings.
13. INDEMNIFICATION OF AUDITORS
To the extent permitted by law, the Company has agreed to indemnify its auditors, Ernst & Young Australia, as part of the terms of its audit engagement agreement against claims by third parties arising from the audit (for an unspecified amount). No payment has been made to indemnify Ernst & Young during or since the financial year.
14. REMUNERATION REPORT (AUDITED)
The compensation arrangements in place for key management personnel of Legend are set out below:
Details of key management personnel
Directors M Atkins Chairman (non-executive)
M Wilson Managing Director
D Waterfield Executive Director - Technical
D Ryan Non-Executive Director (resigned 23 October 2013)
For
per
sona
l use
onl
y

DIRECTORS’ REPORT For the year ended 31 December 2014
13
14. REMUNERATION REPORT (CONTD)
Compensation Philosophy
The performance of the Company depends upon the quality of its directors and executives. To prosper, the Company must attract, motivate and retain highly skilled directors and executives.
The Company embodies the following principle in its compensation framework:
Provide competitive rewards to attract high-calibre executives.
Group Performance
The Group’s financial performance for the last five years has been as follows:
December 2014
December 2013
December 2012
December 2011
December 2010
Revenue $371,332 $280,734 $602,416 $780,553 $915,567 Net profit/(loss) after tax ($2,618,326) ($38,412,494) $2,215,446 ($4,250,169) $1,124,126 Basic earnings/(loss) per share (cents per share)
(0.128) (1.769) 0.112 (0.241) 0.075
Diluted earnings/(loss) per share (cents per share)
(0.128) (1.769) 0.112 (0.214) 0.075
Net assets $17,067,286 $22,354,576 $51,900,776 $49,575,238 $48,320,287
Share price (at balance date) $0.007 $0.008 $0.02 $0.03 $0.06
As the Group is currently in exploration and evaluation phases, historical earnings are not yet an accurate reflection of Group performance and cannot be used as a long term incentive measure. Consideration of the Group’s earnings will be more relevant as the Group matures.
Remuneration Committee
Due to the size of Legend, remuneration is considered by the full Board. The Board reviews remuneration packages and policies applicable to the directors and senior executives. Remuneration levels are competitively set to attract the most qualified and experienced directors and senior executives.
Compensation Structure
In accordance with best practice corporate governance, the structure of non-executive director and senior manager remuneration is separate and distinct.
Objective of Non-Executive Director Compensation
The Board seeks to set aggregate compensation at a level that provides the company with the ability to attract and retain directors of the highest calibre, whilst incurring a cost that is acceptable to shareholders.
Structure of Non-Executive Director Compensation
The Constitution and the ASX Listing Rules specify that the aggregate compensation of non-executive directors shall be determined from time to time by a general meeting. An amount not exceeding the amount determined is then divided between the directors as agreed. The latest determination was at the Annual General Meeting held on 16 May 2012 when shareholders approved the aggregate remuneration of $300,000 per year.
The amount of aggregate compensation sought to be approved by shareholders and the manner in which it is apportioned amongst directors is reviewed annually. The Board considers the fees paid to non-executive directors of comparable companies when undertaking the annual review process.
Objective of Senior Management and Executive Director Compensation
The company aims to reward executives with a level and mix of compensation commensurate with their position and responsibilities within the company and so as to:
reward executives for company and individual performance against targets set by reference to appropriate benchmarks;
align the interests of executives with those of shareholders; and
ensure total compensation is competitive by market standards.
Structure of Senior Management and Executive Director Compensation
In determining the level and make-up of executive compensation, the Board may engage external consultants to provide independent advice. No external advice was obtained during the 2014 year.
For
per
sona
l use
onl
y

DIRECTORS’ REPORT For the year ended 31 December 2014
14
14. REMUNERATION REPORT (CONTD)
It is the Board’s policy that an employment contract is entered into with key executives.
Compensation consists of a fixed compensation element and the issue of options from time to time at the directors’ discretion under the Employee Share Option Plan. Any issue of options to directors under the Employee Share Option Plan requires prior shareholder approval.
Fixed Compensation
Fixed compensation is reviewed annually by the Board. The process consists of a review of company and individual performance, relevant comparative compensation in the market and internally and, where appropriate, external advice on policies and practices. No external advice was obtained during the 2014 year.
Structure
Senior managers are given the opportunity to receive their fixed (primary) compensation in a variety of forms including cash and fringe benefits. It is intended that the manner of payment chosen will be optimal for the recipient without creating undue cost for the Company.
Employment Contracts
The Managing Director, Mr Mark Wilson, is employed under contract. The current contract commenced on 1 July 2011 and is effective until terminated in accordance with the contract. The significant terms of the contract are:
Mr Wilson receives remuneration of $320,000 per annum exclusive of superannuation;
Mr Wilson may resign from his position and thus terminate his contract by giving one month written notice;
The company may terminate Mr Wilson’s employment contract by providing six months’ written notice if the position has become redundant, or three months’ written notice in all other circumstances; and
The Company may terminate Mr Wilson’s contract at any time without notice if serious misconduct has occurred.
Mr Michael Atkins, is employed under contract. The current contract commenced on 1 July 2012 and is effective until terminated in accordance with the contract. The significant terms of the contract are:
Mr Atkins receives remuneration of $80,000 per annum exclusive of superannuation;
Mr Atkins’ agreement provides for engagement of consultancy services outside of the scope of the ordinary duties of a non-executive chairman. In addition to the director’s fees above, Mr Atkins is paid $2,000 per day (inclusive of superannuation) for the provision of these consultancy services.
Mr Atkins’ appointment is contingent upon satisfactory performance and successful re-election by shareholders of the Company;
Mr Atkins may resign from his position and thus terminate his contract by giving written notice; and
The Company may terminate Mr Atkins’ contract by way of resolution of the Company.
Mr Derek Waterfield, is employed under contract. The current contract commenced on 1 November 2012 and is effective until terminated in accordance with the contract. The significant terms of the contract are:
Mr Waterfield receives remuneration of $220,000 per annum exclusive of superannuation;
Mr Waterfield may resign from his position and thus terminate his contract by giving one month written notice;
The company may terminate Mr Waterfield’s employment contract by providing three months’ written notice if the position has become redundant, or one months’ written notice in all other circumstances; and
The Company may terminate Mr Waterfield’s contract at any time without notice if serious misconduct has occurred.
Employee Share Option Plan
The Board has in place an Employee Share Option Plan allowing share options to be issued to eligible employees in order to provide them with an incentive to provide growth and value to all shareholders.
At a General Meeting on 4 December 2009 shareholders approved the implementation of Employee Share Option Plan No 3. The new plan differs from the previous plans in that there is no 12 month vesting period on any new options received under plan No 3. There is a significant change in the context of recent proposals by the Federal Government to change the tax treatment of options issued under incentive schemes. Removal of the vesting period requirement allows the Board maximum flexibility to make offers of options on the terms of the plans appropriate at the time, having regard for the tax environment which the proposed participants find themselves in when an offer of options is received from the company.
For
per
sona
l use
onl
y

DIRECTORS’ REPORT For the year ended 31 December 2014
15
14. REMUNERATION REPORT (CONTD)
Compensation of Key Management Personnel for Year Ended 31 December 2014
Name
Year
Short term Salary and
Fees(1)
$
Post Employment
Super- annuation
$
Share based payments
options
$
Total
$
% of compen-
sation granted as
options
% of performance
related remuneration
Director
M Atkins 2014 80,000 7,500 - 87,500 - -
2013 87,200(2) 7,966 - 95,166 - -
M Wilson 2014 349,949 30,000 - 379,949 - -
2013 348,720 29,200 - 377,920 - -
D Waterfield 2014 222,538 20,625 - 243,163 - -
2013 226,770 20,075 - 246,845 - -
D Ryan 2014 - - - - - -
2013(3) 40,000 3,640 - 43,640 - -
Total 2014 652,487 58,125 - 710,612 - -
2013 702,690 60,881 - 763,571 - - (1) Short term salary and fees includes net movements in leave provisions. (2) These amounts include $nil (2013: $7,200) for consultancy services outside of the scope of the ordinary duties of a non-executive chairman. (3) Mr Dermot Ryan resigned on 23 October 2013.
Option holdings of Key Management Personnel(1)
Options held in Legend Mining Limited (number) during the year ended 31 December 2014
Name Balance at beginning
of year 1 Jan 2014
Granted as Remuneration
Exercised during
the year
Net Change Other
Balance at end
of year 31 Dec 2014
Not Vested & Not
Exercisable
Vested & Exercisable
Directors
M Atkins 5,000,000 - - - 5,000,000 - 5,000,000
M Wilson 55,000,000 - - - 55,000,000 - 55,000,000
D Waterfield 3,000,000 - - (2)(3,000,000) - - -
Total 63,000,000 - - (3,000,000) 60,000,000 - 60,000,000
(1) Includes options held directly, indirectly and beneficially by KMP. (2) Options expired unexercised.
Shareholdings of Key Management Personnel(1)
Shares held in Legend Mining Limited (number) during the year ended 31 December 2014 Name Balance
1 Jan 14 Granted as
remuneration On exercise of options
Net change other
Balance 31 Dec 14
Directors
M Atkins (Windamurah P/L), (Alkali Exploration P/L)
4,558,334 - - - 4,558,334
M Wilson (Chester Nominees WA P/L)
45,000,000 - - (2)25,000,000 70,000,000
D Waterfield 1,000,000 - - - 1,000,000
Total 50,558,334 - - 25,000,000 75,558,334
(1) Includes options held directly, indirectly and beneficially by KMP. (2) On-market purchases made during the year.
END OF REMUNERATION REPORT
For
per
sona
l use
onl
y

DIRECTORS’ REPORT For the year ended 31 December 2014
16
15. DIRECTORS’ MEETINGS
The number of Meetings of Directors held during the year and the number of Meetings attended by each Director was as follows:
Name
No. of Meetings Attended
No. of Meetings Held Whilst A Director
Attended by:
Michael Atkins 8 8
Mark Wilson 8 8
Derek Waterfield 8 8
16. DIRECTORS’ INTERESTS
The relevant interest of each director in the shares and options issued by the company in accordance with the Corporations Act 2001, at the date of signing this report is as follows:
Name Ordinary shares Options over ordinary shares
M Atkins (Windamurah P/L), (Alkali Exploration P/L)
4,558,334 -
M Wilson (Chester Nominees WA P/L)
78,000,000 -
D Waterfield 1,000,000 -
17. AUDITOR INDEPENDENCE AND NON-AUDIT SERVICES
Non-audit services
There were no non-audit services provided by the Company’s auditor, Ernst & Young during the 2014 financial year.
We have received the Declaration of Auditor Independence from Ernst & Young, the Company’s Auditor. This is available for review on page 52 and forms part of this report.
SIGNED in accordance with a Resolution of the Directors on behalf of the Board
__________________________ Mark Wilson Managing Director Dated this 5th day of March 2015
For
per
sona
l use
onl
y

CONSOLIDATED STATEMENT OF COMPREHENSIVE INCOME FOR THE YEAR ENDED 31 DECEMBER 201 4
17
Note
2014
$
2013
$
Continuing operations
Finance revenue 4(a) 371,332 280,734
Other income 4(b) 874,340 52,266
Employee benefits expense 4(c) (888,997) (876,682)
Impairment of deferred exploration costs 4(d) (1,105,212) (36,829,394)
Other expenses 4(e) (1,080,108) (278,728)
Corporate and administration expenses 4(f) (816,039) (1,137,170)
Net loss before income tax (2,644,684) (38,788,974)
Income tax benefit 6 26,358 376,480
Net loss for the year (2,618,326) (38,412,494)
Other comprehensive income
Items that may be reclassified to profit or loss
Exchange differences on translation of foreign operations (920,688) 8,016,807
Exchange differences realised on disposal of foreign operations (2,576,839) -
Items that will not be reclassified to profit or loss
Non-controlling interest in exchange differences on translation of foreign operations
(102,395) 890,756
Other comprehensive (loss)/income for the year, net of tax (3,599,922) 8,907,563
Total comprehensive loss for the year (6,218,248) (29,504,931)
Net loss attributable to:
Members of Legend Mining Limited (2,507,805) (34,729,555)
Non-controlling interest (110,521) (3,682,939)
(2,618,326) (38,412,494)
Total comprehensive loss attributable to:
Members of Legend Mining Limited (6,005,332) (26,712,748)
Non-controlling interest (212,916) (2,792,183)
(6,218,248) (29,504,931)
EARNINGS PER SHARE (cents per share)
Basic loss per share 5 (0.128) (1.769)
Diluted loss per share 5 (0.128) (1.769)
The accompanying notes form part of these financial statements
For
per
sona
l use
onl
y

CONSOLIDATED STATEMENT OF FINANCIAL POSITION AS AT 31 DECEMBER 2014
18
Notes
2014
$
2013
$
ASSETS
Current Assets
Cash and cash equivalents 8 6,937,339 4,652,135
Trade & other receivables 9 5,797,098 32,480
Other financial assets 10 4,161,900 3,727,050
16,896,337 8,411,665
Assets of disposal group classified as held for sale 11 - 14,076,514
Total Current Assets 16,896,337 22,488,179
Non-current Assets
Other financial assets 10 50,000 50,000
Property, plant & equipment 12 47,920 62,624
Deferred exploration costs 13 393,318 66,979
Total Non-current Assets 491,238 179,603
TOTAL ASSETS 17,387,575 22,667,782
LIABILITIES
Current Liabilities
Trade & other payables 14 140,105 166,920
Provisions 15 130,229 103,498
Total Current Liabilities 270,334 270,418
Non-current Liabilities
Provisions 15 49,955 42,788
Total Non-current Liabilities 49,955 42,788
TOTAL LIABILITIES 320,289 313,206
NET ASSETS 17,067,286 22,354,576
EQUITY
Equity attributable to equity holders of the parent
Contributed Equity 16 59,801,531 59,818,890
Reserves 17 22,417,578 22,417,578
Reserves attributable to disposal group classified as held for sale 11 - 3,497,527
Accumulated losses (65,151,823) (62,644,018)
Total parent entity interest 17,067,286 23,089,977
Non-controlling interests - (735,401)
TOTAL EQUITY 17,067,286 22,354,576
The accompanying notes form part of these financial statements
For
per
sona
l use
onl
y

CONSOLIDATED STATEMENT OF CASH FLOWS FOR THE YEAR ENDED 31 DECEMBER 201 4
19
CASH FLOWS FROM OPERATING ACTIVITIES Note
2014
$ 2013
$
Receipts from customers - 52,266
Payments to suppliers and employees (1,773,675) (1,915,420)
Interest received 168,492 275,124
Income taxes refunded/(paid) 22,003 (1,203,513)
Payments for cancellation of performance options (1,000,000) -
Net cash flows used in operating activities 21(ii) (2,583,180) (2,791,543)
CASH FLOWS FROM INVESTING ACTIVITIES
Proceeds on sale of subsidiaries 11 5,775,000 -
Proceeds from sale of property, plant & equipment & scrap - 6,565
Purchase of property, plant & equipment 12 (10,316) (49,560)
Payment for the purchase of investments (67,258) -
Proceeds from the sale of investments 137,079 -
Payment for exploration and evaluation (966,121) (2,446,025)
Refund of performance bonds - 16,134
Net cash flows (used in)/from investing activities 4,868,384 (2,472,886)
CASH FLOWS FROM FINANCING ACTIVITIES
Payments for share buy-back - (42,389)
Net cash flows used in financing activities - (42,389)
Net increase/(decrease) in cash and cash equivalents 2,285,204 (5,306,818)
Cash and cash equivalents at the beginning of year 4,652,135 9,958,535
Effects of exchange rate movements on cash and cash equivalents - 418
Cash and cash equivalents at end of year 21(i) 6,937,339 4,652,135
The accompanying notes form part of these financial statements
For
per
sona
l use
onl
y
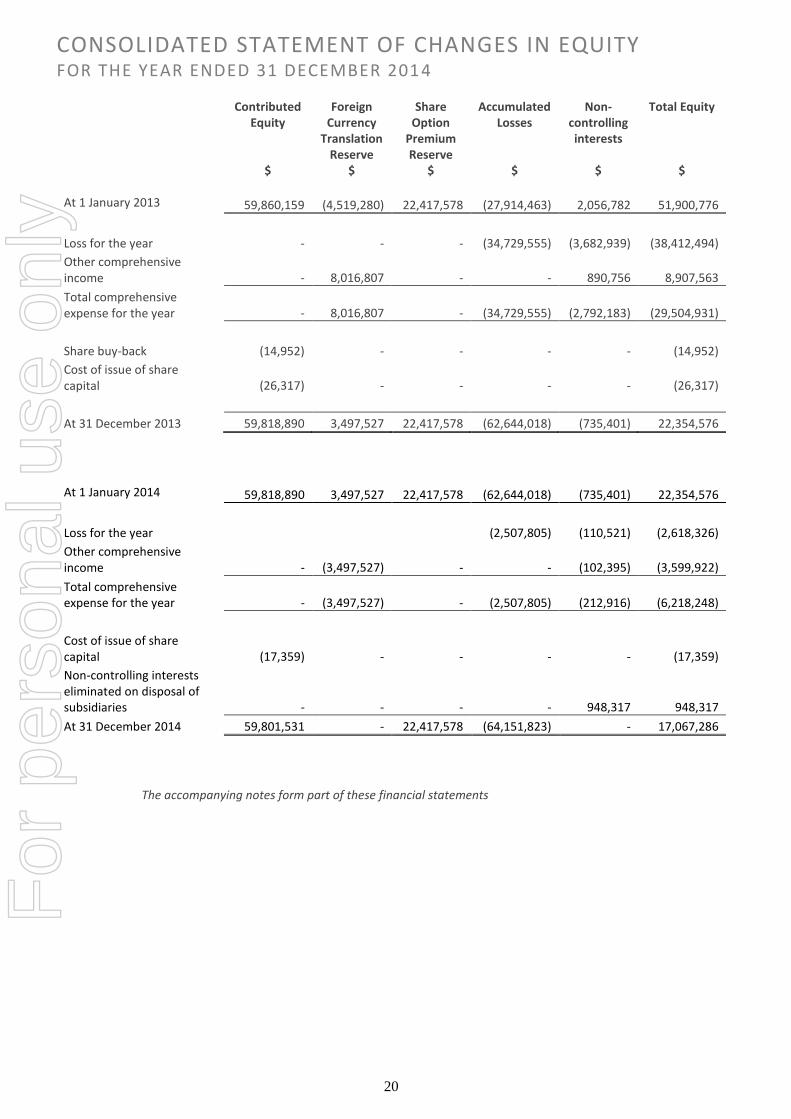
CONSOLIDATED STATEMENT OF CHANGES IN EQUITY FOR THE YEAR ENDED 31 DECEMBER 201 4
20
Contributed Equity
Foreign Currency
Translation Reserve
Share Option
Premium Reserve
Accumulated Losses
Non-controlling interests
Total Equity
$ $ $ $ $ $ At 1 January 2013 59,860,159 (4,519,280) 22,417,578 (27,914,463) 2,056,782 51,900,776
Loss for the year - - - (34,729,555) (3,682,939) (38,412,494)
Other comprehensive income - 8,016,807 - - 890,756 8,907,563
Total comprehensive expense for the year - 8,016,807 - (34,729,555) (2,792,183) (29,504,931)
Share buy-back (14,952) - - - - (14,952)
Cost of issue of share capital (26,317) - - - - (26,317)
At 31 December 2013 59,818,890 3,497,527 22,417,578 (62,644,018) (735,401) 22,354,576
At 1 January 2014 59,818,890 3,497,527 22,417,578 (62,644,018) (735,401) 22,354,576
Loss for the year (2,507,805) (110,521) (2,618,326)
Other comprehensive income - (3,497,527) - - (102,395) (3,599,922)
Total comprehensive expense for the year - (3,497,527) - (2,507,805) (212,916) (6,218,248)
Cost of issue of share capital (17,359) - - - - (17,359)
Non-controlling interests eliminated on disposal of subsidiaries - - - - 948,317 948,317
At 31 December 2014 59,801,531 - 22,417,578 (64,151,823) - 17,067,286
The accompanying notes form part of these financial statements
For
per
sona
l use
onl
y

NOTES TO THE FINANCIAL STATEMENTS FOR THE YEAR ENDED 31 DECEMBER 2014
21
NOTE 1: CORPORATE INFORMATION
The consolidated financial statements of Legend Mining Limited and its subsidiaries (collectively, the Group) for the year ended 31 December 2014 were authorised for issue in accordance with a resolution of the Directors on 5 March 2015.
Legend Mining Limited (the Company or the parent) is a for profit company limited by shares incorporated in Australia whose shares are publicly traded on the Australian Securities Exchange.
The nature of the operations and principal activities of the Group are described in note 3.
NOTE 2: SIGNIFICANT ACCOUNTING POLICIES
Basis of preparation
The financial report is a general-purpose financial report, which has been prepared in accordance with the requirements of the Corporations Act 2001, Australian Accounting Standards and other authoritative pronouncements of the Australian Accounting Standards Board. The financial report has also been prepared on a historical cost basis, except for certain financial assets carried at fair value and the disposal group classified as held for sale which was measured at the lower of cost and fair value less costs to sell.
The financial report is presented in Australian dollars and all values are expressed as whole dollars.
The consolidated financial statements have been prepared on a going concern basis which assumes the continuity of normal business activity and the realisation of assets and settlement of liabilities in the ordinary course of business.
Compliance with IFRS
The financial report also complies with International Financial Reporting Standards (‘IFRS’) as issued by the International Accounting Standards Board.
Changes in accounting policy, disclosures, standards and interpretations
The accounting policies adopted are consistent with those of the previous financial year except as follows:
(i) New and amended standards and interpretations
The Group has adopted all new and amended Australian Accounting Standards and AASB Interpretations effective as of 1 January 2014, including:
AASB 2011-4 Amendments to Australian Accounting Standards to Remove Individual Key Management Personnel Disclosure Requirements [AASB 124]
AASB 2012-3 Amendments to Australian Accounting Standards – Offsetting Financial Assets and Financial Liabilities
AASB 2013-3 Amendments to AASB 136 – Recoverable Amount Disclosures for Non-Financial Assets
AASB 1031 Materiality
AASB 2013-9 Amendments to Australian Accounting Standards – Conceptual Framework, Materiality and Financial Instruments (Part B)
The nature and impact of each new standard and interpretation affecting the Group is described below:
AASB 2011-4 Amendments to Australian Accounting Standards to Remove Individual Key Management Personnel Disclosure Requirements [AASB 124] (applicable for annual reporting periods commencing on or after 1 January 2014).
This amendment deletes from AASB 124 individual key management personnel disclosure requirements for disclosing entities that are not companies. It also removes the individual KMP disclosure requirements for all disclosing entities in relation to equity holdings, loans and other related party transactions.
This amendment has resulted in reduced disclosures in the Group’s financial statements.
AASB 2013-3 Amendments to AASB 136 – Recoverable Amount Disclosures for Non-Financial Assets (applicable for annual reporting periods commencing on or after 1 January 2014).
AASB 2013-3 amends the disclosure requirements in AASB 136 Impairment of Assets. The amendments include the requirement to disclose additional information about the fair value measurement when the recoverable amount of impaired assets is based on fair value less costs of disposal.
This amendment has resulted in changes to disclosures in the Group’s financial statements.
For
per
sona
l use
onl
y

NOTES TO THE FINANCIAL STATEMENTS FOR THE YEAR ENDED 31 DECEMBER 2014
22
NOTE 2: SIGNIFICANT ACCOUNTING POLICIES (CONTD)
(ii) Accounting Standards and Interpretations issued but not yet effective
Australian Accounting Standards and Interpretations that have recently been issued or amended but are not yet effective and have not been adopted by the Group for the annual reporting period ending 31 December 2014 are outlined below:
AASB 9 Financial Instruments (applicable for annual reporting periods commencing on or after 1 January 2018).
AASB 9 (December 2014) is a new Principal standard which replaces AASB 139. This new Principal version supersedes AASB 9 issued in December 2009 (as amended) and AASB 9 (issued in December 2010) and includes a model for classification and measurement, a single, forward-looking ‘expected loss’ impairment model and a substantially-reformed approach to hedge accounting.
AASB 9 is effective for annual reporting periods beginning on or after 1 January 2018. However, the Standard is available for early adoption. The own credit changes can be early applied in isolation without otherwise changing the accounting for financial instruments.
The final version of AASB 9 introduces a new expected-loss impairment model that will require more timely recognition of expected credit losses. Specifically, the new Standard requires entities to account for expected credit losses from when financial instruments are first recognised and to recognise full lifetime expected losses on a more timely basis.
Amendments to AASB 9 (December 2009 & 2010 editions)(AASB 2013-9) issued in December 2013 included the new hedge accounting requirements, including changes to hedge effectiveness testing, treatment of hedging costs, risk components that can be hedged and disclosures.
AASB 9 includes requirements for a simpler approach for classification and measurement of financial assets compared with the requirements of AASB 139.
The main changes are described below.
(a) Financial assets that are debt instruments will be classified based on (1) the objective of the entity’s business model for managing the financial assets; (2) the characteristics of the contractual cash flows.
(b) Allows an irrevocable election on initial recognition to present gains and losses on investments in equity instruments that are not held for trading in other comprehensive income. Dividends in respect of these investments that are a return on investment can be recognised in profit or loss and there is no impairment or recycling on disposal of the instrument.
(c) Financial assets can be designated and measured at fair value through profit or loss at initial recognition if doing so eliminates or significantly reduces a measurement or recognition inconsistency that would arise from measuring assets or liabilities, or recognising the gains and losses on them, on different bases.
(d) Where the fair value option is used for financial liabilities the change in fair value is to be accounted for as follows:
The change attributable to changes in credit risk are presented in other comprehensive income (OCI)
The remaining change is presented in profit or loss
AASB 9 also removes the volatility in profit or loss that was caused by changes in the credit risk of liabilities elected to be measured at fair value. This change in accounting means that gains caused by the deterioration of an entity’s own credit risk on such liabilities are no longer recognised in profit or loss.
Consequential amendments were also made to other standards as a result of AASB 9, introduced by AASB 2009-11 and superseded by AASB 2010-7, AASB 2010-10 and AASB 2014-1 – Part E.
AASB 2014-7 incorporates the consequential amendments arising from the issuance of AASB 9 in December 2014.
AASB 2014-8 limits the application of the existing versions of AASB 9 (AASB 9 (December 2009) and AASB 9 (December 2010)) from 1 February 2015 and applies to annual reporting periods beginning on or after 1 January 2015.
The effect of this amendment on the Group’s financial statements has yet to be determined.
AASB 2014-1 Part A Amendments to Australian Accounting Standards Annual Improvements to IFRSs 2010-2012 Cycle (applicable for annual reporting periods commencing on or after 1 Jan 2015).
This standard sets out amendments to Australian Accounting Standards arising from issuance by the International Accounting Standards Board (IASB) of International Financial Reporting Standards (IFRSs) Annual Improvements to IFRSs 2010-2012 Cycle and Annual Improvements to IFRSs 2011-2013 Cycle.
For
per
sona
l use
onl
y

NOTES TO THE FINANCIAL STATEMENTS FOR THE YEAR ENDED 31 DECEMBER 2014
23
NOTE 2: SIGNIFICANT ACCOUNTING POLICIES (CONTD)
Annual Improvements to IFRSs 2010-2012 Cycle addresses the following items:
AASB 2 – Clarifies the definition of ‘vesting conditions’ and ‘market condition’ and introduces the definition of ‘performance condition’ and ‘service condition’.
AASB 3 – Clarifies the classification requirements for contingent consideration in a business combination by removing all references to AASB 137.
AASB 8 – Requires entities to disclose factors used to identify the entity’s reportable segments when operating segments have been aggregated. An entity is also required to provide a reconciliation of total reportable segments’ assets to the entity’s assets.
AASB 116 & AASB 138 – Clarifies that the determination of accumulated depreciation does not depend on the selection of the valuation technique and that it is calculated as the difference between the gross and net carrying amounts.
AASB 124 – Defines a management entity providing KMP services as a related party of the reporting entity. The amendment added an exemption from the detailed disclosure requirements in paragraph 17 of AASB 124 for KMP services provided by a management entity. Payments made to a management entity in respect of KMP services should be separately disclosed.
Annual Improvements to IFRSs 2011-2013 Cycle addresses the followings items:
AASB 13 – Clarifies that the portfolio exception in paragraph 52 of AASB 13 applies to all contracts within the scope of AASB 139 or AASB 9, regardless of whether they meet the definitions of financial assets or financial liabilities as defined in AASB 132.
AASB 140 – Clarifies that judgement is needed to determine whether an acquisition of investment property is solely the acquisition of an investment property or whether it is the acquisition of a group of assets or a business combination in the scope of AASB 3 that includes an investment property. That judgement is based on guidance in AASB 3.
The effect of these amendments on the Group’s financial statements has yet to be determined.
AASB 2013-9 Amendments to Australian Accounting Standards – Conceptual Framework, Materiality and Financial Instruments.
The standard contains three main parts and makes amendments to a number of Standards and Interpretations.
Part C makes amendments to a number of Australian Accounting Standards, including incorporating Chapter 6 Hedge Accounting into AASB 9 Financial Instruments (applicable to annual reporting periods commencing on or after 1 January 2015).
There will be no impact on the Group’s financial position or performance.
AASB 2014-3 Amendments to Australian Accounting Standards – Accounting for Acquisitions of Interests in Joint Operations [AASB 1 & AASB 11] (applicable for annual reporting periods commencing on or after 1 January 2016).
AASB 2014-3 amends AASB 11 to provide guidance on the accounting for acquisitions of interests in joint operations in which the activity constitutes a business. The amendments require:
a) The acquirer of an interest in a joint operation in which the activity constitutes a business, as defined in AASB Business Combinations, to apply all of the principles on business combinations accounting in AASB 3 and other Australian Accounting Standards except for those principles that conflict with the guidance in AASB 11; and
b) The acquirer to disclose the information required by AASB 3 and other Australian Accounting Standards for business combinations.
The Standard also makes editorial correction to AASB 11. There will be no impact on the Group’s financial position or performance.
AASB 2014-4 Clarification of Acceptable Methods of Depreciation and Amortisation (Amendments to AASB 116 and AASB 138) (applicable for annual reporting periods commencing on or after 1 January 2016).
AASB 116 and AASB 138 both establish the principle for the basis of depreciation and amortisation as being the expected pattern of consumption of the future economic benefits of an asset. The IASB has clarified that the use of revenue-based methods to calculate the depreciation of an asset is not appropriate because revenue generated by an activity that includes the use of an asset generally reflects factors other than the consumption of the economic benefits embodied in the asset. The amendment also clarified that revenue is generally presumed to be an inappropriate basis for measuring the consumption of the economic benefits embodied in an intangible asset. This presumption, however, can be rebutted in certain limited circumstances. There will be no impact on the Group’s financial position or performance.
For
per
sona
l use
onl
y

NOTES TO THE FINANCIAL STATEMENTS FOR THE YEAR ENDED 31 DECEMBER 2014
24
NOTE 2: SIGNIFICANT ACCOUNTING POLICIES (CONTD)
AASB 15 Revenue from Contracts with Customers (applicable for annual reporting periods commencing on or after 1 January 2017).
In May 2014, the IASB issued IFRS 15 Revenue from Contracts with Customers, which replaces IAS 11 Construction Contracts, IAS 18 Revenue and related interpretations (IFRIC 13 Customer Loyalty Programmes, IFRIC 15 Agreements for the Construction of Real Estate, IFRIC 18 Transfers of Assets from Customers and SIC-31 Revenue-Barter Transactions Involving Advertising Services). The core principle of IFRS 15 is that an entity recognises revenue to depict the transfer of promised goods or services to customers in an amount that reflects the consideration to which the entity expects to be entitled in exchange for those goods or services. An entity recognises revenue in accordance with that core principle by applying the following steps:
a) Step 1: Identify the contract(s) with a customer
b) Step 2: Identify the performance obligations in the contract
c) Step 3: Determine the transaction price
d) Step 4: Allocate the transaction price to the performance obligations in the contract
e) Step 5: Recognise revenue when (or as) the entity satisfies a performance obligation
Early application of this standard is permitted. AASB 2014-5 incorporates the consequential amendments to a number of Australian Accounting Standards (including Interpretations) arising from the issuance of AASB 15.
There will be no impact on the Group’s financial position or performance.
AASB 2014-9 Amendments to Australian Accounting Standards – Equity Method in Separate Financial Statements (applicable for annual reporting periods commencing on or after 1 January 2016).
AASB 2014-9 amends AASB 127 Separate Financial Statements, and consequentially amends AASB 1 First-time Adoption of Australian Accounting Standards and AASB 128 Investments in Associates and Joint Ventures, to allow entities to use the equity method of accounting for investments in subsidiaries, joint ventures and associates in their separate financial statements.
AASB 2014-9 also makes editorial corrections to AASB 127. Early adoption is permitted.
There will be no impact on the Group’s financial position or performance.
AASB 2014-10 Amendments to Australian Accounting Standards – Sale or Contribution of Assets between an Investor and its Associate or Joint Venture (applicable for annual reporting periods commencing on or after 1 January 2016).
AASB 2014-10 amends AASB 10 Consolidated Financial Statements and AASB 128 to address an inconsistency between the requirements in AASB 10 ad those in AASB 128 (August 2011) in dealing with the sale or contribution of assets between an investor and its associate or joint venture. The amendments require:
a) A full gain or loss to be recognised when a transaction involves a business (whether it is housed in a subsidiary or not); and
b) A partial gain or loss to be recognised when a transaction involves assets that do not constitute a business, even if these assets are housed in a subsidiary.
AASB 2014-10 also makes editorial correction to AASB 10. Early adoption is permitted.
There will be no impact on the Group’s financial position or performance.
Disclosure Initiative – Amendments to IAS 1 (applicable for annual reporting periods commencing on or after 1 January 2016).
As part of the IASB’s Disclosure Initiative projects, the IASB issued Amendments to IAS 1 in December 2014. The amendments are designed to further encourage companies to apply professional judgement in determining what information to disclose in the financial statements. For example, the amendments make clear that materiality applies to the whole of the financial statements and that the inclusion of immaterial information can inhibit the usefulness of financial disclosures. The amendments also clarify that companies should use professional judgement in determining where and in what order information is presented in the financial disclosures. This amendment has not yet been adopted by the AASB. The effect of this amendment on the Group’s financial statements has yet to be determined.
For
per
sona
l use
onl
y

NOTES TO THE FINANCIAL STATEMENTS FOR THE YEAR ENDED 31 DECEMBER 2014
25
NOTE 2: SIGNIFICANT ACCOUNTING POLICIES (CONTD)
(d) Summary of significant accounting policies
(i) Basis of consolidation
The consolidated financial statements comprise the financial statements of Legend Mining Limited and its subsidiaries (‘the Group’) as at 31 December 2014. Control is achieved when the Group is exposed, or has rights, to variable returns from its involvement with the investee and has the ability to affect those returns through its power over the investee. Specifically, the Group controls an investee if and only if the Group has:
Power over the investee (ie existing rights that give it the current ability to direct the relevant activities of the investee);
Exposure, or rights, to variable returns from its involvement with the investee; and
The ability to use its power over the investee to affect its returns.
When the Group has less than a majority of the voting or similar rights of an investee, the Group considers all relevant facts and circumstances in assessing whether it has power over an investee, including:
The contractual arrangement with the other vote holders of the investee;
Rights arising from other contractual arrangements; and
The Group’s voting rights and potential voting rights.
The Group re-assesses whether or not it controls an investee if facts and circumstances indicate that there are changes to one or more of the three elements of control. Consolidation of a subsidiary begins when the Group obtains control over the subsidiary and ceases when the Group loses control of the subsidiary. Assets, liabilities, income and expenses of a subsidiary acquired or disposed of during the year are included in the statement of comprehensive income from the date the Group gains control until the date the Group ceases to control the subsidiary.
Profit or loss and each component of other comprehensive income (OCI) are attributed to the equity holders of the parent of the Group and to the non-controlling interests, even if this results in the non-controlling interests having a deficit balance. When necessary, adjustments are made to the financial statements of subsidiaries to bring their accounting policies into line with the Group’s accounting policies. All intra-group assets and liabilities, equity, income, expenses and cash flows relating to transactions between members of the Group are eliminated in full on consolidation.
A change in the ownership interest of a subsidiary, without a loss of control, is accounted for as an equity transaction. If the Group loses control over a subsidiary, it derecognises the related assets (including goodwill), liabilities, non-controlling interest and other components of equity while any resultant gain or loss is recognised in profit or loss. Any investment retained is recognised at fair value.
(ii) Significant accounting judgements, estimates and assumptions
The carrying amounts of certain assets and liabilities are often determined based on estimates and assumptions of future events. The key estimate and assumptions that have a significant risk of causing a material adjustment to the carrying amounts of certain assets and liabilities within the next annual reporting period are:
Cancellation of Performance Options
Establishing the fair value of the Performance Options at the time of cancellation required significant judgement by the Directors on the probability of the performance conditions being satisfied prior to expiry of the options.
Held for trading investments
The Group has classified equity investments as held for trading. This classification requires significant judgements on the intentions of the Group in relation to the investments held.
Share-based payment transactions
The Group measures the cost of equity-settled share-based payments at fair value at the grant date using a Black-Scholes formula taking into account the terms and conditions upon which the instruments were granted.
Impairment of capitalised exploration and evaluation expenditure
The future recoverability of capitalised exploration and evaluation expenditure is dependent on a number of factors, including whether the Group decides to exploit the related lease itself or, if not, whether it successfully recovers the related exploration and evaluation asset through sale.
For
per
sona
l use
onl
y

NOTES TO THE FINANCIAL STATEMENTS FOR THE YEAR ENDED 31 DECEMBER 2014
26
NOTE 2: SIGNIFICANT ACCOUNTING POLICIES (CONTD)
Factors which could impact the future recoverability include the level of proved, probable and inferred mineral resources, future technological changes which could impact the cost of mining, future legal changes (including changes to environmental restoration obligations) and changes to commodity prices.
To the extent that capitalised exploration and evaluation expenditure is determined not to be recoverable in the future, this will reduce profits and net assets in the period in which the determination is made.
In addition, exploration and evaluation expenditure is capitalised if activities in the area of interest have not yet reached a stage which permits a reasonable assessment of the existence or otherwise of economically recoverable reserves. To the extent that it is determined in the future that this capitalised expenditure should be written off, this will reduce profits and net assets in the period in which this determination is made.
(iii) Property, plant and equipment
Property, plant and equipment are stated at cost less accumulated depreciation and any accumulated impairment losses.
Depreciation is calculated on a straight line basis over the useful life of the asset from the time the asset is held ready for use.
The depreciation rates used for each class are:
Buildings 10%
Plant and equipment 7.5% - 50%
Impairment
The carrying values of property, plant and equipment are reviewed for impairment at each reporting date, with recoverable amount being estimated when events or changes in circumstances indicate the carrying value may not be recoverable.
For an asset that does not generate largely independent cash inflows, the recoverable amount is determined for the cash-generating unit to which the asset belongs.
If any indication of impairment exists and where the carrying values exceed the estimated recoverable amount, the assets or cash-generating units are written down to their recoverable amounts.
The recoverable amount of property, plant and equipment is the greater of fair value less costs to sell and value in use. In assessing value in use, the estimated future cash flows are discounted to their present value using a pre-tax discount rate that reflects current market assessments of the time value of money and the risks specific to the asset.
Derecognition and disposal
An item of property, plant and equipment is derecognised upon disposal or when no future economic benefits are expected to arise from the continued use of the asset. Any gain or loss arising on derecognition of the asset (calculated as the difference between the net disposal proceeds and the carrying amount of the item) is included in the income statement in the period the item is derecognised.
(iv) Borrowing costs
Borrowing costs directly attributable to the acquisition, construction or production of an asset that necessarily takes a substantial period of time to get ready for its intended use or sale are capitalised as part of the cost of the asset. All other borrowing costs are expensed in the period in which they occur. Borrowing costs consist of interest and other costs that an entity incurs in connection with the borrowing of funds.
(v) Cash and cash equivalents
Cash and cash equivalents in the statement of financial position comprise cash at bank and in hand, short-term deposits with an original maturity of three months or less that are readily convertible to known amounts of cash and which are subject to an insignificant risk of changes in value.
For the purposes of the Statement of Cash Flows, cash and cash equivalents consist of cash and cash equivalents as defined above, net of outstanding bank overdrafts.
(vi) Trade and other receivables
Trade receivables, which generally have 30-90 day terms, are recognised initially at fair value and subsequently measured at amortised cost using the effective interest method, less an allowance for any uncollectible amounts.
Collectability of trade receivables is reviewed on an ongoing basis. Debts that are known to be uncollectible are written off when identified. An allowance for doubtful debts is raised when there is objective evidence that the Group will not be able to collect the debt.
For
per
sona
l use
onl
y

NOTES TO THE FINANCIAL STATEMENTS FOR THE YEAR ENDED 31 DECEMBER 2014
27
NOTE 2: SIGNIFICANT ACCOUNTING POLICIES (CONTD)
(vii) Other Financial Assets
Financial assets in the scope of AASB 139 Financial Instruments: Recognition and Measurement are classified as either financial assets at fair value through profit or loss, loans and receivables, held-to-maturity investments, or available-for-sale investments, as appropriate. When financial assets are recognised initially, they are measured at fair value, plus, in the case of investments not at fair value through profit or loss, directly attributable transactions costs. The Group determines the classification of its financial assets after initial recognition and, when allowed and appropriate, re-evaluates this designation at each financial year-end.
All regular way purchases and sales of financial assets are recognised on the trade date i.e. the date that the Group commits to purchase the asset. Regular way purchases or sales are purchases or sales of financial assets under contracts that require delivery of the assets within the period established generally by regulation or convention in the marketplace.
Financial assets at fair value through profit or loss
Financial assets classified as held for trading are included in the category ‘financial assets at fair value through profit or loss’. Financial assets are classified as held for trading if they are acquired for the purpose of selling in the near term. Derivatives are also classified as held for trading unless they are designated as effective hedging instruments. Gains or losses on investments held for trading are recognised in profit or loss.
Loans and receivables
Loans and receivables are non-derivative financial assets with fixed or determinable payments that are not quoted in an active market. Such assets are carried at amortised cost using the effective interest method. Gains and losses are recognised in profit or loss when the loans and receivables are derecognised or impaired, as well as through the amortisation process.
(viii) Operating Segments
An operating segment is a component of an entity that engages in business activities from which it may earn revenues and incur expenses (including revenues and expenses relating to transactions with other components of the same entity), whose operating results are regularly reviewed by the entity's chief operating decision maker to make decisions about resources to be allocated to the segment and assess its performance and for which discrete financial information is available. This includes start-up operations which are yet to earn revenues. Management will also consider other factors in determining operating segments such as the existence of a line manager and the level of segment information presented to the board of directors.
Operating segments have been identified based on the information provided to the chief operating decision makers – being the executive management team.
Operating segments that meet the quantitative criteria as prescribed by AASB 8 are reported separately. However, an operating segment that does not meet the quantitative criteria is still reported separately where information about the segment would be useful to users of the financial statements.
Information about other business activities and operating segments that are below the quantitative criteria are combined and disclosed in a separate category for “all other segments”.
(ix) Deferred exploration costs
Deferred exploration and evaluation costs
Exploration and evaluation expenditure is stated at cost and is accumulated in respect of each identifiable area of interest.
Such costs are only carried forward to the extent that they are expected to be recouped through the successful development of the area of interest (or alternatively by its sale), or where activities in the area have not yet reached a stage which permits a reasonable assessment of the existence or otherwise of economically recoverable reserves, and active operations are continuing.
Accumulated costs in relation to an abandoned area are written off to the income statement in the period in which the decision to abandon the area is made.
A regular review is undertaken of each area of interest to determine the appropriateness of continuing to carry forward costs in relation to that area of interest.
Impairment
The carrying values of exploration and evaluation costs are reviewed for impairment when facts and circumstances indicate the carrying value may not be recoverable.
For
per
sona
l use
onl
y

NOTES TO THE FINANCIAL STATEMENTS FOR THE YEAR ENDED 31 DECEMBER 2014
28
NOTE 2: SIGNIFICANT ACCOUNTING POLICIES (CONTD)
The recoverable amount of exploration and evaluation costs is the greater of fair value less costs to sell and value in use. In assessing the value in use, the estimated future cash flows are discounted to their present value using a pre-tax discount rate that reflects current market assessments of the fair value of money and the risks specific to the asset.
Accumulated costs in relation to an abandoned area are written off in full against the income statement in the year in which the decision to abandon the area is made. A regular review is undertaken of each area of interest to determine the appropriateness of continuing to carry forward costs in relation to that area of interest. Each area of interest is limited to the size related to known or probable mineral resources capable of supporting a mining operation.
(x) Provisions
Provisions are recognised when the Group has a present obligation (legal or constructive) as a result of a past event, it is probable that an outflow of resources embodying economic benefits will be required to settle the obligation and a reliable estimate can be made of the amount of the obligation.
If the effect of the time value of money is material, provisions are determined by discounting the expected future cash flows at a pre-tax rate that reflects current market assessments of the time value of money and, where appropriate, the risks specific to the liability. When discounting is used, the increase in the provision due to the passage of time is recognised as a finance cost.
(xi) Revenue
Revenue is recognised and measured at the fair value of consideration received or receivable to the extent that it is probable that economic benefits will flow to the Group and the revenue can be reliably measured. The following specific recognition criteria must also be met before revenue is recognised:
Sale of goods
Revenue is recognised when the significant risks and rewards of ownership of the goods have passed to the buyer and the costs incurred or to be incurred in respect of the transaction can be measured reliably. Risks and rewards of ownership are considered passed to the buyer at the time of delivery of the goods to the customer.
Interest income
Interest revenue is recognised as it accrues, using the effective interest rate method. This is a method of calculating the amortised cost of a financial asset and allocating the interest income over the relevant period using the effective interest rate, which is the rate that exactly discounts estimated future cash receipts through the expected life of the financial asset to the net carrying amount of the financial asset.
Rental Income
Rental income is accounted for on a straight line basis over the lease term.
All revenue is stated net of the amount of goods and services tax (GST).
(xii) Income tax
Current tax assets and liabilities for the current and prior periods are measured at the amount expected to be recovered from or paid to the taxation authorities. The tax rates and tax law used to compute the amount are those that are enacted or substantively enacted by the reporting date.
Deferred income tax is provided on all temporary differences at the reporting date between the tax bases of assets and liabilities and their carrying amounts for financial reporting purposes.
Deferred income tax liabilities are recognised for all taxable temporary differences:
Except where the deferred income tax liability arises from the initial recognition of goodwill or of an asset or liability in a transaction that is not a business combination and, at the time of the transaction, affects neither the accounting profit nor taxable profit or loss; and
In respect of taxable temporary differences associated with investments in subsidiaries, associates and interests in joint ventures, except where the timing of the reversal of the temporary differences can be controlled and it is probable that the temporary differences will not reverse in the foreseeable future.
For
per
sona
l use
onl
y

NOTES TO THE FINANCIAL STATEMENTS FOR THE YEAR ENDED 31 DECEMBER 2014
29
NOTE 2: SIGNIFICANT ACCOUNTING POLICIES (CONTD)
Deferred income tax assets are recognised for all deductible temporary differences, carry-forward of unused tax assets and unused tax losses, to the extent that it is probable that taxable profit will be available against which the deductible temporary differences, and the carry-forward of unused tax assets and unused tax losses can be utilised:
Except where the deferred income tax asset relating to the deductible temporary differences arises from the initial recognition of an asset or liability in a transaction that is not a business combination and, at the time of the transaction, affects neither the accounting profit nor taxable profit or loss; and
In respect of deductible temporary differences associated with investments in subsidiaries, associates and interests in joint ventures, deferred tax assets are only recognised to the extent that it is probable that the temporary differences will reverse in the foreseeable future and taxable profit will be available against which the temporary differences can be utilised.
The carrying amounts of deferred tax assets is reviewed at each reporting date and reduced to the extent that it is no longer probable that sufficient taxable profit will be available to allow all or part of the deferred income tax assets to be utilised. Unrecognised deferred tax assets are reassessed at each reporting date and are recognised to the extent that it has become probable that future taxable profit will allow the deferred tax asset to be recovered.
Deferred income tax assets and liabilities are measured at the tax rates that are expected to apply to the year when the asset is realised or the liability is settled, based on tax rates (and tax laws) that have been enacted or substantively enacted at the reporting date.
Deferred tax relating to items recognised outside profit or loss is recognised outside profit or loss. Deferred tax items are recognised in correlation to the underlying transaction either in other comprehensive income or directly in equity.
Deferred tax assets and deferred tax liabilities are offset only if a legally enforceable right exists to set off current tax assets against current tax liabilities and the deferred tax assets and liabilities relate to the same taxable entity and the same taxation authority.
(xiii) Other taxes
Revenue, expenses and assets are recognised net of the amount of GST except:
Where the amount of the GST incurred is not recoverable from the Australian Taxation Office. In these circumstances the GST is recognised as part of the cost of acquisition of the asset or as part of the expense.
Receivables and payables are stated with the amount of GST included.
The net amount of GST recoverable from, or payable to, the ATO is included as a current asset or liability in the Statement of Financial Position. Commitments and contingencies are disclosed net of the amount of GST recoverable from, or payable to, the taxation authority.
Cash flows are included in the Consolidated Statement of Cash Flows on a gross basis. The GST components of cash flows arising from investing or financing activities which are recoverable from, or payable to, the ATO are classed as operating cash flows.
(xiv) Business Combinations
Business combinations are accounted for using the acquisition method. The cost of an acquisition is measured as the aggregate of the consideration transferred measured at acquisition date fair value and the amount of any non-controlling interests in the acquiree. For each business combination, the Group elects whether to measure the non-controlling interests in the acquiree at fair value or at the proportionate share of the acquiree’s identifiable net assets. Acquisition-related costs are expensed as incurred and included in administrative expenses.
When the Group acquires a business, it assesses the financial assets and liabilities assumed for appropriate classification and designation in accordance with the contractual terms, economic circumstances and pertinent conditions as at the acquisition date. This includes the separation of embedded derivatives in host contracts by the acquiree.
If the business combination is achieved in stages, any previously held equity interest is re-measured at its acquisition date fair value and any resulting gain or loss is recognised in profit or loss.
Any contingent consideration to be transferred by the acquirer will be recognised at fair value at the acquisition date. Contingent consideration classified as an asset or liability that is a financial instrument and within the scope of AASB 139 Financial Instruments: Recognition and Measurement is measured at fair value with changes in fair value recognised either in profit or loss or as a change to OCI. If the contingent consideration is not within the scope of AASB 139, it is measured in accordance with the appropriate AASB. Contingent consideration that is classified as equity is not re-measured and subsequent settlement is accounted for within equity.
For
per
sona
l use
onl
y

NOTES TO THE FINANCIAL STATEMENTS FOR THE YEAR ENDED 31 DECEMBER 2014
30
NOTE 2: SIGNIFICANT ACCOUNTING POLICIES (CONTD)
Goodwill is initially measured at cost, being the excess of the aggregate of the consideration transferred and the amount recognised for non-controlling interests, and any previous interest held, over the identifiable net assets acquired and liabilities assumed. If the fair value of the net assets acquired is in excess of the aggregate consideration transferred, the Group re-assesses whether it has correctly identified all of the assets acquired and all of the liabilities assumed and reviews the procedures used to measure the amounts to be recognised at the acquisition date. If the re-assessment still results in an excess of the fair value of net assets acquired over the aggregate consideration transferred, then the gain is recognised in profit or loss.
After initial recognition, goodwill is measured at cost less any accumulated impairment losses. For the purpose of impairment testing, goodwill acquired in a business combination is, from the acquisition date, allocated to each of the Group’s cash-generating units that are expected to benefit from the combination, irrespective of whether other assets or liabilities of the acquiree are assigned to those units.
Where goodwill has been allocated to a cash-generating unit and part of the operation within that unit is disposed of, the goodwill associated with the disposed operation is included in the carrying amount of the operation when determining the gain or loss on disposal. Goodwill disposed in these circumstances is measured based on the relative values of the disposed operation and the portion of the cash-generating unit retained.
(xv) Trade and or other payables
Liabilities for trade creditors and other amounts are carried at amortised cost and represent liabilities for goods and services provided to the Group prior to the end of the financial year that are unpaid and arise when the Group becomes obliged to make future payments in respect of these goods and services. The amounts are unsecured and are usually paid within 30 days.
(xvi) Interest bearing loans and borrowings
All loans and borrowings are initially recognised at the fair value of the consideration received less directly attributable transaction costs.
After initial recognition, interest bearing loans and borrowings are subsequently measured at amortised cost using the effective interest method. Amortised cost is calculated by taking into account any issue costs, and any discount or premium on settlement.
(xvii) Share based payment transactions
The Group provides benefits to employees (including directors) of the Group and to the providers of services to the Group in the form of share based payment transactions, whereby employees or service providers render services in exchange for shares or rights over shares (‘equity-settled transactions’).
There are currently three scenarios in place to provide these services:
(a) ‘Employees Share Option Plan’, which provides benefits to eligible persons;
(b) Capital raising costs, which provide payment to stockbrokers and finance institutions for capital raising services and commissions; and
(c) Other grants of options to directors on an ad hoc basis.
The cost of the equity-settled transactions with stockbrokers and finance institutions is measured by reference to the fair value of the service received at the date they are granted.
For transactions with employees (including directors), the cost of these equity-settled transactions is measured by reference to the fair value of the options provided. The fair value is determined by an external valuer using a Black-Scholes model.
The cost of these equity-settled transactions with employees is recognised, together with a corresponding increase in equity, over the period in which the performance conditions are fulfilled, ending on the date on which the relevant employee becomes fully entitled to the award (‘vesting date’).
In valuing these equity-settled transactions, no account is taken of any performance conditions, other than conditions linked to the price of the shares of Legend Mining Limited (market conditions) if applicable.
The cumulative expense recognised for these equity-settled transactions at each reporting date until vesting date reflects (i) the extent to which the vesting period has expired and (ii) the Group’s best estimate of the number of equity instruments that will ultimately vest. No adjustment is made for the likelihood of market conditions being met as the effect of these conditions is included in the determination of fair value at grant date. The income statement charge or credit for a period represents the movement in cumulative expenses recognised as at the beginning and end of the period.
For
per
sona
l use
onl
y

NOTES TO THE FINANCIAL STATEMENTS FOR THE YEAR ENDED 31 DECEMBER 2014
31
NOTE 2: SIGNIFICANT ACCOUNTING POLICIES (CONTD)
No expense is recognised for awards that do not ultimately vest, except for awards where vesting is only conditional upon a market condition.
If the terms of an equity-settled award are modified, as a minimum an expense is recognised as if the terms had not been modified. In addition, an expense is recognised for any modification that increases the total fair value of the share-based payment arrangement, or is otherwise beneficial to the employee, as measured at the date of modification.
If an equity-settled award is cancelled, it is treated as if it had vested on the date of cancellation, and any expense not yet recognised for the award is recognised immediately. However , if a new award is substituted for the cancelled award and designated as a replacement award on the date that it is granted, the cancelled and new award are treated as if they were a modification of the original award, as described in the previous paragraph.
For transactions with other service providers, the cost of these equity-settled transactions is measured by reference to the value of the services provided. The cost of these equity-settled transactions is recognised, together with a corresponding increase in equity, at the time the services are provided unless they are transaction costs arising on the issue of ordinary shares, in which case the transaction costs are recognised directly in equity as a reduction of the proceeds received on the issue of shares.
(xviii) Contributed Equity
Issued and paid up capital is recognised at the fair value of the consideration received by the Company. Any transaction costs net of tax arising on the issue of ordinary shares are recognised directly in equity as a reduction of the proceeds received.
(xix) Employee Benefits
Provision is made for employee benefits accumulated as a result of employee services up to the reporting date. These employee benefits include wages, salaries, annual leave and include related on-costs such as superannuation and payroll tax.
The Group does not expect its long service leave or annual leave benefits to be settled wholly within 12 months of each reporting date. The Group recognises a liability for long service leave and annual leave measured as the present value of expected future payments to be made in respect of services provided by employees up to the reporting date using the projected unit credit method. Consideration is given to expected future wage and salary levels, experience of employee departures, and periods of service.
Expected future payments are discounted using market yields at the reporting date on national government bonds with terms to maturity and currencies that match, as closely as possible, the estimated future cash outflows.
No provision is made for non-vesting sick leave, as the anticipated pattern of future sick leave taken indicates that accumulated non-vesting sick leave will never be paid.
The liability for long service leave is recognised and measured as the present value of expected future payments to be made in respect of services provided by employees up to the reporting date using the projected unit credit method. Consideration is given to expected future wage and salary levels, experience of employee departures, and period of service. Expected future payments are discounted using market yields at the reporting date on national government bonds with terms to maturity and currencies that match, as closely as possible, the estimated future cash outflow.
Contributions to employee superannuation funds of choice are expensed as incurred.
(xx) Earnings per share
Basic earnings per share (EPS) is calculated as net profit or loss attributable to members, adjusted to exclude costs of servicing equity (other than dividends), divided by the weighted average number of ordinary shares, adjusted for any bonus element.
Diluted EPS is calculated as net profit or loss attributable to members, adjusted for:
(a) Costs of servicing equity (other than dividends).
(b) The after tax effect of dividends and interest associated with the dilutive potential ordinary shares that have been recognised as expenses; and
(c) Other non-discretionary changes in revenues or expenses during the period that would result from the dilution of potential ordinary shares;
divided by the weighted average number of ordinary shares and dilutive potential ordinary shares, adjusted for any bonus element.
For
per
sona
l use
onl
y

NOTES TO THE FINANCIAL STATEMENTS FOR THE YEAR ENDED 31 DECEMBER 2014
32
NOTE 2: SIGNIFICANT ACCOUNTING POLICIES (CONTD) (xxi) Foreign currency translation
(a) Functional and presentation currency
The Group’s consolidated financial statements are presented in Australian dollars, which is also the Company’s functional currency. For each entity, the Group determines the functional currency and items included in the financial statements of each entity are measured using that functional currency.
(b) Transactions and balances
Transactions in foreign currencies are initially recorded by the Group’s entities at their respective functional currency spot rates at the date the transaction first qualifies for recognition.
Monetary assets and liabilities denominated in foreign currencies are retranslated at the functional currency spot rates of exchange at the reporting date.
Non-monetary items that are measured in terms of historical cost in a foreign currency are translated using the exchanges rates at the dates of the initial transactions. Non-monetary items measured at fair value in a foreign currency are translated using the exchange rates at the date when the fair value is determined. The gain or loss arising on translation of non-monetary items measured at fair value is treated in line with the recognition of gain or loss on change in fair value of the item (ie translation differences on items whose fair value gain or loss is recognised in other comprehensive income or profit or loss are also recognised in other comprehensive income or profit or loss respectively).
(c) Group Companies
On consolidation, the assets and liabilities of foreign operations are translated into Australian dollars at the rate of exchange prevailing at the reporting date and their statements of profit or loss are translated at average rates for the reporting period. The exchange differences arising on translation for consolidation purposes are recognised in other comprehensive income. On disposal of a foreign operation, the component of other comprehensive income relating to that particular foreign operation is recognised in profit or loss.
(xxii) Non-current assets held for sale
The Group classifies non-current assets and disposal groups as held for sale if their carrying amounts will be recovered principally through a sale rather than through continuing use. Such non-current assets or disposal groups classified as held for sale are measured at the lower of their carrying amount and fair value less costs to sell.
The criteria for held for sale classification is regarded as met only when the sale is highly probable and the asset or disposal group is available for immediate sale in its present condition subject only to terms that are usual and customary for sales of such assets. For the sale to be highly probable management must be committed to a plan to sell the asset, and an active program to locate a buyer and complete the plan must have been initiated. In addition, the sale should be expected to qualify for recognition as a completed sale within one year from the date of classification and actions required to complete the plan should indicate that it is unlikely that significant changes to the plan will be made or that the plan will be withdrawn.
Property, plant and equipment and intangible assets are not depreciated or amortised once classified as held for sale.
Assets and liabilities classified as held for sale are presented separately as current items in the statement of financial position.
(xxiii) Current versus non-current classification
The Group presents assets and liabilities in the statement of financial position based on current/non-current classification. An asset is current when it is:
Expected to be realised or intended to be sold or consumed in the Group’s normal operating cycle;
Held primarily for the purpose of trading;
Expected to be realised within twelve months after the reporting period; or
Cash or cash equivalent unless restricted from being exchanged or used to settle a liability for at least twelve months after the reporting period.
The Group classifies all other assets as non-current.
A liability is current when:
It is expected to be settled in the Group’s normal operating cycle;
It is held primarily for the purpose of trading;
It is due to be settled within twelve months after the reporting period; or
For
per
sona
l use
onl
y

NOTES TO THE FINANCIAL STATEMENTS FOR THE YEAR ENDED 31 DECEMBER 2014
33
NOTE 2: SIGNIFICANT ACCOUNTING POLICIES (CONTD)
There is no unconditional right to defer the settlement of the liability for at least twelve months after the reporting period.
The Group classifies all other liabilities as non-current. Deferred tax assets and liabilities are classified as non-current assets and liabilities.
NOTE 3: NATURE OF OPERATIONS AND PRINCIPAL ACTIVITIES
The principal activities during the year of the entities within the consolidated entity were exploration for iron and gold deposits in Australia and Cameroon.
NOTE 4: REVENUE AND EXPENSES Note 2014 $
2013 $
Revenues and expenses from continuing operations
a) Finance Revenue Bank interest received and receivable 178,287 280,734 Receivables – unwinding of discount 193,045 -
371,332 280,734
b) Other Income
Fair value gain on investments held for trading 504,671 - Gain on disposal of subsidiaries 369,669 - Other - 52,266
874,340 52,266
c) Employee Benefits Expense
Salaries & on-costs 876,031 868,394 Other employee benefits 12,966 8,288
888,997 876,682
d) Impairment of Deferred Exploration Costs
Impairment of deferred exploration costs 13 1,105,212 36,829,394
e) Other Expenses
Depreciation 17,858 32,268 Loss on disposal of property, plant & equipment (i) 7,162 32,496 Fair value loss on investments held for trading - 168,800 Performance Options cancellation fee 19(b) 1,000,000 - Exploration expenditure not capitalised 55,088 45,164
1,080,108 278,728
(i) Loss on disposal of property, plant & equipment comprises:
Proceeds on sale 10,316 6,565 Carrying value of assets disposed (17,478) (39,061)
(7,162) (32,496)
f) Corporate and administration expenses
Fees – Audit/Tax 95,215 94,885 Fees – ASX 30,411 27,769 Fees – Share registry 21,727 33,858 Consultancy Fees 200,181 287,695 Office rent 70,876 97,237 Legal expenses 125,870 210,692 Travel expenses 101,587 113,030 Other expenses 170,172 272,004
816,039 1,137,170
For
per
sona
l use
onl
y

NOTES TO THE FINANCIAL STATEMENTS FOR THE YEAR ENDED 31 DECEMBER 2014
34
NOTE 5: EARNINGS PER SHARE 2014
$ 2013
$
(a) Reconciliation of earnings to net loss: Net loss (2,507,805) (34,729,555)
Loss used in the calculation of basic earnings per share (2,507,805) (34,729,555)
(b) Weighted average number of shares on issue during the financial year
used in the calculation of basic loss per share 1,962,850,801 1,963,205,071
Weighted average number of ordinary shares on issue used in the calculation of diluted loss per share 1,962,850,801 1,963,205,071
(c) Information on classification of options
As the Group has made a loss for the year ended 31 December 2014, all options on issue are considered antidilutive and have not been included in the calculation of diluted earnings per share. These options could potentially dilute basic earnings per share in the future.
NOTE 6: INCOME TAX
2014 $
2013 $
The major components of income tax expense are: Income Statement Current income tax Current income tax benefit - (13,004) Over provision of prior tax year (8,999) (196,592) Deferred income tax Relating to origination and reversal of temporary differences (17,359) (166,884)
Income tax benefit reported in the income statement (26,358) (376,480)
A reconciliation between tax benefit and the product of accounting loss before income tax multiplied by the Group’s applicable income tax rate is as follows:
Accounting loss before tax from ordinary activities (2,644,684) (38,788,974)
Accounting loss before income tax (2,644,684) (38,788,974)
At the Group’s statutory income tax rate of 30% (793,405) (11,636,692) Expenditure not allowed for income tax purposes 745,162 180,908 Utilisation of losses against prior period taxable income - 196,592 Impairment of foreign exploration costs - 11,048,818 Current year tax losses not recognised 133,004 56,802 Current year capital losses not recognised 84,054 - In respect of sale of subsidiaries (110,901) - Non-assessable income (57,914) - Over provision of prior tax year (8,999) (196,592) Deductible equity raising costs (17,359) (26,316)
Income tax benefit reported in the consolidated income statement (26,358) (376,480)
Income tax expensed directly to equity Relating to equity costs 17,359 26,316
Deferred tax expense recognised in equity 17,359 26,316
Current Income Tax Asset - 13,004
For
per
sona
l use
onl
y

NOTES TO THE FINANCIAL STATEMENTS FOR THE YEAR ENDED 31 DECEMBER 2014
35
NOTE 6: INCOME TAX (CONTD)
2014 $
2013 $
Deferred Income Tax Deferred income tax at 31 December related to the following: Consolidated Recognised deferred tax liabilities Capitalised exploration and evaluation expenditure (117,995) (20,094) Investments (414,373) (178,918) Other (8,734) (6,366)
Amounts disclosed as deferred tax liability (541,102) (205,377)
Set-off of deferred tax assets 541,102 205,377
Net deferred tax liabilities recognised - -
Recognised deferred tax assets Tax losses available to offset against future taxable income 463,135 121,294 Other provisions 64,555 54,386 Property, plant & equipment 1,073 - Share based costs on equity 12,339 29,698
Gross deferred tax assets 541,102 205,377
Set-off of deferred tax assets (541,102) (205,377)
Net deferred tax assets recognised - -
Unrecognised deferred tax assets Deferred tax assets have not been recognised in respect of the following as the statutory requirements for recognising those deferred tax assets have not been met
Tax revenue losses 189,805 56,802 Tax capital losses 6,681,901 6,421,487
6,871,706 6,478,289
Tax Consolidation
Legend Mining Limited and its 100% owned Australian resident subsidiaries formed a tax consolidated group with effect from 1 July 2004. Legend Mining Limited is the head entity of the tax consolidated group. Members of the group have entered into a tax sharing agreement in order to allocate the income tax liabilities between the entities within the Group should the head entity default on its tax payment obligations. At the balance date, the possibility of default is remote.
Tax effect accounting by members of the tax consolidated group
Tax expense / income, deferred tax liabilities and deferred tax assets arising from temporary differences are recognised in the separate financial statements of the members of the tax consolidated group using the separate taxpayer within a group method. Current tax liabilities and assets and deferred tax assets arising from unused tax losses and tax credits of the members of the tax consolidated group are recognised by the Company (as head entity in the tax consolidated group).
Members of the tax consolidated group have not entered into a tax funding agreement. As a result, the aggregate of the current tax liability or asset and any deferred tax asset arising from unused tax losses and tax credits in respect of that period, assumed by the Company, are recognised as a contribution from (or distribution to) equity participants. There were no contributions (or distributions) made during the year ended 31 December 2014.
NOTE 7: SEGMENT INFORMATION
Operating Segments
AASB 8 requires operating segments to be identified on the basis of internal reports that are used by the chief operating decision maker (“CODM”) in order to allocate resources to the segment and to assess its performance. The CODM of the Group is the Board of Directors.
The Group has identified its operating segments based on the internal reports that are provided to the CODM on a regular basis. The Group had two reportable operating segments, being exploration and evaluation activities in Australia and West Africa, until completion of the sale of the African operations (refer note 11). Following completion of the sale the Group now has only one reportable segment being exploration and evaluation activities in Australia.
For
per
sona
l use
onl
y

NOTES TO THE FINANCIAL STATEMENTS FOR THE YEAR ENDED 31 DECEMBER 2014
36
NOTE 7: SEGMENT INFORMATION (CONTD)
The accounting policies applied for internal reporting purposes are consistent with those applied in the preparation of this financial report.
Australia West Africa Total 2014
$ 2013
$ 2014
$ 2013
$ 2014
$ 2013
$ Revenue 371,332 280,734 - - 371,332 280,734
Segment Result (1,882,783) (1,550,604) (735,543) (36,861,890) (2,618,326) (38,412,494) Segment Assets 17,387,575 8,586,484 - 14,081,298 17,387,575 22,667,782 Segment Liabilities (320,289) (289,522) - (23,684) (320,289) (313,206)
Segment revenues and expenses are those directly attributable to the segments and include those expenses incurred by head office where a reasonable basis of allocation exists. Segment assets include all assets used by a segment and consist principally of cash and cash equivalents, receivables, property, plant and equipment, investments in listed entities and capitalised exploration. Segment liabilities consist principally of payables, employee benefits, accrued expenses and provisions.
NOTE 8: CASH AND CASH EQUIVALENTS
2014 2013
$ $
Cash at bank and in hand 1,437,339 652,135
Deposits 5,500,000 4,000,000
6,937,339 4,652,135
Cash at bank earns interest at floating rates based on daily bank deposit rates.
Deposits at call earn interest on a 30, 60 and 90 day term basis at bank deposit rates.
NOTE 9: TRADE AND OTHER RECEIVABLES
2014 2013 $ $
Current Receivable from Jindal Mining & Exploration Limited (a) 5,748,601 - Other receivables (b) 48,497 19,476 Current tax receivable - 13,004
5,797,098 32,480
Terms and conditions relating to the above financial instruments:
(a) The receivable from Jindal Mining & Exploration Limited (“Jindal”) is for the second tranche of $6 million due on 22 July 2015 following the sale of the Cameroon Project (refer note 11). The receivable is recognised at amortised cost, with the gross proceeds being discounted at 8% from the due date.
(b) Other receivables are non-interest bearing and have repayment terms of between 30 and 60 days.
Trade and other receivables are not past due and no impairment is required.
NOTE 10: OTHER FINANCIAL ASSETS
2014 2013 $ $ Current Shares in Pilbara Minerals Ltd – at fair value (a) - 21,000 Shares and options in Nemex Resources Ltd – at fair value (b) 141,900 61,050 Shares in Artemis Resources Ltd – at fair value (c) 180,000 240,000 Shares in Sirius Resources Ltd – at fair value (d) 3,840,000 3,405,000
4,161,900 3,727,050
Non-current Performance and other bonds (e) 50,000 50,000
For
per
sona
l use
onl
y

NOTES TO THE FINANCIAL STATEMENTS FOR THE YEAR ENDED 31 DECEMBER 2014
37
NOTE 10: OTHER FINANCIAL ASSETS (CONTD)
Terms and conditions relating to the above financial instruments:
(a) Shares in Pilbara Minerals Ltd – Nil shares were on hand at 31 December 2014 (2013: 1,750,000 shares at $0.012).
(b) Shares and options in Nemex Resources Ltd – 3,300,000 shares were on hand at 31 December 2014. The shares had a market value of $0.043 each (2013: 3,300,000 shares at $0.018 and 1,650,000 options at $0.001).
(c) Shares in Artemis Resources Ltd – 60,000,000 shares were on hand at 31 December 2014. The shares had a market value of $0.003 each at 31 December 2014 ($0.004 at 31 December 2013).
(d) Shares in Sirius Resources Ltd – 1,500,000 shares were on hand at 31 December 2014. The shares had a market value of $2.56 each at 31 December 2014 ($2.27 at 31 December 2013).
(e) Performance bonds – bank deposit held as security for credit cards. At 31 December 2014, this deposit is held on a 6 month term deposit with an interest rate of 3.55% per annum (31 December 2013, 6 months at 3.75%pa).
The equity investments are all classified as held for trading. The market value of all equity investments represent the fair value based on quoted prices on active markets (ASX) as at the reporting date without any deduction for transaction costs. These investments are classified as Level 1 financial instruments. There have been no transfers between levels of the fair value hierarchy used in measuring the fair value of these financial instruments, or changes in its classification as a result of a change in the purpose or use of these assets.
The fair value of the above equity investments at the date of signing this report has increased to $4,876,500.
For
per
sona
l use
onl
y

NOTES TO THE FINANCIAL STATEMENTS FOR THE YEAR ENDED 31 DECEMBER 2014
38
NOTE 11: DISPOSAL GROUP CLASSIFIED AS HELD FOR SALE
At Date of Disposal 22 July 2014 2013
$ $ Net assets – at fair value less costs to sell Cash 17,474 -
Receivables 67 - Prepayments 18,499 48,944 Inventory 2,563 11,164 Property, plant & equipment 588,302 842,304
Deferred exploration costs 11,984,175 13,174,102 Payables (21,574) -
12,589,506 14,076,514
Reserves attributable to disposal group classified as held for sale Foreign currency translation reserve 2,576,839 3,497,527
Consideration received or receivable Cash 6,000,000 Transaction fees (225,000)
Proceeds on sale of subsidiaries per the Statement of Cash Flows 5,775,000 Present value of amount due on 22 July 2015 5,555,556
Total disposal consideration 11,330,556 Carrying amount of net assets and reserves sold (12,589,506) Non-controlling interests eliminated (948,220) Exchange differences realised on disposal of foreign operations 2,576,839
Gain on disposal of subsidiaries included in other income (note 4(b)) 369,669
On 20 November 2013 Legend announced that it had entered into a Share Sale and Debt Assignment Agreement (“Agreement”) for the sale of Legend’s 90% interest in Camina SA, the holding company of the Ngovayang Project in the Republic of Cameroon (the “Transaction”). The sale was implemented by the sale of 100% of Legend’s wholly-owned British Virgin Islands subsidiary, Legend Iron Limited (“Company”), and transfer of intercompany debts by Legend Cameroon Pty Ltd (“Seller”) to Jindal Mining & Exploration Limited (“Purchaser”).
Pursuant to the Agreement, Legend has or shall receive cash consideration of:
(i) $6 million upon completion of the Transaction;
(ii) $6 million twelve months after completion; and
(iii) $5.5 million within 10 business days of the execution of a Mining Convention between the purchaser and the Government of Cameroon.
The contingent consideration of $5.5 million is dependent upon the execution of a mining convention between the purchaser and the government of Cameroon. Given the probability and time risk of the mining convention being executed, the directors have taken a conservative view and assigned a nil fair value to the contingent consideration.
Completion occurred on 22 July 2014 and the first tranche of $6 million was received on 5 August 2014.
Prior to disposal, the fair value of the disposal group, classified as level 3 in the fair value hierarchy, was determined by reference to the estimated fair value of the consideration receivable. In determining fair value, the first tranche of $6 million has been valued at its face value given the expected short term maturity thereof. The second tranche of $6 million is due to be received on 22 July 2015 and has been discounted at 8% over this period.
The carrying value of the Group’s projects in West Africa was reviewed, and impairment of $1,105,212 recognised during the current period, in light of the sale agreement entered into. The carrying value was determined by reference to the fair value of the proceeds to be received in accordance with the sale agreement.
For
per
sona
l use
onl
y

NOTES TO THE FINANCIAL STATEMENTS FOR THE YEAR ENDED 31 DECEMBER 2014
39
NOTE 12: PROPERTY, PLANT AND EQUIPMENT
Buildings
Plant and equipment
Total
$ $ $
At 1 January 2014 Net of accumulated depreciation - 62,624 62,624 Additions - 10,316 10,316 Disposals - (7,162) (7,162) Depreciation expense - (17,858) (17,858)
At 31 December 2014 Net of accumulated depreciation - 47,920 47,920
At 1 January 2014 Cost - 250,488 250,488 Accumulated depreciation - (187,864) (187,864)
Net carrying amount - 62,624 62,624
At 31 December 2014 Cost - 129,237 129,237 Accumulated depreciation - (81,317) (81,317)
Net carrying amount - 47,920 47,920
At 1 January 2013 Net of accumulated depreciation 299,314 815,614 1,114,928 Exchange differences 59,453 121,996 181,449 Additions - 49,560 49,560 Disposals - (39,060) (39,060) Reclassification to disposal group classified as held for sale (note 11) (319,186) (523,118) (842,304) Depreciation expense (39,581) (362,368) (401,949)
At 31 December 2013 Net of accumulated depreciation - 62,624 62,624
At 1 January 2013 Cost 366,781 1,436,491 1,803,272 Accumulated depreciation (67,467) (620,877) (688,344)
Net carrying amount 299,314 815,614 1,114,928
At 31 December 2013 Cost - 250,488 250,488 Accumulated depreciation - (187,864) (187,864)
Net carrying amount - 62,624 62,624
For
per
sona
l use
onl
y

NOTES TO THE FINANCIAL STATEMENTS FOR THE YEAR ENDED 31 DECEMBER 2014
40
NOTE 13: DEFERRED EXPLORATION COSTS
Note 2014 $
2013 $
Deferred exploration costs 393,318 66,979
(a) Deferred exploration and evaluation costs
At 1 January, at cost 66,979 38,904,952
Exchange differences - 8,498,334 Expenditure incurred during the year 326,339 2,667,189 Assets reclassified as held for sale 11, 13(i) - (13,174,102) Expenditure impaired during the year 13(i) - (36,829,394)
At 31 December, at cost 13(ii) 393,318 66,979
Note:
(i) The carrying value of the Group’s projects in West Africa were reviewed, and impairment recognised, in light of the sale agreement entered into (refer note 11). The carrying value has been determined by reference to the fair value of the proceeds to be received in accordance with the sale agreement. The carrying value of these projects was transferred to disposal group classified as held for sale during the year ended 31 December 2013. Impairment of $1,105,212 was recognised against these assets during the year ended 31 December 2014.
(ii) The future recoverability of capitalised exploration and evaluation expenditure is dependent on a number of factors, including whether the Group decides to exploit the related lease itself or, if not, whether it successfully recovers the related exploration and evaluation asset through sale.
NOTE 14: TRADE AND OTHER PAYABLES
2014 $
2013 $
Current – unsecured Trade payables 105,105 122,604
Other payables and accruals 35,000 44,316
140,105 166,920
Terms and conditions relating to the above financial instruments
(i) Trade payables are non-interest bearing and normally settled on 30 day terms.
(ii) Other payables are non-interest bearing and normally settled as they fall due.
(iii) There are no trade payables past due for payment.
NOTE 15: PROVISIONS
2014
$ 2013
$ Current Employee benefits 130,229 103,498
Non-Current Employee benefits 49,955 42,788
Number of employees at year end 4 32
For
per
sona
l use
onl
y

NOTES TO THE FINANCIAL STATEMENTS FOR THE YEAR ENDED 31 DECEMBER 2014
41
NOTE 16: CONTRIBUTED EQUITY
2014 $
2013 $
Ordinary shares Issued and fully paid 63,075,664 63,075,664 Issue costs (3,274,133) (3,256,774)
59,801,531 59,818,890
Movement in ordinary shares on issue 2014 No $ At 1 January 2014 1,962,850,801 63,075,664
At 31 December 2014 1,962,850,801 63,075,664
Movement in ordinary shares on issue 2013 No $ At 1 January 2013 1,983,467,684 63,090,616 Share buy-back (20,616,883) (14,952)
At 31 December 2013 1,962,850,801 63,075,664
Effective 1 July 1998, the Corporations’ legislation in place abolished the concept of authorised share capital and par value shares. Accordingly the Company does not have authorised capital nor par value in respect of its issued shares.
Fully paid ordinary shares carry one vote per share and carry the right to dividends.
NOTE 17: RESERVES
Foreign currency
translation reserve
Share option premium reserve
Movement in reserves $ $ At 1 January 2013 (4,519,280) 22,417,578
Foreign currency translation 8,016,807 -
At 31 December 2013 3,497,527 22,417,578
Exchange differences on translation of foreign operations (920,688) -
Exchange differences realised on disposal of foreign operations (2,576,839) -
At 31 December 2014 - 22,417,578
Share option premium reserve
The share option premium reserve is used to record the value of share based payments provided to employees, directors and contractors, as part of their remuneration.
Foreign currency translation reserve
The foreign currency translation reserve is used to record exchange differences arising from the translation of the financial statements of foreign subsidiaries.
For
per
sona
l use
onl
y

NOTES TO THE FINANCIAL STATEMENTS FOR THE YEAR ENDED 31 DECEMBER 2014
42
NOTE 18: SHARE OPTIONS
Number Exercise price cents per share
Unlisted options – Expiry date 16 December 2014 At 1 January 2014 9,000,000 5.3 cents Expired on 16 December 2014 (9,000,000) 5.3 cents
At 31 December 2014 - -
Unlisted options – Expiry date 4 February 2015 At 1 January 2014 191,250,000 4 cents No movement during the year - -
At 31 December 2014 191,250,000 4 cents
Unlisted options – Expiry date 21 December 2015 At 1 January 2014 30,000,000 6 cents No movement during the year - -
At 31 December 2014 30,000,000 6 cents
Unlisted options – Expiry date 4 February 2015 Performance Options A (refer note 19(b)) At 1 January 2014 400,000,000 0 cents Cancelled during the year (400,000,000) 0 cents
At 31 December 2014 - -
Unlisted options – Expiry date 4 February 2015 Performance Options B (refer note 19(b)) At 1 January 2014 400,000,000 0 cents Cancelled during the year (400,000,000) 0 cents
At 31 December 2014 - -
Unlisted options – Expiry date 4 February 2015 At 1 January 2014 199,750,000 4 cents No movement during the year - -
At 31 December 2014 199,750,000 4 cents
Unlisted options – Expiry date 4 February 2015 At 1 January 2014 14,400,000 5 cents No movement during the year - -
At 31 December 2014 14,400,000 5 cents
NOTE 19: SHARE-BASED PAYMENT PLANS
(a) Recognised share-based payment expenses
There was no expense recognised for services received during the current or prior year.
(b) Types of share-based payment plans
Employee Share Option Plan, ‘ESOP’
Share options are granted to Eligible Persons with more than 6 months service. Eligible Persons are determined by the Board after taking into account the following considerations:
(i) the seniority of the Eligible Person and the position the Eligible Person occupies within the Group;
(ii) the length of service of the Eligible Person with the Group;
(iii) the record of employment of the Eligible Person with the Group;
(iv) the contractual history of the Eligible Person with the Group;
(v) the potential contribution of the Eligible Person to the growth of the Group;
(vi) the extent (if any) of the existing participation of the Eligible Person in the Plan; and
For
per
sona
l use
onl
y
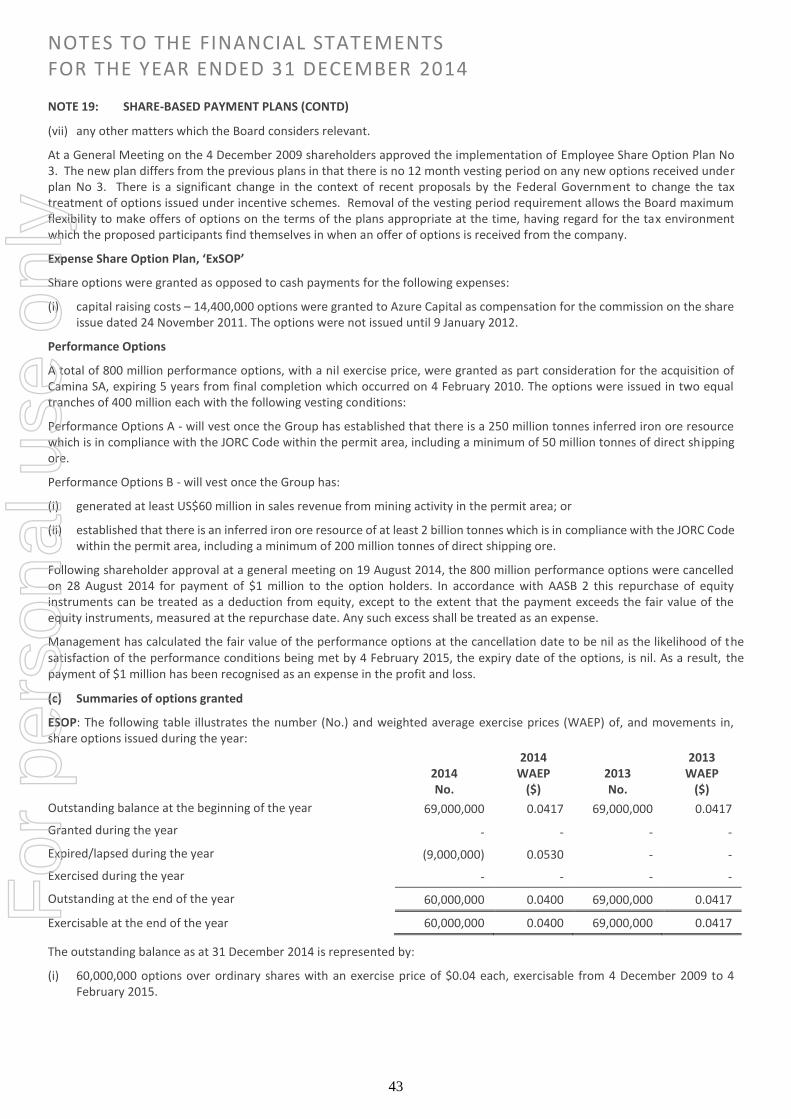
NOTES TO THE FINANCIAL STATEMENTS FOR THE YEAR ENDED 31 DECEMBER 2014
43
NOTE 19: SHARE-BASED PAYMENT PLANS (CONTD)
(vii) any other matters which the Board considers relevant.
At a General Meeting on the 4 December 2009 shareholders approved the implementation of Employee Share Option Plan No 3. The new plan differs from the previous plans in that there is no 12 month vesting period on any new options received under plan No 3. There is a significant change in the context of recent proposals by the Federal Government to change the tax treatment of options issued under incentive schemes. Removal of the vesting period requirement allows the Board maximum flexibility to make offers of options on the terms of the plans appropriate at the time, having regard for the tax environment which the proposed participants find themselves in when an offer of options is received from the company.
Expense Share Option Plan, ‘ExSOP’
Share options were granted as opposed to cash payments for the following expenses:
(i) capital raising costs – 14,400,000 options were granted to Azure Capital as compensation for the commission on the share issue dated 24 November 2011. The options were not issued until 9 January 2012.
Performance Options
A total of 800 million performance options, with a nil exercise price, were granted as part consideration for the acquisition of Camina SA, expiring 5 years from final completion which occurred on 4 February 2010. The options were issued in two equal tranches of 400 million each with the following vesting conditions:
Performance Options A - will vest once the Group has established that there is a 250 million tonnes inferred iron ore resource which is in compliance with the JORC Code within the permit area, including a minimum of 50 million tonnes of direct shipping ore.
Performance Options B - will vest once the Group has:
(i) generated at least US$60 million in sales revenue from mining activity in the permit area; or
(ii) established that there is an inferred iron ore resource of at least 2 billion tonnes which is in compliance with the JORC Code within the permit area, including a minimum of 200 million tonnes of direct shipping ore.
Following shareholder approval at a general meeting on 19 August 2014, the 800 million performance options were cancelled on 28 August 2014 for payment of $1 million to the option holders. In accordance with AASB 2 this repurchase of equity instruments can be treated as a deduction from equity, except to the extent that the payment exceeds the fair value of the equity instruments, measured at the repurchase date. Any such excess shall be treated as an expense.
Management has calculated the fair value of the performance options at the cancellation date to be nil as the likelihood of the satisfaction of the performance conditions being met by 4 February 2015, the expiry date of the options, is nil. As a result, the payment of $1 million has been recognised as an expense in the profit and loss.
(c) Summaries of options granted
ESOP: The following table illustrates the number (No.) and weighted average exercise prices (WAEP) of, and movements in, share options issued during the year:
2014 No.
2014 WAEP
($) 2013 No.
2013 WAEP
($)
Outstanding balance at the beginning of the year 69,000,000 0.0417 69,000,000 0.0417
Granted during the year - - - -
Expired/lapsed during the year (9,000,000) 0.0530 - -
Exercised during the year - - - -
Outstanding at the end of the year 60,000,000 0.0400 69,000,000 0.0417
Exercisable at the end of the year 60,000,000 0.0400 69,000,000 0.0417
The outstanding balance as at 31 December 2014 is represented by:
(i) 60,000,000 options over ordinary shares with an exercise price of $0.04 each, exercisable from 4 December 2009 to 4 February 2015.
For
per
sona
l use
onl
y

NOTES TO THE FINANCIAL STATEMENTS FOR THE YEAR ENDED 31 DECEMBER 2014
44
NOTE 19: SHARE-BASED PAYMENT PLANS (CONTD)
ExSOP: The following table illustrates the number (No.) and weighted average exercise prices (WAEP) of, and movements in, share options issued during the year:
2014 No.
2014 WAEP
2013 No.
2013 WAEP
Outstanding balance at the beginning of the year 175,650,000 0.044 175,650,000 0.044
Granted during the year - - - -
Exercised during the year - - - -
Outstanding at the end of the year 175,650,000 0.044 175,650,000 0.044
Exercisable at the end of the year 175,650,000 0.044 175,650,000 0.044
The outstanding balance as at 31 December 2014 is represented by:
(i) 14,400,000 options over ordinary shares with an exercise price of $0.05 each, exercisable immediately and expiring on 4 February 2015.
(ii) 30,000,000 options over ordinary shares with an exercise price of $0.06 each, exercisable immediately and expiring on 21 December 2015.
(iii) 131,250,000 options over ordinary shares with an exercise price of $0.04 each, exercisable immediately and expiring on 4 February 2015.
NOTE 20: RELATED PARTIES
(i) Wholly-owned group transactions
Loans made by Legend Mining Limited to wholly-owned subsidiaries are repayable on demand and are not interest bearing.
(ii) Other related party transactions
Transactions between related parties are on normal commercial terms and conditions no more favourable than those available to other parties unless otherwise stated.
(iii) Ultimate parent
Legend Mining Limited is the ultimate parent company.
(iv) Compensation of key management personnel of the Group
2014 $
2013 $
Short-term employee benefits 652,487 702,690
Post-employment benefits 58,125 60,881
Other long-term benefits - -
Termination benefits - -
Share-based payment - -
Total compensation paid to Key Management Personnel 710,612 763,571
The amounts disclosed in the table are the amounts recognised as an expense during the reporting period related to key management personnel.
For
per
sona
l use
onl
y

NOTES TO THE FINANCIAL STATEMENTS FOR THE YEAR ENDED 31 DECEMBER 2014
45
NOTE 21: CASH FLOW INFORMATION
(i) Reconciliation of Cash
For the purposes of the Cash Flow Statement, cash and cash equivalents includes cash on hand and at bank and short term deposits at call, net of outstanding bank overdrafts. Cash as at the end of the financial year as shown in the Cash Flow Statement is reconciled to the related items in the Statement of Financial Position as follows:
Note 2014 $
2013 $
Cash on hand Cash at bank
500 1,436,839
2,857 649,278
Deposits at call 5,500,000 4,000,000
8 6,937,339 4,652,135
(ii) Reconciliation of net loss after income tax to net cash used in operating activities
Net loss after tax (2,618,326) (38,412,494)
Adjusted for:
Net loss on disposal of property, plant & equipment 7,162 32,496
Net gain on disposal of subsidiaries (369,669) -
Depreciation 17,856 32,268
Unwinding of discount on receivables (193,045) -
Fair value (gain)/loss on investments (504,671) 168,800
Deferred exploration costs impaired or expensed 1,160,302 36,874,558
(2,500,391) (1,304,372)
Change in operating assets and liabilities:
(Increase) in receivables (16,017) (5,610)
Increase in provision for annual leave 26,731 23,266
Increase in provision for long service leave 7,167 7,168
(Decrease) in provision for income tax payables - (1,413,109)
(Decrease) in deferred tax liabilities (17,359) (166,884)
(Decrease)/increase in payables (83,311) 67,998
Net cash used in operating activities (2,583,180) (2,791,543)
Non cash financing and investment activities
There were no non-cash financing and investment activities transacted during the 2014 or 2013 years.
For
per
sona
l use
onl
y

NOTES TO THE FINANCIAL STATEMENTS FOR THE YEAR ENDED 31 DECEMBER 2014
46
NOTE 22: COMMITMENTS
(a) Exploration expenditure commitments
In order to maintain current rights of tenure to exploration tenements, the Group will be required to outlay approximately $120,000 (2013: $nil) in the following twelve months in respect of tenement lease rentals and to meet minimum expenditure requirements of the Department of Industry & Resources. These obligations are expected to be fulfilled in the normal course of operations and have not been provided for in the financial report.
(b) Operating Lease commitments
The company has a lease commitment over its office premises located at 8 Kings Park Road, West Perth. The lease is for a period of two years commencing 1 November 2013. The lease commitment is $68,122 for the first year increased for CPI in the second year.
NOTE 23: INVESTMENTS IN CONTROLLED ENTITIES
(a) Details of subsidiaries
Set out below are the Group’s subsidiaries at 31 December 2014. All the subsidiaries as listed below have share capital consisting solely of ordinary shares, which are held directly by the Group, and the proportion of ownership interests held equals to the voting rights held by the Group. The country of incorporation or registration is also their principal place of business.
Name Place of Business / Country of
Incorporation
Ownership Interest Held by the Group
Ownership Interest Held by Non-Controlling Interests
2014 %
2013 %
2014 %
2013 %
Gibson Metals Pty Ltd Australia 100 100 - -
Legend Cameroon Pty Ltd Australia 100 100 - -
Legend Iron Ltd BVI - 100 - -
Camina SA Cameroon - 90 - 10
(b) Non-controlling interests (NCI)
Set out below is summarised financial information for Camina SA, the only subsidiary of the Group that had non-controlling interests. The amounts disclosed are before inter-company eliminations.
2014 $
2013 $
Summarised Statement of Financial Position Current assets - 64,891 Non-current assets - 14,016,405 Current liabilities - (23,684) Non-current liabilities - (21,436,892)
Net (liabilities)/assets - (7,379,280)
Accumulated NCI - (735,401) Summarised Statement of Comprehensive Income Revenue - - Loss for the year (1,105,212) (36,301,658) Other comprehensive income (3,886,237) 8,907,563
Total comprehensive income (4,991,449) (27,394,095)
Loss allocated to NCI (110,521) (3,682,939)
Dividends paid to NCI - - Summarised Cash Flows Cash flows from operating activities - - Cash flows from investing activities (612,625) (1,993,704) Cash flows from financing activities 629,758 2,015,532
Net increase in cash and cash equivalents 17,133 21,828
For
per
sona
l use
onl
y

NOTES TO THE FINANCIAL STATEMENTS FOR THE YEAR ENDED 31 DECEMBER 2014
47
NOTE 24: FINANCIAL INSTRUMENTS DISCLOSURE
The Group’s principal financial instruments comprise loans and borrowings, and cash and short-term deposits and investments held for trading.
The main purpose of these financial instruments is to raise finance for the Group’s operations. The Group has various other financial assets and liabilities such as trade receivables and trade payables, which arise directly from its operations. It is, and has been throughout the period under review, the Group’s policy that no trading in financial instruments shall be undertaken. The main risks arise from the Group’s financial instruments are fair value interest rate risks, liquidity risk, credit risk and equity price risk. The Board reviews and agrees policies for managing each of these risks and they are summarised below.
Details of the significant accounting policies and methods adopted, including the criteria for recognition, the basis of measurement and the basis on which income and expenses are recognised in respect of each class of financial asset, financial liability and equity instrument are disclosed in note 2 to the financial statements.
Fair value interest risk
The Group’s exposure to fair value interest risk is minimal.
Commodity price risk
The Group’s exposure to price risk is minimal as the group is still in an exploration phase and has no revenues from mining.
Credit risk
The Group trades only with recognised, creditworthy third parties.
It is the Group’s policy that all customers who wish to trade on credit terms are subject to credit verification procedures.
In addition, receivable balances are monitored on an ongoing basis with the result that the Group’s exposure to bad debts is not significant.
The only significant concentration of credit risk within the Group is the loan receivable from Jindal. Exposure to credit risk is managed through regular analysis of Jindal’s ability and willingness to meet payment obligations. The carrying amount of financial assets represents the maximum credit exposure. At 31 December 2014 the Group had a material credit risk exposure to Jindal. The receivables recorded on the Group’s balance sheet contains an amount of $6 million (carrying amount $5,748,601) due from Jindal under the SSDA for the sale of the shares in, and debts due from, Legend Iron Limited. It is expected the material credit exposure to Jindal will be completely removed during the financial year ended 31 December 2015. No collateral is held as security. Jindal’s obligations are supported by a guarantee from its parent entity. Jindal’s parent is a large industrial conglomerate listed on both the Bombay Stock Exchange and National Stock Exchange of India. The credit rating and financial health of Jindal and its parent entity are monitored regularly as is Jindal’s exploration activities in-country Cameroon.
With respect to credit risk arising from the other financial assets of the Group, which comprise cash and cash equivalents, the Group’s exposure to credit risk arises from default of the counter party, with a maximum exposure equal to the carrying amount of these instruments.
Since the Group only trades with recognised third parties, there is no requirement for collateral.
Liquidity risk
The Group’s objective is to maintain a balance between continuity of funding and flexibility through the use of a mixture of long and short term debt.
Equity price risk
Equity price risk is the risk that changes in equity prices will affect the fair value of the Group’s holdings of financial instruments. The objective of equity price risk management is to manage and control the risk within acceptable parameters, while optimising the return.
To minimise the risk the Group’s investments are of high quality and are publicly traded on the ASX. The investments are managed on a day to day basis so as to pick up any significant adjustments to market prices.
For
per
sona
l use
onl
y

NOTES TO THE FINANCIAL STATEMENTS FOR THE YEAR ENDED 31 DECEMBER 2014
48
NOTE 24: FINANCIAL INSTRUMENTS DISCLOSURE (CONTD)
(b) Interest Rate Risk
The consolidated entity’s exposure to cashflow interest rate risk is as follows:
2014 Weighted Average Interest
Rate
Floating Interest
$
Fixed Interest
$
Non-Interest Bearing
$
Total
$ Financial assets: Cash and cash equivalents 3.05% 1,436,839 5,500,000 500 6,937,339 Other financial assets 3.63% - 50,000 - 50,000
1,436,839 5,550,000 500 6,987,339
2013 2013 Financial assets: Cash and cash equivalents 3.82% 649,278 4,000,000 2,857 4,652,135 Other financial assets 3.28% - 50,000 - 50,000
649,278 4,050,000 2,857 4,702,135
The maturity date for all financial instruments included in the above tables is 1 year or less from balance date.
A change of 100 basis points in interest rates would result in a net gain/loss before taxation of $58,447 (2013: $73,634). This is based on the interest bearing financial assets as detailed above.
(c) Credit Risk
The carrying amount of the Group’s financial assets represents the maximum credit exposure. The Group’s maximum exposure to credit risk at the reporting date was:
Carrying Amount Note 2014
$ 2013
$ Cash and cash equivalents 8 6,937,339 4,652,135 Trade and other receivables 9 5,797,098 32,480 Performance bonds 11 50,000 50,000
12,784,437 4,734,615
The Company’s maximum exposure to credit risk at the reporting date was $12,784,437 (2013: $4,734,615).
All group trade and other receivables are current and have not been impaired.
(d) Liquidity Risk
The following are the contractual maturities of financial liabilities, including estimated interest payments and excluding the impact of netting agreements:
31 December 2014 Carrying Amount
Contractual cash flows
6 mths or less
Non-derivative financial liabilities
Trade and other payables 140,105 (140,105) (140,105)
140,105 (140,105) (140,105)
31 December 2013 Carrying
Amount Contractual cash
flows 6 mths or less
Non-derivative financial liabilities
Trade and other payables 166,920 (166,920) (166,920)
166,920 (166,920) (166,920)
For
per
sona
l use
onl
y

NOTES TO THE FINANCIAL STATEMENTS FOR THE YEAR ENDED 31 DECEMBER 2014
49
NOTE 24: FINANCIAL INSTRUMENTS DISCLOSURE (CONTD)
(e) Net Fair Value of Financial Assets and Liabilities
The fair values of financial assets and liabilities, together with the carrying amounts shown in the statement of financial position, are as follows:
31 December 2014 31 December 2013 Carrying
Amount $
Fair Value
$
Carrying Amount
$
Fair Value
$ Held for trading financial assets 4,161,900 4,161,900 3,727,050 3,727,050 Cash and cash equivalents 6,937,339 6,937,339 4,652,135 4,652,135 Performance and other bonds 50,000 50,000 50,000 50,000 Trade and other receivables 5,797,098 5,797,098 32,480 32,480 Trade and other payables (140,105) (140,105) (166,920) (166,920)
16,806,232 16,806,232 8,294,745 8,294,745
(f) Equity price risk
The Group’s exposure to equity securities is considered high as the company has significant investments in other listed investments totalling $4,161,900 at 31 December 2014. Such risk is managed through diversification of investments and daily monitoring of price movements.
A change of 10% in the market price of the shares would result in a gain/loss before taxation of $416,190 (2013: $372,705).
(g) Foreign Exchange risk
The consolidated entity is exposed to foreign currency risk on foreign currency bank balances, payments for services denominated in foreign currencies and intercompany loans that are denominated in a currency other than the functional currency. The currencies giving rise to this risk are primarily US Dollars and Cameroon Francs (XAF). Following completion of the sale of the West African operations (refer note 11), exposure to foreign exchange risks are minimal.
At balance date, the group had no material foreign currency denominated liabilities and receivables.
NOTE 25: FAIR VALUES
The carrying amounts of the Group’s financial assets and financial liabilities at 31 December 2014 and 31 December 2013 are reasonable approximations of its fair value.
Management assessed that cash and cash equivalents, trade and other receivables, and trade and other payables approximate their carrying amounts largely due to the short-term maturities of these instruments.
The following table provides the fair value measurement hierarchy of the Group’s assets measured at fair value:
Asset measured at fair value Date of valuation
Total Quoted prices in active market (Level 1)
Significant observable inputs (Level 2)
Significant unobservable inputs (Level 3)
Recurring
Quoted equity investments (Note 10)
31-Dec-2014 4,161,900 4,161,900 - -
There have been no transfers between Level 1 and Level 2 during the year.
The fair value of the financial assets is included at the amount at which the instrument could be exchanged in a current transaction between willing parties, other than in a forced or liquidation sale.
Fair value of the quoted equity instruments is based on price quotations at the reporting date.
For
per
sona
l use
onl
y

NOTES TO THE FINANCIAL STATEMENTS FOR THE YEAR ENDED 31 DECEMBER 2014
50
NOTE 26: INFORMATION RELATING TO LEGEND MINING LIMITED (“THE PARENT ENTITY”)
2014 2013
$ $
Current assets 11,147,736 8,406,881
Total assets 17,638,976 21,219,438
Current liabilities 270,335 246,733
Total liabilities 320,290 289,522
Net assets 17,318,686 20,929,916
Contributed equity 59,801,531 59,818,890
Accumulated losses (64,900,423) (61,306,552)
Share option premium reserve 22,417,578 22,417,578
17,318,686 20,929,916
Loss of the parent entity after tax (3,593,871) (28,872,809)
Total comprehensive loss of the parent entity (3,593,871) (28,872,809)
NOTE 27: AUDITOR’S REMUNERATION
The auditor of Legend Mining Limited is Ernst & Young Australia.
Consolidated
2014 $
2013 $
Amounts received or due and receivable by Ernst & Young Australia for: - An audit or review of the financial report of the entity and any other entity in the consolidated group 63,345 56,500
63,345 56,500
NOTE 28: CONTINGENT LIABILITIES
There are no contingent liabilities at the date of this report.
The consolidated entity’s activities in Australia are subject to the Native Titles Act and the Department of Environment. Uncertainty associated with Native Title issues may impact on the Group’s future plans.
There are no unresolved Native Title issues and the consolidated entity is not aware of any other matters that may impact upon its access to the land that comprises its project areas.
NOTE 29: EVENTS AFTER THE BALANCE SHEET DATE
No matter or circumstance has arisen since the end of the financial year which has significantly affected, or may significantly affect the operations of the Group, the result of those operations, or the state of affairs of the Group in subsequent financial years.
NOTE 30: DIVIDENDS PAID AND PROPOSED
No dividends were paid or proposed this financial year.
There are no franking credits available for future reporting periods.
For
per
sona
l use
onl
y

DIRECTORS’ DECLARATION
51
In accordance with a resolution of the Directors of Legend Mining Limited, I state that:
In the opinion of the Directors:
(a) the financial statements and notes on pages 17-50, and the remuneration disclosures that are contained in the Remuneration report in the Directors report pages 12-15, of the consolidated entity, are in accordance with the Corporations Act 2001, including;
i Giving a true and fair view of the consolidated entity’s financial position as at 31 December 2014 and of its performance for the year ended on that date; and
ii Complying with Australian Accounting Standards’ and the Corporations Regulations 2001; and
iii The financial statements and notes also comply with International Financial Reporting Standards as disclosed in note 2(b); and
(b) there are reasonable grounds to believe that the company will be able to pay its debts as and when they become due and payable.
This declaration has been made after receiving the declarations required to be made to the directors in accordance with section 295A of the Corporations Act 2001 for the financial year ended 31 December 2014.
On behalf of the Board.
Mark Wilson Managing Director Dated this 5th day of March 2015
For
per
sona
l use
onl
y
DECLARATION OF AUDITOR’S INDEPENDENCE
52
For
per
sona
l use
onl
y
INDEPENDENT AUDITOR’S REPORT
53
For
per
sona
l use
onl
y

INDEPENDENT AUDITOR’S REPORT
54
For
per
sona
l use
onl
y

SHAREHOLDER INFORMATION For the year ended 31 December 2014
55
The issued capital of the company as at 5 March 2015 is 1,962,850,801 ordinary fully paid shares.
Distribution of Share Holders as at 5 March 2015
Fully Paid Shares Number of Holders
Number of Shares
1 - 1,000 90 25,045 1,001 - 5,000 126 477,009 5,001 - 10,000 318 2,685,421
10,001 - 100,000 1,828 87,000,456 100,001 and over 1,392 1,872,662,870
3,754 1,962,850,801
Number holding less than a marketable parcel 1,929 49,643,084
Top 20 Shareholders as at 5 March 2015 Name Total Holdings % Issued Capital
YANDAL INVESTMENTS PTY LTD 344,750,000 17.56 AUSTRALIAN GOLD RESOURCES PTY LTD 164,985,000 8.41 CHESTER NOMINEES WA PTY LTD 78,000,000 3.97 J P MORGAN NOMINEES AUSTRALIA LIMITED 54,224,597 2.76 MIKADO CORPORATION PTY LTD 53,500,000 2.73 CASTLE BAILEY PTY LTD 23,533,860 1.2 MOTTE & BAILEY PTY LTD 24,000,000 1.22 BELLARINE GOLD PTY LTD 35,000,000 1.78 KARARI AUSTRALIA PTY LTD 31,000,000 1.58 MR PAUL GABRIEL SHARBANEE 27,100,000 1.38 MR ALEXANDER JASON ELKS 20,000,000 1.02 MR RICHARD PAUL HABEKOST 18,000,000 0.92 PHH PTY LIMITED 17,800,000 0.91 MR MATTHEW MCLEISH 17,004,285 0.87 SIXTY-EIGHTH STOWAWAY PTY LTD 15,000,000 0.76 BONTOWN PTY LTD 14,000,000 0.71 NEFCO NOMINEES PTY LTD 12,000,000 0.61 MR ANDREW NICHOLAS VUKOSAV 10,177,777 0.52 MR L P JUDD and MRS S H JUDD 10,010,000 0.51 MR G C BERWYN DAVIES and MRS C A DAVIES 10,000,000 0.51
980,085,519 49.93
Unlisted Option holders as at 5 March 2015 Class of options Number Number of
Holders
21 December 2015 exercisable at 6.0 cents per share 30,000,000 1
TENEMENT LISTING AS AT 5 MARCH 2015
Tenement
Status
Percentage Interest
FRASER PROJECT
E28/2342 Granted 100%
E28/2408 Application N/A
E28/2409 Application N/A
E28/2415 Application N/A
For
per
sona
l use
onl
y


