50
Amcor 2015/16 Full Year Results Investor Presentation Ron Delia – Managing Director & CEO Michael Casamento – CFO For personal use only

Amcor 2015/16 Full Year ResultsInvestor Presentation
Ron Delia – Managing Director & CEO
Michael Casamento – CFOFor
per
sona
l use
onl
y

Disclaimer
2
Forward looking statements
This presentation contains forward-looking statements that involve subjective judgment and analysis and are subject to significant uncertainties, risks and contingencies, many of which are outside the control of, and are unknown to Amcor. Forward-looking statements can generally be identified by the use of forward-looking words such as “may”, “will”, “expect”, “intend”, “plan”, “seeks”, “estimate”, “anticipate”, “believe”. “continue”, or similar words.
No representation, warranty or assurance (express or implied) is given or made in relation to any forward looking statement by any person (including Amcor). In addition, no representation, warranty or assurance (express or implied) is given in relation to any underlying assumption or that any forward looking statements will be achieved. Actual future events may vary materially from the forward looking statement and the assumptions on which the forward looking statements are based. Given these uncertainties,
readers are cautioned not to place undue reliance on such forward looking statements.
In particular, we caution you that these forward looking statements are based on management’s current economic predictions and assumptions and business and financial projections. Amcor’s business is subject to uncertainties, risks and changes that may cause its actual results, performance or achievements to differ materially from any future results, performance or achievements expressed or implied by these forward-looking statements. The factors that may affect Amcor’s future performance include, among others:
• Changes in the legal and regulatory regimes in which Amcor operates;
• Changes in behaviour of Amcor’s major customers;
• Changes in behaviour of Amcor’s major competitors;
• The impact of foreign currency exchange rates; and
• General changes in the economic
conditions of the major markets in which Amcor operates.
These forward looking statements speak only as of the date of this presentation. Subject to any continuing obligations under applicable law or any relevant stock exchange listing rule. Amcor disclaims any obligation or undertaking to publicly update or revise any of the forward looking statements in this presentation, whether as a result of new information, or any change in events conditions or circumstances on which any statement is based.
Non-IFRS information
Results shown refers to underlying result unless otherwise indicated. Underlying earnings is defined and reconciled on slide 26.
Certain non-IFRS financial information has been presented within this news release. This information is presented to assist in making appropriate comparisons with prior periods and to assess the operating performance of the business. Amcor uses these
measures to assess the performance of the business and believes that the information is useful to investors. Non-IFRS information, including underlying earnings and average funds employed have not been audited but have been extracted from Amcor’s annual financial report.
Full year results available information
Amcor has today released a package of information relating to its financial results for the full year ended 30 June 2016. Information contained in this presentation should be read in conjunction with information contained in the associated News Release and Webcast, available at www.amcor.com
For
per
sona
l use
onl
y

Safety
Lost time frequency rate1.9
1.6
1.2
0.90.8 0.8
0.7
0.50.6 0.6
0
0.2
0.4
0.6
0.8
1
1.2
1.4
1.6
1.8
2
Recordable case frequency rate8.4
7.4
5.1
4.1 4.03.4
2.62.0 2.0 2.0
0
1
2
3
4
5
6
7
8
9
3
Committed to our goal of ‘no injuries’
2007 to 2012 data includes the demerged Orora business. 2013 to 2016 are shown exclusive of Orora. 2016 and 2015 includes acquired businesses from the first day of ownership. 2007 to 2014 excludes acquired businesses for the first 12 months of ownership.
For
per
sona
l use
onl
y
Highlights
4
Underlying earnings unless otherwise indicated(1)
• Strong financial performance
• Balanced earnings growth
• Strong cash flow and balance sheet
• Increased ROAFE to 21.6%
• $1.2 billion cash redeployed for benefit of shareholders
• Increased annual dividend to 41.0 US cents
• 8 acquisitions either announced or completed since 30 June 2015
• Completion of US$500 million on-market share buy-back
• Good progress on strategic priorities
• Outlook for another strong year in FY17
Strong result and good momentum despite challenging macroeconomic environment
1. Throughout this document, references are to underlying earnings unless otherwise indicated. Underlying earnings are defined and reconciled on slide 26.F
or p
erso
nal u
se o
nly

Strong financial performance and shareholder returns
Strong constant currency earnings growth
• PAT up 7.5%
• EPS up 11.3%
• Negative currency impact of US$51m on PAT
Continued operating improvements
• RoAFE increased from 20.3% to 21.6%
Strong cash flow
Strong financial position
• Net debt / PBITDA 2.6
Improved shareholder returns
• Annual dividend of 41.0 US cents
• Annual dividend paid as 55.3 AUD cents up 4.3%
• US$500m share buy-back completed
Full year results(1)
5
US$ million Jun 15 Jun 16 ���� %Constant currency
���� %
Sales revenue 9,611.8 9,421.3 (2.0) 3.7
PBIT 1,053.3 1,055.3 - 7.0
PBIT / Sales margin (%) 11.0 11.2 0.2
PAT 671.1 671.1 - 7.5
EPS (US cents) 55.8 57.7 3.4 11.3
Statutory PAT 680.3 244.1 (64.1)
Statutory EPS (US cents) 56.6 21.0 (62.9)
Free cash flow 298.3 311.2 4.3
RoAFE (%) 20.3 21.6 1.3
Dividend (US cents) 40.0 41.0 2.5
Dividend (AUD cents) 53.0 55.3 4.3
1. References are to underlying earnings. This is defined and reconciled on slide 26.
For
per
sona
l use
onl
y

Well balanced earnings growth(1)
7%
10%
Flexibles Rigid Plastics
Segment PBIT - growth rate
6
Balance growth by segment, market, acquisitions and organic sources
(1) Constant currency underlying earnings growth(2) Excludes AMVIG and Corporate costs. On a consistent basis, growth rates for the December 2015 half year were 4% for Developed markets and 8% for Emerging markets.
5%
8%
Developed Markets Emerging Markets
Market PBIT - organic growth rate (2)
4%
7%
3%
Org
anic
Gro
wth
Con
trib
utio
nfr
omac
quis
ition
sT
otal
Sources of PBIT growth
For
per
sona
l use
onl
y

Flexibles SegmentEuro million Jun 15 Jun 16
Reported���� %
Constant currency
���� %
Sales revenue 5,232 5,466 4.5 4.7
PBIT (1) 642.9 681.2 6.0 7.2
PBIT/Sales margin % 12.3 12.5 0.2
AFE 2,560 2,643 3.2
RoAFE %(1) 25.1 25.8 0.7
Operating cash flow 707.9 758.9 7.2
7
Solid PBIT growth with strong margins and returns
1. Represents underlying PBIT. This is defined and reconciled on slide 26.
• Solid PBIT growth in constant currency terms
• Business group performanceTobacco Packaging
• Very strong in Europe on inventory build• Growth in Asia however Americas weakFlexible Packaging excluding Tobacco Packaging
• Strong growth in Eastern Europe & Sth East Asia• China in line with last year• Subdued performance in Western Europe and North
America• Strong growth in emerging markets, stable in developed
markets• Investing in growth
• 6 acquisitions announced or completed • 2 greenfield plants
For
per
sona
l use
onl
y
Flexibles Restructuring(1)
8
Allowing a strong business to become even better positioned in the market place
• Announced on 9 June 2016• Initiatives designed to accelerate the pace of adapting the organisation within
developed markets• Generates excellent returns – 35% on cash invested of US$120 to US$150 million
• benefits of US$40-US$50 million within three years
• Fast start as expected at the time of announcement• 4 plant closures. One plant in each of the UK, Australia, New Zealand and Belgium• 1 plant restructure• An organisation restructure
1. Refer slide 48 for further details
For
per
sona
l use
onl
y

Flexibles full year outlook for 2016/17
9
Flexibles segment is expected to deliver particularly strong earnings growth in the 2016/17 year in constant currency terms compared with €681.2 million achieved in the 2015/16 year. This outlook takes into account:• modest organic growth; • earnings from the Alusa business, which was acquired on 1 June 2016;• modest growth from other recently acquired businesses; and• restructuring benefits of approximately €9 to €13 million (US$10 to US$15 million).
Overall growth is expected to be weighted towards the second half of the year.
Refer to slide 29 for full details.
For
per
sona
l use
onl
y
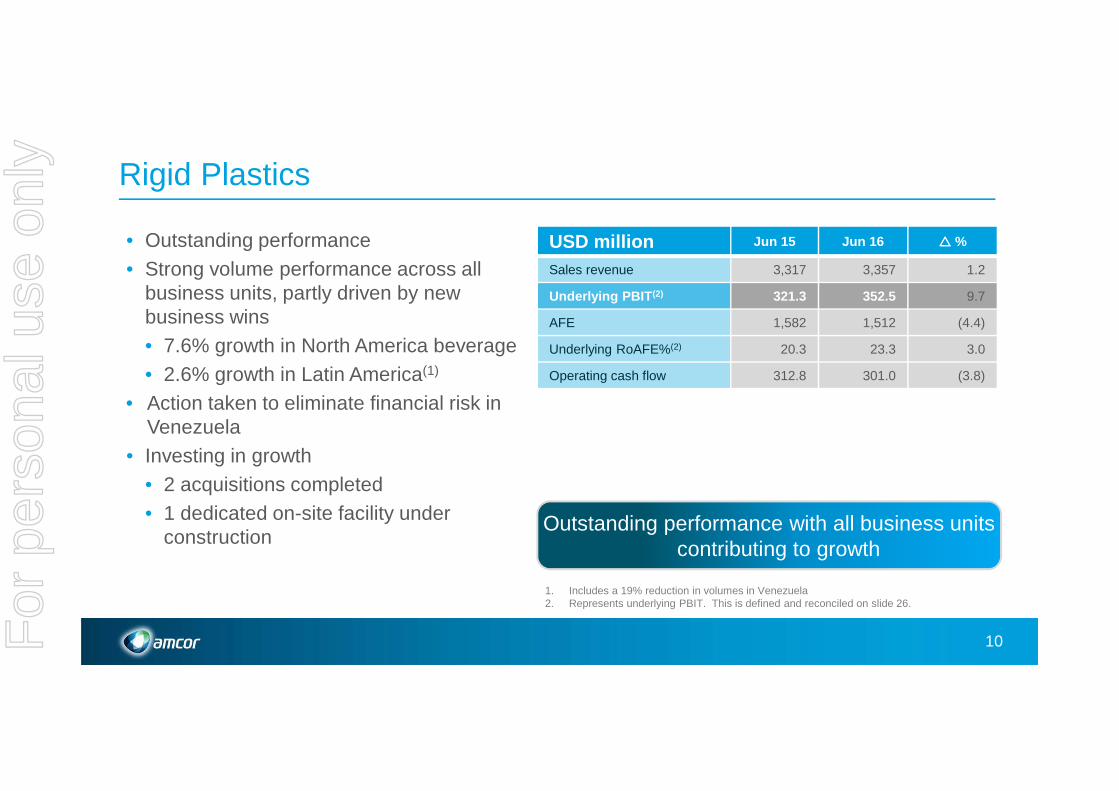
Rigid Plastics
USD million Jun 15 Jun 16 ���� %
Sales revenue 3,317 3,357 1.2
Underlying PBIT (2) 321.3 352.5 9.7
AFE 1,582 1,512 (4.4)
Underlying RoAFE%(2) 20.3 23.3 3.0
Operating cash flow 312.8 301.0 (3.8)
10
• Outstanding performance• Strong volume performance across all
business units, partly driven by new business wins• 7.6% growth in North America beverage• 2.6% growth in Latin America(1)
• Action taken to eliminate financial risk in Venezuela
• Investing in growth• 2 acquisitions completed • 1 dedicated on-site facility under
construction Outstanding performance with all business units
contributing to growth
1. Includes a 19% reduction in volumes in Venezuela2. Represents underlying PBIT. This is defined and reconciled on slide 26.
For
per
sona
l use
onl
y

Rigid Plastics full year outlook for 2016/17
11
The outlook for the Rigid Plastics segment , compared with PBIT of US$352.5 million achieved in the 2015/16 year takes into account:
• A negative impact of approximately US$40 million related to Venezuela;
• continued growth in Latin America excluding Venezuela;
• solid volume growth in North America at rates lower than those achieved in the 2015/16 year; and
• benefits from the Encon and Plastic Moulders acquisitions.
Refer to slide 30 for full details.
For
per
sona
l use
onl
y

Cash flow
US$ million Jun 15 Jun 16 Comments
PBITDA 1,408.6 1,409.3 Up 6.5% on a constant currency basis
Interest (165.8) (153.4)
Tax (154.7) (170.3) Due to timing of payments
Capital expenditure (323.0) (348.9) Moderately higher than D&A including restructuring and integration costs(1)
Working capital (46.0) 37.2 Average working capital to sales improved from 8.6% to 8.3%
Other 59.3 17.6 Mainly non cash PBITDA and proceeds from PP&E disposals
Operating cash flow 778.4 791.5
12
Operating cash flow remained strong
1. Based on $348.9 million capital expenditure plus $32 million of cash restructuring and integration costs.
For
per
sona
l use
onl
y

Cash flow - continued
US$ million Jun 15 Jun 16 Comments
Operating cash flow 778.4 791.5
Dividends and other equity distributions
(480.1) (480.3)
Free cash flow 298.3 311.2
Acquisitions/Divestments (97.6) (496.6) Increased acquisition activity compared with prior years
Venezuela adjustment(1) - (184.2)
Share buy-back/ othermovements in share capital
(374.8) (309.6) Reduced weighted average number of shares by 3.3% for the full year
Foreign exchange rate changes and hedges / other
(22.6) (170.5) Mainly FX on net debt arising from exchange rate movements
Increase in Net Debt (196.7) (849.7)
13
2016/17 free cash flow expected to be US$150 to US$250 million after taking into account Flexibles segment cash restructuring costs
1. Related to cash balance at 30 June 2016.
For
per
sona
l use
onl
y

Balance sheet and debt profile
Debt profile Jun 16
Fixed / floating interest rate ratio 48% fixed
Bank debt / total debt 22% bank
Undrawn committed facilities (US$ million) US$714
Non current debt maturity (years) 4.4
14
Balance sheet Jun 15 Jun 16
Net debt (US$ million) 2,880 3,829
Net finance costs (US$ million) 169.2 166.8
PBITDA interest cover (x) 8.4 8.4
Net debt / PBITDA (x)(1) 2.0 2.6
Balance sheet remains strong
• Leverage at 2.6 x
• Interest cover strong at 8.4 x
• FY17 interest expense US$185-$195m
Liquidity
• Diverse mix
• Balanced maturity profile
• US$275m facility due to mature in December 2016
1. Calculated on a 12 month pro forma basis for acquisitions completed during the year ended 30 June 2016.
For
per
sona
l use
onl
y

Amcor shareholder value creation model
15
Dividend(~$500m)
Reinvestment(~$400m)
Acquisitions and/or buy-backs(~$200-300m)
Total shareholder value of 10-15% per annum with
low volatilit y
Growth in line with EPS ~ 4% yield
Organic EPS growth of ~ 3-4%
EPS growth of ~ 2-7%
Strong, defensive cash
flow
For
per
sona
l use
onl
y

Total value creation of 15% for the full year
16
Multiple sources of value under resilient shareholder value creation model
Value creation of 15%
Constant currency PAT growth 8%
Dividend yield of 4%
Reduction in average number of shares on issue
3%
For
per
sona
l use
onl
y

Where to from here….
For
per
sona
l use
onl
y

18
Current operating priorities
Amcor Today – Position of Strength
• Focused portfolio – leadership positions, good industry structure, significant Emerging Market exposure
• Differentiated capabilities – “The Amcor Way”
• Disciplined cash and capital deployment
• Resilient shareholder value creation model
Strong foundation to build on
Opportunities for Amcor
• Generating our own growth -customer focus, innovation, M&A
• Increasing agility and adapting our operations – organisation, cost structure, asset base
• Strengthening and engaging our talent
Accelerating efforts in each area
For
per
sona
l use
onl
y

Current operating priorities
19
Accelerating and building momentum in each area
Current operating priorities ProgressGenerating our own growth
(customer focus, innovation, emerging markets,M&A)
• Market share gains
• Investing in new plants
• Philippines, Indonesia and USA
• 8 acquisitions announced since 30 June 2015
• 1 in each Business Group
Increasing agility and adapting our operations
(organisation, cost structure, asset base)
• Flexibles restructuring program
• Ongoing footprint consolidation
• Venezuela
Strengthening and engaging our talent • Global Management Team refresh
• Highest ever engagement survey scores
For
per
sona
l use
onl
y

Future earnings to benefit from increase in acquisitions
0
100
200
300
400
500
600
700
2012 2013 2014 2015 2016
US
$ m
illio
n sp
end
Rigid PlasticsFlexibles AmericasFlexibles EuropeTobacco PackagingFlexibles Asia Pacific
20
Total spend (US$m)(1) 273 191 104 58 655
Number of acquisitions 3 4 3 2 8
1. Based on announced acquisition cost.
For
per
sona
l use
onl
y

Strategy and growth
21
Substantial opportunities to deliver on shareholder value proposition
Objective is clear Delivery is enabled by:
Business Portfolio – strong businesses with significant growth potential
Unique Capabilities - sources of differentiation and competitive advantage
Total shareholder value of 10-15% per
annum with low volatilit y
For
per
sona
l use
onl
y

22
Growth opportunity - Flexibles Americas
Significant opportunity to accelerate growth in the Americas region
Market share
Amcor <5%25%
75%
Global Flexible packaging demand by region
Americas ROW
For
per
sona
l use
onl
y

23
Growth opportunity – non beverage rigid plastics
Significant growth opportunity to continue building Diversified Products business
• Differentiation and competitive advantage
• Materials and production technologies
• Barrier and decoration capabilities
• Footprint
• Significant growth opportunities
• Conversions from other packaging formats
• Increasing share of wallet with existing customers
• Acquisition opportunities
Food
Spirits
Personal / Home Care
Pharmaceutical
For
per
sona
l use
onl
y

Summary
24
• Strong financial performance
• Balanced earnings growth, strong cash flow and balance sheet
• US$1.2 billion cash deployed for shareholders
• Good progress against strategic priorities
• Defensive and resilient with substantial growth potential
Strong result delivered despite a challenging macroeconomic environment F
or p
erso
nal u
se o
nly
Full Year ResultsAppendix slides
For
per
sona
l use
onl
y

Results
26
Sales revenue 9,611.8 9,421.3 - - 9,611.8 9,421.3
PBITDA 1,420.4 929.7 11.8 (479.6) 1,408.6 1,409.3
- Depreciation and amortisation (355.3) (354.0) - - (355.3) (354.0)
PBIT 1,065.1 575.7 11.8 (479.6) 1,053.3 1,055.3
- Net finance costs (169.2) (166.8) - - (169.2) (166.8)
Profit before tax 895.9 408.9 11.8 (479.6) 884.1 888.5
- Income tax expense (188.0) (135.3) (2.6) 52.6 (185.4) (187.9)
- Non-controlling interest (27.6) (29.5) - - (27.6) (29.5)
Profit after tax 680.3 244.1 9.2 (427.0) 671.1 671.1
Statutory result Adjustments (1) Underlying result
(US$ million) 2015 2016 2015 2016 2015 2016
1. Refer slide 47 for further details.
Key RatiosPBIT/Sales Margin 11.0 11.2
PBIT/Average funds employed (%) 20.3 21.6EPS (US cents) 55.8 57.7Free cash flow 298.3 311.2
For
per
sona
l use
onl
y
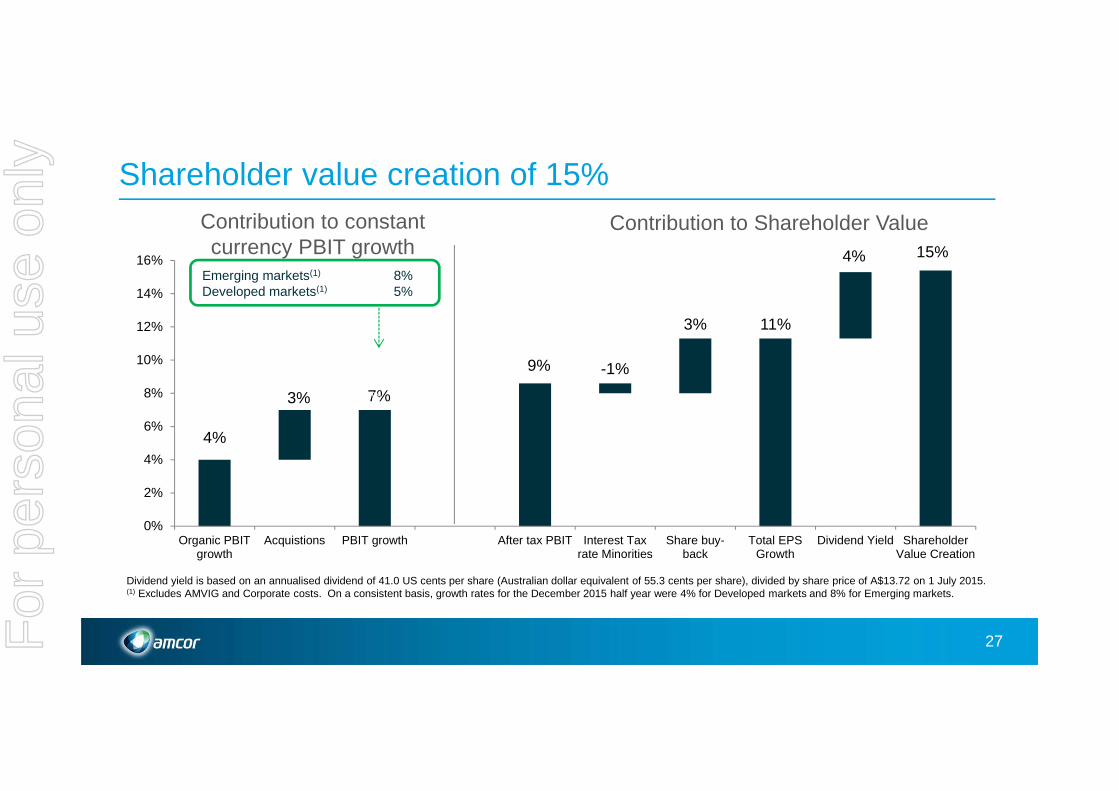
Shareholder value creation of 15%
4%
9%
11%
3% 7%
-1%
3%
4%
0%
2%
4%
6%
8%
10%
12%
14%
16%
Organic PBITgrowth
Acquistions PBIT growth After tax PBIT Interest Taxrate Minorities
Share buy-back
Total EPSGrowth
Dividend Yield ShareholderValue Creation
3%
15%
27
Contribution to constant currency PBIT growth
Contribution to Shareholder Value
Dividend yield is based on an annualised dividend of 41.0 US cents per share (Australian dollar equivalent of 55.3 cents per share), divided by share price of A$13.72 on 1 July 2015.(1) Excludes AMVIG and Corporate costs. On a consistent basis, growth rates for the December 2015 half year were 4% for Developed markets and 8% for Emerging markets.
Emerging markets(1) 8%Developed markets(1) 5%
For
per
sona
l use
onl
y

FX Translation impact
28
Euro, 25-30%
Other currencies,
30-40%
USD, 35-40%
PAT currency exposures (1)
Euro:USD
Increase in average USD to Euro rate FY 16 0.9011 vs FY 15 0.8312
US$ million impact on PAT for FY 16
Increase in Jul 16 average USD to Euro rate 0.9043 vs FY 16 average rate of 0.9011
8% 14 <1%
Other currencies (2):USD
Weighted average increase in average USD to other currencies ratesFY 16 vs FY 15
US$ million impact on PAT for FY 16
Weighted average Jul 16 USD to other currencies rates vs FY 16 weighted average
14% 37 <1%
1. Approximate range.2. Includes all currencies other than USD and Euro.
Total currency impact US$ million
PBIT (71)
PAT (51)
For
per
sona
l use
onl
y

Flexibles full year outlook for 2016/17
29
In constant currency terms, the Flexibles segment is expected to deliver particularly strong PBIT growth in the 2016/17 year, compared with PBIT of €681.2 million achieved in the 2015/16 year. This outlook takes into account:• modest organic growth across the Flexibles segment, inclusive of an unfavourable customer destocking impact within
the tobacco packaging business in the first half; • an additional 11 months of acquired earnings from the Alusa business. For the full year synergy benefits will be offset
by integration costs.• Synergy benefits and integration costs are expected to be a net expense of approximately US$5 to US$10 million in the first
half of the year; and• Synergy benefits and integration costs are expected to be a net benefit of approximately US$5 to US$10 million in the second
half of the year.• in addition to Alusa, the business is expected to generate modest growth from other recently acquired businesses, net
of integration costs; and• restructuring benefits of approximately €9 to €13 million (US$10 to US$15 million) are expected to be delivered in the
second half of the year.Given the timing of restructuring benefits, the timing of integration costs and synergy benefits related to the Alusa acquisition and the timing of inventory movements in the Tobacco Packaging business, overall growth is expected to be significantly weighted towards the second half of the year. PBIT growth in the first half is expected to be moderate compared with €321.0 million achieved in the first half of the 2015/16 year.
For
per
sona
l use
onl
y

Rigid Plastics full year outlook for 2016/17
30
The outlook for the Rigid Plastics segment in the 2016/17 year, compared with PBIT of US$352.5 million achieved in the 2015/16 year, takes into account:• the decision announced on 9 June 2016 to eliminate Amcor’s financial exposure to Venezuela. As a
result, PBIT for the year ended 30 June 2017 will be negatively impacted by approximately US$40 million. Of this amount, approximately US$25 million will negatively impact the December 2016 half year;
• continued growth in Latin America excluding Venezuela, notwithstanding the challenging conditions in some countries;
• solid volume growth in North America, at rates lower than those achieved in the 2015/16 year given timing of market share gains; and
• benefits from the Encon and Plastic Moulders acquisitions.
For
per
sona
l use
onl
y
Finance and cash expectations – FY17
Net financing costs between US$185 and US$195 million in constant currency terms
• Cash costs in line with P&L charge
Effective tax rate between 21% and 23%
• Cash tax 85-95% of P&L charge
Corporate costs US$70 – US$80 million taking into account current exchange rates
Free cash flow between US$150 and US$250 million
31For
per
sona
l use
onl
y
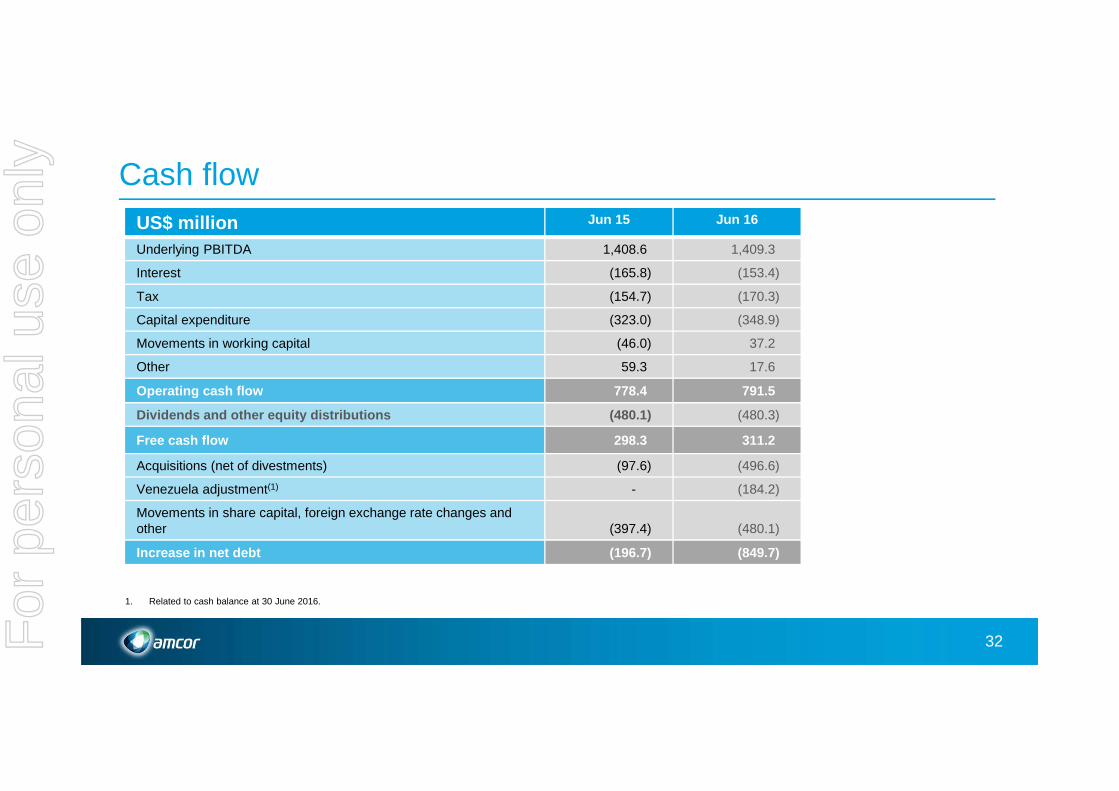
Cash flowUS$ million Jun 15 Jun 16
Underlying PBITDA 1,408.6 1,409.3
Interest (165.8) (153.4)
Tax (154.7) (170.3)
Capital expenditure (323.0) (348.9)
Movements in working capital (46.0) 37.2
Other 59.3 17.6
Operating cash flow 778.4 791.5
Dividends and other equity distributions (480.1) (480.3)
Free cash flow 298.3 311.2
Acquisitions (net of divestments) (97.6) (496.6)
Venezuela adjustment(1) - (184.2)
Movements in share capital, foreign exchange rate changes and other (397.4) (480.1)
Increase in net debt (196.7) (849.7)
32
1. Related to cash balance at 30 June 2016.
For
per
sona
l use
onl
y

Working capital performance
Amcor average working capital to sales (1) (%)
33
(1) Working capital to sales from Jun 2013 onwards exclude the demerged Orora business. Prior periods are presented inclusive of Orora.
Working capital to sales ratio continues to improve
9.6%7.9%
9.6% 9.5% 8.7% 8.9% 8.6% 8.3%
Jun 09 Jun 10 Jun 11 Jun 12 Jun 13 Jun 14 Jun 15 Jun 16
For
per
sona
l use
onl
y
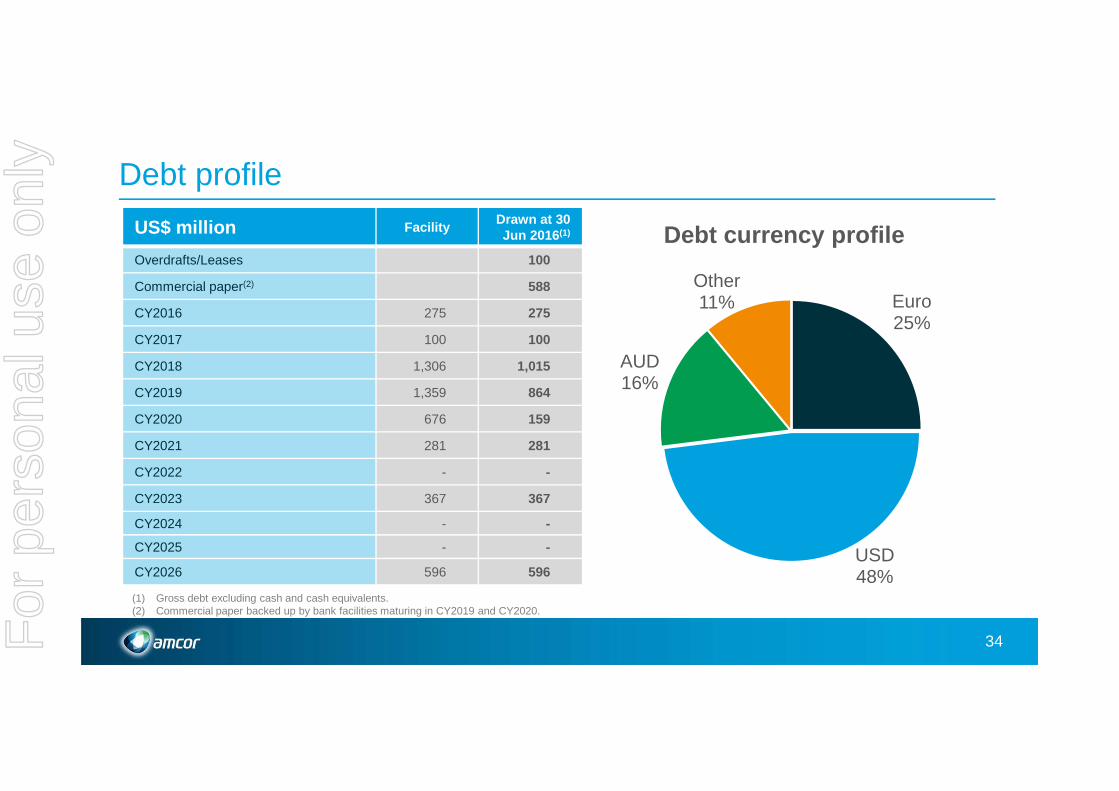
Debt profile
Debt currency profile
34
Euro25%
USD48%
AUD16%
Other11%
US$ million FacilityDrawn at 30 Jun 2016 (1)
Overdrafts/Leases 100
Commercial paper(2) 588
CY2016 275 275
CY2017 100 100
CY2018 1,306 1,015
CY2019 1,359 864
CY2020 676 159
CY2021 281 281
CY2022 - -
CY2023 367 367
CY2024 - -
CY2025 - -
CY2026 596 596
(1) Gross debt excluding cash and cash equivalents.(2) Commercial paper backed up by bank facilities maturing in CY2019 and CY2020.
For
per
sona
l use
onl
y

Rigid Plastics
36%
Flexibles64%
Focused portfolio and balanced global footprint
FY16 Sales
35
Emerging Markets
32%
Nth America32%
Western Europe
31%
Australia, NZ5%
FY16 Sales
Focused portfolio Balanced global footprint
For
per
sona
l use
onl
y

Plastics72%
Fibre15%
Aluminium13%
Focused portfolio – by substrate and end market
FY16 sales by end market
36
Food33%
Beverage33%
Tobacco Packaging15%
Healthcare14%
Home & Personal care3%
Other2%
FY16 sales by substrate
Common substrates Defensive end markets
For
per
sona
l use
onl
y

Historic performance – Half yearly sales revenue
(million) Jun 09
Dec 09
Jun 10
Dec 10
Jun 11
Dec 11
Jun 12
Dec 12
Jun 13
Dec 13
Jun 14
Dec 14
Jun 15
Dec 15
Jun 16
Flexibles € 869 869 1,940 2,248 2,329 2,272 2,411 2,534 2,553 2,467 2,529 2,521 2,711 2,706 2,760
Rigid Plastics US$ 1,203 1,064 1,194 1,417 1,693 1,625 1,740 1,497 1,682 1,490 1,702 1,563 1,754 1,562 1,795
Orora A$ 1,421 1,398 1,402 1,470 1,366 1,479 1,393
Investments/Other
US$ - - 68 71 49 - - - - - - - - -
Total (1) US$ 3,393 3,521 5,106 5,848 6,438 6,275 6,306 4,719 5,025 4,796 5,168 4,809 4,803 4,548 4,873
37
(1) Total US dollar sales from Dec 08 to Dec 12 reflects total sales as reported in Australian dollars, converted at the average exchange rate for the period. Total sales revenue from Dec 08 to Jun 12 includes the demerged Orora business. Dec 12 onwards is presented excluding Orora.
For
per
sona
l use
onl
y

Historic performance – Half yearly PBIT
(million) Jun 09
Dec 09
Jun 10
Dec 10
Jun 11
Dec 11
Jun 12
Dec 12
Jun 13
Dec 13
Jun 14
Dec14
Jun 15
Dec 15
Jun 16
Flexibles(2) € 80 81 171 198 252 246 281 280 308 289 317 308 344 321 360
Rigid Plastics(3) US$ 103 82 104 101 139 117 156 128 159 128 170 139 182 154 199
Orora(1) A$ 50 82 78 100 60 90 63
Investments/Other
US$ (7) (10) - (6) (14) (16) (24) (22) (16) (24) (15) (17) (25) (19) (34)
Total (1) US$ 239 260 405 453 540 532 563 463 547 492 590 519 546 489 566
38
(1) Total US dollar PBIT from Dec 08 to Dec 12 reflects total PBIT as reported in Australian dollars, converted at the average exchange rate for the period. Total PBIT from Dec 08 to Jun 12 includes the demerged Orora business. Dec 12 onwards is presented excluding Orora.
(2) H2 2016 adjustments relate to non-recurring restructuring initiatives within the flexibles segment announced on 9 June 2016.(3) Adjustment related to a non-recurring charge related to the business in Venezuela.
For
per
sona
l use
onl
y

Historic performance – Average funds employed
(million) Jun 09
Dec 09
Jun 10
Dec 10
Jun 11
Dec 11
Jun 12
Dec 12
Jun 13
Dec 13
Jun 14
Dec 14
Jun 15
Dec 15
Jun 16
Flexibles € 1,009 981 1,463 2,195 2,209 2,195 2,199 2,447 2,457 2,515 2,498 2,529 2,560 2,611 2,643
Rigid Plastics
US$ 1,601 1,453 1,460 1,786 1,804 1,798 1,753 1,738 1,699 1,649 1,630 1,599 1,582 1,513 1,512
Orora(1) A$ 1,713 1,575 1,605 1,679 1,592 1,638 1,632
Investments/Other
US$ 397 386 487 628 631 505 525 498 542 602 561 539 527 437 449
Total (1) US$ 4,708 4,614 5,368 6,913 7,025 7,024 6,907 5,355 5,421 5,628 5,581 5,394 5.189 4,831 4,894
39
(1) Total US dollar AFE from Dec 08 to Dec 12 reflects total AFE as reported in Australian dollars, converted at the average exchange rate for the period. Total AFE from Dec 08 to Jun 12 includes the demerged Orora business. Dec 12 onwards excludes Orora.
For
per
sona
l use
onl
y

Flexibles – Historic performance half yearly sales
Sales€ million
Jun 09
Dec 09
Jun 10
Dec 10
Jun 11
Dec 11
Jun 12
Dec 12
Jun 13
Dec 13
Jun 14
Dec14
Jun 15
Dec 15
Jun 16
Europe, Middle East and Africa(1)
620 589 1,360 1,552 1,604 1,492 1,558 1,503 1,563 1,475 1,556 1,231 1,341 1,315 1,328
Americas(1) 266 290 273 336
Tobacco Packaging
162 175 362 428 452 479 498 537 565 551 541 534 587 610 621
Asia Pacific 89 105 223 274 283 312 369 507 439 455 446 503 506 544 509
Eliminations (2) - (5) (6) (10) (11) (14) (13) (14) (14) (14) (13) (13) (36) (34)
Total 869 869 1,940 2,248 2,329 2,272 2,411 2,534 2,553 2,467 2,529 2,521 2,711 2,706 2,760
40
(1) Sales for Dec 2008 through to June 2014 are based on the legacy Flexibles Europe and Americas business group. Effective 1 July 2015 the Flexibles Europe and Americas business group was separated into two separate busiensses – Flexibles Europe, Middle East and Africa and Flexibles Americas. Comparative information for Dec 14 and Jun 15 has been restated accordingly.
For
per
sona
l use
onl
y

Flexibles – raw material input costs
41
Rolling quarterly weighted average index for Western European Polyethylene & Polyethylene resins and film and PET film expressed in Euro’s,Rolling quarterly average index for LME aluminium prices expressed in Euro’s,
60
80
100
120
140
160
180
200
220
Resins Aluminium
For
per
sona
l use
onl
y
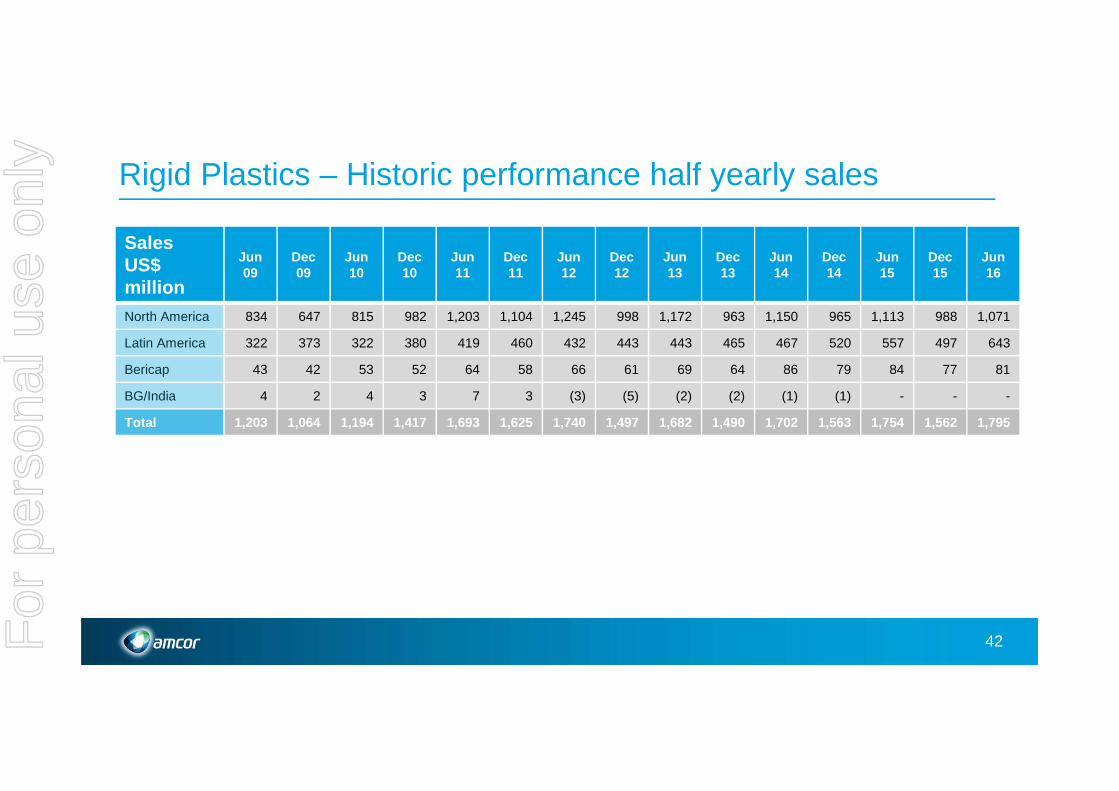
Rigid Plastics – Historic performance half yearly sales
SalesUS$ million
Jun 09
Dec 09
Jun 10
Dec 10
Jun 11
Dec 11
Jun 12
Dec 12
Jun 13
Dec 13
Jun14
Dec 14
Jun 15
Dec 15
Jun 16
North America 834 647 815 982 1,203 1,104 1,245 998 1,172 963 1,150 965 1,113 988 1,071
Latin America 322 373 322 380 419 460 432 443 443 465 467 520 557 497 643
Bericap 43 42 53 52 64 58 66 61 69 64 86 79 84 77 81
BG/India 4 2 4 3 7 3 (3) (5) (2) (2) (1) (1) - - -
Total 1,203 1,064 1,194 1,417 1,693 1,625 1,740 1,497 1,682 1 ,490 1,702 1,563 1,754 1,562 1,795
42For
per
sona
l use
onl
y

36%
40%
24%
46%
34%
21%
Rigid Plastics – product mix
Latin America Sales revenue (1)
USD 1,140 million
43
63%
22%
15%
North America Sales revenue (1)
USD 2,059 millionTotal Sales revenue (1)
USD 3,357 million
(1) Sales for the full year ended 30 June 2016.
� CSDW� Custom� Diversified Products
For
per
sona
l use
onl
y

Rigid Plastics – North AmericaCustom Containers
7,27
9
7,73
3
454
0
1,000
2,000
3,000
4,000
5,000
6,000
7,000
8,000
9,000
FY 2015 Growth FY 2016
Mill
ion
units
4447
4
484
(12.3) 18.73.6
0
100
200
300
400
500
600
FY 2015 Raw materialpass through
Acquistion Improvedmix / Growth
FY 2016
Sal
es r
even
ue (
US
$ m
illio
ns)
Diversified Products
For
per
sona
l use
onl
y

Investments / other
PBIT (US$ million) Jun 11 Jun 12 Jun 13 Jun 14 Jun 15 Jun 16
AMVIG 33.7 34.0 26.2 19.8 21.3 18.2
Glass Tubing 18.2 - - - - -
Corporate costs(1) (71.5) (73.7) (63.7) (59.7) (62.0) (71.3)
Total (19.6) (39.7) (37.5) (39.8) (40.7) (53.1)
45
Corporate costs for 2016/17 expected to be US$70-US$80 million(2)
(1) In the 2012/13, 2013/14 and 2014/15 years, corporate costs included net one-off benefits. In both the 2013/14 and 2014/15 years this benefit was approximately A$11 million and related to benefits from changes to pension plans and legal claims.
(2) Taking into account current exchange rates.
For
per
sona
l use
onl
y

46
Historical acquisitions
Average annual spend US$280 million, attractive multiples and strong synergy opportunities
Business group Country Completion date
Currency Acquisition price (Local currency
millions)
EBITDAMultiple
Acquired sales (Local currency
millions)
Synergy:Acquired
sales Alcan Packaging Flexibles Global H2 2010 USD 1,948 5.1 4,100 5%Alcan Medical Flexibles Flexibles Europe, Middle East & Africa USA H1 2011 USD 65.2 115Ball Plastics Packaging Rigid Plastics USA H1 2011 USD 280.0 4.0 600 6%B-Pack Due Flexibles Europe, Middle East & Africa Italy H1 2011 EUR 43.0 4.9 43Techni-Chem Flexibles Asia Pacific Australia H1 2011 AUD 40Beijing VPS minority interests Flexibles Asia Pacific China H2 2012 AUDAperio Flexibles Asia Pacific Australia H2 2012 AUD 238.0 6.0 350 7%International Playcard & Label Company Tobacco Packaging Argentina H1 2013 USD 16Uniglobe Flexibles Asia Pacific India H1 2013 AUD 19.8 20Aluprint Tobacco Packaging Mexico H1 2013 USD 40.0 30Chengdu minority interests Flexibles Asia Pacific China H1 2013 AUDShorewood Tobacco Packaging Global H2 2013 USD 115.0 5.2 126 10%Jiangsu Shenda Group Flexibles Asia Pacific China H1 2014 RMB 350.0 8.0 440Parry Enterprises India Flexibles Asia Pacific India H1 2014 AUDDetmold Flexibles Asia Pacific Australia H1 2014 AUD 50.0 6.6 55Bella Prima Flexibles Asia Pacific Indonesia H1 2015 AUD 27.0 7.0 29Zhongshan TianCai Flexibles Asia Pacific China H2 2015 RMB 211.0 7.1 280Nampak Flexibles Flexibles Europe, Middle East & Africa South Africa H1 2016 ZAR 250.0 5.0 1100Souza Cruz in-house packaging Tobacco Packaging Brazil H1 2016 BRL 98 200Packaging India Private Limited Flexibles Asia Pacific India H1 2016 INR 1,650 2500Encon Rigid Plastics USA H1 2016 USD 55.0 110Deluxe Packages Flexibles Americas USA H1 2016 USD 45.0 42BPI China Flexibles Asia Pacific China H2 2016 USD 13.0Alusa Flexibles Americas South America H2 2016 USD 435.0 8.5 375Plastic Moulders Ltd Rigid Plastics Canada H2 2016 CAD 36.0 35
For
per
sona
l use
onl
y

Details of adjustments
47
US$ million
Flexibles (€ million) Flexibles Rigid Plastics
Investments / Other Consolidated
Income statement 2015 2016 2015 2016 2015 2016 2015 2016 201 5 2016
Sale of surplus land in Turkey(1) 9.2 11.8 11.8 -Flexibles Restructuring - (85.5) - (94.9) - - - - - (94.9)Change of accounting treatment Venezuela - - - - - (384.7) - - - (384.7)
Total PBIT adjustments 9.2 (85.5) 11.8 (94.9) - (384.7) - - 11.8 (479.6)
Tax on adjustments (2.0) 15.1 (2.6) 16.8 35.8 (2.6) 52.6
Total PAT adjustments 7.2 (70.4) 9.2 (78.1) (348.9) 9.2 (427.0)
(1) This item has not been presented as an adjustment in Amcor’s annual financial report. However, management believe it is useful to present underlying earnings exclusive of this item in order to facilitate comparability. This item was disclosed in Amcor’s earnings announcements for the year ended 30 June 2015 and the half year ended 31 December 2015.
For
per
sona
l use
onl
y
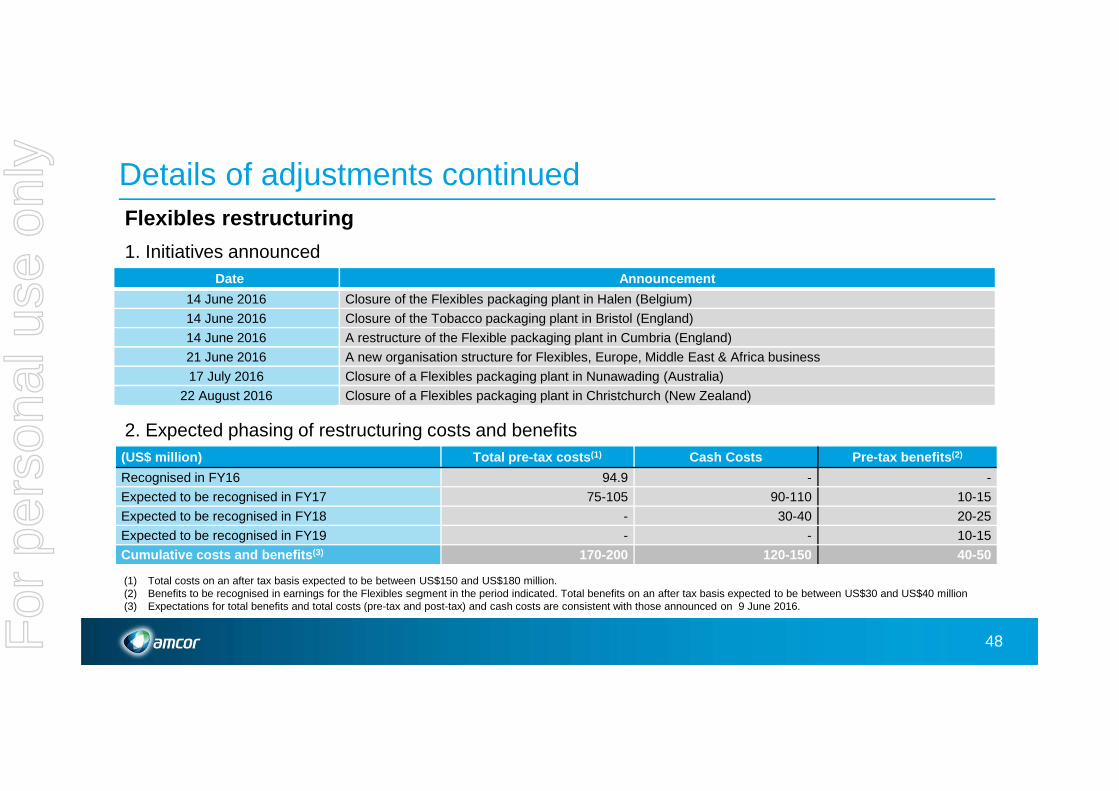
Details of adjustments continued
48
Date Announcement
14 June 2016 Closure of the Flexibles packaging plant in Halen (Belgium)
14 June 2016 Closure of the Tobacco packaging plant in Bristol (England)
14 June 2016 A restructure of the Flexible packaging plant in Cumbria (England)
21 June 2016 A new organisation structure for Flexibles, Europe, Middle East & Africa business
17 July 2016 Closure of a Flexibles packaging plant in Nunawading (Australia)
22 August 2016 Closure of a Flexibles packaging plant in Christchurch (New Zealand)
Flexibles restructuring
2. Expected phasing of restructuring costs and benefits
1. Initiatives announced
(US$ million) Total pre-tax costs (1) Cash Costs Pre-tax benefits (2)
Recognised in FY16 94.9 - -
Expected to be recognised in FY17 75-105 90-110 10-15
Expected to be recognised in FY18 - 30-40 20-25
Expected to be recognised in FY19 - - 10-15
Cumulative costs and benefits (3) 170-200 120-150 40-50
(1) Total costs on an after tax basis expected to be between US$150 and US$180 million.(2) Benefits to be recognised in earnings for the Flexibles segment in the period indicated. Total benefits on an after tax basis expected to be between US$30 and US$40 million(3) Expectations for total benefits and total costs (pre-tax and post-tax) and cash costs are consistent with those announced on 9 June 2016.
For
per
sona
l use
onl
y

Details of adjustments continued
49
VenezuelaAs announced on 9 June 2016, economic conditions in Venezuela deteriorated during the period and impacted the business environment, including the ability to convert local currency to the US dollars required for importing raw materials. As a result, a number of measures were taken to eliminate Amcor’s financial exposure to Venezuela. As outlined in the June announcement:• there was no impact on PBIT during the 2016 financial year. However, compared with 2016, PBIT in the 2017 financial year will be
negatively impacted by approximately US$40 million (unfavourable PAT impact of US$20 million); and • this resulted in a one-off charge of US$348.9 million (US$384.7 million pre-tax) at 30 June 2016 which has been excluded from
underlying earnings. After taking this one-off charge there is no material financial exposure on the Amcor balance sheet related to Venezuela.
Details of one-time charge and impact on balance sheet
(US$ million) Statutory earnings Net Assets
Profit after tax loss / Retained earnings (348.9)Reversal of foreign exchange translation losses previously recognised in equity(1) 147.9
Reversal of non-controlling interest previously recognised in equity(1) (26.3)
Reduction in total equity (227.3) (227.3)Other net assets (43.1)
Cash balance at 30 June 2016 (184.2)
(1) On reversal these amounts were recognised in earnings.
For
per
sona
l use
onl
y

The following notes provide further details of certain non-IFRS financial measures used throughout this presentation:
Operating cash flow is cash flow from operating activities calculated in accordance with IFRS and extracted from Amcor’s financial statements, adjusted to take into account capital expenditure and other items. This measure is reconciled to cash flow from operating activities as follows:
FY 15 FY 16Operating cash flow 778.4 791.5Capital expenditure 323.0 348.9Proceeds on disposal of PP&E (83.5) (30.4)Other items (15.6) (10.6)Cash flow from operating activities 1,002.3 1,099.4
Free cash flow is Operating cash flow (refer above) less dividends and other equity distributions paid during the period calculated in accordance with IFRS and extracted from Amcor’s financial statements.
Movement in net debt is reconciled to the net increase in cash held calculated in accordance with IFRS and extracted from Amcor’s financial statements as follows:
FY 15 FY 16Proceeds from borrowings (6,084.0) (5,701.2)Repayment of borrowings 5,698.7 5,036.2Net increase in cash held 193.7 (24.5)Effects of exchange rate changes on cash and cash equivalents (1.4) (159.6)Other items (3.7) (0.6)Cash Increase in net debt (196.7) (849.7)
Non-IFRS information
50For
per
sona
l use
onl
y


