24
Th G ldS i The Gold Symposium November 2011 November 2011 Les Davis - Managing Director www.silverlakeresources.com.au ABN: 38 108 779 782 ASX: SLR For personal use only

Th G ld S iThe Gold Symposium
November 2011November 2011
Les Davis - Managing Director
www.silverlakeresources.com.auABN: 38 108 779 782ASX: SLR
For
per
sona
l use
onl
y

Important Notice and Disclaimer
Silver Lake Resources Limited has prepared this presentation based on information available to it. No representation or warranty, express or implied, ismade as to the fairness, accuracy, completeness or correctness of the information, opinions and conclusions contained in this presentation.
All dollar terms expressed in this presentation are in Australian dollars unless otherwise statedAll dollar terms expressed in this presentation are in Australian dollars unless otherwise stated.
To the maximum extent permitted by law, none of Silver Lake Resources Limited, its directors, employees or agents, advisers, nor any other personaccepts any liability, including, without limitation, any liability arising from fault or negligence on the part of any of them or any other person, for any lossarising from the use of this presentation or its contents or otherwise arising in connection with it.
This presentation is not an offer invitation solicitation or other recommendation with respect to the subscription for purchase or sale of any security andThis presentation is not an offer, invitation, solicitation or other recommendation with respect to the subscription for, purchase or sale of any security, andneither this presentation nor anything in it shall form the basis of any contract or commitment whatsoever. This presentation may contain forward lookingstatements that are subject to risk factors associated with gold exploration, mining and production businesses. It is believed that the expectations reflectedin these statements are reasonable but they may be affected by a variety of variables and changes in underlying assumptions which could cause actualresults or trends to differ materially, including but not limited to price fluctuations, actual demand, currency fluctuations, drilling and production results,reserve estimations, loss of market, industry competition, environmental risks, physical risks, legislative, fiscal and regulatory changes, economic andfinancial market conditions in various countries and regions, political risks, project delay or advancement, approvals and cost estimates.financial market conditions in various countries and regions, political risks, project delay or advancement, approvals and cost estimates.
The information in this presentation that relates to mineral resources and exploration results are based on information compiled by Mr Christopher Banasik who is a Member of the Australasian Institute of Mining and Metallurgy. Any statement herein, direct or implied, as to a potential gold deposit is conceptual in nature and a reference to the targeted gold potential and not to any JORC compliant Mineral Resource. Mr Banasik is a full time employee of Silver Lake Resources Ltd, and has sufficient experience which is relevant to the style of mineralisation under consideration to qualify as a Competent Person as defined in the 2004 edition of the JORC Code. Mr Banasik has given his consent to the inclusion in this presentation of the matters based on the g pinformation in the form and context in which it appears.
The information in this presentation that relates to exploration and production targets refers to targets that are conceptual in nature, where there has beeninsufficient exploration to define a Mineral Resource and it is uncertain if further exploration will result in the determination of a Mineral Resource.
The information on exploration targets in this presentation are based on a conceptual range of targets as follows:p g p p g g
Tonnage range: 50 million to 100 million tonnes
Grade range: 3 g/t Au to 8 g/t Au
Ounces: 5 million to 10 million
Slide 2
For
per
sona
l use
onl
y
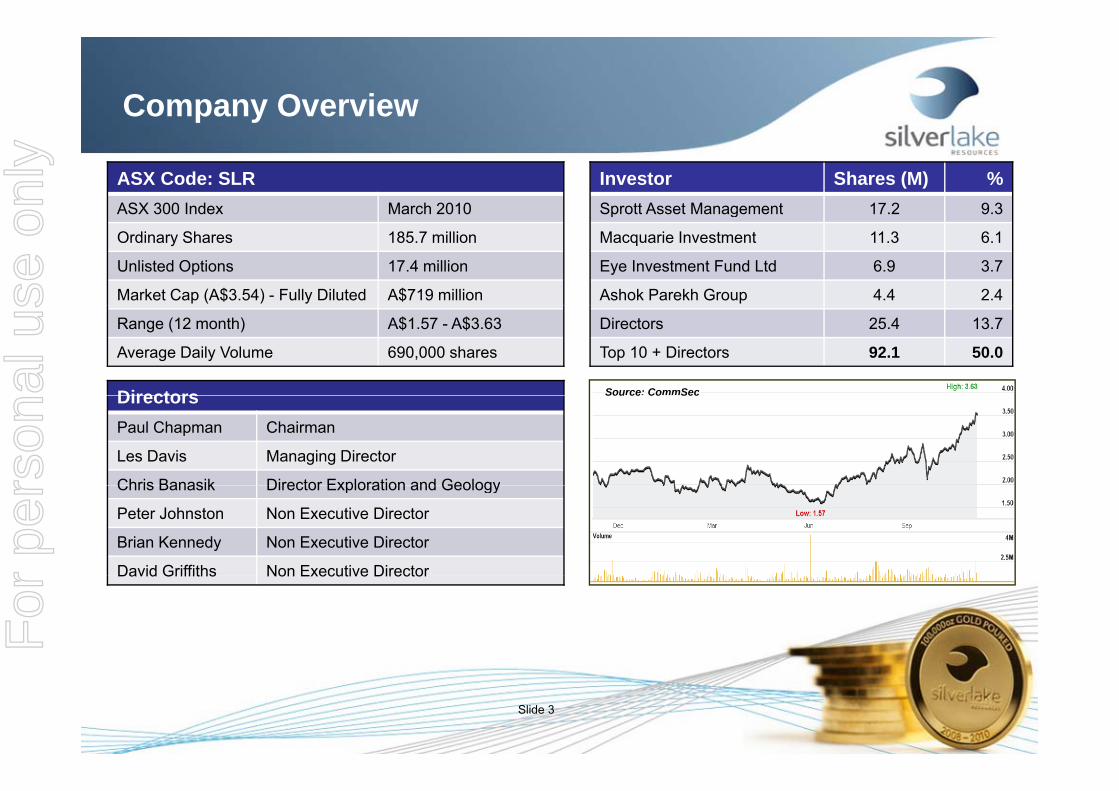
Company Overview
Investor Shares (M) %Sprott Asset Management 17.2 9.3
ASX Code: SLRASX 300 Index March 2010 p g
Macquarie Investment 11.3 6.1
Eye Investment Fund Ltd 6.9 3.7
Ashok Parekh Group 4.4 2.4
Ordinary Shares 185.7 million
Unlisted Options 17.4 million
Market Cap (A$3.54) - Fully Diluted A$719 million
Directors 25.4 13.7
Top 10 + Directors 92.1 50.0
Directors
Range (12 month) A$1.57 - A$3.63
Average Daily Volume 690,000 shares
Source: CommSecDirectorsPaul Chapman Chairman
Les Davis Managing Director
Chris Banasik Director Exploration and Geology
Sou ce Co Sec
Chris Banasik Director Exploration and Geology
Peter Johnston Non Executive Director
Brian Kennedy Non Executive Director
David Griffiths Non Executive DirectorDavid Griffiths Non Executive Director
Slide 3
For
per
sona
l use
onl
y

Company Performance
Equity Raising1:– November 2007 $30 million at $0.30 ps (IPO)$ $ p ( )
– October 2009 $18 million at $0.79 ps (accelerate exploration)
Results:$26 4 million cash & bullion (30 September 20112)– $26.4 million cash & bullion (30 September 20112)
– no debt, no hedging
– profitable every year since inception
– delivered low capital business outcomes
– purchased 4 mining areas & 2 mills
– produced over 200,000 ounces of gold from Mount Monger
– added over 2.5 million ounces to global resource base
– extended mine life from 2 to >10 years
– high grade copper discovery at Hollandaire
– board decision to mine Murchison 12 Nov 2011
1: Excludes capital raising as announced to ASX 14 November 20112: Excludes funds from capital raising as announced to ASX 14 November 2011
Slide 4
p g
For
per
sona
l use
onl
y

Investment Highlights
Mount Monger - 1.5 Moz Au high grade resource1 (8.9 g/t Au):– 4 underground producing mines & 1 open pit– pipeline of other ore sources4
– expanding processing facility to 1mtpa by H2 2012– targeting sustained production of ~ 200,000 oz pa by 2014
t d i lif f 10– expected mine life of >10 years Murchison - 1.7 Moz Au resource1 (2.8 g/t Au):
– production Q3 FY1314 open pit2 & 4 underground3 feed sources– 14 open pit2 & 4 underground3 feed sources
– ~100,000 oz per annum, 8 to 10 year mine life– <2 year payback period at A$1,400 oz Au price
Strong production growth profile:Strong production growth profile:– two large gold production centres– multiple surface and underground mines
Eelya Complex– high grade copper discovery at Hollandaire– further base metal potential5
1: Refer to slide 24 - JORC Resource Inventory2: Murchison U/G resource grade = 4.2 g/t Au3: Murchison O/P resource grade = 2 3 g/t Au
Slide 5
3: Murchison O/P resource grade = 2.3 g/t Au4: Mining reserves being finalised5: Refer to slide 2 - Exploration Targets
For
per
sona
l use
onl
y
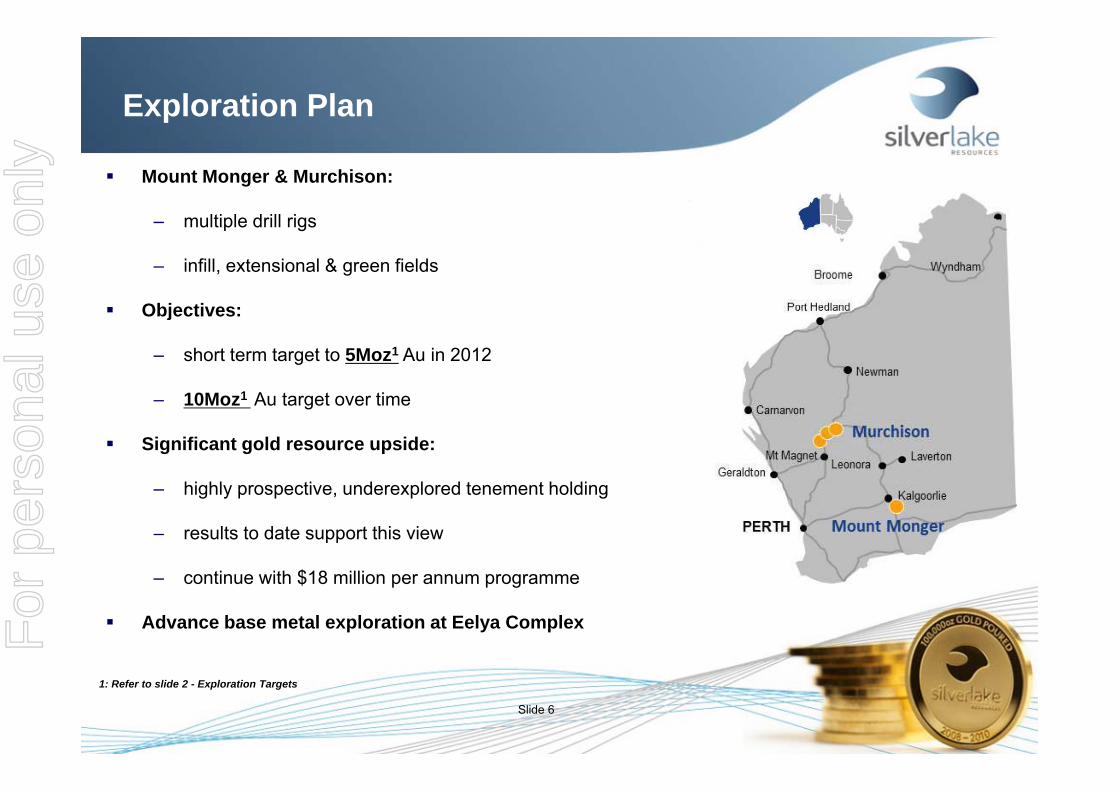
Exploration Plan
Mount Monger & Murchison:
lti l d ill i– multiple drill rigs
– infill, extensional & green fields
Obj ti Objectives:
– short term target to 5Moz1 Au in 2012
10M 1 A t t ti– 10Moz1 Au target over time
Significant gold resource upside:
highly prospective underexplored tenement holding– highly prospective, underexplored tenement holding
– results to date support this view
continue with $18 million per annum programme– continue with $18 million per annum programme
Advance base metal exploration at Eelya Complex
Slide 6
1: Refer to slide 2 - Exploration Targets
For
per
sona
l use
onl
y

Resource Growth
6
4
5
es Add d 1 illi f 2 ti
3
Milli
on O
unce Added ~1 million ounces per annum for 2 consecutive years
1
2M
0 Nov 2007
(IPO)Jun-08 Jun-09 Jun-10 Jun-11 June-12
TargetRange
FutureYears
“We have demonstrated our ability to rapidly grow the resource base at <$10 oz”
1: Refer to slide 24 - JORC Resource Inventory
Mount Monger Murchison
Slide 7
1: Refer to slide 24 - JORC Resource Inventory2: Refer to slide 2 - Exploration Targets3: Murchison resource includes Rothsay4: 2007 to 2011 depletion: 202koz
For
per
sona
l use
onl
y

Conceptual Production Targets
Mount Monger Murchison Cash Operating Cost
600
700
300
350
Ounc
e
400
500
200
250
g Co
st p
er O
per A
nnum Gold Sales FY12
H1 35 to 40kozH2 65 to 70koz
Total 100 to 110koz
200
300
100
150
sh O
pera
ting
000
Ounc
es
9 day shut Dec 11 to tie in mill expansion
0
100
0
50 A$ C
as,0
1. Pending exploration success2. CONCEPTUAL TARGETS ONLY - Refer to disclaimer on slide 23. Australian financial years, 1 July to 30 June4 Contained gold in mine production
00 FY11 Actual FY12 Target FY13 Target FY14 Target FY15 Target
Slide 8
4. Contained gold in mine production5. Cash operating cost is for Mount Monger only
& excludes royalties
For
per
sona
l use
onl
y

Key Requirements To Achieve Targets
1. Ongoing exploration:
– $18 million per annum programme $ p p g
– committed to long term exploration
2. Debottleneck Mount Monger underground mines:
– construction of $5 million ventilation shaft
– completed on time & on budget 3. Debottleneck Lakewood Gold Processing Facility (LGPF):
– upgrade to 1 million tpa by H2 2012
– in progress and on track
4. Murchison production:
commence construction January 2012– commence construction January 2012
– in progress and on track
Slide 9
For
per
sona
l use
onl
y

Mount Monger Location
50 km south east of Kalgoorlie:
a world class gold region– a world class gold region
– produced >60Moz
– excellent access to suppliersexcellent access to suppliers
– residential workforce
Access:
– via Mount Monger Road
Land holding:
– ~160 sqkm
Slide 10
For
per
sona
l use
onl
y

Mount Monger Overview
Quality high grade resource:
– 5.1 million tonnes at 8.9 g/t Au for 1.5Moz1 Northg
– high grade mineralised system
– multiple lines of mineralisationDaisy Milano Mine Site
– over 10 km of strike
2.4 to 4.5Moz gold potential2 :
– Anglo due diligence report (2003)
Daisy Milano Mine Site
– 9 independent zones <500 metres depth
Underexplored along strike and at depth:
l 3% f h l d ill d 100 t– only 3% of holes drilled >100 metres
− mineralisation tested to 900 metres and open at depth
Pipeline of other ore sources:
– 3.1 million tonnes @ 4.6 g/t Au for 454,000 oz1
– mining studies in progress for Wombola Pit & Magic
Slide 11
1: Refer to slide 24 - JORC Resource Inventory2: Refer to slide 2 - Exploration Targets
For
per
sona
l use
onl
y

Ore Sources To Achieve 200,000 oz pa?
Daisy Milano:
− produced > 320,000 oz of gold1200
p , g
− current resource of 618,000 oz
− endowed with >1,000 oz per vertical metre
mineralisation remains open below 900 metres- 400
- 200
− mineralisation remains open below 900 metres
− potential to produce a total of over 1Moz
− becoming significant on a regional scale - 600
− near mine exploration targeting “the next one”
“Three Daisy Milano Strategy”:
− three independent underground mines- 800
West
p g
− accessed from same infrastructure
− development in place by 2014
producing 60 000 pa each
Schematic view of Daisy Milano
− producing ~60,000 pa each
+ open pit production = 200,000 oz pa by 2014
Slide 12
1: Since inception
For
per
sona
l use
onl
y

Daisy Milano ~ 10 year Life of Mine
Ventilation Shaft
- 200
East
Daisy Milano- 400
Daisy Deeps
- 600
Mine developed down to 620 vertical metres
- 800
WestOpen
Slide 13
p
Ventilation shaft completed June 2011
For
per
sona
l use
onl
y

4 Underground Mines
Ventilation Shaft1. Daisy Milano
2. Daisy East
Daisy EastDaisy East
Rosemary- 200
2. Daisy East
3. Haoma
4. Rosemary#4
East
Daisy Milano
Ventilation Shaft
Daisy Milano
Ventilation Shaft
y
Daisy Milano
y
- 400 #1
#2
Haoma
600#3
Daisy DeepsDaisy Deeps
Daisy Deeps
- 600
- 800West
Multiple New Structures
All accessible from same infrastructure containing 1 Moz of resource
Open
Slide 14
All accessible from same infrastructure containing 1 Moz of resource
For
per
sona
l use
onl
y

Haoma - The Next Daisy Milano?
Ventilation Shaft
Daisy EastDaisy East
Rosemary- 200
East
Daisy Milano
Ventilation Shaft
Daisy Milano
Ventilation Shaft
y
Daisy Milano
y
- 400
Haoma
600
65,000 oz
170 000 oz
Daisy DeepsDaisy Deeps
Daisy Deeps
- 600
Drilling Programme
Haoma 32 North Ore Drive
170,000 oz
- 800West
Multiple New Structures
June 2011 resource: 238,900 tonnes at 30.46 g/t Au for 235,000 oz
Haoma 32 North Ore Drive
3 metres wide at 80 g/t AuOpen
Slide 15
, g ,
For
per
sona
l use
onl
y

Multiple New Structures - Increasing OVM
Ventilation Shaft
Daisy EastDaisy East
Rosemary- 200
East
Daisy Milano
Ventilation Shaft
Daisy Milano
Ventilation Shaft
y
Daisy Milano
y
- 400
600
65,000 oz
Daisy DeepsDaisy Deeps
Daisy Deeps
- 600
“OVM”: Ounces Per Vertical Metre
Open- 800West
OpenMultiple New Structures
Slide 16
For
per
sona
l use
onl
y

Murchison - Overview
Located 600 km north of Perth Large project area:
− Tuckabianna, Comet & Moyagee Historic production:
– 500,000 oz (A$400 oz gold price environment)L hi h d Large high grade resource:
– 18.4 million tonnes at 2.8 g/t gold for 1.7Moz1
– 65 km strike, under drilled >100 m Surrounded by multi million ounce gold deposits Surrounded by multi million ounce gold deposits
– Big Bell (4Moz), Great Fingall (2Moz), Hill 50 (2Moz)– largest regional deposits were all underground mines
Target base case production plan:g p p– 1.2mtpa at ~3.0 g/t Au– 14 open pit & 4 underground ore sources– ~100,000 oz per annum, 8 to 10 year mine life
Eelya Complex:– high grade copper discovery at Hollandaire– further base metal potential2
Slide 17
1: Refer to slide 24 - JORC Resource Inventory2: Refer to slide 2 - Exploration Targets
For
per
sona
l use
onl
y
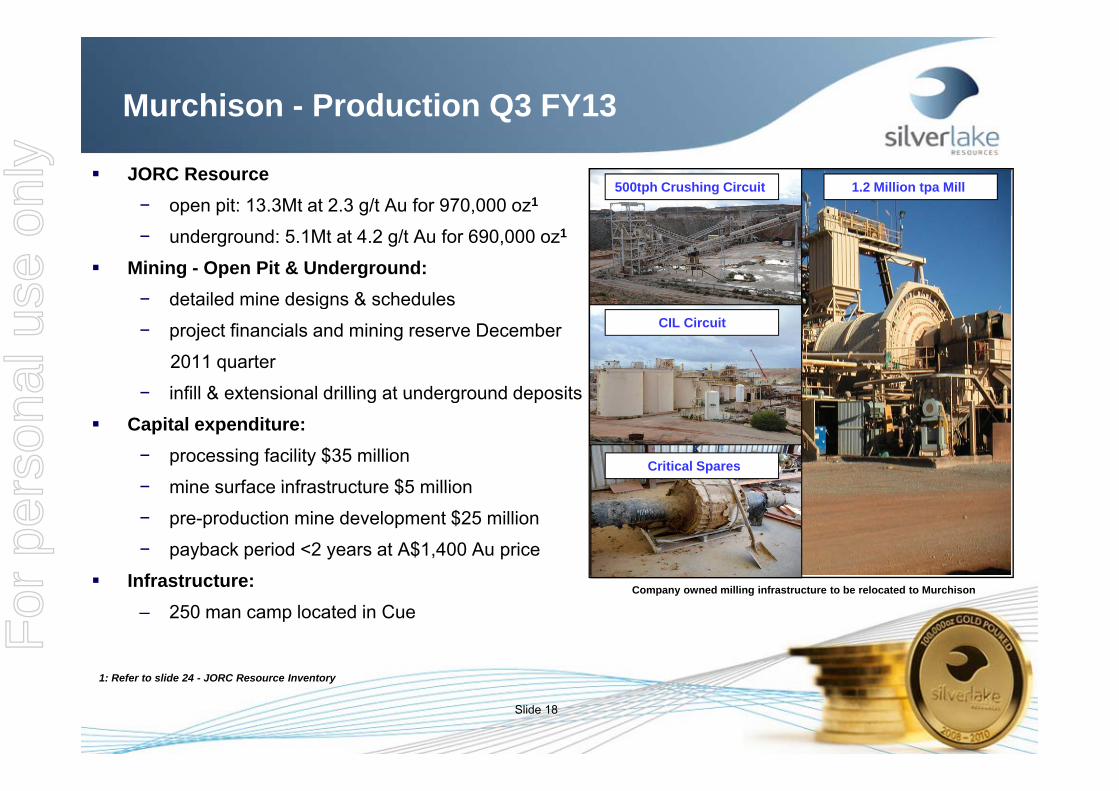
Murchison - Production Q3 FY13
JORC Resource− open pit: 13.3Mt at 2.3 g/t Au for 970,000 oz1
500tph Crushing Circuit 1.2 Million tpa Mill
− underground: 5.1Mt at 4.2 g/t Au for 690,000 oz1
Mining - Open Pit & Underground:− detailed mine designs & schedulesg
− project financials and mining reserve December
2011 quarter
− infill & extensional drilling at underground deposits
CIL Circuit
infill & extensional drilling at underground deposits
Capital expenditure:− processing facility $35 million
mine surface infrastructure $5 millionCritical Spares
− mine surface infrastructure $5 million
− pre-production mine development $25 million
− payback period <2 years at A$1,400 Au price
I f t t Infrastructure:– 250 man camp located in Cue
Company owned milling infrastructure to be relocated to Murchison
Slide 18
1: Refer to slide 24 - JORC Resource Inventory
For
per
sona
l use
onl
y

Deeper Drilling Confirming Resource Potential
Tuckabianna West:− 2.0m at 16.2 g/t Au from 94m
Tuckabianna West− 3.0m at 18.3 g/t Au from 143m− 3.9m at 15.4 g/t Au from 170m− 9.0m at 5.7 g/t Au from 370m
Tuckabianna West
Caustons:− 7.1m at 25.6 g/t Au from 209m− 4.6m at 10.9 g/t Au from 210m− 2.0m at 19.7 g/t Au from 115m
Comet:− 3.8m at 5.4 g/t Au from 200m
3 0 t 3 6 /t A f 245− 3.0m at 3.6 g/t Au from 245m− 2.5m at 3.6 g/t Au from 243m
Lena:2 0 t 81 0 /t A f 81
Schematic long section showing mine layout & extensional drilling programme
− 2.0m at 81.0 g/t Au from 81m− 5.0m at 57.0 g/t Au from 102m− 6.0m at 31.0 g/t Au from 355m
Slide 19
For
per
sona
l use
onl
y

Time Line & Targeted Production Profile
150O i i l l ti
Drilling strike & depth extensions at underground deposits
Ongoing regional exploration
100
cse
per A
nnum
Construct &Produce 50koz Au
50,000
Oun
Jan 12 - Jun 13
0FY11 FY12 FY13 FY14 FY15 FY16 FY17 FY18
1. Pending exploration success2. CONCEPTUAL TARGETS ONLY - Refer to disclaimer on slide 2
FY11 FY12 FY13 FY14 FY15 FY16 FY17 FY18
Slide 20
3. Australian financial years, 1 July to 30 June4. Ounces recovered
For
per
sona
l use
onl
y

Hollandaire - High Grade Copper Discovery
Hollandaire deposit:− copper grades up to 45%− gold grades up to 5.5 g/t − silver grades up to 256 g/t
Current status:9 holes completed− 9 holes completed
− mineralisation open in all directions− maiden resource March 2012 quarter− documentation prepared for further drilling
Drill core showing supergene chalcocite with copper grades up to 45%
p p g Initial results include:
− 9.3m at 15.4% Cu, 2.0 g/t Au & 29.0 g/t Ag from 61m(including 1.0m at 45.5% Cu, 2.8 g/t Au & 51.0 g/t Ag)
− 14.3m at 7.8% Cu, 1.0 g/t Au & 20.1 g/t Ag from 109m(including 1.7m at 23.0% Cu, 1.8 g/t Au & 77.3 g/t Ag)
− 1.9m at 5.2% Cu, 0.5 g/t Au & 10.7 g/t Ag from 97m− 15 7m at 1 1% Cu 0 3 g/t Au & 4 4 g/t Ag from 161m− 15.7m at 1.1% Cu, 0.3 g/t Au & 4.4 g/t Ag from 161m
Next steps:− maiden resource Q3 FY12− A$20 million exploration programme
Slide 21
$ p p g
For
per
sona
l use
onl
y

Why Silver Lake Resources?
Production increasing at Mount Monger:– multiple underground and open pit ore sources– expected mine life of ~10 years– staged expansion to 1mtpa in Sep Qtr 2012
Murchison production Q3 FY13:– 14 open pit & 4 underground ore sources– targeting ~1.2mtpa at 3.0 g/t Au– expected mine life 8 to 10 years
Strong cashflow & profitable:– no debt and no hedging
Significant exploration upside: – 3.3 Moz Au resource base1
– June 2012 resource target of 5.0Moz Au2
– high grade copper discovery at Hollandairef th b t l t ti l t E l C l 2– further base metal potential at Eelya Complex2
Growth:– targeting production of ~ 300,000 oz pa by 2014
Slide 22
1: Refer to slide 24 - JORC Resource Inventory2: Refer to slide 2 - Exploration Targets
For
per
sona
l use
onl
y

Presentation Appendix
www.silverlakeresources.com.auABN: 38 108 779 782ASX: SLR
For
per
sona
l use
onl
y
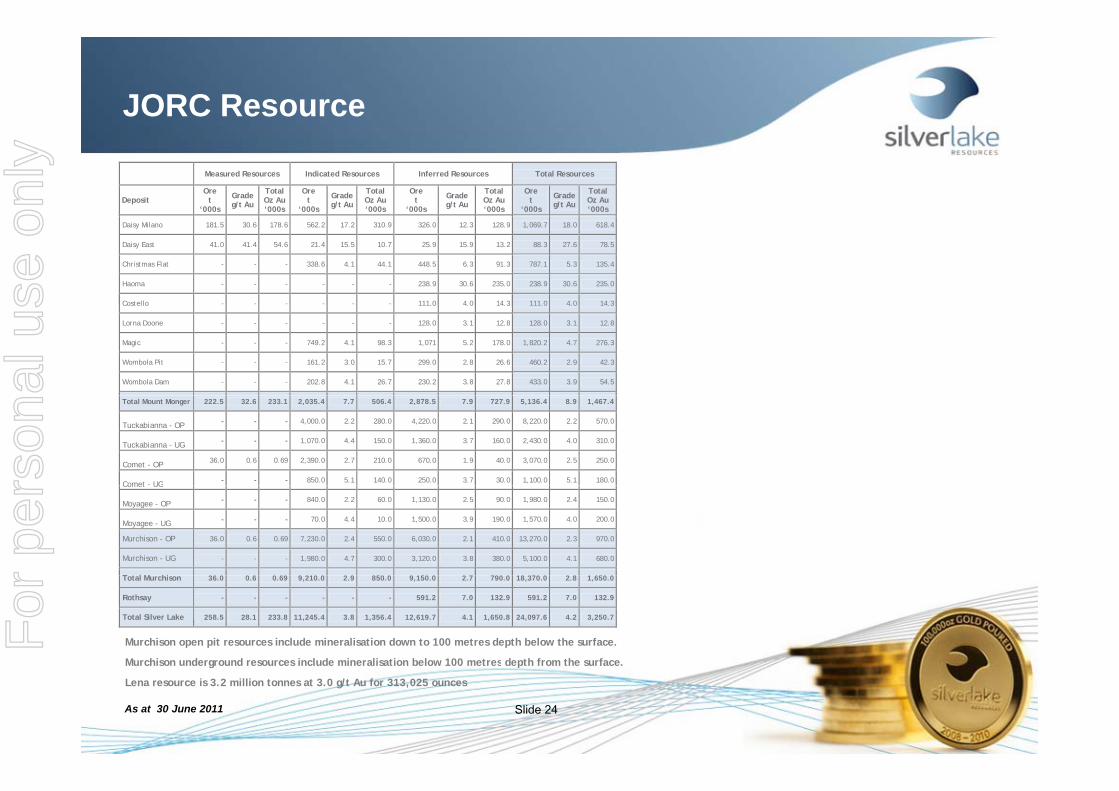
JORC Resource
Measured Resources Indicated Resources Inferred Resources Total Resources
Deposit Ore
t ‘000s
Grade g/t Au
Total Oz Au ‘000s
Ore t
‘000s
Grade g/t Au
Total Oz Au ‘000s
Ore t
‘000s
Grade g/t Au
Total Oz Au ‘000s
Ore t
‘000s
Grade g/t Au
Total Oz Au ‘000s
Daisy Milano 181.5 30.6 178.6 562.2 17.2 310.9 326.0 12.3 128.9 1,069.7 18.0 618.4
Daisy East 41.0 41.4 54.6 21.4 15.5 10.7 25.9 15.9 13.2 88.3 27.6 78.5
Christmas Flat - - - 338.6 4.1 44.1 448.5 6.3 91.3 787.1 5.3 135.4
Haoma - - - - - - 238.9 30.6 235.0 238.9 30.6 235.0
Costello - - - - - - 111.0 4.0 14.3 111.0 4.0 14.3 C
Lorna Doone - - - - - - 128.0 3.1 12.8 128.0 3.1 12.8
Magic - - - 749.2 4.1 98.3 1,071 5.2 178.0 1,820.2 4.7 276.3
Wombola Pit - - - 161.2 3.0 15.7 299.0 2.8 26.6 460.2 2.9 42.3
Wombola Dam - - - 202.8 4.1 26.7 230.2 3.8 27.8 433.0 3.9 54.5
Total Mount Monger 222.5 32.6 233.1 2,035.4 7.7 506.4 2,878.5 7.9 727.9 5,136.4 8.9 1,467.4
Tuckabianna - OP - - - 4,000.0 2.2 280.0 4,220.0 2.1 290.0 8,220.0 2.2 570.0
Tuckabianna - UG - - - 1,070.0 4.4 150.0 1,360.0 3.7 160.0 2,430.0 4.0 310.0
Comet - OP 36.0 0.6 0.69 2,390.0 2.7 210.0 670.0 1.9 40.0 3,070.0 2.5 250.0
Comet - UG - - - 850.0 5.1 140.0 250.0 3.7 30.0 1,100.0 5.1 180.0 Comet UG
Moyagee - OP - - - 840.0 2.2 60.0 1,130.0 2.5 90.0 1,980.0 2.4 150.0
Moyagee - UG - - - 70.0 4.4 10.0 1,500.0 3.9 190.0 1,570.0 4.0 200.0
Murchison - OP 36.0 0.6 0.69 7,230.0 2.4 550.0 6,030.0 2.1 410.0 13,270.0 2.3 970.0
Murchison - UG - - - 1,980.0 4.7 300.0 3,120.0 3.8 380.0 5,100.0 4.1 680.0
T l M hi
Notes to table 1:
Murchison open pit resources include mineralisation down to 100 metres depth below the surface.
Murchison underground resources include mineralisation below 100 metres depth from the surface.
Total Murchison 36.0 0.6 0.69 9,210.0 2.9 850.0 9,150.0 2.7 790.0 18,370.0 2.8 1,650.0
Rothsay - - - - - - 591.2 7.0 132.9 591.2 7.0 132.9
Total Silver Lake 258.5 28.1 233.8 11,245.4 3.8 1,356.4 12,619.7 4.1 1,650.8 24,097.6 4.2 3,250.7
Slide 24As at 30 June 2011
Murchison underground resources include mineralisation below 100 metres depth from the surface.
Lena resource is 3.2 million tonnes at 3.0 g/t Au for 313,025 ounces
For
per
sona
l use
onl
y


