Page 1
For Review O
nly
Selection criteria for assessing drought tolerance in a
segregating population of flax (Linum usitatissimum L.)
Journal: Canadian Journal of Plant Science
Manuscript ID CJPS-2016-0140.R2
Manuscript Type: Article
Date Submitted by the Author: 28-Aug-2016
Complete List of Authors: Asgarinia, Parvaneh; plant breeding and genetics Mirlohi, Aghafakhr; Department of Agronomy and Plant Breeding, College of Agriculture, Isfahan University of Technology, Isfahan, 84156-83111, Iran Saeidi, Ghodratollah Mohamadi Mirik, Ali Akbar
Gheysari, Mahdi; Isfahan University of Technology, Department of Water Engineering Razavi, Vahideh Sadat
Keywords: Biplot, Selection Index, Water Use Efficiency, Drought Tolerance, Flax
https://mc.manuscriptcentral.com/cjps-pubs
Canadian Journal of Plant Science
Page 2
For Review O
nly
1
Selection criteria for assessing drought tolerance in a segregating population of flax (Linum usitatissimum L.)
Parvaneh Asgarinia1, AghaFakhr Mirlohi
*2, Ghodratollah Saeidi
2, Ali Akbar Mohamadi Mirik
3, Mahdi Gheysari
4, Vahideh Sadat
Razavi5
1. PhD Student of Plant Breeding and Genetics, Department of Agronomy and Plant Breeding, Isfahan University of Technology,
Isfahan 84156-83111, Iran, E-mail: [email protected]
2. Prof. of Plant Breeding and Genetics, Department of Agronomy and Plant Breeding, Isfahan University of Technology, Isfahan
84156-83111, Iran
3. Assist. Prof. of Plant Breeding and Genetics, Department of Agronomy and Plant Breeding, Rafsanjan University, Rafsanjan,
Iran
4. Assoc. Prof. of Irrigation System, Irrigation Department, Isfahan University of Technology, Isfahan 84156-83111, Iran
5. MS of Plant Breeding and Genetics, Department of Agronomy and Plant Breeding, Isfahan University of Technology, Isfahan
84156-83111, Iran
*Corresponding Author: Aghafakhr Mirlohi, Ph.D.
Professor in Plant Genetics and Breeding, Department of Agronomy and Plant Breeding, College of Agriculture, Isfahan
University of Technology, Isfahan, 84156-83111, Iran, Tel: +98 3133913450, Fax: +98 3133912254
Email: [email protected]
Abstract
Using plant genotypes adaptable to water-deficit stress is an optimal strategy in sustainable agriculture. This study was conducted
to assess the selection criteria for identifying high yielding-drought tolerant F2- derived F3 flax families from a cross between
Iranian genotype KO37 and the Canadian genotype SP1066. One hundred and nineteen F2:3 were evaluated under drought stress
and non-stress conditions using an 11*11 lattice design with three replications. Sixteen drought tolerance indices adjusted based on
grain yield under drought stress and non-stress conditions were calculated. The presence of high variability for grain yield and
irrigation water use efficiency in parental lines and F2:3 families under both conditions indicated that the F2:3 population or its
advanced generations can be used in selection programs to increase drought tolerance and also to identify quantitative trait loci /
genes related to grain yield and drought tolerance in flax. The results of biplot based on the PC1 and PC2 and triplot analysis based
on STI index and grain yield in both stress and non-stress conditions introduced thirteen families as the most promising families for
drought tolerance and therefore, their advanced generations can be used in future breeding programs to improve drought tolerance
in flax.
Keyword: Biplot, Drought Tolerance, Flax, Selection Index, Water Use Efficiency
Introduction
Page 1 of 25
https://mc.manuscriptcentral.com/cjps-pubs
Canadian Journal of Plant Science
Page 3
For Review O
nly
2
Flax (Linum usitatissimum L., 2n = 2x = 30) is a self-pollinating, diploid species and dual-purpose crop grown commercially for its
seed oil as well as its stem fiber. Flax oil, rich in the omega-3 fatty acid (alpha linolenic acid), a precursor for many essential fatty
acids of human diet, is being used in the fabrication of biodegradable products such as linoleum as well as for functional food and
feed. The fiber from flax stem is highly valued for use in textiles such as linen and in insulations (Kulpa and Denart 1962;
Marchenkov et al. 2003).
Drought is one of the most damaging abiotic stresses in arid and semi arid regions of the word that affects the seed yield and yield
stability of oilseed crops. This is through alternations in metabolism and gene expression and cause declines in many traits such as
root growth, leaf water potential, cell membrane stability, photosynthetic rate, photochemical efficiency as well as in quality and
quantity of oil (Van Ginkel et al. 1998; Schroeder et al. 2001; Luan 2002; Biswas et al. 2011).
To overcome these limitations, strategies such as the use of suitable varieties adapted to stress conditions with high irrigation water
use efficiency (IWUE) (Siahpoosh et al. 2011; Blum 2005) and using deficit irrigation management (Costa et al. 2007; Geerts and
Raes 2009; Gheysari et al. 2009) have been suggested. However, in flax only a few studies have been accomplished on evaluating
water deficit stress and IWUE and on identifying drought tolerant genotypes (Sharma et al. 2012; Yenpreddiwar et al. 2007).
Plant improvement for drought tolerance through identification of drought tolerant genotypes has been a goal in oilseed crops
breeding programs. However, breeding for drought tolerance is genetically complicated because of its polygenic nature, difficulty
of simultaneous selection of genes/QTLs involved (Yeo 1998; Flowers et al. 2000) and the lack of fast, reproducible screening
techniques particularly under field conditions (Ramirez and Kelly 1998). The assessment of early generation segregating
populations from crosses between parental lines contrasting for drought tolerance, under different water deficit stress conditions is
one of the first steps to identify the chromosomal location of genes/QTLs related to drought tolerance.
Various quantitative criteria based on yield reduction under water deficit stress conditions in comparison to non-stress conditions
have commonly been proposed to identify drought tolerant genotypes (Fischer and Maurer 1978; Clarke et al. 1992; Fernandez
1992; Byrne et al. 1995). Fernandez (1992) stated that SSI (stress susceptibility index) determines sensitive and tolerant families
without attention to yield potential. It was reported that SSI is a useful indicator for wheat breeding where the stress is severe while
MP (mean productivity), GMP, TOL (tolerance index), HM (harmonic mean) and STI (Stress tolerance index) are better if the
stress is less severe (Akçura et al. 2011; Clarke et al. 1992 and Guttieri et al. 2001). The relative effectiveness of indices such as
STI, MP and GMP in discriminating drought tolerant genotypes was reported in maize (Farshadfar and Sutka 2002, Jafaria et al.
2009; Hejazi et al. 2013), safflower (Pourdad 2008; Majidi et al. 2011), rapeseed (Yarnia et al. 2011) and wheat (Anwar et al.
2011; Nouraein et al. 2013; El-Rawy and Hassan 2014). Also, these indices were identified as suitable indices to select the high-
yielding and drought tolerance families among F3 and F4 families of durum wheat (Golabadi et al. 2006) and F5 families of rice
(Rahimi et al. 2013). Fernandez (1992), in a three-dimensional representation of genotypes based on Ys, Yp and GMP, categorized
Page 2 of 25
https://mc.manuscriptcentral.com/cjps-pubs
Canadian Journal of Plant Science
Page 4
For Review O
nly
3
genotypes into four groups based on their performance in water deficit stress and non-stress environments; genotypes expressing
uniform superiority in both water deficit stress and non-stress environments (Group A); genotypes with high performance in non-
water deficit stress environments (Group B); genotypes with relatively high yield only in water deficit stress environments (Group
C) and genotypes performing poorly in both water deficit stress and non-stress environments (Group D). The optimal selection
criteria should distinguish group A from the other three groups (Fernandez 1992). According to this, STI and GMP indices were
introduced as the best selection criteria for distinguishing tolerant and susceptible genotypes (Vegh 2013; Ramirez and Kelly 1998;
Nouraein et al. 2013; Majidi et al. 2011). Nouraein et al. (2013) reported that GMP is more powerful in separating group A and has
a lower susceptibility to different amounts of Ys and Yp; So GMP will be bias when the difference between Ys and Yp is less.
Mohammadi et al. (2010) carried out a complete diallel cross using eight flax genotypes including four Iranian breeding lines
(KO37, KH124, SE65 and AH92) and four Canadian genotypes (SP1066, CDC1774, Flanders and McGregor) and estimated
genetic parameters for days to flowering, days to maturity, plant height, primary branches per plant, number of capsules per plant,
number of seeds per capsule, seed yield per plant, 1000-seed weight, seed yield, oil yield and harvest index. The superiority of the
parental line KO37 for oil yield, fatty acids, seed yield and other agronomic traits despite its short plant height was observed. As
compared to KO37, SP10266 had lower mean values for most traits except for plant height. So, these genotypes were considered
suitable for crossing and production of F2 population. Also, eight flax genotype including KO37 and SP1066 were assayed under
water deficit stress and non-stress field conditions in 2011 at the Research Farm of Isfahan University of Technology (RFIUT),
Isfahan, Iran. Based on the result, KO37 was the most drought tolerant genotype with higher yield. On the other hand, SP1066 with
a Canadian origin had taller height and a more erect stature.
Flax is a neglected oilseed crop of developing countries grown on marginal land with poor management. The poor yield of this
crop is attributed to non availability of improved cultivars to suit the diverse agroclimatic conditions. Hence, development of high
yielding and drought tolerant flax genotypes with high water use efficiency and productivity would greatly facilitate the cultivation
of this crop in arid and semi-arid regions. This study was conducted to assess the selection criteria for identifying high yielding-
drought tolerant F2- derived F3 families from a cross between Iranian flax genotype KO37 and the Canadian genotype SP1066
under water deficit stress and non-stress field conditions.
Material and Methods
Plant materials
An F2 population of 400 individuals from a cross between Iranian genotype KO37 and the Canadian cultivar SP1066 was generated
(Mohammadi et al. 2010). The F2 plants were grown in the field and the F3 seeds were harvested in 2011. Among the F2 plants
only 119 produced sufficient seeds for a replicated field experiment. Therefore the seeds from these 119 F2 plants were field
evaluated in 2012.
Page 3 of 25
https://mc.manuscriptcentral.com/cjps-pubs
Canadian Journal of Plant Science
Page 5
For Review O
nly
4
Experimental site and design
The 119 F3 families along with the parents were sown according to a lattice design (11*11) with three replications. Planting rows
were 2m-long with 0.3 m distance between the rows with plant to plant distances of 2 cm. The experimental field was located in
the Research Farm of Isfahan University of Technology (RFIUT), Isfahan, Iran (51° 32' E and 32° 22' N, 1630 m asl). The field
soil was a Typic Haplargid with clay loam texture, pH 7.5 and 0.5% organic matter content. The mean annual precipitation was
110 mm and mean annual temperature was 15° C at RFIUT in 2012 (Table1). After sowing, fertilizers were applied at a rate of 10
kg N ha−1
and 40 kg (NH4)3PO4 ha−1
, and additional side dressing of 10 kg N ha−1
was applied before flowering stage and weed
was controlled manually. The mean of days to flowering and maturity was 64 and 93 days for KO37 (Iranian genotype).
Irrigation system
For irrigation a surface drip-tape system (Eurodrip S.A. Inc.1) was used with the drippers 15 cm apart and 1.3 Lit h
-1 flow rate for
each dripper, and one streamline for each crop row. For the first 55 days after sowing the irrigation time and amounts were the
same for all the plots but after that the irrigation treatments were applied.
The irrigation schedule was determined using the FAO-PM equation and weather data (Allen et al. 1998). The reference crop
evapotranspiration (ET0) was calculated based on FAO-Penman-Monteith (FPM) equation (Allen et al. 1998), and the
evapotranspiration of linseed (ETC) was computed using ET0 and recommended linseed crop coefficients (KC) (Allen et al., 1998).
( ) ( )
( )2
2
034.01
273
900408.0
u
eeuT
GR
ETasn
++∆
−+
+−∆
=γ
γ
(1)
CC KETET ×= 0 (2)
Where ET0 is the reference crop evapotranspiration (mm day-1
), Rn is the net radiation at the crop surface (MJ m-2
day-1
), G is the
soil heat flux density (MJ m-2
day-1
),T is the mean daily air temperature at 2m height (°C), u2 is the wind speed at 2 m height (m s-
1), es is saturation vapor pressure (kPa),ea is actual vapor pressure (kPa), es-ea is saturation vapor pressure deficit (kPa), ∆ is slope
vapor pressure curve (kPa °C-1
), and γ is psychometric constant (kPa °C-1
).
For no water deficit stress condition, irrigation was started when the management allowed depletion (P) of the available water
reached (1 ± 0.05) × 50% for linseed (Allen et al. 1998). That is, when almost 50% of the total available water was depleted from
root zone, the no water deficit stress treatment was irrigated. The threshold of the soil water content (�) in no water deficit stress
condition was calculated as follows (Gheysari et al. 2009, Kiani et al. 2016):
��� = �� − ��� − �� � × � (3)
Where, θFC is soil water deficit content at field capacity (m3 m
-3), and θWP is soil water content at wilting point (m
3 m
-3).
1- http://www.eurodrip.gr/contactUs.aspx?affID=2&langID=2
Page 4 of 25
https://mc.manuscriptcentral.com/cjps-pubs
Canadian Journal of Plant Science
Page 6
For Review O
nly
5
The maximum allowed depletion of water (MADW) (mm) from the root zone under no water stress treatment was calculated as
follows (Gheysari et al. 2015):
MADW = �θ�� − θ��� × Z (4)
Where, Z is the root zone depth (mm), in this study equal to 25 cm for first 30 days, and 40 cm for remind growing period. No
water deficit stress plants were watered when the water content of the soil was 50% of the way to wilting (���� at
either 25 cm or 40 cm soil depth, calculated based on total ETc for flax and these soils. When ∑�� (cumulative ETC)
after each irrigation event equaled MADW, irrigation was applied to the no water stress plants and irrigation depth was equal to
MADW. For water stress treatment, irrigation interval was increased two times that of no water deficit stress treatment and
irrigation depth was equal to MADW. During the growing season, for control of the irrigation treatments, the gravimetric method
(Smith and Warrick 2007) was used to measure soil water content before irrigation.
Characters and Selection indices
Grain yield (gram per square meter) was determined for the parents and 119 F3 families under water deficit stress and non-stress
conditions and indicated as Ys and Yp, respectively. Also, irrigation water use efficiency (IWUE, gram per litter), calculated
according to the formula: grain yield /applied water, was determined under water deficit stress and non-stress conditions and
indicated as IWUEs and IWUEp, respectively. Drought tolerance indices were calculated using the relationships given in table2.
Statistical analysis
Because the relative efficiency of lattice design to randomized complete block design (RCBD) for grain yield (g m-2
) was nearly
100%, therefore the analysis of variance was conducted based on the RCBD for all calculated indices. The analysis of variance and
principal component analysis for calculated indices was performed using SAS statistical program. The CORR SAS procedure was
used to estimate correlations among indices. Cluster analysis of F3 families was conducted using Wards method (Squared
Euclidean) and the bi and triple plots were drawn using Stat Graphics software.
Result
Analysis of variance and mean comparison of indices
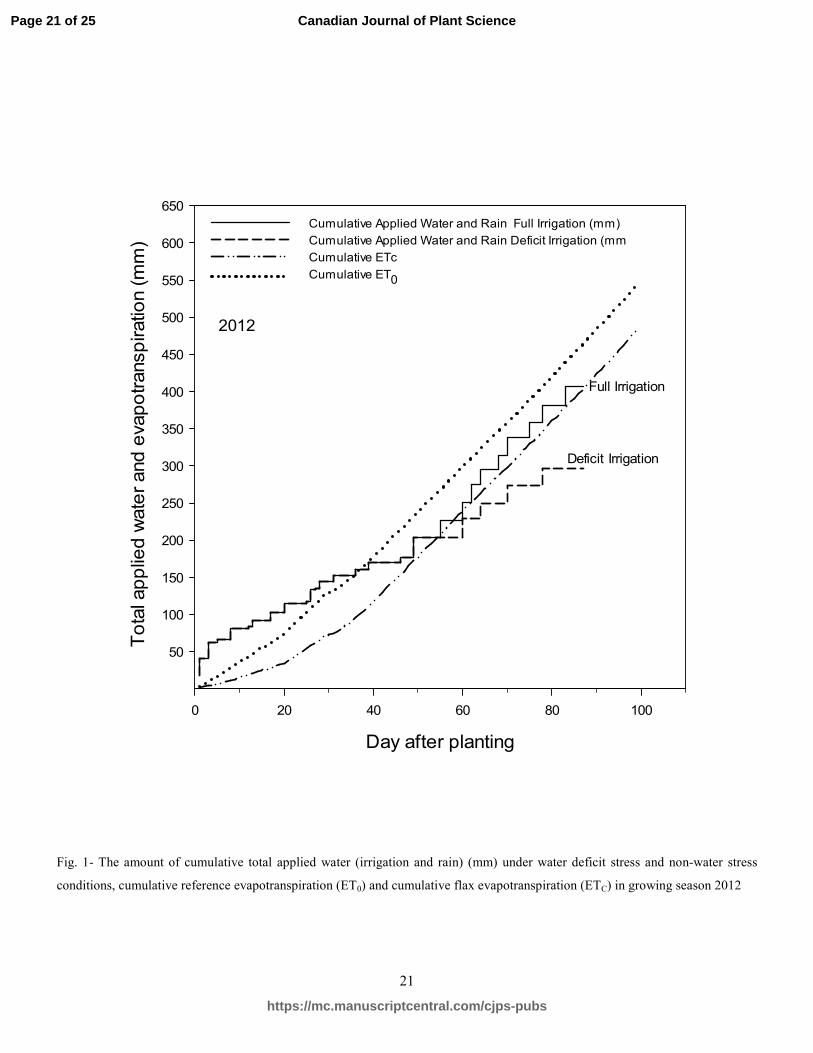
For non-water deficit stress condition the total of applied water including the irrigation and rain was 408.8 mm from sowing to
harvest in 2012. The water deficit stress treatment received 25 percent less water than the control one. Time and amount of
cumulative applied water including irrigation and rain and flax cumulative evapotranspiration represents the precise
implementation of irrigation treatments (Fig. 1 and table1).
The analysis of variance indicated significant differences among the parents and F3 families for Yp, Ys, IWUEp and IWUEs and
all drought tolerance indices, except for k1STI and K2STI (Table 3). In non-water deficit stress condition, the mean of grain yield
Page 5 of 25
https://mc.manuscriptcentral.com/cjps-pubs
Canadian Journal of Plant Science
Page 7
For Review O
nly
6
per square meter for F3 families, KO37 and SP1066 were 175, 250 and 130 g m-2
, respectively. These values were 98, 160 and 70 g
m-2
in water deficit stress condition. Among F3 families, grain yield varied from 78 to 312 and from 32 to 168 g m-2
in non-water
deficit stress and water deficit stress conditions, respectively (Fig. 2). Mean grain yield of F3 families, KO37 and SP1066 in water
deficit stress condition was 44, 36 and 46% smaller than the ones in non-water deficit stress condition, respectively. The mean
comparison of the families revealed that families number 38, 39, 72, 74 and 119 had high yield in both water deficit stress and non-
stress conditions and were recognized as the most drought tolerant families in the population.
In overall, the water deficit stress effect was significant on grain yield. The percent of yield reduction as a result of water deficit
stress was highly variable among F3 families. The biggest reduction (78%) belonged to family number 34 that had the highest grain
yield (312 g m-2
) in non-water deficit stress condition and also the lowest (68 g m-2
) under water deficit stress condition. This
family was identified as the most unstable family among all the F3 families tested. Family number 7 with the lowest yield reduction
(% 4) had average and low yield in water deficit stress and non-stress conditions, respectively. Family number 42 had high and
average yield in water deficit stress and non-stress conditions respectively and was recognized as a desirable family for drought
environments.
In non-water deficit stress condition the mean of IWUE for F3 families, KO37 and SP1066 was 0.43, 0.61 and 0.32 g L-1
,
respectively. These values were 0.33, 0.53 and 0.23 g L-1
, respectively, for water deficit stress condition. Among F3 families,
IWUE varied from 0.19 to 0.76 in non-water deficit stress and from 0.11 to 0.56 g L-1
for water deficit stress conditions (Fig. 2).
Mean IWUE of F3 families, KO37 and SP1066 in water deficit stress condition was 23, 11 and 25% smaller than the ones in non-
water deficit stress condition, respectively. As it was expected the KO37 parental line was more tolerant to drought stress when
compared to the SP1066 parent. Based on this, families number 38, 39, 72, 74 and 119 that had high IWUE in both water deficit
stress (average 0.47 g L-1
) and non-stress (average 0.63 g L-1
) conditions were recognized as the most favorable families in the
population. Transgressive segregation in both directions was also observed for grain yield and IWUE in water deficit stress and
non-stress conditions (Fig. 2).
Overall the IWUE was reduced by water deficit stress although in some families it was not changed or even increased. For
example, families number 42, 50 and 72 had high IWUE in both moisture conditions and their IWUE were reduced by water deficit
stress. To date a very few studies have been conducted on assaying IWUE and introducing drought tolerant genotypes in flax
(Sharma et al. 2012; Yenpreddiwar et al. 2007).
The mean comparison of parents showed that the most reduction in yield and IWUE traits under drought stress belonged to SP1066
parental genotype. Mean comparison of grain yield and IWUE and their reduction in F3 families and parental lines under water
stress condition, showed that there was a wide diversity among F3 families. This was an indication that the segregating population
had enough polymorphism in terms of drought tolerance.
Page 6 of 25
https://mc.manuscriptcentral.com/cjps-pubs
Canadian Journal of Plant Science
Page 8
For Review O
nly
7
The ranks of families for SSI and SDI indices were equal. When selecting on these bases, the families with low value of SDI and
SSI will be more desirable. A total of 53 families had SSI>1 with families number 27, 32, 34, 36, 45, 46, 55 and 83 showed the
highest sensitivity to drought stress. The remaining 68 families had SSI<1 and the lowest SSI in this group belonged to families
number 7, 9, 42, 54, 9, 99 and 104. Although these families had the lowest sensitivity to water deficit stress they did not have
outstanding performance in non-stress condition, because of their low yield potential.
Base on reverse relationship of SSI to RDI and YSI, the families with SSI<1 and high level of RDI and YSI that had high yield in
both water deficit stress and non-stress conditions, including 1, 12, 35, 38, 40, 43, 70, 72, 78, 84, 113 and 117 were introduced as
the high yield families with the lowest sensitivity to water deficit stress.
Based on the results, the greater the TOL value, the larger the yield reduction under water deficit stress conditions and the higher
sensitivity to water deficit stress. The ranks of families for TOL and SSPI indices were equal. The highest and the lowest value of
the indices belonged to families number 7 and 34, respectively. The families with low level of SSI, SDI, TOL and SSPI indices
including families number 6, 7, 9, 42, 44, 54, 76, 85, 86, 88, 91, 94, 96, 99, 104, 107 and 114 showed the lowest sensitivity to
water deficit stress, but they did not have a high level of yield in non-stress condition. Selection based on these indices detected
genotypes with high yield in water deficit stress condition and low yield in non-stress conditions and failed to identifying
genotypes with both high yield and drought tolerant characteristics.
The ranks of families for MP, HM, GMP and STI criteria were almost the same. Families number 33, 38, 39, 70, 72, 78 and 119
had high value of these indices and were recognized as high yielding and drought tolerant families. Rating families based on
K1STI and K2STI was nearly similar to ones based on STI but families with high K1STI had almost higher yield in non-water
deficit stress condition. The opposite was true for the families with high K2STI that had higher yield in stress condition.
Families with high yield in water deficit stress condition showed high YI, the lowest sensitivity to water deficit stress and almost
had moderate yield in non-stress condition. The families ranked the same for DI and SNPI criteria. Families number 42, 50, 68, 72,
104 and 118 had high values for these criteria and almost had high and average yield in water deficit stress and non-stress
conditions, respectively. Based on ATI, families number 7, 54, 85 and 96 with the lowest level of this index and yield in non-water
deficit stress condition, showed the lowest tolerant to drought stress. Families number 26, 27, 31, 32, 33, 34, 35, 36, 37, 38, 39, 45,
47, 59, 81 and 119 with high level of ATI and yield in non-water deficit stress condition showed high tolerance to water deficit
stress but almost all of them had average yield in water deficit stress condition. Based on PI index families number 26, 27, 33, 34,
36, 37, 38, 39, 43, 72, 78, 81 and 119 had low level of PI and showed more tolerant to water deficit stress.
Correlation of indices
To determine the most desirable drought tolerance criteria in the population, the correlation coefficient between Yp , Ys, IWUEp,
IWUEs and other quantitative indices of drought tolerance were calculated (Table 4). The Yp was adversely correlated with Ys,
Page 7 of 25
https://mc.manuscriptcentral.com/cjps-pubs
Canadian Journal of Plant Science
Page 9
For Review O
nly
8
depicting that high yield potential under best possible conditions does not anticipate superior yield under water deficit stress
conditions. Yp was highly and positively correlated with IWUEp, MP, HM, GMP, STI, ATI, SSPI, K1STI and TOL and highly
and negatively correlated with PI. Ys had high and positive correlation with IWUEs, MP, HM, GMP, STI, YI, DI, SNPI and
K2STI and high and negative correlation with TOL, SSI, SSPI, PI and SDI.
Positive correlation of Yp and negative correlation of Ys with TOL, SSI, SSPI, PI and SDI criteria suggest that selection based on
these indices will result in reduced yield in well - watered conditions. There was higher correlation between MP and Yp rather than
MP and Ys and between HM and Ys rather than HM and Yp. Thus, based on the results, GMP and STI criteria were more useful
for prediction of potential yield of the genotypes in both water deficit stress and non-stress conditions, because of very high,
positive and significant correlation with IWUEp, IWUEs, Yp and Ys.
There were positive and significant correlation among IWUEp, IWUEs, MP, HM, GMP, STI, ATI, YI, MSTIp and MSTIs. These
indices had a weak association to YSI and SDI. The SSI was positively and significantly correlated with SDI, TOL, SSPI and ATI
and negatively and significantly correlated with RDI, YSI, DI, SNPI, YI, PI and HM, respectively. So, it seems that SSI, SDI,
TOL, SSPI and ATI had the same capability in performing tolerance against stress. The PI was positively correlated with RDI and
YSI (r= 0.29) and had significant and negative association to other indices with the highest negative correlation belonging to MP
(r= -0.98) and Yp (r= -0.96). The SNPI had the highest positive correlation with DI.
Biplot analysis
Selection based on a combination of indices may provide a more useful criterion for improving drought resistance of field crops,
but study of correlation coefficients are useful in finding the degree of overall linear association between any two attributes. Thus,
a better approach such as biplot than a correlation analysis is needed to identify the superior genotypes for both water deficit stress
and non-stress conditions. Principal component analysis (PCA) revealed that the first dimension (PC1) explained 50% of the
variation (Table 5). PC1 was highly and positively correlated with IWUEp, IWUEs, Yp, Ys MP, HM, GMP, STI, ATI, YI, K1STI
and K2STI and negatively correlated with PI. Thus, the first dimension can be named as the yield potential and drought tolerance.
Considering the high and positive value of the PC1 on biplot, genotypes with high values of PC1 will be high yielding under water
deficit stress and non-stress conditions. The second component (PC2) explained 42.6% of the total variability and was positively
correlated with RDI, SNPI, DI and YSI and negatively correlated with SSI, TOL, SDI and SSPI. Therefore, the second component
can be named as a stress susceptibility dimension which separates stress-tolerant from non-stress tolerant genotypes. Based on the
PC2, genotypes that their yields were severely affected by water deficit stress are identified.
According to the biplot based on the PC1 and PC2 , F3 families with high and positive PC1 and low and positive PC2 are suitable for
both water deficit stress and non-stress conditions. The F3 families with high PC1 and negative PC2 are suitable for non-stress
condition (Fig. 3). The F3 families with negative PC1 and PC2 are unsuitable. In the present study, families number 33, 38, 39, 43,
Page 8 of 25
https://mc.manuscriptcentral.com/cjps-pubs
Canadian Journal of Plant Science
Page 10
For Review O
nly
9
50, 68, 70, 72, 78, 81, 113, 117, 118 and 119 with high positive PC1 and low PC2 were identified as the superior families for both
water deficit stress and non-stress conditions. Family number 32 with high positive PC1 and negative PC2, that had high yield
potential in non-stress condition and high sensitivity to drought, was identified as the superior family for non-stress condition. In
total, 46 families had low or moderate PC1 and PC2, low or moderate yield potential and low sensitivity to water deficit stress. Also
14 families with low PC1 and high PC2, had low yield potential in both water deficit stress and non-stress conditions that defined as
the most unstable families.
Classifying families based on STI
The STI values were used to draw three-dimensional graph to find drought resistant genotypes (Fig. 4). According to Fernandez
(1992) model, studied families were divided into four categories based on their performance in water deficit stress and non-stress
conditions: 22 families positioned in group A that among them families number 26, 33, 36, 37, 38, 39, 43, 70, 72, 78, 81, 113 and
119 had high yield in both water deficit stress and non-stress conditions and high STI criterion (Fig. 5). Families number 27, 31,
32, 34, 45 and 56 were placed in group B having maximum yield in non-water deficit stress condition. Also 56 families situated in
group C that among them families number 42, 50, 68 and 118 had the highest yield under water deficit stress condition. The 35
families found to be in group D exhibited low yield in both water deficit stress and non-stress conditions.
Discussion
Different responses of families to moisture conditions indicated that the population have segregated for genes controlling yield and
drought tolerance related traits. The parental genotypes SP1066 (Canadian) and KO37 (Iranian) are from two separate gene pools,
and were expected to contribute to greater variation. Transgressive segregation observed for grain yield in both moisture
conditions, indicated that some of the F3 families had more drought tolerance than parents (Fig. 2), and have the potential to be
used in advanced generations for future breeding programs.
Low correlation between Yp and Ys, suggested that high potential yield under optimal conditions does not necessarily result in
improved yield under water deficit stress conditions. However, due to genotype by environmental interactions, indirect selection
for a drought-prone environment based on the results of optimum conditions will not be efficient. These findings are similar to
those previously reported for wheat (Siahpoosh et al. 2011) and barely (Giancarla et al. 2010) that genotypes with low yield
potential under well watered conditions had high yield under deficient irrigation conditions.
The estimates of stress tolerance attributes indicated that the identification of drought-tolerant genotypes based on different criteria
was varied. Families selected based on SSI, SDI, YSI, RDI, TOL and SSPI showed the lowest sensitivity to water deficit stress, but
they did not have the high level of yield in non-stress condition, as previously reported in wheat (Nouraein et al. 2013) and
safflower (Majidi et al. 2011). Fernandez (1992) stated that SSI determined sensitive and tolerant families without attention to
yield potential. Similar results were reported by Rosielle and Hamblin (1981). Limitations of using SSI, SDI, YSI, RDI, TOL and
Page 9 of 25
https://mc.manuscriptcentral.com/cjps-pubs
Canadian Journal of Plant Science
Page 11
For Review O
nly
10
SSPI indices have already been described (Lander et al. 1989; Saba et al. 2001; Akhter et al. 2010; Sio-Se Mardeh et al. 2006).
Farshadfar et al. (2013a,b) reported that the indices K1STI, K2STI, SSPI, RDI, ATI, SNPI, and DI can be used as the most suitable
indicators for screening drought tolerant cultivars. It was suggested that SSI is a useful indicator for wheat breeding where the
stress is severe while MP, GMP, TOL HM and STI are better if the stress is less severe (Akçura et al. 2011; Clarke et al. 1984;
1992 and Guttieri et al. 2001).
The families number 33, 38, 39, 70, 72, 78 and 119 with high value of the MP, GMP, HM and STI criteria were introduced as high
yielding and drought tolerant families that their advanced generations can be used in future breeding programs of flax. The rank
similarity of genotypes and high efficiency of MP, HM, GMP and STI criteria in identifying high yielding and drought tolerant
genotypes were previously reported in wheat (Nouraein et al. 2013; Siahpoosh et al. 2011; Ud-Din et al. 1992), barley (Nazari and
Pakniat 2010; Giancarla 2010), rice (Akhter et al. 2010), canola (Khalili et al. 2012; Yarnia et al. 2011), corn (Vegh 2013) and
safflower (Majidi et al. 2011). Also, relative efficiency of MP, GMP and STI criteria in plant breeding programs for determining
drought tolerant families among F3 and F4 families in durum wheat (Golabadi et al. 2006) and high yielding F5 families in rice
(Rahimi et al. 2013) was previously reported.
Based on the correlation coefficient among Yp, Ys, IWUEp, IWUEs and other quantitative indices of drought tolerance (Table 4),
GMP and STI criteria were more useful for prediction of potential yield in both water deficit stress and non-stress conditions,
because of very high, significant and positive correlation with IWUEp, IWUEs, Yp and Ys. The results of present study were
congruent with those reported in common bean (Ramirez and Kelly 1998), wheat (Nouraein et al. 2013), soybean (Yan and Rajcan
2002), safflower (Pourdad 2008; Majidi et al. 2011) and canola (Yarnia et al. 2011). Low correlation among some indices stated
that each index may be a potential indicator of different biological response to water deficit stress (Farshadfar et al. 2013a).
Selection based on a combination of indices may provide a more useful criterion for improving drought resistance in plants. Biplot
of genotypes based on two PCs obtained from PCA of their drought tolerance indices is an acceptable method to identify superior
genotypes under water deficit stress and non-stress environments. The correlation coefficient between two indices is almost angle
cosine of their vectors. In biplot of genotypes based on drought tolerance indices, the cosine of the angle between the vectors of
two indices approximates the correlation coefficient between them.
The PCA was performed to group the drought tolerance indices based on their function as well as the genotypes using their drought
tolerance indices. In the present study, because of high and positive correlation and the least angle among GMP and STI indices
with Yp and Ys, they were introduced as the most suitable selection criteria. Since, in this study, the first two PC explained 92.6%
of the total variability, the biplot based on the PC1 and PC2 that scattered all F3 families and indices was a useful tool to evaluate
indices and to identify high yielding - drought tolerant families. Based on this, families number 33, 38, 39, 43, 50, 68, 70, 72, 78,
81, 113, 117 118 and 119 were identified as the superior families for water deficit stress and non-stress conditions. In order to
Page 10 of 25
https://mc.manuscriptcentral.com/cjps-pubs
Canadian Journal of Plant Science
Page 12
For Review O
nly
11
select based on a combination of indices, some researchers have used PCA (Majidi et al. 2011; Ebrahimiyan et al. 2012) and
observed that genotypes with larger PC1 and lower PC2 scores had high yields (stable genotypes), and genotypes with lower PC1
and larger PC2 scores had low yields (unstable genotypes). Similar results were observed in assaying drought tolerance in
segregating populations of durum wheat (Golabadi et al. 2006) and rice (Rahimi et al. 2013).
According to Fernandez (1992) model, the best possible selection criteria should distinguish genotypes of Group A (genotypes
expressing uniform superiority in both water deficit stress and non-stress environments) from the genotypes of other three groups.
Based on this, some researchers introduced GMP and STI criteria as the best indices for identifying tolerant genotypes (Farshadfar
et al. 2013; Majidi et al. 2011; Akhter et al. 2010). Nouraein et al. 2013) reported that GMP is more powerful in separating group A
and has a lower susceptibility to different amounts of Ys and Yp, so; GMP will be bias when the difference between Ys and Yp is
less.
In this study, the results of triplot analysis based on STI index and grain yield in both water deficit stress and non-stress conditions
introduced families number 26, 33, 36, 37, 38, 39, 43, 70, 72, 78, 81, 113 and 119 as the most favorable families for drought
tolerance (Fig. 4 and 5). Families number 27, 31, 32, 34, 45 and 56 and families number 42, 50, 68 and 118 were recommended for
non-water deficit stress and stress conditions, respectively.
Conclusion
In this study, the presence of high variability and transgressive segregation for grain yield and IWUE in parental lines (KO37 and
SP1066) and F3 families under both water deficit stress and non-stress conditions indicated that the F3 population or its advanced
generations can be used in selection programs, increasing drought tolerance and identification of QTL related to agronomically
important traits in flax. Based on the result from assessing the selection criteria, GMP and STI indices that had positive significant
correlations with both Yp and Ys is suggested as desirable indices to identify drought tolerant genotypes. The results of biplot and
triplot analysis, based on STI index, Yp and Ys, indicated that families number 26, 33, 36, 37, 38, 39, 43, 70, 72, 78, 81, 113 and
119 had the best combination of yield production under water deficit stress and non-water deficit stress conditions and therefore
further validation is required to introduce them into flax breeding programs in Iran and elsewhere.
Acknowledgement
This research was supported by Isfahan University of Technology (IUT).
References
Akçura, M., Partigoç, F., Kaya, Y. 2011. Evaluating of drought stress tolerance based on selection indices in Turkish bread wheat
landraces. J. Animal Plant Sci. 21: 700-709
Akhter, J., Monneveux, P., Sabiri, S.A., Ashrafi, M.Y., Lateef, Z., Serraj, R. 2010. Selection of drought tolerance and high water
use efficient rice cultivars through 13C isotopie discrimination technique. Pak. J. Bot. 42: 3887-3897.
Page 11 of 25
https://mc.manuscriptcentral.com/cjps-pubs
Canadian Journal of Plant Science
Page 13
For Review O
nly
12
Allen, R.G., Pereira, L.S., Raes, D., Smith, M. 1998. Crop Evapotranspiration-Guidlines for Computing Crop Water Requierments.
Irrigation and drainage, paper 56. Rome, Italy.
Anwar, J., Subhani, G.M., Hussain, M., Ahmad, J., Hussain, M., Munir, M. 2011. Drought tolerance indices and their correlation
with yield in exotic wheat genotypes. Pak. J. Bot. 43: 1527-1530.
Biswas, S., Koul, M., Bhatnagar, A.K. 2011. Effect of salt, drought and metal stress on essential oil yield and quality in plants. Nat.
Prod. Commun. 6:1797.
Blum, A. 2005. Drought resistance, water-use efficiency, and yield potential are they compatible, dissonant, or mutually exclusive.
Aust. J. Agric. Res. 56: 1159–1168.
Bouslama, M., Schapaugh, W.T. 1984. Stress tolerance in soybean. Part 1: evaluation of three screening techniques for heat and
drought tolerance. Crop Sci 24: 933-937.
Byrne, P.F., Bolanos, J., Edmeades, G.O., Eaton, D.L. 1995. Gains from selection under drought versus multilocation testing in
related tropical maize populations. Crop Sci. 35: 63-69.
Clarke, J.M., De Pauw, R.M., Townley-Smith, T.M. 1992. Evaluation of methods for quantification of drought tolerance in wheat.
Crop Sci. 32: 728-732.
Clarke, J.M., Towenley-Smith, T.M., McCaig, T.N., Green, D.G. 1984. Growth analysis of spring wheat cultivars of varying
drought resistance. Crop Sci. 24: 537-541.
Costa, J.M., Ortuño, M.F., Chaves, M.M. 2007. Deficit irrigation as a strategy to save water: physiology and potential application
to horticulture. Integrative Plant Biology. 49: 1421-1434.
Ebrahimiyan, M., Majidi, M.M., Mirlohi, A.F., Gheysari, M. 2012. Drought-tolerance indices in a tall fescue population and its
polycross progenies. Aust. J. Crop Sci. 5: 360-369.
El-Rawy, M.A., Hassan, M.I. 2014. Effectiveness of drought tolerance indices to identify tolerant genotypes in bread wheat
(Triticum aestivum L.). J. Crop Sci. and Biotech. 17: 255-266.
Farshadfar, E., Sutka, J. 2002. Screening drought tolerance criteria in maize. Acta. Agron. Hung. 50: 411–416.
Farshadfar, E., Pour Siahbidi, M.M., Pour Abooghadareh, A.R. 2012. Repeatability of drought tolerance indices in bread wheat
genotypes. Inter. J. Agric. Crop Sci. 4: 891-903.
Farshadfar, E., Mohammadi, R., Farshadfar, M., Dabiri, S. 2013a. Relationships and repeatability of drought tolerance indices in
wheat-rye disomic addition lines. Aust. J. Crop Sci. 7: 130-138.
Farshadfar, E., Poursiahbidi, M.M., Safavi, S.M., Vosough, A. 2013b. Screening of Drought Tolerant Genotypes in Bread Wheat
using a New Integrated Selection Index. Adv. Crop Sci. 3: 237–246.
Page 12 of 25
https://mc.manuscriptcentral.com/cjps-pubs
Canadian Journal of Plant Science
Page 14
For Review O
nly
13
Fernandez, G.C.J. 1992. Effective selection criteria for assessing stress tolerance. In: Kuo C.G. (Ed.), Proceedings of the
International Symposium on Adaptation of Vegetables and Other Food Crops in Temperature and Water Stress, Publication,
Tainan, Taiwan.
Fischer, R.A., Maurer, R. 1978. Drought resistance in spring wheat cultivars. I., Grain yield response. Aust. J. Agric. Res. 29: 897-
907.
Fischer, R.A., Wood, J.T. 1979. Drought resistance in spring wheat cultivars III Yield association with morpho-physiological traits.
Aust. J. Agric. Res. 30: 1001–1020.
Flowers, T.J., Koyama, M.L., Flowers, S.A., Sudhakar, C., Singh, K.P., Yeo, A.R. 2000. QTL: Their place in engineering tolerance
of rice to salinity. J. Exp. Bot. 51: 99–106.
Gavuzzi, P., Delogu, G., Boggini, G., Di Fonzo, N., Borghi, B. 1993. Identification of bread wheat, durum wheat and barley
cultivars adapted to dry areas of southern Italy. Euphytica. 68: 131–145.
Geerts, S., Raes, D. 2009. Deficit irrigation as an on-farm strategy to maximize crop water productivity in dry areas. Agric. Water
Management. 96: 1275-1284.
Gheysari, M., Loescher H. W., Sadeghi, S.H., Mirlatifi, S.M., Zareian, M. J., Hoogenboom, G. 2015. Water-yield relations and
water use efficiency of maize under nitrogen fertigation for semiarid environments: experiment and synthesis. In: Sparks, D.L.
(Ed.), Advances in Agronomy, pp. 175-229.
Gheysari, M., Mirlatifi, S.M., Bannayan, M., Homaee, M., Hoogenboom, G. 2009. Interaction of water and nitrogen on maize
grown for silage. Agric. Water Management. 96: 809-821.
Giancarla, V., Madosa, E., Ciulca, S., Adriana, C., Cerasela, P., Nicoleta, B. 2010. Assessment of drought tolerance in some barley
genotypes cultivated in West part of Romania. J. Hortic. Forestry Biotech. 14: 114-118.
Golabadi, M., Arzani, A., Mirmohammadi Maibody, S.A.M. 2006. Assessment of drought tolerance in segregating populations in
durum wheat. Afric. J. Agric. Res. 1: 162-171.
Guttieri, M.J., Stark, J.C., Brien, K., Souza, E. 2001. Relative sensitivity of spring wheat grain yield and quality parameters to
moisture deficit. Crop Sci. 41: 327-335.
Hejazi, P., Mousavi, S.M.N., Mostafavi, K., Ghomshei, M.S., Hejazi, S., Mousavi, S.M.N. 2013. Study on hybrids maize response
for drought tolerance index. Adv. Environ. Biology. 7: 333-338.
Jafaria, A., Paknejada, F., Jami AL-Ahmadib, M. 2009. Evaluation of selection indices for drought tolerance of corn (Zea mays L.)
hybrids. Inter. J. Plant Production. 3: 33-38.
Khalili, M., Naghavi, M.R., Pour Aboughadareh, A., Talebzadeh, S.J. 2012. Evaluating of Drought Stress Tolerance Based on
Selection Indices in Spring Canola Cultivars (Brassica napus L.). J .Agric. Sci. 4: 78-85.
Page 13 of 25
https://mc.manuscriptcentral.com/cjps-pubs
Canadian Journal of Plant Science
Page 15
For Review O
nly
14
Kiani, M., Gheysari, M., Mostafazadeh-Fard, B., Majidi, M. M., Karchani, K., Hoogenboom, G. 2016. Effect of the interaction
of water and nitrogen on sunflower under drip irrigation in an arid region. Agricultural Water Management. 171, Pages 162–172.
Kulpa, W., Denart, S. 1962. Zur systematic von Linum usitatissimum L. [On the systematic Linum usitatissimum L.].
Kulturpflanze. 3: 341-388.
Lan, J. 1998. Comparison of evaluating methods for agronomic drought resistance in crops. Acta. Agric. Boreali-occidentalis
Sinica. 7: 85–87.
Lander, E.S., Botstein, D. 1989. Mapping Mendelian factors underlying quantitative traits using RFLP linkage maps. Genet. 121:
185–199.
Lin, C.S., Binns, M.R., Lefkovitch, L.P. 1986. Stability analysis: where do we stand? Crop Sci. 26: 894-900.
Luan, S. 2002. Signalling drought in guard cells. Plant, Cell and Environ. 25: 229–237.
Majidi, M.M., Tavakoli, V., Mirlohi, A.F., Sabzalian, M.R. 2011. Wild safflower species (Carthamus oxyacanthus Bieb.): A
possible source of drought tolerance for arid environ. Aust. J. Crop Sci. 5: 1055-1063.
Marchenkov, A., Rozhmina, T., schapovsky, I.U., Muir, A.D. 2003. Cultivation of flax. In: Muir AD, Westcott ND (eds) Flax: the
Genus Linum. CRC, New York, PP. 74-91.
Mohammadi, A.A., Saeidi, G., Arzani, A. 2010. Genetic analysis of some agronomic traits in flax (Linum usitatissimum L.). Aust.
J. Crop Sci. 4: 343-352.
Moosavi, S.S., Yazdi Samadi, B., Naghavi, M.R., Zali, A.A., Dashti, H., Pourshahbazi, A. 2008. Introduction of new indices to
identify relative drought tolerance and resistance in wheat genotypes. Desert .12: 165-178.
Nazari, L., Pakniat, H. 2010. Assessment of drought tolerance in barley genotypes. J. Appl. Sci. 10: 151-156.
Nouraein, M., Mohammadi, S.A., Aharizad, S., Moghaddam, M., Sadeghzadeh, B. 2013. Evaluation of drought tolerance indices in
wheat recombinant inbred line population. Annals Biological Res. 4: 113-122.
Pourdad, S.S. 2008. Study on drought resistance indices in spring safflower. Acta. Agronomica Hungarica. 56: 203–212.
Rahimi, M., Dehghani, H., Rabiei, B., Tarang, A.R. 2013. Evaluation of rice segregating population based on drought tolerance
criteria and biplot analysis. Inter. J. Agric. Crop Sci. 5: 194-199.
Ramirez, P., Kelly, J.D. 1998. Traits related to drought resistance in common bean. Euphytica. 99: 127-136.
Rosielle, A.A., Hamblin, J. 1981. Theoretical aspects of selection for yield in stress and non-stress environment. Crop Sci. 21: 943-
946.
Saba, J., Moghaddam, M., Ghassemi, K., Nishabouri, M.R. 2001. Genetic Properties of Drought Resistance Indices. J. Agric. Sci.
Technol. 3: 43-49.
SAS Institute 1999. SAS/STAT Software: Release 9.00. SAS Inst. Cary, N.C, USA.
Page 14 of 25
https://mc.manuscriptcentral.com/cjps-pubs
Canadian Journal of Plant Science
Page 16
For Review O
nly
15
Schroeder, J.I., Kwak, J.M., Allen, G.J. 2001. Guard cell abscisic acid signalling and engineering drought hardiness in plants.
Nature. 410: 327–330.
Sharma, J.C., Tomar, S.S., Shivran, R.K., Chandra, P. 2012. Water requirement, water use efficiency, consumptive use, yield and
quality parameters of linseed (Linum usitatissimum L.) varieties as influenced by fertility levels, irrigation scheduling. Adv. Life
Scie. 1: 180- 182.
Siahpoosh, M.R., Dehghanianb, E., Kamara, A. 2011. Drought tolerance evaluation of bread wheat genotypes using water use
efficiency, evapotranspiration efficiency, and drought susceptibility index. Crop Sci. 51: 1198-1204.
Sio-Se Mardeh, A., Ahmadi, A., Poustini, K., Mohammadi, V. 2006. Evaluation of drought resistance indices under various
environmental conditions. Field Crops Res. 98: 222–229.
Ud-Din, N, Carverm B.F., Clutter, A.C. 1992. Genetic analysis and selection for wheat yield in drought-stressed and irrigated
environments. Euphytica. 62: 89-96.
Van Ginkel, M., Calhoun, D.S., Gebeyehu, G., Miranda, A., Tian-you, C., Pargas Lara, R., Trethowan, R.M., Sayre, K., Crossa, L.,
Rajaram, S. 1998. Plant traits related to yield of wheat in early, late, or continuous drought conditions. Euphytica .100: 109-121.
Végh, K.R. 2013. Root and leaf traits, water use and drought tolerance of maize genotypes. Biologia. 68: 1123-1127.
Yarnia, M., Arabifard, N., Rahimzadeh Khoei, F., Zandi, P. 2011. Evaluation of drought tolerance indices among some winter
rapeseed cultivars. Afric. J. Biotech. 10: 10914-10922.
Yan, W., Rajcan, I. 2002. Biplot analysis of test sites and trait relations of soybean in Ontario. Crop Sci. 42: 2-11.
Yeo, A. 1998. Molecular biology of salt tolerance in the context of whole-plant physiology. J. Experimental Botany. 49: 913–929.
Yenpreddiwar, M.D., Nikam, R.R., Dange, R.B., Gaidhane, S.N. 2007. Water use studies in linseed as influenced by different
irrigation levels and moisture conservation practices. Soils and Crops. 17: 176-177.
Page 15 of 25
https://mc.manuscriptcentral.com/cjps-pubs
Canadian Journal of Plant Science
Page 17
For Review O
nly
16
Table1- The weather conditions of the Research Farm of Isfahan University of Technology (RFIUT) during the vegetation period
in 2012.
Months Cumulative
Sunshine (hour)
Cumulative pan
evaporation (mm)
Cumulative rain
(mm)
Average of air
humidity (%)
Average of air
temperature (°C)
March 210.5 125 7.8 48.6 10.6
April 252.0 159.1 38.4 44.4 13.1
May 288.1 250.4 10 36.0 19.4
Jun 288.1 250.4 0 36.0 19.4
July 357.3 376 0 22.7 28.1
Aug 334.9 275.8 0 25.1 24.9
Page 16 of 25
https://mc.manuscriptcentral.com/cjps-pubs
Canadian Journal of Plant Science
Page 18
For Review O
nly
17
Table2- Relationships of 16 drought tolerance indices
No. Index Ab. Formulab
Explanation Reference
1 Stress
susceptibility index
SSI
�1 − ���/� ��/�1 −
�Ῡs/Ῡp��
The genotypes with SSI<1 have high
level of yield in stress conditions and are
more resistant to drought stress
conditions, but almost the genotypes do
not have the high level of yield in non-
stress condition.
Fischer and
Maurer 1978
2 Relative drought
index RDI ���/� � ∕ �Ῡs/Ῡp�
Fischer and
Wood 1979
3 Tolerance index TOL � − ��
The genotypes with low values of TOL
and high value of MP and HM are more
stable in different conditions.
Rosielle and
Hamblin 1981
4
Mean productivity
MP �� + ���/2
5 Harmonic mean HM [2��� ∗ � �/��� +� �]
6 Stress tolerance
index STI �� ∗ ���/Ῡ�*
The genotypes with high STI values will
be tolerant to drought stress
Fernandez
1992
7 Geometric mean
productivity GMP +�� ∗ ���
GMP is interested in relative performance
under various conditions, since drought
stress can vary in severity in the field
environment over years.
Fernandez
1992
8
Yield index
YI ��/Ῡs Gavuzzi et al.
1997
9 Yield stability
index YSI ��/�
Bouslama and
Schapaugh
1984
10 Drought resistance
index DI �� ∗ ���/� �/Ῡs Lan 1998
11 Modified stress
tolerance index MSTI
a ,-.�/, 11 =
234
Ῡ54 ,
12 = 264
Ῡ74
Farshadfar and
Sutka 2002
12 Abiotic tolerance
index ATI
[�� − ���/�Ῡp/Ῡs�] ∗√��Yp ∗ Ys�� They were introduced to identify
relatively tolerant (through ATI and
SSPI) and resistant (through SNPI)
genotypes under non irrigated and
irrigated conditions
Moosavi et al.
2008 13
Stress
susceptibility
percentage index
SSPI [�� − ���/�2 ∗ Ῡp�] ∗100
14 Stress non-stress
production index SNPI
∛{[�� + ���/�� −���] ∗ �� ∗ �� ∗ ���}
15 Sensitivity drought
index SDI � − ���/�
Farshadfar et
al. 2012
16 Superiority index Pi ∑ �>-? − @?�*ABCD /2E
Clarke et al.
1992; Lin et al.
1986 a where ki is the correction coefficient
b In the above formulas, ��, � , Ῡs and Ῡp, represent yield under stress, yield under non-stress for each genotype, and yield mean
in stress and non-stress conditions for all genotypes, respectively. E, >-? and @? are the number of environments which is equal
two, the grain yield of ith genotype in the jth environment and the yield of the genotype with maximum yield at environment j,
respectively.
Page 17 of 25
https://mc.manuscriptcentral.com/cjps-pubs
Canadian Journal of Plant Science
Page 19
For Review O
nly
18
Table3- Analysis of variance based on RCBD for grain yield (Y) and irrigation water use efficiency (IWUE) in non- stress (p) and
stress (s) conditions and studied indices
Mean Squarea of Indexb
S.O.V. df IWUEp IWUEs Yp Ys SSI RDI TOL
Block 2 0.62** 0.62** 103743** 55111** 1.62** 0.98** 10213**
Family 120 0.03** 0.02** 5697** 1834** 0.34** 0.21** 4831**
Error 240 0.02 0.01 2602 854 0.17 0.11 2914
MP HM STI GMP YI YSI DI
Block 2 76874** 66776** 0.31** 70364** 5.70** 0.31** 3.91**
Family 120 2558** 2208** 0.19** 2259** 0.19** 0.07** 0.20**
Error 240 999 887 0.09 867 0.09 0.03 0.11
K1STI K2STI ATI SSPI SNPI PI SDI
Block 2 83.47** 74.52** 521868818** 833** 360372** 4995980729** 0.31**
Family 120 4.20ns 2.99ns 52646394** 394** 16277** 231747267** 0.07**
Error 240 3.67 2.37 36389911 238 11053 78518391 0.03
a **, * and ns: Significant at 5% and 1% probability levels and non-significant, respectively
b SSI: Stress susceptibility index, RDI: Relative drought index, TOL: Tolerance index, MP: Mean productivity, HM:
Harmonic mean, STI Stress tolerance index, GMP: Geometric mean productivity, YI: Yield index, YSI: Yield stability
index, DI: Drought resistance index, MSTI: Modified stress tolerance index, ATI: Abiotic tolerance index, SSPI: Stress
susceptibility percentage index, SNPI: Stress non-stress production index, SDI: Sensitivity drought index and Pi:
Superiority
Page 18 of 25
https://mc.manuscriptcentral.com/cjps-pubs
Canadian Journal of Plant Science
Page 20
For Review O
nly
19
Table4- Correlation coefficients of grain yield (Y) and irrigation water use efficiency (IWUE) in non- stress (IWUEp) and stress
(IWUEs) conditions and studied indices
Indexb IWUEp IWUEs Yp Ys SSI RDI TOL MP HM STI
IWUEs 0.40**
Yp 0.97**
0.41**
Ys 0.38**
0.95**
0.42**
SSI 0.48**
-0.48**
0.47**
-0.53**
RDI -0.48**
0.48**
-0.47**
0.53**
-1.00
TOL 0.82**
-0.13 0.83**
-0.16 0.84**
-0.84**
MP 0.89**
0.71**
0.92**
0.74**
0.13 -0.13 0.55**
HM 0.63**
0.91**
0.67**
0.94**
-0.24**
0.24**
0.15 0.90**
STI 0.78**
0.80**
0.82**
0.82**
-0.02 0.02 0.38**
0.96**
0.95**
GMP 0.76**
0.84**
0.80**
0.87**
-0.07 0.07 0.34**
0.97**
0.98**
0.98**
YI 0.38**
0.95**
0.42**
1.00**
-0.53**
0.53**
-0.16**
0.74**
0.94**
0.82**
YSI -0.48**
0.48**
-0.47**
0.53**
-1.00**
1.00**
-0.84**
-0.12 0.24 0.02
DI -0.03 0.81**
-0.02 0.87**
-0.84**
0.84**
-0.56**
0.36**
0.66**
0.48**
K1STI 0.77**
0.36**
0.79**
0.37**
0.25**
-0.25**
0.63**
0.74**
0.55**
0.76**
K2STI 0.51**
0.72**
0.53**
0.74**
-0.14 0.14 0.12 0.71**
0.79**
0.86**
ATI 0.89**
0.13 0.92**
0.12 0.60**
-0.60**
0.92**
0.73**
0.41**
0.62**
SSPI 0.82**
-0.13 0.83**
-0.16 0.84**
-0.84**
1.00**
0.55**
0.15 0.38**
SNPI 0.03 0.75**
0.05 0.82**
-0.77**
0.77**
-0.45**
0.38**
0.62**
0.47**
PI -0.92**
-0.61**
-0.96**
-0.62**
-0.29**
0.29**
-0.65**
-0.98**
-0.83**
-0.90**
SDI 0.48**
-0.48**
0.47**
-0.53**
1.00**
-1.00**
0.84**
0.12 -0.24**
-0.02
GMP YI YSI DI K1STI K2STI ATI SSPI SNPI PI
YI 0.87**
YSI 0.07 0.53**
DI 0.54**
0.87**
0.84**
K1STI 0.65**
0.37**
-0.25**
0.04
K2STI 0.77**
0.74**
0.14 0.53**
0.67**
ATI 0.57**
0.12 -0.60**
-0.30**
0.85**
0.35**
SSPI 0.34**
-0.16 -0.84**
-0.56**
0.63**
0.12 0.92**
SNPI 0.52**
0.82**
0.77**
0.94**
0.09 0.50**
-0.21**
-0.45**
PI -0.92**
-0.62**
0.29**
-0.21* -0.67
** -0.61
** -0.77
** -0.65
** -0.24
**
SDI -0.07 -0.53**
-1.00**
-0.84**
0.25**
-0.14 0.60**
0.84**
0.77**
-0.29**
a ** and * Significant at 5% and 1% probability levels
b SSI: Stress susceptibility index, RDI: Relative drought index, TOL: Tolerance index, MP: Mean productivity, HM: Harmonic
mean, STI Stress tolerance index, GMP: Geometric mean productivity, YI: Yield index, YSI: Yield stability index, DI: Drought
resistance index, MSTI: Modified stress tolerance index, ATI: Abiotic tolerance index, SSPI: Stress susceptibility percentage
index, SNPI: Stress non-stress production index, SDI: Sensitivity drought index and Pi: Superiority index
Page 19 of 25
https://mc.manuscriptcentral.com/cjps-pubs
Canadian Journal of Plant Science
Page 21
For Review O
nly
20
Table5- The coefficients of grain yield (Y) and irrigation water use efficiency (IWUE) in non- stress (IWUEp) and stress (IWUEs)
conditions and studied indices in PC1 and PC2 based on principal component analysis.
Eigen Vectors of indexa
PC
Eigen Value
% Cumulative
IWUEp
IWUEs
Yp
Ys
SSI
RDI
TOL
MP
HM
STI
GMP
PC1 10.5 50.1 0.26 0.24 0.27 0.25 0.01 -0.01 0.14 0.30 0.29 0.30 0.30
PC2 8.9 92.7 -0.16 0.18 -0.16 0.20 -0.33 0.33 -0.29 -0.03 0.10 0.02 0.04
YI
YSI
DI
K1STI
K2STI
ATI
SSPI
SNPI
PI
SDI
PC1 0.25 -0.01 0.14 0.23 0.25 0.21 0.14 0.14 -0.29 0.01
PC2 0.20 0.33 0.30 -0.10 0.07 -0.22 -0.29 0.27 0.08 -0.33
a SSI: Stress susceptibility index, RDI: Relative drought index, TOL: Tolerance index, MP: Mean productivity, HM: Harmonic
mean, STI Stress tolerance index, GMP: Geometric mean productivity, YI: Yield index, YSI: Yield stability index, DI: Drought
resistance index, MSTI: Modified stress tolerance index, ATI: Abiotic tolerance index, SSPI: Stress susceptibility percentage
index, SNPI: Stress non-stress production index, SDI: Sensitivity drought index and Pi: Superiority index
Page 20 of 25
https://mc.manuscriptcentral.com/cjps-pubs
Canadian Journal of Plant Science
Page 22
For Review O
nly
21
Day after planting
0 20 40 60 80 100
Total applied water and evapotranspiration (mm)
50
100
150
200
250
300
350
400
450
500
550
600
650
Cumulative Applied Water and Rain Full Irrigation (mm)
Cumulative Applied Water and Rain Deficit Irrigation (mm
Cumulative ETc
Cumulative ET0
Full Irrigation
Deficit Irrigation
2012
Fig. 1- The amount of cumulative total applied water (irrigation and rain) (mm) under water deficit stress and non-water stress
conditions, cumulative reference evapotranspiration (ET0) and cumulative flax evapotranspiration (ETC) in growing season 2012
Page 21 of 25
https://mc.manuscriptcentral.com/cjps-pubs
Canadian Journal of Plant Science
Page 23
For Review O
nly
22
Fig. 2- Frequency distribution of F3 families derived from a cross between KO37 and SP1066 for A) grain yield (g m-2
) and B)
irrigation water use efficiency (IWUE, g Lit-1
) in stress and non stress conditions. Average yield of KO37 and SP1066 are
indicated on the graph in both stress and non-stress conditions.
Page 22 of 25
https://mc.manuscriptcentral.com/cjps-pubs
Canadian Journal of Plant Science
Page 24
For Review O
nly
23
Fig. 3- Biplot analysis of F3 families based on PC1 and PC2. The vector was drawn from center to each index.
Yp: grain yield in non- stress and Ys: in stress conditions, IWUEp: irrigation water use efficiency in non- stress and IWUEs : in
stress conditions, SSI: Stress susceptibility index, RDI: Relative drought index, TOL: Tolerance index, MP: Mean productivity,
HM: Harmonic mean, STI: Stress tolerance index, GMP: Geometric mean productivity, YI: Yield index, YSI: Yield stability index,
DI: Drought resistance index, MSTI: Modified stress tolerance index, ATI: Abiotic tolerance index, SSPI: Stress susceptibility
percentage index, SNPI: Stress non-stress production index, SDI: Sensitivity drought index and Pi: Superiority index
Page 23 of 25
https://mc.manuscriptcentral.com/cjps-pubs
Canadian Journal of Plant Science
Page 25
For Review O
nly
24
Fig. 4- Triplot analysis of F3 families based on grain yield in non- stress (Yp) and stress (Ys) conditions and Stress tolerance index
(STI). The vector was drawn from each family to bottom. Families were classified to four groups.
Page 24 of 25
https://mc.manuscriptcentral.com/cjps-pubs
Canadian Journal of Plant Science
Page 26
For Review O
nly
25
X Data
1 2 3 4 5 6 7 8 9 10 11 12 13 14 15
GY (gr m-2)
100
200
300
400
500
N
S
1 2 3 4 5 6 7 8 9 10 11 12 13 14 15
IWP (kg m-3)
0.0
0.2
0.4
0.6
0.8
1.0
KO37
KO37
SP1066
SP1066
Fig.5- Mean of grain yield (GY) and irrigation water use efficiency (IWUE) among superior F3 families in stress (S) and non stress
(N) conditions. Numbers 1 to 15 on horizontal axis corresponds to families number 26, 36, 37, 38, 39, 43, 70, 72, 74, 78, 81,
113.119, KO37 and SP1066 respectively.
Page 25 of 25
https://mc.manuscriptcentral.com/cjps-pubs
Canadian Journal of Plant Science