PROPERTY HIGHLIGHTS
RARE OPPORTUNITY
6,525 Square Foot Mixed-Use Building
Streetcar Stop Station #10 Directly Across the Street
Catty-Corner to Historical Findlay Market’s Entrance
Joshua M. [email protected]
513.268.4453
Milford
Eastgate
74
275
264
12727
275
74
75
71
42
7522
42
71
275
50
471
27 52
126
747
4
126
50
125
32
Mason
OH
IOIN
DIA
NA
BUTLER COUNTY
HAMILTON COUNTY WARREN COUNTY
CLERMONT COUNTY
CAMPBELL COUNTY
KENTON COUNTY
BOONE COUNTY
Kenwood
Deerfield Twp
Anderson Twp
Hyde ParkWestern Hills
Covington
Newport
INT’L AIRPORT
Colerain Twp
CINCINNATI
Springdale
West Chester
OHIOKENTUCKY
6,525 SF
OnSite Retail Group, LLC | 9545 Kenwood Road, Suite 202 | Cincinnati, OH 45242 | 513.924.4989 | www.onsiteretailgroup.com
FOR SALEOTR Building Along Streetcar
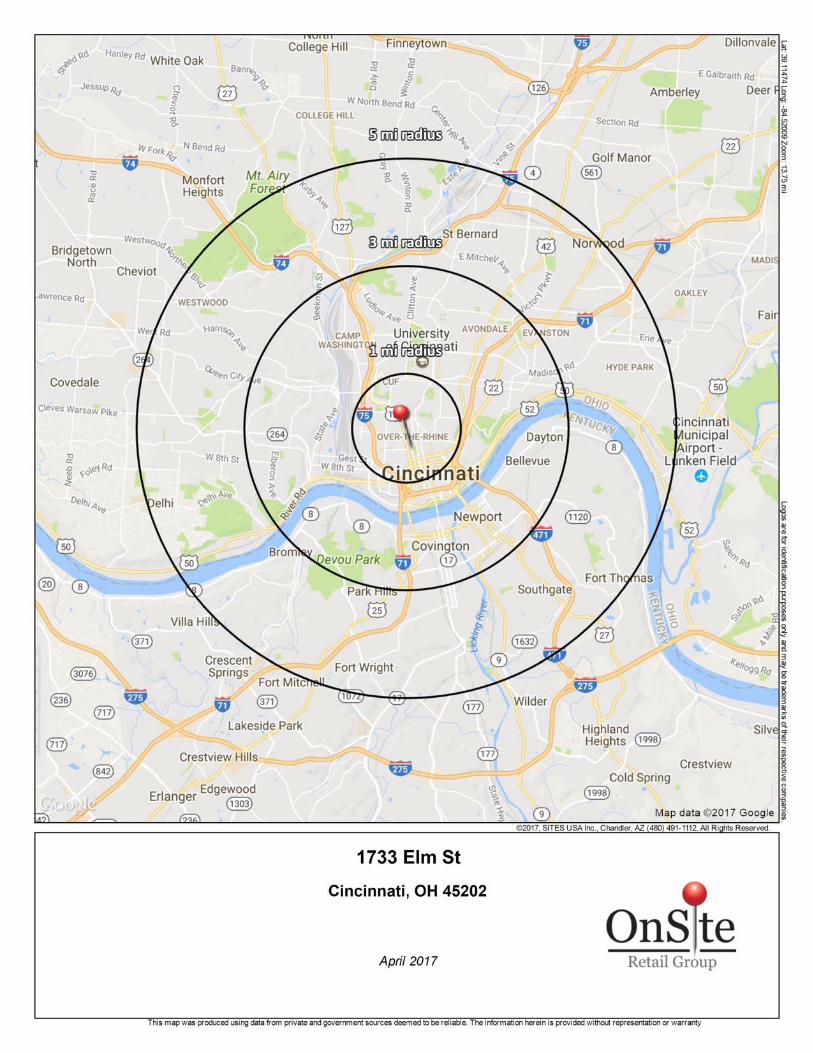
DEMOGRAPHICSYear 2016Estimated PopulationMedian IncomeAverage HH IncomeDaytime Population
1733 Elm Street, Cincinnati, OH 45202
3 Mile147,500$33,997$51,024258,867
5 Mile318,674$41,367$57,763321,688
1 Mile32,159
$27,452$43,101
57,147
Traffic Counts: Elm Street 3,000 ADT ('16)
The information herein is produced using data from private and government sources deemed to be reliable and is provided without representation or warranty.Logos are for identification purposes only and may be trademarks of their respective companies. © 2017 OnSite Retail Group, LLC All Rights Reserved.
1733 Elm Street, Cincinnati, OH 45202Joshua M. [email protected]
The information herein is produced using data from private and government sources deemed to be reliable and is provided without representation or warranty. Logos are for identification purposes only and may be trademarks of their respective companies. © 2017 OnSite Retail Group, LLC All Rights Reserved.
SITE
75
71
71
75
75
Newport
Bellevue
Dayton
Covington
Cincinnati
71
71Ludlow
Mairmount
WashingtonPark
CincinnatiMusic Hall
AlumniLofts
1733 Elm Street, Cincinnati, OH 45202Joshua M. [email protected]
The information herein is produced using data from private and government sources deemed to be reliable and is provided without representation or warranty. Logos are for identification purposes only and may be trademarks of their respective companies. © 2017 OnSite Retail Group, LLC All Rights Reserved.
3K
15K
WashingtonPark
CincinnatiMusic Hall
AlumniLofts
SITE
Demographic Source: Applied Geographic Solutions 10/2016, TIGER Geography page 1 of 1©2017, Sites USA, Chandler, Arizona, 480-491-1112
Th
is r
ep
ort
wa
s p
rod
uce
d u
sin
g d
ata
fro
m p
riva
te a
nd
go
vern
me
nt
sou
rce
s d
ee
me
d t
o b
e r
elia
ble
. T
he
info
rma
tio
n h
ere
in is
pro
vid
ed
with
ou
t re
pre
sen
tatio
n o
r w
arr
an
ty.
SUMMARY PROFILE2000-2010 Census, 2016 Estimates with 2021 Projections
Calculated using Weighted Block Centroid from Block Groups
Lat/Lon: 39.1148/-84.5201RS1
1733 Elm St1 mi radius 3 mi radius 5 mi radius
Cincinnati, OH 45202
PO
PU
LA
TIO
N
2016 Estimated Population 32,159 147,500 318,674
2021 Projected Population 33,182 153,303 329,422
2010 Census Population 29,176 139,514 310,671
2000 Census Population 31,466 158,039 344,146
Projected Annual Growth 2016 to 2021 0.6% 0.8% 0.7%
Historical Annual Growth 2000 to 2016 0.1% -0.4% -0.5%
2016 Median Age 30 32 33.7
HO
US
EH
OL
DS
2016 Estimated Households 14,286 65,787 141,215
2021 Projected Households 15,067 69,627 148,401
2010 Census Households 12,474 60,576 134,116
2000 Census Households 13,756 68,712 148,211
Projected Annual Growth 2016 to 2021 1.1% 1.2% 1.0%
Historical Annual Growth 2000 to 2016 0.2% -0.3% -0.3%
RA
CE
AN
DE
TH
NIC
ITY
2016 Estimated White 40.5% 53.8% 61.1%
2016 Estimated Black or African American 53.7% 38.6% 32.4%
2016 Estimated Asian or Pacific Islander 2.8% 3.1% 2.2%
2016 Estimated American Indian or Native Alaskan 0.3% 0.3% 0.2%
2016 Estimated Other Races 2.8% 4.3% 4.1%
2016 Estimated Hispanic 2.4% 3.7% 3.3%
INC
OM
E 2016 Estimated Average Household Income $43,101 $51,024 $57,763
2016 Estimated Median Household Income $27,452 $33,997 $41,367
2016 Estimated Per Capita Income $20,816 $23,501 $26,011
ED
UC
AT
ION
(AG
E 2
5+
)
2016 Estimated Elementary (Grade Level 0 to 8) 3.2% 5.2% 4.2%
2016 Estimated Some High School (Grade Level 9 to 11) 11.9% 12.1% 10.4%
2016 Estimated High School Graduate 27.3% 27.3% 28.2%
2016 Estimated Some College 19.0% 19.6% 19.8%
2016 Estimated Associates Degree Only 6.3% 6.6% 7.0%
2016 Estimated Bachelors Degree Only 17.9% 16.6% 18.1%
2016 Estimated Graduate Degree 14.2% 12.7% 12.3%
BU
SIN
ES
S 2016 Estimated Total Businesses 2,684 11,596 17,038
2016 Estimated Total Employees 57,147 258,867 321,688
2016 Estimated Employee Population per Business 21.3 22.3 18.9
2016 Estimated Residential Population per Business 12.0 12.7 18.7