Page 1
Campana Waltz Commercial Real Estate, LLC
Ron A. Campana, Jr.
11832 Fishing Point Drive, Suite 400
Newport News, Virginia 23606
757.327.0333
[email protected]
www.CampanaWaltz.com
This information was obtained from sources deemed to be reliable, but is not warranted.
This offer subject to errors and omissions, or withdrawal, without notice.
FOR ADDITIONAL INFORMATION, PLEASE CONTACT:
For Sale
Redevelopment Opportunity101 Maxton Lane
Williamsburg, Virginia
Page 2
FOR SALE
Redevelopment Opportunity 101 Maxton Lane
Williamsburg, Virginia
Location: 101 Maxton Lane, Williamsburg, Virginia
Description: The property is currently zoned A-1, and this parcel is adjacent to the
James City County Regional Library.
This parcel is ideal for a business looking to purchase and be located on a
highly visible corner lot.
Located on the corner of Croaker Road & Maxton Lane in James City
County, VA. The property is approximately .4 miles of Interstate 64,
which supplies direct access to Richmond and Newport News/Hampton.
The site is within 2.6 miles of Route 199 which creates a loop around
Williamsburg. The property is in close proximity to Walmart, Lowes,
Sentara Hospital, and is adjacent to the James City County Regional
Library.
Land Area: Approximately 2.27 Acres
Improvements: Approximately 2,400 Square Feet
Sales Price: $350,000.00
Zoning: A-1 General Agricultural District. Multiple allowable uses by SUP are
attached in the marketing package.
General Information:
Rare opportunity
Great road frontage on Croaker Road
Well established area
Surrounded by numerous retailers and solid residential
neighborhoods
Also included:
Aerial Maps
Location Map
Floor Plan
Plat
List of uses which are allowed by right
Demographic Information
For Additional Information, Please Contact:
Ron A. Campana, Jr.
Campana Waltz Commercial Real Estate, LLC
11832 Fishing Point Drive, Suite 400
Newport News, Virginia, 23606
757.327.0333
[email protected]
www.CampanaWaltz.com
This information was obtained from sources deemed to be reliable, but is not warranted.
This offer subject to errors and omissions or withdrawal without notice.
Page 3
This information was obtained from sources deemed to be reliable, but is not warranted.
This offer subject to errors and omissions, or withdrawal, without notice.
101 Maxton Lane
Williamsburg, Virginia
Page 4
This information was obtained from sources deemed to be reliable, but is not warranted.
This offer subject to errors and omissions, or withdrawal, without notice.
101 Maxton Lane
Williamsburg, Virginia
Page 5
This information was obtained from sources deemed to be reliable, but is not warranted.
This offer subject to errors and omissions, or withdrawal, without notice.
101 Maxton Lane
Williamsburg, Virginia
Page 6
This information was obtained from sources deemed to be reliable, but is not warranted.
This offer subject to errors and omissions, or withdrawal, without notice.
101 Maxton Lane, Williamsburg, Virginia
Page 17
Demographic and Income Profile101 Maxton Ln, Williamsburg, Virginia, 23188 Prepared by Janice Lewis, CCIMDrive Time: 5 minute radius Latitude: 37.37936
Longitude: -76.76814
Summary Census 2010 2017 2022Population 5,076 6,750 7,679Households 1,835 2,425 2,747Families 1,451 1,896 2,139Average Household Size 2.77 2.78 2.80Owner Occupied Housing Units 1,506 1,938 2,220Renter Occupied Housing Units 329 488 527Median Age 41.2 42.1 42.5
Trends: 2017 - 2022 Annual Rate Area State NationalPopulation 2.61% 0.92% 0.83%Households 2.52% 0.86% 0.79%Families 2.44% 0.77% 0.71%Owner HHs 2.75% 0.83% 0.72%Median Household Income 1.51% 2.31% 2.12%
2017 2022 Households by Income Number Percent Number Percent
<$15,000 219 9.0% 258 9.4%$15,000 - $24,999 139 5.7% 151 5.5%$25,000 - $34,999 166 6.8% 170 6.2%$35,000 - $49,999 255 10.5% 262 9.5%$50,000 - $74,999 447 18.4% 443 16.1%$75,000 - $99,999 349 14.4% 380 13.8%$100,000 - $149,999 516 21.3% 619 22.5%$150,000 - $199,999 216 8.9% 300 10.9%$200,000+ 118 4.9% 165 6.0%
Median Household Income $73,933 $79,696Average Household Income $87,230 $97,950Per Capita Income $31,924 $35,725
Census 2010 2017 2022 Population by Age Number Percent Number Percent Number Percent
0 - 4 297 5.9% 372 5.5% 422 5.5%5 - 9 363 7.2% 444 6.6% 486 6.3%10 - 14 370 7.3% 456 6.8% 503 6.6%15 - 19 347 6.8% 432 6.4% 477 6.2%20 - 24 230 4.5% 328 4.9% 340 4.4%25 - 34 484 9.5% 704 10.4% 824 10.7%35 - 44 742 14.6% 894 13.2% 1,047 13.6%45 - 54 886 17.5% 1,047 15.5% 1,064 13.9%55 - 64 693 13.7% 971 14.4% 1,071 13.9%65 - 74 424 8.4% 704 10.4% 883 11.5%75 - 84 182 3.6% 295 4.4% 424 5.5%
85+ 58 1.1% 102 1.5% 137 1.8%Census 2010 2017 2022
Race and Ethnicity Number Percent Number Percent Number PercentWhite Alone 3,919 77.2% 5,036 74.6% 5,576 72.6%Black Alone 864 17.0% 1,204 17.8% 1,401 18.2%American Indian Alone 18 0.4% 28 0.4% 36 0.5%Asian Alone 73 1.4% 120 1.8% 159 2.1%Pacific Islander Alone 2 0.0% 3 0.0% 4 0.1%Some Other Race Alone 64 1.3% 118 1.7% 168 2.2%Two or More Races 136 2.7% 241 3.6% 335 4.4%
Hispanic Origin (Any Race) 218 4.3% 405 6.0% 558 7.3%Data Note: Income is expressed in current dollars.
Source: U.S. Census Bureau, Census 2010 Summary File 1. Esri forecasts for 2017 and 2022.
September 05, 2017
©2017 Esri Page 1 of 6
Page 18
Demographic and Income Profile101 Maxton Ln, Williamsburg, Virginia, 23188 Prepared by Janice Lewis, CCIMDrive Time: 5 minute radius Latitude: 37.37936
Longitude: -76.76814
AreaStateUSA
Trends 2017-2022Trends 2017-2022
Ann
ual R
ate
(in
perc
ent) 2.5
2
1.5
1
0.5
0Population Households Families Owner HHs Median HH Income
20172022
Population by AgePopulation by Age
Perc
ent
14
12
10
8
6
4
2
00-4 5-9 10-14 15-19 20-24 25-34 35-44 45-54 55-64 65-74 75-84 85+
2017 Household Income 2017 Household Income
<$15K9.0%
$15K - $24K5.7%
$25K - $34K6.8%
$35K - $49K10.5%
$50K - $74K18.4%
$75K - $99K14.4%
$100K - $149K21.3%
$150K - $199K8.9%
$200K+4.9%
2017 Population by Race2017 Population by Race
Perc
ent
70
60
50
40
30
20
10
0White Black Am. Ind. Asian Pacific Other Two+
2017 Percent Hispanic Origin: 6.0%
Source: U.S. Census Bureau, Census 2010 Summary File 1. Esri forecasts for 2017 and 2022.
September 05, 2017
©2017 Esri Page 2 of 6
Page 19
Demographic and Income Profile101 Maxton Ln, Williamsburg, Virginia, 23188 Prepared by Janice Lewis, CCIMDrive Time: 10 minute radius Latitude: 37.37936
Longitude: -76.76814
Summary Census 2010 2017 2022Population 15,459 18,645 20,771Households 5,936 7,140 7,935Families 4,431 5,292 5,860Average Household Size 2.60 2.60 2.61Owner Occupied Housing Units 4,648 5,489 6,134Renter Occupied Housing Units 1,288 1,652 1,801Median Age 42.5 44.2 44.8
Trends: 2017 - 2022 Annual Rate Area State NationalPopulation 2.18% 0.92% 0.83%Households 2.13% 0.86% 0.79%Families 2.06% 0.77% 0.71%Owner HHs 2.25% 0.83% 0.72%Median Household Income 2.00% 2.31% 2.12%
2017 2022 Households by Income Number Percent Number Percent
<$15,000 510 7.1% 580 7.3%$15,000 - $24,999 506 7.1% 539 6.8%$25,000 - $34,999 593 8.3% 595 7.5%$35,000 - $49,999 842 11.8% 849 10.7%$50,000 - $74,999 1,426 20.0% 1,409 17.8%$75,000 - $99,999 1,001 14.0% 1,112 14.0%$100,000 - $149,999 1,349 18.9% 1,621 20.4%$150,000 - $199,999 593 8.3% 801 10.1%$200,000+ 321 4.5% 429 5.4%
Median Household Income $67,836 $74,887Average Household Income $84,094 $94,231Per Capita Income $32,716 $36,560
Census 2010 2017 2022 Population by Age Number Percent Number Percent Number Percent
0 - 4 873 5.6% 958 5.1% 1,053 5.1%5 - 9 972 6.3% 1,094 5.9% 1,164 5.6%10 - 14 1,046 6.8% 1,139 6.1% 1,242 6.0%15 - 19 941 6.1% 1,083 5.8% 1,150 5.5%20 - 24 748 4.8% 906 4.9% 907 4.4%25 - 34 1,618 10.5% 2,058 11.0% 2,268 10.9%35 - 44 2,087 13.5% 2,273 12.2% 2,650 12.8%45 - 54 2,453 15.9% 2,629 14.1% 2,622 12.6%55 - 64 2,208 14.3% 2,682 14.4% 2,856 13.7%65 - 74 1,581 10.2% 2,261 12.1% 2,638 12.7%75 - 84 717 4.6% 1,172 6.3% 1,655 8.0%
85+ 217 1.4% 392 2.1% 569 2.7%Census 2010 2017 2022
Race and Ethnicity Number Percent Number Percent Number PercentWhite Alone 12,107 78.3% 14,227 76.3% 15,476 74.5%Black Alone 2,353 15.2% 2,899 15.5% 3,285 15.8%American Indian Alone 60 0.4% 86 0.5% 106 0.5%Asian Alone 267 1.7% 385 2.1% 495 2.4%Pacific Islander Alone 8 0.1% 12 0.1% 14 0.1%Some Other Race Alone 235 1.5% 374 2.0% 505 2.4%Two or More Races 428 2.8% 661 3.5% 890 4.3%
Hispanic Origin (Any Race) 740 4.8% 1,210 6.5% 1,619 7.8%Data Note: Income is expressed in current dollars.
Source: U.S. Census Bureau, Census 2010 Summary File 1. Esri forecasts for 2017 and 2022.
September 05, 2017
©2017 Esri Page 3 of 6
Page 20
Demographic and Income Profile101 Maxton Ln, Williamsburg, Virginia, 23188 Prepared by Janice Lewis, CCIMDrive Time: 10 minute radius Latitude: 37.37936
Longitude: -76.76814
AreaStateUSA
Trends 2017-2022Trends 2017-2022
Ann
ual R
ate
(in
perc
ent)
2.22
1.81.61.41.2
10.80.60.40.2
0Population Households Families Owner HHs Median HH Income
20172022
Population by AgePopulation by Age
Perc
ent
14
12
10
8
6
4
2
0-4 5-9 10-14 15-19 20-24 25-34 35-44 45-54 55-64 65-74 75-84 85+
2017 Household Income 2017 Household Income
<$15K7.1%
$15K - $24K7.1%
$25K - $34K8.3%
$35K - $49K11.8%
$50K - $74K20.0%
$75K - $99K14.0%
$100K - $149K18.9%
$150K - $199K8.3%
$200K+4.5%
2017 Population by Race2017 Population by Race
Perc
ent
70
60
50
40
30
20
10
0White Black Am. Ind. Asian Pacific Other Two+
2017 Percent Hispanic Origin: 6.5%
Source: U.S. Census Bureau, Census 2010 Summary File 1. Esri forecasts for 2017 and 2022.
September 05, 2017
©2017 Esri Page 4 of 6
Page 21
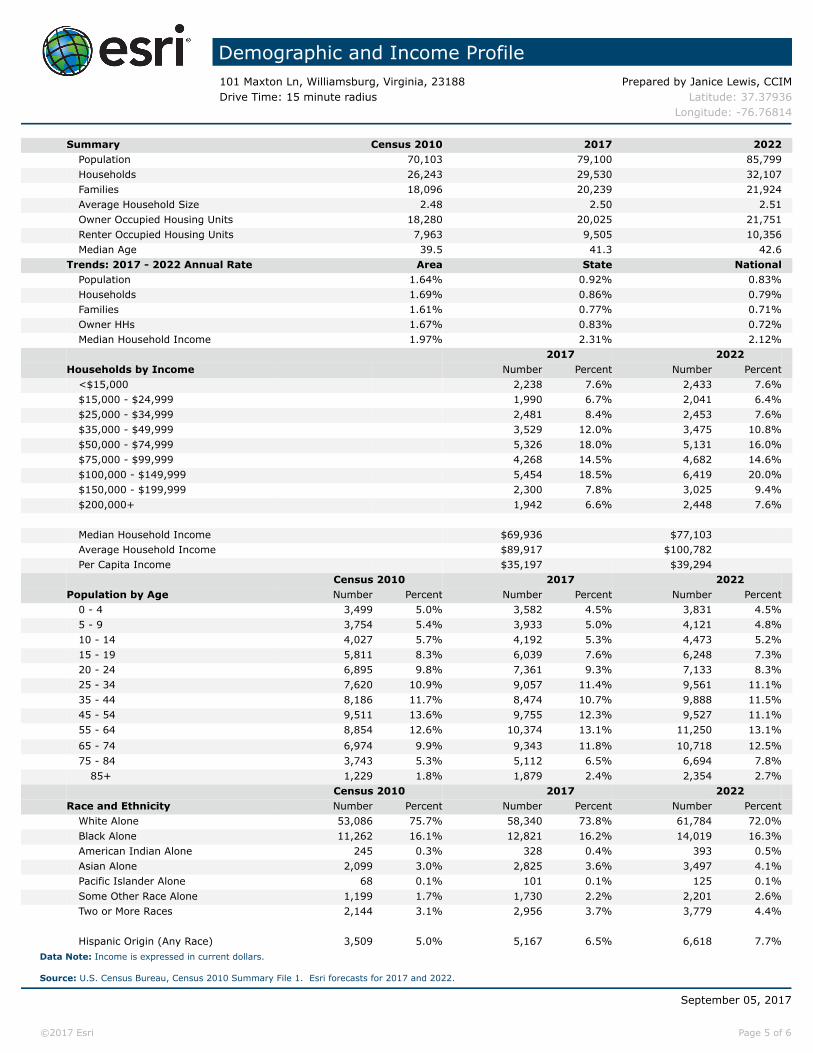
Demographic and Income Profile101 Maxton Ln, Williamsburg, Virginia, 23188 Prepared by Janice Lewis, CCIMDrive Time: 15 minute radius Latitude: 37.37936
Longitude: -76.76814
Summary Census 2010 2017 2022Population 70,103 79,100 85,799Households 26,243 29,530 32,107Families 18,096 20,239 21,924Average Household Size 2.48 2.50 2.51Owner Occupied Housing Units 18,280 20,025 21,751Renter Occupied Housing Units 7,963 9,505 10,356Median Age 39.5 41.3 42.6
Trends: 2017 - 2022 Annual Rate Area State NationalPopulation 1.64% 0.92% 0.83%Households 1.69% 0.86% 0.79%Families 1.61% 0.77% 0.71%Owner HHs 1.67% 0.83% 0.72%Median Household Income 1.97% 2.31% 2.12%
2017 2022 Households by Income Number Percent Number Percent
<$15,000 2,238 7.6% 2,433 7.6%$15,000 - $24,999 1,990 6.7% 2,041 6.4%$25,000 - $34,999 2,481 8.4% 2,453 7.6%$35,000 - $49,999 3,529 12.0% 3,475 10.8%$50,000 - $74,999 5,326 18.0% 5,131 16.0%$75,000 - $99,999 4,268 14.5% 4,682 14.6%$100,000 - $149,999 5,454 18.5% 6,419 20.0%$150,000 - $199,999 2,300 7.8% 3,025 9.4%$200,000+ 1,942 6.6% 2,448 7.6%
Median Household Income $69,936 $77,103Average Household Income $89,917 $100,782Per Capita Income $35,197 $39,294
Census 2010 2017 2022 Population by Age Number Percent Number Percent Number Percent
0 - 4 3,499 5.0% 3,582 4.5% 3,831 4.5%5 - 9 3,754 5.4% 3,933 5.0% 4,121 4.8%10 - 14 4,027 5.7% 4,192 5.3% 4,473 5.2%15 - 19 5,811 8.3% 6,039 7.6% 6,248 7.3%20 - 24 6,895 9.8% 7,361 9.3% 7,133 8.3%25 - 34 7,620 10.9% 9,057 11.4% 9,561 11.1%35 - 44 8,186 11.7% 8,474 10.7% 9,888 11.5%45 - 54 9,511 13.6% 9,755 12.3% 9,527 11.1%55 - 64 8,854 12.6% 10,374 13.1% 11,250 13.1%65 - 74 6,974 9.9% 9,343 11.8% 10,718 12.5%75 - 84 3,743 5.3% 5,112 6.5% 6,694 7.8%
85+ 1,229 1.8% 1,879 2.4% 2,354 2.7%Census 2010 2017 2022
Race and Ethnicity Number Percent Number Percent Number PercentWhite Alone 53,086 75.7% 58,340 73.8% 61,784 72.0%Black Alone 11,262 16.1% 12,821 16.2% 14,019 16.3%American Indian Alone 245 0.3% 328 0.4% 393 0.5%Asian Alone 2,099 3.0% 2,825 3.6% 3,497 4.1%Pacific Islander Alone 68 0.1% 101 0.1% 125 0.1%Some Other Race Alone 1,199 1.7% 1,730 2.2% 2,201 2.6%Two or More Races 2,144 3.1% 2,956 3.7% 3,779 4.4%
Hispanic Origin (Any Race) 3,509 5.0% 5,167 6.5% 6,618 7.7%Data Note: Income is expressed in current dollars.
Source: U.S. Census Bureau, Census 2010 Summary File 1. Esri forecasts for 2017 and 2022.
September 05, 2017
©2017 Esri Page 5 of 6
Page 22
Demographic and Income Profile101 Maxton Ln, Williamsburg, Virginia, 23188 Prepared by Janice Lewis, CCIMDrive Time: 15 minute radius Latitude: 37.37936
Longitude: -76.76814
AreaStateUSA
Trends 2017-2022Trends 2017-2022
Ann
ual R
ate
(in
perc
ent)
2.22
1.81.61.41.2
10.80.60.40.2
0Population Households Families Owner HHs Median HH Income
20172022
Population by AgePopulation by Age
Perc
ent
12
10
8
6
4
2
00-4 5-9 10-14 15-19 20-24 25-34 35-44 45-54 55-64 65-74 75-84 85+
2017 Household Income 2017 Household Income
<$15K7.6%
$15K - $24K6.7%
$25K - $34K8.4%
$35K - $49K12.0%
$50K - $74K18.0%
$75K - $99K14.5%
$100K - $149K18.5%
$150K - $199K7.8%
$200K+6.6%
2017 Population by Race2017 Population by Race
Perc
ent
70
60
50
40
30
20
10
0White Black Am. Ind. Asian Pacific Other Two+
2017 Percent Hispanic Origin: 6.5%
Source: U.S. Census Bureau, Census 2010 Summary File 1. Esri forecasts for 2017 and 2022.
September 05, 2017
©2017 Esri Page 6 of 6
Page 23
AGENCY DISCLOSURE
In a real estate transaction, when the Agent represents the:
Seller/Landlord:
then an Agent under a listing agreement with a seller acts as the agent for the seller. The
listing company and all of its broker/agents, and the selling company and all of its agents
as subagents of the seller, would owe their fiduciary duties to the seller. The broker and
broker's agents may still provide buyer/tenants, as customers, with information about
properties and available financing, may show them properties, and may assist them in
preparing an offer to purchase, option or lease a particular property.
Buyer/Tenant:
then an Agent under a contract with a buyer acts as the agent for that buyer only, as a
"Buyer/Broker/Agent," and the Agent is not the seller's agent, even if the Purchase
Contract provides that the Seller or the Listing Broker will pay the Agent for the services
rendered to the buyer/tenant. An Agent acting as the buyer's/tenant's agent must disclaim
sub agency if offered and must disclose the Buyer/Tenant Broker/Agent relationship when
dealing with the seller's/landlord's Agent or the Seller/Landlord. The Buyer/Tenant
Broker/Agent owes its fiduciary duties to the buyer/tenant.
Buyer and Seller (Acting as a Dual Agent):
then an Agent, either acting directly or through one or more of the brokerage firm's other
Agents, may be the Agent of both the buyer and the seller, but only if the scope of the
agency is limited by a written agreement and only with the express knowledge and written
consent of both the buyer and the seller. An Agent representing both the buyer and the
seller must disclose all information regarding the agency relationship, including the
limitation on the Agent's ability to represent either party folly and exclusively. The Agent
must not disclose to either party, without the prior consent of the party adversely affected
by the disclosure, any information obtained within the confidentiality and trust of the
fiduciary relationship. As an example, the Agent must not tell the buyer that the seller
will accept a price lower than the listing price, nor tell the seller that the buyer will pay a
price offered, without the prior consent of the party adversely affected by the disclosure.
Campana Waltz Commercial Real Estate, LLC is the Listing Broker, Buyer Broker,
Dual Agent for the property submitted in this information package.
Acknowledged by:
Campana Waltz Commercial Real Estate, LLC


![CSC Investor Day - Maxton Presentation Web.ppt [Compatibility Mode]](https://static.documents.pub/doc/80x56/58833e7b1a28ab53198bdfe9/csc-investor-day-maxton-presentation-webppt-compatibility-mode.jpg)


