166
INTEGRATED REPORT 2019 For the fiscal year ended March 31, 2019 Data Appendix

INTEGRATED REPORT 2019For the fiscal year ended March 31, 2019
Data Appendix


Corporate Information 2
Risk Management 7
Risk Glossary 12
Financial Information 14
Management’s Discussion and Analysis of Financial Condition and Results of Operations
14
Overview 14
Selected Financial Data (Consolidated) 16
Results of Operations (Consolidated) 17
Results of Operations (Nonconsolidated) 33
Critical Accounting Policies 33
Financial Condition 39
Consolidated Balance Sheet 54
Consolidated Statement of Income 55
Consolidated Statement of Comprehensive Income
56
Consolidated Statement of Changes in Equity 57
Consolidated Statement of Cash Flows 59
Notes to Consolidated Financial Statements 60
Independent Auditors’ Report 113
Nonconsolidated Balance Sheet (Unaudited) 114
Nonconsolidated Statement of Income (Unaudited)
115
Nonconsolidated Statement of Changes in Equity (Unaudited)
116
Capital Adequacy Requirement (Basel Accord) Pillar III (Market Discipline)
Disclosure117
Please see Shinsei Bank’s Integrated Report 2019 for our businesses, strategies and ESG information.
Contents
SHINSEI BANK, LIMITED Integrated Report 2019 Data Appendix 1

Corporate Information
Major Subsidiaries and Affiliates (As of March 31, 2019)
As of March 31, 2019, the Shinsei Bank Group consisted of Shinsei Bank, Limited, 179 subsidiaries (comprising 83 consolidated com-
panies including APLUS FINANCIAL Co., Ltd., Showa Leasing Co., Ltd., Shinsei Financial Co., Ltd. and Shinsei Investment & Finance
Limited and 96 unconsolidated subsidiaries) and 37 affiliated companies (35 affiliated companies accounted for using the equity meth-
od, such as Jih Sun Financial Holding Co., Ltd. and 2 affiliated companies that are not accounted for using the equity method). The
Shinsei Bank Group provides a wide variety of financial products and services to domestic institutional and individual customers
through “Institutional Business,” “Global Markets Business” and “Individual Business.”
Equity stake held by Shinsei Bank and consolidated subsidiaries (%)
Name Location Main businessCapital
(in millions)Established Acquired
Equity stake held by Shinsei Bank
Equity stake held by consolidated subsid-iaries of Shinsei Bank
Major Domestic Subsidiaries
Showa Leasing Co., Ltd. Tokyo, Japan Leasing1 ¥29,360 1969. 4 2005. 3 100.0% 100.0% —
Shinsei Trust & Banking Co., Ltd. Tokyo, Japan Trust banking1 5,000 1996.11 — 100.0% 100.0% —
Shinsei Securities Co., Ltd. Tokyo, Japan Securities2 8,750 1997. 8 — 100.0% 100.0% —
Shinsei Investment Management Co., Ltd. Tokyo, Japan Investment trust and discretionary investment advising2 495 2001.12 — 100.0% 100.0% —
Shinsei Investment & Finance Limited Tokyo, Japan Financial instruments business1 100 2006. 4 2012.12 100.0% 100.0% —
Shinsei Corporate Investment Limited Tokyo, Japan Investment1 50 2012.11 — 100.0% 100.0% —
APLUS FINANCIAL Co., Ltd. Osaka, Japan Holding company3 15,000 1956.10 2004. 9 95.0% 2.1% 92.8%
APLUS Co., Ltd. Osaka, Japan Installment credit3 15,000 2009. 4 — 100.0% — 100.0%
APLUS Personal Loan Co., Ltd. Osaka, Japan Finance3 100 2009. 4 — 100.0% — 100.0%
Zen-Nichi Shinpan Co., Ltd. Okayama, Japan Installment credit3 1,000 1957. 4 2006. 3 100.0% — 100.0%
Shinsei Financial Co., Ltd. Tokyo, Japan Finance3 100 1991. 6 2008. 9 100.0% 100.0% —
Shinsei Personal Loan Co., Ltd. Tokyo, Japan Financing for individuals and small businesses3 100 1954.12 2007.12 100.0% — 100.0%
Shinsei Business Services Co., Ltd. Tokyo, Japan Outsourcing services4 54 1985. 2 — 100.0% 100.0% —
Alpha Servicer Co., Ltd. Tokyo, Japan Servicing business3 500 2005.12 2017. 7 100.0% 100.0% —
Major Overseas Subsidiaries
Shinsei International Limited London, UK Securities2 £3 2004. 9 — 100.0% 100.0% —
OJBC Co. Ltd. Tortola, British Virgin Islands Financial holding company3 $56 2013. 6 — 50.0% 50.0% —
Nippon Wealth Limited Kowloon, Hong Kong Investment trust and discretionary investment advising3 HK$440 2013. 8 — 100.0% — 100.0%
Major Affiliates Accounted for Using the Equity Method
Jih Sun Financial Holding Co., Ltd. Taipei, Taiwan Financial holding company1 NT$36,190 2002. 2 2006. 7 36.2% — 36.2%
Nissen Credit Service Co., Ltd. Kyoto, Japan Credit card3 ¥4,050 1997.12 2016.12 50.0% 50.0% —
MB Shinsei Finance Limited Liability Company Hanoi, Vietnam Finance3 VND800,000 2016. 3 2017.10 49.0% 49.0% —
1 Institutional Business 2 Global Markets Business 3 Individual Business 4 Corporate/Other
Institutional Business
Global Markets Business
Individual Business
Shinsei Bank, Limited
Head Office and domestic branch officesMajor subsidiaries: ● Showa Leasing Co., Ltd. ● Shinsei Trust & Banking Co., Ltd. ● Shinsei Investment & Finance Ltd.
Head Office and domestic branch officesMajor subsidiaries: ● Shinsei Securities Co., Ltd. ● Shinsei Investment Management Co., Ltd.
Head Office and domestic branch officesMajor subsidiaries: ● Shinsei Financial Co., Ltd. ● Shinsei Personal Loan Co., Ltd. ● APLUS FINANCIAL Co., Ltd.
SHINSEI BANK, LIMITED Integrated Report 2019 Data Appendix2

Major Subsidiaries and Affiliates (As of March 31, 2019)
Employees
Equity stake held by Shinsei Bank and consolidated subsidiaries (%)
Name Location Main businessCapital
(in millions)Established Acquired
Equity stake held by Shinsei Bank
Equity stake held by consolidated subsid-iaries of Shinsei Bank
Major Domestic Subsidiaries
Showa Leasing Co., Ltd. Tokyo, Japan Leasing1 ¥29,360 1969. 4 2005. 3 100.0% 100.0% —
Shinsei Trust & Banking Co., Ltd. Tokyo, Japan Trust banking1 5,000 1996.11 — 100.0% 100.0% —
Shinsei Securities Co., Ltd. Tokyo, Japan Securities2 8,750 1997. 8 — 100.0% 100.0% —
Shinsei Investment Management Co., Ltd. Tokyo, Japan Investment trust and discretionary investment advising2 495 2001.12 — 100.0% 100.0% —
Shinsei Investment & Finance Limited Tokyo, Japan Financial instruments business1 100 2006. 4 2012.12 100.0% 100.0% —
Shinsei Corporate Investment Limited Tokyo, Japan Investment1 50 2012.11 — 100.0% 100.0% —
APLUS FINANCIAL Co., Ltd. Osaka, Japan Holding company3 15,000 1956.10 2004. 9 95.0% 2.1% 92.8%
APLUS Co., Ltd. Osaka, Japan Installment credit3 15,000 2009. 4 — 100.0% — 100.0%
APLUS Personal Loan Co., Ltd. Osaka, Japan Finance3 100 2009. 4 — 100.0% — 100.0%
Zen-Nichi Shinpan Co., Ltd. Okayama, Japan Installment credit3 1,000 1957. 4 2006. 3 100.0% — 100.0%
Shinsei Financial Co., Ltd. Tokyo, Japan Finance3 100 1991. 6 2008. 9 100.0% 100.0% —
Shinsei Personal Loan Co., Ltd. Tokyo, Japan Financing for individuals and small businesses3 100 1954.12 2007.12 100.0% — 100.0%
Shinsei Business Services Co., Ltd. Tokyo, Japan Outsourcing services4 54 1985. 2 — 100.0% 100.0% —
Alpha Servicer Co., Ltd. Tokyo, Japan Servicing business3 500 2005.12 2017. 7 100.0% 100.0% —
Major Overseas Subsidiaries
Shinsei International Limited London, UK Securities2 £3 2004. 9 — 100.0% 100.0% —
OJBC Co. Ltd. Tortola, British Virgin Islands Financial holding company3 $56 2013. 6 — 50.0% 50.0% —
Nippon Wealth Limited Kowloon, Hong Kong Investment trust and discretionary investment advising3 HK$440 2013. 8 — 100.0% — 100.0%
Major Affiliates Accounted for Using the Equity Method
Jih Sun Financial Holding Co., Ltd. Taipei, Taiwan Financial holding company1 NT$36,190 2002. 2 2006. 7 36.2% — 36.2%
Nissen Credit Service Co., Ltd. Kyoto, Japan Credit card3 ¥4,050 1997.12 2016.12 50.0% 50.0% —
MB Shinsei Finance Limited Liability Company Hanoi, Vietnam Finance3 VND800,000 2016. 3 2017.10 49.0% 49.0% —
1 Institutional Business 2 Global Markets Business 3 Individual Business 4 Corporate/Other
March 31, 2017 March 31, 2018 March 31, 2019
Consolidated Number of Employees 5,360 5,307 5,179
Nonconsolidated Number of Employees 2,207 2,188 2,150
Male 1,272 1,265 1,218
Female 935 923 932
Average age 40 years 11 months 41 years 3 months 41 years 7 months
Average years of service 11 years 11 months 12 years 5 months 12 years 11 months
Average monthly salary ¥482 thousand ¥479 thousand ¥477 thousand
Number of Business-Limited Employees 0 0 146
Number of Part-time Employees 203 267 215
Number of Temporary Employees 143 113 6
(Note) Number of employees does not include business-limited employees, part-time employees and temporary employees. However, the number of employees after accounting for personnel seconded in or out of the Bank is 2,248 as of March 31, 2019.
SHINSEI BANK, LIMITED Integrated Report 2019 Data Appendix 3

Organization of Shinsei Bank, Limited (As of July 1, 2019)
Group HeadquartersGroup Internal Audit Division
Group Information Technology Division
Group General Services Division
Office of Audit& Supervisory
Board Members
Corporate Banking Business Division ICorporate Banking Business Division IICorporate Banking Business Division III (Overseas Finance Department)Osaka Corporate Banking Business Division*8
Financial Institutions & Public Sector Business DivisionSapporo, Sendai, Nagoya,Osaka, Hiroshima and FukuokaSyndicated Finance DivisionCorporate Advisory DivisionTrading DivisionMarkets DivisionMarket Products DivisionInvestment Business DivisionWealth Management Division*10
Real Estate Finance DivisionHealthcare Finance DivisionReal Estate Business DivisionSpecialty Finance DivisionProject Finance Division (Structured Finance Department)Business Succession Finance Division
Institutional Business Operation Division
Showa Leasing Co., Ltd.Shinsei Trust and Banking Co., Ltd.Other Group Companies (Institutional Business)
(Corporate Customer Service Department)(Markets Business Planning Department)(Corporate Administration Department)(New Business Promotion & Support Department)
Management Affairs Division
Group Integrated Risk Management DivisionGroup Portfolio Risk Management DivisionGroup Individual Banking Risk Management Division
Group Legal and Compliance Division (Legal Department) (Financial Crime Information Department)
*1
*1
Group Corporate Planning Division (Financial Research Department)Group Financial and RegulatoryAccounting Division (IFRS Department)Group Treasury DivisionGroup Investor Relations &Corporate Communications Division
Group Human Resources Division (Diversity Promotion Department)
Group Organizational Strategy Division (Group Strategic Sourcing Department)
Group Business Strategy Division (Eco System Strategy Department) (Innovative Finance Institute)*11
(Group Data Strategy Department)*12
Office of Financing Facilitation Management
Operations Management Division (FATCA Management Department)
(IT System)Information Systems Risk Management Division*9
Information Systems Development DivisionInformation Systems Operation Division
(Credit Management)Institutional Credit Management DivisionStructured Risk Management DivisionReal Estate Risk Management Division (Real Estate Research Department)
<Institutional Business>Group Institutional Business Planning Division
<Individual Business>Group Individual Business Planning Division
(Retail IT Development Department)
Retail Sales & Support Division 5 Financial Centers*2
(Estate Consulting Promotion Department)Retail Sales Division I*3
Retail Sales Division II*4
Retail Sales Division III*5
Kansai Retail Sales Division*6
Channel Management Division*7
(Fukuoka Call Center) (Direct Banking Department)Retail Products Division (Foreign Exchange Business Promotion Department)Retail Operation DivisionHousing Loan DivisionConsumer Finance Division (Customer Communication Center I) (Customer Communication Center II) (Smart Card Loan Center) (Osaka Administration Management Center) (Customer Relationship Department)Customer Service Division (AML Correspondence Department) (Customer Service Department)
APLUS FINANCIAL Co., Ltd.Shinsei Financial Co., Ltd.Other Group Companies (Individual Business)
Board ofDirectors
Audit &Supervisory
Board
ExecutiveCommittee
CEO
GroupExecutive
Committee
GroupImportantCommittee
Audit &Supervisory
BoardMembers
*1 Management Affairs Division shall act as the secretariat of the Executive Committee and the Group Executive Committee.
*2 Sapporo, Sendai, Nagoya (incl. Sakae Annex),Hiroshima, Fukuoka *3 In charge of each SFC in Omiya, Ikebukuro, Kichijoji, Shinjuku, Hachioji *4 In charge of each SFC in Head Office, Kashiwa, Tsudanuma, Tokyo,
Ginza, Ueno *5 In charge of each SFC in Shibuya, Futakotamagawa, Machida,
Yokohama, Fujisawa *6 In charge of each SFC in Kyoto, Umeda (incl. Senri-Chuo Annex and
Hankyu-Umeda Annex), Namba, Kobe *7 Channel Management Division shall report to Executive Officer in
charge of IT System . *8 Osaka Corporate Banking Business Division shall report to GM of
Osaka Branch. *9 Information Systems Risk Management Division shall report to the
management.*10 This division shall report to both corporate and individual business divi-
sions / executive officers.*11 To be positioned as a Department.*12 Group Data Strategy Department shall be under both of Group
Business Strategy Division and Group Organizational Strategy Division.
SHINSEI BANK, LIMITED Integrated Report 2019 Data Appendix4

Hideyuki KudoRepresentative Director, President
Hideyuki KudoRepresentative DirectorPresident and Chief Executive Officer
Ernest M. Higa*1
DirectorChairman, President & ChiefExecutive Officer,Higa Industries Co., Ltd.
Yoshiaki KozanoDirector
Yoshiaki KozanoDirectorChief Officer, Group Business Strategy,GM, Group Business Strategy Division
J. Christopher Flowers*1
DirectorManaging Director and ChiefExecutive Officer, J.C. Flowers & Co. LLC
Shigeru KaniFormer Director, Administration Department, The Bank of JapanFormer Professor, Yokohama College of Commerce
David MorganChairman, Europe and Asia-Pacific, J.C. Flowers & Co. UK LLP
Akira HirasawaChief Officer, Group Organizational Strategy, Group Human ResourcesSenior Managing Executive Officer, Executive Officer in charge of Operations Management
Michiyuki OkanoChief Officer, Group ITSenior Officer, Group Business Strategy,Senior Officer, Group Organizational Strategy
Shinichirou SetoSenior Managing Executive Officer, Head of Institutional Business Unit,President and CEO of Showa Leasing Co., Ltd.
Rie Murayama*1
Former Managing Director, Goldman Sachs Japan Co., Ltd.
Jun Makihara*1
DirectorDirector, Monex Group, Inc.Director, Philip Morris International Inc.
Shoichi HiranoChief Officer, Group Corporate Planning and Finance, Managing Executive Officer, Executive Officer in charge of Financing Facilitation, General Manager, Office of Financing Facilitation Management
(Managing Executive Officer (MEO) and equivalent to MEO)
Masanori MatsubaraManaging Executive Officer,Head of IT System
Hirohisa KazamiSenior Officer, Group Legal and Compliance
Kumi KikugawaExecutive Officer, Executive Officer in charge of Retail Sales, General Manager, Retail Sales Division II
Noboru TakemuraSenior Officer, Group Corporate Planning and Finance
Toichiro ShiomiChief Officer, Group Risk, GM, Group Portfolio Risk Management Division
Ryuichi Tomimura*1
DirectorPresident, Representative Director,SIGMAXYZ Inc.
Kyohei MatsumotoChief Officer, Group Legal and Compliance
Soichiro KomoriSenior Officer, Group Business Strategy
Masayoshi TomitaExecutive Officer, Executive Officer in charge of Individual Business
Etsuko IchibaExecutive Officer, Executive Officer in charge of Retail Operation, General Manager, Retail Operation Division
Hiroyuki KagitaExecutive Officer, Executive Officer in charge of Customer Service, General Manager, Group Individual Business Planning Division
Hiroshi OoyamaExecutive Officer, General Manager, Group Institutional Business Planning Division
Shinya NagataAudit & Supervisory Board Member
Ikuko Akamatsu*2
Audit & Supervisory Board MemberCertified Public Accountant, Certified Fraud Examiner
Shiho Konno*2
Audit & Supervisory Board MemberLawyer
Tetsuro ShimizuManaging Executive Officer, Head of Individual Business Unit, Senior Officer, Group Business Strategy,Representative Director and President and CEO, APLUS FINANCIAL Co., Ltd.
Kouichi SawajiChief Officer, Group General Service
Hiroyuki TorigoeSenior Officer, Group Business StrategyManaging Executive Officer, Head of Consumer Finance, President and CEO of Shinsei Financial Co., Ltd.
Shigeto YanaseManaging Executive Officer, Executive Officer in charge of Institutional Business,General Manager, Osaka Branch
Takahiro Kubo*1
Executive Officer, Executive Officer in charge of Group Structured Solution
Kenji UesakaExecutive Officer, Executive Officer in charge of Group Structured Solution, General Manager, Specialty Finance Division
Takahiro FujiiExecutive Officer, Executive Officer in charge of Institutional Business
(Executive Officer (EO) and equivalent to EO)
Hirofumi KusakabeExecutive Officer, Head of Group Structured Solution
Junya NakamuraSenior Officer, Group Organizational Strategy, GM, Group Organizational Strategy Division
Nobuyasu NaraExecutive Officer, General Manager,Institutional Credit Management Division
Takahiro YoshidaSenior Officer, Group Corporate Planning and Finance, GM, Group Treasury Division
Takako Hayashi Senior Officer, Group Human Resources,GM, Group Human Resources Division
Kunimitsu HayashiExecutive Officer, Executive Officer in charge of Institutional Business
Hiroki OtakeExecutive Officer, Head of Retail Sales, General Manager, Retail Sales and Support Division
Tamane NishiSenior Officer, Group Human Resources, GM, Group Human Resources Division, Department Head, Diversity Promotion Department
Tomoko OgawaraExecutive Officer, Executive Officer in charge of Retail Sales, General Manager, Kansai Retail Sales DivisionTsukasa Makizumi
Managing Executive Officer, Head of Credit Risk Management
Takahisa KomodaManaging Executive Officer, Head of Institutional Business
Taichi KawaiExecutive Officer, Executive Officer in charge of Institutional Business
Board of Directors (7)
Directors and Executive Officers (As of July 1, 2019)
Audit & Supervisory Board Members (3)
Group Headquarters Officers and Shinsei Bank Executive Officers (37)
Senior Advisors
Yuji Tsushima
Advisor
Nozomi Moue
Executive Advisors
Yukio Nakamura
Special Advisor
*1 Outside Directors *2 Outside Audit & Supervisory Board Members
Note: Chief Officer and Senior Officer are positions of Group Headquarters.
Note: Officers and Executive Officers are listed in alphabetical order.
Note: Messrs. Yoshiaki Kozano and Michiyuki Okano are equivalent to Senior Managing Executive Officer of Shinsei Bank, Mr. Kouichi Sawaji is equivalent to Managing Executive Officer of Shinsei Bank, and Ms. Takako Hayashi, Mr. Junya Nakamura, Ms. Tamane Nishi, Mr. Touichiro Shiomi and Mr. Takahiro Yoshida are equivalent to Executive Officers of Shinsei Bank.
*1: Mr. Takahiro Kubo is also appointed as Representative Director and President, Shinsei Trust & Banking Co., Ltd.
Sanjeev GuptaSenior Managing Executive Officer,Advisor to the President and ChiefExecutive Officer
(Senior Managing Executive Officer (SMEO) and equivalent to SMEO)
Yasufumi Shimada
SHINSEI BANK, LIMITED Integrated Report 2019 Data Appendix 5

Network (As of June 30, 2019)
HokkaidoSapporo Branch
TohokuSendai Branch
Kanto (Excluding Tokyo)Omiya BranchKashiwa BranchTsudanuma BranchYokohama BranchFujisawa Branch
TokyoHead OfficeTokyo BranchGinza BranchIkebukuro BranchUeno BranchKichijoji BranchShinjuku BranchShibuya BranchFutakotamagawa BranchHachioji BranchMachida Branch
TokaiNagoya BranchSakae Financial Center
KinkiKyoto BranchOsaka BranchUmeda BranchUmeda Branch—Hankyu Umeda AnnexUmeda Branch—Senri Chuo AnnexNamba BranchKobe Branch
ChugokuHiroshima Branch
KyushuFukuoka Branch
29outlets (26 branches including head office,3annexes)
Domestic Outlets
Lake Unstaffed Branches: Lake unstaffed branches 725 locations
Partner Train Station, Convenience Store and Supermarket ATMs: Seven Bank, Ltd. ATMs 23,444 locations
E-net ATMs 12,357 locations
Lawson ATM Networks ATMs 13,510 locations
AEON Bank ATMs 5,191 locations
VIEW ALTTE ATMs 315 locations
Patsat ATMs 106 locations
SHINSEI BANK, LIMITED Integrated Report 2019 Data Appendix6

Risk Management
Shinsei Financial Co., Ltd. Other Group Companies
Group Executive Committee
Chief Executive Officer
Board of DirectorsAudit & Supervisory Board Members/
Audit & Supervisory Board
Group Internal Audit Division
AuditAudit Audit Audit
AuditReport Report
Report
Shinsei Bank
(Analysis of individual transactions at each company)
Executive Committee
APLUS FINANCIAL Co., Ltd. Showa Leasing Co., Ltd.
MarketRisk
Credit RiskGroup Risk Policy Committee
Group ALM Committee
Group New Business/Product Committee
Group Compliance Committee
Group IT Committee, etc.
ALM OperationalRisk
Group Headquarters (in Shinsei Bank)
Group IndividualBanking RiskManagement
Division
Group PortfolioRisk
ManagementDivision
Group Integrated RiskManagement Division
Group Legal andCompliance DivisionGroup Information
Technology Division
Divisions in Charge of Risk Management (3 Divisions)Designing Systems for the Various Risks, Monitoring Operation of Business,
and Measurement and Analysis of Risks, etc.
Important Group Committees
Shinsei Bank Committees
Transaction Committee
Compliance Committee
IT Committee, etc.
Divisions in Charge of Credit Analysis (3 Divisions)Credit Analysis and Approval of Loan Applications,
Monitoring
Institutional Credit Management Division
Structured Risk Management Division
Real Estate Risk Management Division
L Risk Management System Chart (as of 19th June, 2019)
Overview of the Group’s Risk Management Systems
To ensure its risk management is more effective, the
Bank has established various specific committees such as
the “Group Risk Policy Committee,” “Transaction
Committee,” “Group Asset and Liability Management
(ALM) Committee” and “Market Business Management
Committee.” All these committees are able to function
effectively as bodies responsible for making important
risk judgments by constantly improving their composition
and functions in response to changes in the operating
environment. The Group Risk Policy Committee, whose
members include senior management such as the CEO,
Chief Officer of the Group head of corporate planning
and finance, and the Group head of risk management,
performs the crucial role of setting and coordinating the
appropriate and optimal level of risk taking by concur-
rently reviewing the Bank’s risk management policies and
business strategy. Shinsei Bank has established the “Risk
Management Policy” as its fundamental policy on risk
management and basic recognition of risk categories
based upon its understanding of the totality of risks
faced by the entire Shinsei Bank Group and the need to
actively manage them.
SHINSEI BANK, LIMITED Integrated Report 2019 Data Appendix 7

Risk Management
Basic Concept regarding Risk Management
Financial institutions are exposed to various risks, includ-
ing credit risk, market risk, interest rate risk, liquidity risk,
and operational risk. To maintain highly profitable and
stable operations, a financial institution must make the
control of these risks a management priority. For that
purpose, the Bank must be able to ascertain that risks
are taken in line with Bank-wide policies as well as indi-
vidual operational policies, remain within appropriate
limits. To strengthen the required monitoring functions
and further develop its risk management framework, the
Bank established two risk management groups: 1) credit
analysis divisions responsible for credit analysis, loan
application approvals and monitoring and 2) divisions
responsible for overall risk management, measuring and
analyzing credit, market, and other risks, and integrating
functions for examining and verifying fair value.
L Definitions of Risk Categories
Risk Categories Definition
Credit Risk
Credit risk is the risk of incurring losses due to dete-rioration in the financial condition of a borrower resulting in an erosion or total loss of asset value (including off-balance assets).
Market Risk
Market risk is the risk of incurring losses due to changes in the value of assets or liabilities through fluctuations of various risk factors such as interest rates, foreign exchange rates, and stock prices, etc.
Liquidity Risk
Liquidity risk (fund-raising risk) is the risk of incur-ring losses due to difficulties in securing necessary funds or the need to raise funds at an interest rate that is substantially higher than normal stemming from mismatches in the maturities of assets and lia-bilities or an unexpected outflow of funds.
Operational Risk
Operational risk refers to the risk of incurring losses resulting from inadequate or failed internal process-es, personnel, and systems, or from external events.
Credit Risk
Institutional Business Credit Risk ManagementUnder the “Credit Risk Policy,” the Bank has established
specific policies for customer attributes, products, mar-
kets, industries, and forms of credit that should acquire
or contain risks, and has clearly set out the “Credit
Procedures” and various procedures as well as the basic
policies for credit business and specific guidelines for
credit risk management. Credit risk management pro-
cesses for institutional businesses are broadly grouped
into credit risk management for individual transactions
and portfolio-based credit risk management.
Credit Risk Management for Individual Transactions(1) Organization & StructureRegarding credit assessments for institutional business,
an effective system of checks and balances on sales pro-
motion divisions is established by veto rights of risk man-
agement divisions.
(2) Obligor Rating SystemsUsing credit estimation models including a model bench-
marking the credit ratings of external credit rating agen-
cies, we calculate model ratings and apply adjustments
to these based on qualitative factors, and use this meth-
od to determine credit rankings.
Portfolio-Based Credit Risk Management(1) Monitoring Analysis SystemAt Shinsei Bank, we perform analysis that derives from
unique entry points based on the risk profiles of each
product and monitor risk diversification status by seg-
ments such as industry, ratings, products, and regions, to
report to the appropriate management layer.
(2) Quantifying Credit RiskBy factoring measured expected losses and unexpected
losses into loan spreads, we can harness this data to
ensure an appropriate risk-return in each transaction.
(3) Credit Concentration GuidelineOur credit concentration management framework con-
sists of industry concentration guidelines and obligor
group concentration guidelines, and in the event that
credit concentration exceeds the guideline, we conduct
reviews and adopt countermeasures.
Individual Business Credit Risk ManagementRisk management for our consumer finance businesses
encompasses all operations from loan application assess-
ment (entry-point credit) to managing risks after a con-
tract is signed (credit monitoring) and, if needed, loan
collection operations. The Group Individual Banking Risk
Management Division is in charge of risk management
for products for individual customers, including our con-
sumer finance businesses. The division holds a monthly
risk performance review meeting with other risk-related
divisions include Chief Officer of the Group head of risk
management at the Bank as well as risk officers from
subsidiaries in order to share information and promote
a shared awareness of risks. The division also provides
operational support and advice to relevant units of the
Bank and its subsidiaries relating to overall risk manage-
ment concerning credit administration policies and credit
strategies.
SHINSEI BANK, LIMITED Integrated Report 2019 Data Appendix8
Risk-related divisions at Group subsidiaries carry out
appropriate risk control through a process that incorpo-
rates scoring models into credit administration processes,
while using credit- related databases of customer attri-
butes stemming from the nature of their businesses,
credit information, and transaction history. The scoring
models i.e., initial credit score, score at credit monitoring
stages, collection strategy scores, etc. were developed
using statistical methodologies, and to maintain the
accuracy of the scoring models in line with the level
achieved when it was first developed, model perfor-
mance is constantly monitored and the model is subject
to fine tuning as needed.
The Group Individual Banking Risk Management
Division is working to elevate its scoring model develop-
ment and enhance the entire Group’s credit provision
capabilities in ways that help maximize earnings of the
entire Group in the medium and long term.
Credit costs are crucial to the management of profit-
ability in the consumer finance business. We therefore
conduct monitoring while tracking multiple leading indi-
cators and verification metrics at the portfolio level to
enable us to quickly grasp any deterioration in the port-
folio’s overall asset quality and take timely action to
improve its profitability.
Credit Risks on Market-Related TransactionsCounterparty credit risk attendant with market transac-
tions such as derivative transactions are managed based
on estimations of the fair value and future value fluctua-
tions of relevant transactions.
Self-AssessmentAsset self-assessments are a part of credit risk manage-
ment. Financial institutions examine and analyze their
asset holdings so they can grasp the actual state of their
assets as steps in preparing for appropriate asset write-
downs and write-offs as well as reserve provisioning.
At Shinsei Bank, sales promotion divisions and credit
analysis divisions conduct asset appraisals, and risk man-
agement divisions that are independent of sales promo-
tion and credit analysis verify appraisal results.
Market Risk
Market Risk Management PolicyIn accordance with the “Trading Business Risk
Management Policy,” market risks in the trading business
are managed through a series of processes with the
Group Executive Committee determining overall market
risk and loss limits. The Group Integrated Risk
Management Division monitors on a daily basis the sta-
tus of compliance with these limits, and the Market
Business Management Committee reviews every month
trends at individual businesses, the status of profits and
losses, market risk conditions, and overall business risks
including the risks of products handled.
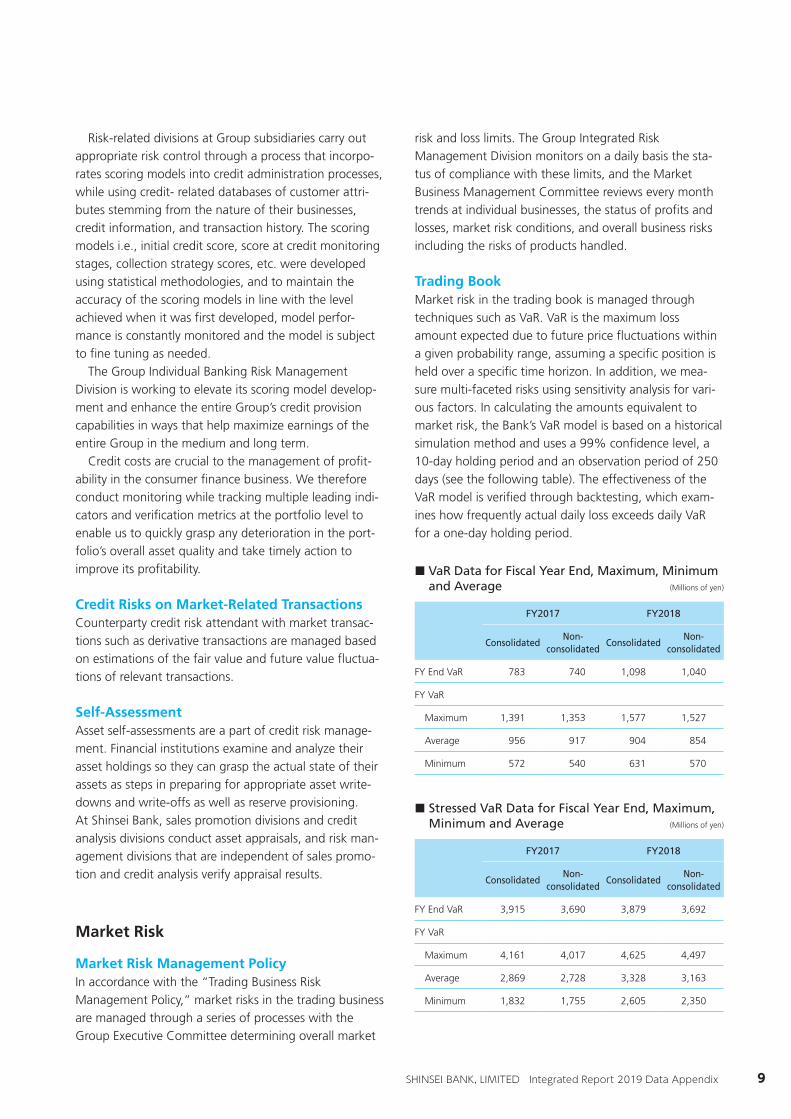
Trading BookMarket risk in the trading book is managed through
techniques such as VaR. VaR is the maximum loss
amount expected due to future price fluctuations within
a given probability range, assuming a specific position is
held over a specific time horizon. In addition, we mea-
sure multi-faceted risks using sensitivity analysis for vari-
ous factors. In calculating the amounts equivalent to
market risk, the Bank’s VaR model is based on a historical
simulation method and uses a 99% confidence level, a
10-day holding period and an observation period of 250
days (see the following table). The effectiveness of the
VaR model is verified through backtesting, which exam-
ines how frequently actual daily loss exceeds daily VaR
for a one-day holding period.
L VaR Data for Fiscal Year End, Maximum, Minimum and Average (Millions of yen)
FY2017 FY2018
ConsolidatedNon-
consolidatedConsolidated
Non-consolidated
FY End VaR 783 740 1,098 1,040
FY VaR
Maximum 1,391 1,353 1,577 1,527
Average 956 917 904 854
Minimum 572 540 631 570
L Stressed VaR Data for Fiscal Year End, Maximum, Minimum and Average (Millions of yen)
FY2017 FY2018
ConsolidatedNon-
consolidatedConsolidated
Non-consolidated
FY End VaR 3,915 3,690 3,879 3,692
FY VaR
Maximum 4,161 4,017 4,625 4,497
Average 2,869 2,728 3,328 3,163
Minimum 1,832 1,755 2,605 2,350
SHINSEI BANK, LIMITED Integrated Report 2019 Data Appendix 9

Risk Management
Interest Rate Risk in Banking BookInterest rate risk is the risk of eroding profits or incurring
losses due to market interest rate fluctuations amid mis-
matches in the interest rate or maturities of assets and
liabilities. Conventionally to measure interest rate risk
exposure, we calculated the decrease in the economic
value of the banking book from an unexpected 1% inter-
est rate increase [a 1% parallel upward shift in interest
rates for loan originations (bank assets) and core deposits
(bank liabilities)]. This calculated exposure was used for
internal controls. From 2019, we calculate the change of
economic value of the banking book( EVE) by means the
three scenarios of IRRBB: parallel shock up, parallel shock
down and steepener shock, and use maximum EVE
across three scenarios above for internal controls. EVE is
significantly impacted by the recognition of asset and lia-
bility maturities and loan prepayments, we are endeavor-
ing to appropriately capture interest rate risk controls.
Risk Relating to Marketable Credit InstrumentsInvestments in structured bonds, funds, securitized
instruments, etc., are generally held until maturity,
although some instruments can be traded on the market.
Such instruments have a complex risk profile that
includes market risk and liquidity risk in addition to credit
risk related to their underlying assets and counterparties.
The Bank has established a system to ensure appropriate
management of these risks, regularly reviews its invest-
ment policies based on the investment environment. The
Transaction Committee, the Market Business
Management Committee and the Group Risk Policy
Committee strive to promote appropriate management
of risks through regular reviews of risk exposure.
Liquidity Risk
Liquidity Risk Management PolicyAs for funding liquidity risk, pursuant to the “Liquidity
Risk Management Policy,” the Group Treasury Division, a
fund-raising management unit, and the Group Integrated
Risk Management Division, a funding liquidity risk man-
agement unit, have been put in place, and the Group
ALM Committee receives reports on the following desig-
nated liquidity risk management indicators: “funding gap
limit,” “minimum liquidity reserves,” “liquidity stress
tests,” and “liquidity coverage ratio.” The levels of fund-
ing liquidity risk consist of “Normal,” “Need for
Concern,” “Crisis,” and “Risk Administration Mode,”
with the Group ALM Committee determining the current
mode. The response framework for each specific mode is
set forth in the “Funding Liquidity Contingency Plan,”
and regular training is provided.
Operational Risk
Operational Risk Management FrameworksTo ensure comprehensive management of operational
risks, the Bank has established an operational risk man-
agement policy that defines risks and sets forth its basic
policy and organizational structures for risk management
L VaR and Daily Profit and Loss (Backtesting) (FY2018, Consolidated basis)(Millions of yen)
-400
-200
0
-600
200
321121110987654
20192018
Backtesting on the VaR Model
Applied to the Trading Account
Backtesting involves comparing fixed
position virtual losses to estimated VaR
to confirm the reliability of the VaR
method.
Assumptions of
Shinsei’s VaR Model
Method: Historical simulation method
Confidence level: 99%
Holding period: 10 days
Observation days: 250 days
Coverage: Trading account
L Daily P/L VaR (holding period: one day)
SHINSEI BANK, LIMITED Integrated Report 2019 Data Appendix10

as well as procedures for identifying, evaluating, moni-
toring, reporting and controlling/mitigating risk.
The Group Integrated Risk Management Division, a
unit responsible for Group-wide operational risk manage-
ment, evaluates, analyzes and reports on operational risk
to management. Moreover, for each domain of opera-
tional risk such as administrative risk and systems risk,
specialized risk management divisions that are indepen-
dent from business divisions implement measures to
manage operational risks according to the attributes of
each category.
Risk Management Frameworks for Administrative RisksAdministrative and systems risks refer to the risk of
“incurring losses from inaccuracies in clerical tasks due to
the carelessness of executives or employees, or errors or
misconduct in their performance of work duties.” As for
administrative risks, we recognize appropriate manage-
ment of them is extremely important to our ability to
offer services that our customers trust. We strive to
improve the level of our administrative work perfor-
mance by clarifying the content of procedures through
efforts to revise terminology, hold training seminars, pro-
vide guidance on administrative work and improve
administrative workflows. Specifically, our efforts to
improve administrative risk management include estab-
lishing a system of branch self-audits where autonomous
checks are performed at the work-task level and creating
a database documenting past errors that enables analysis
of the causal factors behind errors that will help prevent
reoccurrence in the future.
Risk Management Frameworks for Systems RisksSystems risks include the risk of companies or individuals
incurring losses from the disappearance of valuable data
of customers as a result of information systems shutting
off and software or hardware failures. Through consecu-
tive reviews of systems risks, we are identifying and eval-
uating the risks, and working to improve quality in
systems development and prevent systems failures and
ensure rapid recoveries when problems occur by improv-
ing our systems operating capabilities. In January 2019,
we renewed our core operational systems, and will man-
age risks for safe operations of new systems. We have
endeavored to improve the level of systems risk manage-
ment and information security for the entire Group,
including subsidiaries. Moreover, we have taken appro-
priate steps based on the latest trends in technology to
respond to cyber-security problems that have recently
come to be seen as a social threat; so, we are working to
ensure the safety of customer information and assets.
Due Diligence System for New Business and ProductGroup New Business / Product Committee (The
Committee) has been established in the group headquar-
ters to conduct due diligence for new businesses and
products of our group companies. In strategic invest-
ments with capital tie-up, due diligence has to be con-
ducted by the Committee before the Group Executive
Committee makes decisions.
Furthermore, a post launch monitoring system for new
business has been established and we shall take appro-
priate actions if a problem in the business exists.
Due diligence system for new business and product
Chairman and committee members
• (Co-chairman) Chief Officers of the Group Corporate Planning & Finance and the Group Risk
• Chief Officer and GM of internal management sections in the group headquar-ters (Corporate Planning, Financial and Regulatory Accounting, Legal and Compliance, IT, Risk, etc.)
• Heads of risk management divisions in the group companies and executive offi-cer in credit management of the Bank.
• Group Internal Audit Division, Audit & Supervisory Board Member of the Bank
Main verification items
• Conformance with the legal and compliances measures, action on anti-money laundering
• Adequacy of the financial and regulatory accounting process
• Implementation of technologies that conform to the Group’s security standards
• Management process of risks inherent in businesses and services. Credit risks, market risks, liquidity risks, etc.
Authority, etc.
• Verification of the framework of internal management in response to legal and compliances measures requires the approval from all of the Committee members.
• For strategic investments, important new business and products, the Committee reports the results of verification to the Group Executive Committee, in which decision-making authority resides.
Process after the business is launched
Monitoring system
• The effectiveness of the approved matters is confirmed by the Committee.
• Managements and business sections regularly evaluate performance of the business.
SHINSEI BANK, LIMITED Integrated Report 2019 Data Appendix 11
Risk Glossary
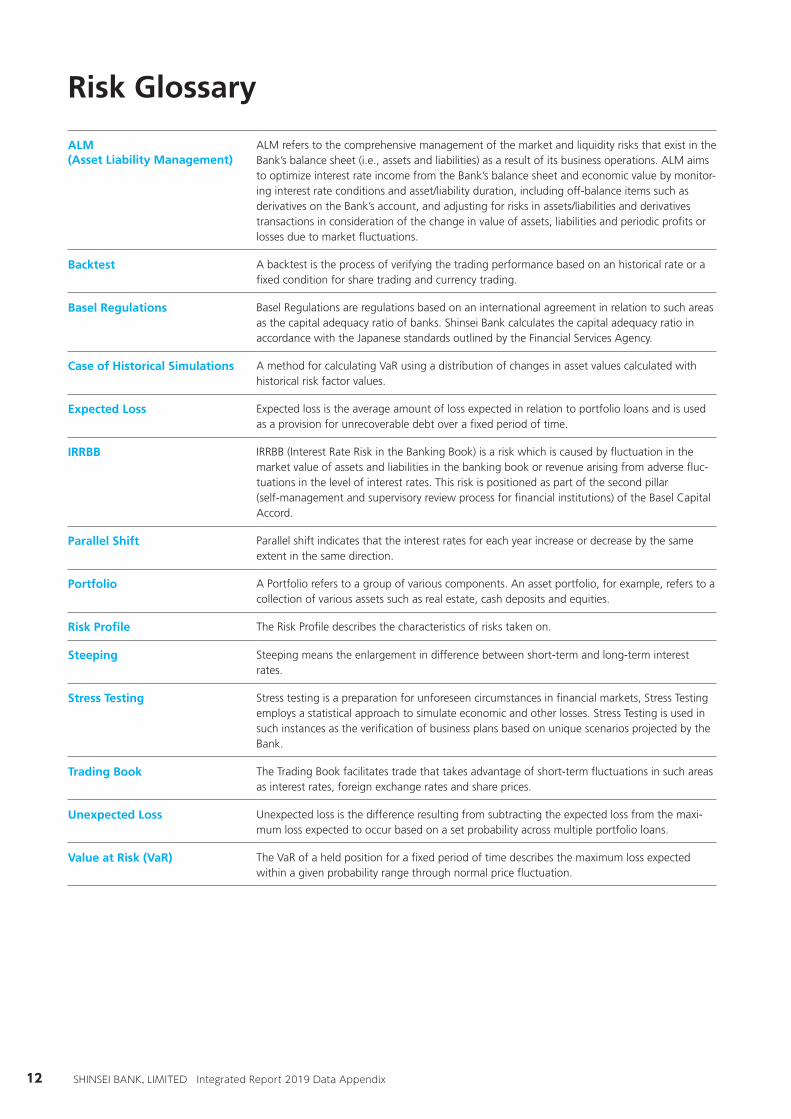
ALM (Asset Liability Management)
ALM refers to the comprehensive management of the market and liquidity risks that exist in the Bank’s balance sheet (i.e., assets and liabilities) as a result of its business operations. ALM aims to optimize interest rate income from the Bank’s balance sheet and economic value by monitor-ing interest rate conditions and asset/liability duration, including off-balance items such as derivatives on the Bank’s account, and adjusting for risks in assets/liabilities and derivatives transactions in consideration of the change in value of assets, liabilities and periodic profits or losses due to market fluctuations.
Backtest A backtest is the process of verifying the trading performance based on an historical rate or a fixed condition for share trading and currency trading.
Basel Regulations Basel Regulations are regulations based on an international agreement in relation to such areas as the capital adequacy ratio of banks. Shinsei Bank calculates the capital adequacy ratio in accordance with the Japanese standards outlined by the Financial Services Agency.
Case of Historical Simulations A method for calculating VaR using a distribution of changes in asset values calculated with historical risk factor values.
Expected Loss Expected loss is the average amount of loss expected in relation to portfolio loans and is used as a provision for unrecoverable debt over a fixed period of time.
IRRBB IRRBB (Interest Rate Risk in the Banking Book) is a risk which is caused by fluctuation in the market value of assets and liabilities in the banking book or revenue arising from adverse fluc-tuations in the level of interest rates. This risk is positioned as part of the second pillar (self-management and supervisory review process for financial institutions) of the Basel Capital Accord.
Parallel Shift Parallel shift indicates that the interest rates for each year increase or decrease by the same extent in the same direction.
Portfolio A Portfolio refers to a group of various components. An asset portfolio, for example, refers to a collection of various assets such as real estate, cash deposits and equities.
Risk Profile The Risk Profile describes the characteristics of risks taken on.
Steeping Steeping means the enlargement in difference between short-term and long-term interest rates.
Stress Testing Stress testing is a preparation for unforeseen circumstances in financial markets, Stress Testing employs a statistical approach to simulate economic and other losses. Stress Testing is used in such instances as the verification of business plans based on unique scenarios projected by the Bank.
Trading Book The Trading Book facilitates trade that takes advantage of short-term fluctuations in such areas as interest rates, foreign exchange rates and share prices.
Unexpected Loss Unexpected loss is the difference resulting from subtracting the expected loss from the maxi-mum loss expected to occur based on a set probability across multiple portfolio loans.
Value at Risk (VaR) The VaR of a held position for a fixed period of time describes the maximum loss expected within a given probability range through normal price fluctuation.
SHINSEI BANK, LIMITED Integrated Report 2019 Data Appendix12

SHINSEI BANK, LIMITED Integrated Report 2019 Data Appendix 13

SHINSEI BANK, LIMITED Integrated Report 2019
2019/07/17 13:02:21 / 19509941_株式会社新生銀行_総会その他(C)
MANAGEMENT’S DISCUSSION ANDANALYSIS OF FINANCIAL CONDITION ANDRESULTS OF OPERATIONSExcept for where the context indicates otherwise, words such as “we” or “our” indicates Shinsei Bank, Limited and its subsidiaries and affiliates accounted for by the equity-method, and “Shinsei” or the “Bank” refers to Shinsei Bank, Limited alone. The following discussion should be read in conjunction with our consolidated and nonconsolidated financial statements prepared in accordance with generally accepted accounting principles in Japan (“Japanese GAAP”) for banks, including the notes to those financial statements, included elsewhere in this annual report. Unless otherwise indicated, the financial information in the following discussion is based on our consolidated financial statements. The following discussion contains forward-looking statements regarding the intent, belief or current expectations of the Bank’s management with respect to our financial condition and future results of operations. In many cases, but not all, words such as “anticipate,” “believe,” “estimate,” “expect,” “intend,” “plan,” “probability,” “risk” and similar expressions are used in relation to the Bank or its management to identify forward-looking statements. These statements reflect our current views with respect to future events and are subject to risks, uncertainties and assumptions. Should one or more of these risks or uncertainties materialize, or should underlying assumptions prove incorrect, actual results may vary materially from those we currently anticipate or target. We do not intend to update these forward-looking statements. Regarding financial figures, amounts of less than 0.1 billion yen have been rounded down to the nearest 0.1 billion yen, respectively except for per share data, percentage data, and claims classified under the Financial Revitalization Law. As a result, the totals in yen do not necessarily equal the sum of the individual amounts. In addition, percentages have been rounded to the nearest tenth or hundredth. Fiscal year 2018 refers to the consolidated accounting period from April 1, 2018 to March 31, 2019 and other fiscal years are also stated in the same manner. Additionally, “this fiscal year” refers to fiscal year 2018.
OVERVIEW
Shinsei Bank, Limited is a diversified Japanese financial institution providing a range of financial products and services to both institutional and individual customers. Our business is organized around three business groups: the Institutional Business, the Global Markets Business and the Individual Business.• Regarding businesses serving institutional clients, in order
to provide financial products and services that meet the needs of our institutional customers through a strategic and systematic business promotion structure, the Institutional Business engages in the finance and advisory businesses primarily catering to corporations, public corporations and financial institutions, and the Global Markets Business engages in the various financial markets businesses. The Institutional Business consists of these businesses promoted through the Bank and Showa Leasing Co., Ltd. (Showa Leasing).
• The Individual Business consists of the retail banking and the consumer finance businesses. In the retail banking business, the Bank engages in the provision of services to meet the needs of its individual customers. In the consumer finance business, the Bank engages in the provision of unsecured personal loans through the Bank itself, Shinsei Financial Co., Ltd. (Shinsei Financial) and Shinsei Persnal Loan Co., Ltd. (Shinsei Personal Loan) and through APLUS FINANCIAL Co., Ltd. (APLUS FINANCIAL) the Bank engages in the installment sales credit, credit card and settlement businesses.
FINANCIAL SUMMARY FORTHE FISCAL YEAR ENDED MARCH 31, 2018
In the fiscal year ended March 31, 2019, the Shinsei Bank Group recorded consolidated profit attributable to owners of the parent of ¥52.3 billion, increased ¥0.9 billion compared to the ¥51.4 billion recorded in the previous fiscal year. Total revenue decreased due to the non-recurrence of gains on the sale of equities posted in the previous fiscal year, the decline in derivative transaction-related income, and other factors, despite strong performances in our major business areas including an increase in interest income in unsecured loans to individuals and the structured finance business, which are growth areas. Net credit costs decreased due to a reversal following the calculation of general reserves for loan losses corresponding to the expansion of the portfolio in project finance and other areas in the Institutional Business, and consolidated profit attributable to owners of the parent increased from the previous fiscal year. Total revenue was ¥229.6 billion, a ¥2.3 billion decrease compared to fiscal year 2017. Of this amount, net interest income totaled ¥133.8 billion, increased ¥5.0 billion compared to net interest income totaling ¥128.7 billion in fiscal year 2017. This increase was due to factors including the rise in loan interest in the growth areas of the unsecured loans business and the Structured Finance Business. Noninterest income totaled ¥95.9 billion, decreased ¥7.3 billion compared to noninterest income
14
OVERVIEW
Management’s Discussion and Analysis of Financial Condition and Results of Operations
SHINSEI BANK, LIMITED Integrated Report 2019
2019/07/17 13:02:21 / 19509941_株式会社新生銀行_総会その他(C)
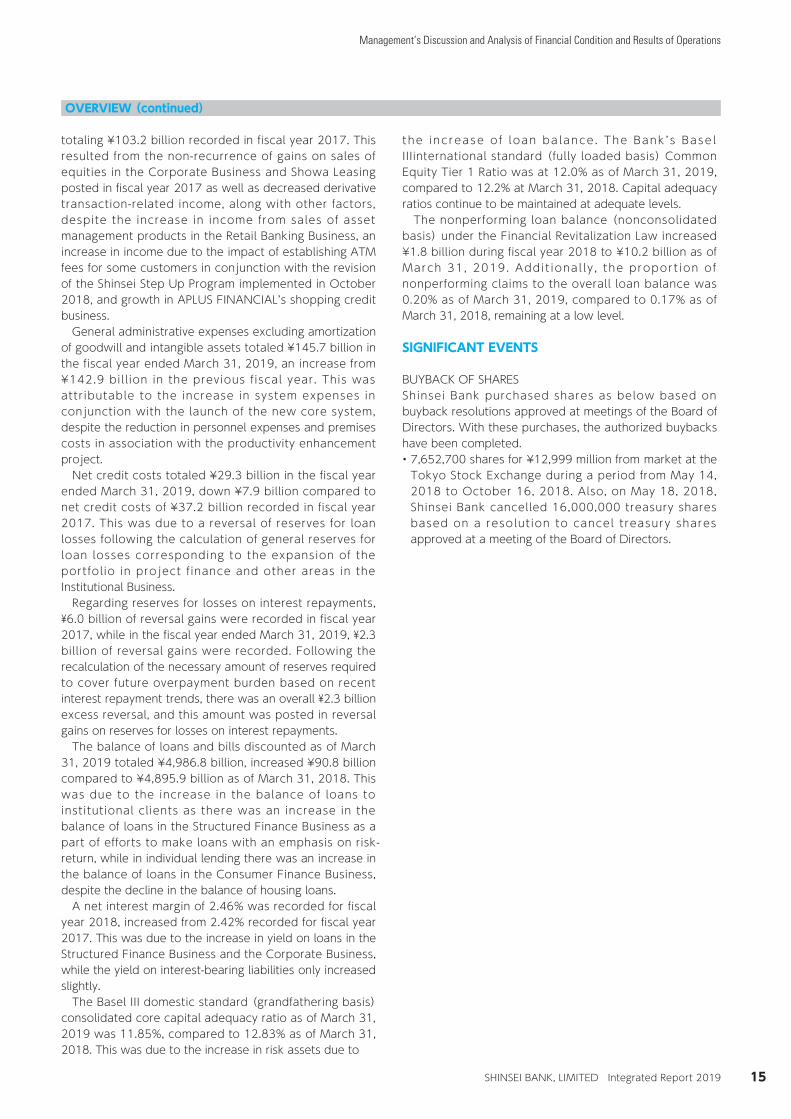
OVERVIEW (continued)
totaling ¥103.2 billion recorded in fiscal year 2017. This resulted from the non-recurrence of gains on sales of equities in the Corporate Business and Showa Leasing posted in fiscal year 2017 as well as decreased derivative transaction-related income, along with other factors, despite the increase in income from sales of asset management products in the Retail Banking Business, an increase in income due to the impact of establishing ATM fees for some customers in conjunction with the revision of the Shinsei Step Up Program implemented in October 2018, and growth in APLUS FINANCIAL’s shopping credit business. General administrative expenses excluding amortization of goodwill and intangible assets totaled ¥145.7 billion in the fiscal year ended March 31, 2019, an increase from ¥142.9 bill ion in the previous fiscal year. This was attributable to the increase in system expenses in conjunction with the launch of the new core system, despite the reduction in personnel expenses and premises costs in association with the productivity enhancement project. Net credit costs totaled ¥29.3 billion in the fiscal year ended March 31, 2019, down ¥7.9 billion compared to net credit costs of ¥37.2 billion recorded in fiscal year 2017. This was due to a reversal of reserves for loan losses following the calculation of general reserves for loan losses corresponding to the expansion of the portfolio in project f inance and other areas in the Institutional Business. Regarding reserves for losses on interest repayments, ¥6.0 billion of reversal gains were recorded in fiscal year 2017, while in the fiscal year ended March 31, 2019, ¥2.3 billion of reversal gains were recorded. Following the recalculation of the necessary amount of reserves required to cover future overpayment burden based on recent interest repayment trends, there was an overall ¥2.3 billion excess reversal, and this amount was posted in reversal gains on reserves for losses on interest repayments. The balance of loans and bills discounted as of March 31, 2019 totaled ¥4,986.8 billion, increased ¥90.8 billion compared to ¥4,895.9 billion as of March 31, 2018. This was due to the increase in the balance of loans to institutional clients as there was an increase in the balance of loans in the Structured Finance Business as a part of efforts to make loans with an emphasis on risk-return, while in individual lending there was an increase in the balance of loans in the Consumer Finance Business, despite the decline in the balance of housing loans. A net interest margin of 2.46% was recorded for fiscal year 2018, increased from 2.42% recorded for fiscal year 2017. This was due to the increase in yield on loans in the Structured Finance Business and the Corporate Business, while the yield on interest-bearing liabilities only increased slightly. The Basel III domestic standard (grandfathering basis) consolidated core capital adequacy ratio as of March 31, 2019 was 11.85%, compared to 12.83% as of March 31, 2018. This was due to the increase in risk assets due to
the inc rease o f loan ba lance . The Bank ’ s Base l IIIinternational standard (fully loaded basis) Common Equity Tier 1 Ratio was at 12.0% as of March 31, 2019, compared to 12.2% at March 31, 2018. Capital adequacy ratios continue to be maintained at adequate levels. The nonperforming loan balance (nonconsolidated basis) under the Financial Revitalization Law increased ¥1.8 billion during fiscal year 2018 to ¥10.2 billion as of March 31, 2019. Addit ional ly , the proport ion of nonperforming claims to the overall loan balance was 0.20% as of March 31, 2019, compared to 0.17% as of March 31, 2018, remaining at a low level.
SIGNIFICANT EVENTS
BUYBACK OF SHARESShinsei Bank purchased shares as below based on buyback resolutions approved at meetings of the Board of Directors. With these purchases, the authorized buybacks have been completed.• 7,652,700 shares for ¥12,999 million from market at the
Tokyo Stock Exchange during a period from May 14, 2018 to October 16, 2018. Also, on May 18, 2018, Shinsei Bank cancelled 16,000,000 treasury shares based on a resolution to cancel treasury shares approved at a meeting of the Board of Directors.
15
OVERVIEW

Management’s Discussion and Analysis of Financial Condition and Results of Operations
SHINSEI BANK, LIMITED Integrated Report 2019
2019/07/17 13:02:21 / 19509941_株式会社新生銀行_総会その他(C)
SELECTED FINANCIAL DATA (CONSOLIDATED)
Shinsei Bank, Limited and its Consolidated SubsidiariesAs of or for the fiscal years ended March 31, 2019, 2018, 2017, 2016 and 2015
Billions of yen (except for per share data and percentages)2019 2018 2017 2016 2015
Statements of income data:Net interest income ¥ 133.8 ¥ 128.7 ¥ 122.2 ¥ 122.3 ¥ 126.4Net fees and commissions 31.3 25.0 25.5 25.4 24.6Net trading income 6.6 8.5 7.3 8.4 11.5Net other business income 57.8 69.6 73.3 60.3 72.6Total revenue 229.6 232.0 228.5 216.6 235.3General and administrative expenses 145.7 142.9 144.2 141.3 144.2Amortization of goodwill and intangible assets
acquired in business combinations 2.8 3.9 5.2 7.4 8.6Total general and administrative expenses 148.5 146.9 149.4 148.7 152.8Net credit costs 29.3 37.2 31.8 3.7 11.8Net business profit after net credit costs 51.8 47.7 47.1 64.0 70.5Other gains (losses), net 2.7 7.6 4.6 (1.2) 2.1Income before income taxes 54.5 55.4 51.7 62.8 72.7Current income taxes 3.8 1.2 2.1 1.9 2.4Deferred income taxes (benefit) (1.3) 2.5 (0.9) (0.5) 0.9Profit (loss) attributable to noncontrolling interests (0.2) 0.1 (0.2) 0.3 1.5Profit (loss) attributable to owners of the parent ¥ 52.3 ¥ 51.4 ¥ 50.7 ¥ 60.9 ¥ 67.8Balance sheet data:Trading assets ¥ 204.4 ¥ 205.2 ¥ 244.1 ¥ 336.3 ¥ 317.3Securities 1,130.2 1,123.5 1,014.6 1,227.8 1,477.3Loans and bills discounted 4,986.8 4,895.9 4,833.4 4,562.9 4,461.2Customers’ liabilities for acceptances and guarantees 456.7 395.3 346.6 280.6 291.7Reserve for credit losses (98.0) (100.8) (100.1) (91.7) (108.2)Total assets 9,571.1 9,456.6 9,258.3 8,928.7 8,889.8Deposits, including negotiable certificates of deposit 5,922.1 6,067.0 5,862.9 5,800.9 5,452.7Trading liabilities 182.3 184.5 212.2 294.3 267.9Borrowed money 684.0 739.5 789.6 801.7 805.2Acceptances and guarantees 456.7 395.3 346.6 280.6 291.7Total liabilities 8,674.5 8,600.6 8,437.5 8,135.6 8,136.0Common stock 512.2 512.2 512.2 512.2 512.2Total equity 896.6 856.0 820.7 793.1 753.7Total liabilities and equity ¥ 9,571.1 ¥ 9,456.6 ¥ 9,258.3 ¥ 8,928.7 ¥ 8,889.8Per share data1:Common equity2 ¥3,636.92 ¥3,376.39 ¥3,163.89 ¥ 294.41 ¥ 275.45Basic earnings per share 211.24 199.01 194.65 22.96 25.57Diluted earnings per share 211.22 198.98 194.64 22.96 -Capital adequacy data:Capital ratio (Basel lll, Domestic Standard) 11.9% 12.8% 13.1% 14.2% 14.9%Total capital adequacy ratio (Basel ll) - - - - -Tier I capital ratio (Basel ll) - - - - -Average balance data:Securities ¥ 1,150.6 ¥ 1,109.1 ¥ 1,116.3 ¥ 1,336.9 ¥ 1,604.9Loans and bills discounted 4,954.6 4,903.7 4,679.1 4,434.2 4,326.8Total assets 9,513.9 9,357.4 9,093.5 8,909.3 9,105.5Interest-bearing liabilities 7,773.8 7,591.2 7,283.4 7,142.7 7,346.4Total liabilities 8,637.5 8,519.0 8,286.6 8,135.9 8,367.3Total equity 876.3 838.4 806.9 773.4 738.2Other data:Return on assets 0.5% 0.5% 0.6% 0.7% 0.7%Return on equity2 6.0% 6.1% 6.3% 8.1% 9.8%Ratio of deposits, including negotiable certificates of
deposit, to total liabilities 68.2% 70.5% 69.5% 71.3% 67.0%Expense-to-revenue ratio3 63.5% 61.6% 63.1% 65.3% 61.3%Nonperforming claims, nonconsolidated ¥ 10.2 ¥ 8.3 ¥ 10.3 ¥ 34.7 ¥ 60.9Ratio of nonperforming claims to total claims,
nonconsolidated 0.2% 0.2% 0.2% 0.8% 1.4%1 Shinsei Bank executed a 1-for-10 reverse stock split on October 1, 2017. The above Per share data is calculated as if the reverse stock split had been implemented at the beginning of the fiscal
year ended March 31, 2018.2 Stock acquisition rights and noncontrolling interests are excluded from equity.3 The expense-to-revenue ratio is calculated by dividing general and administrative expenses by total revenue.
16
SELECTED FINANCIAL DATA (CONSOLIDATED)

Management’s Discussion and Analysis of Financial Condition and Results of Operations
SHINSEI BANK, LIMITED Integrated Report 2019
2019/07/17 13:02:21 / 19509941_株式会社新生銀行_総会その他(C)
RESULTS OF OPERATIONS (CONSOLIDATED)
NET INTEREST INCOME
Net interest income was ¥133.8 billion in fiscal year 2018, increased ¥5.1 billion from ¥128.7 billion recorded in fiscal year 2017. This was mainly due to a boost from loan growth, including unsecured loans at the consumer finance business.
NET REVENUE ON INTEREST-EARNING ASSETS
The table below shows the principal components of net revenue on interest-earning assets.
TABLE 1. INTEREST-EARNING ASSETS AND INTEREST-BEARING LIABILITIES (CONSOLIDATED)Billions of yen (except Yield/Rate)
2019 2018
Fiscal years ended March 31AverageBalance Interest Yield/Rate
AverageBalance Interest Yield/Rate
Interest-earning assets:Loans and bills discounted ¥ 4,954.6 ¥ 140.1 2.83% ¥ 4,903.7 ¥ 134.8 2.75%Lease receivables and leased investment assets/
installment receivables 746.4 37.5 5.03 746.6 37.0 4.96
Securities 1,150.6 12.5 1.09 1,109.1 11.7 1.06Other interest-earning assets1 190.0 2.1 n.m.3 162.1 1.9 n.m.3
Total revenue on interest-earning assets (A) ¥ 7,041.7 ¥ 192.3 2.73% ¥ 6,921.7 ¥ 185.5 2.68%
Interest-bearing liabilities:Deposits, including negotiable certificates of deposit ¥ 6,033.0 ¥ 7.8 0.13% ¥ 5,965.9 ¥ 9.0 0.15%Borrowed money 786.5 3.3 0.43 785.2 3.4 0.44
Subordinated debt 3.7 0.0 2.36 12.4 0.2 2.37Other borrowed money 782.8 3.2 0.42 772.8 3.1 0.41
Corporate bonds 89.9 0.4 0.52 98.1 0.9 0.97Subordinated bonds 12.8 0.2 1.88 28.6 0.6 2.43Other corporate bonds 77.1 0.2 0.29 69.5 0.2 0.37
Other interest-bearing liabilities1 864.2 9.3 n.m3 741.7 6.2 n.m.3Total expense on interest-bearing liabilities (B) ¥ 7,773.8 ¥ 21.0 0.27% ¥ 7,591.2 ¥ 19.7 0.26%
Net interest margin (A) - (B) - 171.3 2.46% - 165.8 2.42%
Non interest-bearing sources of funds:Non interest-bearing (assets) liabilities, net ¥ (1,605.8) - - ¥ (1,506.3) - -Total equity excluding noncontrolling interest2 873.8 - - 836.8 - -
Total non interest-bearing sources of funds (C) ¥ (732.0) - - ¥ (669.5) - -Total interest-bearing liabilities and
non interest-bearing sources of funds (D) = (B)+(C) ¥ 7,041.7 ¥ 21.0 0.30% ¥ 6,921.7 ¥ 19.7 0.29%Net revenue on interest-earning assets/
yield on interest-earning assets (A) - (D) - ¥ 171.3 2.43% - ¥ 165.8 2.40%
Reconciliation of total revenue on interest-earning assets to total interest income
Total revenue on interest-earning assets ¥ 7,041.7 ¥ 192.3 2.73% ¥ 6,921.7 ¥ 185.5 2.68%Less: Income on lease transactions and installment receivables 746.4 37.5 5.03 746.6 37.0 4.96Total interest income ¥ 6,295.3 ¥ 154.8 2.46% ¥ 6,175.0 ¥ 148.5 2.40%Total interest expenses - 21.0 - - 19.7 -
Net interest income - ¥ 133.8 - - ¥ 128.7 -1 Other interest-earning assets and other interest-bearing liabilities include interest swaps and funding swaps.2 Represents a simple average of the balance as of the beginning and the end of the fiscal years presented.3 n.m. is not meaningful.
17
REVENUE

Management’s Discussion and Analysis of Financial Condition and Results of Operations
SHINSEI BANK, LIMITED Integrated Report 2019
2019/07/17 13:02:21 / 19509941_株式会社新生銀行_総会その他(C)
RESULTS OF OPERATIONS (CONSOLIDATED) (continued)
Net interest income presented in the preceding table includes income on lease receivables, leased investment assets and installment receivables in addition to net received interest. However, while the Bank considers income on lease assets and installment receivables to be a component of net interest income, Japanese GAAP does not include income on lease transactions and installment receivables as eligible components of net interest income. As a result, the Bank reports income on lease transactions and installment receivables in net other business income in its consolidated statements of income in conformity with Japanese GAAP. A net interest margin of 2.46% was recorded in fiscal year 2018, increased from 2.42% recorded in fiscal year 2017. This was primarily due to increase of loan interest income from unsecured loan and Structured Finance Business, while in the yield on interest-bearing liabilities slightly increased. Net interest income including income on leasing and installment receivables for fiscal year 2018 was ¥171.3 billion, increased from ¥165.8 billion in the previous fiscal year. This increase reflects an increase in total interest revenue recorded from interest earnings assets from ¥185.5 billion recorded in fiscal year 2017 to ¥192.3 billion recorded in fiscal year 2018, exceeding the increase in interest expenses incurred on interest bearing liabilities from ¥19.7 billion recorded in fiscal year 2017 to ¥21.0 billion recorded in the fiscal year ended March 31, 2019.
NET FEES AND COMMISSIONS
Net fees and commissions consists mainly of fee income associated with sales of products such as mutual funds and insurance products, fee income associated with the credit guarantee and credit card business in the consumer finance business, fee income associated with lending business such as real estate finance and project finance. Net fees and commissions totaled ¥31.3 billion in fiscal year 2018.Revenues increased re lated to the sa le of asset management products and the effect of the revision of Shinsei Step Up Program, charging ATM fees on Standard-stage customers in Retail Banking Business and the growth in APLUS FINANCIAL's shopping credit , as well as continued strong fee income in the structured finance business, particularly for project finance.
NET TRADING INCOME
The following table presents the principal components of net trading income.
TABLE 2. NET TRADING INCOME (CONSOLIDATED)Billions of yen
Fiscal years ended March 31 2019 2018 Change (Amount)Income from trading securities ¥ 2.4 ¥ 3.8 ¥ (1.3)Income from securities held to hedge trading transactions 0.2 0.0 0.2Income from trading-related financial derivatives 3.9 4.6 (0.6)Other, net 0.0 0.0 (0.0)
Net trading income ¥ 6.6 ¥ 8.5 ¥ (1.8)
Net trading income consists of revenue from derivatives associated with transactions with customers as well as revenue from proprietary trading performed by the Bank.
Net trading income of ¥6.6 billion for the fiscal year 2018, decreased ¥8.5 billion in the previous fiscal year.
18
REVENUE

Management’s Discussion and Analysis of Financial Condition and Results of Operations
SHINSEI BANK, LIMITED Integrated Report 2019
2019/07/17 13:02:21 / 19509941_株式会社新生銀行_総会その他(C)
RESULTS OF OPERATIONS (CONSOLIDATED) (continued)
NET OTHER BUSINESS INCOME
The following table presents the principal components of net other business income.
TABLE 3. NET OTHER BUSINESS INCOME (CONSOLIDATED)Billions of yen
Fiscal years ended March 31 2019 2018 Change (Amount)Net gain on monetary assets held in trust ¥ 2.5 ¥ 2.7 ¥ (0.2)Net gain on foreign exchanges 6.7 9.4 (2.7)Net gain on securities 0.3 9.9 (9.5)Net gain on other monetary claims purchased 0.8 1.1 (0.3)Other, net: 9.8 9.2 0.6
Income (loss) from derivatives entered into for banking purposes, net (0.5) (0.0) (0.4)Equity in net income of affiliates 5.6 5.1 0.5Gain on lease cancellation and other lease income, net 2.2 2.1 0.1Other, net 2.4 2.0 0.4
Net other business income before income on lease transactionsand installment receivables, net 20.3 32.6 (12.2)
Income on lease transactions and installment receivables, net 37.5 37.0 0.4Net other business income ¥ 57.8 ¥ 69.6 ¥(11.7)
Net other business income recorded in the fiscal year ended March 31, 2019 totaled ¥57.8 billion, decreased from ¥69.6 billion recorded in the fiscal year ended March 31, 2018. This reflected the non-recurrence in large gains booked on sales of investment securities in the previous fiscal year, as well as a decrease in foreign exchanges.
TOTAL REVENUE
As a result of the preceding factors, total revenue in fiscal year 2018 was ¥229.6 billion, as compared to ¥232.0 billion in the previous fiscal year.
GENERAL AND ADMINISTRATIVE EXPENSES
The following table presents the principal components of general and administrative expenses.
TABLE 4. GENERAL AND ADMINISTRATIVE EXPENSES (CONSOLIDATED)Billions of yen
Fiscal years ended March 31 2019 2018 Change (Amount)Personnel expenses ¥ 56.5 ¥ 56.2 ¥ 0.2Premises expenses 19.6 20.0 (0.3)Technology and data processing expenses 23.2 20.8 2.4Advertising expenses 10.9 11.0 (0.1)Consumption and property taxes 10.4 9.3 1.0Deposit insurance premium 1.6 1.7 (0.1)Other general and administrative expenses 23.2 23.6 (0.3)
General and administrative expenses 145.7 142.9 2.7Amortization of goodwill and intangible assets acquired in business combinations 2.8 3.9 (1.1)
Total general and administrative expenses ¥ 148.5 ¥ 146.9 ¥ 1.5
19
REVENUE、GENERAL AND ADMINISTRATIVE EXPENSES

Management’s Discussion and Analysis of Financial Condition and Results of Operations
SHINSEI BANK, LIMITED Integrated Report 2019
2019/07/17 13:02:21 / 19509941_株式会社新生銀行_総会その他(C)
RESULTS OF OPERATIONS (CONSOLIDATED) (continued)
Genera l and admin is t ra t i ve expenses exc lud ing amortization of goodwill and intangible assets was ¥145.7 billion in the fiscal year ended March 31, 2019, increased from ¥142.9 billion recorded in the previous fiscal year 2017. Personnel expenses increased from ¥56.2 billion recorded in the fiscal year ended March 31, 2018, to ¥56.5 billion in the fiscal year ended March 31, 2019. This increase was due to the increase in retirement benefits costs, despite efforts to more effectively assign personnel with the aim of expanding the customer base and enhancing profitability. Nonpersonnel expenses of ¥89.1 billion were recorded in fiscal year 2018, increased from ¥86.7 billion in the previous fiscal year. This increase was attributable to the allocation of necessary resources targeting an expansion of the business base. The Bank’s performances in the major components of nonpersonnel expenses were as follows: 1) Due to continued efforts to improve operational efficiency, premises expenses totaled ¥19.6 billion in the fiscal year ended March 31, 2019, decreased from ¥20.0 billion recorded in the previous fiscal year; 2) Technology and data processing expenses totaled ¥23.2 billion in the fiscal year ended March 31, 2019, increased from ¥20.8 billion recorded in the fiscal year ended March 31, 2018, as investment for the stabilization of our systems continued and the core system began operating; 3) As a result of the continued implementation of advertising activities in order to expand our customer base along with efforts to increase
efficiency, advertising expenses decreased from ¥11.0 billion recorded in the fiscal year ended March 31, 2018, to ¥10.9 billion in the fiscal year ended March 31, 2019; 4) Consumption and property tax expenses were ¥10.4 billion in the fiscal year ended March 31, 2019, increased from ¥9.3 billion in the previous fiscal year, due primarily to the effects of pro-forma standard taxation; 5) Deposit insurance premium totaled ¥1.6 billion in the fiscal year ended March 31, 2019, almost the same as the ¥1.7 billion recorded in the fiscal year ended March 31, 2018; and 6) Other general and administrative expenses totaled ¥23.2 billion in the fiscal year ended March 31, 2019, a decline from the ¥23.6 billion recorded in the previous fiscal year, due to continued efforts to increase the efficiency of operations.
AMORTIZATION OF GOODWILL AND INTANGIBLEASSETS ACQUIRED IN BUSINESS COMBINATIONS
Amortization of goodwill and intangible assets acquired in business combinations associated with the acquisition of consumer finance and commercial finance subsidiaries totaled ¥2.8 billion in fiscal year 2018, compared to ¥3.9 bill ion in the previous fiscal year. This reduction is attributable to factors such as the utilization of the sum-of-the-years’ digits method in recording amortization of goodwill and intangible assets acquired in business combinations related to Shinsei Financial.
TABLE 5. AMORTIZATION OF GOODWILL AND INTANGIBLE ASSETS ACQUIREDIN BUSINESS COMBINATIONS (CONSOLIDATED)
Billions of yenFiscal years ended March 31 2019 2018 Change (Amount)Shinsei Financial ¥ 0.7 ¥ 1.9 ¥ (1.1)Shinsei Personal Loan (0.3) (0.3) -Showa Leasing 2.3 2.4 (0.0)Others 0.0 (0.0) 0.0
Amortization of goodwill and intangible assets acquired in business combinations ¥ 2.8 ¥ 3.9 ¥ (1.1)
20
GENERAL AND ADMINISTRATIVE EXPENSES

Management’s Discussion and Analysis of Financial Condition and Results of Operations
SHINSEI BANK, LIMITED Integrated Report 2019
2019/07/17 13:02:21 / 19509941_株式会社新生銀行_総会その他(C)
RESULTS OF OPERATIONS (CONSOLIDATED) (continued)
NET CREDIT COSTS
The following table presents the principal components of net credit costs.
TABLE 6. NET CREDIT COSTS (CONSOLIDATED)Billions of yen
Fiscal years ended March 31 2019 2018 Change (Amount)Losses on write-off or sales of loans ¥ 0.4 ¥ 0.5 ¥ (0.1)Net provision (reversal) of reserve for loan losses:
Net provision (reversal) of general reserve for loan losses 17.2 28.0 (10.8)Net provision (reversal) of specific reserve for loan losses 17.9 14.9 3.0Net provision (reversal) of reserve for loan losses to restructuring countries - (0.0) 0.0
Subtotal 35.2 43.0 (7.7)Other credit costs (recoveries) relating to leasing business 0.3 0.6 (0.3)Recoveries of written-off claims (6.6) (6.9) 0.2
Net credit costs (recoveries) ¥ 29.3 ¥ 37.2 ¥ (7.9)
The principal components of net credit costs are provisions and reversals of reserves for loan losses. In accordance with Japanese GAAP, the Bank maintains general and specific reserves for loan losses, specified reserves for loans losses to restructuring countries as well as a specific reserve for other credit losses. Subsidiaries such as Shinsei Financial, APLUS FINANCIAL, Shinsei Personal Loan and Showa Leasing also maintain general and specific reserves for loan losses.
In the fiscal year ended March 31, 2019, the Bank recorded net credit costs totaling ¥29.3 billion, decreased from ¥37.2 billion recorded in the fiscal year ended March 31, 2018. This was largely due to the dulling of growth in operating assets in unsecured personal loans and the recording of net credit costs recoveries due to calculation of general reserve for loan losses in accordance with growth of portfolio in the Institutional Business. Recoveries of written-off claims totaled ¥6.6 billion in fiscal year 2018, decreased compared to ¥6.9 billion recorded in fiscal year 2017. Major components of the ¥6.6 billion of recoveries recorded in the fiscal year ended March 31, 2019 included ¥0.2 billion in Shinsei Bank on a nonconsolidated basis and ¥6.2 billion in Shinsei Financial, and ¥0.1 billion in APLUS FINANCIAL. It should be noted that excluding recoveries of written-off claims, net credit costs recorded in fiscal year 2018 totaled ¥36.0 billion, decreased compared to ¥44.2 billion recorded in fiscal year 2017.
21
CREDIT COSTS

Management’s Discussion and Analysis of Financial Condition and Results of Operations
SHINSEI BANK, LIMITED Integrated Report 2019
2019/07/17 13:02:21 / 19509941_株式会社新生銀行_総会その他(C)
RESULTS OF OPERATIONS (CONSOLIDATED) (continued)
OTHER GAINS (LOSSES), NET
The following table presents the principal components of other gains (losses).
TABLE 7. OTHER GAINS (LOSSES), NET (CONSOLIDATED)Billions of yen
Fiscal years ended March 31 2019 2018 Change (Amount)Net gain (loss) on disposal of premises and equipment ¥ (0.0) ¥ 0.5 ¥ (0.6)Gains on write-off of unclaimed debentures 0.3 3.1 (2.8)Provision for reimbursement of debentures (0.1) (1.2) 1.0Gains on write-off of unclaimed deposits 0.4 0.4 (0.0)Reversal (provision) of reserve for losses on interest repayments 2.3 6.0 (3.7)Impairment losses on long-lived assets (0.9) (1.8) 0.8Loss on liquidation of subsidiaries (0.0) (0.0) 0.0Loss on change in equity of affiliates - (0.2) 0.2Gains on unexercised and forfeited stock acquisition rights 0.2 0.2 (0.0)Other, net 0.6 0.3 0.2
Total ¥ 2.7 ¥ 7.6 ¥ (4.8)
Other net gains totaled ¥2.7 billion in the fiscal year ended March 31, 2019. With respect to reserves for losses on interest repayments, Shinsei Financial reversed ¥5.6 billion and Shinsei Personal Loan ¥0.1 billion, whereas APLUS FINANCIAL made provisions of additional reserves totaling ¥3.5 billion.
INCOME BEFORE INCOME TAXESAs a result of the preceding factors income before income taxes totaled ¥54.5 billion for fiscal year 2018, compared to ¥55.4 billion in the previous fiscal year.
TAX EXPENSE (BENEFIT)Current taxes, including corporate tax, residency tax and business tax, and deferred taxes, totaled a net expense of ¥2.5 billion for fiscal year 2018, compared to a net expense of ¥3.8 billion in the previous fiscal year. In fiscal year 2018, current tax expense totaled ¥3.8 billion and deferred tax benefit totaled ¥1.3 billion. In the previous fiscal year, current tax expense totaled ¥1.2 billion and deferred tax expense totaled ¥2.5 billion.
PROFIT ATTRIBUTABLE TO OWNERS OF THE PARENTAs a result of the preceding factors, in fiscal year 2018, we recorded a consolidated profit attributable to owners of the parent of ¥52.3 billion, increased from ¥51.4 billion in the previous fiscal year.
22
OTHER GAINS, TAX, PROFIT, RECONCILIATION

Management’s Discussion and Analysis of Financial Condition and Results of Operations
SHINSEI BANK, LIMITED Integrated Report 2019
2019/07/17 13:02:21 / 19509941_株式会社新生銀行_総会その他(C)
RESULTS OF OPERATIONS (CONSOLIDATED) (continued)
RECONCILIATION OF REPORTED-BASIS RESULTS AND OPERATING-BASIS RESULTSIn addition to analyzing our results of operations in the format used for our English version annual report financial statements, which we refer to as the “reported-basis” results, our management also monitors our “operating-basis” results in order to assess individual business lines and evaluate achievements against targeted goals. Operating-basis results are calculated by adjusting the reported-basis results, with adjustments primarily made for the amortization of goodwill and intangible assets acquired in business combinations, certain revenue items, amortization of net actuarial losses and lump-sum payment lines. Generally speaking, the operating-basis results represent what the Bank considers to be “core” business results and are in accordance with Japanese GAAP at the profit (loss) level. The following summary table presents a reconciliation between our reported-basis results and operating-basis results.
TABLE 8. RECONCILIATION FROM REPORTED-BASIS RESULTS TO OPERATING-BASIS RESULTS(CONSOLIDATED)
Billions of yen2019 2018
Fiscal years ended March 31Reported-
basis ReclassificationsOperating-
basisReported-
basis ReclassificationsOperating-
basisRevenue:
Net interest income ¥ 133.8 ¥ - ¥ 133.8 ¥ 128.7 ¥ - ¥ 128.7Noninterest income 95.8 0.0 95.9 103.2 - 103.2
Total revenue 229.6 0.0 229.7 232.0 - 232.0General and administrative expenses1,3 145.7 (0.9) 144.7 142.9 (0.3) 142.5Amortization of goodwill and intangible assets
acquired in business combinations2,3 2.8 (2.8) - 3.9 (3.9) -Total general and administrative expenses 148.5 (3.8) 144.7 146.9 (4.3) 142.5Net business profit/Ordinary business profit2 81.1 3.8 84.9 85.0 4.3 89.4Net credit costs 29.3 - 29.3 37.2 - 37.2Amortization of goodwill and intangible assets
acquired in business combinations2 - 2.8 2.8 - 3.9 3.9Other gains (losses), net1 2.7 (1.0) 1.7 7.6 (0.3) 7.2Income before income taxes 54.5 - 54.5 55.4 - 55.4Income taxes and profit attributable to noncontrolling interests 2.2 - 2.2 3.9 - 3.9Profit attributable to owners of the parent ¥ 52.3 ¥ - ¥ 52.3 ¥ 51.4 ¥ - ¥ 51.4
1 Reclassifications consist principally of adjustments relating to lump-sum compensation and amortization of actuarial gains or losses from general and administrative expenses to other gains (losses), net.
2 Amortization of goodwill and intangible assets acquired in business combinations associated with acquisitions of companies is reclassified under ordinary business profit after net credit costs.3 Amortization of goodwill and intangible assets acquired in business combinations associated with partial acquisitions of businesses is classified to general and administrative expenses.
23
OTHER GAINS, TAX, PROFIT, RECONCILIATION

Management’s Discussion and Analysis of Financial Condition and Results of Operations
SHINSEI BANK, LIMITED Integrated Report 2019
2019/07/17 13:02:21 / 19509941_株式会社新生銀行_総会その他(C)
RESULTS OF OPERATIONS (CONSOLIDATED) (continued)
BUSINESS LINES RESULTS
The management of Shinsei Bank continuously monitors operating-basis business performances. The following section provides explanations regarding the operating-basis ordinary business profit (loss) after net credit costs (recoveries) of each business area.
TABLE 9. OPERATING-BASIS ORDINARY BUSINESS PROFIT (LOSS) AFTER NET CREDIT COSTS(RECOVERIES) BY BUSINESS LINE (CONSOLIDATED)1
Billions of yenFiscal years ended March 31 2019 2018 Change (Amount)Institutional Business:
Net interest income ¥ 24.1 ¥ 24.4 ¥ (0.3)Noninterest income 33.8 40.2 (6.3)
Total revenue 58.0 64.6 (6.6)General and administrative expenses 33.5 32.4 1.0Ordinary business profit (loss) 24.5 32.2 (7.7)Net credit costs (recoveries) (1.9) 3.6 (5.5)Ordinary business profit (loss) after net credit costs (recoveries) ¥ 26.4 ¥ 28.6 ¥ (2.1)
Global Markets Business:Net interest income ¥ 2.0 ¥ 2.1 ¥ (0.1)Noninterest income 7.3 9.2 (1.8)
Total revenue 9.4 11.4 (2.0)General and administrative expenses 7.0 7.0 (0.0)Ordinary business profit (loss) 2.3 4.3 (1.9)Net credit costs (recoveries) 0.0 0.0 (0.0)Ordinary business profit (loss) after net credit costs (recoveries) ¥ 2.3 ¥ 4.3 ¥ (1.9)
Individual Business:Net interest income ¥ 104.8 ¥ 103.4 ¥ 1.4Noninterest income 50.8 48.8 2.0
Total revenue 155.7 152.3 3.4General and administrative expenses 101.1 99.6 1.4Ordinary business profit (loss) 54.6 52.6 2.0Net credit costs (recoveries) 31.2 33.6 (2.3)Ordinary business profit (loss) after net credit costs (recoveries) ¥ 23.3 ¥ 19.0 ¥ 4.3
Corporate/Other2:Net interest income ¥ 2.6 ¥ (1.3) ¥ 4.0Noninterest income 3.8 4.9 (1.1)
Total revenue 6.5 3.6 2.9General and administrative expenses 3.0 3.4 (0.3)Ordinary business profit (loss) 3.5 0.2 3.2Net credit costs (recoveries) 0.0 (0.0) 0.0Ordinary business profit (loss) after net credit costs (recoveries) ¥ 3.4 ¥ 0.2 ¥ 3.2
Total:Net interest income ¥ 133.8 ¥ 128.7 ¥ 5.0Noninterest income 95.9 103.2 (7.3)
Total revenue 229.7 232.0 (2.3)General and administrative expenses 144.7 142.5 2.1Ordinary business profit (loss) 84.9 89.4 (4.4)Net credit costs (recoveries) 29.3 37.2 (7.9)Ordinary business profit (loss) after net credit costs (recoveries) ¥ 55.6 ¥ 52.1 ¥ 3.4
1 Costs associated with the funding operations have been allocated to the interest earning businesses on a management accounting basis.2 Includes company-wide accounts, allocation variance of indirect expense and elimination amount of inter-segment transactions.
24
BUSINESS LINES RESULTS

Management’s Discussion and Analysis of Financial Condition and Results of Operations
SHINSEI BANK, LIMITED Integrated Report 2019
2019/07/17 13:02:21 / 19509941_株式会社新生銀行_総会その他(C)
RESULTS OF OPERATIONS (CONSOLIDATED) (continued)
INSTITUTIONAL BUSINESS
The Institutional Business consists of: 1) Corporate Business, which provides financial products and services to the Bank’s corporate, public corporation and financial institution customers; 2) Structured Finance, which provides services including real estate finance and project finance; 3) Principal Transactions, which is engaged in businesses such as credit trading, private equity and asset-backed investment businesses;and 4) Showa Leasing.
TABLE 10. INSTITUTIONAL BUSINESS ORDINARY BUSINESS PROFIT (LOSS) AFTER NET CREDIT COSTS(RECOVERIES) BY BUSINESS/SUBSIDIARY (CONSOLIDATED)1
Billions of yenFiscal years ended March 31 2019 2018 Change (Amount)Corporate Business:
Net interest income ¥ 10.0 ¥ 10.0 ¥ 0.0Noninterest income 6.7 8.7 (2.0)
Total revenue 16.7 18.7 (2.0)General and administrative expenses 11.8 11.8 (0.0)Ordinary business profit (loss) 4.9 6.9 (1.9)Net credit costs (recoveries) 0.8 0.2 0.5Ordinary business profit (loss) after net credit costs (recoveries) ¥ 4.0 ¥ 6.6 ¥ (2.5)
Structured Finance:Net interest income ¥ 10.3 ¥ 9.5 ¥ 0.8Noninterest income 7.2 7.4 (0.2)
Total revenue 17.6 17.0 0.5General and administrative expenses 7.7 6.8 0.9Ordinary business profit (loss) 9.8 10.1 (0.3)Net credit costs (recoveries) (2.1) 1.7 (3.9)Ordinary business profit (loss) after net credit costs (recoveries) ¥ 12.0 ¥ 8.4 ¥ 3.6
Principal Transactions:Net interest income ¥ 3.7 ¥ 5.0 ¥ (1.2)Noninterest income 5.6 7.8 (2.2)
Total revenue 9.3 12.8 (3.4)General and administrative expenses 4.0 4.7 (0.6)Ordinary business profit (loss) 5.3 8.1 (2.7)Net credit costs (recoveries) 0.0 (1.2) 1.2Ordinary business profit (loss) after net credit costs (recoveries) ¥ 5.3 ¥ 9.3 ¥ (4.0)
Showa Leasing:Net interest income ¥ (0.0) ¥ (0.1) ¥ 0.0Noninterest income 14.2 16.1 (1.8)
Total revenue 14.2 15.9 (1.7)General and administrative expenses 9.8 8.9 0.8Ordinary business profit (loss) 4.3 7.0 (2.6)Net credit costs (recoveries) (0.6) 2.7 (3.4)Ordinary business profit (loss) after net credit costs (recoveries) ¥ 4.9 ¥ 4.2 ¥ 0.7
Institutional Business:Net interest income ¥ 24.1 ¥ 24.4 ¥ (0.3)Noninterest income 33.8 40.2 (6.3)
Total revenue 58.0 64.6 (6.6)General and administrative expenses 33.5 32.4 1.0Ordinary business profit (loss) 24.5 32.2 (7.7)Net credit costs (recoveries) (1.9) 3.6 (5.5)Ordinary business profit (loss) after net credit costs (recoveries) ¥ 26.4 ¥ 28.6 ¥ (2.1)
1 Net of consolidation adjustments, if applicable.
25
INSTITUTIONAL BUSINESS
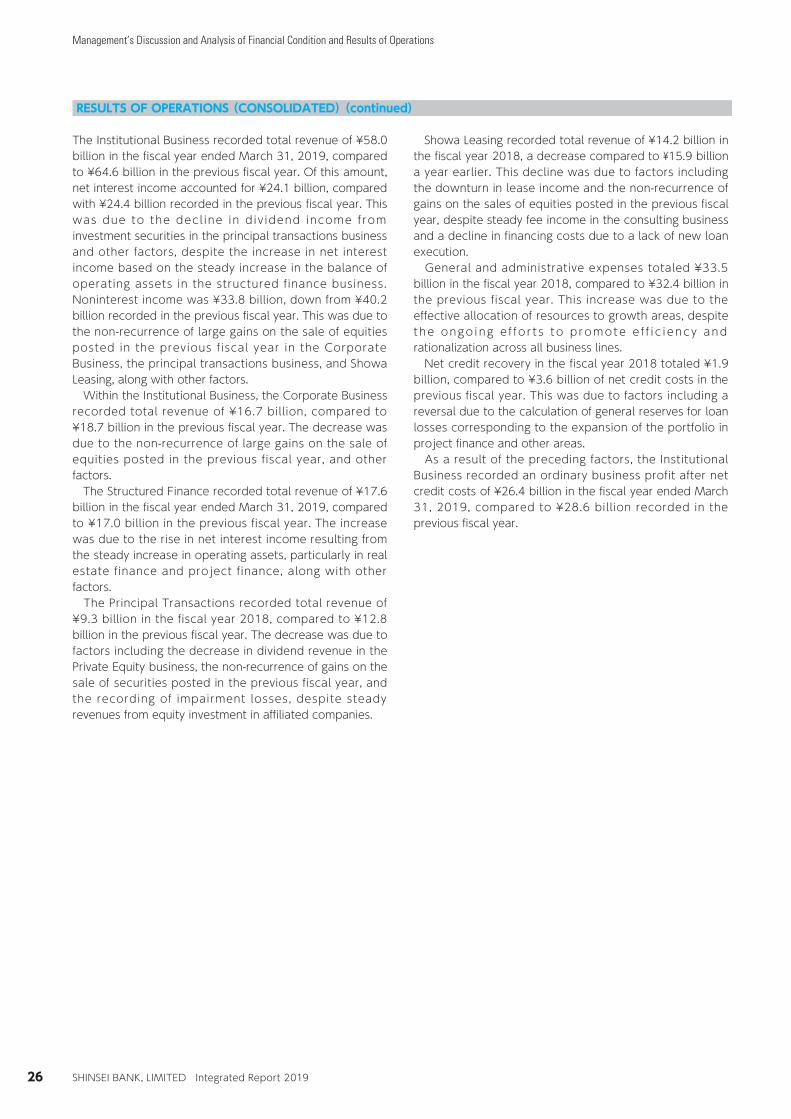
Management’s Discussion and Analysis of Financial Condition and Results of Operations
SHINSEI BANK, LIMITED Integrated Report 2019
2019/07/17 13:02:21 / 19509941_株式会社新生銀行_総会その他(C)
RESULTS OF OPERATIONS (CONSOLIDATED) (continued)
The Institutional Business recorded total revenue of ¥58.0 billion in the fiscal year ended March 31, 2019, compared to ¥64.6 billion in the previous fiscal year. Of this amount, net interest income accounted for ¥24.1 billion, compared with ¥24.4 billion recorded in the previous fiscal year. This was due to the decl ine in d iv idend income f rom investment securities in the principal transactions business and other factors, despite the increase in net interest income based on the steady increase in the balance of operating assets in the structured finance business. Noninterest income was ¥33.8 billion, down from ¥40.2 billion recorded in the previous fiscal year. This was due to the non-recurrence of large gains on the sale of equities posted in the previous fiscal year in the Corporate Business, the principal transactions business, and Showa Leasing, along with other factors. Within the Institutional Business, the Corporate Business recorded total revenue of ¥16.7 billion, compared to ¥18.7 billion in the previous fiscal year. The decrease was due to the non-recurrence of large gains on the sale of equities posted in the previous fiscal year, and other factors. The Structured Finance recorded total revenue of ¥17.6 billion in the fiscal year ended March 31, 2019, compared to ¥17.0 billion in the previous fiscal year. The increase was due to the rise in net interest income resulting from the steady increase in operating assets, particularly in real estate finance and project finance, along with other factors. The Principal Transactions recorded total revenue of ¥9.3 billion in the fiscal year 2018, compared to ¥12.8 billion in the previous fiscal year. The decrease was due to factors including the decrease in dividend revenue in the Private Equity business, the non-recurrence of gains on the sale of securities posted in the previous fiscal year, and the recording of impairment losses, despite steady revenues from equity investment in affiliated companies.
Showa Leasing recorded total revenue of ¥14.2 billion in the fiscal year 2018, a decrease compared to ¥15.9 billion a year earlier. This decline was due to factors including the downturn in lease income and the non-recurrence of gains on the sales of equities posted in the previous fiscal year, despite steady fee income in the consulting business and a decline in financing costs due to a lack of new loan execution. General and administrative expenses totaled ¥33.5 billion in the fiscal year 2018, compared to ¥32.4 billion in the previous fiscal year. This increase was due to the effective allocation of resources to growth areas, despite the ongo ing e f fo r t s to p romote e f f i c i ency and rationalization across all business lines. Net credit recovery in the fiscal year 2018 totaled ¥1.9 billion, compared to ¥3.6 billion of net credit costs in the previous fiscal year. This was due to factors including a reversal due to the calculation of general reserves for loan losses corresponding to the expansion of the portfolio in project finance and other areas. As a result of the preceding factors, the Institutional Business recorded an ordinary business profit after net credit costs of ¥26.4 billion in the fiscal year ended March 31, 2019, compared to ¥28.6 billion recorded in the previous fiscal year.
26
INSTITUTIONAL BUSINESS
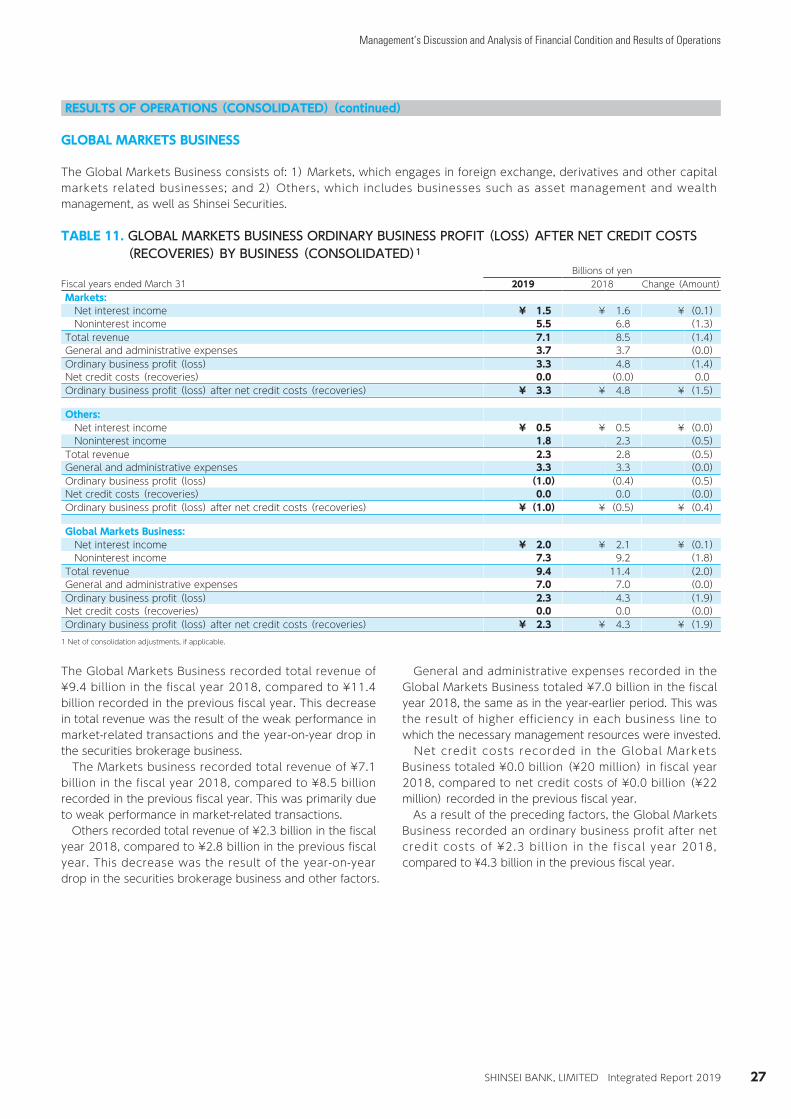
Management’s Discussion and Analysis of Financial Condition and Results of Operations
SHINSEI BANK, LIMITED Integrated Report 2019
2019/07/17 13:02:21 / 19509941_株式会社新生銀行_総会その他(C)
RESULTS OF OPERATIONS (CONSOLIDATED) (continued)
GLOBAL MARKETS BUSINESS
The Global Markets Business consists of: 1) Markets, which engages in foreign exchange, derivatives and other capital markets related businesses; and 2) Others, which includes businesses such as asset management and wealth management, as well as Shinsei Securities.
TABLE 11. GLOBAL MARKETS BUSINESS ORDINARY BUSINESS PROFIT (LOSS) AFTER NET CREDIT COSTS(RECOVERIES) BY BUSINESS (CONSOLIDATED)1
Billions of yenFiscal years ended March 31 2019 2018 Change (Amount)Markets:
Net interest income ¥ 1.5 ¥ 1.6 ¥ (0.1)Noninterest income 5.5 6.8 (1.3)
Total revenue 7.1 8.5 (1.4)General and administrative expenses 3.7 3.7 (0.0)Ordinary business profit (loss) 3.3 4.8 (1.4)Net credit costs (recoveries) 0.0 (0.0) 0.0Ordinary business profit (loss) after net credit costs (recoveries) ¥ 3.3 ¥ 4.8 ¥ (1.5)
Others:Net interest income ¥ 0.5 ¥ 0.5 ¥ (0.0)Noninterest income 1.8 2.3 (0.5)
Total revenue 2.3 2.8 (0.5)General and administrative expenses 3.3 3.3 (0.0)Ordinary business profit (loss) (1.0) (0.4) (0.5)Net credit costs (recoveries) 0.0 0.0 (0.0)Ordinary business profit (loss) after net credit costs (recoveries) ¥ (1.0) ¥ (0.5) ¥ (0.4)
Global Markets Business:Net interest income ¥ 2.0 ¥ 2.1 ¥ (0.1)Noninterest income 7.3 9.2 (1.8)
Total revenue 9.4 11.4 (2.0)General and administrative expenses 7.0 7.0 (0.0)Ordinary business profit (loss) 2.3 4.3 (1.9)Net credit costs (recoveries) 0.0 0.0 (0.0)Ordinary business profit (loss) after net credit costs (recoveries) ¥ 2.3 ¥ 4.3 ¥ (1.9)
1 Net of consolidation adjustments, if applicable.
The Global Markets Business recorded total revenue of ¥9.4 billion in the fiscal year 2018, compared to ¥11.4 billion recorded in the previous fiscal year. This decrease in total revenue was the result of the weak performance in market-related transactions and the year-on-year drop in the securities brokerage business. The Markets business recorded total revenue of ¥7.1 billion in the fiscal year 2018, compared to ¥8.5 billion recorded in the previous fiscal year. This was primarily due to weak performance in market-related transactions. Others recorded total revenue of ¥2.3 billion in the fiscal year 2018, compared to ¥2.8 billion in the previous fiscal year. This decrease was the result of the year-on-year drop in the securities brokerage business and other factors.
General and administrative expenses recorded in the Global Markets Business totaled ¥7.0 billion in the fiscal year 2018, the same as in the year-earlier period. This was the result of higher efficiency in each business line to which the necessary management resources were invested. Net credit costs recorded in the Global Markets Business totaled ¥0.0 billion (¥20 million) in fiscal year 2018, compared to net credit costs of ¥0.0 billion (¥22 million) recorded in the previous fiscal year. As a result of the preceding factors, the Global Markets Business recorded an ordinary business profit after net credit costs of ¥2.3 bill ion in the fiscal year 2018, compared to ¥4.3 billion in the previous fiscal year.
27
GLOBAL MARKETS BUSINESS

Management’s Discussion and Analysis of Financial Condition and Results of Operations
SHINSEI BANK, LIMITED Integrated Report 2019
2019/07/17 13:02:21 / 19509941_株式会社新生銀行_総会その他(C)
RESULTS OF OPERATIONS (CONSOLIDATED) (continued)
INDIVIDUAL BUSINESSThe Individual Business consists of: 1) Retail Banking; 2) Shinsei Financial ; 3) APLUS FINANCIAL; 4)Others.
TABLE 12. INDIVIDUAL BUSINESS ORDINARY BUSINESS PROFIT (LOSS) AFTER NET CREDIT COSTS(RECOVERIES) BY BUSINESS/SUBSIDIARY (CONSOLIDATED)1
Billions of yenFiscal years ended March 31 2019 2018 Change (Amount)Retail Banking:
Net interest income ¥ 23.9 ¥ 22.4 ¥ 1.5Loans 9.8 10.5 (0.6)Deposits 14.1 11.9 2.2
Noninterest income 2.9 1.0 1.8Asset Management Products 6.8 6.5 0.3Other Fees (ATM, Fund Transfer, FX etc.) (3.8) (5.4) 1.6
Total revenue 26.9 23.5 3.4General and administrative expenses 27.6 29.2 (1.5)Ordinary business profit (loss) (0.7) (5.7) 4.9Net credit costs (recoveries) (0.0) 0.1 (0.1)Ordinary business profit (loss) after net credit costs (recoveries) ¥ (0.7) ¥ (5.8) ¥ 5.1
Shinsei Financial 2:Net interest income ¥ 69.3 ¥ 69.0 ¥ 0.3
Lake Business 63.4 62.9 0.5Noninterest income (0.0) (0.1) 0.0
Total revenue 69.2 68.9 0.3General and administrative expenses 33.4 32.4 1.0Ordinary business profitt (loss) 35.7 36.4 (0.7)Net credit costs (recoveries) 14.5 22.7 (8.1)Ordinary business profit (loss) after net credit costs (recoveries) ¥ 21.2 ¥ 13.7 ¥ 7.4
APLUS FINANCIAL:Net interest income ¥ 10.7 ¥ 11.3 ¥ (0.5)Noninterest income 47.1 45.0 2.0
Total revenue 57.8 56.4 1.4General and administrative expenses 38.1 36.6 1.5Ordinary business profitt (loss) 19.6 19.7 (0.0)Net credit costs (recoveries) 16.5 10.6 5.9Ordinary business profit (loss) after net credit costs (recoveries) ¥ 3.1 ¥ 9.1 ¥ (6.0)
Others 3:Net interest income ¥ 0.8 ¥ 0.6 ¥ 0.1Noninterest income 0.8 2.7 (1.9)
Total revenue 1.6 3.4 (1.7)General and administrative expenses 1.7 1.3 0.4Ordinary business profitt (loss) (0.1) 2.0 (2.1)Net credit costs (recoveries) 0.1 0.0 0.0Ordinary business profit (loss) after net credit costs (recoveries) ¥ (0.2) ¥ 2.0 ¥ (2.2)
Individual Business:Net interest income ¥ 104.8 ¥ 103.4 ¥ 1.4Noninterest income 50.8 48.8 2.0
Total revenue 155.7 152.3 3.4General and administrative expenses 101.1 99.6 1.4Ordinary business profitt (loss) 54.6 52.6 2.0Net credit costs (recoveries) 31.2 33.6 (2.3)Ordinary business profit (loss) after net credit costs (recoveries) ¥ 23.3 ¥ 19.0 ¥ 4.3
1 Net of consolidation adjustments, if applicable.2 Income of Shinsei Financial, "Shinsei Bank Card Loan - Lake", and “Shinsei Bank Smart Card Loan Plus” are combined on a management accounting basis.3 Others include the results of the Consumer Finance Sub-Group and its subsidiaries.
28
INDIVIDUAL BUSINESS

Management’s Discussion and Analysis of Financial Condition and Results of Operations
SHINSEI BANK, LIMITED Integrated Report 2019
2019/07/17 13:02:21 / 19509941_株式会社新生銀行_総会その他(C)
RESULTS OF OPERATIONS (CONSOLIDATED) (continued)
The Individual Business recorded an ordinary business profit after net credit costs of ¥23.3 billion in fiscal year 2018, compared to ¥19.0 billion in the previous fiscal year.
RETAIL BANKINGThe Retail Banking Business recorded total revenue of ¥26.9 billion in the fiscal year ended March 31, 2019, compared to ¥23.5 billion in the previous fiscal year. Of this amount, net interest income was ¥23.9 billion in the fiscal year ended March 31, 2019, compared to ¥22.4 billion recorded in the previous fiscal year. This was primarily the result of the increase in income from foreign currency deposits. Noninterest income totaled ¥2.9 billion in the fiscal year ended March 31, 2019, an increase from the ¥1.0 billion recorded in the previous fiscal year. This was due to the increase in income related to sales of asset management products, the impact of establishing ATM fees for some customers in conjunction with the revision of the Shinsei Step Up Program, and other factors. General and administrative expenses totaled ¥27.6 billion in fiscal year 2018, a decline compared to the ¥29.2 billion recorded in the previous fiscal year. This was the result of the continued pursuit of efficiency and rationalization across all businesses. Net credit recovery of ¥0.0 billion (¥24 million) were recorded in fiscal year 2018, compared to costs of ¥0.1 billion in the previous fiscal year. As a result of the preceding factors, an ordinary business loss after net credit costs of ¥0.7 billion was recorded in the fiscal year ended March 31, 2019, compared to a loss of ¥5.8 billion recorded in the previous fiscal year.
SHINSEI FINANCIALShinsei Financial recorded an ordinary business profit after net credit costs after related consolidation adjustments of ¥21.2 billion in the fiscal year ended March 31, 2019, compared to ¥13.7 billion in the previous fiscal year. Total revenue was ¥69.2 billion in fiscal year 2018, compared to ¥68.9 billion in the previous fiscal year, primarily the result of the increase in loan interest in the unsecured loan business. General and administrative expenses totaled ¥33.4 billion in fiscal year 2018, a increase compared to the ¥32.4 billion recorded in the previous fiscal year. Net credit costs were ¥14.5 billion in fiscal year 2018, a decline compared to ¥22.7 billion in fiscal year 2017. The Bank continued to engage in rigorous credit control in addition to strengthening collection capabilities. In addition, a reversal of reserves was posted due to weak growth of operating assets.
APLUS FINANCIALAPLUS FINANCIAL recorded an ordinary business profit after net credit costs after related consol idat ion adjustments of ¥3.1 billion in the fiscal year ended March 31, 2019, compared to ¥9.1 billion in the previous fiscal year. Total revenue in the fiscal year 2018 was ¥57.8 billion, increased from ¥56.4 billion recorded in the previous fiscal year. Of this amount, net interest income was ¥10.7 billion, decreased from ¥11.3 billion in the previous fiscal year, as the loan balance was steady due to the decline in the loan balance on loan cards and other factors. Noninterest income was ¥47.1 billion, compared to ¥45.0 billion in the previous fiscal year, due to the strong performance by the installment sales credit and credit card businesses. General and administrative expenses were ¥38.1 billion in fiscal year 2018, an increase from ¥36.6 billion in the previous fiscal year. This was due to an increase in expenses related to the launch of a new system for credit cards, despite the continued pursuit of efficiency and rationalization in our businesses. Net credit costs were ¥16.5 billion in fiscal year 2018, compared to ¥10.6 billion in the previous fiscal year. This increase was due to the accumulation of loan-loss reserves on long-term delinquent receivables. Others include the results of the Consumer Finance Sub-Group and its subsidiaries.
INTEREST REPAYMENTIn the fiscal year ended March 31, 2018, Shinsei Financial reversed ¥11.8 billion in reserves for losses on interest repayments, whereas Shinsei Personal Loan and APLUS FINANCIAL made provisions of additional reserves totaling ¥2.7 billion and ¥3.0 billion, respectively. However, in the f i s ca l yea r ended March 31 , 2019 , fo l low ing a recalculation of the necessary amount of reserves required to cover future overpayment burden based on recent interest repayment trends, Shinsei Financial reversed ¥5.6 billion and Shinsei Personal Loan ¥0.1 billion of reserves for losses on interest repayments respectively, while APLUS FINANCIAL made provisions of additional reserves totaling ¥3.5 billion. Shinsei Financial’s usage of reserves for losses on interest repayments (interest repayments and related principal amortization) was ¥5.2 billion in the fiscal year ended March 31, 2019, compared to ¥14.8 billion utilized in the previous fiscal year. As ¥5.6 billion of reserves for losses on interest repayments were reversed in the fiscal year 2018, the total balance of reserves for losses on interest repayments was ¥50.1 billion as of March 31, 2019, compared to ¥61.1 billion as of March 31, 2018.
29
INDIVIDUAL BUSINESS

Management’s Discussion and Analysis of Financial Condition and Results of Operations
SHINSEI BANK, LIMITED Integrated Report 2019
2019/07/17 13:02:21 / 19509941_株式会社新生銀行_総会その他(C)
RESULTS OF OPERATIONS (CONSOLIDATED) (continued)
Shinsei Personal Loan’s usage of reserves for losses on interest repayments (interest repayments and related principal amortization) in the fiscal year ended March 31, 2019 was ¥1.5 billion, compared to ¥2.3 billion in the previous fiscal year. In fiscal year 2018, a reversal of ¥0.1 billion of reserves for losses on interest repayments was newly made, and the total balance of reserves for losses on interest repayments was ¥5.6 billion as of March 31, 2019, compared to ¥7.4 billion as of March 31, 2018.
APLUS FINANCIAL and its consolidated subsidiaries’ usage of reserves for losses on interest repayments (interest repayments and related principal amortization) was ¥2.4 billion in the fiscal year ended March 31, 2019, compared to ¥3.9 billion utilized in the previous fiscal year. In the fiscal year 2018, an additional ¥3.5 billion has been provisioned as reserves for losses on interest repayments were made and the total balance of reserves for losses on interest repayments was ¥7.1 billion as of March 31, 2019, compared to ¥6.1 billion as of March 31, 2018.
30
INDIVIDUAL BUSINESS
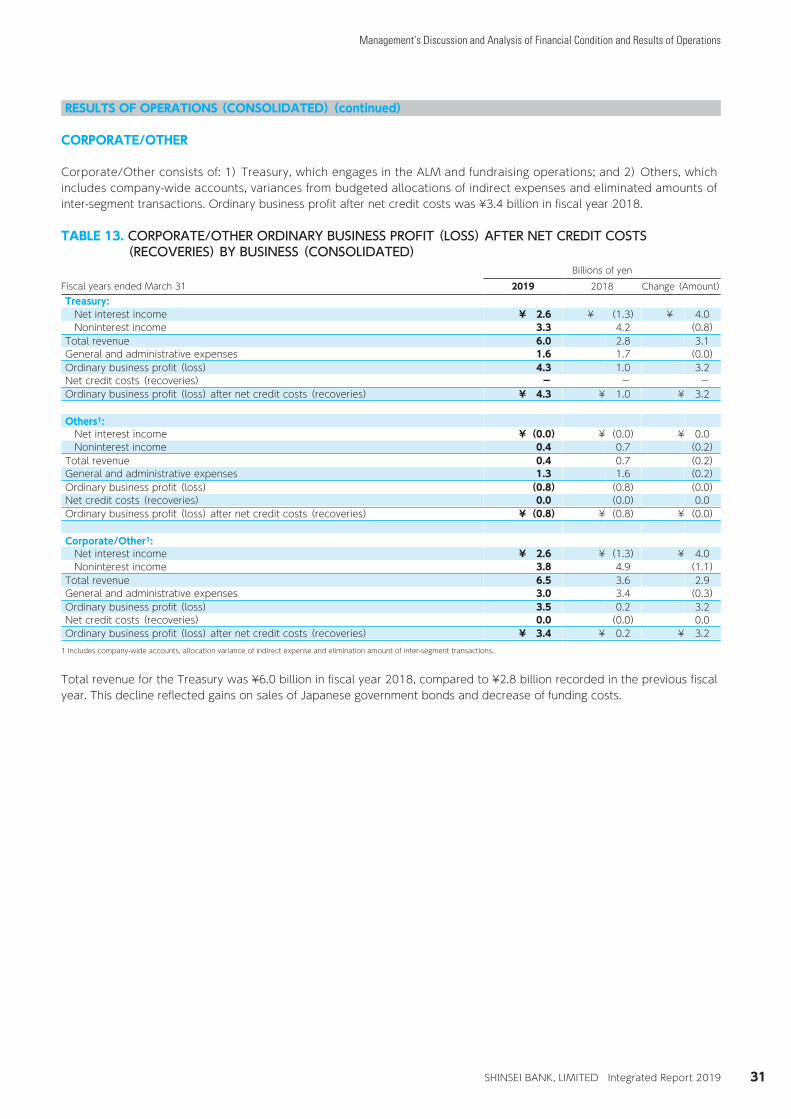
Management’s Discussion and Analysis of Financial Condition and Results of Operations
SHINSEI BANK, LIMITED Integrated Report 2019
2019/07/17 13:02:21 / 19509941_株式会社新生銀行_総会その他(C)
RESULTS OF OPERATIONS (CONSOLIDATED) (continued)
CORPORATE/OTHER
Corporate/Other consists of: 1) Treasury, which engages in the ALM and fundraising operations; and 2) Others, which includes company-wide accounts, variances from budgeted allocations of indirect expenses and eliminated amounts of inter-segment transactions. Ordinary business profit after net credit costs was ¥3.4 billion in fiscal year 2018.
TABLE 13. CORPORATE/OTHER ORDINARY BUSINESS PROFIT (LOSS) AFTER NET CREDIT COSTS(RECOVERIES) BY BUSINESS (CONSOLIDATED)
Billions of yenFiscal years ended March 31 2019 2018 Change (Amount)Treasury:
Net interest income ¥ 2.6 ¥ (1.3) ¥ 4.0Noninterest income 3.3 4.2 (0.8)
Total revenue 6.0 2.8 3.1General and administrative expenses 1.6 1.7 (0.0)Ordinary business profit (loss) 4.3 1.0 3.2Net credit costs (recoveries) - - -Ordinary business profit (loss) after net credit costs (recoveries) ¥ 4.3 ¥ 1.0 ¥ 3.2
Others1:Net interest income ¥ (0.0) ¥ (0.0) ¥ 0.0Noninterest income 0.4 0.7 (0.2)
Total revenue 0.4 0.7 (0.2)General and administrative expenses 1.3 1.6 (0.2)Ordinary business profit (loss) (0.8) (0.8) (0.0)Net credit costs (recoveries) 0.0 (0.0) 0.0Ordinary business profit (loss) after net credit costs (recoveries) ¥ (0.8) ¥ (0.8) ¥ (0.0)
Corporate/Other1:Net interest income ¥ 2.6 ¥ (1.3) ¥ 4.0Noninterest income 3.8 4.9 (1.1)
Total revenue 6.5 3.6 2.9General and administrative expenses 3.0 3.4 (0.3)Ordinary business profit (loss) 3.5 0.2 3.2Net credit costs (recoveries) 0.0 (0.0) 0.0Ordinary business profit (loss) after net credit costs (recoveries) ¥ 3.4 ¥ 0.2 ¥ 3.2
1 Includes company-wide accounts, allocation variance of indirect expense and elimination amount of inter-segment transactions.
Total revenue for the Treasury was ¥6.0 billion in fiscal year 2018, compared to ¥2.8 billion recorded in the previous fiscal year. This decline reflected gains on sales of Japanese government bonds and decrease of funding costs.
31
CORPORATE/OTHER

Management’s Discussion and Analysis of Financial Condition and Results of Operations
SHINSEI BANK, LIMITED Integrated Report 2019
2019/07/17 13:02:21 / 19509941_株式会社新生銀行_総会その他(C)
RESULTS OF OPERATIONS (NONCONSOLIDATED)
OVERVIEW
We disclose nonconsolidated financial information in addition to our consolidated financial statements. As a recipient of public funds, we are required by the Financial Services Agency of Japan (“FSA”) to update and report on nonconsolidated performance in relation to targets set forth in our Revitalization Plan on a quarterly basis and to publicly disclose that information semi-annually. Shinsei recorded net income of ¥35.4 bill ion on a
nonconsolidated basis for the fiscal year ended March 31, 2019. Dif ferences between the net incomes on a nonconsolidated basis and consolidated basis result mainly from the gains and losses from our consolidated subsidiaries, including Showa Leasing, Shinsei Financial, APLUS FINANCIAL and Shinsei Personal Loan, the gains and losses on our investment in our equity-method affiliate, Jih Sun Financial Holding Co., Ltd., and the div idends received f rom our major consol idated subsidiaries.
TABLE 14. COMPARISON OF TARGETS AND RESULTS FOR KEY MEASURES IN THE REVITALIZATION PLAN(NONCONSOLIDATED)
Billions of yen (except percentages)2019 2018
Fiscal years ended March 31 Target Actual Target ActualNet income ¥ 32.0 ¥ 35.4 ¥ 36.0 ¥ 40.5Total expenses (without taxes)1 69.5 65.6 76.5 73.4Return on equity based on net business profit2 4.3% 4.4% 3.0% 3.9%
1 Equals Shinsei’s total general and administrative expenses excluding business taxes such as consumption tax.2 Equals net business profit (jisshitsu gyomu jun-eki), as such term is defined under “Supplemental Measures” below, divided by average total equity excluding stock acquisition rights.
SUPPLEMENTAL MEASURES
In addit ion to the reporting items set forth in our nonconsolidated financial statements, the Banking Act of Japan requires us to disclose gross business profit (gyomu sorieki) on a nonconsolidated basis. Furthermore, in the Japanese banking industry, net business profit (jisshitsu gyomu jun-eki) has traditionally been used as a measure of the profitability of core banking operations. We review these non Japanese GAAP performance measures in monitoring the results of our operations. Gross business profit (gyomu sorieki) is the sum of:
• net interest income, which excludes interest expense related to investment in monetary assets held in trust;
• net fees and commissions, which includes net gain (loss) on monetary assets held in trust (in keeping with the definition of gross business profit in our Revitalization Plan);
• net trading income; and
• net other business income, which excludes net gain (loss) on monetary assets held in trust and on equity securities.
Net business profit (jisshitsu gyomu jun-eki) is gross business profit (gyomu sorieki) minus nonconsolidated e x p e n s e s , w h i c h c o r r e s p o n d s t o g e n e r a l a n d administrative expenses adjusted for certain items. While these non Japanese GAAP business profit measures should not be viewed as a substitute for net income, management believes that these measures provide a meaningful way of comparing a number of the important components of Shinsei ’s revenues and profitability from year to year. The following table sets forth these supplemental financial data and corresponding reconciliations to net income under Japanese GAAP for the fiscal years ended March 31, 2019 and 2018.
32
RESULTS OF OPERATIONS (NONCONSOLIDATED)
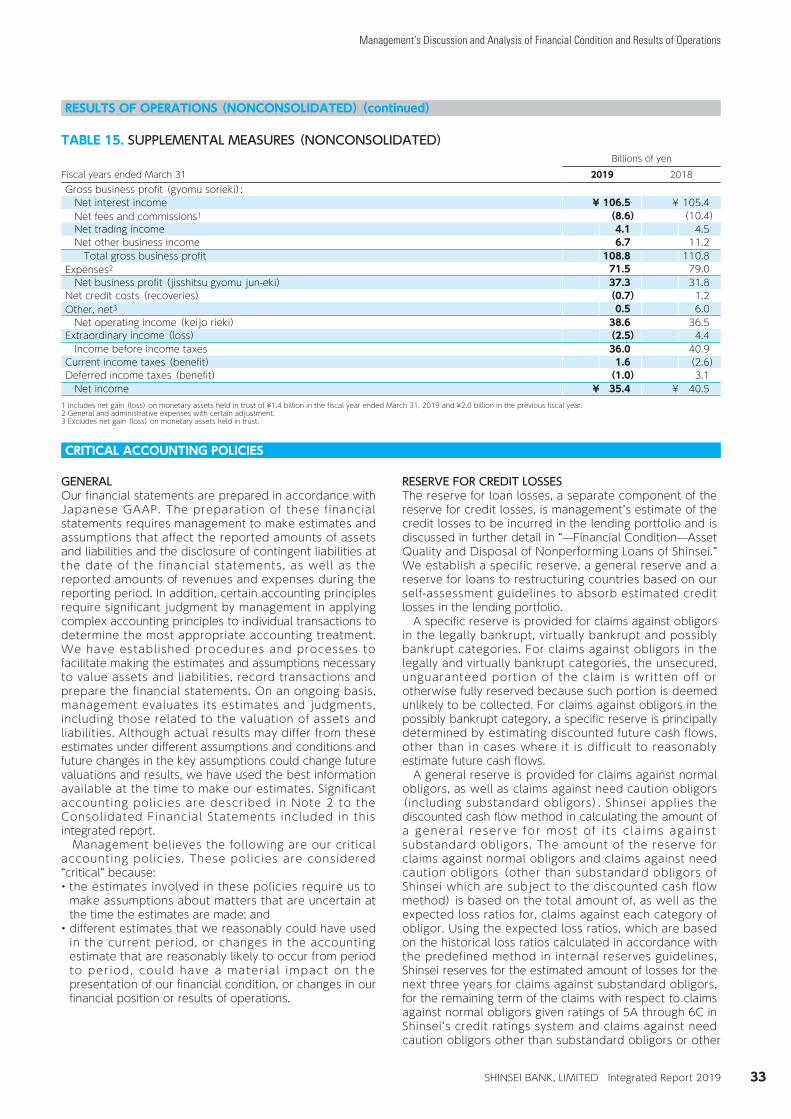
Management’s Discussion and Analysis of Financial Condition and Results of Operations
SHINSEI BANK, LIMITED Integrated Report 2019
2019/07/17 13:02:21 / 19509941_株式会社新生銀行_総会その他(C)
RESULTS OF OPERATIONS (NONCONSOLIDATED) (continued)
TABLE 15. SUPPLEMENTAL MEASURES (NONCONSOLIDATED)Billions of yen
Fiscal years ended March 31 2019 2018Gross business profit (gyomu sorieki):
Net interest income ¥ 106.5 ¥ 105.4Net fees and commissions1 (8.6) (10.4)Net trading income 4.1 4.5Net other business income 6.7 11.2
Total gross business profit 108.8 110.8Expenses2 71.5 79.0
Net business profit (jisshitsu gyomu jun-eki) 37.3 31.8Net credit costs (recoveries) (0.7) 1.2Other, net3 0.5 6.0
Net operating income (keijo rieki) 38.6 36.5Extraordinary income (loss) (2.5) 4.4
Income before income taxes 36.0 40.9Current income taxes (benefit) 1.6 (2.6)Deferred income taxes (benefit) (1.0) 3.1
Net income ¥ 35.4 ¥ 40.51 Includes net gain (loss) on monetary assets held in trust of ¥1.4 billion in the fiscal year ended March 31, 2019 and ¥2.0 billion in the previous fiscal year.2 General and administrative expenses with certain adjustment.3 Excludes net gain (loss) on monetary assets held in trust.
CRITICAL ACCOUNTING POLICIES
GENERALOur financial statements are prepared in accordance with Japanese GAAP. The preparation of these financial statements requires management to make estimates and assumptions that affect the reported amounts of assets and liabilities and the disclosure of contingent liabilities at the date of the financial statements, as well as the reported amounts of revenues and expenses during the reporting period. In addition, certain accounting principles require significant judgment by management in applying complex accounting principles to individual transactions to determine the most appropriate accounting treatment. We have established procedures and processes to facilitate making the estimates and assumptions necessary to value assets and liabilities, record transactions and prepare the financial statements. On an ongoing basis, management evaluates its estimates and judgments, including those related to the valuation of assets and liabilities. Although actual results may differ from these estimates under different assumptions and conditions and future changes in the key assumptions could change future valuations and results, we have used the best information available at the time to make our estimates. Significant accounting policies are described in Note 2 to the Consolidated Financial Statements included in this integrated report. Management believes the following are our critical accounting policies. These policies are considered “critical” because:
• the estimates involved in these policies require us to make assumptions about matters that are uncertain at the time the estimates are made; and
• different estimates that we reasonably could have used in the current period, or changes in the accounting estimate that are reasonably likely to occur from period to per iod, could have a mater ia l impact on the presentation of our financial condition, or changes in our financial position or results of operations.
RESERVE FOR CREDIT LOSSESThe reserve for loan losses, a separate component of the reserve for credit losses, is management’s estimate of the credit losses to be incurred in the lending portfolio and is discussed in further detail in “—Financial Condition—Asset Quality and Disposal of Nonperforming Loans of Shinsei.” We establish a specific reserve, a general reserve and a reserve for loans to restructuring countries based on our self-assessment guidelines to absorb estimated credit losses in the lending portfolio. A specific reserve is provided for claims against obligors in the legally bankrupt, virtually bankrupt and possibly bankrupt categories. For claims against obligors in the legally and virtually bankrupt categories, the unsecured, unguaranteed portion of the claim is written off or otherwise fully reserved because such portion is deemed unlikely to be collected. For claims against obligors in the possibly bankrupt category, a specific reserve is principally determined by estimating discounted future cash flows, other than in cases where it is difficult to reasonably estimate future cash flows. A general reserve is provided for claims against normal obligors, as well as claims against need caution obligors (including substandard obligors). Shinsei applies the discounted cash flow method in calculating the amount of a genera l reserve for most o f i t s c la ims aga inst substandard obligors. The amount of the reserve for claims against normal obligors and claims against need caution obligors (other than substandard obligors of Shinsei which are subject to the discounted cash flow method) is based on the total amount of, as well as the expected loss ratios for, claims against each category of obligor. Using the expected loss ratios, which are based on the historical loss ratios calculated in accordance with the predefined method in internal reserves guidelines, Shinsei reserves for the estimated amount of losses for the next three years for claims against substandard obligors, for the remaining term of the claims with respect to claims against normal obligors given ratings of 5A through 6C in Shinsei’s credit ratings system and claims against need caution obligors other than substandard obligors or other
33
RESULTS OF OPERATIONS (NONCONSOLIDATED)、CRITICAL ACCOUNTING POLICIES

Management’s Discussion and Analysis of Financial Condition and Results of Operations
SHINSEI BANK, LIMITED Integrated Report 2019
2019/07/17 13:02:21 / 19509941_株式会社新生銀行_総会その他(C)
CRITICAL ACCOUNTING POLICIES (continued)
need caution obligors, and for the next year for claims against normal obligors given ratings higher than 5A. Shinsei reviews its classification of obligors quarterly, although every month it downgrades obligors whose financial condition has deteriorated based on the results of its self-assessment process. A reserve for loans to restructuring countries is provided for estimated losses on those loans due to political and economic conditions in the countries. Estimating Shinsei’s specific reserve for claims against obligors in the possibly bankrupt category and the general reserve for claims against obligors in the substandard category is subject to a number of significant judgments and uncertainties regarding discounted cash flows due to the changing financial conditions of the obligors and general economic conditions surrounding the obligors’ business operations. In addition, because the secured portion of claims is not covered by a specific reserve, actual losses on such claims are also subject to significant judgments and uncertainties regarding the fair value of collateral. Estimating the general reserve for claims against obligors in the normal and other need caution categories could be affected by changes made by management in the methodologies used to calculate the migration analyses of obligors or the assumptions used in the calculation of the reserve. As a result, actual losses in the nonperforming loans portfolio could be greater or lesser than we have estimated. If the estimated credit losses are not enough to cover actual losses incurred from the ultimate disposition of the portfolio, it would result in additional write-offs or additional reserves in the future for the lending portfolio, increasing our reported total credit costs. If the estimate is in excess of actual losses, it would result in a reduction of our total credit costs. APLUS FINANCIAL establishes loan loss reserves based on the historical loss ratio for delinquent and non delinquent accounts. The amount of reserves in the case of delinquent accounts primarily depends on the number of months for which a particular account is past due. In addition, APLUS FINANCIAL writes off the entire amount of any claims it deems uncollectible, either as a result of personal bankruptcy or otherwise. Shinsei Financial and Shinsei Personal Loan establish loan loss reserves in the same manner as APLUS FINANCIAL, and Showa Leasing establishes reserves on the basis of obligor classification in accordance with its self-assessment guidelines.
RESERVE FOR REIMBURSEMENT OF DEBENTURESThe reserve for reimbursement of debentures is provided for estimated losses on future reimbursement requests of debentures derecognized from liabilities based on past experience. If any of the assumptions change due to changes in circumstances, an additional reserve could become necessary.
RESERVE FOR LOSSES ON INTEREST REPAYMENTSWe follow “Audit Guidelines on Consumer Finance Compan ie s ’ P rov i s i on s f o r Pos s i b l e Lo s se s on Reimbursements of Excess Interest Payments” issued by the Japanese Institute of Certified Public Accountants (the “JICPA”). These guidelines stipulate that consumer and commercial finance companies make certain provisions for possible losses on reimbursements of excess interest payments and loan losses related to consumer finance loans extended at interest rates in excess of the maximum interest rate prescribed in the Interest Rate Restriction Act of Japan. The reserve is established in the amount of the estimated future reimbursement requests based on past experience. If any of the assumptions change due to changes in circumstances, an additional reserve could become necessary.
VALUATION OF FINANCIAL INSTRUMENTSMEASURED AT FAIR VALUEWe have various types of financial instruments in our trading and banking books. Pursuant to Japanese GAAP, we record some of our financial instruments at their fair values, which are measured based on market prices or third-party quotes or, if both are unavailable, our internal valuation methodologies. Although we strive to follow market standards in making assumptions and determining scenarios necessary for these valuation methodologies, the outcomes of our methodologies could differ from those derived from other methodologies.
AVAILABLE-FOR-SALE SECURITIESWe record available-for-sale securities, both debt and equity, at their fair values except for securities whose fair value cannot be rel iably determined, such as non marketable equity securities, etc. The net unrealized gains or losses on these securit ies are included in and presented as a separate component of equity. Available-for-sale securities include some securities without readily obtainable market prices or quotes. These securities primarily consist of residual interests and debt investments in collateralized debt obligations as well as illiquid corporate bonds. We estimate the fair values of these securities based on historical data concerning market prices and quotes. In some cases, we determine fair value using internal valuation methodologies that are subject to complex assumptions, including those relating to scenarios, interest rates and volatility.
34
CRITICAL ACCOUNTING POLICIES
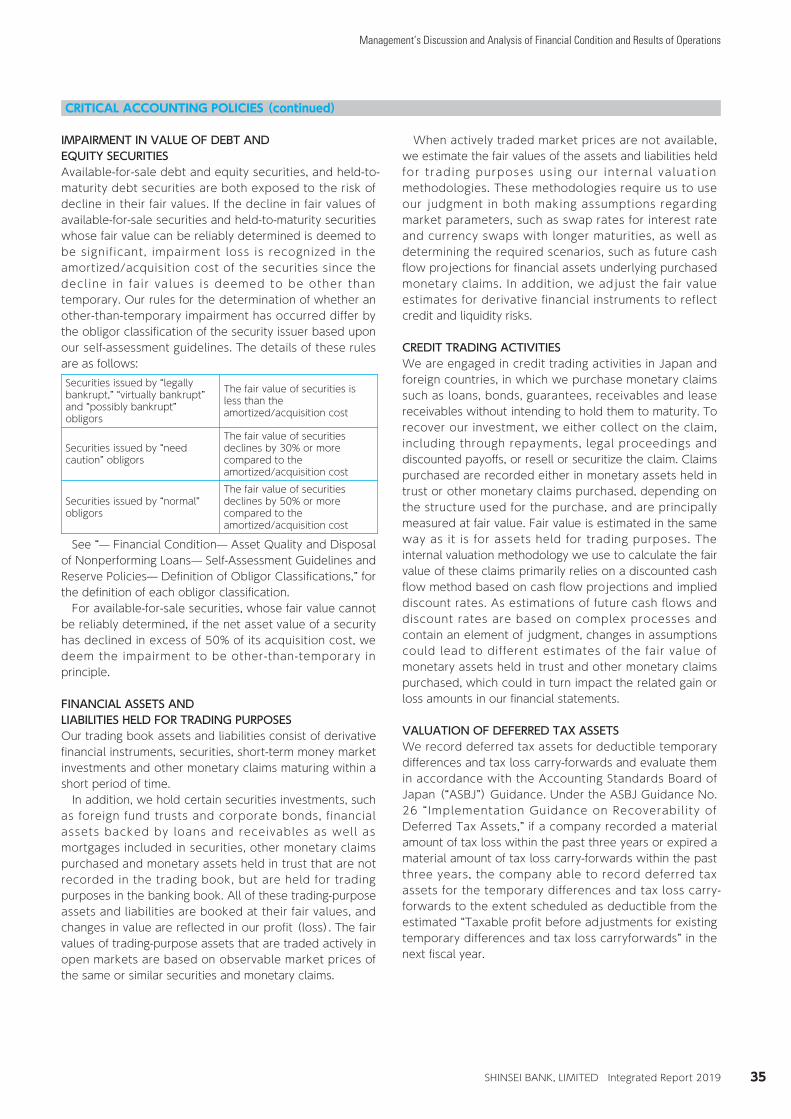
Management’s Discussion and Analysis of Financial Condition and Results of Operations
SHINSEI BANK, LIMITED Integrated Report 2019
2019/07/17 13:02:21 / 19509941_株式会社新生銀行_総会その他(C)
CRITICAL ACCOUNTING POLICIES (continued)
IMPAIRMENT IN VALUE OF DEBT ANDEQUITY SECURITIESAvailable-for-sale debt and equity securities, and held-to-maturity debt securities are both exposed to the risk of decline in their fair values. If the decline in fair values of available-for-sale securities and held-to-maturity securities whose fair value can be reliably determined is deemed to be significant, impairment loss is recognized in the amortized/acquisition cost of the securities since the decl ine in fair values is deemed to be other than temporary. Our rules for the determination of whether an other-than-temporary impairment has occurred differ by the obligor classification of the security issuer based upon our self-assessment guidelines. The details of these rules are as follows:Securities issued by “legally bankrupt,” “virtually bankrupt” and “possibly bankrupt” obligors
The fair value of securities is less than the amortized/acquisition cost
Securities issued by “need caution” obligors
The fair value of securities declines by 30% or more compared to the amortized/acquisition cost
Securities issued by “normal” obligors
The fair value of securities declines by 50% or more compared to the amortized/acquisition cost
See “— Financial Condition— Asset Quality and Disposal of Nonperforming Loans— Self-Assessment Guidelines and Reserve Policies— Definition of Obligor Classifications,” for the definition of each obligor classification. For available-for-sale securities, whose fair value cannot be reliably determined, if the net asset value of a security has declined in excess of 50% of its acquisition cost, we deem the impairment to be other-than-temporary in principle.
FINANCIAL ASSETS ANDLIABILITIES HELD FOR TRADING PURPOSESOur trading book assets and liabilities consist of derivative financial instruments, securities, short-term money market investments and other monetary claims maturing within a short period of time. In addition, we hold certain securities investments, such as foreign fund trusts and corporate bonds, financial assets backed by loans and receivables as well as mortgages included in securities, other monetary claims purchased and monetary assets held in trust that are not recorded in the trading book, but are held for trading purposes in the banking book. All of these trading-purpose assets and liabilities are booked at their fair values, and changes in value are reflected in our profit (loss). The fair values of trading-purpose assets that are traded actively in open markets are based on observable market prices of the same or similar securities and monetary claims.
When actively traded market prices are not available, we estimate the fair values of the assets and liabilities held for trading purposes using our internal valuat ion methodologies. These methodologies require us to use our judgment in both making assumptions regarding market parameters, such as swap rates for interest rate and currency swaps with longer maturities, as well as determining the required scenarios, such as future cash flow projections for financial assets underlying purchased monetary claims. In addition, we adjust the fair value estimates for derivative financial instruments to reflect credit and liquidity risks.
CREDIT TRADING ACTIVITIESWe are engaged in credit trading activities in Japan and foreign countries, in which we purchase monetary claims such as loans, bonds, guarantees, receivables and lease receivables without intending to hold them to maturity. To recover our investment, we either collect on the claim, including through repayments, legal proceedings and discounted payoffs, or resell or securitize the claim. Claims purchased are recorded either in monetary assets held in trust or other monetary claims purchased, depending on the structure used for the purchase, and are principally measured at fair value. Fair value is estimated in the same way as it is for assets held for trading purposes. The internal valuation methodology we use to calculate the fair value of these claims primarily relies on a discounted cash flow method based on cash flow projections and implied discount rates. As estimations of future cash flows and discount rates are based on complex processes and contain an element of judgment, changes in assumptions could lead to different estimates of the fair value of monetary assets held in trust and other monetary claims purchased, which could in turn impact the related gain or loss amounts in our financial statements.
VALUATION OF DEFERRED TAX ASSETSWe record deferred tax assets for deductible temporary differences and tax loss carry-forwards and evaluate them in accordance with the Accounting Standards Board of Japan (“ASBJ”) Guidance. Under the ASBJ Guidance No. 26 “Implementation Guidance on Recoverability of Deferred Tax Assets,” if a company recorded a material amount of tax loss within the past three years or expired a material amount of tax loss carry-forwards within the past three years, the company able to record deferred tax assets for the temporary differences and tax loss carry-forwards to the extent scheduled as deductible from the estimated “Taxable profit before adjustments for existing temporary differences and tax loss carryforwards” in the next fiscal year.
35
CRITICAL ACCOUNTING POLICIES

Management’s Discussion and Analysis of Financial Condition and Results of Operations
SHINSEI BANK, LIMITED Integrated Report 2019
2019/07/17 13:02:21 / 19509941_株式会社新生銀行_総会その他(C)
CRITICAL ACCOUNTING POLICIES (continued)
As a result of that we recorded tax loss in the past three years, we recorded deferred tax assets for the temporary differences and tax loss carry-forwards to the extent scheduled as deductible in the next fiscal year. We recorded a valuation allowance to reduce deferred tax assets accordingly. The actual taxable profit amount for the fiscal year ended March 31, 2020 may be different from our estimate.
EMPLOYEES’ RETIREMENT BENEFITS ANDPENSION PLAN ASSETSThe Bank has a noncontributory defined benefit pension plan. APLUS Co., Ltd. (“APLUS”) and Showa Leasing have a noncontributory defined benefit pension plan and an unfunded severance indemnity plan. Shinsei Financial and certain consolidated domestic subsidiaries have unfunded severance indemnity plans. These plans cover substantially all of the Group’s employees. Assets and liabilities for employees’ retirement benefits are held for the payment of employees’ retirement benefits based on the estimated amounts of the projected benefit obligation and the estimated value of pension plan assets at the end of the period. We follow the accounting standard and guideline for employees’ retirement benefit plans issued by the ASBJ and estimate the amounts of the projected benefit obligation and the fair value of pension plan assets at the end of the fiscal year using assumptions for the long-term expected rate of return on plan assets and the discount rate. We determine the long-term expected rate of return on plan assets based on the targeted average long-term performance of the assets. Because assumptions regarding the long-term expected rate of return on plan assets are affected by changing general economic and market conditions, we need to make significant judgments to determine appropriate assumptions underlying the estimate of long-term performance, which also impact the estimate of the liabilities for employees’ retirement benefits and net periodic retirement benefit cost. We have applied the method of allocating the projected benefit obligations over the period on a benefit formula basis and selected a single weighted average discount rate of highly graded corporate bonds reflecting the estimated timing and amount of benefit payments. If we become aware of information that leads us to determine that a different discount rate for settling the benefit obligation is required, the discount rate could be changed accordingly, which may have an impact on the related amounts reported in our financial statements.
HEDGE ACCOUNTINGWe follow guidelines issued by the JICPA regarding hedge accounting applicable to financial assets and liabilities exposed to a risk of change in fair value or cash flow. Derivative transactions that meet the hedge accounting criteria are primarily accounted for using a deferral method whereby unrealized gains and losses are deferred in a separate component of equity until the gains and losses on the hedged items are realized. The Bank adopted portfolio hedging in accordance with Industry Audit Committee Report No. 24 issued, on February 13, 2002, by the JICPA. Under portfolio hedging activities to mitigate the change in fair value, a portfolio of hedged items with common maturities such as deposits or loans is designated and matched with a group of hedging instruments such as interest rate swaps, which offset the effect of fair value fluctuations of the hedged items by identified maturities. The effectiveness of the portfolio hedging is assessed by each group. As for portfolio hedging activities to fix the cash flows, the effectiveness is assessed based on the correlation between the base interest rate index of the hedged cash flow and that of the hedging instrument. The interest rate swaps of certain consolidated subsidiaries which qualify for hedge accounting and meet specific matching criteria are not measured at fair values, but the net payments or receipts under the swap agreements are recognized and included in interest expenses or income. The Bank applies either deferral hedge accounting or fair value hedge accounting in accordance with Industry Audit Committee Report No. 25 issued, on July 29, 2002, by the JICPA, to the derivative transactions that meet the hedge accounting criteria for mitigating foreign currency fluctuation risks of its financial assets and liabilities such as funding swap and certain currency swap transactions. Funding swap transactions are foreign exchange swaps, and consist of spot foreign exchange contracts bought or sold and forward foreign exchange contracts bought or sold. Such transactions are contracted for the purpose of lending or borrowing in a di f ferent currency and converting the corresponding principal equivalents and foreign currency equivalents to pay and receive, whose amounts and due dates are predetermined at the time of the transactions, into forward foreign exchange contracts bought or sold. Under deferral hedge accounting, hedged items are identified by grouping the foreign currency-denominated financial assets and liabilities by currencies and designating derivative transactions such as currency swap transactions and forward exchange contracts as hedging instruments. Hedge effectiveness is assessed by confirming that the total foreign currency position of the hedged items is equal to or larger than that of hedging instruments.
36
CRITICAL ACCOUNTING POLICIES

Management’s Discussion and Analysis of Financial Condition and Results of Operations
SHINSEI BANK, LIMITED Integrated Report 2019
2019/07/17 13:02:21 / 19509941_株式会社新生銀行_総会その他(C)
CRITICAL ACCOUNTING POLICIES (continued)
In accordance with Industry Audit Committee Report No. 25 of the JICPA, the Bank also applies deferral hedge accounting and fair value hedge accounting to translation gains or losses from foreign currency assets of net investments in foreign nonconsolidated subsidiaries, affiliates and securities available for sale (other than bonds denominated in foreign currencies) when such foreign currency exposures recorded as assets are hedged with offsetting foreign currency liabilities and the liabilities exceed the acquisition cost of such foreign currency assets.
IMPAIRMENT OF LONG-LIVED ASSETSWe review our long-lived assets for impairment whenever events or changes in circumstances indicate that the carrying amount of an asset or asset group may not be recoverable. Impairment losses on an asset or asset group establish a new cost basis for the assets. We evaluate our long-lived assets for impairment using our best estimates based on reasonable and supportable assumptions and projections. An impairment loss would be recognized if the carrying amount of an asset or asset group exceeds the sum of the undiscounted future cash flows expected to result from the continued use and eventual disposition of an asset or asset group. The impairment loss would be measured as the amount by which the carrying amount of the asset exceeds its recoverable amount, which is the higher of the sum of discounted cash flows from the continuing use and eventual disposition of the asset, or the net selling price at disposition.
BUSINESS COMBINATIONSFor consolidated financial statement purposes, assets and liabilities of acquired subsidiaries are recorded primarily on the basis of their estimated fair values at the date of the acquisition. We acquired controlling interests in APLUS FINANCIAL and Showa Leasing on September 29, 2004 and March 23, 2005, respectively. Regarding Showa Leasing, we acquired 100% of the controlling interest, through additional acquisition and a share exchange on June 30, 2016 and December 1, 2016, respectively. On December 13, 2007, we acquired a controlling interest in Shinsei Personal Loan, which was previously an affiliate, through the purchase of additional shares. On September 22, 2008, the Bank, together with APLUS FINANCIAL, acquired 100% of the controlling interest (equity and debt) in Shinsei Financial, and its subsidiaries.
In connect ion with the consol idat ion of APLUS FINANCIAL, Showa Leasing, Shinsei Personal Loan and Shinsei Financial, we recognized the assets (including intangibles) and liabilities of those entities primarily at their fair values. We used quoted market prices in active markets as the best evidence of fair value, where available. If quoted market prices were not available, the estimate of fair value was based on the best information available, including prices for similar assets and liabilities and the results using other fair value measurement methodologies. We adopted the following methodologies based on the nature of the assets and liabilities being valued and the availability of information:• market approach: market transactions involving the sale
of comparable assets.• income approach: present value of earnings attributable
to the asset. As a result of fair value recognition, reserves for credit losses were offset with the corresponding loans or other assets. We also recognized certain identifiable intangible assets in connection with the acquisition of Showa Leasing, Shinsei Financial and their consolidated subsidiaries, because they were separable such as contractual or other legal rights. The identified intangible assets consist of trade names and customer and/or merchant relationships, among others, which are valued using variations of the income approach and which are being amortized over various periods and using different methodologies depending on the nature of the asset. See Note 2 (B) to the Consolidated Financial Statements. The excess of the purchase price over the fair value of the net assets acquired, including identified intangible assets, was recorded as goodwill and is being amortized on a consistent basis primarily over 20 years. The amortization period of 20 years is the maximum period allowed under Japanese GAAP and was determined based upon the Bank’s business strategy. With regard to the acquisitions executed before April 1, 2010, recorded with the previous accounting standard, when the purchase price was lower than the fair value of the net assets acquired, including identified intangible assets, the difference was recorded as negative goodwill and has been amortized on a straight-line basis primarily over 20 years, which is the maximum period allowed under the previous accounting standards. Any unamortized balances of identified intangible assets and goodwill are subject to impairment testing periodically.
37
CRITICAL ACCOUNTING POLICIES

Management’s Discussion and Analysis of Financial Condition and Results of Operations
SHINSEI BANK, LIMITED Integrated Report 2019
2019/07/17 13:02:21 / 19509941_株式会社新生銀行_総会その他(C)
CRITICAL ACCOUNTING POLICIES (continued)
IMPAIRMENT OF GOODWILL AND INTANGIBLEASSETS ACQUIRED IN BUSINESS COMBINATIONSThe Bank conducts impairment testing for goodwill and intangible assets acquired in business combinations as a result of certain triggering events including:• A result or an indication of an operating loss or negative
cash flow for two consecutive years
• Impairment of underlying investment securities is recognized
• A material adverse change in the business environment surrounding subsidiaries, such as a change in law which significantly and negatively impacts their business
• Management decisions that could have an adverse effect on the value of goodwill and intangible assets which were acquired in business combination
As the first step of the impairment test, we estimate the undiscounted future cash flows of the business. If the value of the undiscounted future cash flows is less than the book value of the net assets, including goodwill and intangible assets acquired in business combination, of the business, it is determined that impairment exists. The next step of the impairment test is to measure the amount of the impairment loss, which is to compare the “value in use,” which is recoverable amount calculated as the discounted value of future cash flows of the business, with the net asset book value which includes unamortized balances of goodwill and intangible assets acquired in business combination. Finally, the impairment loss on goodwill is calculated as the residual, (i) less (ii) below. ( i) Impairment loss for the total of goodwill and intangible assets acquired in business combination is recognized as an amount by which the net asset book value exceeds the “value in use.” The recoverable amount of intangible assets acquired in business combination is determined by discounted cash flow method, which is also used to measure the acquired assets, and ( i i) the impairment loss of intangible assets acquired in business combinations, is determined as the difference between the recoverable amount and book value.
ASSET RETIREMENT OBLIGATIONSAn asset retirement obligation is defined as a legal obligation imposed either by law or contract that results from the acquisition, construction, development and the normal operation of a tangible fixed asset. The asset retirement obligation is associated with the retirement of such tangible fixed asset. The asset retirement obligation is recognized as the sum of the discounted cash flows required for the future asset retirement and is recorded in the period in which the obligation is incurred. Upon initial recognition of a liability for an asset retirement obligation, an asset retirement cost is capitalized by increasing the carrying amount of the related fixed asset by the amount of the liability. The asset retirement cost is subsequently allocated to expense through depreciation over the remaining useful life of the asset. Over time, the liability is accreted to its present value each period. Any subsequent revisions to the timing or the amount of the original estimate of undiscounted cash flows are reflected as an adjustment to the carrying amount of the liability and the capitalized amount of the related asset retirement cost.
38
CRITICAL ACCOUNTING POLICIES

Management’s Discussion and Analysis of Financial Condition and Results of Operations
SHINSEI BANK, LIMITED Integrated Report 2019
2019/07/17 13:02:21 / 19509941_株式会社新生銀行_総会その他(C)
FINANCIAL CONDITION
TOTAL ASSETS
As of March 31, 2019, we had consolidated total assets of ¥9,571.1 billion, representing a 1.2% increase from March 31, 2018. The balance of loans and bills discounted as of March 31, 2019 was ¥4,986.8 billion, increased by ¥90.9 billion from ¥4,895.9 billion as of March 31, 2018. While the balance of housing loan has declined, this growth in the overall balance was supported by the increase of institutional client and Structured Finance's loan balances.
SECURITIES
The following table sets forth the composition of our consolidated portfolio of trading securities in the banking book, available-for-sale securities and held-to-maturity securities as of March 31, 2019. As reflected below, 56.2% of the securities will mature during the next five years. The balance of securities as of March 31, 2019 was ¥1,130.2 billion, increased compared to the balance of ¥1,123.5 billion as of March 31, 2018. 44.4% of the investments in securities consists of Japanese national government bonds for ALM purposes, including liquidity reserves. In the course of portfolio management, the total balance of Japanese national government bonds was ¥501.5 billion as of March 31, 2019, as compared to ¥504.5 billion as of March 31, 2018.
TABLE 16. SECURITIES BY MATURITY (CONSOLIDATED)Billions of yen
As of March 31, 2019
1 yearor less
Over1 year to3 years
Over3 years to
5 years
Over5 years to
7 years
Over7 years to10 years
Over10 years
Unspecifiedterm Total
Japanese national government bonds ¥ 119.9 ¥ 285.3 ¥ 6.1 ¥ - ¥ 50.2 ¥ 39.8 ¥ - ¥ 501.5Japanese local government bonds - - - - - - - -Japanese corporate bonds 2.2 38.3 76.9 12.7 16.8 24.0 - 171.1Japanese equity securities - - - - - - 30.6 30.6Foreign bonds and other 28.0 30.6 46.9 29.4 83.5 120.5 87.6 426.9Total securities ¥ 150.3 ¥ 354.4 ¥ 130.0 ¥ 42.1 ¥ 150.5 ¥ 184.4 ¥ 118.2 ¥ 1,130.2
Billions of yenAs of March 31, 2018
1 yearor less
Over1 year to3 years
Over3 years to
5 years
Over5 years to
7 years
Over7 years to10 years
Over10 years
Unspecifiedterm Total
Japanese national government bonds ¥ 120.0 ¥ 243.8 ¥ 119.3 ¥ - ¥ 21.2 ¥ - ¥ - ¥ 504.5Japanese local government bonds - - - - 2.3 - - 2.3Japanese corporate bonds 3.0 29.0 73.7 18.2 18.3 14.9 - 157.4Japanese equity securities - - - - - - 32.7 32.7Foreign bonds and other 46.9 14.3 53.9 38.1 83.6 97.5 91.8 426.5Total securities ¥ 170.1 ¥ 287.3 ¥ 247.1 ¥ 56.3 ¥ 125.5 ¥ 112.4 ¥ 124.5 ¥ 1,123.5
39
TOTAL ASSETS, SECURITIES

Management’s Discussion and Analysis of Financial Condition and Results of Operations
SHINSEI BANK, LIMITED Integrated Report 2019
2019/07/17 13:02:21 / 19509941_株式会社新生銀行_総会その他(C)
FINANCIAL CONDITION (continued)
LOAN PORTFOLIO
As of March 31, 2019, loans and bills discounted totaled ¥4,986.8 bi l l ion. This represented 52.1% of total consolidated assets. Installment receivables of APLUS F INANCIAL , Showa Leas ing and other non bank subsidiaries are classified in our consolidated balance sheets as other assets, and are not reflected in our data on loans and bills discounted. Most of our loan portfolio was originated by Shinsei and
our domestic subsidiaries. Of loans we originated, loans to the finance and insurance industry and the real estate industry accounted for 23.1% of total domestic loans as of March 31, 2019. Loans to the real estate industry consisted in part of non recourse and project finance loans. Loans to others of ¥2,402.7 billion as of March 31, 2019 included loans extended to Shinsei’s retail banking, Shinsei Bank Lake, Shinsei Financial’s, APLUS FINANCIAL’s and Shinsei Personal Loan’s indiv idual customers amounting, in aggregate, to ¥1,934.5 billion.
TABLE 17. LOANS BY BORROWER INDUSTRY (CONSOLIDATED)Billions of yen (except percentages)
As of March 31 2019 2018Domestic offices (excluding Japan offshore market account):
Manufacturing ¥ 190.0 4.0% ¥ 189.6 4.0%Agriculture and forestry 0.0 0.0 0.0 0.0Fishery - - - -Mining, quarrying and gravel extraction 0.3 0.0 0.4 0.0Construction 9.1 0.2 7.6 0.2Electric power, gas, heat supply and water supply 320.7 6.7 250.1 5.3Information and communications 55.1 1.2 70.5 1.5Transportation, postal service 195.2 4.1 197.9 4.2Wholesale and retail 122.5 2.6 114.5 2.4Finance and insurance 521.5 10.9 509.1 10.7Real estate 584.9 12.2 565.9 11.9Services 341.8 7.1 344.6 7.2Local government 52.4 1.1 68.4 1.4Others 2,402.7 50.1 2,437.3 51.2
Total domestic (A) ¥ 4,796.9 100.0% ¥ 4,756.4 100.0%Overseas offices (including Japan offshore market accounts):
Governments ¥ 0.1 0.1% ¥ 0.3 0.3%Financial institutions 32.6 17.2 30.8 22.1Others 157.1 82.7 108.3 77.6
Total overseas (B) ¥ 189.9 100.0% ¥ 139.5 100.0%Total (A+B) ¥ 4,986.8 ¥ 4,895.9
40
LOAN PORTFOLIO

Management’s Discussion and Analysis of Financial Condition and Results of Operations
SHINSEI BANK, LIMITED Integrated Report 2019
2019/07/17 13:02:21 / 19509941_株式会社新生銀行_総会その他(C)
FINANCIAL CONDITION (continued)
LOAN MATURITY
The following table sets forth the composition of Shinsei’s nonconsolidated loan portfolio by type of interest rate and
maturity as of the dates indicated. In the fiscal year ended March 31, 2019, the increase in total loans resulted from an increase in both variable-interest rate loans and fixed-interest rate loans.
TABLE 18. LOAN MATURITY (NONCONSOLIDATED)Billions of yen
As of March 31 2019 2018Fixed-interest loans:
One year or less1 ¥ - ¥ -Over one year to three years 14.3 18.5Over three years to five years 30.7 17.2Over five years to seven years 42.8 38.9Over seven years 865.5 958.1Indefinite term 275.9 299.1
Variable-interest loans:One year or less1 ¥ - ¥ -Over one year to three years 755.5 787.9Over three years to five years 617.8 700.4Over five years to seven years 401.0 262.2Over seven years 843.5 749.1Indefinite term 7.7 6.8
Total loans:One year or less ¥ 1,077.5 ¥ 799.0Over one year to three years 769.8 806.5Over three years to five years 648.6 717.7Over five years to seven years 443.8 301.2Over seven years 1,709.0 1,707.3Indefinite term 283.6 306.0
Total loans ¥ 4,932.6 ¥ 4,637.91 Loans with maturities of one year or less are not broken down by type of interest rate.
ASSET QUALITY AND DISPOSAL OFNONPERFORMING LOANS OF SHINSEI
At March 31 , 2019 , 13 .1% o f our conso l ida ted nonperforming loans as disclosed in accordance with the guidelines of the Japanese Bankers Association (JBA) were held by Sh inse i and most of the remain ing nonperforming loans were held by Shinsei Financial and APLUS FINANCIAL. This discussion of our asset quality presents information of Shinsei on a nonconsolidated basis unless specified otherwise. In particular, nonperforming claims as defined in the Financial Revitalization Law are only disclosed on a nonconsolidated basis, and therefore do not include nonperforming loans held by Shinsei Financial, APLUS FINANCIAL and Showa Leasing. For a discussion of the nonperforming claims of Shinsei Financial, APLUS FINANCIAL and Showa Leasing see“—Asset Quality of Shinsei Financial, APLUS FINANCIAL and Showa Leasing.”
We classify our obligors and assess our asset quality based on our self-assessment guidelines developed in accordance with guidelines published by the FSA. We generally perform our self-assessment quarterly. The self-assessment process involves classifying obligors based on their financial condition and then categorizing claims against obligors in order of collection risk. Based on these classifications, we establish reserves and disclose our nonperforming loans and other claims using criteria specified in the Financial Revitalization Law. We also disclose our nonperforming loans under a format devised by the JBA for the disclosure of risk-monitored loans. The following table compares the scope of each category of claim under the Financial Revitalization Law and each type of riskmonitored loan, as well as the obligor type to which they relate as of March 31, 2019:
41
LOAN MATURITY、ASSET QUALITY AND DISPOSAL OF NONPERFORMING LOANS OF SHINSEI
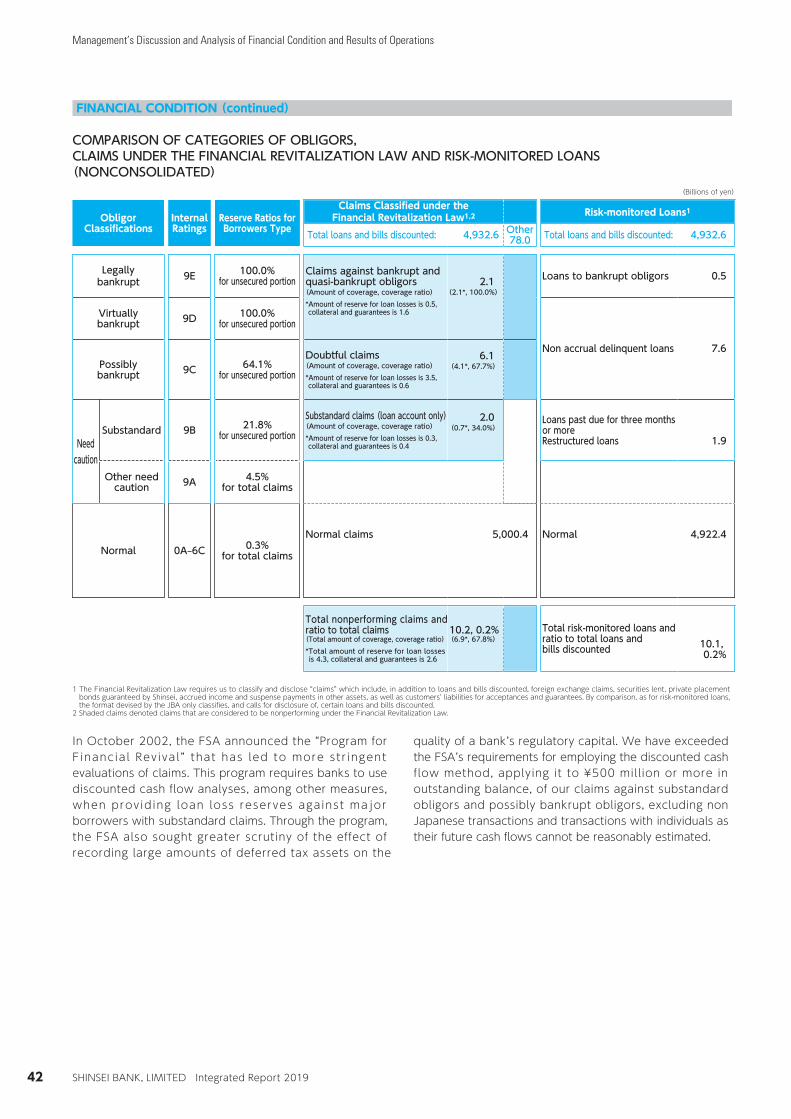
Management’s Discussion and Analysis of Financial Condition and Results of Operations
SHINSEI BANK, LIMITED Integrated Report 2019
2019/07/17 13:02:21 / 19509941_株式会社新生銀行_総会その他(C)
FINANCIAL CONDITION (continued)
COMPARISON OF CATEGORIES OF OBLIGORS,CLAIMS UNDER THE FINANCIAL REVITALIZATION LAW AND RISK-MONITORED LOANS(NONCONSOLIDATED)
(Billions of yen)
ObligorClassifications
InternalRatings
Reserve Ratios forBorrowers Type
Claims Classified under theFinancial Revitalization Law1,2 Risk-monitored Loans1
Total loans and bills discounted: 4,932.6 Other78.0 Total loans and bills discounted: 4,932.6
Legallybankrupt 9E 100.0%
for unsecured portionClaims against bankrupt andquasi-bankrupt obligors(Amount of coverage, coverage ratio)*Amount of reserve for loan losses is 0.5,collateral and guarantees is 1.6
2.1(2.1*, 100.0%)
Loans to bankrupt obligors 0.5
Virtuallybankrupt 9D 100.0%
for unsecured portion
Non accrual delinquent loans 7.6Possiblybankrupt 9C 64.1%
for unsecured portion
Doubtful claims(Amount of coverage, coverage ratio)*Amount of reserve for loan losses is 3.5,collateral and guarantees is 0.6
6.1(4.1*, 67.7%)
Needcaution
Substandard 9B 21.8%for unsecured portion
Substandard claims (loan account only)(Amount of coverage, coverage ratio)*Amount of reserve for loan losses is 0.3,collateral and guarantees is 0.4
2.0(0.7*, 34.0%)
Loans past due for three monthsor moreRestructured loans 1.9
Other needcaution 9A 4.5%
for total claims
Normal 0A–6C 0.3%for total claims
Normal claims 5,000.4 Normal 4,922.4
Total nonperforming claims andratio to total claims(Total amount of coverage, coverage ratio)*Total amount of reserve for loan losses is 4.3, collateral and guarantees is 2.6
10.2, 0.2%(6.9*, 67.8%)
Total risk-monitored loans andratio to total loans andbills discounted 10.1,
0.2%
1 The Financial Revitalization Law requires us to classify and disclose “claims” which include, in addition to loans and bills discounted, foreign exchange claims, securities lent, private placement bonds guaranteed by Shinsei, accrued income and suspense payments in other assets, as well as customers’ liabilities for acceptances and guarantees. By comparison, as for risk-monitored loans, the format devised by the JBA only classifies, and calls for disclosure of, certain loans and bills discounted.
2 Shaded claims denoted claims that are considered to be nonperforming under the Financial Revitalization Law.
In October 2002, the FSA announced the “Program for F inancia l Revival” that has led to more str ingent evaluations of claims. This program requires banks to use discounted cash flow analyses, among other measures, when providing loan loss reserves against major borrowers with substandard claims. Through the program, the FSA also sought greater scrutiny of the effect of recording large amounts of deferred tax assets on the
quality of a bank’s regulatory capital. We have exceeded the FSA’s requirements for employing the discounted cash flow method, applying it to ¥500 million or more in outstanding balance, of our claims against substandard obligors and possibly bankrupt obligors, excluding non Japanese transactions and transactions with individuals as their future cash flows cannot be reasonably estimated.
42
ASSET QUALITY AND DISPOSAL OF NONPERFORMING LOANS OF SHINSEI
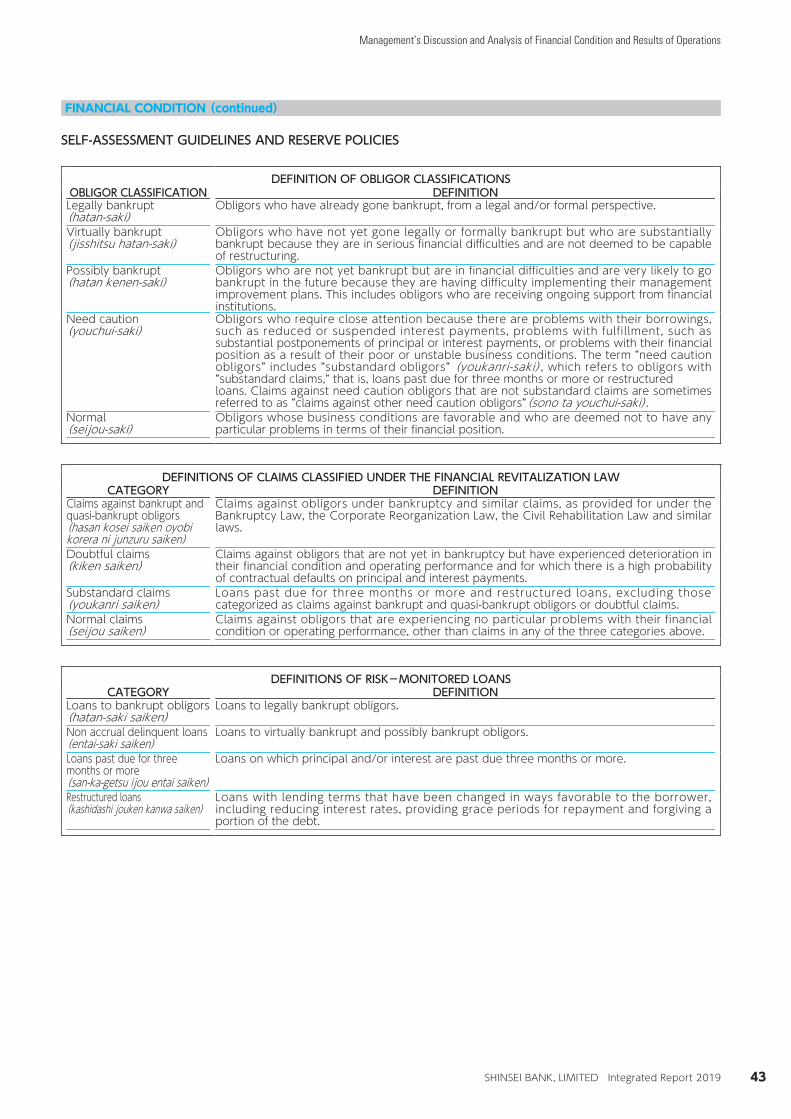
Management’s Discussion and Analysis of Financial Condition and Results of Operations
SHINSEI BANK, LIMITED Integrated Report 2019
2019/07/17 13:02:21 / 19509941_株式会社新生銀行_総会その他(C)
FINANCIAL CONDITION (continued)
SELF-ASSESSMENT GUIDELINES AND RESERVE POLICIES
DEFINITION OF OBLIGOR CLASSIFICATIONSOBLIGOR CLASSIFICATION DEFINITIONLegally bankrupt(hatan-saki)
Obligors who have already gone bankrupt, from a legal and/or formal perspective.
Virtually bankrupt(jisshitsu hatan-saki)
Obligors who have not yet gone legally or formally bankrupt but who are substantially bankrupt because they are in serious financial difficulties and are not deemed to be capable of restructuring.
Possibly bankrupt(hatan kenen-saki)
Obligors who are not yet bankrupt but are in financial difficulties and are very likely to go bankrupt in the future because they are having difficulty implementing their management improvement plans. This includes obligors who are receiving ongoing support from financial institutions.
Need caution(youchui-saki)
Obligors who require close attention because there are problems with their borrowings, such as reduced or suspended interest payments, problems with fulfillment, such as substantial postponements of principal or interest payments, or problems with their financial position as a result of their poor or unstable business conditions. The term “need caution obligors” includes “substandard obligors” (youkanri-saki), which refers to obligors with “substandard claims,” that is, loans past due for three months or more or restructuredloans. Claims against need caution obligors that are not substandard claims are sometimes referred to as “claims against other need caution obligors”(sono ta youchui-saki).
Normal(seijou-saki)
Obligors whose business conditions are favorable and who are deemed not to have any particular problems in terms of their financial position.
DEFINITIONS OF CLAIMS CLASSIFIED UNDER THE FINANCIAL REVITALIZATION LAWCATEGORY DEFINITION
Claims against bankrupt andquasi-bankrupt obligors(hasan kosei saiken oyobikorera ni junzuru saiken)
Claims against obligors under bankruptcy and similar claims, as provided for under the Bankruptcy Law, the Corporate Reorganization Law, the Civil Rehabilitation Law and similar laws.
Doubtful claims(kiken saiken)
Claims against obligors that are not yet in bankruptcy but have experienced deterioration in their financial condition and operating performance and for which there is a high probability of contractual defaults on principal and interest payments.
Substandard claims(youkanri saiken)
Loans past due for three months or more and restructured loans, excluding those categorized as claims against bankrupt and quasi-bankrupt obligors or doubtful claims.
Normal claims(seijou saiken)
Claims against obligors that are experiencing no particular problems with their financial condition or operating performance, other than claims in any of the three categories above.
DEFINITIONS OF RISK-MONITORED LOANSCATEGORY DEFINITION
Loans to bankrupt obligors(hatan-saki saiken)
Loans to legally bankrupt obligors.
Non accrual delinquent loans(entai-saki saiken)
Loans to virtually bankrupt and possibly bankrupt obligors.
Loans past due for threemonths or more(san-ka-getsu ijou entai saiken)
Loans on which principal and/or interest are past due three months or more.
Restructured loans(kashidashi jouken kanwa saiken)
Loans with lending terms that have been changed in ways favorable to the borrower, including reducing interest rates, providing grace periods for repayment and forgiving a portion of the debt.
43
ASSET QUALITY AND DISPOSAL OF NONPERFORMING LOANS OF SHINSEI

Management’s Discussion and Analysis of Financial Condition and Results of Operations
SHINSEI BANK, LIMITED Integrated Report 2019
2019/07/17 13:02:21 / 19509941_株式会社新生銀行_総会その他(C)
FINANCIAL CONDITION (continued)
RESERVE POLICIESCLAIMS AGAINST OBLIGORS,
AS CATEGORIZEDUNDER SELF-ASSESSMENT
GUIDELINES RESERVE POLICYClaims against legally andvirtually bankrupt obligorsClaims against possiblybankrupt obligors
We either write off directly or make a provision for, in the specific reserve for loan losses, the full amount of the unsecured, unguaranteed portion of the claim.For most claims against possibly bankrupt obligors, we make a provision in the specific reserve for loan losses in an amount calculated based on the discounted cash flow method.
For the remaining claims, we make a provision to that reserve for the unsecured, unguaranteed portion of the claims in the amount of the product of that portion and the higher of 70% or the estimated loss ratio, based on historical losses on claims in this category, for the next three years.
Claims againstsubstandard obligors
For most claims against substandard obligors, we make a provision in the general reserve for loan losses in an amount calculated based on the discounted cash flow method.
For the remaining claims, we make a provision to that reserve for the estimated amount of losses over three years computed based on the expected loss ratio for claims in this category.
Claims against need cautionobligors, other than claimsagainst substandard obligors
We make a provision, in the general reserve for loan losses, for the estimated amount of losses over the average remaining term of the loans computed based on the expected loss ratio for claims in this category.
Claims against normal obligors For claims against obligors rated 5A through 6C under our credit rating system, we make a provision, in the general reserve for loan losses, for the estimated amount of losses over the average remaining term of the loans computed based on the expected loss ratio for claims in this category. For the remaining claims, we make a provision to that reserve for the estimated amount of losses over a year computed based on the expected loss ratio for claims in this category.
CLAIMS CLASSIFIED UNDERTHE FINANCIAL REVITALIZATION LAWUnder the Financial Revitalization Law, Japanese banks categorize their total claims in four categories by reference to the nature of the relevant assets. In addition to loans and bills discounted, claims that are subject to disclosure under the Financial Revitalization Law include foreign exchange claims, securities lent, private placement bonds guaranteed by Shinsei, accrued income and suspense payments in other assets, as well as customers’ liabilities for acceptances and guarantees.
DISCLOSURE OF CLAIMS CLASSIFIED UNDERTHE FINANCIAL REVITALIZATION LAWOur current management team has cons is tent ly emphasized the monitoring of nonperforming loans. Shinsei’s total amount of nonperforming claims as disclosed pursuant to the Financial Revitalization Law increased by ¥1.8 billion, or 21.7%, to ¥10.2 billion,
between March 31, 2018 and 2019. During the fiscal year ended March 31, 2019, claims against bankrupt and quasi-bankrupt obligors increased from ¥1.8 billion to ¥2.1 billion, doubtful claims increased from ¥3.5 billion to ¥6.1 billion, and substandard claims decreased from ¥3.0 billion to ¥2.0 billion as a result of our self assessment. The ratio of nonperforming claims disclosed under the Financial Revitalization Law to total nonconsolidated claims as of March 31, 2019 was 0.2%, was same as March 31, 2018. Shinsei’s claims against other need caution obligors, excluding substandard claims, totaled ¥64.3 billion as of March 31, 2019, a 47.2% increase from ¥43.6 billion as of March 31, 2018. These include private placement bonds guaranteed by Shinsei and classified as claims against other need caution obligors. These claims represented 1.3% of total nonconsolidated claims as of March 31, 2019, increased from 0.9% as of March 31, 2018.
TABLE 19. CLAIMS CLASSIFIED UNDER THE FINANCIAL REVITALIZATION LAW (NONCONSOLIDATED)Billions of yen (except percentages)
As of March 31 2019 2018Claims against bankrupt and quasi-bankrupt obligors ¥ 2.1 ¥ 1.8Doubtful claims 6.1 3.5Substandard claims 2.0 3.0
Total claims disclosed under the Financial Revitalization Law1 10.2 8.3Normal claims and claims against other need caution obligors, excluding substandard claims 5,000.4 4,715.7
Total claims ¥ 5,010.6 ¥ 4,724.0Ratio of total claims disclosed under the Financial Revitalization Law to total claims 0.2% 0.2%
1 Total claims consists of loans and bills discounted, foreign exchange claims, securities lent, accrued interest income and suspense payments in other assets, as well as customers’ liabilities for acceptances and guarantees.
44
ASSET QUALITY AND DISPOSAL OF NONPERFORMING LOANS OF SHINSEI、CLAIMS CLASSIFIED UNDER THE FINANCIAL REVITALIZATION LAW

Management’s Discussion and Analysis of Financial Condition and Results of Operations
SHINSEI BANK, LIMITED Integrated Report 2019
2019/07/17 13:02:21 / 19509941_株式会社新生銀行_総会その他(C)
FINANCIAL CONDITION (continued)
COVERAGE RATIOS
As of March 31, 2019, Shinsei’s nonconsolidated coverage ra t ios fo r c la ims c lass i f i ed under the F inanc ia l Revitalization Law, which for each category of claims is the total of collateral pledged against claims, guarantees for claims and reserve for loan losses, measured against total claims, were 100.0% for claims against bankrupt and quasi-bankrupt obligors, 67.7% for doubtful claims and 34.0% for
substandard claims. For all claims classified under the Financial Revitalization Law, the coverage ratio was 67.8%, a increase from 65.8% as of March 31, 2018. Shinsei directly writes off, rather than reserves, the portion of claims against bankrupt and quasi-bankrupt obligors that are estimated to be uncollectible. In the fiscal years ended March 31, 2019 and 2018, ¥2.9 billion and ¥5.8 billion, respectively, of such claims were written off on a nonconsolidated basis.
TABLE 20. COVERAGE RATIOS FOR NONPERFORMING CLAIMS DISCLOSED UNDER THE FINANCIALREVITALIZATION LAW (NONCONSOLIDATED)
Billions of yen (except percentages)Amounts of coverage
Amount ofclaims
Reservefor loanlosses
Collateraland
guarantees TotalCoverage
ratioAs of March 31, 2019:Claims against bankrupt and quasi-bankrupt obligors ¥ 2.1 ¥ 0.5 ¥ 1.6 ¥ 2.1 100.0%Doubtful claims 6.1 3.5 0.6 4.1 67.7Substandard claims 2.0 0.3 0.4 0.7 34.0
Total ¥ 10.2 ¥ 4.3 ¥ 2.6 ¥ 6.9 67.8%As of March 31, 2018:Claims against bankrupt and quasi-bankrupt obligors ¥ 1.8 ¥ 0.4 ¥ 1.3 ¥ 1.8 100.0%Doubtful claims 3.5 1.9 0.1 2.0 57.4Substandard claims 3.0 0.6 1.0 1.6 55.3
Total ¥ 8.3 ¥ 3.0 ¥ 2.5 ¥ 5.5 65.8%
CHANGES IN AMOUNT OF NONPERFORMING CLAIMS
The table below sets forth Shinsei’s experience since March 31, 2017 with the removal of nonperforming claims and the emergence of new claims on a nonconsolidated basis:
TABLE 21. CHANGES IN AMOUNT OF NONPERFORMING CLAIMS (NONCONSOLIDATED)Billions of yen
Substandardclaims
Doubtfulclaims
Claims againstbankrupt and
quasi-bankruptobligors Total
Balance of nonperforming claims as of March 31, 2017 ¥ 3.8 ¥ 3.6 ¥ 2.9 ¥ 10.3Claims newly added April 1, 2017 to March 31, 2018 0.8 0.5 1.1 2.4Claims removed April 1, 2017 to March 31, 2018 (1.6) (0.2) (2.6) (4.4)Claims migrating between classifications April 1, 2017 to March 31, 2018 0.0 (0.3) 0.3 -
Net change (0.7) (0.0) (1.1) (1.9)Balance of nonperforming claims as of March 31, 2018 ¥ 3.0 ¥ 3.5 ¥ 1.8 ¥ 8.3
Claims newly added April 1, 2018 to March 31, 2019 0.4 3.0 0.8 4.3Claims removed April 1, 2018 to March 31, 2019 (1.3) (0.4) (0.7) (2.4)Claims migrating between classifications April 1, 2018 to March 31, 2019 (0.2) (0.1) 0.2 -
Net change (1.1) 2.6 0.3 1.8Balance of nonperforming claims as of March 31, 2019 ¥ 2.0 ¥ 6.1 ¥ 2.1 ¥ 10.2
In the fiscal year ended March 31, 2019, ¥4.3 billion of claims were newly classified as substandard or worse, while Shinsei removed ¥2.4 billion of claims in these categories during the same period. Of the newly added nonperforming claims, ¥0.4 billion were classified as substandard claims, and ¥3.0 billion were classified as
Doubtful claims. For the fiscal year ended March 31, 2018, ¥2.4 billion of claims were newly classified as substandard or worse, while Shinsei removed ¥4.4 billion of claims in these categories during the same period.
45
COVERAGE RATIOS、CHANGES IN AMOUNT OF NON-PERFORMING CLAIMS

Management’s Discussion and Analysis of Financial Condition and Results of Operations
SHINSEI BANK, LIMITED Integrated Report 2019
2019/07/17 13:02:21 / 19509941_株式会社新生銀行_総会その他(C)
FINANCIAL CONDITION (continued)
RESERVE FOR CREDIT LOSSES
The following table sets forth a breakdown of our total reserve for credit losses on a nonconsolidated basis as of the dates indicated:
TABLE 22. RESERVE FOR CREDIT LOSSES (NONCONSOLIDATED)Billions of yen (except percentages)
As of March 31 2019 2018General reserve for loan losses ¥ 21.2 ¥ 24.3Specific reserve for loan losses 4.2 2.3Reserve for loans to restructuring countries - -
Total reserve for credit losses ¥ 25.5 ¥ 26.7Total claims1 ¥ 5,010.6 ¥ 4,724.0Ratio of total reserve for credit losses to total claims 0.5% 0.6%
1 Total claims consists of loans and bills discounted, foreign exchange claims, securities lent, accrued interest income and suspense payments in other assets, as well as customers’ liabilities for acceptances and guarantees.
As of March 31, 2019 and 2018, Shinsei’s total reserve for credit losses on a nonconsolidated basis was ¥25.5 billion and ¥26.7 billion, respectively, constituting 0.5% and 0.6%, respectively, of total claims.
TABLE 23. RESERVE RATIOS BY BORROWERS’ CATEGORY (NONCONSOLIDATED)Percentages
As of March 31 2019 2018Legally and virtually bankrupt (unsecured portion) 100.0% 100.0%Possibly bankrupt (unsecured portion) 64.1% 55.7%Substandard (unsecured portion) 21.8% 39.7%Other need caution (total claims) 4.5% 5.4%
(unsecured portion) 10.4% 11.2%Normal (total claims) 0.3% 0.4%
RISK-MONITORED LOANS
Consolidated risk-monitored loans increased by 3.5% during the fiscal year ended March 31, 2019 to ¥77.5 bil l ion. The decrease of ¥2.7 bil l ion in nonaccrual del inquent loans during the period were primari ly
attributable to collection of nonconsolidated loans. The following tables set forth information concerning our consolidated and nonconsolidated risk-monitored loans as of the dates indicated:
TABLE 24. RISK-MONITORED LOANS (CONSOLIDATED)Billions of yen (except percentages)
As of March 31 2019 2018Total loans and bills discounted ¥ 4,986.8 ¥ 4,895.9Loans to bankrupt obligors (A) 4.8 5.6Nonaccrual delinquent loans (B) 28.3 31.1
Subtotal (A)+(B) ¥ 33.2 ¥ 36.8Ratio to total loans and bills discounted 0.7% 0.8%
Loans past due for three months or more (C) ¥ 0.8 ¥ 1.8Restructured loans (D) 43.4 36.2
Total risk-monitored loans (A)+(B)+(C)+(D) ¥ 77.5 ¥ 74.9Ratio to total loans and bills discounted 1.6% 1.5%
Reserve for credit losses ¥ 98.0 ¥ 100.8
46
RESERVE FOR CREDIT LOSSES (NONCONSOLIDATED)、RESERVE RATIOS BY BORROWERS'CATEGORY(NONCONSOLIDATED)、RISK-MONITORED LOANS

Management’s Discussion and Analysis of Financial Condition and Results of Operations
SHINSEI BANK, LIMITED Integrated Report 2019
2019/07/17 13:02:21 / 19509941_株式会社新生銀行_総会その他(C)
FINANCIAL CONDITION (continued)
TABLE 25. RISK-MONITORED LOANS (NONCONSOLIDATED)Billions of yen (except percentages)
As of March 31 2019 2018Total loans and bills discounted ¥ 4,932.6 ¥ 4,637.9Loans to bankrupt obligors (A) 0.5 0.5Nonaccrual delinquent loans (B) 7.6 4.7
Subtotal (A)+(B) ¥ 8.2 ¥ 5.3Ratio to total loans and bills discounted 0.2% 0.1%
Loans past due for three months or more (C) ¥ 0.2 ¥ 1.1Restructured loans (D) 1.7 1.8
Total risk-monitored loans (A)+(B)+(C)+(D) ¥ 10.1 ¥ 8.3Ratio to total loans and bills discounted 0.2% 0.2%
Reserve for credit losses ¥ 25.5 ¥ 26.7
TABLE 26. RISK-MONITORED LOANS BY BORROWER INDUSTRY (NONCONSOLIDATED)Billions of yen
As of March 31 2019 2018Domestic offices (excluding Japan offshore market account):
Manufacturing ¥ 2.9 ¥ 2.9Agriculture and forestry - -Fishery - -Mining, quarrying and gravel extraction - -Construction - -Electric power, gas, heat supply and water supply - -Information and communications 0.0 0.2Transportation and postal service - 0.0Wholesale and retail 0.1 0.3Finance and insurance 0.1 -Real estate 0.0 -Services 1.1 0.5Local government - -Individual 2.3 2.6Overseas yen loan and overseas loans booked domestically 2.1 0.2
Total domestic (A) ¥ 8.9 ¥ 7.0Overseas offices (including Japan offshore market accounts):
Governments ¥ - ¥ -Financial institutions - -Others 1.2 1.3
Total overseas (B) ¥ 1.2 ¥ 1.3Total (A+B) ¥ 10.1 ¥ 8.3
47
RISK-MONITORED LOANS

Management’s Discussion and Analysis of Financial Condition and Results of Operations
SHINSEI BANK, LIMITED Integrated Report 2019
2019/07/17 13:02:21 / 19509941_株式会社新生銀行_総会その他(C)
FINANCIAL CONDITION (continued)
ASSET QUALITY OF SHINSEI FINANCIAL,APLUS FINANCIAL AND SHOWA LEASING
Shinsei Financial, APLUS FINANCIAL and Showa Leasing classify their obligors and assess their asset quality based on the se l f -assessment gu ide l ines deve loped in accordance with guidelines published by the FSA. They generally perform their self-assessment quarterly and at least semi-annually. Shinsei Financial’s, APLUS FINANCIAL’s and Showa Leasing’s assessments, where applicable,
include, among other things, an assessment of credit extended to credit card customers as well as lease obligors, unsecured personal loans and customer guarantees. The following tables set forth information concerning consolidated risk-monitored loans and risk-monitored installment receivables held by Shinsei, Shinsei Financial, APLUS FINANCIAL, Showa Leasing and other subsidiaries as of the dates indicated:
TABLE 27. RISK-MONITORED LOANS BREAKDOWN FOR LARGE ENTITIES (CONSOLIDATED)Billions of yen
ShinseiShinsei
FinancialAPLUS
FINANCIALOther
subsidiaries TotalAs of March 31, 2019:Loans to bankrupt obligors ¥ 0.5 ¥ 3.6 ¥ 0.0 ¥ 0.6 ¥ 4.8Nonaccrual delinquent loans 7.6 10.5 5.5 4.6 28.3Loans past due for three months or more 0.2 - 0.4 0.1 0.8Restructured loans 1.7 31.6 10.0 - 43.4
Total ¥ 10.1 ¥ 45.8 ¥ 16.0 ¥ 5.4 ¥ 77.5As of March 31, 2018:Loans to bankrupt obligors ¥ 0.5 ¥ 4.6 ¥ - ¥ 0.3 ¥ 5.6Nonaccrual delinquent loans 4.7 12.3 9.8 4.2 31.1Loans past due for three months or more 1.1 0.0 0.3 0.3 1.8Restructured loans 1.8 25.0 9.2 - 36.2
Total ¥ 8.3 ¥ 42.0 ¥ 19.5 ¥ 4.9 ¥ 74.9
TABLE 28. RISK-MONITORED INSTALLMENT RECEIVABLES INCLUDED IN OTHER ASSETS(CONSOLIDATED)1
Billions of yenShinsei
FinancialAPLUS
FINANCIALShowaLeasing
Othersubsidiaries Total
As of March 31, 2019:Credits to bankrupt obligors ¥ - ¥ 0.0 ¥ 0.0 ¥ - ¥ 0.0Nonaccrual delinquent credits - 3.7 2.2 - 5.9Credits past due for three months or more - 0.2 0.6 - 0.8Restructured credits - 0.2 0.0 - 0.2
Total ¥ - ¥ 4.1 ¥ 2.8 ¥ - ¥ 6.9As of March 31, 2018:Credits to bankrupt obligors ¥ - ¥ 0.0 ¥ 0.0 ¥ 0.0 ¥ 0.0Nonaccrual delinquent credits - 4.5 2.7 - 7.2Credits past due for three months or more - 0.3 0.0 - 0.3Restructured credits - 0.0 0.0 - 0.0
Total ¥ - ¥ 4.9 ¥ 2.8 ¥ 0.0 ¥ 7.71 Neither Shinsei Bank (nonconsolidated) nor Shinsei Personal Loan had any such installment receivables.
FUNDING AND LIQUIDITY
We continues to optimize its funding base through deposits from retail customers. Total deposits and negotiable certificates of deposit decrease from ¥6,067.0 billion as of March 31, 2018 to ¥5,922.1 billion as of March 31, 2019. The retail deposits balance totaled
¥4,594.5 billion as of March 31, 2019, a decrease of ¥290 billion compared to March 31, 2018. Retail Banking constitutes 77.6% of our total funding through customer deposits. The following table shows changes in the proportion of our overall funding represented by funds raised from deposits in our Retail and Institutional Banking businesses.
48
ASSET QUALITY OF SHINSEI FINANCIAL,APLUS FINANCIAL AND SHOWA LEASING、COMMENTARY (DIVERSIFICATION BY FUNDING TYPE)

Management’s Discussion and Analysis of Financial Condition and Results of Operations
SHINSEI BANK, LIMITED Integrated Report 2019
2019/07/17 13:02:21 / 19509941_株式会社新生銀行_総会その他(C)
FINANCIAL CONDITION (continued)
TABLE 29. DIVERSIFICATION BY FUNDING TYPE (CONSOLIDATED)Billions of yen
As of March 31 2019 2018Retail deposits ¥ 4,594.5 ¥ 4,884.5Institutional deposits 1,327.5 1,182.5
Total ¥ 5,922.1 ¥ 6,067.0
DEPOSITSThe following table sets forth the composition of our time deposits by remaining maturity as of the dates indicated:
TABLE 30. MATURITY SCHEDULE OF TIME DEPOSITS (CONSOLIDATED)Billions of yen
As of March 31 2019 2018Less than three months1 ¥ 1,518.6 ¥ 1,679.3Three months or more, but less than six months 158.6 227.3Six months or more, but less than one year 119.5 467.1One year or more, but less than two years 89.5 76.5Two years or more, but less than three years 85.0 71.0Three years or more 300.3 169.5
Total ¥ 2,271.9 ¥ 2,691.01 Less than three months includes time deposits that have matured but have not yet been paid.
CORPORATE BONDSThe following table sets forth the composition of our corporate bonds by remaining maturity as of the dates indicated:
TABLE 31. MATURITY SCHEDULE OF CORPORATE BONDS (CONSOLIDATED)
Corporate BondsFiscal year ending March 31 Billions of yen2020 ¥ 25.02021 15.72022 10.02023 -2024 and thereafter 41.6
Total ¥ 92.3
OTHERThe securitization of loans and other assets is another component of our funding strategy. We will continue to explore additional issuance opportunities subject to market conditions.
TABLE 32. SHINSEI’S CREDIT RATINGS AS OF JULY 2019Rating agency Long-term (Outlook) Short-termR&I A- (Stable) a-1JCR A- (Stable) J-1S&P BBB+ (Stable) A-2Moody’s Baa2 (Stable) Prime-2
49
COMMENTARY (DIVERSIFICATION BY FUNDING TYPE)、DEPOSITS, CORPORATE BONDS、OTHER (CREDIT RATINGS)

Management’s Discussion and Analysis of Financial Condition and Results of Operations
SHINSEI BANK, LIMITED Integrated Report 2019
2019/07/17 13:02:21 / 19509941_株式会社新生銀行_総会その他(C)
FINANCIAL CONDITION (continued)
OTHER CONTRACTUAL CASH OBLIGATIONS
We use other contractual cash obligations for funding purposes. The following table sets forth a summary of our primary consolidated other contractual cash obligations as of March 31, 2019 and 2018:
TABLE 33. OTHER CONTRACTUAL CASH OBLIGATIONS (CONSOLIDATED)Billions of yen
Payments due by period as of March 31, 2019 1 year or less Over 1 year TotalBorrowed money ¥ 247.9 ¥ 436.0 ¥ 684.0Obligations under finance leases 0.3 0.6 0.9
Total ¥ 248.3 ¥ 436.7 ¥ 685.0Billions of yen
Payments due by period as of March 31, 2018 1 year or less Over 1 year TotalBorrowed money ¥ 322.1 ¥ 417.4 ¥ 739.5Obligations under finance leases 0.3 0.9 1.3
Total ¥ 322.5 ¥ 418.4 ¥ 740.9
TAXATION
SCHEDULE OF TAX LOSS CARRYFORWARDSAs of March 31, 2019, Shinsei had ¥147.2 billion of tax loss carryforwards based on the consolidated corporate tax system.
TABLE 34. SCHEDULE OF THE TAX EFFECT OF TAX LOSS CARRY-FORWARDS
Millions of yen
1 year or less Over 1 yearto 2 years
Over 2 yearsto 3 years
Over 3 yearsto 4 years
Over 4 yearsto 5 years Over 5 years Total
Deferred tax assets relating totax loss carryforwards1 ¥7,347 ¥11,152 ¥7,914 ¥9,235 ¥12,918 ¥23,696 ¥72,264
Less valuation allowances fortax loss carryforwards (¥3,865) (¥9,795) (¥7,823) (¥9,172) (¥12,837) (¥23,536) (¥67,030)Net deferred tax assets relating to tax loss carryforwards ¥3,482 ¥1,356 ¥91 ¥63 ¥80 ¥159 ¥5,2342
Thousands of U.S. dollars
1 year or less Over 1 yearto 2 years
Over 2 yearsto 3 Years
Over 3 yearsto 4 years
Over 4 yearsto 5 years Over 5 years Total
Deferred tax assets relating totax loss carryforwards1
$66,346 $100,712 $71,472 $83,398 $116,655 $213,980 $652,563
Less valuation allowances for taxloss carryforwards ($34,903) ($88,458) ($70,645) ($82,826) ($115,927) ($212,539) ($605,298)Net deferred tax assets relating to tax loss carryforwards $31,443 $12,254 $826 $573 $727 $1,441 $47,2642
1 The amounts of tax loss carryforwards are obtained as a result of multiplying the statutory effective tax rate.2 The tax loss carryforwards resulted from the disposal of the non-performing loans in the prior fiscal years. Certain tax loss carryforwards are determined to be collectible as it is probable that consolidated taxable income would be generated based on the expected profitability of the consolidated taxpayer including the Bank as the consolidated parent corporation under consolidated tax filing system. The collectability of the deferred tax assets is considered by corporate tax, inhabitant tax and enterprise tax, respectively.
The table above sets forth a schedule of the tax effect of the tax loss carryforwards, which resulted in deferred tax assets of the Group as of March 31, 2019. The amounts are recorded mainly by two consolidated taxpayer, Shinsei Bank and APLUS FINANCIAL, which is not wholly-owned subsidiaries, thus an independent consolidated taxpayer. We record deferred tax assets for tax loss carryforwards and evaluate them in accordance with the ASBJ Guidance. See “—Critical Accounting Policies— Valuation of Deferred Tax Assets” on page 113.
CONSOLIDATED CORPORATE TAX SYSTEMShinsei has filed its corporate tax returns under the consolidated corporate tax system since the fiscal year ended March 31, 2004. Under the consolidated corporate tax system, we base corporate tax payments on the combined profits or losses of Shinsei and its wholly-owned domestic subsidiaries. APLUS FINANCIAL has also adopted the consolidated corporate tax system beginning with the fiscal year ended March 31, 2011, respectively.
50
OTHER CONTRACTUAL CASH OBLIGATIONS、TAXATION

Management’s Discussion and Analysis of Financial Condition and Results of Operations
SHINSEI BANK, LIMITED Integrated Report 2019
2019/07/17 13:02:21 / 19509941_株式会社新生銀行_総会その他(C)
FINANCIAL CONDITION (continued)
CAPITAL RESOURCES AND ADEQUACY
EQUITYThe following table sets forth a summary of our equity as of March 31, 2019 and 2018:
TABLE 35. EQUITY (CONSOLIDATED)Billions of yen (except percentages)
As of March 31 2019 2018Common stock ¥ 512.2 ¥ 512.2Capital surplus 78.5 78.5Stock acquisition rights 0.0 0.3Retained earnings 346.5 361.3Treasury stock, at cost (37.7) (89.5)Accumulated other comprehensive income:
Unrealized gain on available-for-sale securities 10.0 5.1Deferred gain (loss) on derivatives under hedge accounting (16.3) (14.4)Foreign currency translation adjustments (1.5) (1.5)Defined retirement benefit plans 0.3 2.0Total ¥ 892.1 ¥ 854.1
Noncontrolling interests 4.4 1.9Total equity ¥ 896.6 ¥ 856.0
Ratio of total equity to total assets 9.4% 9.1%
CAPITAL RATIOSFrom the fiscal year ended March 31, 2014, the Basel III methodology has been adopted to calculate capital ratios. For credit risk, the Foundation Internal Ratings Based Approach (FIRB) has been applied. For operational risk, the Standardized Approach (TSA) has been adopted and
the Internal Model Method has been used for market risk. Our total capital adequacy ratio (Basel III) as of March 31, 2019 was 11.85%, compared with 12.83% as of March 31, 2018. See “COMPOSIT ION OF CAPITAL DISCLOSURE (CONSOLIDATED)” on Page 199.
51
EQUITY、CAPITAL RATIOS

Management’s Discussion and Analysis of Financial Condition and Results of Operations
SHINSEI BANK, LIMITED Integrated Report 2019
2019/07/17 13:02:21 / 19509941_株式会社新生銀行_総会その他(C)
FINANCIAL CONDITION (continued)
Subordinated debt and preferred securities are included in eligible capital instruments subject to transitional arrangements (amount allowed to be included in Core capital: instruments and reserves). In the grandfathering rule, eligible capital instruments can be calculated as capital but the value will decrease due to the amortization and redemption. Basel III additional capital items which are capital deduction are the following items. The capital deduction will increase gradually in the grandfathering rule.
• Other intangibles other than goodwill and mortgage servicing rights.
• Deferred tax assets that rely on future profitability excluding those arising from temporary differences (net of related tax liability).
• Net defined benefit asset.
OFF-BALANCE SHEET ARRANGEMENTS
We use off-balance sheet arrangements, including i n ves tmen t s t h rough spec i a l pu rpose en t i t i e s , secur i t i zat ions , l ines and le t ters o f c red i t , loan commitments and loan participations, in the ordinary course of business, including in our securitization and financing businesses, as well as to manage our own liquidity risk. The main purposes of such off-balance sheet arrangements are to develop our institutional banking business as well as to diversify our sources of liquidity. The following is a discussion of the principal off-balance sheet arrangements we use.
SECURITIZATIONWe structure, arrange, distribute and service mortgage-backed securities and asset-backed securities both for third-parties and ourselves. Our securitization services utilize special purpose entities, which may be organized in the form of trusts, partnerships or corporations, mainly to protect the securitized assets from creditors of transferors even in bankruptcy. Assets securitized include commercial loans, residential mortgage loans, installment receivables and lease receivables.
REPACKAGINGOne aspect of our securitization business involves our repackaging of assets purchased by special purpose entities that we establish into new financial instruments that represent undivided interests in the underlying assets. Repackaging the assets generally entails analyzing the cash flows from the underlying assets, using various means to rearrange the timing and order of cash flows, and then combining them with other cash flows to create new financial instruments that can be tailored to meet the demands of a broad range of investors. Often the assets are repackaged into residual or subordinated interests, mezzanine interests and senior interests. The residual interests are the first to suffer any losses as a result of any decline in the value of the underlying financial assets, while the senior interests are structured to be the last to absorb such losses. In instances where we repackage assets on our own initiative, rather than for our customers, we generally retain the residual interests and either sell the senior or mezzanine interests immediately to third-parties or hold them temporarily before placing them with investors. Revenues on these transactions consist of gains on sales of the repackaged senior and mezzanine interests, transaction arrangement fees received from the originators of the assets, fees for underwriting the senior instruments, and returns on the residual interests. The principal risk inherent in these repackagings is credit risk on the securitized financial instruments that is absorbed by the retained residual interests. We may record losses on the residual interests due to declines in the value of the underlying financial assets. We manage this credit risk through quarterly assessing our retained interests and providing valuation allowances for them based on those assessments, taking into consideration how much we believe we will be able to collect on the underlying assets. We generally transfer financial assets to special purpose entities on a “true sale” basis, which means that we would neither be entitled nor required to reacquire the financial assets so transferred.
52
OFF-BALANCE SHEET ARRANGEMENTS

Management’s Discussion and Analysis of Financial Condition and Results of Operations
SHINSEI BANK, LIMITED Integrated Report 2019
2019/07/17 13:02:21 / 19509941_株式会社新生銀行_総会その他(C)
FINANCIAL CONDITION (continued)
ARRANGEMENTWe also securitize customers’ assets on their behalf, drawing on our expertise and experience in establishing securitization vehicles tailored to accommodate clients’ needs, analyzing cash flows from the financial assets, structuring them into classes of securitized interests, arranging credit enhancements and locating investors for the securities to be issued. We generally place the securities representing the senior interests from these transactions with third-party investors. We may choose, however, to acquire temporarily a portion of these senior securities for later sale and often structure financial arrangements, including repackaging, that enhance the liquidity of these senior securities in order to attract third-party investors. These securities are recorded in other monetary claims purchased and recorded at fair value. Our revenue on these transactions consists of fees, generally fixed, for arranging the transaction and for underwriting the sale of the financial instruments. We typically record those fees as having been received at the completion of all arrangements for the customer. On these transactions, we act as an arranger, an underwriter, a servicer, a trustee or an administrator, or combination of some of these roles, for our corporate customers. As our customers usually retain the residual interests and the related risk of loss on them, we are not exposed to risks of incurring losses inherent in such residual interests. As of March 31, 2019 and 2018, we held ¥3.4 billion and ¥8.8 billion, respectively, of debt securities and residual interests from securitization transactions.
LOAN PARTICIPATIONSWe have sold or transferred participation interests in certain of our loans. Loan participation involves the original lender transferring economic interests in the loan to others, while the original lender retains title to the loan itself. Under Japanese GAAP, where substantially all of the economic interest in and risks of the loans are transferred to the participants, the original lenders are not deemed to bear recourse obligations for the participating interests or to have any rights to repurchase such interests. As a result, the original lender may remove the loans from its balance sheet as if the loans were sold to the participants. Because substantially all of the economic interest and risks have been transferred to the participants, we believe that we are not taking any substantial economic risk on the portions of loans in which we have sold participating
interests. As of March 31, 2019 and 2018, the total principal amount of participation interests in loans transferred to third-parties removed from the loan account was ¥7.4 billion and ¥7.8 billion, respectively.
OFF-BALANCE SHEET ARRANGEMENTS TO EXTENDCREDIT, ACCEPTANCES AND GUARANTEESWe have off-balance sheet commitments to extend credit to customers up to certain predetermined amounts at current market rates, in consideration of which we receive fee income that is recorded on an accrual basis for the period of the commitments. The unfulfilled amounts of these commitments and established credit l ine of overdrafts were ¥3,041.3 billion and ¥3,348.3 billion as of March 31, 2019 and 2018, out of which the amounts with the commitments of the agreements expiring within one year or being able to be cancelled at any time with no condition were ¥2,676.9 billion and ¥3,016.0 billion as of March 31, 2019 and 2018, respectively. In addition, we provide acceptances and guarantees, which include lines and letters of credit and guarantees on customers’ borrowings from other creditors. These acceptances and guarantees require us to satisfy our customers’ obligations in the event they fail to do so, although we would have a claim for reimbursement against them. Under Japanese GAAP for banks, these acceptances and guarantees are deemed to be both contingent assets and liabilities, and are recorded as both assets and liabilities in the principal amount of the acceptances and guarantees. We record the fees we earn from providing acceptances and guarantees on an accrual basis over the period of the acceptance or guarantee. As of March 31, 2019 and 2018, we had ¥456.7 billion and ¥395.3 billion, respectively, of outstanding acceptances and guarantees. APLUS FINANCIAL extends credit in the form of guarantees. The most signif icant component of its guarantee business is providing guarantees on installment shopping credit provided by other lenders to customers of its partner merchants. APLUS FINANCIAL also offers collection guarantees for foreign automobile dealers. As of March 31, 2019 and 2018, ¥392.6 billion and ¥321.9 billion of our outstanding acceptances or guarantees, respectively, were attributable to its guarantee business.
53
OFF-BALANCE SHEET ARRANGEMENTS

SHINSEI BANK, LIMITED Integrated Report 2019
2019/07/10 8:13:49 / 19509946_株式会社新生銀行_総会その他(C)
CONSOLIDATED BALANCE SHEETShinsei Bank, Limited, and its Consolidated SubsidiariesAs of March 31, 2019
Millions of yenThousands of
U.S. dollars (Note 1)
2019 2018 2019ASSETSCash and due from banks (Notes 4, 24, and 38) ¥ 1,355,966 ¥ 1,465,663 $ 12,244,592Receivables under securities borrowing transactions (Note 38) 2,119 2,629 19,135Other monetary claims purchased (Notes 5 and 38) 30,994 36,332 279,888Trading assets (Notes 6, 24, 38 and 39) 204,415 205,295 1,845,901Monetary assets held in trust (Notes 7, 24 and 38) 305,879 234,924 2,762,137Securities (Notes 8, 24, 25 and 38) 1,130,286 1,123,522 10,206,669Loans and bills discounted (Notes 9, 24, and 38) 4,986,839 4,895,963 45,031,963Foreign exchanges (Note 10) 29,546 32,511 266,813Lease receivables and leased investment assets (Notes 24, 35 and 38) 176,553 171,429 1,594,311Other assets (Notes 11, 24, 38 and 39) 851,287 856,213 7,687,266Premises and equipment (Notes 12, 24 and 35) 45,341 50,261 409,442Intangible assets (Notes 13 and 35) 67,189 59,484 606,733Assets for retirement benefits (Note 21) 10,931 13,261 98,711Deferred tax assets (Note 32) 15,096 14,705 136,325Customers’ liabilities for acceptances and guarantees (Note 22) 456,759 395,301 4,124,607Reserve for credit losses (Note 14) (98,034) (100,840) (885,272)
Total assets ¥ 9,571,172 ¥ 9,456,660 $ 86,429,222
LIABILITIES AND EQUITYLiabilities:Deposits, including negotiable certificates of deposit (Notes 15, 24 and 38) ¥ 5,922,145 ¥ 6,067,096 $ 53,477,923Debentures (Notes 16 and 38) - 423 -Call money (Notes 38) 145,000 - 1,309,373Payables under repurchase agreements (Notes 24 and 38) 59,098 55,919 533,671Payables under securities lending transactions (Notes 24 and 38) 510,229 433,462 4,607,458Trading liabilities (Notes 17, 38 and 39) 182,363 184,582 1,646,776Borrowed money (Notes 18, 24, 25 and 38) 684,077 739,578 6,177,334Foreign exchanges (Note 10) 471 102 4,256Short-term corporate bonds (Note 38) 191,000 175,700 1,724,761Corporate bonds (Notes 19 and 38) 92,335 85,000 833,800Other liabilities (Notes 20, 24, 38 and 39) 347,383 367,734 3,136,925Accrued employees’ bonuses 8,598 8,489 77,649Accrued directors’ bonuses 44 51 404Liabilities for retirement benefits (Note 21) 8,232 8,366 74,337Reserve for reimbursement of debentures 3,764 4,130 33,991Reserve for losses on interest repayments 63,025 74,687 569,131Acceptances and guarantees (Notes 22, 24 and 38) 456,759 395,301 4,124,607
Total liabilities 8,674,529 8,600,625 78,332,396Equity:Common stock (Note 26) 512,204 512,204 4,625,290Capital surplus 78,506 78,506 708,925Stock acquisition rights (Note 27) 99 318 896Retained earnings 346,562 361,368 3,129,519Treasury stock, at cost (Note 26) (37,729) (89,540) (340,699)Accumulated other comprehensive income:
Unrealized gain (loss) on available-for-sale securities (Note 8) 10,041 5,187 90,673Deferred gain (loss) on derivatives under hedge accounting (16,391) (14,457) (148,018)Foreign currency translation adjustments (1,527) (1,573) (13,798)Defined retirement benefit plans (Note 21) 378 2,089 3,415
Total 892,143 854,103 8,056,202Noncontrolling interests 4,498 1,930 40,623
Total equity 896,642 856,034 8,096,825Total liabilities and equity ¥ 9,571,172 ¥ 9,456,660 $ 86,429,222
See accompanying “Notes to Consolidated Financial Statements,” which are an integral part of these statements.
54
CONSOLIDATED BALANCE SHEET

SHINSEI BANK, LIMITED Integrated Report 2019
2019/07/10 8:13:49 / 19509946_株式会社新生銀行_総会その他(C)
CONSOLIDATED STATEMENT OFINCOMEShinsei Bank, Limited, and its Consolidated SubsidiariesFor the fiscal year ended March 31, 2019
Millions of yenThousands of
U.S. dollars (Note 1)
2019 2018 2019Interest income:
Interest on loans and bills discounted ¥ 140,177 ¥ 134,858 $ 1,265,827Interest and dividends on securities 12,531 11,705 113,158Interest on deposits with banks 1,162 1,069 10,501Other interest income 971 871 8,774
Total interest income 154,843 148,504 1,398,261Interest expenses:
Interest on deposits, including negotiable certificates of deposit 7,802 9,021 70,457Interest and discounts on debentures 0 3 1Interest on other borrowings 3,356 3,432 30,311Interest on corporate bonds 466 952 4,210Other interest expenses 9,401 6,318 84,900
Total interest expenses 21,027 19,728 189,878Net interest income 133,816 128,775 1,208,383
Fees and commissions income 55,332 50,129 499,665Fees and commissions expenses 23,981 25,059 216,558
Net fees and commissions 31,351 25,070 283,107Net trading income (loss) (Note 28) 6,673 8,542 60,265
Other business income (loss), net:Income on lease transactions and installment receivables, net 37,525 37,030 338,865Net gain (loss) on monetary assets held in trust 2,535 2,760 22,897Net gain (loss) on foreign exchanges 6,719 9,466 60,675Net gain (loss) on securities 378 9,936 3,415Net gain (loss) on other monetary claims purchased 809 1,193 7,307Other, net (Note 29) 9,886 9,253 89,279
Net other business income (loss) 57,854 69,641 522,438Total revenue 229,696 232,030 2,074,194
General and administrative expenses:Personnel expenses 56,509 56,249 510,288Premises expenses 19,679 20,065 177,713Technology and data processing expenses 23,265 20,810 210,088Advertising expenses 10,951 11,052 98,897Consumption and property taxes 10,406 9,389 93,976Deposit insurance premium 1,645 1,775 14,862Other general and administrative expenses 23,275 23,637 210,179
General and administrative expenses 145,734 142,981 1,316,002Amortization of goodwill and intangible assets acquired in business combinations 2,811 3,987 25,386Total general and administrative expenses 148,545 146,969 1,341,389Net business profit (loss) 81,150 85,060 732,805
Net credit costs (recoveries) (Note 30) 29,348 37,270 265,024Other gains (losses), net (Note 31) 2,782 7,621 25,123
Income (loss) before income taxes 54,584 55,411 492,904Income taxes (benefit) (Note 32):
Current 3,810 1,266 34,410Deferred (1,306) 2,574 (11,800)
Profit 52,080 51,570 470,293Profit (loss) attributable to noncontrolling interests (239) 156 (2,160)
Profit attributable to owners of the parent ¥ 52,319 ¥ 51,414 $ 472,453
Yen U.S. dollars (Note 1)Basic earnings per share (Note 33) ¥ 211.24 ¥ 199.01 $ 1.91Diluted earnings per share (Note 33) ¥ 211.22 ¥ 198.98 $ 1.91
See accompanying “Notes to Consolidated Financial Statements,” which are an integral part of these statements.Shinsei Bank executed a 1-for-10 reverse stock split on October 1, 2017. The above earnings per share data is calculated as if the reverse stock split had been implemented at the beginning of the fiscal year ended March 31, 2018.
55
CONSOLIDATED STATEMENT OF INCOME

SHINSEI BANK, LIMITED Integrated Report 2019
2019/07/10 8:13:49 / 19509946_株式会社新生銀行_総会その他(C)
CONSOLIDATED STATEMENT OFCOMPREHENSIVE INCOMEShinsei Bank, Limited, and its Consolidated SubsidiariesFor the fiscal year ended March 31, 2019
Millions of yenThousands of
U.S. dollars (Note 1)
2019 2018 2019Profit ¥ 52,080 ¥ 51,570 $ 470,293
Other comprehensive income (Note 34):Unrealized gain (loss) on available-for-sale securities (295) (5,968) (2,665)Deferred gain (loss) on derivatives under hedge accounting (1,933) (532) (17,463)Foreign currency translation adjustments (4) 219 (43)Defined retirement benefit plans (1,708) 3,434 (15,427)Share of other comprehensive income in affiliates 1,354 (1,248) 12,227
Total other comprehensive income (2,588) (4,095) (23,371)Comprehensive income ¥ 49,492 ¥ 47,474 $ 446,923Total comprehensive income attributable to:
Owners of the parent ¥ 49,692 ¥ 47,430 $ 448,729Noncontrolling interests (200) 43 (1,807)
See accompanying “Notes to Consolidated Financial Statements,” which are an integral part of these statements.
56
CONSOLIDATED STATEMENT OF COMPREHENSIVE INCOME

SHINSEI BANK, LIMITED Integrated Report 2019
2019/07/10 8:13:49 / 19509946_株式会社新生銀行_総会その他(C)
CONSOLIDATED STATEMENT OFCHANGES IN EQUITYShinsei Bank, Limited, and its Consolidated SubsidiariesFor the fiscal year ended March 31, 2019
Millions of yen
Accumulated other comprehensive income
Common stock Capital surplusStock acquisition
rights Retained earningsTreasury stock,
at cost
Unrealized gain(loss) on
available-for-salesecurities
Deferred gain(loss) on
derivativesunder hedgeaccounting
Foreign currencytranslation
adjustments
Definedretirement
benefit plans TotalNoncontrolling
interests Total equityBALANCE, March 31, 2017(April 1, 2017, as previously reported)
¥ 512,204 ¥ 78,506 ¥ 584 ¥ 312,538 ¥ (79,539) ¥ 10,299 ¥ (13,925) ¥ 199 ¥ (1,344) ¥ 819,524 ¥ 1,262 ¥ 820,786
Cumulative effect of accounting change of certain foreign affiliates accounted for by the equity method
- - - -
BALANCE, April 1, 2017(as restated) 512,204 78,506 584 312,538 (79,539) 10,299 (13,925) 199 (1,344) 819,524 1,262 820,786
Dividends (2,588) (2,588) (2,588)Profit attributable to owners of the parent 51,414 51,414 51,414Purchase of treasury stock (10,001) (10,001) (10,001)Disposal of treasury stock - - - -Cancellation of treasury stock - - - -Transfer to capital surplus from retained earnings - - - -Changes in ownership interest of the parent related to transactions with noncontrolling interests
(0) (0) (0)
Changes by forfeit of stock acquisition rights in a consolidated subsidiary
4 4 4
Changes by inclusion of consolidated subsidiaries (0) (0) (0)Changes by exclusion of consolidated subsidiaries - - -Transfer to retained earnings from unrealized gain (loss) on available-for-sale securities
- - -
Net change during the year (265) (5,112) (532) (1,772) 3,433 (4,248) 668 (3,580)BALANCE, March 31, 2018(April 1, 2018, as previously reported)
512,204 78,506 318 361,368 (89,540) 5,187 (14,457) (1,573) 2,089 854,103 1,930 856,034
Cumulative effect of accounting change of certain foreign affiliates accounted for by the equity method
(311) 4,307 3,996 3,996
BALANCE, April 1, 2018(as restated) 512,204 78,506 318 361,057 (89,540) 9,495 (14,457) (1,573) 2,089 858,099 1,930 860,030
Dividends (2,528) (2,528) (2,528)Profit attributable to owners of the parent 52,319 52,319 52,319Purchase of treasury stock (12,999) (12,999) (12,999)Disposal of treasury stock (78) 178 100 100Cancellation of treasury stock (64,632) 64,632 - -Transfer to capital surplus from retained earnings 64,710 (64,710) - -Changes in ownership interest of the parent related to transactions with noncontrolling interests
(0) (0) (0)
Changes by forfeit of stock acquisition rights in a consolidated subsidiary
1 1 1
Changes by inclusion of consolidated subsidiaries - - -Changes by exclusion of consolidated subsidiaries (1) (1) (1)Transfer to retained earnings from unrealized gain (loss) on available-for-sale securities
426 426 426
Net change during the year (219) 546 (1,933) 45 (1,711) (3,273) 2,567 (705)BALANCE, March 31, 2019 ¥ 512,204 ¥ 78,506 ¥ 99 ¥ 346,562 ¥ (37,729) ¥ 10,041 ¥ (16,391) ¥ (1,527) ¥ 378 ¥ 892,143 ¥ 4,498 ¥ 896,642
57
CONSOLIDATED STATEMENT OF CHANGES IN EQUITY

SHINSEI BANK, LIMITED Integrated Report 2019
2019/07/10 8:13:49 / 19509946_株式会社新生銀行_総会その他(C)
Thousands of U.S. dollars (Note 1)
Accumulated other comprehensive income
Common stock Capital surplusStock acquisition
rights Retained earningsTreasury stock,
at cost
Unrealized gain(loss) on
available-for-salesecurities
Deferred gain(loss) on
derivativesunder hedgeaccounting
Foreign currencytranslation
adjustments
Definedretirement
benefit plans TotalNoncontrolling
interests Total equityBALANCE, March 31, 2018(April 1. 2018, aspreviously reported)
$ 4,625,290 $ 708,926 $ 2,881 $ 3,263,219 $ (808,569) $ 46,843 $ (130,555) $ (14,206) $ 18,868 $ 7,712,695 $ 17,436 $ 7,730,131
Cumulative effect of accounting change of certain foreign affiliates accounted for by the equity method
(2,816) 38,900 36,085 36,085
BALANCE, April 1, 2018(as restated) 4,625,290 708,926 2,881 3,260,403 (808,569) 85,743 (130,555) (14,206) 18,868 7,748,780 17,436 7,766,216
Dividends (22,834) (22,834) (22,834)Profit attributable to owners of the parent 472,453 472,453 472,453Purchase of treasury stock (117,390) (117,390) (117,390)Disposal of treasury stock (706) 1,616 910 910Cancellation of treasury stock (583,644) 583,644 - -Transfer to capital surplus from retained earnings 584,350 (584,350) - -Changes in ownership interest of the parent related to transactions with noncontrolling interests
(0) (0) (0)
Changes by forfeit of stock acquisition rights in a consolidated subsidiary
10 10 10
Changes by inclusion of consolidated subsidiaries - - -Changes by exclusion of consolidated subsidiaries (17) (17) (17)Transfer to retained earnings from unrealized gain (loss) on available-for-sale securities
3,853 3,853 3,853
Net change during the year (1,985) 4,931 (17,463) 408 (15,453) (29,562) 23,187 (6,375)BALANCE, March 31, 2019 $ 4,625,290 $ 708,925 $ 896 $ 3,129,519 $ (340,699) $ 90,673 $ (148,018) $ (13,798) $ 3,415 $ 8,056,202 $ 40,623 $ 8,096,825
See accompanying “Notes to Consolidated Financial Statements,” which are an integral part of these statements.
58
CONSOLIDATED STATEMENT OF CHANGES IN EQUITY

SHINSEI BANK, LIMITED Integrated Report 2019
2019/07/10 8:13:49 / 19509946_株式会社新生銀行_総会その他(C)
CONSOLIDATED STATEMENT OFCASH FLOWSShinsei Bank, Limited, and its Consolidated SubsidiariesFor the fiscal year ended March 31, 2019
Millions of yenThousands of
U.S. dollars (Note 1)
2019 2018 2019Cash flows from operating activities:
Income (loss) before income taxes ¥ 54,584 ¥ 55,411 $ 492,904Adjustments for:
Income taxes paid (3,710) (825) (33,510)Depreciation (other than leased assets as lessor) 12,519 10,973 113,055Amortization of goodwill and intangible assets acquired in business combinations 2,811 3,987 25,386Impairment losses on long-lived assets 955 1,834 8,626Net change in reserve for credit losses (2,805) 686 (25,338)Net change in reserve for losses on interest repayments (16,527) (27,159) (149,243)Net change in other reserves (263) 338 (2,379)Interest income (154,843) (148,504) (1,398,261)Interest expenses 21,027 19,728 189,878Investment (gains) losses (4,129) (12,690) (37,286)Net exchange (gain) loss 5,278 2,306 47,665Net change in trading assets 880 38,818 7,951Net change in trading liabilities (2,219) (27,658) (20,038)Net change in loans and bills discounted (62,901) (62,490) (568,015)Net change in deposits, including negotiable certificates of deposit (145,026) 204,252 (1,309,608)Net change in debentures (423) (6,138) (3,820)Net change in borrowed money (other than subordinated debt) (40,483) (50,987) (365,576)Net change in corporate bonds (other than subordinated corporate bonds) 32,335 (21,200) 291,990Net change in interest-bearing deposits with banks (other than due from the Bank of Japan) (78,740) 37,444 (711,038)Net change in call loans, receivables under resale agreements,
receivables under securities borrowing transactions andother monetary claims purchased 5,848 11,379 52,813
Net change in call money, payables under repurchase agreements, payables undersecurities lending transactions, and short-term corporate bonds (liabilities) 240,246 69,061 2,169,468
Net change in foreign exchange assets and liabilities 3,333 (12,894) 30,105Interest received 157,568 147,408 1,422,870Interest paid (35,716) (20,104) (322,525)Net change in securities for trading purposes - (0) -Net change in monetary assets held in trust for trading purposes 4,702 4,541 42,464Net change in lease receivables and leased investment assets 17,511 20,060 158,133Other, net 2,133 (70,166) 19,270
Total adjustments (40,637) 112,003 (366,964)Net cash provided by (used in) operating activities 13,946 167,415 125,939
Cash flows from investing activities:Purchase of investments (1,923,233) (1,531,992) (17,367,106)Proceeds from sales of investments 1,552,842 1,363,117 14,022,420Proceeds from maturity of investments 271,477 147,769 2,451,488Purchase of premises and equipment (other than leased assets as lessor) (3,833) (3,441) (34,615)Purchase of intangible assets (other than leased assets as lessor) (18,249) (20,742) (164,793)Payment for acquisition of business (33,020) - (298,181)Proceeds from acquisition of the business 1,982 - 17,907Other, net (512) 1,001 (4,630)
Net cash provided by (used in) investing activities (152,545) (44,287) (1,377,511)Cash flows from financing activities:
Repayment of subordinated debt (12,400) - (111,974)Payment for redemption of subordinated corporate bonds (25,000) (6,400) (225,754)Proceeds from noncontrolling shareholders 2,770 838 25,018Dividends paid (2,528) (2,588) (22,834)Payment for purchase of treasury stock (12,999) (10,001) (117,390)Purchase of investments in subsidiaries not resulting in change in scope of consolidation (0) (185) (0)
Net cash provided by (used in) financing activities (50,158) (18,337) (452,935)Foreign currency translation adjustments on cash and cash equivalents 52 (84) 477Net change in cash and cash equivalents (188,704) 104,706 (1,704,030)Cash and cash equivalents at beginning of year 1,434,574 1,329,867 12,954,437Cash and cash equivalents at end of year (Note 4) ¥ 1,245,870 ¥ 1,434,574 $ 11,250,406
Note: Investments consist of securities and monetary assets held in trust for other than trading purposes.See accompanying “Notes to Consolidated Financial Statements,” which are an integral part of these statements.
59
CONSOLIDATED STATEMENT OF CASH FLOWS

SHINSEI BANK, LIMITED Integrated Report 2019
2019/07/10 8:13:49 / 19509946_株式会社新生銀行_総会その他(C)
NOTES TO CONSOLIDATEDFINANCIAL STATEMENTSShinsei Bank, Limited, and its Consolidated SubsidiariesFor the fiscal year ended March 31, 2019
1. BASIS OF PRESENTATION OF CONSOLIDATED FINANCIAL STATEMENTS CONSOLIDATED
The accompanying consolidated financial statements of Shinsei Bank, Limited (the “Bank”) and its consolidated subsidiaries (collectively, the “Group”), stated in Japanese yen, have been prepared on the basis of generally accepted accounting principles in Japan (“Japanese GAAP”) and in accordance with the Banking Act of Japan (the “Banking Act”), and compiled from the consolidated financial statements prepared under the provisions set forth in the Financial Instruments and Exchange Act of Japan, which are different in certain respects as to application and disclosure requirements of International Financial Reporting Standards(“IFRS”). Certain reclassifications and rearrangements have been made to the consolidated financial statements issued domestically in order to present them in a form which is more familiar to readers outside Japan. In addition, the accompanying notes include information that is not required under Japanese GAAP, but is presented herein for the convenience of readers. The preparation of consolidated financial statements in conformity with Japanese GAAP requires management to make estimates and assumptions that affect the reported amounts of assets and liabilities and disclosures of contingent
liabil it ies at the date of the consolidated financial statements and the reported amounts of revenues and expenses during the reporting period. Actual results could differ from those estimates. The consolidated financial statements are stated in Japanese yen, the currency of the country in which the Bank is incorporated and operates. The translations of Japanese yen amounts into U.S. dollar amounts are included solely for the convenience of readers outside Japan and have been made at the rate of ¥110.74 to U.S.$1.00, the rate of exchange prevailing on the Tokyo foreign exchange market on March 31, 2019. Such translations should not be construed as representations that the Japanese yen amounts could be converted into U.S. dollars at that or any other rate. Amounts of less than one million yen and one thousand U.S. dollars have been rounded down to the nearest million and rounded to the nearest thousand, respectively except for per share amounts in the presentation of the accompanying consolidated financial statements and the notes thereto. As a result, the totals in yen and U.S. dollars do not necessarily equal the sum of the individual amounts.
2. SUMMARY OF SIGNIFICANT ACCOUNTING POLICIES CONSOLIDATED
(A) PRINCIPLES OF CONSOLIDATIONThe Group determines its scope of consolidation under the concepts of control and influence. Those companies over which the Bank is able to directly or indirectly exercise control are fully consolidated, except if they are immaterial, judging from the financial position or results of operations, such as assets, ordinary income, profit (the Group's interest portion), retained earnings (the Group's interest portion) and accumulated other comprehensive income (the Group's interest portion) of the Group, or the control over the subsidiary is temporary, and those companies over which the Bank is able to directly or indirectly exercise significant influence are accounted for by the equity method, except if they are immaterial, judging from the financial position or results of operations, such as assets, ordinary income, profit (the Group's interest portion), retained earnings (the Group's interest portion) and accumulated other comprehensive income (the Group's interest portion) of the Group. The numbers of subsidiaries and affiliates as of March 31, 2019 and 2018 were as follows:
2019 2018Consolidated subsidiaries 83 83Unconsolidated subsidiaries 96 104Affiliates accounted for by the equity method 35 30Affiliates accounted for not applying the equity method 2 -
Shinsei Capital Partners, Ltd. and 6 other companies were newly consolidated due to their formation. Additionally, Godo Kaisha Koriyama 5 Gou and 3 other companies were excluded from the scope of consolidation
due to liquidation, gumi Ventures, L.P. was excluded from the scope of consol idat ion due to the loss of i ts controlling interest and APPM FUNDING DESIGNATED ACTIVITY COMPANY and 1 other company were excluded from the scope of consolidation due to their decreased materiality in the fiscal year ended March 31, 2019. LS Holdings Co., Ltd. and 5 other companies were newly included in the scope of application of the equity method due to their formation and Asuka Corporate Advisory Co., Ltd. and 1 other company were newly included in the scope of application of the equity method due to the acquisition of shares or interest. Additionally, Tin Pan Alley Investment Limited Partnership and 2 other companies were excluded from the scope of application of the equity method due to liquidation in the fiscal year ended March 31, 2019. Unconsolidated subsidiaries are primarily operating companies that are engaged in the leasing business under the Tokumei Kumiai (anonymous partnership) system. Under the Tokumei Kumiai system, assets, profits and losses essentially do not belong to individual operating companies or their parent companies but to the members of the anonymous partnership, and furthermore, as the Group does not have any material transactions with these subsidiaries, pursuant to Article 5, Paragraph 1, Section 2 and Article 10, Paragraph 1, Section 2 of the regulations concerning consolidated financial statements, respectively, these subsidiaries are excluded from the scope of consolidation and the scope of application of the equity method.
60
BASIS OF PRESENTATION OF CONSOLIDATED FINANCIAL STATEMENTS、SUMMARY OF SIGNIFICANT ACCOUNTING POLICIES

Notes to Consolidated Financial Statements
SHINSEI BANK, LIMITED Integrated Report 2019
2019/07/10 8:13:49 / 19509946_株式会社新生銀行_総会その他(C)
2. SUMMARY OF SIGNIFICANT ACCOUNTING POLICIES (CONTINUED) CONSOLIDATED
Other unconsolidated subsidiaries are excluded from the scope of consolidation and the scope of application of the equity method due to their immateriality to the financial position and operational results of the Group. H Holdings Co., Ltd. and 1 other company were excluded from the scope of application of the equity method because they are immaterial to the financial condition and results of operations, such as profit (the Group’s interest portion), retained earnings (the Group’s interest portion) and accumulated other comprehensive income (the Group’s interest portion) of the Group. ORTHOREBIRTH CO., LTD. was not treated as an affiliate because the objective for the Group to own the voting rights was merely to obtain capital gains and the fact meets the requirement according to Paragraph 24 of the Accounting Standards Board of Japan (the “ASBJ”) guidance No. 22 “Implementation Guidance on Determining a Subsidiary and an Affiliate.” Major consolidated subsidiaries as of March 31, 2019 are listed below:
Name LocationPercentageownership
APLUS FINANCIAL Co., Ltd. Japan 95.0%Showa Leasing Co., Ltd. Japan 100.0%Shinsei Personal Loan Co., Ltd. Japan 100.0%Shinsei Financial Co., Ltd. Japan 100.0%Shinsei Trust & Banking Co., Ltd. Japan 100.0%Shinsei Securities Co., Ltd. Japan 100.0%Shinsei Investment & Finance Limited Japan 100.0%
All significant inter-company transactions, related account balances and unrealized gains have been eliminated upon consolidation. As of March 31, 2019, the fiscal year ending dates were March 31 for 53 subsidiaries, September 30 for 3 subsidiaries, December 16 for 1 subsidiary, December 31 for 25 subsidiaries and February 28 for 1 subsidiary. Regarding the 4 companies of the Bank's consolidated subsidiaries which have fiscal year-end dates other than March 31, consolidation was performed utilizing its respective fiscal year-end financial statements prepared in accordance with the provisional settlements of accounts performed on March 31 and other consolidated subsidiaries have been consolidated utilizing their respective statements. Appropriate adjustments have been made for significant transactions that occurred during the period from the ending dates of their fiscal year to March 31, 2019. A major affiliate accounted for by the equity method as of March 31, 2019 is listed below:
Name LocationPercentageownership
Jih Sun Financial Holding Co., Ltd. Taiwan 36.2%
(B) GOODWILL AND INTANGIBLE ASSETS ACQUIRED INBUSINESS COMBINATIONS
The Bank recognized certain identifiable intangible assets in connection with the acquisition of Showa Leasing Co., Ltd. (“Showa Leasing”), Shinsei Financial Co., Ltd. (“Shinsei Financial”) and their consolidated subsidiaries, because they were separable such as contractual or other legal rights. The identified intangible assets with amortization method and period are listed below:
Showa LeasingIdentified intangible assets Amortization method Amortization periodCustomer relationship Sum-of-the-years digits 20 yearsSublease contracts Straight-line Subject to the
remainingcontract years
Shinsei FinancialIdentified intangible assets Amortization method Amortization periodTrade names and
trademarksStraight-line 10 years
Customer relationship Sum-of-the-years digits 10 years
The excess of the purchase price over the fair value of the net assets acquired, including identified intangible assets, was recorded as goodwill and is being amortized on a consistent basis primarily over 20 years. The amortization period of 20 years is the maximum period allowed under Japanese GAAP and was determined based upon the Bank's business strategy. With regard to the acquisitions executed before April 1, 2010, recorded with the previous accounting standard, when the purchase price was lower than the fair value of the net assets acquired, including identified intangible assets, the difference was recorded as negative goodwill and has been amortized on a straight-line basis primarily over 20 years, which is the maximum period allowed under the previous accounting standard.
(C) IMPAIRMENT OF GOODWILL AND INTANGIBLEASSETS ACQUIRED IN BUSINESS COMBINATIONS
The Bank conducts impairment testing for goodwill and intangible assets acquired in business combinations as a result of certain triggering events including:
• A result or an indication of an operating loss or negative cash flow for two consecutive years
• Impairment of underlying investment securities is recognized
• A material adverse change in the business environment surrounding subsidiaries, such as a change in law which significantly and negatively impacts their business
• Management decisions that could have an adverse effect on the value of goodwill and intangible assets which were acquired in business combination
As the first step of the impairment test, we estimate the undiscounted future cash flows of the business. If the value of the undiscounted future cash flows is less than the book value of the net assets, including goodwill and intangible assets acquired in business combination, of the business, it is determined that impairment exists.
61
SUMMARY OF SIGNIFICANT ACCOUNTING POLICIES

Notes to Consolidated Financial Statements
SHINSEI BANK, LIMITED Integrated Report 2019
2019/07/10 8:13:49 / 19509946_株式会社新生銀行_総会その他(C)
2. SUMMARY OF SIGNIFICANT ACCOUNTING POLICIES (CONTINUED) CONSOLIDATED
The next step of the impairment test is to measure the amount of the impairment loss, which is to compare the “value in use,” which is the recoverable amount calculated as the discounted value of future cash flows of the business, with the net asset book value which includes unamortized balances of goodwill and intangible assets acquired in business combination. Finally, the impairment loss on goodwill is calculated as the residual, (i) less (ii) below. ( i) Impairment loss for the total of goodwill and intangible assets acquired in business combination is recognized as an amount by which the net asset book value exceeds the “value in use.” The recoverable amount of intangible assets acquired in business combination is determined by discounted cash flow method (“DCF method”), which is also used to measure the acquired assets, and (ii) the impairment loss of intangible assets acquired in business combinations, is determined as the difference between the recoverable amount and book value.
(D) TRANSLATION OF FOREIGN CURRENCY FINANCIALSTATEMENTS AND TRANSACTIONS
(a) The financial statements of consolidated foreign sub- sidiaries are translated into Japanese yen at exchange rates as of their respective balance sheet dates, except for equity, which is translated at historical exchange rates. Differences arising from such trans- lation are shown as “Foreign currency translation adjustments” under accumulated other comprehensive income in a separate component of equity in the accompanying consolidated balance sheets.
(b) Foreign currency accounts held by consolidated foreign subsidiaries are translated into the functional currency of each subsidiary at exchange rates as of their respective balance sheet dates.
(c) Foreign currency-denominated assets and liabilities of the Bank and consolidated domestic subsidiaries are translated into Japanese yen at exchange rates as of their respective balance sheet dates, except for investments in unconsolidated subsidiaries and affiliates which are translated at the relevant historical exchange rates.
(E) CASH AND CASH EQUIVALENTSCash and cash equivalents in the consolidated statements of cash flows, consist of cash on hand, due from the Bank of Japan and noninterest-bearing deposits.
(F) OTHER MONETARY CLAIMS PURCHASEDOther monetary claims purchased held for trading purposes, except for those included in trading accounts, are recorded at fair value and unrealized gains and losses are recorded in “Other business income (loss), net.”
(G) VALUATION OF TRADING ACCOUNT ACTIVITIESTrading account positions entered into to generate gains arising from short-term changes in interest rates, currency exchange rates or market prices of financial instruments and other market-related indices, or from price differences among markets, are included in “Trading assets” and “Trading liabilities” on a trade-date basis.
Trading securities and monetary claims purchased for trading purposes are stated at market value and derivative financial instruments related to trading positions are stated at fair value based on estimated amounts that would be settled in cash if such positions were terminated at the end of the fiscal year, which reflects liquidity and credit risks. Trading income and trading losses include interest received and paid during the fiscal year and unrealized gains and losses resulting from the change in the value of securities, monetary claims purchased, and derivatives between the beginning and the end of the fiscal year.
(H) MONETARY ASSETS HELD IN TRUSTThe components of trust assets are accounted for based on the accounting standards appropriate for each asset type. Instruments held in trust for trading purposes are recorded at fair value and unrealized gains and losses are recorded in “Other business income (loss), net.” Instruments held in trust classified as available-for-sale are recorded at fair value with the corresponding unrealized gains and losses recorded directly in a separate component of equity. Instruments held in trust classified as available-for-sale of which fair value cannot be reliably determined are carried at cost.
(I) SECURITIESSecurities other than securities in (G) VALUATION OF TRADING ACCOUNT ACTIVITIES are classified into the four categories, principally based on management's intent to own the security, as follows:
(i) Trading securities are securities held in anticipation of gains arising from short-term changes in market value and/or held for resale to customers. Trading securities are carried at fair value with corresponding unrealized gains and losses recorded in “Other business income (loss), net.”
(ii) Securities being held to maturity are debt securities which management has both a positive intent and ability to hold until maturity. Securities being held to maturity are carried at amortized cost determined by the moving average method.
(iii) Available-for-sale securities are securities other than (i) trading securities and (ii) securities being held to maturity. Available-for-sale securities are carried at fair value with the corresponding unrealized gains and losses, net of applicable taxes, recorded directly in a separate component of equity, after deducting the amount charged to profit or loss by applying fair value hedge accounting. The cost of these securities upon sale is determined by the moving average method. Available-for-sale securities for which fair value cannot be reliably determined are carried at cost determined by the moving average method.
(iv) Investments in unconsolidated subsidiaries and affiliates that are not accounted for by the equity method are carried at cost determined by the moving average method . In add i t ion , investments in partnerships and others are carried at the amount of the Group's share of net asset value in their most recent financial statements.
62
SUMMARY OF SIGNIFICANT ACCOUNTING POLICIES

Notes to Consolidated Financial Statements
SHINSEI BANK, LIMITED Integrated Report 2019
2019/07/10 8:13:49 / 19509946_株式会社新生銀行_総会その他(C)
2. SUMMARY OF SIGNIFICANT ACCOUNTING POLICIES (CONTINUED) CONSOLIDATED
In the event individual securities (except for those whose fair value cannot be reliably determined), other than trading securities, experience a decline in fair value which is significant as compared to the acquisition cost of such securities, the securities are written down as the decline in fair value is deemed to be other than temporary.
(J) PREMISES AND EQUIPMENT“Premises and equipment” are stated at cost less accumu- lated depreciation. Depreciation of the Group's buildings and the Bank's computer equipment ( including ATMs) other than personal computers is computed principally using the straight-line method, and depreciation of other equipment is computed principally using the declining-balance method. Estimated useful lives of buildings and equipment as of March 31, 2019 are principally as follows:
Buildings........... 3 years to 50 yearsEquipment ...... 2 years to 20 years
(K) SOFTWARECapitalized software for internal use is depreciated using the straight-line method based on the Group's estimated useful lives (primarily 5 years to 15 years).
(L) IMPAIRMENT OF LONG-LIVED ASSETSLong-lived assets are reviewed for impairment whenever events or changes in circumstances indicate that the carrying amount of an asset or asset group may not be recoverable. An impairment loss is recognized if the carrying amount of an asset or asset group exceeds the sum of the undiscounted future cash flows expected to result from the continued use and eventual disposition of an asset or asset group. The impairment loss is measured as the amount by which the carrying amount of the asset exceeds its recoverable amount, which is the higher of the sum of discounted cash flows from the continuing use and eventual disposition of the asset, or the net selling price at disposition.
(M) DEFERRED CHARGESDeferred issuance expenses for debentures and corporate bonds are amortized using the straight-line method over the term of the debentures and corporate bonds.
(N) RESERVE FOR CREDIT LOSSESThe reserve for credit losses of the Bank and the con- solidated domestic trust and banking subsidiary has been established as described below based on the Bank's internal rules for establishing the reserve. For claims to obligors who are undergoing bankruptcy, special liquidation proceedings or similar legal procee-dings (“legally bankrupt obligors”) or to obligors who have not yet legally or formally gone bankrupt but who are substantially in bankruptcy because they are in serious financial difficulties and are not deemed to be capable of restructuring (“virtually bankrupt obligors”), a specific reserve is provided based on the amount of claims, after the charge-off stated below, net of amounts expected to be collected through the disposal of collateral or execution of guarantees.
For claims to obligors who are not yet in bankruptcy but are in financial difficulties and are very likely to go bankrupt in the future (“possibly bankrupt obligors”), except for claims to obligors with larger amount than predetermined one, a specific reserve is provided for the amount considered to be necessary based on an overall solvency assessment performed for the amount of claims net of amounts expected to be collected through the disposal of collateral or execution of guarantees. With regard to claims to possibly bankrupt obligors, restructured loans and certain claims for which the reserve has been provided based on the DCF method (as mentioned below) in previous fiscal years, provided that obligors' cash flows for debt service are reasonably estimable and the balance of claims to such obligors is at or larger than a predetermined amount, the reserve for credit losses is determined as the difference between (i) relevant estimated cash flows discounted by the original contractual interest rate and (ii) the book value of the claim (“DCF method”). In cases where it is difficult to reasonably estimate future cash flows, the reserve is provided based on the expected loss amount for the remaining term of respective claims. For other claims, a general reserve is provided based on historical loan loss experience. For specific foreign claims, there is a reserve for loans to restructuring countries which has been provided based on losses estimated by considering the political and eco- nomic conditions in those countries. All claims are assessed by sales promotion divisions and credit analysis divisions based on the predetermined internal rules for self-assessment of asset quality. The risk management divisions, which are independent from sales promotion divisions and credit analysis divisions, conduct verifications of these assessments, and additional reserves may be provided based on the verification results. The consolidated subsidiaries other than the domestic trust and banking subsidiary calculate the general reserve for general claims based on the actual historical loss ratio, and the specific reserve for claims to possibly bankrupt obligors, virtually bankrupt obligors and legally bankrupt obligors based on estimated losses, considering the recoverable value. For collateralized or guaranteed claims of the Bank and certain consolidated subsidiaries to legally bankrupt obligors or virtually bankrupt obligors, the amount of claims exceeding the estimated value of collateral or guarantees, which is deemed uncollectible, has been charged off in principal and totaled ¥53,786 million (U.S.$485,701 thousand) and ¥63,418 million as of March 31, 2019 and 2018, respectively.
(O) ACCRUED BONUSES FOR EMPLOYEES ANDDIRECTORS
Accrued bonuses for employees and directors are provided in the amount of the estimated bonuses which are attributable to each fiscal year.
63
SUMMARY OF SIGNIFICANT ACCOUNTING POLICIES

Notes to Consolidated Financial Statements
SHINSEI BANK, LIMITED Integrated Report 2019
2019/07/10 8:13:49 / 19509946_株式会社新生銀行_総会その他(C)
2. SUMMARY OF SIGNIFICANT ACCOUNTING POLICIES (CONTINUED) CONSOLIDATED
(P) EMPLOYEES' RETIREMENT BENEFITS AND PENSIONPLAN ASSETS
The Bank has a noncontributory defined benefit pension plan. APLUS Co., Ltd. (“APLUS”) and Showa Leasing have a noncontributory defined benefit pension plan and an unfunded severance indemnity plan. Shinsei Financial and certain consolidated domestic subsidiaries have unfunded severance indemnity plans. These plans cover substantially all of the Group's employees. The Group accounts for liabilities or assets for retirement benefits based on the projected benefit obligations and plan assets at the consolidated balance sheet date. The projected benefit obligations are allocated over the periods on a benefit formula basis. Actuarial gains and losses and past service costs that are yet to be recognized in profit or loss are recognized as “Accumulated other comprehensive income” in equity after tax effects, and are recognized in profit or loss over a certain period no longer than the expected average remaining service period of the employees. Certain consolidated subsidiaries recognize retirement benefit obligations at the amount that would be payable if employees retired voluntarily at the consolidated balance sheet date.
(Q) RESERVE FOR REIMBURSEMENT OF DEBENTURESThe reserve for reimbursement of debentures is provided for estimated losses on future reimbursement requests of debentures derecognized from liabilities.
(R) RESERVE FOR LOSSES ON INTEREST REPAYMENTSThe reserve for losses on interest repayments is provided for estimated losses on reimbursements of excess interest payments and loan losses related to consumer finance loans extended at interest rates in excess of the maximum interest rate prescribed in the Interest Rate Restriction Act of Japan. The reserve is established in the amount of the estimated future reimbursement requests based on past experience.
(S) ASSET RETIREMENT OBLIGATIONSAn asset retirement obligation is defined as a legal obligation imposed either by law or contract that results from the acquisition, construction, development and the normal operation of a tangible fixed asset. The asset retirement obligation is associated with the retirement of such tangible fixed asset. The asset retirement obligation is recognized as the sum of the discounted cash flows required for the future asset retirement and is recorded in the period in which the obligation is incurred. Upon initial recognition of a liability for an asset retirement obligation, an asset retirement cost is capitalized by increasing the carrying amount of the related fixed asset by the amount of the liability. The asset retirement cost is subsequently allocated to expense through depreciation over the remaining useful life of the asset. Over time, the liability is accreted to its present value each period. Any subsequent revisions to the timing or the amount of the original estimate of undiscounted cash flows are reflected as an adjustment to the carrying amount of the liability and the capitalized amount of the related asset retirement cost.
(T) STOCK OPTIONSThe Group measures the cost of employee stock options based on the fair value at the grant date and recognizes compensation expense over the vesting period as consideration for receiving goods or services. In the consolidated balance sheet, stock options are presented as “Stock acquisition rights” in a component of equity until the exercise of the right or the expiration of the period.
(U) LEASE TRANSACTIONS(As lessee)Finance lease transactions are capitalized by recognizing lease assets and lease obligations in the consolidated balance sheets. Depreciation of lease assets from f inance lease transactions that are deemed to transfer ownership of the leased property to the lessee, is computed using the same method as the one applied to owned assets. Depreciation of lease assets from finance lease transactions that are not deemed to transfer ownership of the leased property to the lessee is computed using the straight-line method over the leasing period. Residual values of lease assets are the guaranteed value determined in the lease contracts or zero for assets without such guaranteed value.
(As lessor)The Group recognizes finance leases that are deemed to transfer ownership of the leased property to the lessee as lease receivables, and finance leases that are not deemed to transfer ownership of the leased property to the lessee as leased investment assets. In addition, depreciation of tangible leased assets as lessor for operating lease transactions is computed using the straight-line method over the leasing period assuming that residual values are the disposal price estimable at the end of the estimated leasing period. Profit on each finance lease transaction is calculated on the basis of the internal rate of return of each transaction. With regard to finance lease transactions entered into prior to April 1, 2008, that are not deemed to transfer ownership of the leased property to the lessee, leased investment assets are recognized at those book values of leased properties as of March 31, 2008, according to the transitional provision of the accounting standard. As a result of this transitional treatment, “Income before income taxes” increased by ¥90 mill ion (U.S.$819 thousand) and ¥103 million for the fiscal years ended March 31, 2019 and 2018, respectively, as compared to what would have been reported if the revised accounting standard was applied retroactively to all finance lease transactions as lessor.
(V) INSTALLMENT SALES FINANCE ANDCREDIT GUARANTEES
Fees from installment sales finance have principally been prorated over the respective installment periods by using the sum-of-the-months digits method, or by using the credit-balance method. Fees from credit guarantees have been recognized by the sum-of-the-months digits method, the straight-line method or the credit-balance method over the contract terms.
64
SUMMARY OF SIGNIFICANT ACCOUNTING POLICIES
Notes to Consolidated Financial Statements
SHINSEI BANK, LIMITED Integrated Report 2019
2019/07/10 8:13:49 / 19509946_株式会社新生銀行_総会その他(C)
2. SUMMARY OF SIGNIFICANT ACCOUNTING POLICIES (CONTINUED) CONSOLIDATED
(W) REVENUE RECOGNITION FOR INTEREST ONCONSUMER LENDING BUSINESS
Consolidated subsidiaries specializing in the consumer lending business accrued interest income at the balance sheet date at the lower of the amount determined using a rate permissible under the Interest Rate Restriction Act of Japan and the amount determined using rates on contracts with customers.
(X) INCOME TAXESDeferred income taxes relating to temporary differences between financial reporting and tax bases of assets and liabilities and tax loss carryforwards have been recognized. The asset and liability approach is used to recognize deferred income taxes. The Bank files its corporate income tax return under the consol idated corporate tax system, which al lows companies to base tax payments on the combined profits and losses of the Bank and its wholly-owned domestic subsidiaries. A valuation allowance is deducted from the carrying amount of deferred tax assets to the extent that it is not considered that taxable profit will be estimated to be sufficient enough to allow the benefit of part or all of the deferred tax assets to be realized.
(Y) DERIVATIVES AND HEDGE ACCOUNTINGDerivatives are stated at fair value. Except for derivatives in (G) VALUATION OF TRADING ACCOUNT ACTIVITIES, derivative transactions that meet hedge accounting criteria are primarily accounted for using the deferral method whereby unrealized gains and losses are deferred in a separate component of equity until the gains and losses on the hedged items are realized.
(a) Hedge of interest rate risksDerivative transactions that meet hedge accounting criteria for mitigating interest rate risks of the Bank's financial assets and liabilities are accounted for using the deferral method. The Bank adopted portfolio hedging to determine the effectiveness of its hedging instruments in accordance with "Accounting and Auditing Treatment of Accounting Standards for Financial Instruments in the Banking Industry" (Industry Audit Committee Report No. 24 issued, on February 13, 2002, by the Japanese Institute of Certified Public Accountants (“JICPA”)) . Under portfolio hedging activities to mitigate the change in fair value, a portfolio of hedged items with common maturities such as deposits or loans is designated and matched with a group of hedging instruments such as interest rate swaps, which offset the effect of fair value fluctuations of the hedged items by identified maturities. The effectiveness of portfolio hedging is assessed by each group. As for portfolio hedging activities to fix cash flows, the effectiveness is assessed based on the correlation between the base interest rate index of the hedged cash flow and that of the hedging instrument. The interest rate swaps of certain consolidated sub- sidiaries which qualify for hedge accounting and meet specific matching criteria are not measured at fair value, but the net payments or receipts under the swap
agreements are recognized and included in interest expenses or income. Other certain consolidated subsidiaries apply deferral hedge accounting.
(b) Hedge of foreign exchange fluctuation risksThe Bank applies either deferral hedge accounting or fair value hedge accounting in accordance with "Accounting and Auditing Treatment of Accounting Standards for Foreign Exchange Transactions in the Banking Industry" (Industry Audit Committee Report No. 25 issued, on July 29, 2002, by of the JICPA), to the derivative transactions that meet the hedge accounting criteria for mitigating foreign currency fluctuation risks of its financial assets and liabilities. Funding swap transactions are foreign exchange swaps, and consist of spot foreign exchange contracts bought or sold and forward foreign exchange contracts bought or sold. Such transactions are contracted for the purpose of lending or borrowing in a different currency and converting the corresponding principal equivalents and foreign currency equivalents to pay and r ece i ve , whose amoun t s and due da te s a r e predetermined at the time of the transactions, into forward foreign exchange contracts bought or sold. Under deferral hedge accounting, hedged items are i den t i f i ed by g roup ing t he f o re i gn cu r r ency -denominated financial assets and liabilities by currency and designating derivative transactions such as currency swap transactions, funding swap transactions and fo rward exchange con t rac t s as hedg ing instruments. Hedge effectiveness is assessed by confirming that the total foreign currency position of the hedged items is equal to or larger than that of hedging instruments. The Bank also applies deferral hedge accounting and fair value hedge accounting to translation gains or losses from foreign currency assets of net investments in foreign unconsolidated subsidiaries, affiliates and securit ies avai lable- for-sale (other than bonds denominated in foreign currencies) when such foreign currency exposures recorded as assets are hedged with offsetting foreign currency liabilities and the liabilities equal or exceed the acquisition cost of such foreign currency assets.
(c) Inter-company and intra-company derivative transactionsGains and losses on inter-company and intra-company derivative hedging transactions between the trading book and the banking book are not eliminated since o f f set t ing t ransact ions wi th th i rd par t ies a re appropriately entered into in conformity with the nonarbitrary and strict hedging policy in accordance with Industry Audit Committee Reports No. 24 and No. 25 of the JICPA. As a result, in the banking book, realized gains and losses on such inter-company and intra-company transactions are reported in current earnings and valuation gains and losses which meet the hedge accounting criteria are deferred. On the other hand, in the trading book, realized gains and losses and valuation gains and losses on such inter-company and intra-company transactions are substantially offset with covering contracts entered into with third parties.
65
SUMMARY OF SIGNIFICANT ACCOUNTING POLICIES

Notes to Consolidated Financial Statements
SHINSEI BANK, LIMITED Integrated Report 2019
2019/07/10 8:13:49 / 19509946_株式会社新生銀行_総会その他(C)
2. SUMMARY OF SIGNIFICANT ACCOUNTING POLICIES (CONTINUED) CONSOLIDATED
(Z) PER SHARE INFORMATIONBasic earnings per share (“EPS”) calculations represent profit attributable to owners of the parent which is available to common shareholders, divided by the weighted average number of outstanding shares of common stock during the respective period, retroactively adjusted for stock splits and reverse stock splits. Diluted EPS calculations consider the dilutive effect of common stock equiva lents , which inc lude stock acquisition rights, assuming that stock acquisition rights were fully exercised at the time of issuance for those issued during the period and at the beginning of the period for those previously issued and outstanding at the beginning of the period.
(AA) NEW ACCOUNTING PRONOUNCEMENTS(a)“Accounting Standard for Revenue Recognition” (ASBJ
Statement No.29, March 30, 2018)“Implementation Guidance on Accounting Standard for
Revenue Recognition” (ASBJ Guidance No.30, March 30, 2018)
On March 30, 2018, the ASBJ issued ASBJ Statement No. 29, “Accounting Standard for Revenue Recognition,” and ASBJ Guidance No. 30, “Implementation Guidance on Accounting Standard for Revenue Recognition.” This statement and guidance were established taking the core principles of IFRS 15 “Revenue from contracts with customers” and adding alternative treatments, to the extent that comparability is not impaired, for any practices which have been applied in Japan. The core principle of the standard and guidance is that an entity should recognize revenue to depict the transfer of promised goods or services to customers in an amount that reflects the consideration to which the entity expects to be entitled in exchange for those goods or services. An entity should recognize revenue in accordance with that core principle by applying the following steps:Step 1: Identify the contract(s) with a customerStep 2: Identify the performance obligations in the contractStep 3: Determine the transaction priceStep 4: Allocate the transaction price to the performance
obligations in the contractStep 5: Recognize revenue when (or as) the entity satisfies
a performance obligationThe accounting standard and guidance are effective for annual periods beginning on or after April 1, 2021. Earlier application is permitted for annual periods beginning on or after April 1, 2018.The Group expects to apply the accounting standard and guidance for annual periods beginning on or after April 1, 2021, and is in the process of measuring the effects of applying the accounting standard and guidance in future applicable periods.
(b)“Practical Solution on Unification of Accounting Policies Applied to Associates Accounted for Using the Equity Method” (ASBJ Practical Issues Task Force (PITF) No. 24, September 14, 2018)
(i) OutlineThis accounting standard was revised mainly in the part of the consolidation process for foreign affiliates which are accounted for by the equity method. When the affiliates elected to present as other comprehensive income for subsequent changes in the fair value of investments in equity instruments, the changes in fair value should be recycled from other comprehensive income to profit and loss, for the period in which those instruments are disposed.
(ii) Effective dateThe Group plans to apply this accounting standard from the beginning of the fiscal year beginning on April 1, 2019.
(iii) The impact of the applicationThe impact of the application is under evaluation at the time of the preparation of these consolidated financial statements.
(AB) SUPPLEMENTARY INFORMATIONFrom the beginning of the fiscal year ended March 31, 2019, certain foreign affiliates accounted for by the equity method of the Bank, have adopted IFRS 9 “Financial Instruments.” IFRS 9 sets out new requirements with regards to classification and measurement of financial instruments, impairment and hedge accounting. In accordance with the accepted transitional provisions under this standard, the Group recognized the amount of the cumulative effect of the accounting change on "Retained earnings," and "Unrealized gain (loss) on available-for-sale securities” at the beginning of the fiscal year ended March 31, 2019. As a result, “Retained Earnings” as of April 1, 2018, decreased by ¥311 million (U.S.$2,816 thousand), and “Unrealized gain (loss) on available-for-sale securities” as of April 1, 2018, increased by ¥4,307 million (U.S.$38,900 thousand), respectively.
66
SUMMARY OF SIGNIFICANT ACCOUNTING POLICIES

Notes to Consolidated Financial Statements
SHINSEI BANK, LIMITED Integrated Report 2019
2019/07/10 8:13:49 / 19509946_株式会社新生銀行_総会その他(C)
3. BUSINESS COMBINATION CONSOLIDATED
(Succession of business by absorption-type company split)Shinsei Financial Co., Ltd., a wholly-owned subsidiary of the Bank, succeeded a partial financial business relating to consumer mortgage loans from CFJ Godo Kaisha (the former DIC FINANCE CO., LTD., a group company of Citigroup Inc.) on January 15, 2019 as the effective date, pursuant to the “SALE AND PURCHASE AGREEMENT” dated on October 5, 2018 and the absorption-type company split contract dated on November 14, 2018.
(A) Outline of the business combination
(a) Names and business description of the splitting entityName: CFJ Godo KaishaDivested business: A partial financial business relating to consumer mortgage loans
(b) Purpose of the successionFor a revenue growth of the Group.
(c) Date on which the business combination was effectedJanuary 15, 2019
(d) Legal form of the business combinationAbsorption-type company split; Succeeding entity: Shinsei Financial Co., Ltd.
Splitting entity: CFJ Godo Kaisha(e) Name of the company after the business combination
Shinsei Financial Co., Ltd.(f) Basis for determination of the acquiring company
Shinsei Financial Co., Ltd. succeeded the partial financial business relating to consumer mortgage loans of CFJ Godo Kaisha by cash.
(B) Period of the acquired business’s financial result included in the consolidated statement of income of the Group
From January 15, 2019 to March 31, 2019
(C) Acquisition costs of the succeeded business and their breakdown
Shinsei Financial Co., Ltd. paid cash ¥9,154 million to CFJ Godo Kaisha for this split.
(D) Major acquisition-related costs and their breakdown Advisory fees etc., ¥12 million
(E) Amount, reason of the occurrence, and amortization method and period, of goodwill(a) Amount of goodwill incurred ¥1,111 million(b) Reason for recognizing goodwill The goodwill results mainly from excess earnings expected by business development.(c) Amortization method and the period Straight-line method over 5 years
(F) Amounts and breakdown of succeeded assets and liabilities on the date of the business combination(a) Assets Millions of yen Total assets........................................................... 14,400 Loans....................................................................... 10,609
(b) Liabilities Millions of yen Total liabilities........................................................ 6,357 Reserve for losses on interest repayments... 4,865
(G) Approximate amounts and their calculation method of impact on the consolidated statement of income for the fiscal year ended March 31, 2019, assuming that the business combination had been completed at the beginning of the fiscal year
The approximate amounts have not been disclosed since they are immaterial.
67
BUSINESS COMBINATION

Notes to Consolidated Financial Statements
SHINSEI BANK, LIMITED Integrated Report 2019
2019/07/10 8:13:49 / 19509946_株式会社新生銀行_総会その他(C)
4. CASH AND CASH EQUIVALENTS CONSOLIDATED
The reconciliation of cash and cash equivalents and cash and due from banks in the consolidated balance sheets as of March 31, 2019 and 2018 was as follows:
Millions of yenThousands ofU.S. dollars
2019 2018 2019Cash and due from banks ¥ 1,355,966 ¥ 1,465,663 $ 12,244,592Interest-bearing deposits included in due from banks (other than due from the Bank of Japan) (110,096) (31,089) (994,185)Cash and cash equivalents ¥ 1,245,870 ¥ 1,434,574 $ 11,250,406
5. OTHER MONETARY CLAIMS PURCHASED CONSOLIDATED
(a) Other monetary claims purchased as of March 31, 2019 and 2018 consisted of the following:
Millions of yenThousands ofU.S. dollars
2019 2018 2019Trading purposes ¥ 2,853 ¥ 1,705 $ 25,769Other 28,141 34,626 254,119
Total ¥ 30,994 ¥ 36,332 $ 279,888
(b) The fair value and the unrealized loss which is included in net gain (loss) on other monetary claims purchased for trading purposes as of March 31, 2019 and 2018 were as follows:
Millions of yen Thousands of U.S. dollars2019 2018 2019
Fair value Unrealized loss Fair value Unrealized loss Fair value Unrealized lossTrading purposes ¥ 2,853 ¥ 256 ¥ 1,705 ¥ 635 $ 25,769 $ 2,313
6. TRADING ASSETS CONSOLIDATED
Trading assets as of March 31, 2019 and 2018 consisted of the following:
Millions of yenThousands ofU.S. dollars
2019 2018 2019Trading securities ¥ 3,445 ¥ 4,589 $ 31,113Derivatives for trading securities - 1,928 -Derivatives for securities held to hedge trading transactions 7,432 13,134 67,114Trading-related financial derivatives 193,537 185,642 1,747,675
Total ¥ 204,415 ¥ 205,295 $ 1,845,901
7. MONETARY ASSETS HELD IN TRUST CONSOLIDATED
(a) Monetary assets held in trust as of March 31, 2019 and 2018 consisted of the following:
Millions of yenThousands ofU.S. dollars
2019 2018 2019Trading purposes ¥ 12,553 ¥ 17,255 $ 113,356Other 293,325 217,668 2,648,781
Total ¥ 305,879 ¥ 234,924 $ 2,762,137
68
CASH AND CASH EQUIVALENTS、OTHER MONETARY CLAIMS PURCHASED、TRADING ASSETS、MONETARY ASSETS HELD IN TRUST

Notes to Consolidated Financial Statements
SHINSEI BANK, LIMITED Integrated Report 2019
2019/07/10 8:13:49 / 19509946_株式会社新生銀行_総会その他(C)
7. MONETARY ASSETS HELD IN TRUST (CONTINUED) CONSOLIDATED
(b) The fair value and the unrealized gain or loss which is included in net gain (loss) on monetary assets held in trust for trading purposes as of March 31, 2019 and 2018 were as follows:
Millions of yen Thousands of U.S. dollars2019 2018 2019
Fair value Unrealized loss Fair value Unrealized gain Fair value Unrealized lossTrading purposes ¥ 12,553 ¥ 170 ¥ 17,255 ¥ 13 $ 113,356 $ 1,541
(c) The acquisition cost and the carrying amount of monetary assets held in trust for other than trading purposes as of March 31, 2019 and 2018 were as follows:
Millions of yen2019 2018
Acquisitioncost
Grossunrealized
gain
Grossunrealized
lossCarryingamount
Acquisitioncost
Grossunrealized
gain
Grossunrealized
lossCarryingamount
Other ¥ 294,432 ¥ 247 ¥ 1,353 ¥ 293,325 ¥ 218,191 ¥ 104 ¥ 626 ¥ 217,668Thousands of U.S. dollars
2019
Acquisitioncost
Grossunrealized
gain
Grossunrealized
lossCarryingamount
Other $2,658,769 $ 2,233 $ 12,221 $2,648,781
8. SECURITIES CONSOLIDATED
(a) Securities as of March 31, 2019 and 2018 consisted of the following:
Millions of yenThousands ofU.S. dollars
2019 2018 2019Trading securities ¥ 0 ¥ 0 $ 0Securities being held to maturity 399,201 481,303 3,604,853Securities available for sale:
Securities carried at fair value 624,563 534,752 5,639,907Securities carried at cost whose fair value cannot be reliably determined 35,658 42,757 322,001
Investments in unconsolidated subsidiaries and affiliates 70,863 64,708 639,908Total ¥ 1,130,286 ¥ 1,123,522 $ 10,206,669
The above balances do not include securities held in connection with securities borrowing transactions with or without cash collateral, securities purchased under resale agreements or securities accepted as collateral for derivative transactions, where the Group has the right to sell or pledge such securities without restrictions. The balances of those securities as of March 31, 2019 and 2018 were ¥5,643 million (U.S.$50,965 thousand) and ¥6,960 million, respectively. The amount of guarantee obligations for privately-placed bonds (Paragraph 3 of Article 2 of the Financial Instruments and Exchange Act) included in securities as of March 31, 2019 and 2018 were ¥3,580 million (U.S.$32,328 thousand) and ¥1,000 million, respectively.
69
MONETARY ASSETS HELD IN TRUST、SECURITIES
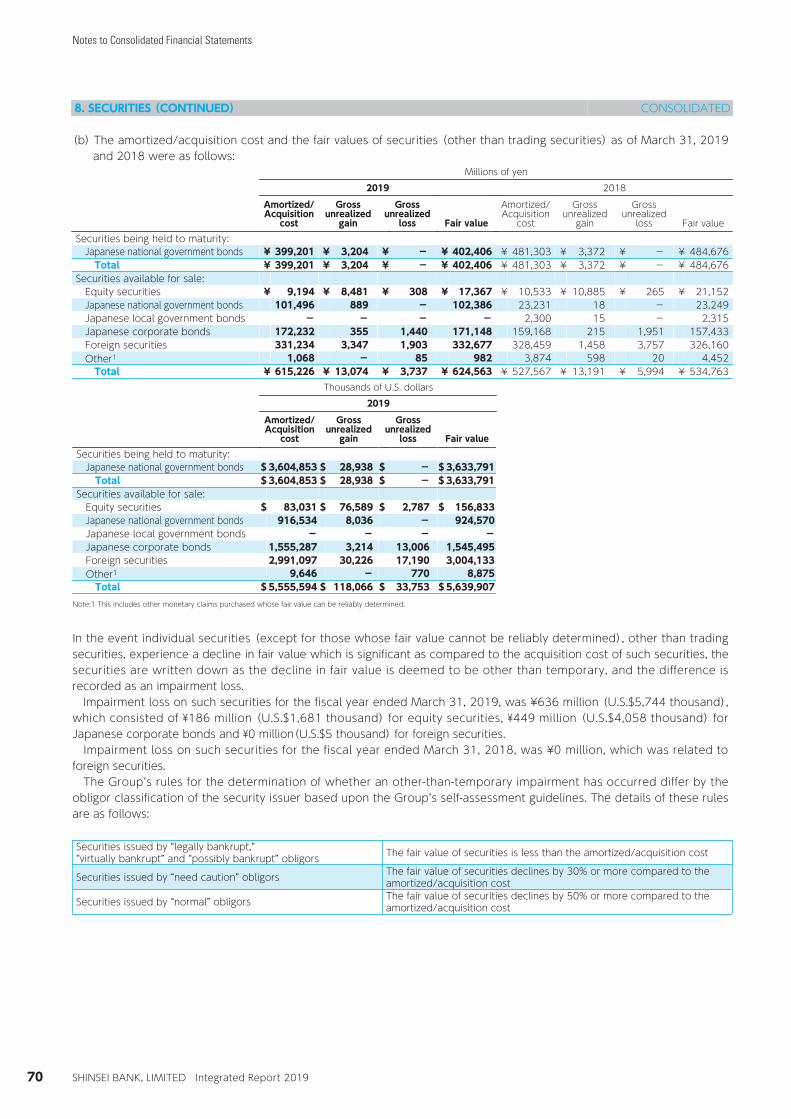
Notes to Consolidated Financial Statements
SHINSEI BANK, LIMITED Integrated Report 2019
2019/07/10 8:13:49 / 19509946_株式会社新生銀行_総会その他(C)
8. SECURITIES (CONTINUED) CONSOLIDATED
(b) The amortized/acquisition cost and the fair values of securities (other than trading securities) as of March 31, 2019 and 2018 were as follows:
Millions of yen2019 2018
Amortized/Acquisition
cost
Grossunrealized
gain
Grossunrealized
loss Fair value
Amortized/Acquisition
cost
Grossunrealized
gain
Grossunrealized
loss Fair valueSecurities being held to maturity:
Japanese national government bonds ¥ 399,201 ¥ 3,204 ¥ - ¥ 402,406 ¥ 481,303 ¥ 3,372 ¥ - ¥ 484,676Total ¥ 399,201 ¥ 3,204 ¥ - ¥ 402,406 ¥ 481,303 ¥ 3,372 ¥ - ¥ 484,676
Securities available for sale:Equity securities ¥ 9,194 ¥ 8,481 ¥ 308 ¥ 17,367 ¥ 10,533 ¥ 10,885 ¥ 265 ¥ 21,152Japanese national government bonds 101,496 889 - 102,386 23,231 18 - 23,249Japanese local government bonds - - - - 2,300 15 - 2,315Japanese corporate bonds 172,232 355 1,440 171,148 159,168 215 1,951 157,433Foreign securities 331,234 3,347 1,903 332,677 328,459 1,458 3,757 326,160Other1 1,068 - 85 982 3,874 598 20 4,452
Total ¥ 615,226 ¥ 13,074 ¥ 3,737 ¥ 624,563 ¥ 527,567 ¥ 13,191 ¥ 5,994 ¥ 534,763Thousands of U.S. dollars
2019Amortized/Acquisition
cost
Grossunrealized
gain
Grossunrealized
loss Fair valueSecurities being held to maturity:
Japanese national government bonds $ 3,604,853 $ 28,938 $ - $ 3,633,791Total $ 3,604,853 $ 28,938 $ - $ 3,633,791
Securities available for sale:Equity securities $ 83,031 $ 76,589 $ 2,787 $ 156,833Japanese national government bonds 916,534 8,036 - 924,570Japanese local government bonds - - - -Japanese corporate bonds 1,555,287 3,214 13,006 1,545,495Foreign securities 2,991,097 30,226 17,190 3,004,133Other1 9,646 - 770 8,875
Total $ 5,555,594 $ 118,066 $ 33,753 $ 5,639,907Note:1 This includes other monetary claims purchased whose fair value can be reliably determined.
In the event individual securities (except for those whose fair value cannot be reliably determined), other than trading securities, experience a decline in fair value which is significant as compared to the acquisition cost of such securities, the securities are written down as the decline in fair value is deemed to be other than temporary, and the difference is recorded as an impairment loss. Impairment loss on such securities for the fiscal year ended March 31, 2019, was ¥636 million (U.S.$5,744 thousand), which consisted of ¥186 million (U.S.$1,681 thousand) for equity securities, ¥449 million (U.S.$4,058 thousand) for Japanese corporate bonds and ¥0 million(U.S.$5 thousand) for foreign securities. Impairment loss on such securities for the fiscal year ended March 31, 2018, was ¥0 million, which was related to foreign securities. The Group’s rules for the determination of whether an other-than-temporary impairment has occurred differ by the obligor classification of the security issuer based upon the Group’s self-assessment guidelines. The details of these rules are as follows:
Securities issued by “legally bankrupt,”“virtually bankrupt” and “possibly bankrupt” obligors The fair value of securities is less than the amortized/acquisition cost
Securities issued by “need caution” obligors The fair value of securities declines by 30% or more compared to theamortized/acquisition cost
Securities issued by “normal” obligors The fair value of securities declines by 50% or more compared to theamortized/acquisition cost
70
SECURITIES

Notes to Consolidated Financial Statements
SHINSEI BANK, LIMITED Integrated Report 2019
2019/07/10 8:13:49 / 19509946_株式会社新生銀行_総会その他(C)
8. SECURITIES (CONTINUED) CONSOLIDATED
“Legally bankrupt” obligors are those who have already gone bankrupt from a legal and/or formal perspective.“Virtually bankrupt” obligors are those who have not yet legally or formally gone bankrupt but who are substantially in bankruptcy because they are in serious financial difficulties and are not deemed to be capable of restructuring.“Possibly bankrupt” obligors are those who are not yet in bankruptcy but are in financial difficulties and are very likely to go bankrupt in the future.“Need caution” obligors are those who are in need of close attention because there are problems with their borrowings.“Normal” obligors are those whose business conditions are favorable and who are deemed not to have any particular problems in their financial position.
(c) Unrealized gain (loss) on available-for-sale securities as of March 31, 2019 and 2018 consisted of the following:
Millions of yenThousands ofU.S. dollars
2019 2018 2019Unrealized gain (loss) before deferred tax on:
Available-for-sale securities ¥ 9,336 ¥ 7,196 $ 84,313The Group’s interests in available-for-sale securities held by partnerships recorded
as securities whose fair value cannot be reliably determined and other adjustments (1,468) 283 (13,260)Other monetary assets held in trust (1,106) (522) (9,988)
Deferred tax liabilities (1,477) (1,377) (13,341)Unrealized gain (loss) on available-for-sale securities before interest adjustments 5,284 5,579 47,723Noncontrolling interests - (13) -The Group’s interests in unrealized gain (loss) on available-for-sale securities
held by affiliates to which the equity method is applied 4,756 (378) 42,951Unrealized gain (loss) on available-for-sale securities ¥ 10,041 ¥ 5,187 $ 90,673
(d) Available-for-sale securities sold during the fiscal year ended March 31, 2019 and 2018 were as follows:Millions of yen
2019 2018
Proceedsfrom sales Gains on sales Losses on sales
Proceedsfrom sales Gains on sales Losses on sales
Available-for-sale securities sold:Equity securities ¥ 1,516 ¥ 530 ¥ 242 ¥ 11,521 ¥ 7,032 ¥ 18Japanese national government bonds 571,927 1,074 143 330,840 692 11Japanese local government bonds 27,572 40 25 26,103 12 27Japanese corporate bonds 58,517 113 4 95,075 212 7Foreign securities 730,211 3,069 990 662,215 3,370 1,061Other 5,314 719 28 28,737 1,223 427
Total ¥ 1,395,060 ¥ 5,548 ¥ 1,433 ¥ 1,154,493 ¥ 12,545 ¥ 1,552Thousands of U.S. dollars
2019
Proceedsfrom sales Gains on sales Losses on sales
Available-for-sale securities sold:Equity securities $ 13,694 $ 4,787 $ 2,186Japanese national government bonds 5,164,598 9,700 1,299Japanese local government bonds 248,987 365 227Japanese corporate bonds 528,423 1,026 40Foreign securities 6,593,928 27,723 8,944Other 47,988 6,501 253
Total $ 12,597,618 $ 50,101 $ 12,948
71
SECURITIES

Notes to Consolidated Financial Statements
SHINSEI BANK, LIMITED Integrated Report 2019
2019/07/10 8:13:49 / 19509946_株式会社新生銀行_総会その他(C)
9. LOANS AND BILLS DISCOUNTED CONSOLIDATED
Loans and bills discounted as of March 31, 2019 and 2018 consisted of the following:
Millions of yenThousands ofU.S. dollars
2019 2018 2019Loans on deeds ¥ 4,228,572 ¥ 4,126,777 $ 38,184,689Loans on bills 10,474 10,686 94,590Bills discounted 2,337 2,603 21,105Overdrafts 745,455 755,896 6,731,580
Total ¥ 4,986,839 ¥ 4,895,963 $ 45,031,963
(a) Risk-monitored loansLoans and bills discounted include loans to bankrupt obligors of ¥4,836 million (U.S.$43,673 thousand) and ¥5,622 million as of March 31, 2019 and 2018, res- pectively, as well as nonaccrual delinquent loans of ¥28,383 million (U.S.$256,305 thousand) and ¥31,178 million as of March 31, 2019 and 2018, respectively. Nonaccrual delinquent loans include loans classified as “possibly bankrupt” and “virtually bankrupt” under the Group's self-assessment guidelines. In addition to nonaccrual delinquent loans as defined, certain other loans classified as “substandard” under the Group's self-assessment guidelines include loans past due for three months or more. Loans past due for three months or more consist of loans for which the principal and/or interest is three months or more past due, but excluding loans to bankrupt obligors and nonaccrual delinquent loans. The balances of loans past due for three months or more as of March 31, 2019 and 2018 were ¥880 million (U.S.$7,950 thousand) and ¥1,842 million, respectively. Restructured loans are loans where the Group relaxes lending conditions, such as by reducing the original interest rate, or by forbearing interest payments or principal repayments to support the borrower's re- organization, but excluding loans to bankrupt obligors, nonaccrual delinquent loans or loans past due for three months or more. The outstanding balances of restructured loans as of March 31, 2019 and 2018 were ¥43,458 million (U.S.$392,439 thousand) and ¥36,257 million, respectively.
(b) Loan participationsThe total amounts accounted for as the transfer of loans by loan participations as of March 31, 2019 and 2018 were ¥7,477 million (U.S.$67,524 thousand) and ¥7,811 million, respectively. This “offbalance sheet” treatment is in accordance with guidelines issued by the JICPA. The total
amounts of such loans in which the Bank participated were ¥12,400 million (U. S. $111,980 thousand) and ¥12,974 mil l ion as of March 31, 2019 and 2018, respectively.
(c) Bills discountedBills discounted, such as bank acceptances bought, commercial bills discounted, documentary bills and foreign exchange contracts bought, are accounted for as financing transactions in accordance with Industry Audit Committee Report No. 24 issued by the JICPA, although the Group has the right to sell or pledge them without restrictions. The face amounts of such bills discounted held as of March 31, 2019 and 2018 were ¥2,337 million (U.S.$21,105 thousand) and ¥2,603 million, respectively.
(d) Loan commitmentsThe Bank and certain consolidated subsidiaries set credit lines of overdrafts and issue commitments to extend credit to meet the financing needs of customers. The unfulfilled amounts of these commitments were ¥3,041,385 million (U.S.$27,464,198 thousand) and ¥3,348,354 million as of March 31, 2019 and 2018, out of which the amounts with the commitments of the agreements expiring within one year or being able to be cancelled at any time with no condition were ¥2,676,954 million (U.S.$24,173,326 thousand) and ¥3,016,034 million as of March 31, 2019 and 2018, respectively. Since a large majority of these commitments expire without being drawn upon, the unfulfilled amounts do not necessarily represent future cash requirements. Many such agreements include conditions granting the Bank and its consolidated subsidiaries the right to reject the drawdown or to reduce the amount on the basis of changes in the financial circumstances of the borrower or other reasonable grounds. In addition, the Bank obtains collateral when necessary to reduce credit risk related to these commitments.
72
LOANS AND BILLS DISCOUNTED

Notes to Consolidated Financial Statements
SHINSEI BANK, LIMITED Integrated Report 2019
2019/07/10 8:13:49 / 19509946_株式会社新生銀行_総会その他(C)
10. FOREIGN EXCHANGES CONSOLIDATED
Foreign exchange assets and liabilities as of March 31, 2019 and 2018 consisted of the following:
Millions of yenThousands ofU.S. dollars
2019 2018 2019Foreign exchange assets:
Foreign bills receivable ¥ 1,059 ¥ 1,777 $ 9,565Due from foreign banks 28,487 30,734 257,248Total ¥ 29,546 ¥ 32,511 $ 266,813
Foreign exchange liabilities:Foreign bills sold ¥ - ¥ 80 $ -Foreign bills payable 471 22 4,256Total ¥ 471 ¥ 102 $ 4,256
11. OTHER ASSETS CONSOLIDATED
Other assets as of March 31, 2019 and 2018 consisted of the following:
Millions of yenThousands ofU.S. dollars
2019 2018 2019Accrued income ¥ 17,482 ¥ 15,522 $ 157,868Prepaid expenses 4,631 3,991 41,827Fair value of derivatives 54,984 73,656 496,522Accounts receivable 40,918 30,608 369,505Installment receivables 562,236 558,843 5,077,089Security deposits 14,121 11,028 127,521Suspense payments 14,814 20,474 133,781Margin deposits for futures transactions 4,852 4,582 43,821Cash collateral paid for financial instruments 41,914 50,527 378,494Other 95,329 86,976 860,838
Total ¥ 851,287 ¥ 856,213 $ 7,687,266
Installment receivables in “Other assets” as of March 31, 2019 and 2018 include credits to bankrupt obligors of ¥0 million (U.S.$3 thousand) and ¥48 million, nonaccrual delinquent credits of ¥5,957 mil l ion (U.S.$53,797 thousand) and ¥7,244 million, credits past due
for three months or more of ¥823 million(U.S.$7,441 thousand) and ¥382 million, and restructured credits of ¥212 million (U.S.$1,915 thousand) and ¥98 million, respectively.
12. PREMISES AND EQUIPMENT CONSOLIDATED
Premises and equipment as of March 31, 2019 and 2018 consisted of the following:
Millions of yenThousands ofU.S. dollars
2019 2018 2019Buildings ¥ 29,825 ¥ 28,203 $ 269,331Land 2,665 2,680 24,070Tangible leased assets as lessor 53,836 56,578 486,155Other 28,103 28,286 253,777
Subtotal 114,431 115,748 1,033,333Accumulated depreciation (69,089) (65,486) (623,892)
Net book value ¥ 45,341 ¥ 50,261 $ 409,442
73
FOREIGN EXCHANGES、OTHER ASSETS、PREMISES AND EQUIPMENT

Notes to Consolidated Financial Statements
SHINSEI BANK, LIMITED Integrated Report 2019
2019/07/10 8:13:49 / 19509946_株式会社新生銀行_総会その他(C)
13. INTANGIBLE ASSETS CONSOLIDATED
Intangible assets as of March 31, 2019 and 2018 consisted of the following:
Millions of yenThousands ofU.S. dollars
2019 2018 2019Software:
Software ¥ 51,465 ¥ 17,605 $ 464,743Software in progress 3,033 27,692 27,392
Goodwill, net:Goodwill 14,072 15,355 127,073Negative goodwill (3,082) (3,445) (27,837)
Intangible assets acquired in business combinations 690 1,290 6,239Intangible leased assets as lessor 3 0 27Other 1,007 985 9,096
Total ¥ 67,189 ¥ 59,484 $ 606,733
14. RESERVE FOR CREDIT LOSSES CONSOLIDATED
Reserve for credit losses as of March 31, 2019 and 2018 consisted of the following:
Millions of yenThousands ofU.S. dollars
2019 2018 2019Reserve for loan losses:
General reserve for loan losses ¥ 70,749 ¥ 75,545 $ 638,882Specific reserve for loan losses 27,285 25,295 246,389Total ¥ 98,034 ¥ 100,840 $ 885,272
15. DEPOSITS, INCLUDING NEGOTIABLE CERTIFICATES OF DEPOSIT CONSOLIDATED
Deposits, including negotiable certificates of deposit, as of March 31, 2019 and 2018 consisted of the following:
Millions of yenThousands ofU.S. dollars
2019 2018 2019Current ¥ 39,846 ¥ 37,299 $ 359,820Ordinary 2,537,841 2,370,073 22,917,114Notice 13,897 15,712 125,492Time 2,271,980 2,691,014 20,516,351Negotiable certificates of deposit 570,580 438,927 5,152,437Other 487,999 514,069 4,406,710
Total ¥ 5,922,145 ¥ 6,067,096 $ 53,477,923
16. DEBENTURES CONSOLIDATED
Debentures as of March 31, 2019 and 2018 consisted of the following:
Issuer Description Issue MaturityInterest Rate
(%)
Millions of yenThousands ofU.S. dollars
2019 2018 2019Shinsei Bank,
LimitedFive-year coupondebentures1 Apr. 2013 Apr. 2018 0.08 ¥ - ¥ 423 $ -
Total ¥ - ¥ 423 $ -1 This includes a series of five-year Long-Term Credit Debentures.
74
INTANGIBLE ASSETS、RESERVE FOR CREDIT LOSSES、DEPOSITS, INCLUDING NEGOTIABLE CERTIFICATES OF DEPOSIT、DEBENTURES

Notes to Consolidated Financial Statements
SHINSEI BANK, LIMITED Integrated Report 2019
2019/07/10 8:13:49 / 19509946_株式会社新生銀行_総会その他(C)
17. TRADING LIABILITIES CONSOLIDATED
Trading liabilities as of March 31, 2019 and 2018 consisted of the following:
Millions of yenThousands ofU.S. dollars
2019 2018 2019Derivatives for trading securities ¥ 1,193 ¥ 1,205 $ 10,779Derivatives for securities held to hedge trading transactions 3,344 9,630 30,205Trading-related financial derivatives 175,700 171,121 1,586,606Trading securities sold for short sales 2,124 2,625 19,186
Total ¥ 182,363 ¥ 184,582 $ 1,646,776
18. BORROWED MONEY CONSOLIDATED
(a) Borrowed money as of March 31, 2019 and 2018 consisted of the following:
Millions of yenThousands ofU.S. dollars
2019 2018 2019Subordinated debt ¥ - ¥ 12,400 $ -Other 684,077 727,178 6,177,334
Total ¥ 684,077 ¥ 739,578 $ 6,177,334
(b) The weighted average interest rate applicable to the total balance of borrowed money as of March 31, 2019 was 0.49%.
(c) Annual maturities of borrowed money as of March 31, 2019 were as follows:
Year ending March 31, Millions of yenThousands ofU.S. dollars
2020 ¥ 247,979 $ 2,239,2942021 124,890 1,127,7832022 99,886 901,9892023 48,816 440,8242024 and thereafter 162,504 1,467,444
Total ¥ 684,077 $ 6,177,334
75
TRADING LIABILITIES、BORROWED MONEY
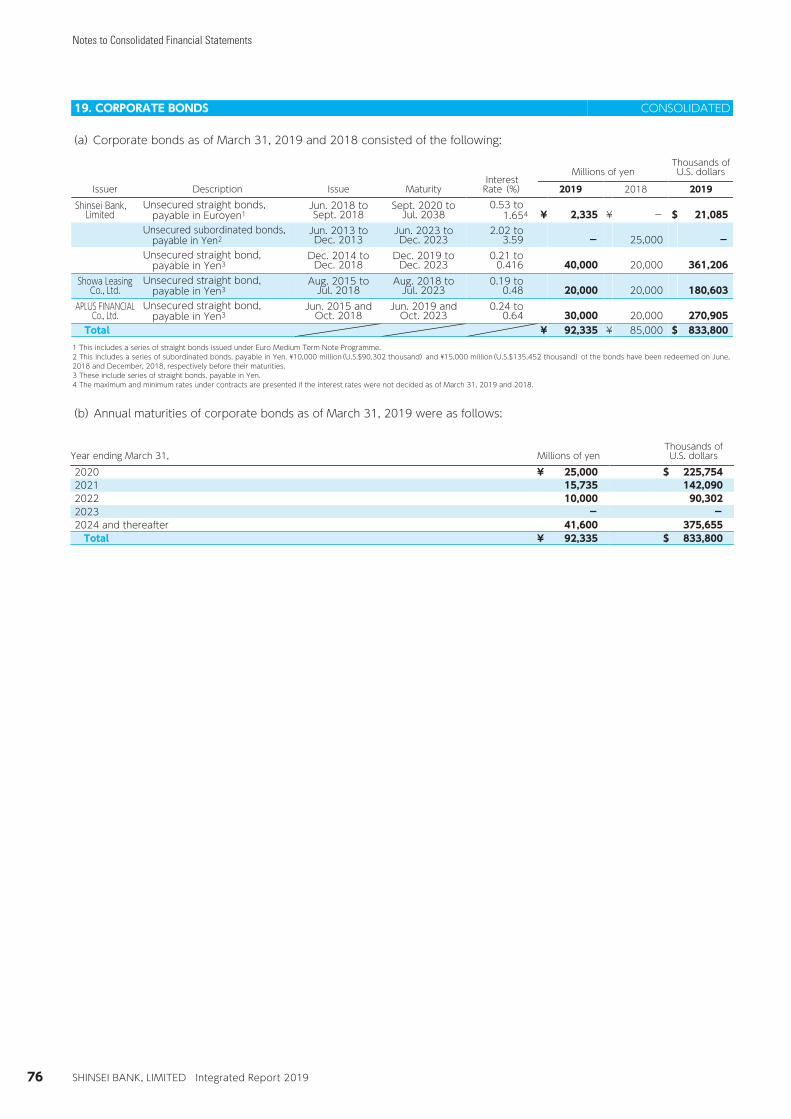
Notes to Consolidated Financial Statements
SHINSEI BANK, LIMITED Integrated Report 2019
2019/07/10 8:13:49 / 19509946_株式会社新生銀行_総会その他(C)
19. CORPORATE BONDS CONSOLIDATED
(a) Corporate bonds as of March 31, 2019 and 2018 consisted of the following:
Issuer Description Issue MaturityInterestRate (%)
Millions of yenThousands ofU.S. dollars
2019 2018 2019Shinsei Bank,
LimitedUnsecured straight bonds,
payable in Euroyen1Jun. 2018 toSept. 2018
Sept. 2020 toJul. 2038
0.53 to1.654 ¥ 2,335 ¥ - $ 21,085
Unsecured subordinated bonds,payable in Yen2
Jun. 2013 toDec. 2013
Jun. 2023 toDec. 2023
2.02 to3.59 - 25,000 -
Unsecured straight bond,payable in Yen3
Dec. 2014 toDec. 2018
Dec. 2019 toDec. 2023
0.21 to0.416 40,000 20,000 361,206
Showa LeasingCo., Ltd.
Unsecured straight bond,payable in Yen3
Aug. 2015 toJul. 2018
Aug. 2018 toJul. 2023
0.19 to0.48 20,000 20,000 180,603
APLUS FINANCIALCo., Ltd.
Unsecured straight bond,payable in Yen3
Jun. 2015 andOct. 2018
Jun. 2019 andOct. 2023
0.24 to0.64 30,000 20,000 270,905
Total ¥ 92,335 ¥ 85,000 $ 833,8001 This includes a series of straight bonds issued under Euro Medium Term Note Programme.2 This includes a series of subordinated bonds, payable in Yen. ¥10,000 million(U.S.$90,302 thousand) and ¥15,000 million(U.S.$135,452 thousand) of the bonds have been redeemed on June, 2018 and December, 2018, respectively before their maturities.3 These include series of straight bonds, payable in Yen.4 The maximum and minimum rates under contracts are presented if the interest rates were not decided as of March 31, 2019 and 2018.
(b) Annual maturities of corporate bonds as of March 31, 2019 were as follows:
Year ending March 31, Millions of yenThousands ofU.S. dollars
2020 ¥ 25,000 $ 225,7542021 15,735 142,0902022 10,000 90,3022023 - -2024 and thereafter 41,600 375,655
Total ¥ 92,335 $ 833,800
76
CORPORATE BONDS

Notes to Consolidated Financial Statements
SHINSEI BANK, LIMITED Integrated Report 2019
2019/07/10 8:13:49 / 19509946_株式会社新生銀行_総会その他(C)
20. OTHER LIABILITIES CONSOLIDATED
Other liabilities as of March 31, 2019 and 2018 consisted of the following:
Millions of yenThousands ofU.S. dollars
2019 2018 2019Accrued expenses ¥ 10,160 ¥ 24,073 $ 91,748Unearned income 23,662 24,027 213,674Income taxes payable 3,548 2,980 32,048Fair value of derivatives 62,590 74,588 565,199Matured debentures, including interest - 330 -Accounts payable 63,973 58,548 577,691Deferred gains on installment receivables and credit guarantees 30,195 30,414 272,668Asset retirement obligations 9,262 8,954 83,643Deposits payable 110,000 103,843 993,321Cash collateral received for financial instruments 15,519 22,078 140,140Other 18,470 17,892 166,794
Total ¥ 347,383 ¥ 367,734 $ 3,136,925
21. EMPLOYEES’ RETIREMENT BENEFITS AND PENSION PLAN ASSETS CONSOLIDATED
(a) The changes in defined benefit obligation for the fiscal years ended March 31, 2019 and 2018 were as follows:
Millions of yenThousands ofU.S. dollars
2019 2018 2019Balance at beginning of the year ¥ 89,226 ¥ 88,689 $ 805,732
Current service cost 4,002 4,138 36,147Interest cost 987 983 8,920Actuarial (gains) losses 1,756 (737) 15,863Benefits paid (4,278) (3,847) (38,639)
Balance at end of the year ¥ 91,695 ¥ 89,226 $ 828,022
(b) The changes in plan assets for the fiscal years ended March 31, 2019 and 2018 were as follows:
Millions of yenThousands ofU.S. dollars
2019 2018 2019Balance at beginning of the year ¥ 94,121 ¥ 87,508 $ 849,937
Expected return on plan assets 2,200 2,052 19,871Actuarial gains (losses) (1,741) 2,825 (15,728)Contributions from the employer 3,542 5,227 31,986Benefits paid (3,728) (3,492) (33,669)
Balance at end of the year ¥ 94,394 ¥ 94,121 $ 852,397
77
OTHER LIABILITIES、EMPLOYEES’ RETIREMENT BENEFITS AND PENSION PLAN ASSETS

Notes to Consolidated Financial Statements
SHINSEI BANK, LIMITED Integrated Report 2019
2019/07/10 8:13:49 / 19509946_株式会社新生銀行_総会その他(C)
21. EMPLOYEES’ RETIREMENT BENEFITS AND PENSION PLAN ASSETS (CONTINUED) CONSOLIDATED
(c) A reconciliation between the liability and the asset recorded in the consolidated balance sheet and balances of defined benefit obligation and plan assets as of March 31, 2019 and 2018 was as follows:
Millions of yenThousands ofU.S. dollars
2019 2018 2019Defined benefit obligation ¥ 84,429 ¥ 82,027 $ 762,413Plan assets (94,394) (94,121) (852,397)
Subtotal (9,964) (12,094) (89,984)Unfunded defined benefit obligation 7,265 7,198 65,610Net liability (asset) arising from benefit obligation ¥ (2,699) ¥ (4,895) $ (24,374)
Millions of yenThousands ofU.S. dollars
2019 2018 2019Liability for retirement benefits ¥ 8,232 ¥ 8,366 $ 74,337Asset for retirement benefits (10,931) (13,261) (98,711)Net liability (asset) arising from benefit obligation ¥ (2,699) ¥ (4,895) $ (24,374)
(d) The components of net periodic retirement benefit cost for the fiscal years ended March 31, 2019 and 2018 were as follows:
Millions of yenThousands ofU.S. dollars
2019 2018 2019Current service cost ¥ 4,002 ¥ 4,138 $ 36,147Interest cost 987 983 8,920Expected return on plan assets (2,200) (2,052) (19,871)Amortization of past service cost (100) (212) (908)Recognized actuarial (gains) losses 1,075 792 9,710Other (primarily consists of extraordinary severance benefit) 166 71 1,503Net periodic retirement benefit cost ¥ 3,931 ¥ 3,721 $ 35,501
(e) Other comprehensive income on defined retirement benefit plans (before adjusting for tax effects) for the fiscal years ended March 31, 2019 and 2018 consisted of the following:
Millions of yenThousands ofU.S. dollars
2019 2018 2019Past service cost ¥ (100) ¥ (212) $ (908)Actuarial gains (losses) (2,423) 4,355 (21,881)Total ¥ (2,523) ¥ 4,143 $ (22,789)
(f) Accumulated other comprehensive income on defined retirement benefit plans (before adjusting for tax effects) as of March 31, 2019 and 2018 consisted of the following:
Millions of yenThousands ofU.S. dollars
2019 2018 2019Unrecognized past service cost ¥ 167 ¥ 268 $ 1,513Unrecognized actuarial gains (losses) 204 2,627 1,847Total ¥ 372 ¥ 2,895 $ 3,359
78
EMPLOYEES’ RETIREMENT BENEFITS AND PENSION PLAN ASSETS

Notes to Consolidated Financial Statements
SHINSEI BANK, LIMITED Integrated Report 2019
2019/07/10 8:13:49 / 19509946_株式会社新生銀行_総会その他(C)
21. EMPLOYEES’ RETIREMENT BENEFITS AND PENSION PLAN ASSETS (CONTINUED) CONSOLIDATED
(g) Plan assets
(i) Components of plan assetsPlan assets as of March 31, 2019 and 2018 consisted of the following:
2019 2018Domestic bonds 24.4% 25.5%Foreign bonds 12.7 11.1Domestic equity securities 19.8 19.6Foreign equity securities 18.2 18.3Life insurance company accounts (general accounts) 17.6 17.4Other 7.3 8.1Total 100.0% 100.0%
(ii) Method of determining the long-term expected rate of return on plan assets
The Bank, which dominates a large share of plan assets in the Group, determined 2.20% of long-term expected rate of return on plan assets for the fiscal year ended March 31, 2019, considering the financial condition, policy for asset investment and the asset portfolios of the Bank besides current economic environment and market trend. For major consolidated subsidiaries, the long-term expected rates of return on plan assets were determined considering the long-term rates of return which are expected currently and in the future from the various components of the plan assets.
(h) Assumptions used for the fiscal years ended March 31, 2019 and 2018 were set forth as follows:2019 2018
Discount rate 0.43 - 1.20% 0.43 - 1.20%Long-term expected rate of return on plan assets 2.00 - 3.50% 2.00 - 3.50%Expected future salary increase rate 1.00 - 5.30% 1.00 - 5.30%
22. ACCEPTANCES AND GUARANTEES CONSOLIDATED
Acceptances and guarantees as of March 31, 2019 and 2018 consisted of the following:
Millions of yenThousands ofU.S. dollars
2019 2018 2019Guarantees ¥ 456,759 ¥ 395,301 $ 4,124,607
23. CONTINGENT LIABILITIES CONSOLIDATED
Contingent liabilities as of March 31, 2019 and 2018 were as follows:
Millions of yenThousands ofU.S. dollars
2019 2018 2019Agreement for the purchase of personal property ¥ 821 ¥ 861 $ 7,420
A subsidiary has made agreements in which it will purchase the personal property collateralized by the creditor at a specified price if the borrower defaults. As a result, there is the possibility that the subsidiary assumes an obligation to purchase the collateral.
79
EMPLOYEES’ RETIREMENT BENEFITS AND PENSION PLAN ASSETS、ACCEPTANCES AND GUARANTEES、CONTINGENT LIABILITIES
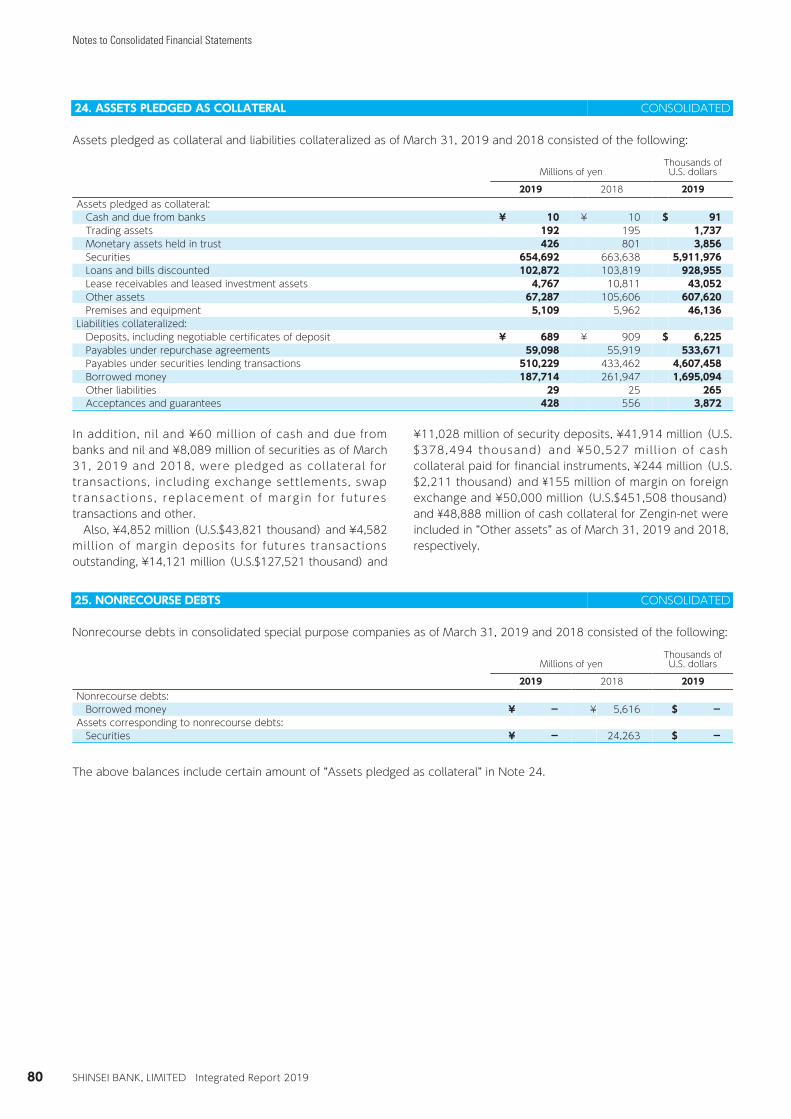
Notes to Consolidated Financial Statements
SHINSEI BANK, LIMITED Integrated Report 2019
2019/07/10 8:13:49 / 19509946_株式会社新生銀行_総会その他(C)
24. ASSETS PLEDGED AS COLLATERAL CONSOLIDATED
Assets pledged as collateral and liabilities collateralized as of March 31, 2019 and 2018 consisted of the following:
Millions of yenThousands ofU.S. dollars
2019 2018 2019Assets pledged as collateral:
Cash and due from banks ¥ 10 ¥ 10 $ 91Trading assets 192 195 1,737Monetary assets held in trust 426 801 3,856Securities 654,692 663,638 5,911,976Loans and bills discounted 102,872 103,819 928,955Lease receivables and leased investment assets 4,767 10,811 43,052Other assets 67,287 105,606 607,620Premises and equipment 5,109 5,962 46,136
Liabilities collateralized:Deposits, including negotiable certificates of deposit ¥ 689 ¥ 909 $ 6,225Payables under repurchase agreements 59,098 55,919 533,671Payables under securities lending transactions 510,229 433,462 4,607,458Borrowed money 187,714 261,947 1,695,094Other liabilities 29 25 265Acceptances and guarantees 428 556 3,872
In addition, nil and ¥60 million of cash and due from banks and nil and ¥8,089 million of securities as of March 31, 2019 and 2018, were pledged as collateral for transactions, including exchange settlements, swap t ransact ions , rep lacement o f marg in for fu tures transactions and other. Also, ¥4,852 million (U.S.$43,821 thousand) and ¥4,582 mill ion of margin deposits for futures transactions outstanding, ¥14,121 million (U.S.$127,521 thousand) and
¥11,028 million of security deposits, ¥41,914 million (U.S.$378,494 thousand) and ¥50,527 mil l ion of cash collateral paid for financial instruments, ¥244 million (U.S.$2,211 thousand) and ¥155 million of margin on foreign exchange and ¥50,000 million (U.S.$451,508 thousand) and ¥48,888 million of cash collateral for Zengin-net were included in “Other assets” as of March 31, 2019 and 2018, respectively.
25. NONRECOURSE DEBTS CONSOLIDATED
Nonrecourse debts in consolidated special purpose companies as of March 31, 2019 and 2018 consisted of the following:
Millions of yenThousands ofU.S. dollars
2019 2018 2019Nonrecourse debts:
Borrowed money ¥ - ¥ 5,616 $ -Assets corresponding to nonrecourse debts:
Securities ¥ - 24,263 $ -
The above balances include certain amount of “Assets pledged as collateral” in Note 24.
80
ASSETS PLEDGED AS COLLATERAL、NONRECOURSE DEBTS

Notes to Consolidated Financial Statements
SHINSEI BANK, LIMITED Integrated Report 2019
2019/07/10 8:13:49 / 19509946_株式会社新生銀行_総会その他(C)
26. EQUITY CONSOLIDATED
Shinsei Bank executed a 1-for-10 reverse stock split on October 1, 2017 based on the number of shares held by shareholders, who were recorded in the Register of Shareholders as of the end of the day on September 30, 2017. In accordance with a decrease in the number of outstanding shares after the above reverse stock split, the aggregate number of authorized shares decreased at the one-tenth on October 1, 2017, and the number as of March 31, 2019 was 400,000 thousand shares.
The following table shows changes in the number of shares of common stock.Thousands
Issued number of shares Number of treasury stockFiscal year ended March 31, 2018:
Beginning of year 2,750,346 161,955Increase1 - 5,971Decrease2,3 (2,475,312) (145,761)End of year 275,034 22,166
Fiscal year ended March 31, 2019:Beginning of year 275,034 22,166Increase4 - 7,652Decrease5,6 (16,000) (16,058)End of year 259,034 13,760
1 The increase of 5,971 thousand treasury stocks is associated with the repurchase of 1 thousand shares less than one unit and the repurchase of 5,969 thousand shares from market.2 The decrease of 2,475,312 thousand common stocks is associated with the reverse stock split(1-for-10 reverse stock split on October 1, 2017).3 The decrease of 145,761 thousand treasury stocks is associated with the reverse stock split noted in 2.4 The increase of 7,652 thousand treasury stocks is associated with the repurchase of 0 thousand shares less than one unit and the repurchase of 7,652 thousand shares from market.5 The decrease of 16,000 thousand common stocks is associated with the cancellation of treasury stocks.6 The decrease of 16,058 thousand thousand treasury stocks is associated with the cancellation of 16,000 thousand treasury stocks, the transfer of 14 thousand shares upon exercise of the stock option (stock acquisition rights), and the disposal of 44 thousand shares as a restricted stock compensation.
Japanese banks are subject to the Companies Act of Japan (the “Companies Act”) and the Banking Act. The significant provisions in the Companies Act and the Banking Act that affect financial and accounting matters are summarized below:
(a) DividendsUnder the Companies Act, companies can pay dividends at any time during the fiscal year in addition to the year-end dividend upon resolution at the shareholders' meeting. For companies that meet certain criteria including (1) having a Board of Directors, (2) having independent auditors, (3) having an Audit & Supervisory Board, and (4) the term of service of the directors being prescribed as one year rather than the normal two year term by its articles of incorporation, the Board of Directors may declare dividends (except for dividends-in-kind) at any time during the fiscal year if the company has prescribed so in its articles of incorporation. The Bank meets all of the above criteria and its articles of incorporation prescribe the authority for dividend declaration by the Board of Directors. The Companies Act permits companies to distribute dividends-in-kind (noncash assets) to shareholders subject to certain limitations and additional requirements. Interim dividends may also be paid once a year upon resolution by the Board of Directors if the articles of incorporation of the company stipulate it. The Companies Act and the Banking Act provides certain limitations on the amounts available for dividends or the purchase of treasury stock.
(b) Increases/decreases and transfer of common stock, reserve and surplusThe Banking Act requires that an amount equal to 20% of dividends must be appropriated as a legal reserve (a component of retained earnings) or as additional paid-in capital (a component of capital surplus), depending on the equity account charged upon the payment of such dividends, until the aggregate amount of legal reserve and additional paid-in capital equals 100% of the common stock. The Companies Act provides that common stock, legal reserve, additional paid-in capital, other capital surplus and retained earnings can be transferred among the accounts within equity under certain conditions upon resolution of the shareholders.
(c) Treasury stock and treasury stock acquisition rightsThe Act also provides for purchasing treasury stock and disposing of such treasury stock by resolution of the Board of Directors. The total carrying amount of the monies, etc. delivered to shareholders for treasury stock purchased may not exceed the surplus available for dividend as at the day on which such act takes effect. Under the Companies Act, stock acquisition rights are presented as a separate component of equity. The Companies Act also provides that companies can purchase both treasury stock acquisition rights and treasury stock. Such treasury stock acquisition rights are presented as a separate component of equity or deducted directly from stock acquisition rights.
81
EQUITY

Notes to Consolidated Financial Statements
SHINSEI BANK, LIMITED Integrated Report 2019
2019/07/10 8:13:49 / 19509946_株式会社新生銀行_総会その他(C)
27. STOCK ACQUISITION RIGHTS CONSOLIDATED
The Bank and a subsidiary issue stock acquisition rights as a stock option plan to directors, executive officers and employees of the Bank and its subsidiaries. Some stock acquisition rights provide eligible individuals (the “holders”) with the right to purchase stock of the issuers, without any cash consideration, others with offsetting the remuneration claims against the issuers. The amount of money to be paid upon exercising stock acquisition rights is the amount calculated by multiplying the payment amount per share (the “exercise price”) by the number of shares that can be purchased through the exercise of one stock acquisition right. Conditions are stipulated in the “Agreement on the Grant of Stock Acquisition Rights” entered between the issuers and the holders to whom stock acquisition rights were allotted based on the resolution of the annual general meeting of shareholders and the meeting of the Board of Directors which resolves the issuance of stock acquisition rights subsequent to the shareholders' meeting.
Also, the Bank introduced a new remuneration plan, a restricted stock compensation plan, for the purpose of granting a long-term incentive to eligible directors and executive officers, etc. (the “recipients”) and promoting shared value with shareholders, during the fiscal year ended March 31, 2019. Recipients will make in-kind contributions of monetary compensation claims to be provided by the Bank in accordance with the restricted stock compensation plan, and, in return, receive shares of common stock of the Bank that will be issued or disposed of by the Bank. On issuing or disposing of common stock of the Bank based on the restricted stock compensation plan, the Bank shall enter into a restricted stock allotment agreement with recipients. The fol lowing table shows the detai ls of stock acquisition rights and restricted stocks granted during the fiscal year ended March 31, 2019.
(a) Stock-based compensation expenses for the fiscal years ended March 31, 2019 and 2018 were as follows.
Millions of yenThousands ofU.S. dollars
2019 2018 2019General and administrative expenses ¥ 99 ¥ 39 $ 902
(b) Gains on unexercised and forfeited stock acquisition rights for the fiscal years ended March 31, 2019 and 2018 were as follows:
Millions of yenThousands ofU.S. dollars
2019 2018 2019Other gains (losses), net ¥ 218 ¥ 293 $ 1,974
(c) Details of stock optionsStock options outstanding as of March 31, 2019 and 2018 were as follows:
(i) The Bank
Date of issuance
Total number ofstock options (shares)
at the issuance
Total numberof holders
at the issuanceExerciseperiod
Exerciseprice (Yen)
Fair value at thegrant date (Yen)
20th May 30, 2008 283,000 124 June 1, 2010 - May 13, 2018 4,160 1,580 or 1,69021st May 30, 2008 208,100 30 June 1, 2010 - May 13, 2018 4,160 1,580 or 1,69022nd July 10, 2008 20,300 43 July 1, 2010 - June 24, 2018 4,070 1,270 or 1,37023rd December 1, 2008 9,700 17 December 1, 2010 - November 11, 2018 2,210 530 or 5701st (Share compensation-type)1 May 26, 2016 13,430 2 May 27, 2016 - May 26, 2046 1 1,6202nd (Share compensation-type)1 May 25, 2017 16,730 2 May 26, 2017 - May 25, 2047 1 1,7803rd (Share compensation-type)1 May 28, 2018 13,220 2 May 29, 2018 - May 28, 2048 1 1,724
※ The above table was stated in terms of the number of shares after considering the Bank executed a one-for-ten reverse stock split of common shares on October 1, 2017.
1 These are the Bank's issuance of equity remuneration type of stock options with JPY 1 of exercise price, only for the Bank's directors (excluding outside directors).
82
STOCK ACQUISITION RIGHTS

Notes to Consolidated Financial Statements
SHINSEI BANK, LIMITED Integrated Report 2019
2019/07/10 8:13:49 / 19509946_株式会社新生銀行_総会その他(C)
27. STOCK ACQUISITION RIGHTS (CONTINUED) CONSOLIDATED
(ⅱ) OJBC Co. Ltd
Date of issuance
Total number ofstock options (shares)
at the issuance
Totalnumber of holders
at the issuanceExerciseperiod
Exerciseprice (USD)
Fair value at thegrant date (USD)
1st1 April 28, 2015 2,114,680 8 April 28, 2017 - April 28, 2025 1.10 0.262nd1 May 25, 2016 72,920 1 May 25, 2018 - May 25, 2026 1.10 0.153rd1 April 30, 2018 109,380 2 April 30, 2020 - April 30, 2028 1.10 0.22
1 These stock acquisition rights allow option holders to acquire Class B Preferred shares of OJBC Co. Ltd.
(d) The number of stock options and movement thereinThe number of stock options and price information is as follows:(i) The Bank
20th 21st 22nd 23rdFiscal year ended March 31, 2019Nonvested (share)
Outstanding at the beginning of the year - - - -Granted during the year - - - -Forfeited during the year - - - -Vested during the year - - - -Outstanding at the end of the year - - - -
Vested (share)Outstanding at the beginning of the year 113,900 4,200 17,800 5,000Vested during the year - - - -Exercised during the year - - - -Forfeited during the year 113,900 4,200 17,800 5,000Exercisable at the end of the year - - - -
Exercise price (Yen) 4,160 4,160 4,070 2,210Weighted average stock price at the date of exercise (Yen) - - - -
1st(Share compensation-type)
2nd(Share compensation-type)
3rd(Share compensation-type)
Fiscal year ended March 31, 2019Nonvested (share)
Outstanding at the beginning of the year - - -Granted during the year - - 13,220Forfeited during the year - - -Vested during the year - - 13,220Outstanding at the end of the year - - -
Vested (share)Outstanding at the beginning of the year 13,430 16,730 -Vested during the year - - 13,220Exercised during the year 4,480 5,580 4,410Forfeited during the year - - -Exercisable at the end of the year 8,950 11,150 8,810
Exercise price (Yen) 1 1 1Weighted average stock price at the date of exercise (Yen) 1,697 1,697 1,697
83
STOCK ACQUISITION RIGHTS

Notes to Consolidated Financial Statements
SHINSEI BANK, LIMITED Integrated Report 2019
2019/07/10 8:13:49 / 19509946_株式会社新生銀行_総会その他(C)
27. STOCK ACQUISITION RIGHTS (CONTINUED) CONSOLIDATED
(ⅱ) OJBC Co. Ltd1st 2nd 3rd
Fiscal year ended March 31, 2019Nonvested (share)
Outstanding at the beginning of the year - 72,920 -Granted during the year - - 109,380Forfeited during the year - - -Vested during the year - 72,920 -Outstanding at the end of the year - - 109,380
Vested (share)Outstanding at the beginning of the year 1,786,540 - -Vested during the year - 72,920 -Exercised during the year - - -Forfeited during the year 72,920 - -Exercisable at the end of the year 1,713,620 72,920 -
Exercise price (USD) 1.10 1.10 1.10Weighted average stock price at the date of exercise (USD) - - -
(e) Measurement of the fair value of stock optionsThe following shows the assumptions used to measure the fair value of the stock options granted during fiscal years ended March 31, 2019.(i) The Banka) Method used: Black-Scholes option pricing modelb) Major inputs and variables to the model
3rd(Share compensation-type)
Exercise period From May 29, 2018 to May 28, 2048Expected volatility1 36.289%Expected life2 7.0 yearsExpected dividends3 ¥10.0/ShareRisk-free interest rate4 -0.056%
1 Measured based on the historical stock price corresponding to expected life (from May 29, 2011 to May 28, 2018).2 Estimated based on the retirement data of the director and statutory executive officers of the Bank for the past 10 years, as the reasonable estimate is difficult without enough data.3 Based on the actual dividend for the fiscal year ended in March, 2018 (¥10.0/Share).4 Used the average compound yield of Long term JGB with the maturity that is approximate to expected life.
(ⅱ) OJBC Co. Ltda) Method used: Binominal modelb) Major inputs and variables to the model
3rd
Exercise period From April 30, 2020 to April 30, 2028Expected volatility1 27.45%Expected life2 10.0 yearsExpected dividends3 -Risk-free interest rate4 2.95%
1 Measured based on the historical stock price of comparable similar companies.2 Assumed based on the term from grant date to the end of exercise period.3 Based on the recent actual dividend(0%).4 Used the yield of US Treasury Bond with the maturity that is equivalent to expected life.
(f) Method of determining the vested number of stock optionsThe actual forfeited options are used for calculating the vested number of stock options because the future forfeitures cannot be reliably estimated.
84
STOCK ACQUISITION RIGHTS

Notes to Consolidated Financial Statements
SHINSEI BANK, LIMITED Integrated Report 2019
2019/07/10 8:13:49 / 19509946_株式会社新生銀行_総会その他(C)
27. STOCK ACQUISITION RIGHTS (CONTINUED) CONSOLIDATED
(g) Details of restricted stock compensationThe following shows the details of restricted stocks granted during fiscal years ended March 31, 2019.
Number of shares granted
Total number of recipients Transfer restriction period
Fair value at thegrant date (Yen)
Granted on July 19, 2018 11,675 2 July 19, 2018 - July 18, 2021 1,713Granted on October 31, 2018 32,447 33 October 31, 2018 - July 18, 2021 1,725
These restricted stocks have the following cancellation conditions;On the condition that the recipient has maintained his/her position of executive director, etc. of the Bank or its subsidiary continuously during the transfer restriction period, the transfer restriction shall be cancelled at the expiration of the transfer restriction period. If the recipient loses the position of executive director, etc. of the Bank or its subsidiary prior to the expiration of the transfer restriction period, the transfer restrictions will be immediately removed. The number of shares subject to removal of transfer restrictions are obtained by multiplying the number of allotted stocks held by the recipient at the time of his/her resignation or retirement by the value obtained as a result of dividing the period of service of the recipient or during the transfer restriction period (on a monthly basis) by 12. The Bank shall automatically acquire, without consideration, the allotted stocks for which transfer restrictions have not been removed at the time of expiration of the transfer restriction period or at the time of removal of the transfer restrictions.
(h) The number of restricted stocks and movement thereinThe number of restricted stocks is as follows:
Granted on July 19, 2018 Granted on October 31, 2018
Fiscal year ended March 31, 2019Number of shares before the cancellation of transfer restrictions
Outstanding at the end of the last fiscal year - -Granted during the fiscal year 11,675 32,447Acquisition without consideration by the Bank - -Cancellation of the transfer restrictions - -Outstanding at the end of the fiscal year 11,675 32,447
85
STOCK ACQUISITION RIGHTS

Notes to Consolidated Financial Statements
SHINSEI BANK, LIMITED Integrated Report 2019
2019/07/10 8:13:49 / 19509946_株式会社新生銀行_総会その他(C)
28. NET TRADING INCOME (LOSS) CONSOLIDATED
Net trading income (loss) for the fiscal years ended March 31, 2019 and 2018 consisted of the following:
Millions of yenThousands ofU.S. dollars
2019 2018 2019Income (loss) from trading securities ¥ 2,458 ¥ 3,814 $ 22,203Income (loss) from securities held to hedge trading transactions 272 49 2,457Income (loss) from trading-related financial derivatives 3,936 4,627 35,549Other, net 6 52 56
Total ¥ 6,673 ¥ 8,542 $ 60,265
29. OTHER BUSINESS INCOME (LOSS), NET CONSOLIDATED
“Other, net” in other business income (loss), net, for the fiscal years ended March 31, 2019 and 2018 consisted of the following:
Millions of yenThousands ofU.S. dollars
2019 2018 2019Income (loss) from derivatives entered into for banking purposes, net ¥ (515) ¥ (46) $ (4,659)Equity in net income (loss) of affiliates 5,697 5,152 51,452Gain on lease cancellation and other lease income (loss), net 2,239 2,111 20,225Other, net 2,465 2,035 22,261
Total ¥ 9,886 ¥ 9,253 $ 89,279
30. NET CREDIT COSTS CONSOLIDATED
Net credit costs for the fiscal years ended March 31, 2019 and 2018 consisted of the following:
Millions of yenThousands ofU.S. dollars
2019 2018 2019Losses on write-off or sales of loans ¥ 426 ¥ 541 $ 3,856Net provision (reversal) of reserve for loan losses:
Net provision (reversal) of general reserve for loan losses 17,246 28,051 155,742Net provision (reversal) of specific reserve for loan losses 17,994 14,978 162,497Net provision (reversal) of reserve for loan losses to restructuring countries - (0) -
Subtotal 35,241 43,030 318,239Other credit costs (recoveries) relating to leasing business 338 645 3,058Recoveries of written-off claims (6,658) (6,946) (60,128)
Total ¥ 29,348 ¥ 37,270 $ 265,024
31. OTHER GAINS (LOSSES), NET CONSOLIDATED
Other gains (losses), net for the fiscal years ended March 31, 2019 and 2018 consisted of the following:
Millions of yen Thousands ofU.S. dollars
2019 2018 2019Net gain (loss) on disposal of premises and equipment ¥ (67) ¥ 543 $ (612)Gains on write-off of unclaimed debentures 321 3,189 2,902Provision for reimbursement of debentures (122) (1,211) (1,103)Gains on write-off of unclaimed deposits 419 470 3,788Reversal (provision) of reserve for losses on interest repayment 2,333 6,052 21,071Impairment losses on long-lived assets (955) (1,834) (8,626)Loss on liquidation of subsidiaries (3) (30) (31)Loss on change in equity of affiliates - (234) -Gains on unexercised and forfeited stock acquisition rights 218 293 1,974Other, net 637 383 5,760
Total ¥ 2,782 ¥ 7,621 $ 25,123
• Impairment losses on long-lived assetsFor the fiscal years ended March 31, 2019 and 2018, respectively, “Impairment losses on long-lived assets” of ¥955 million (U.S.$8,626 thousand) and ¥1,834 million were recognized mainly on the properties of the Bank’s branches and ATMs for the Individual Business which were decided to be closed and on the unused IT-related properties.
86
NET TRADING INCOME (LOSS)、OTHER BUSINESS INCOME (LOSS), NET、NET CREDIT COSTS、OTHER GAINS (LOSSES), NET

Notes to Consolidated Financial Statements
SHINSEI BANK, LIMITED Integrated Report 2019
2019/07/10 8:13:49 / 19509946_株式会社新生銀行_総会その他(C)
32. INCOME TAXES CONSOLIDATED
The Group is subject to a number of taxes based on income, such as corporate tax, inhabitant tax and enterprise tax, which, in the aggregate, resulted in normal effective statutory tax rates of approximately 30.6% and 30.8% for the fiscal years ended March 31, 2019 and 2018, respectively.
(a) A reconciliation between the normal effective statutory tax rates and the actual effective tax rates reflected in the accompanying consolidated statement of income for the fiscal years ended March 31, 2019 and 2018 was as follows:
2019 2018Normal effective statutory tax rate 30.6% 30.8%Increase (decrease) in taxes resulting from:
Amortization of goodwill 1.0 1.5Equity in net income/loss of affiliates (2.2) (0.6)Other nondeductible expenses 0.1 0.5Foreign tax 0.0 0.0Change in valuation allowance (26.4) (90.9)Expiration of tax loss carryforwards 1.3 61.5Other 0.0 3.9
Actual effective tax rate 4.5% 6.9%
(b) The tax effects of significant temporary differences and tax loss carryforwards, which resulted in deferred tax assets
and liabilities, as of March 31, 2019 and 2018 were as follows:
Millions of yenThousands ofU.S. dollars
2019 2018 2019Deferred tax assets:
Tax loss carryforwardsⅱ ¥ 72,264 ¥ 74,315 $ 652,563Reserve for credit losses 70,443 71,817 636,118Reserve for losses on interest repayments 21,632 25,590 195,341Deferred loss on derivatives under hedge accounting 5,572 5,305 50,321Securities 4,560 5,747 41,181Liabilities for retirement benefits 3,382 2,668 30,548Monetary assets held in trust 591 5,073 5,341Other 19,819 18,439 178,975
Subtotal 198,267 208,957 1.790,388Valuation allowance for tax loss carryforwards (67,030) - (605,298)Valuation allowance for deductible temporary differences (106,466) - (961,411)Total valuation allowanceⅰ (173,497) (185,443) (1,566,710)
Total deferred tax assets 24,770 23,513 223,678Offset with deferred tax liabilities (9,673) (8,808) (87,353)
Net deferred tax assets ¥ 15,096 ¥ 14,705 $ 136,325Deferred tax liabilities:
Assets for retirement benefits ¥ 3,043 ¥ 3,428 $ 27,480The liability adjustment account 1,723 - 15,565Deferred gain on derivatives under hedge accounting 1,696 2,038 15,319Unrealized gain on available-for-sale securities 1,695 1,777 15,306Asset retirement costs included in premises and equipment 1,103 966 9,962Temporary differences due to business combination(primarily related to identified intangible assets) 363 519 3,279
Other 48 77 441Total deferred tax liabilities 9,673 8,808 87,353
Offset with deferred tax assets (9,673) (8,808) (87,353)Net deferred tax liabilities ¥ - ¥ - $ -
(ⅰ) Total valuation allowance has decreased by 11,946 million (U.S.$107,879 thousand) from the previous year. This is mainly caused by the decrease in deductible temporary differences related to monetary assets held in trust of the Bank and reserve for losses on interest repayments of Shinsei Financial, and the decrease in tax loss carryforwards due to the use of tax loss carryforwards.
87
INCOME TAXES

Notes to Consolidated Financial Statements
SHINSEI BANK, LIMITED Integrated Report 2019
2019/07/10 8:13:49 / 19509946_株式会社新生銀行_総会その他(C)
32. INCOME TAXES (CONTINUED) CONSOLIDATED
(ⅱ) The expiration of tax loss carryforwards, the related valuation allowances and the resulting net deferred tax assets as of March 31, 2019, were as follows:
Millions of yen
1 year or less Over 1 yearto 2 years
Over 2 yearsto 3 years
Over 3 yearsto 4 years
Over 4 yearsto 5 years Over 5 years Total
Deferred tax assets relating totax loss carryforwards1 ¥7,347 ¥11,152 ¥7,914 ¥9,235 ¥12,918 ¥23,696 ¥72,264
Less valuation allowances fortax loss carryforwards (¥3,865) (¥9,795) (¥7,823) (¥9,172) (¥12,837) (¥23,536) (¥67,030)Net deferred tax assets relating to tax loss carryforwards ¥3,482 ¥1,356 ¥91 ¥63 ¥80 ¥159 ¥5,2342
Thousands of U.S. dollars
1 year or less Over 1 yearto 2 years
Over 2 yearsto 3 Years
Over 3 yearsto 4 years
Over 4 yearsto 5 years Over 5 years Total
Deferred tax assets relating totax loss carryforwards1
$66,346 $100,712 $71,472 $83,398 $116,655 $213,980 $652,563
Less valuation allowances for taxloss carryforwards ($34,903) ($88,458) ($70,645) ($82,826) ($115,927) ($212,539) ($605,298)Net deferred tax assets relating to tax loss carryforwards $31,443 $12,254 $826 $573 $727 $1,441 $47,2642
1 The amounts of tax loss carryforwards are obtained as a result of multiplying the statutory effective tax rate.2 The tax loss carryforwards resulted from the disposal of the non-performing loans in the prior fiscal years. Certain tax loss carryforwards are determined to be collectible as it is probable that consolidated taxable income would be generated based on the expected profitability of the consolidated taxpayer including the Bank as the consolidated parent corporation under consolidated tax filing system. The collectability of the deferred tax assets is considered by corporate tax, inhabitant tax and enterprise tax, respectively.
(c) Changes in presentationThe Bank applies “Partial Amendments to Accounting Standard for Tax Effect Accounting”(ASBJ Statement No.28 issued in February 16 2018, thereafter “Partial Amendments”) from the beginning of the fiscal year, and changed the presentation in this income tax notes. According to paragraph 3 to 5 of the “Partial Amendments”, the Bank added the statements as established by the interpretation 8 (expect for the total valuation allowance) and the interpretation 9 of “Accounting Standard for Tax Effect Accounting.” Note that corresponding figures in the prior fiscal year are not stated based on the transitional treatment in interpretation 7 of “Partial Amendments.”
88
INCOME TAXES
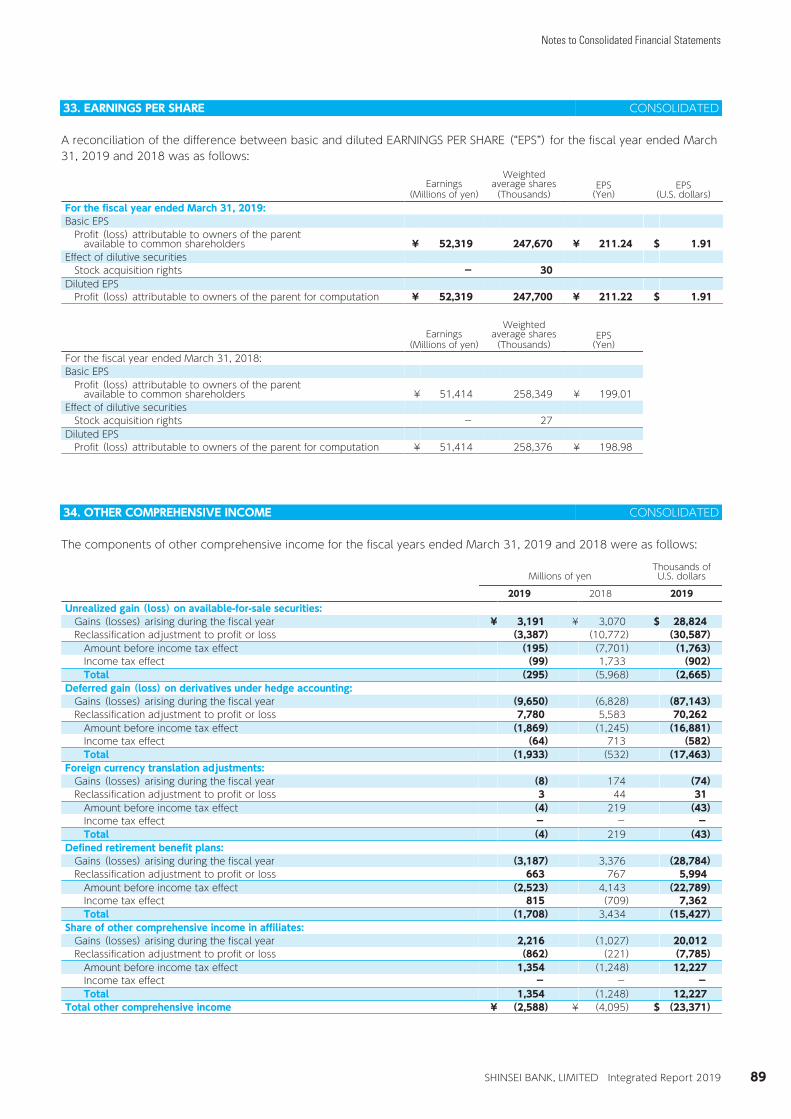
Notes to Consolidated Financial Statements
SHINSEI BANK, LIMITED Integrated Report 2019
2019/07/10 8:13:49 / 19509946_株式会社新生銀行_総会その他(C)
33. EARNINGS PER SHARE CONSOLIDATED
A reconciliation of the difference between basic and diluted EARNINGS PER SHARE (“EPS”) for the fiscal year ended March 31, 2019 and 2018 was as follows:
Earnings(Millions of yen)
Weightedaverage shares(Thousands)
EPS(Yen)
EPS(U.S. dollars)
For the fiscal year ended March 31, 2019:Basic EPS
Profit (loss) attributable to owners of the parentavailable to common shareholders ¥ 52,319 247,670 ¥ 211.24 $ 1.91
Effect of dilutive securitiesStock acquisition rights - 30
Diluted EPSProfit (loss) attributable to owners of the parent for computation ¥ 52,319 247,700 ¥ 211.22 $ 1.91
Earnings(Millions of yen)
Weightedaverage shares(Thousands)
EPS(Yen)
For the fiscal year ended March 31, 2018:Basic EPS
Profit (loss) attributable to owners of the parentavailable to common shareholders ¥ 51,414 258,349 ¥ 199.01
Effect of dilutive securitiesStock acquisition rights - 27
Diluted EPSProfit (loss) attributable to owners of the parent for computation ¥ 51,414 258,376 ¥ 198.98
34. OTHER COMPREHENSIVE INCOME CONSOLIDATED
The components of other comprehensive income for the fiscal years ended March 31, 2019 and 2018 were as follows:
Millions of yenThousands ofU.S. dollars
2019 2018 2019Unrealized gain (loss) on available-for-sale securities:
Gains (losses) arising during the fiscal year ¥ 3,191 ¥ 3,070 $ 28,824Reclassification adjustment to profit or loss (3,387) (10,772) (30,587)
Amount before income tax effect (195) (7,701) (1,763)Income tax effect (99) 1,733 (902)Total (295) (5,968) (2,665)
Deferred gain (loss) on derivatives under hedge accounting:Gains (losses) arising during the fiscal year (9,650) (6,828) (87,143)Reclassification adjustment to profit or loss 7,780 5,583 70,262
Amount before income tax effect (1,869) (1,245) (16,881)Income tax effect (64) 713 (582)Total (1,933) (532) (17,463)
Foreign currency translation adjustments:Gains (losses) arising during the fiscal year (8) 174 (74)Reclassification adjustment to profit or loss 3 44 31
Amount before income tax effect (4) 219 (43)Income tax effect - - -Total (4) 219 (43)
Defined retirement benefit plans:Gains (losses) arising during the fiscal year (3,187) 3,376 (28,784)Reclassification adjustment to profit or loss 663 767 5,994
Amount before income tax effect (2,523) 4,143 (22,789)Income tax effect 815 (709) 7,362Total (1,708) 3,434 (15,427)
Share of other comprehensive income in affiliates:Gains (losses) arising during the fiscal year 2,216 (1,027) 20,012Reclassification adjustment to profit or loss (862) (221) (7,785)
Amount before income tax effect 1,354 (1,248) 12,227Income tax effect - - -Total 1,354 (1,248) 12,227
Total other comprehensive income ¥ (2,588) ¥ (4,095) $ (23,371)
89
EARNINGS PER SHARE、OTHER COMPREHENSIVE INCOME
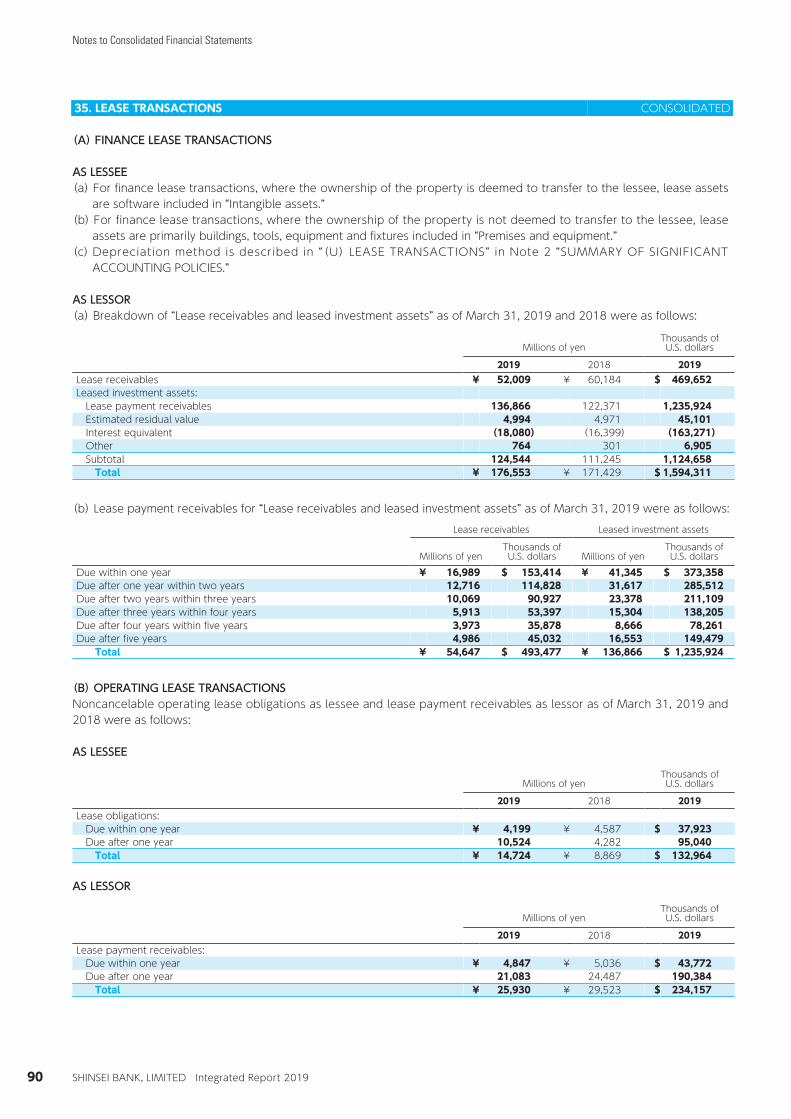
Notes to Consolidated Financial Statements
SHINSEI BANK, LIMITED Integrated Report 2019
2019/07/10 8:13:49 / 19509946_株式会社新生銀行_総会その他(C)
35. LEASE TRANSACTIONS CONSOLIDATED
(A) FINANCE LEASE TRANSACTIONS
AS LESSEE
(a) For finance lease transactions, where the ownership of the property is deemed to transfer to the lessee, lease assets are software included in “Intangible assets.”
(b) For finance lease transactions, where the ownership of the property is not deemed to transfer to the lessee, lease assets are primarily buildings, tools, equipment and fixtures included in “Premises and equipment.”
(c) Depreciation method is described in “(U) LEASE TRANSACTIONS” in Note 2 “SUMMARY OF SIGNIFICANT ACCOUNTING POLICIES.”
AS LESSOR(a) Breakdown of “Lease receivables and leased investment assets” as of March 31, 2019 and 2018 were as follows:
Millions of yenThousands ofU.S. dollars
2019 2018 2019Lease receivables ¥ 52,009 ¥ 60,184 $ 469,652Leased investment assets:
Lease payment receivables 136,866 122,371 1,235,924Estimated residual value 4,994 4,971 45,101Interest equivalent (18,080) (16,399) (163,271)Other 764 301 6,905Subtotal 124,544 111,245 1,124,658
Total ¥ 176,553 ¥ 171,429 $ 1,594,311
(b) Lease payment receivables for “Lease receivables and leased investment assets” as of March 31, 2019 were as follows:Lease receivables Leased investment assets
Millions of yenThousands ofU.S. dollars Millions of yen
Thousands ofU.S. dollars
Due within one year ¥ 16,989 $ 153,414 ¥ 41,345 $ 373,358Due after one year within two years 12,716 114,828 31,617 285,512Due after two years within three years 10,069 90,927 23,378 211,109Due after three years within four years 5,913 53,397 15,304 138,205Due after four years within five years 3,973 35,878 8,666 78,261Due after five years 4,986 45,032 16,553 149,479
Total ¥ 54,647 $ 493,477 ¥ 136,866 $ 1,235,924
(B) OPERATING LEASE TRANSACTIONSNoncancelable operating lease obligations as lessee and lease payment receivables as lessor as of March 31, 2019 and 2018 were as follows:
AS LESSEE
Millions of yenThousands ofU.S. dollars
2019 2018 2019Lease obligations:
Due within one year ¥ 4,199 ¥ 4,587 $ 37,923Due after one year 10,524 4,282 95,040
Total ¥ 14,724 ¥ 8,869 $ 132,964
AS LESSOR
Millions of yenThousands ofU.S. dollars
2019 2018 2019Lease payment receivables:
Due within one year ¥ 4,847 ¥ 5,036 $ 43,772Due after one year 21,083 24,487 190,384
Total ¥ 25,930 ¥ 29,523 $ 234,157
90
LEASE TRANSACTIONS
Notes to Consolidated Financial Statements
SHINSEI BANK, LIMITED Integrated Report 2019
2019/07/10 8:13:49 / 19509946_株式会社新生銀行_総会その他(C)
36. SEGMENT INFORMATION CONSOLIDATED
(A) SEGMENT INFORMATION
(a) DESCRIPTION OF REPORTABLE SEGMENTSOur reportable segments consist of businesses whose individual financial information is available and regular evaluation by the Executive Committee is made in order to decide how much resources are allocated. The Group provides a wide variety of financial products and services to customers through our Institutional Business, Global Markets Business and Individual Business. These Businesses consist of operating segments which provide their respective financial products and services. The Institutional Business consists of the “Corporate Business,” “Structured Finance,” “Principal Transactions,” and “Showa Leasing” and the Global Markets Business consists of the “Markets,” and “Other Global Markets” as reportable segments. The Individual Business consists of “Reta i l Bank ing , ” “Sh inse i F inanc ia l ” and “APLUS FINANCIAL.” Also, the business and operations excluding any of the Institutional Business, the Global Markets Business, and the Individual Business are classified as the “ C o r p o r a t e / O t h e r . ” T h e “ T r e a s u r y ” i n t h e “Corporate/Other” is a reportable segment. In the Institutional Business, the “Corporate Business” segment provides financial products and services, advisory services, and trust business for corporate, public, and financial sectors. The “Structured Finance” segment provides real estate finance such as nonrecourse loans, f inancial products and services for real estate and construction industries, and financial products and services related to project finance and specialty finance, such as M&A finance. The “Principal Transactions” segment provides financial products and services related to credit trading and private equity businesses. “Showa Leasing” segment primarily provides financial products and services related to leasing. In the Global Markets Business, the “Markets” segment engages in foreign exchanges, derivatives, equity-related transactions and other capital markets transactions. The “Other Global Markets” segment consists of securities business provided by Shinsei Securities, asset management and wealth management businesses. In the Individual Business, the “Retail Banking” segment provides f inancial products and services for retail customers, “Shinsei Financial” segment, which consists of Shinsei Financial Co., Ltd., Shinsei Personal Loan Co., Ltd. and unsecured card loan business in the Bank, etc., provides consumer finance business. Also, after reviewing the Group’s unsecured loan business strategy, in April 2018, the Group decided Shinsei Financial launched a new card loan product, “Lake ALSA”, as a service to customers with consumer f inance product needs, suspending appl icat ions and contracts f rom new customers of Shinsei Bank Card Loan—Lake in the Bank from April 2018. “APLUS FINANCIAL” segment provides instal lment sales credit , credit cards, loans and settlement services. The “Other” segment consists of profit and loss attributable to the Consumer Finance
Headquarters and other subsidiaries. In the Corporate/Other, the “Treasury” segment engages in ALM operations and fund raising including capital instruments.
(b) METHODS OF MEASUREMENT FOR THE AMOUNTSOF REVENUE, PROFIT (LOSS), ASSETS, LIABILITIES ANDOTHER ITEMS BY REPORTABLE SEGMENTS
The accounting policies of each reportable segment are consistent to those disclosed in Note 2, “SUMMARY OF SIGNIFICANT ACCOUNTING POLICIES,” except for interest on inter-segment transactions and indirect expense. Interest on inter-segment transactions is calculated using an inter-office rate. Indirect expense is allocated, based on a predetermined internal rule, to each reportable segment according to the budget which is set at the beginning of the fiscal year.
91
SEGMENT INFORMATION

Notes to Consolidated Financial Statements
SHINSEI BANK, LIMITED Integrated Report 2019
2019/07/10 8:13:49 / 19509946_株式会社新生銀行_総会その他(C)
36. SEGMENT INFORMATION (CONTINUED) CONSOLIDATED
(c) REVENUE, PROFIT (LOSS), ASSETS, LIABILITIES AND OTHER ITEMS BY REPORTABLE SEGMENTS
Millions of yenInstitutional Business Global Markets Business
Fiscal year ended March 31, 2019CorporateBusiness
StructuredFinance
PrincipalTransactions
ShowaLeasing Markets
Other GlobalMarkets
Revenue1: ¥ 16,780 ¥ 17,644 ¥ 9,391 ¥ 14,202 ¥ 7,109 ¥ 2,311Net Interest Income 10,043 10,389 3,778 (65) 1,579 504Noninterest Incomeⅰ 6,737 7,254 5,613 14,267 5,529 1,806
Expenses2 11,827 7,796 4,039 9,838 3,759 3,334Net Credit Costs (Recoveries)3 865 (2,198) 12 (615) 11 8Segment Profit (Loss) ¥ 4,087 ¥ 12,046 ¥ 5,339 ¥ 4,979 ¥ 3,338 ¥ (1,031)Segment Assets4,6,ⅱ ¥ 1,577,138 ¥ 1,643,690 ¥ 190,745 ¥ 490,757 ¥ 368,368 ¥ 39,633Segment Liabilities5,6 ¥ 1,201,064 ¥ 96,407 ¥ 6,218 ¥ 1,504 ¥ 178,539 ¥ 43,925Includes:
ⅰ. Equity in net income (loss) of affiliates ¥ - ¥ - ¥ 5,682 ¥ 2 ¥ - ¥ -ⅱ. Investment in affiliates - - 63,777 1,410 - -
Other:Goodwill (Negative Goodwill):
Amortization ¥ - ¥ - ¥ (0) ¥ 2,158 ¥ - ¥ -Unamortized balance - - (2) 13,016 - -
Intangible assets acquired inbusiness combinations:Amortization ¥ - ¥ - ¥ - ¥ 236 ¥ - ¥ -Unamortized balance - - - 690 - -
Impairment losses onlong-lived assets ¥ 98 ¥ - ¥ 0 ¥ - ¥ 0 ¥ 114
Millions of yenIndividual Business Corporate/Other
RetailBanking
Consumer Finance
Fiscal year ended March 31, 2019Shinsei
FinancialAPLUS
FINANCIAL Other Treasury Other7 Total
Revenue1: ¥ 26,956 ¥ 69,261 ¥ 57,875 ¥ 1,660 ¥ 6,055 ¥ 480 ¥ 229,729Net Interest Income 23,964 69,352 10,768 800 2,699 (0) 133,816Noninterest Incomeⅰ 2,991 (90) 47,107 859 3,355 480 95,913
Expenses2 27,680 33,483 38,175 1,767 1,698 1,335 144,735Net Credit Costs (Recoveries)3 (24) 14,570 16,576 133 - 8 29,348Segment Profit (Loss) ¥ (700) ¥ 21,208 ¥ 3,123 ¥ (240) ¥ 4,357 ¥ (862) ¥ 55,645Segment Assets4,6,ⅱ ¥ 1,203,020 ¥ 519,405 ¥ 1,116,838 ¥ 54,954 ¥ 673,893 ¥ 0 ¥ 7,878,447Segment Liabilities5,6 ¥ 4,594,559 ¥ 49,080 ¥ 389,214 ¥ 753 ¥ - ¥ 0 ¥ 6,561,268Includes:
ⅰ. Equity in net income (loss) of affiliates ¥ - ¥ - ¥ - ¥ 13 ¥ - ¥ - ¥ 5,697ⅱ. Investment in affiliates - - - 6,937 - - 72,125
Other:Goodwill (Negative Goodwill):
Amortization ¥ - ¥ 23 ¥ 29 ¥ - ¥ - ¥ - ¥ 2,211Unamortized balance - (2,024) - - - - 10,989
Intangible assets acquired inbusiness combinations:Amortization ¥ - ¥ 363 ¥ - ¥ - ¥ - ¥ - ¥ 599Unamortized balance - - - - - - 690
Impairment losses onlong-lived assets ¥ 371 ¥ 124 ¥ - ¥ 0 ¥ - ¥ 246 ¥ 955
92
SEGMENT INFORMATION

Notes to Consolidated Financial Statements
SHINSEI BANK, LIMITED Integrated Report 2019
2019/07/10 8:13:49 / 19509946_株式会社新生銀行_総会その他(C)
36. SEGMENT INFORMATION (CONTINUED) CONSOLIDATED
Millions of yenInstitutional Business Global Markets Business
Fiscal year ended March 31, 2018CorporateBusiness
StructuredFinance
PrincipalTransactions
ShowaLeasing Markets
Other GlobalMarkets
Revenue1: ¥ 18,781 ¥ 17,050 ¥ 12,853 ¥ 15,985 ¥ 8,581 ¥ 2,839Net Interest Income 10,005 9,584 5,022 (147) 1,684 509Noninterest Incomeⅰ 8,776 7,465 7,831 16,132 6,897 2,329
Expenses2 11,848 6,863 4,713 8,984 3,759 3,338Net Credit Costs (Recoveries)3 293 1,754 (1,207) 2,793 (35) 57Segment Profit (Loss) ¥ 6,639 ¥ 8,432 ¥ 9,347 ¥ 4,207 ¥ 4,857 ¥ (556)Segment Assets4,6,ⅱ ¥ 1,592,790 ¥ 1,396,630 ¥ 193,795 ¥ 502,802 ¥ 361,331 ¥ 46,424Segment Liabilities5,6 ¥ 1,026,134 ¥ 76,375 ¥ 16,909 ¥ 2,064 ¥ 185,391 ¥ 78,324Includes:
ⅰ. Equity in net income (loss) of affiliates ¥ - ¥ - ¥ 3,265 ¥ (1) ¥ - ¥ -ⅱ. Investment in affiliates - - 57,474 920 - -
Other:Goodwill (Negative Goodwill):
Amortization ¥ - ¥ - ¥ (0) ¥ 2,146 ¥ - ¥ -Unamortized balance - - (2) 15,025 - -
Intangible assets acquired inbusiness combinations:Amortization ¥ - ¥ - ¥ - ¥ 268 ¥ - ¥ -Unamortized balance - - - 927 - -
Impairment losses onlong-lived assets ¥ - ¥ 0 ¥ 34 ¥ - ¥ - ¥ -
Millions of yenIndividual Business Corporate/Other
RetailBanking
Consumer Finance
Fiscal year ended March 31, 2018Shinsei
FinancialAPLUS
FINANCIAL Other Treasury Other7 Total
Revenue1: ¥ 23,506 ¥ 68,930 ¥ 56,446 ¥ 3,421 ¥ 2,871 ¥ 761 ¥ 232,030Net Interest Income 22,414 69,049 11,361 638 (1,340) (6) 128,775Noninterest Incomeⅰ 1,092 (119) 45,084 2,783 4,212 767 103,254
Expenses2 29,210 32,445 36,670 1,343 1,792 1,613 142,584Net Credit Costs (Recoveries)3 170 22,766 10,614 68 - (5) 37,270Segment Profit (Loss) ¥ (5,874) ¥ 13,717 ¥ 9,161 ¥ 2,009 ¥ 1,079 ¥ (846) ¥ 52,175Segment Assets4,6,ⅱ ¥ 1,282,996 ¥ 524,077 ¥ 1,032,687 ¥ 45,041 ¥ 671,034 ¥ 0 ¥ 7,649,612Segment Liabilities5,6 ¥ 4,886,499 ¥ 53,296 ¥ 321,869 ¥ 538 ¥ - ¥ 0 ¥ 6,647,403Includes:
ⅰ. Equity in net income (loss) of affiliates ¥ - ¥ - ¥ - ¥ 1,888 ¥ - ¥ - ¥ 5,152ⅱ. Investment in affiliates - - - 7,087 - - 65,482
Other:Goodwill (Negative Goodwill):
Amortization ¥ - ¥ 627 ¥ - ¥ - ¥ - ¥ - ¥ 2,773Unamortized balance - (3,112) - - - - 11,910
Intangible assets acquired inbusiness combinations:Amortization ¥ - ¥ 945 ¥ - ¥ - ¥ - ¥ - ¥ 1,213Unamortized balance - 363 - - - - 1,290
Impairment losses onlong-lived assets ¥ 101 ¥ 682 ¥ - ¥ - ¥ - ¥ 1,015 ¥ 1,834
93
SEGMENT INFORMATION

Notes to Consolidated Financial Statements
SHINSEI BANK, LIMITED Integrated Report 2019
2019/07/10 8:13:49 / 19509946_株式会社新生銀行_総会その他(C)
36. SEGMENT INFORMATION (CONTINUED) CONSOLIDATED
Thousands of U.S. dollarsInstitutional Business Global Markets Business
Fiscal year ended March 31, 2019CorporateBusiness
StructuredFinance
PrincipalTransactions
ShowaLeasing Markets
Other GlobalMarkets
Revenue1: $ 151,532 $ 159,330 $ 84,811 $ 128,248 $ 64,198 $ 20,872Net Interest Income 90,690 93,823 34,120 (589) 14,266 4,557Noninterest Incomeⅰ 60,842 65,508 50,691 128,837 49,932 16,315
Expenses2 106,802 70,401 36,480 88,842 33,947 30,112Net Credit Costs (Recoveries)3 7,815 (19,853) 114 (5,558) 104 78Segment Profit (Loss) $ 36,915 $ 108,782 $ 48,217 $ 44,964 $ 30,147 $ (9,318)Segment Assets4,6,ⅱ $14,241,817 $14,842,792 $ 1,722,462 $ 4,431,621 $ 3,326,431 $ 357,897Segment Liabilities5,6 $10,845,808 $ 870,575 $ 56,153 $ 13,587 $ 1,612,239 $ 396,653Includes:
ⅰ. Equity in net income (loss) of affiliates $ - $ - $ 51,311 $ 23 $ - $ -ⅱ. Investment in affiliates - - 575,924 12,734 - -
Other:Goodwill (Negative Goodwill):
Amortization $ - $ - $ (5) $ 19,496 $ - $ -Unamortized balance - - (20) 117,539 - -
Intangible assets acquired inbusiness combinations:Amortization $ - $ - $ - $ 2,136 $ - $ -Unamortized balance - - - 6,239 - -
Impairment losses onlong-lived assets $ 887 $ - $ - $ - $ - $ 1,038
Thousands of U.S. dollarsIndividual Business Corporate/Other
RetailBanking
Consumer Finance
Fiscal year ended March 31, 2019Shinsei
FinancialAPLUS
FINANCIAL Other Treasury Other7 TotalRevenue1: $ 243,418 $ 625,445 $ 522,625 $ 14,995 $ 54,680 $ 4,341 $ 2,074,497
Net Interest Income 216,403 626,265 97,238 7,230 24,379 (1) 1,208,383Noninterest Incomeⅰ 27,015 (820) 425,387 7,765 30,301 4,342 866,114
Expenses2 249,959 302,357 344,733 15,961 15,335 12,058 1,306,986Net Credit Costs (Recoveries)3 (219) 131,573 149,690 1,208 - 73 265,024Segment Profit (Loss) $ (6,322) $ 191,515 $ 28,203 $ (2,173) $ 39,345 $ (7,789) $ 502,486Segment Assets4,6,ⅱ $10,863,465 $ 4,690,319 $10,085,227 $ 496,251 $ 6,085,364 $ $71,143,646Segment Liabilities5,6 $41,489,613 $ 443,201 $ 3,514,672 $ 6,806 $ - $ $59,249,307Includes:
ⅰ. Equity in net income (loss) of affiliates $ - $ - $ - $ 118 $ - $ - $ 51,452ⅱ. Investment in affiliates - - - 62,644 - - 651,301
Other:Goodwill (Negative Goodwill):
Amortization $ - $ 215 $ 263 $ - $ - $ - $ 19,969Unamortized balance - (18,283) - - - - 99,236
Intangible assets acquired inbusiness combinations:Amortization $ - $ 3,282 $ - $ - $ - $ - $ 5,417Unamortized balance - - - - - - 6,239
Impairment losses onlong-lived assets $ 3,351 $ 1,123 $ - $ 0 $ - $ 2,226 $ 8,6261 “Revenue,” which represents gross operating profit under our management reporting, is presented as a substitute for sales in other industries. “Revenue” is defined as the total of net
interest income, net fees and commissions, net trading income and net other business income on the management reporting basis. “Revenue” represents income and related cost attributable to our core business.
2 “Expenses” are general and administrative expenses deducting amortization of goodwill and intangible assets, amortization of actuarial gains or losses of retirement benefit cost and lump-sum payments.
3 “Net Credit Costs (Recoveries)” consists of provision/reversal of reserve for credit losses, losses on write-off/sales of loans and recoveries of written-off claims.4 “Segment Assets” consists of other monetary claims purchased, trading assets, monetary assets held in trust, securities, loans and bills discounted, lease receivables and leased investment
assets, installment receivables, tangible leased assets, intangible leased assets and customer’s liabilities for acceptances and guarantees.5 “Segment Liabilities” consists of deposits, including negotiable certificates of deposit, debentures, trading liabilities and acceptances and guarantees.6 Regarding assets and liabilities not allocated to each business segment, there are related revenue and expense items which are allocated to each business segment based on a rational
allocation method. For example, interest on other borrowings is considered a part of “Revenue” and included in segment income, although borrowed money is not allocated to each "Segment Liabilities." In addition, depreciation is considered a part of “Expenses” and included in segment income, although premises and equipment excluding tangible leased assets and intangible assets excluding intangible leased assets are not allocated to each "Segment Assets."
7 “Other” under the Corporate/Other includes company-wide accounts which are not included in our reportable segments, allocation variance of indirect expense and elimination amount of inter-segment transactions.
94
SEGMENT INFORMATION

Notes to Consolidated Financial Statements
SHINSEI BANK, LIMITED Integrated Report 2019
2019/07/10 8:13:49 / 19509946_株式会社新生銀行_総会その他(C)
36. SEGMENT INFORMATION (CONTINUED) CONSOLIDATED
(d) RECONCILIATION BETWEEN THE SEGMENT INFORMATION AND THE CONSOLIDATED FINANCIAL STATEMENTS
(i) A reconciliation between total segment profit and income (loss) before income taxes on the consolidated statements of income for the fiscal years ended March 31, 2019 and 2018 was as follows:
Millions of yenThousands ofU.S. dollars
Fiscal Year ended March 31 2019 2018 2019Total segment profit ¥ 55,645 ¥ 52,175 $ 502,486Amortization of goodwill (2,211) (2,773) (19,969)Amortization of intangible assets (599) (1,213) (5,417)Lump-sum payments (1,031) (397) (9,319)Other gains (losses), net 2,782 7,621 25,123Income (loss) before income taxes ¥ 54,584 ¥ 55,411 $ 492,904
(ii) A reconciliation between total segment assets and total assets on the consolidated balance sheets as of March 31, 2019 and 2018 was as follows:
Millions of yenThousands ofU.S. dollars
As of March 31, 2019 2018 2019Total segment assets ¥ 7,878,447 ¥ 7,649,612 $ 71,143,646Cash and due from banks 1,355,966 1,465,663 12,244,592Receivables under securities borrowing transactions 2,119 2,629 19,135Foreign exchanges 29,546 32,511 266,813Other assets excluding installment receivables 289,051 297,369 2,610,178Premises and equipment excluding tangible leased assets 20,862 22,263 188,387Intangible assets excluding intangible leased assets 67,186 59,484 606,706Assets for retirement benefits 10,931 13,261 98,711Deferred tax assets 15,096 14,705 136,325Reserve for credit losses (98,034) (100,840) (885,272)Total assets ¥ 9,571,172 ¥ 9,456,660 $ 86,429,222
(iii) A reconciliation between total segment liabilities and total liabilities on the consolidated balance sheets as of March 31, 2019 and 2018 was as follows:
Millions of yenThousands ofU.S. dollars
As of March 31, 2019 2018 2019Total segment liabilities ¥ 6,561,268 ¥ 6,647,403 $ 59,249,307Call money 145,000 - 1,309,373Payables under repurchase agreements 59,098 55,919 533,671Payables under securities lending transactions 510,229 433,462 4,607,458Borrowed money 684,077 739,578 6,177,334Foreign exchanges 471 102 4,256Short-term corporate bonds 191,000 175,700 1,724,761Corporate bonds 92,335 85,000 833,800Other liabilities 347,383 367,734 3,136,925Accrued employees’ bonuses 8,598 8,489 77,649Accrued directors’ bonuses 44 51 404Liabilities for retirement benefits 8,232 8,366 74,337Reserve for reimbursement of debentures 3,764 4,130 33,991Reserve for losses on interest repayments 63,025 74,687 569,131Total liabilities ¥ 8,674,529 ¥ 8,600,625 $ 78,332,396
95
SEGMENT INFORMATION

Notes to Consolidated Financial Statements
SHINSEI BANK, LIMITED Integrated Report 2019
2019/07/10 8:13:49 / 19509946_株式会社新生銀行_総会その他(C)
36. SEGMENT INFORMATION (CONTINUED) CONSOLIDATED
(B) RELATED INFORMATION
(a) INFORMATION BY SERVICES
Income regarding major services for the fiscal years ended March 31, 2019 and 2018 was as follows:
Millions of yenThousands ofU.S. dollars
Fiscal Year ended March 31 2019 2018 2019Loan Businesses ¥ 146,836 ¥ 141,804 $ 1,325,956Lease Businesses 6,152 6,105 55,554Securities Investment Businesses 12,908 21,642 116,568Installment Sales and Guarantee Businesses 48,743 47,926 440,164
(b) GEOGRAPHICAL INFORMATION(i) REVENUERevenue from external domestic customers exceeded 90% of total revenue on the consolidated statements of income for the fiscal years ended March 31, 2019 and 2018, therefore geographical revenue information is not presented.
(ii) PREMISES AND EQUIPMENTThe balance of domestic premises and equipment exceeded 90% of the total balance of premises and equipment on the consolidated balance sheets as of March 31, 2019 and 2018, therefore geographical premises and equipment information is not presented.
(c) MAJOR CUSTOMER INFORMATIONRevenue to a specific customer did not reach 10% of total revenue on the consolidated statements of income for the fiscal years ended March 31, 2019 and 2018, therefore major customer information is not presented.
37. RELATED PARTY TRANSACTIONS CONSOLIDATED
Related party transactions for the fiscal years ended March 31, 2019 and 2018 were as follows:
Amount of the transaction Balance at the end of fiscal year
Description ofthe transaction
Millions of yenThousands ofU.S. dollars Millions of yen
Thousands ofU.S. dollars
Related party 2019 2018 2019 Account name 2019 2018 2019
Companies in which a majority of the voting rightsis owned by directors (including their subsidiaries)J.C. Flowers II L.P.1 Investment2 ¥ 56 ¥ 143 $ 514 - ¥ - ¥ - $ -
Dividend 2,798 154 25,266 - - - --
J.C. Flowers III L.P.1 Investment3 403 245 3,647 - - - -Dividend 597 532 5,397 - - - -
- - J.C. Flowers Ⅳ L.P.1 Investment4 48 54 440 - - - -
Director
Hideyuki KudoIn-kind contributions of monetary compensation claims5
¥ 12 ¥ - $ 117 - ¥ - ¥ - $ -
1 The fund is operated by J.C. Flowers & Co. LLC, of which J. Christopher Flowers, a director of the Bank, serves as the managing director and chief executive officer.2 The committed investment amounts are U.S.$ 200 million based on the limited partnership agreement.3 The committed investment amounts are U.S.$ 34,975 thousand based on the limited partnership agreement.4 The committed investment amounts are U.S.$ 25 million based on the limited partnership agreement.5 The in-kind contributions of the monetary compensation claims for the restricted stock compensation.
96
SEGMENT INFORMATION、RELATED PARTY TRANSACTIONS

Notes to Consolidated Financial Statements
SHINSEI BANK, LIMITED Integrated Report 2019
2019/07/10 8:13:49 / 19509946_株式会社新生銀行_総会その他(C)
38. FINANCIAL INSTRUMENTS AND RELATED DISCLOSURES CONSOLIDATED
(A) GROUP POLICY FOR FINANCIAL INSTRUMENTSThe Group conducts total financial services, primarily basic banking business and other financial services such as securities business, trust business, consumer finance business, and commercial finance business. For conducting these businesses, the Bank obtains retail customer deposits as a long-term and stable source of funding. In addition, the Bank diversifies sources of funding by securitization of loans or other assets. Subsidiaries and aff i l iates also use borrowings from other f inancial institutions as a source of funding.
(B) NATURE AND EXTENT OF RISKS ARISING FROM FINANCIAL INSTRUMENTS
(a) Financial assetsThe financial assets held by the Group are exposed to the following risks:
Loans and bills discountedLoans and bills discounted, which are primarily provided to domestic institutional and individual customers, are exposed to customer's credit risk and risk of fluctuation in interest rates.
SecuritiesSecurities primarily consist of bonds and stocks and other investments such as foreign securities and investments in partnerships. They are exposed to the risk of fluctuation in interest rates, foreign exchange rates, and prices in the bond/stock markets and in addition, credit risk arising from downgrading of issuer's credit rating, default, etc.
Other monetary claims purchased,Monetary assets held in trustOther monetary claims purchased and Monetary assets held in trust consist of investments in various assets such as housing loans, nonperforming loans, and receivables in credit trading and securitization businesses, with the purpose of collection, sale, or securitization. There is a possibility that the Group's profits and losses and financial condition will be badly affected if earnings from these assets are less than expected. These investments are exposed to the risk of fluctuation in market size and price of these assets.
Lease receivables and leased investment assets,Installment receivablesLease receivables, leased investment assets, and installment receivables held by consolidated subsidiaries are exposed to the customer's credit risk and the risk of fluctuation in interest rates.
(b) Financial liabilitiesFinancial liabilities of the Group are mainly deposits. In addition to the risk of fluctuation in interest rates, the Group has funding liquidity risk that sufficient funding would become difficult or more expensive in the case of deterioration in the Group's financial position.
By utilizing time deposits as an important Asset Liability Management (ALM) measure, the Bank is striving to diversify funding maturities and to disperse refunding dates. Without solely relying on interbank funding, the Bank is aiming to cover its funding needs through core retail deposits and corporate deposits as well as capital.
(c) Derivative transactionsThe Group enters into the following derivative transactions to provide products for customer needs, to maximize the profit of the Bank's own trading account and for asset and liability management, hedging transactions and other purposes.
(1) Interest rate related Interest rate swap, Futures contract, Interest rate option, and Interest rate swaption
(2) Currency related Currency swap, Forward foreign e x c h a n g e c o n t r a c t , a n d Currency option
(3) Equity related Equity index futures, Equity index option, Equity option, and other
(4) Bond related Bond futures, and Bond futures option
(5) Credit derivative Credit default option, and other
Among the risks associated with derivative transactions, market risk, credit risk and liquidity risk are to be specially noted for risk management.
(1) Market Risk Risk that losses are incurred associated with changes in the value of financial instruments from fluctuation in market price, as well as volatilities inherent in derivative instruments
(2) Credit Risk Risk that losses are incurred associated with the counter-party defaulting on contractual terms
(3) Liquidity Risk Risk that additional costs are incurred associated with closing out the position of the financial instrument held
To appropriately reflect the risk mitigation effect of derivative transactions to the consolidated financial statements, the Group adopts hedge accounting where risks in assets and liabilities of the Group are hedged by interest rate swap, currency swap, etc. In hedge accounting, effectiveness of hedging is assessed based on the conditions determined in the accounting standards such as the “Accounting Standard for Financial Instruments.”
97
FINANCIAL INSTRUMENTS AND RELATED DISCLOSURES

Notes to Consolidated Financial Statements
SHINSEI BANK, LIMITED Integrated Report 2019
2019/07/10 8:13:49 / 19509946_株式会社新生銀行_総会その他(C)
38. FINANCIAL INSTRUMENTS AND RELATED DISCLOSURES (CONTINUED) CONSOLIDATED
(C) RISK MANAGEMENT FOR FINANCIAL INSTRUMENTS(a) Credit risk managementThe Group's model for credit risk management focuses on securing adequate return on risk, avoiding excessive concentration in particular sectors or to particular customer groups, and managing the credit portfolio with an analysis of potential losses under a worst-case scenario. Concrete policies and guidelines related to credit risk management of corporate business are clarified in the Group's detailed procedures, and credit risk management processes are roughly c lass i f ied into credi t r i sk management for individual transactions and portfolio-based credit risk management. As for credit risk management for individual transactions, approval authority level is determined in accordance with transaction amount, aggregate credit exposure to obligor's group companies, credit rating, and so on. The Group has an approval system in which decisions are made jointly by the business promotion section and the credit assessment section, and the final authority and decision rests with the credit assessment section. On portfolio-based credit risk management, to diversify risks in terms of industries, ratings and customer groups, the risk management divisions monitor the segment-specif ic r isk diversi f ication status and also rat ing fluctuations related to customers within the portfolios. The division uses this information to provide comprehensive reports to the Group Risk Policy Committee on a quarterly basis. Credit risks in credit transactions are quantified based on the probability of default by obligor rating, loss given default, and unexpected loss ratio. In order to decrease credit risk of obligors, the Group secures collateral and guarantees for the protection of its claims, the values of which are checked more than once a year. Quasi credit risks involved in market transactions, such as derivative transactions, are controlled based on fair values and estimations of future value fluctuations and are reflected in the valuation of derivative transactions. As for credit risk management of the consumer finance business, risk management divisions of each Group Company monitor leading indicators for quality of screening, quality of portfolio and performance of collection of claims monthly to recognize and tackle the aggravation of credit cost promptly. In case of any aggravation, the Group takes action to tackle it. To take the risk strategy above, the Group Individual Banking Risk Management Division in the Bank holds monthly performance review, analyzes and monitors these leading indicators, confers with the persons in charge of risk management of each Group Company on their policies and strategies, and carries out the necessary measures. The division does not merely avoid losses but also produces a balanced strategy with appropriate risk
and return a t t r ibutes and repor ts th i s bus iness performance to the Group Risk Policy Committee quarterly.
(b) Market risk managementMarket risks which are associated with changes in the value of financial assets and liabilities, including off-balance-sheet transactions, from fluctuations in interest rates, foreign exchange rates, stock prices and other market-related indices, have an effect on our financial performance. The Group manages market risk by segregating the overall balance sheet, including off-balance-sheet transactions, into a trading business and a banking business. At the Market Business Management Committee, the sen io r rev iew and dec i s ion -mak ing fo r the management of the trading business are performed. At the Group ALM Committee, the senior review and decision-mak ing fo r t he management ma in l y r e l a ted to asset/liability management of the banking business are performed. To control total market risk amounts properly, the trading business includes the banking account transactions in “Securities” and “Derivative instruments,” which are desirable to manage the total risk amount in combination with the trading business in light of the purpose and format of the transaction, in addition to the trading account transactions. The actual risk limits for asset/liability management of the trading business, such as the value-at-risk (VaR) method, are approved by the Group Executive Committee based on “Trading Business Risk Management Policy.” The Market Business Management Committee meets monthly to review reports from the Group Integrated Risk Management Division and front office. The interest rate risk of the net asset and/or liability in the banking business, which has interest rate sensitivity, is managed by the Group ALM Committee based on “Group ALM Policy.” The Group Integrated Risk Management Division is responsible for appropriate monitoring and reporting of market risk in both the Group's trading business and banking business. In addition to reporting risk information to management, administrative divisions and front office units, the Group Integrated Risk Management Division c a r r i e s o u t r e g u l a r r i s k a n a l y s e s a n d m a k e s recommendations. Market risk involved in the trading business is managed by the Trading Divis ion and Investment Business Division, and market risk of the balance sheet involved in the banking business is managed by the Group Treasury Division. Market risk is managed by quantifying on a daily basis and making risk adjustment in response to market conditions.
98
FINANCIAL INSTRUMENTS AND RELATED DISCLOSURES

Notes to Consolidated Financial Statements
SHINSEI BANK, LIMITED Integrated Report 2019
2019/07/10 8:13:49 / 19509946_株式会社新生銀行_総会その他(C)
38. FINANCIAL INSTRUMENTS AND RELATED DISCLOSURES (CONTINUED) CONSOLIDATED
Quantitative information on market risk is as follows:
(i) Amount of market risk associated with the trading businessThe Group uses VaR for quantitative analysis on market risk associated with the trading business. For calculating VaR, the historical simulation method (in principle, holding period of 10 days, confidence interval of 99%, and observation period of 250 business days) has been adopted. The VaR in the Group's trading business as of March 31, 2019 and 2018 were ¥1,859 million (U. S. $16,788 thousand) and ¥1,275 mi l l ion in the aggregate , respectively. The Group conducts back testing to compare VaR calculated using the model with actual loss amounts. According to the results of back testing conducted, it is believed that the measurement model the Group uses is adequate enough to accurately capture market risk. It should be noted that VaR measures and calculates the amount of market risk at certain probability levels statistically based on historical market fluctuation, and therefore there may be cases where risk cannot be captured in such situations when market conditions are changing dramatically beyond what was experienced historically.
(ii) Amount of market risk associated with the banking businessThe Group's main financial instruments which are affected by interest rate risk, one of the major risk variables, inc ludes “Cal l loans , ” “Receivables under resa le agreements,” “Receivables under securities borrowing transactions,” “Other monetary claims purchased,” “Monetary assets held in trust,” bonds other than trading business in “Securities,” “Loans and bills discounted,” “Lease receivables and leased investment assets,” “Installment receivables,” “Deposits, including negotiable certificates of deposit,” “Debentures,” “Call money,” “Payables under repurchase agreements,” “Payables under securities lending transactions,” “Borrowed money,” “Short-term corporate bonds,” “Corporate bonds” and interest rate swaps other than trading business in “Derivative instruments.” As for these financial assets and liabilities, the Group uses the amount of impact on economic values, which is calculated using fluctuation range of interest rates by 100 basis points (1%) for quantitative analysis to manage fluctuation risk of interest rates. The amount of such impact on economic values is calculated by categorizing the exposure amount of these financial assets and liabilities according to the term of interest payments and using the above fluctuation range of interest rates. The Bank calculates the amount of impact on economic va l ues wh i l e r e f l e c t i ng t he non - l i nea r r i s k due
to prepayment to appropriately estimate the fluctuation risk of interest rates. Assuming all risk variables except for interest rate are constant, the Group estimated that the economic value would decrease by ¥48,588 million (U.S.$438,761 thousand) and ¥53,257 million in case of an increase of the index interest rates by 100 basis points (1%), and would decrease by ¥5,848 million (U.S.$52,815 thousand) and ¥3,470 million in case of a decrease by 100 basis points (1%),as of March 31, 2019 and 2018, respectively. Such amount of impact on economic value is calculated based on the assumption that all risk variables except for interest rate are constant, and correlation between interest rate and other risk variables is not taken into consideration.
(c) Liquidity risk managementThe Group ALM Committee, which is the senior review and decision-making body for the management of funding liquidity risk, manages funding liquidity risk by establishing funding gap limits and minimum liquidity reserve levels. In accordance with the “Cash Liquidity Risk Management Policy,” the Bank has a structure to conduct two or more liquidity measurements and to secure available reserves over the net cumulat ive outf low forecasted in an emergency situation. To manage the market liquidity risk for marketable instruments, the Group has trading limits and monitors the amounts of marketable instruments in view of the attributes of marketable instruments. Moreover, liquidity reserves for the trading account are calculated monthly and are reflected valuation of derivative transactions.
(D) CONCENTRATION OF CREDIT RISKAs of March 31, 2019, loans to the financial and insurance industry were approximately 11% of the total loans and bills discounted, and those to the real estate industry were approximately 12%, approximately 30% of which are nonrecourse loans for real estate. As of March 31, 2018, loans to the financial and insurance industry were approximately 11% of the total loans and bills discounted, and those to the real estate industry were approximately 12%, approximately 30% of which are nonrecourse loans for real estate.
(E) FAIR VALUE OF FINANCIAL INSTRUMENTSFair value of financial instruments includes the value calculated rationally in cases where no market price is available besides the value based on market price. Certain assumptions have been adopted for the calculation, so that the value calculated may not be the same when assumptions that differ from the Group's calculation are adopted.
99
FINANCIAL INSTRUMENTS AND RELATED DISCLOSURES

Notes to Consolidated Financial Statements
SHINSEI BANK, LIMITED Integrated Report 2019
2019/07/10 8:13:49 / 19509946_株式会社新生銀行_総会その他(C)
38. FINANCIAL INSTRUMENTS AND RELATED DISCLOSURES (CONTINUED) CONSOLIDATED
Fair values of financial instruments as of March 31, 2019 and 2018 were as follows:
Millions of yen2019 2018
Carrying amount Fair valueUnrealizedgain (loss) Carrying amount Fair value
Unrealizedgain (loss)
Assets:(1) Cash and due from banks ¥ 1,355,966 ¥ 1,355,966 ¥ - ¥ 1,465,663 ¥ 1,465,663 ¥ -(2) Receivables under securities
borrowing transactions 2,119 2,119 - 2,629 2,629 -(3) Other monetary claims purchased
Trading purposes 2,853 2,853 - 1,705 1,705 -Other1 27,987 28,287 300 34,322 35,078 755
(4) Trading assetsSecurities held for trading purposes 3,445 3,445 - 4,589 4,589 -
(5) Monetary assets held in trust1 304,039 309,452 5,412 234,249 238,341 4,092(6) Securities
Trading securities 0 0 - 0 0 -Securities being held to maturity 399,201 402,406 3,204 481,303 484,676 3,372Securities available for sale 624,563 624,563 - 534,752 534,752 -Equity securities of affiliates 57,345 43,837 (13,508) 51,960 39,079 (12,880)
(7) Loans and bills discounted2 4,986,839 4,895,963Reserve for credit losses (63,890) (67,160)
Net 4,922,948 5,114,537 191,588 4,828,803 4,997,458 168,655(8) Lease receivables and
leased investment assets 176,553 171,429Estimated Residual Value3 (4,952) (4,971)Reserve for credit losses (1,487) (2,019)Net 170,114 176,338 6,224 164,439 168,611 4,172
(9) Other assetsInstallment receivables 562,236 558,843Deferred gains on
installment receivables (11,246) (11,883)Reserve for credit losses (9,962) (9,802)
Net 541,027 594,686 53,659 537,158 581,827 44,669Total ¥ 8,411,611 ¥ 8,658,493 ¥ 246,881 ¥ 8,341,578 ¥ 8,554,414 ¥ 212,836
Liabilities:(1) Deposits, including negotiable
certificates of deposit ¥ 5,922,145 ¥ 5,919,691 ¥ 2,453 ¥ 6,067,096 ¥ 6,065,652 ¥ 1,444(2) Debentures - - - 423 423 (0)(3) Call money 145,000 145,000 - - - -(4) Payables under
repurchase agreements 59,098 59,098 - 55,919 55,919 -(5) Payables under
securities lending transactions 510,229 510,229 - 433,462 433,462 -(6) Trading liabilities
Trading securities sold for short sales 2,124 2,124 - 2,625 2,625 -(7) Borrowed money 684,077 684,028 49 739,578 739,603 (24)(8) Short-term corporate bonds 191,000 191,000 - 175,700 175,700 -(9) Corporate bonds 92,335 92,373 (38) 85,000 85,228 (228)
Total ¥ 7,606,011 ¥ 7,603,547 ¥ 2,464 ¥ 7,559,805 ¥ 7,558,613 ¥ 1,191Derivative instruments4:
Hedge accounting is not applied ¥ 22,481 ¥ 22,481 ¥ - ¥ 19,528 ¥ 19,528 ¥ -Hedge accounting is applied (9,356) (9,356) - (1,712) (1,712) -
Total ¥ 13,125 ¥ 13,125 ¥ - ¥ 17,815 ¥ 17,815 ¥ -
Contract amount Fair value Contract amount Fair valueOther:
Guarantee contracts5 ¥ 456,759 ¥ 8,792 ¥ 395,301 ¥ 2,318
100
FINANCIAL INSTRUMENTS AND RELATED DISCLOSURES

Notes to Consolidated Financial Statements
SHINSEI BANK, LIMITED Integrated Report 2019
2019/07/10 8:13:49 / 19509946_株式会社新生銀行_総会その他(C)
38. FINANCIAL INSTRUMENTS AND RELATED DISCLOSURES (CONTINUED) CONSOLIDATED
Thousands of U.S. dollars2019
Carrying amount Fair valueUnrealizedgain (loss)
Assets:(1) Cash and due from banks $ 12,244,592 $ 12,244,592 $ -(2) Receivables under securities
borrowing transactions 19,135 19,135 -(3) Other monetary claims purchased
Trading purposes 25,769 25,769 -Other1 252,731 255,440 2,709
(4) Trading assetsSecurities held for trading purposes 31,113 31,113 -
(5) Monetary assets held in trust1 2,745,524 2,794,403 48,879(6) Securities
Trading securities 0 0 -Securities being held to maturity 3,604,853 3,633,791 28,938Securities available for sale 5,639,907 5,639,907 -Equity securities of affiliates 517,839 395,860 (121,980)
(7) Loans and bills discounted2 45,031,963Reserve for credit losses (576,944)
Net 44,455,019 46,185,094 1,730,075(8) Lease receivables and
leased investment assets 1,594,311Estimated residual value3 (44,723)Reserve for credit losses (13,429)Net 1,536,159 1,592,368 56,209
(9) Other assetsInstallment receivables 5,077,089Deferred gains on
installment receivables (101,561)Reserve for credit losses (89,965)
Net 4,885,563 5,370,113 484,551Total $ 75,958,204 $ 78,187,585 $ 2,229,382Liabilities:(1) Deposits, including negotiable
certificates of deposit $ 53,477,923 $ 53,455,770 $ 22,153(2) Debentures - - -(3) Call money 1,309,373 1,309,373 -(4) Payables under
repurchase agreements 533,671 533,671 -(5) Payables under
securities lending transactions 4,607,458 4,607,458 -(6) Trading liabilities
Trading securities sold for short sales 19,186 19,186 -(7) Borrowed money 6,177,334 6,176,890 444(8) Short-term corporate bonds 1,724,761 1,724,761 -(9) Corporate bonds 833,800 834,145 (345)
Total $ 68,683,506 $ 68,661,253 $ 22,253Derivative instruments4:
Hedge accounting is not applied $ 203,014 $ 203,014 $ -Hedge accounting is applied (84,493) (84,493) -
Total $ 118,521 $ 118,521 $ -Contract amount Fair value
Other:Guarantee contracts5 $ 4,124,607 $ 79,399
1 Carrying amounts of Other monetary claims purchased and Monetary assets held in trust are presented as the amount net of reserve for credit losses because they are immaterial.2 For consumer loans held by consolidated subsidiaries included in Loans and bills discounted, reserve for losses on interest repayments of ¥63,025 million (U.S.$569,131 thousand) and ¥74,687
million was recognized for estimated losses on reimbursements of excess interest payments as of March 31, 2019 and 2018 respectively, which included the reserve for losses on interest repayments that have a possibility of being appropriated for loan principal in the future.
3 Estimated residual value of leased investment assets arising from finance lease transactions, where the ownership of the property is not deemed to transfer to the lessee, is deducted from leased investment assets.
4 Derivative instruments include derivative transactions both in trading assets and liabilities, and in other assets and liabilities. Derivative instruments are presented as net of assets and liabilities and presented with ( ) when a liability stands on a net basis.
5 Contract amount for guarantee contracts presents the amount of “Acceptances and guarantees” on the consolidated balance sheets.
101
FINANCIAL INSTRUMENTS AND RELATED DISCLOSURES
Notes to Consolidated Financial Statements
SHINSEI BANK, LIMITED Integrated Report 2019
2019/07/10 8:13:49 / 19509946_株式会社新生銀行_総会その他(C)
38. FINANCIAL INSTRUMENTS AND RELATED DISCLOSURES (CONTINUED) CONSOLIDATED
(Note 1) Valuation methodologies for financial instruments
Assets:(1) Cash and due from banksThe fair values are measured at carrying amounts because the fair values of due from banks with no maturity are approximate to the carrying amounts. Likewise, for due from banks with a maturity, the fair values are measured at carrying amounts because most of them are with short maturities of six months or less, therefore the fair values are approximate to the carrying amounts.
(2) Receivables under securities borrowing transactionsThe fair values are measured at carrying amounts because most of them are with short maturities of three months or less, therefore the fair values are approximate to the carrying amounts.
(3) Other monetary claims purchasedThe fair values are measured at quoted prices from third parties or determined using the DCF method.
(4) Trading assetsThe fair values are measured at market prices or quoted prices from third parties, or determined using the DCF method.
(5) Monetary assets held in trustThe fair values are determined using the DCF method based on the characteristics of the components of the entrusted assets.
(6) SecuritiesThe fair values of marketable equity securities are measured at closing prices on exchanges. The fair values of bonds and mutual funds are measured at market prices or quoted prices from third parties or determined using the DCF method.
(7) Loans and bills discountedThe fair values of loans and bills discounted with a fixed interest rate are determined by discounting contractual cash f lows, and the fa ir values of loans and bi l ls discounted with a floating interest rate are determined by discounting expected cash flows based on the forward rates (for loans and bills discounted hedged by interest rate swaps which meet specific criteria, summing up the cash flows from the interest rate swaps), using the risk-free rate adjusted to account for credit risk (after consideration of col lateral) with CDS spread etc. corresponding to the internal credit rating of each borrower. The fair values of housing loans are determined by discounting expected cash flows at the rates that consist of the risk free rate and spread that would be applied for the new housing loans with the same terms at the consolidated balance sheet date. The fair values of consumer loans are determined by discounting expected cash flows that reflect expected loss at the rates that
consist of the risk-free rate and certain costs, by a group of similar product types and customer segments. Regarding loans to obligors classif ied as “legally bankrupt,” “virtually bankrupt” or “possibly bankrupt,” fair values are measured at carrying amounts net of reserves for loan losses because the fair values of those loans are approximate to the carrying amounts net of reserves for loan losses, which are calculated based on the DCF method described in “(N) RESERVE FOR CREDIT LOSSES” in Note 2 “SUMMARY OF SIGNIFICANT ACCOUNTING POLICIES” or based on amounts which are expected to be collected through the disposal of collateral or execution of guarantees.
(8) Lease receivables and leased investment assetsThe fair values are primarily determined by discounting contractual cash flows at the rates that would be applied for the new contracts by a group of major product categories.
(9) Installment receivablesThe fair values are primarily determined by discounting expected cash flows that reflect the probability of prepayment at the rates that consist of the risk-free rate, credit risk and certain costs, by major product category groups.
Liabilities:(1) Deposits, including negotiable certificates of deposit The fair values of demand deposits, such as current deposits and ordinary deposits are recognized as the payment amount at the consolidated balance sheet date. The fair values of the deposits with maturities of six months or less are approximate to carrying amounts because of their short term maturities. The fair values of time deposits and negotiable certificates of deposit are determined by discounting expected cash flows at the rates that consist of the risk free rate and spread that would be applied for the new contracts with the same terms at the consolidated balance sheet date.
(2) Debentures and (9) Corporate bondsThe fair values of marketable corporate bonds are measured at market prices. The fair values of nonmarketable corporate bonds under the Medium Term Note program are determined by discounting expected cash flows at the actual average funding rates of corporate time deposits etc. funded within the past three months of the consolidated balance sheet date. The fair values of retail debentures are determined by discounting contractual cash flows at the latest actual funding rate of large-denomination (¥10 million or more) time deposits. The fair values of step-up callable subordinated bonds are determined by discounting expected cash flows, which reflect the probability of early redemption at the rates that consist of the risk-free rate and the CDS spread of the Bank.
102
FINANCIAL INSTRUMENTS AND RELATED DISCLOSURES

Notes to Consolidated Financial Statements
SHINSEI BANK, LIMITED Integrated Report 2019
2019/07/10 8:13:49 / 19509946_株式会社新生銀行_総会その他(C)
38. FINANCIAL INSTRUMENTS AND RELATED DISCLOSURES (CONTINUED) CONSOLIDATED
(3) Ca l l money , (4) Payables under repurchase agreements and (5) Payables under securities lending transactionsThe fair values are approximate to the carrying amounts for call money and bills sold, payables under repurchase agreements, and payables under securities lending transactions with short maturities of three months or less.
(6) Trading liabilitiesThe fair values are measured at market prices.
(7) Borrowed moneyThe fair values of borrowed money with fixed interest rates are primarily determined by discounting contractual cash flows (for borrowed money hedged by interest rate swaps which meet speci f ic matching cr iter ia, the contractual cash flows include the cash flows of the interest rate swaps), and the fair values of borrowed money with floating interest rates are determined by discounting expected cash flows on forward rates, at the funding rates that reflect the credit risk of the borrower.
The fair values of step-up callable subordinated borrowings are determined by discounting expected cash flows that reflect the probability of early redemption at the rates that consist of the risk-free rate and the CDS spread of the Bank.
(8) Short-term corporate bondsThe fair values are approximate to the carrying amounts because most of them are with short maturities of one year or less.
Derivative instruments:The fair values are primarily measured at closing prices on exchanges or determined using the DCF method or option-pricing models.
Other:Guarantee contractsThe fair values are determined by discounting the amount of difference between the original contractual cash flows and the expected cash flows that would be applied for the new contracts with the same terms at the risk-free rate.
(Note 2) Carrying amount of the financial instruments whose fair value cannot be reliably determined
Millions of yenThousands ofU.S. dollars
As of March 31, 2019 2018 2019Equity securities without readily available market price1,2 ¥ 14,342 ¥ 13,579 $ 129,519Investment in partnerships and others1,2 34,833 41,925 314,551Total ¥ 49,176 ¥ 55,505 $ 444,070
1 Equity securities without readily available market prices are out of the scope of fair value disclosure because their fair values cannot be reliably determined. Investments in partnerships and others, the assets of which comprise equity securities without readily available market prices, are out of the scope of fair values disclosure because fair values of those investments cannot be reliably determined.
2 For the fiscal years ended March 31, 2019 and 2018, impairment losses on equity securities without readily available market price of ¥1,439 million (U.S.$12,996 thousand) and ¥661 million, and on investment in partnerships and others of ¥1,441 million (U.S.$13,015 thousand) and ¥170 million were recognized, respectively.
(Note 3) Maturity analysis for financial assets with contractual maturitiesMillions of yen
As of March 31, 2019 1 year or lessOver 1 yearto 3 years
Over 3 yearsto 5 years Over 5 years
Due from banks ¥1,351,049 ¥ - ¥ - ¥ -Receivables under securities borrowing transactions 2,119 - - -Other monetary claims purchased
Other than trading purposes 14,562 3,000 826 9,746Securities
Held-to-maturity 120,000 230,000 5,000 40,000Available-for-sale 26,317 119,977 121,259 322,524
Loans and bills discounted 1,222,409 1,342,949 873,513 1,520,287Lease receivables and leased investment assets 53,318 72,745 31,794 18,668Installment receivables 144,394 180,553 77,907 153,635Total ¥2,934,170 ¥1,949,225 ¥1,110,300 ¥2,064,861
103
FINANCIAL INSTRUMENTS AND RELATED DISCLOSURES

Notes to Consolidated Financial Statements
SHINSEI BANK, LIMITED Integrated Report 2019
2019/07/10 8:13:49 / 19509946_株式会社新生銀行_総会その他(C)
38. FINANCIAL INSTRUMENTS AND RELATED DISCLOSURES (CONTINUED) CONSOLIDATED
Thousands of U.S. dollars
As of March 31, 2019 1 year or lessOver 1 yearto 3 years
Over 3 yearsto 5 years Over 5 years
Due from banks $ 12,200,198 $ - $ - $ -Receivables under securities borrowing transactions 19,135 - - -Other monetary claims purchased
Other than trading purposes 131,504 27,090 7,460 88,010Securities
Held-to-maturity 1,083,619 2,076,937 45,151 361,206Available-for-sale 237,653 1,083,420 1,094,997 2,912,449
Loans and bills discounted 11,038,550 12,127,047 7,887,965 13,728,440Lease receivables and leased investment assets 481,472 656,906 287,109 168,578Installment receivables 1,303,902 1,630,423 703,514 1,387,352Total $ 26,496,034 $ 17,601,824 $ 10,026,196 $ 18,646,035
Note: The financial instruments whose cash flow cannot be reliably estimated such as loans and bills discounted to obligors of “legally bankrupt,” “virtually bankrupt” and “possibly bankrupt,” and the financial instruments with no contractual maturity are not included in the tables above.
(Note 4) Maturity analysis for financial liabilities with contractual maturities
Millions of yen
As of March 31, 2019 1 year or lessOver 1 yearto 3 years
Over 3 yearsto 5 years Over 5 years
Deposits, including negotiable certificates of deposit1 ¥ 5,404,938 ¥ 207,990 ¥ 152,792 ¥ 156,423Debentures - - - -Call money 145,000 - - -Payables under repurchase agreements 59,098 - - -Payables under securities lending transactions 510,229 - - -Borrowed money 247,979 224,776 74,719 136,602Short-term corporate bonds 191,000 - - -Corporate bonds 25,000 25,735 40,000 1,600Total ¥ 6,583,246 ¥ 458,502 ¥ 267,511 ¥ 294,625
Thousands of U.S. dollars
As of March 31, 2019 1 year or lessOver 1 yearto 3 years
Over 3 yearsto 5 years Over 5 years
Deposits, including negotiable certificates of deposit1 $ 48,807,467 $ 1,878,187 $ 1,379,738 $ 1,412,532Debentures - - - -Call money 1,309,373 - - -Payables under repurchase agreements 533,671 - - -Payables under securities lending transactions 4,607,458 - - -Borrowed money 2,239,294 2,029,772 674,730 1,233,538Short-term corporate bonds 1,724,761 - - -Corporate bonds 225,754 232,391 361,206 14,448Total $ 59,447,778 $ 4,140,350 $ 2,415,674 $ 2,660,518
1 The cash flow of demand deposits is included in “1 year or less.”
104
FINANCIAL INSTRUMENTS AND RELATED DISCLOSURES

Notes to Consolidated Financial Statements
SHINSEI BANK, LIMITED Integrated Report 2019
2019/07/10 8:13:49 / 19509946_株式会社新生銀行_総会その他(C)
39. DERIVATIVE FINANCIAL INSTRUMENTS CONSOLIDATED
(A) DERIVATIVE TRANSACTIONS TO WHICH HEDGE ACCOUNTING WAS NOT APPLIEDThe fair values of derivatives on the consolidated balance sheets as of March 31, 2019 and 2018 are adjusted for credit risk by a reduction of ¥1,427 million (U.S.$12,891 thousand) and ¥1,399 million, respectively, and also adjusted for liquidity risk by a reduction of ¥1,766 million (U.S.$15,950 thousand) and ¥1,676 million, respectively. Regardless of this accounting treatment, the reduction of those risks is not reflected in the fair values shown in the following tables.
(a) INTEREST RATE-RELATED TRANSACTIONSInterest rate-related transactions as of March 31, 2019 and 2018 were as follows:
Millions of yen2019 2018
Contract/Notional principal Contract/Notional principal
TotalMaturity
over 1 year Fair valueUnrealizedgain (loss) Total
Maturityover 1 year Fair value
Unrealizedgain (loss)
Futures contracts (listed):Sold ¥ - ¥ - ¥ - ¥ - ¥ 260 ¥ - ¥ 1 ¥ 1Bought 16,299 1,610 34 34 1,678 1,031 1 1
Interest rate options (listed):
Sold - - - - - - - -Bought - - - - - - - -
Interest rate swaps (over-the-counter):Receive fixed and pay floating 4,447,768 3,791,287 173,548 173,548 4,594,421 3,884,522 152,090 152,090Receive floating and pay fixed 4,092,652 3,442,857 (154,298) (154,298) 4,110,663 3,521,558 (136,761) (136,761)Receive floating and pay floating 1,738,708 1,425,081 2,101 2,101 1,714,535 1,429,030 1,848 1,848
Interest rate swaptions (over-the-counter):Sold 846,584 566,584 (1,957) (630) 832,134 567,634 (1,597) (131)Bought 741,327 706,698 (571) (2,134) 871,620 732,911 418 (1,855)
Interest rate options (over-the-counter):Sold 12,156 12,156 (85) 135 17,280 11,780 (160) 148Bought 9,156 9,156 41 (28) 13,780 8,780 99 1
Total ¥ 18,812 ¥ 18,727 ¥ 15,941 ¥ 15,342Thousands of U.S. dollars
2019Contract/Notional principal
TotalMaturity
over 1 year Fair valueUnrealizedgain (loss)
Futures contracts (listed):Sold $ - $ - $ - $ -Bought 147,187 14,542 314 314
Interest rate options (listed):Sold - - - -Bought - - - -
Interest rate swaps (over-the-counter):Receive fixed and pay floating 40,164,063 34,235,932 1,567,173 1,567,173Receive floating and pay fixed 36,957,314 31,089,560 (1,393,345) (1,393,345)Receive floating and pay floating 15,700,817 12,868,711 18,974 18,974
Interest rate swaptions (over-the-counter):Sold 7,644,793 5,116,348 (17,680) (5,695)Bought 6,694,305 6,381,600 (5,160) (19,277)
Interest rate options (over-the-counter):Sold 109,772 109,772 (770) 1,224Bought 82,681 82,681 374 (255)
Total $ 169,880 $ 169,115
Notes:
(1) Derivatives included in the table above were measured at fair value and the unrealized gains and losses were recognized in the consolidated statement of income.
(2) The fair values of listed transactions represent the closing price on the Tokyo Financial Exchange and other exchanges. The fair values of over-the-counter transactions are calculated primarily by using the DCF method or option pricing models.
105
DERIVATIVE FINANCIAL INSTRUMENTS

Notes to Consolidated Financial Statements
SHINSEI BANK, LIMITED Integrated Report 2019
2019/07/10 8:13:49 / 19509946_株式会社新生銀行_総会その他(C)
39. DERIVATIVE FINANCIAL INSTRUMENTS (CONTINUED) CONSOLIDATED
(b) CURRENCY-RELATED TRANSACTIONSCurrency-related transactions as of March 31, 2019 and 2018 were as follows:
Millions of yen2019 2018
Contract/Notional principal Contract/Notional principal
TotalMaturity
over 1 year Fair valueUnrealizedgain (loss) Total
Maturityover 1 year Fair value
Unrealizedgain (loss)
Currency swaps (over-the-counter) ¥ 386,172 ¥ 334,939 ¥ 1,000 ¥ 1,000 ¥ 423,375 ¥ 298,609 ¥ 438 ¥ 438Forward foreign exchange contracts(over-the-counter):
Sold 1,057,595 45,219 4,201 4,201 894,307 21,452 12,162 12,162Bought 723,974 56,323 1,523 1,523 744,366 47,985 (10,234) (10,234)
Currency options (over-the-counter):Sold 885,386 451,408 (19,365) 14,084 927,123 380,604 (21,366) 9,789Bought 805,446 372,724 16,403 (4,244) 909,315 340,542 21,199 2,052
Total ¥ 3,763 ¥ 16,566 ¥ 2,199 ¥ 14,209Thousands of U.S. dollars
2019Contract/Notional principal
TotalMaturity
over 1 year Fair valueUnrealizedgain (loss)
Currency swaps (over-the-counter) $ 3,487,199 $ 3,024,559 $ 9,036 $ 9,036Forward foreign exchange contracts(over-the-counter):
Sold 9,550,258 408,341 37,943 37,943Bought 6,537,609 508,611 13,756 13,756
Currency options (over-the-counter):Sold 7,995,180 4,076,293 (174,873) 127,184Bought 7,273,313 3,365,762 148,122 (38,324)
Total $ 33,985 $ 149,595
Notes:
(1) Derivatives included in the table above were measured at fair value and the unrealized gains and losses were recognized in the consolidated statement of income.
(2) The fair values are calculated primarily by using the DCF method or option pricing models.
106
DERIVATIVE FINANCIAL INSTRUMENTS
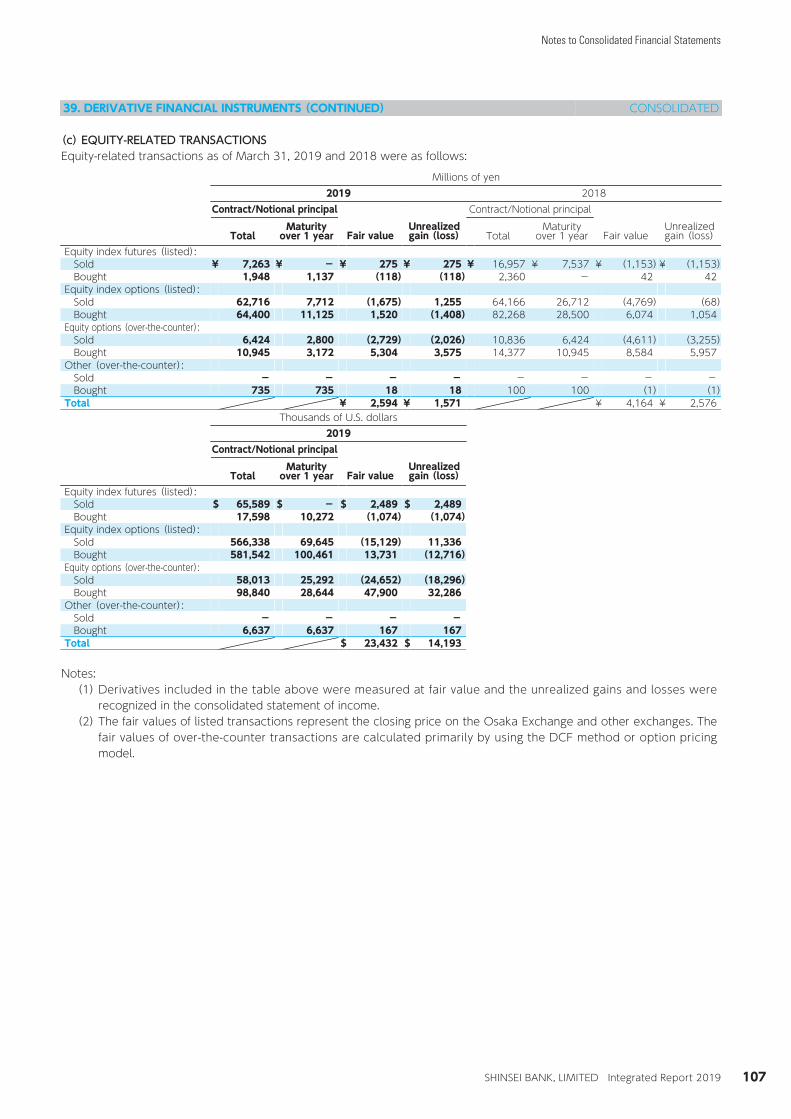
Notes to Consolidated Financial Statements
SHINSEI BANK, LIMITED Integrated Report 2019
2019/07/10 8:13:49 / 19509946_株式会社新生銀行_総会その他(C)
39. DERIVATIVE FINANCIAL INSTRUMENTS (CONTINUED) CONSOLIDATED
(c) EQUITY-RELATED TRANSACTIONSEquity-related transactions as of March 31, 2019 and 2018 were as follows:
Millions of yen2019 2018
Contract/Notional principal Contract/Notional principal
TotalMaturity
over 1 year Fair valueUnrealizedgain (loss) Total
Maturityover 1 year Fair value
Unrealizedgain (loss)
Equity index futures (listed):Sold ¥ 7,263 ¥ - ¥ 275 ¥ 275 ¥ 16,957 ¥ 7,537 ¥ (1,153)¥ (1,153)Bought 1,948 1,137 (118) (118) 2,360 - 42 42
Equity index options (listed):Sold 62,716 7,712 (1,675) 1,255 64,166 26,712 (4,769) (68)Bought 64,400 11,125 1,520 (1,408) 82,268 28,500 6,074 1,054
Equity options (over-the-counter):Sold 6,424 2,800 (2,729) (2,026) 10,836 6,424 (4,611) (3,255)Bought 10,945 3,172 5,304 3,575 14,377 10,945 8,584 5,957
Other (over-the-counter):Sold - - - - - - - -Bought 735 735 18 18 100 100 (1) (1)
Total ¥ 2,594 ¥ 1,571 ¥ 4,164 ¥ 2,576Thousands of U.S. dollars
2019Contract/Notional principal
TotalMaturity
over 1 year Fair valueUnrealizedgain (loss)
Equity index futures (listed):Sold $ 65,589 $ - $ 2,489 $ 2,489Bought 17,598 10,272 (1,074) (1,074)
Equity index options (listed):Sold 566,338 69,645 (15,129) 11,336Bought 581,542 100,461 13,731 (12,716)
Equity options (over-the-counter):Sold 58,013 25,292 (24,652) (18,296)Bought 98,840 28,644 47,900 32,286
Other (over-the-counter):Sold - - - -Bought 6,637 6,637 167 167
Total $ 23,432 $ 14,193
Notes:
(1) Derivatives included in the table above were measured at fair value and the unrealized gains and losses were recognized in the consolidated statement of income.
(2) The fair values of listed transactions represent the closing price on the Osaka Exchange and other exchanges. The fair values of over-the-counter transactions are calculated primarily by using the DCF method or option pricing model.
107
DERIVATIVE FINANCIAL INSTRUMENTS

Notes to Consolidated Financial Statements
SHINSEI BANK, LIMITED Integrated Report 2019
2019/07/10 8:13:49 / 19509946_株式会社新生銀行_総会その他(C)
39. DERIVATIVE FINANCIAL INSTRUMENTS (CONTINUED) CONSOLIDATED
(d) BOND-RELATED TRANSACTIONSBond-related transactions as of March 31, 2019 and 2018 were as follows:
Millions of yen2019 2018
Contract/Notional principal Contract/Notional principal
TotalMaturity
over 1 year Fair valueUnrealizedgain (loss) Total
Maturityover 1 year Fair value
Unrealizedgain (loss)
Bond futures (listed):Sold ¥ 21,840 ¥ - ¥ (55)¥ (55)¥ 26,031 ¥ - ¥ (95)¥ (95)Bought 27,095 - 318 318 19,728 - 73 73
Bond options (listed):Sold - - - - - - - -Bought - - - - 13,545 - 9 (9)
Total ¥ 263 ¥ 263 ¥ (12)¥ (31)Thousands of U.S. dollars
2019Contract/Notional principal
TotalMaturity
over 1 year Fair valueUnrealizedgain (loss)
Bond futures (listed):Sold $ 197,224 $ - $ (501) $ (501)Bought 244,673 - 2,877 2,877
Bond options (listed):Sold - - - -Bought - - - -
Total $ 2,376 $ 2,376
Notes:
(1) Derivatives included in the table above were measured at fair value and the unrealized gains and losses were recognized in the consolidated statement of income.
(2) The fair values of listed transactions represent the closing price on the Osaka Exchange and other exchanges. The fair values of over-the-counter transactions are calculated primarily by using the option pricing model.
(e) CREDIT DERIVATIVES TRANSACTIONSCredit derivatives transactions as of March 31, 2019 and 2018 were as follows:
Millions of yen2019 2018
Contract/Notional principal Contract/Notional principal
TotalMaturity
over 1 year Fair valueUnrealizedgain (loss) Total
Maturityover 1 year Fair value
Unrealizedgain (loss)
Credit default option (over-the-counter):Sold ¥ 46,000 ¥ 27,000 ¥ 622 ¥ 622 ¥ 82,550 ¥ 44,000 ¥ 965 ¥ 965Bought 46,000 27,000 (380) (380) 82,000 43,000 (654) (654)
Total ¥ 241 ¥ 241 ¥ 310 ¥ 310Thousands of U.S. dollars
2019Contract/Notional principal
TotalMaturity
over 1 year Fair valueUnrealizedgain (loss)
Credit default option (over-the-counter):Sold $ 415,387 $ 243,814 $ 5,619 $ 5,619Bought 415,387 243,814 (3,437) (3,437)
Total $ 2,182 $ 2,182
Notes:
(1) Derivatives included in the table above were measured at fair value and the unrealized gains and losses were recognized in the consolidated statement of income.
(2) The fair values are calculated primarily by using the DCF method.(3) “Sold” stands for accepting credit risk and “Bought” stands for transferring credit risk.
108
DERIVATIVE FINANCIAL INSTRUMENTS

Notes to Consolidated Financial Statements
SHINSEI BANK, LIMITED Integrated Report 2019
2019/07/10 8:13:49 / 19509946_株式会社新生銀行_総会その他(C)
39. DERIVATIVE FINANCIAL INSTRUMENTS (CONTINUED) CONSOLIDATED
(B) DERIVATIVE TRANSACTIONS TO WHICH HEDGE ACCOUNTING WAS APPLIED
(a) INTEREST RATE-RELATED TRANSACTIONSInterest rate-related transactions which are accounted for using the deferral method as of March 31, 2019 and 2018 were as follows:
Millions of yen2019 2018
Contract/Notional principal Contract/Notional principal
TotalMaturity
over 1 year Fair value TotalMaturity
over 1 year Fair valueInterest rate swaps:
Receive fixed and pay floating ¥ 106,000 ¥ 84,000 ¥ 2,473 ¥ 406,000 ¥ 88,000 ¥ 2,238Receive floating and pay fixed 183,408 161,408 (16,168) 243,319 181,743 (14,050)
Total ¥ (13,695) ¥ (11,812)Thousands of U.S. dollars
2019Contract/Notional principal
TotalMaturity
over 1 year Fair valueInterest rate swaps:
Receive fixed and pay floating $ 957,197 $ 758,534 $ 22,332Receive floating and pay fixed 1,656,208 1,457,544 (146,007)
Total $ (123,675)
Notes:
(1) Most of the hedged items are interest-bearing assets and liabilities such as loans and bills discounted, available-for-sale securities (bonds) and deposits, including negotiable certificate of deposit.
(2) Interest rate swaps are primarily accounted for using the deferral method in accordance with Industry Audit Committee Report No. 24 of the JICPA.
(3) The fair values are calculated primarily by using the DCF method.
109
DERIVATIVE FINANCIAL INSTRUMENTS
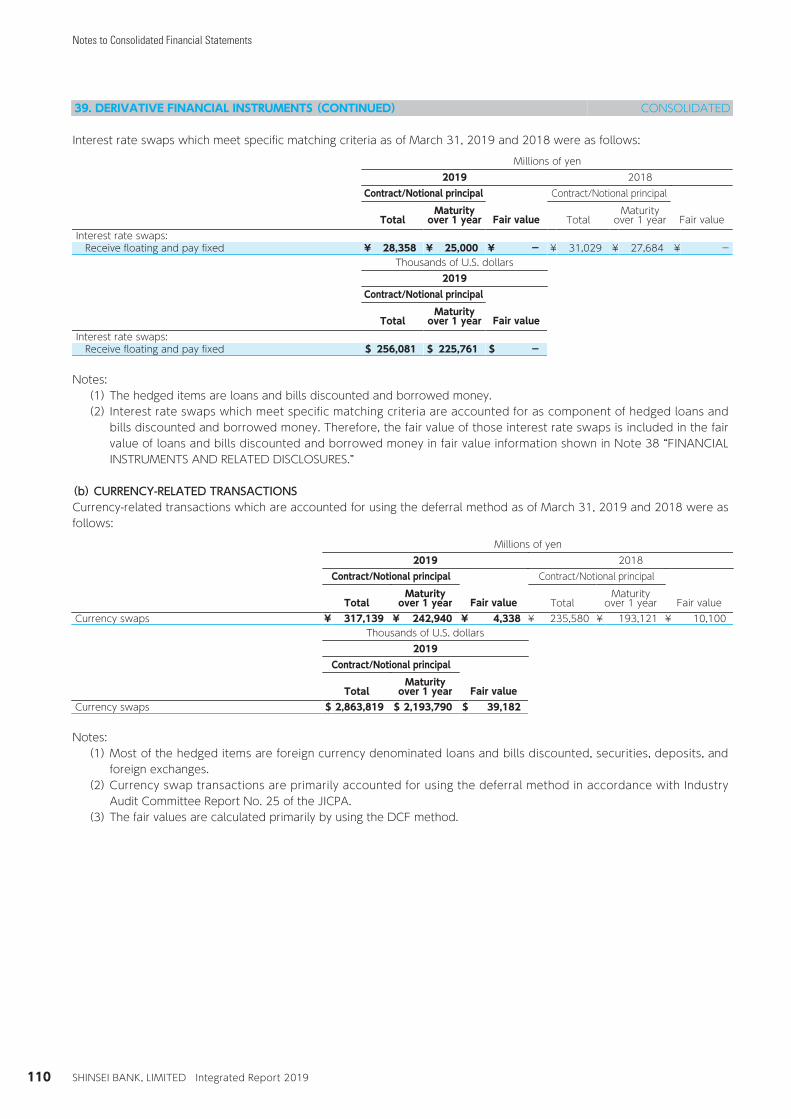
Notes to Consolidated Financial Statements
SHINSEI BANK, LIMITED Integrated Report 2019
2019/07/10 8:13:49 / 19509946_株式会社新生銀行_総会その他(C)
39. DERIVATIVE FINANCIAL INSTRUMENTS (CONTINUED) CONSOLIDATED
Interest rate swaps which meet specific matching criteria as of March 31, 2019 and 2018 were as follows:
Millions of yen2019 2018
Contract/Notional principal Contract/Notional principal
TotalMaturity
over 1 year Fair value TotalMaturity
over 1 year Fair valueInterest rate swaps:
Receive floating and pay fixed ¥ 28,358 ¥ 25,000 ¥ - ¥ 31,029 ¥ 27,684 ¥ -Thousands of U.S. dollars
2019Contract/Notional principal
TotalMaturity
over 1 year Fair valueInterest rate swaps:
Receive floating and pay fixed $ 256,081 $ 225,761 $ -
Notes:(1) The hedged items are loans and bills discounted and borrowed money.
(2) Interest rate swaps which meet specific matching criteria are accounted for as component of hedged loans and bills discounted and borrowed money. Therefore, the fair value of those interest rate swaps is included in the fair value of loans and bills discounted and borrowed money in fair value information shown in Note 38 “FINANCIAL INSTRUMENTS AND RELATED DISCLOSURES.”
(b) CURRENCY-RELATED TRANSACTIONSCurrency-related transactions which are accounted for using the deferral method as of March 31, 2019 and 2018 were as follows:
Millions of yen2019 2018
Contract/Notional principal Contract/Notional principal
TotalMaturity
over 1 year Fair value TotalMaturity
over 1 year Fair valueCurrency swaps ¥ 317,139 ¥ 242,940 ¥ 4,338 ¥ 235,580 ¥ 193,121 ¥ 10,100
Thousands of U.S. dollars2019
Contract/Notional principal
TotalMaturity
over 1 year Fair valueCurrency swaps $ 2,863,819 $ 2,193,790 $ 39,182
Notes:
(1) Most of the hedged items are foreign currency denominated loans and bills discounted, securities, deposits, and foreign exchanges.
(2) Currency swap transactions are primarily accounted for using the deferral method in accordance with Industry Audit Committee Report No. 25 of the JICPA.
(3) The fair values are calculated primarily by using the DCF method.
110
DERIVATIVE FINANCIAL INSTRUMENTS

Notes to Consolidated Financial Statements
SHINSEI BANK, LIMITED Integrated Report 2019
2019/07/10 8:13:49 / 19509946_株式会社新生銀行_総会その他(C)
40. SUBSEQUENT EVENTS CONSOLIDATED
(A) DIVIDENDSThe following appropriation of retained earnings of the Bank for the fiscal year ended March 31, 2019 was approved at the meeting of the Board of Directors held on May 15, 2019:
Millions of yenThousands ofU.S. dollars
Year-end cash dividends, common stock, ¥10.00 (U.S.$0.1) per share ¥ 2,452 $ 22,149
(B) ACQUISITION OF SHARES OF SHINKO LEASE CO., LTD.On April 23, 2019, Showa Leasing Co., Ltd., a subsidiary of the Bank, concluded the share purchase agreement with Mitsubishi UFJ Lease & Finance Company Limited, the current parent company of SHINKO LEASE CO., LTD. Showa Leasing Co., Ltd. will purchase the shares of SHINKO LEASE CO., LTD. on July 1, 2019 as the settlement date.
(a) Outline of the business combination(i) Name and business description of the acquired company Name: SHINKO LEASE CO., LTD. Business description: General leasing business(ii) Purpose of the acquisition For revenue growth of the Group.(iii) Date on which the business combination was effected July 1, 2019 (Planned)(iv) Legal form of the business combination Acquisition of shares with cash consideration(v) Company name after the business combination A change of the company name is not planned.(vi) Percentage of voting rights acquired 80%(vii) Basis for determination of the acquiring company Showa Leasing Co., Ltd., will acquire the shares by cash.
(b) Acquisition costs of the shares and their breakdown Not disclosed by agreement between the related parties
(c) Major acquisition-related costs and their breakdown Not determined
(d) Amount, reason of the occurrence, and amortization method and period, of goodwill Not determined
(e) Amounts and breakdown of assets and liabilities on the date of the business combination These amounts are in the process of being calculated.
(C) ACQUISITION OF TREASURY SHARESOn May 15, 2019, the Bank decided to acquire its own treasury shares in accordance with the provision of its Articles of Incorporation, pursuant to Article 459, paragraph 1 of the Companies Act of Japan.
(a) Reason for acquisition As a part of the Bank’s efforts to achieve the repayment of public funds, a resolution to undertake the acquisition of treasury shares has been approved in light of factors such as the Bank’s current capital position, earnings capability and per share values. Through this acquisition of treasury shares, assuming the maintenance of capital at sufficient levels, the Bank aims to increase the per share values through the implementation of an appropriate capital policy.
111
SUBSEQUENT EVENTS

Notes to Consolidated Financial Statements
SHINSEI BANK, LIMITED Integrated Report 2019
2019/07/10 8:13:49 / 19509946_株式会社新生銀行_総会その他(C)
40. SUBSEQUENT EVENTS (CONTINUED) CONSOLIDATED
(b) Details of acquisition (i) Type of shares to be repurchased
Common stock (ii) Total Number of shares to be repurchased
(Up to) 23,500 thousand shares (9.58% of total number of common shares issued excluding treasury shares) (iii) Total repurchase amount
(Up to) ¥23,500 million (U.S.$212,209 thousand) (iv) Acquisition period
From May 16, 2019 to March 31, 2020
In accordance with the aforementioned resolution by the Board of Directors, the Bank has undertaken the acquisition of treasury shares as follows: (i) Type of shares repurchased
Common stock (ii) Total Number of shares repurchased
848,000 shares (iii) Total amount of repurchase
¥1,321,725,400 (U.S.$11,935 thousand) (iv) Acquisition period
From May 16, 2019 to May 31, 2019 (v) Acquisition method
Open market purchase on the Tokyo Stock Exchange
112
SUBSEQUENT EVENTS

SHINSEI BANK, LIMITED Integrated Report 2019
2019/07/10 8:13:49 / 19509946_株式会社新生銀行_総会その他(C)
INDEPENDENT AUDITORS' REPORT
113
INDEPENDENT AUDITORS’ REPORT

SHINSEI BANK, LIMITED Integrated Report 2019
2019/07/10 8:13:49 / 19509946_株式会社新生銀行_総会その他(C)
NONCONSOLIDATED BALANCESHEET (UNAUDITED)Shinsei Bank, LimitedAs of March 31, 2019
Millions of yenThousands of
U.S. dollars (Note)
2019 2018 2019ASSETSCash and due from banks ¥ 1,280,991 ¥ 1,391,303 $ 11,567,556Other monetary claims purchased 10,809 115,458 97,609Trading assets 200,276 199,866 1,808,525Monetary assets held in trust 198,717 117,756 1,794,449Securities 1,445,927 1,452,342 13,056,956Loans and bills discounted 4,932,610 4,637,953 44,542,265Foreign exchanges 29,546 32,511 266,813Other assets 190,104 223,082 1,716,677Premises and equipment 12,610 14,031 113,879Intangible assets 26,483 23,139 239,153Prepaid pension cost 6,849 6,362 61,854Deferred tax assets 1,127 573 10,182Customers' liabilities for acceptances and guarantees 18,060 19,810 163,090Reserve for credit losses (25,519) (26,721) (230,447)
Total assets ¥ 8,328,595 ¥ 8,207,471 $ 75,208,560
LIABILITIES AND EQUITYLiabilities:Deposits, including negotiable certificates of deposit ¥ 6,206,867 ¥ 6,228,183 $ 56,049,009Debentures - 423 -Call money 145,000 - 1,309,373Payables under repurchase agreements 59,098 55,919 533,671Payables under securities lending transactions 510,229 433,462 4,607,458Trading liabilities 179,749 181,337 1,623,163Borrowed money 195,628 263,114 1,766,557Foreign exchanges 471 102 4,256Corporate bonds 42,335 45,000 382,292Other liabilities 113,903 140,685 1,028,571Accrued employees' bonuses 4,847 4,740 43,772Reserve for reimbursement of debentures 3,764 4,130 33,991Acceptances and guarantees 18,060 19,810 163,090
Total liabilities 7,479,955 7,376,910 67,545,202Equity:Common stock 512,204 512,204 4,625,290Capital surplus 79,465 79,465 717,590Stock acquisition rights 49 270 447Retained earnings:
Legal reserve 15,243 14,738 137,654Unappropriated retained earnings 292,611 324,912 2,642,326
Unrealized gain (loss) on available-for-sale securities 4,719 4,268 42,618Deferred gain (loss) on derivatives under hedge accounting (17,925) (15,759) (161,868)Treasury stock, at cost (37,729) (89,540) (340,699)
Total equity 848,640 830,560 7,663,358Total liabilities and equity ¥ 8,328,595 ¥ 8,207,471 $ 75,208,560
Note: U.S. dollar amounts, presented solely for the readers' convenience, are translated at ¥110.74=U.S.$1.00, the rate of exchange prevailing on the Tokyo foreign exchange market on March 31, 2019.
114
NONCONSOLIDATED BALANCE SHEET (UNAUDITED)

SHINSEI BANK, LIMITED Integrated Report 2019
2019/07/10 8:13:49 / 19509946_株式会社新生銀行_総会その他(C)
NONCONSOLIDATEDSTATEMENT OF INCOME(UNAUDITED)Shinsei Bank, LimitedFor the fiscal year ended March 31, 2019
Millions of yenThousands of
U.S. dollars (Note)
2019 2018 2019Interest income:
Interest on loans and bills discounted ¥ 101,293 ¥ 94,304 $ 914,696Interest and dividends on securities 21,413 25,441 193,369Interest on deposits with banks 1,113 1,036 10,053Other interest income 644 1,051 5,819
Total interest income 124,464 121,833 1,123,937Interest expenses:
Interest on deposits, including negotiable certificates of deposit 7,807 9,025 70,499Interest and discounts on debentures 0 3 1Interest on other borrowings 589 547 5,326Interest on corporate bonds 313 761 2,834Other interest expenses 9,291 6,146 83,906
Total interest expenses 18,002 16,483 162,566Net interest income 106,462 105,350 961,371
Fees and commissions income 19,484 17,227 175,948Fees and commissions expenses 29,660 29,698 267,839
Net fees and commissions (10,176) (12,470) (91,892)Net trading income 4,194 4,575 37,875
Other business income (loss), net:Net gain (loss) on monetary assets held in trust 1,464 2,026 13,222Net gain (loss) on foreign exchanges 5,741 8,213 51,844Net gain (loss) on securities 1,256 6,362 11,350Net gain (loss) on other monetary claims purchased 344 291 3,112Other, net 43 588 388
Net other business income (loss) 8,850 17,483 79,918Total revenue 109,330 114,938 987,272
General and administrative expenses:Personnel expenses 27,755 27,824 250,636Premises expenses 12,023 12,738 108,574Technology and data processing expenses 11,556 11,008 104,360Advertising expenses 882 7,202 7,968Consumption and property taxes 5,821 5,629 52,567Deposit insurance premium 1,645 1,775 14,862Other general and administrative expenses 12,813 13,273 115,705
Total general and administrative expenses 72,498 79,453 654,672Net business profit 36,832 35,485 332,600
Net credit costs (recoveries) (730) 1,295 (6,593)Other gains (losses), net (1,530) 6,798 (13,817)
Income (loss) before income taxes 36,032 40,989 325,376Income taxes (benefit):
Current 1,679 (2,656) 15,169Deferred (1,091) 3,136 (9,856)
Net income (loss) ¥ 35,443 ¥ 40,510 $ 320,062
Yen U.S. dollars (Note)Basic earnings per share ¥ 143.10 ¥ 156.80 $ 1.29Diluted earnings per share ¥ 143.09 ¥ 156.78 $ 1.29
Note: U.S. dollar amounts, presented solely for the readers’ convenience, are translated at ¥110.74=U.S.$1.00, the rate of exchange prevailing on the Tokyo foreign exchange market on March 31, 2019.Shinsei Bank executed a 1-for-10 reverse stock split on October 1, 2017. The above earnings per share data is calculated as if the reverse stock split had been implemented at the beginning of the fiscal year ended March 31, 2018.
115
NONCONSOLIDATED STATEMENT OF INCOME (UNAUDITED)
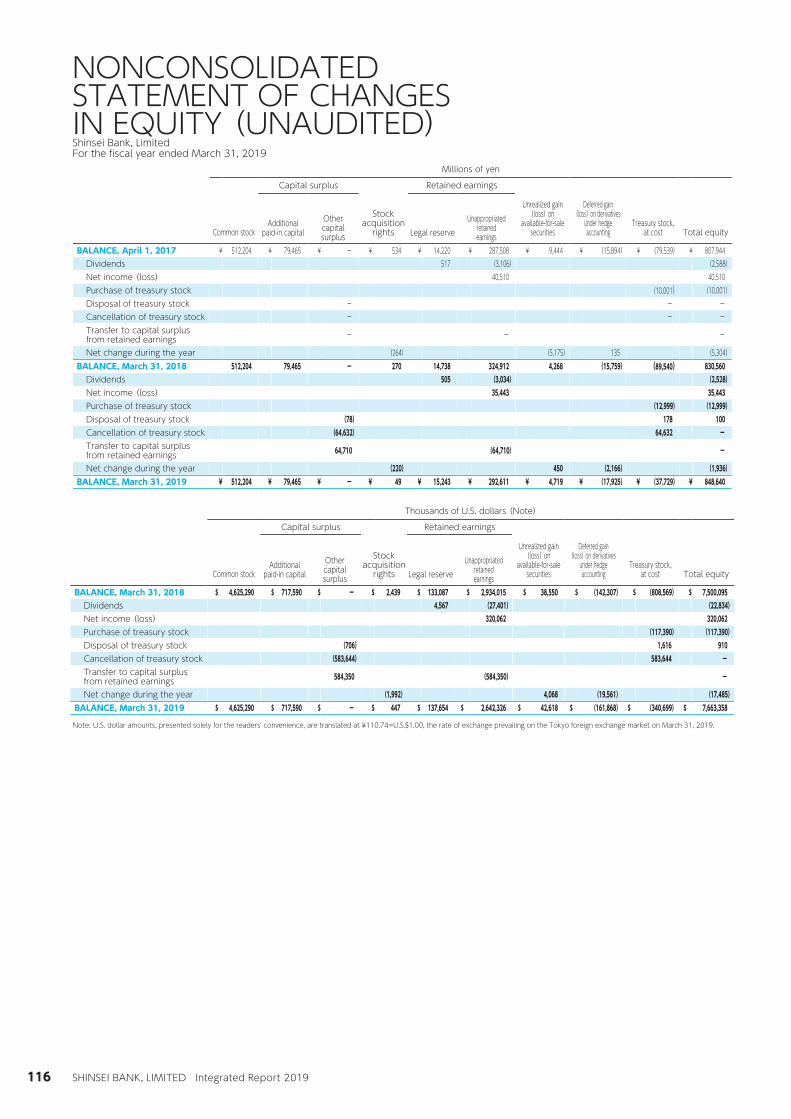
SHINSEI BANK, LIMITED Integrated Report 2019
2019/07/10 8:13:49 / 19509946_株式会社新生銀行_総会その他(C)
NONCONSOLIDATEDSTATEMENT OF CHANGESIN EQUITY (UNAUDITED)Shinsei Bank, LimitedFor the fiscal year ended March 31, 2019
Millions of yen
Capital surplus Retained earnings
Common stockAdditional
paid-in capitalOthercapitalsurplus
Stockacquisition
rights Legal reserveUnappropriated
retainedearnings
Unrealized gain(loss) on
available-for-salesecurities
Deferred gain(loss) on derivatives
under hedgeaccounting
Treasury stock,at cost Total equity
BALANCE, April 1, 2017 ¥ 512,204 ¥ 79,465 ¥ - ¥ 534 ¥ 14,220 ¥ 287,508 ¥ 9,444 ¥ (15,894) ¥ (79,539) ¥ 807,944Dividends 517 (3,106) (2,588)Net income (loss) 40,510 40,510Purchase of treasury stock (10,001) (10,001)Disposal of treasury stock - - -Cancellation of treasury stock - - -Transfer to capital surplusfrom retained earnings - - -Net change during the year (264) (5,175) 135 (5,304)
BALANCE, March 31, 2018 512,204 79,465 - 270 14,738 324,912 4,268 (15,759) (89,540) 830,560Dividends 505 (3,034) (2,528)Net income (loss) 35,443 35,443Purchase of treasury stock (12,999) (12,999)Disposal of treasury stock (78) 178 100Cancellation of treasury stock (64,632) 64,632 -Transfer to capital surplusfrom retained earnings 64,710 (64,710) -Net change during the year (220) 450 (2,166) (1,936)
BALANCE, March 31, 2019 ¥ 512,204 ¥ 79,465 ¥ - ¥ 49 ¥ 15,243 ¥ 292,611 ¥ 4,719 ¥ (17,925) ¥ (37,729) ¥ 848,640
Thousands of U.S. dollars (Note)
Capital surplus Retained earnings
Common stockAdditional
paid-in capitalOthercapitalsurplus
Stockacquisition
rights Legal reserveUnappropriated
retainedearnings
Unrealized gain(loss) on
available-for-salesecurities
Deferred gain(loss) on derivatives
under hedgeaccounting
Treasury stock,at cost Total equity
BALANCE, March 31, 2018 $ 4,625,290 $ 717,590 $ - $ 2,439 $ 133,087 $ 2,934,015 $ 38,550 $ (142,307) $ (808,569) $ 7,500,095Dividends 4,567 (27,401) (22,834)Net income (loss) 320,062 320,062Purchase of treasury stock (117,390) (117,390)Disposal of treasury stock (706) 1,616 910Cancellation of treasury stock (583,644) 583,644 -Transfer to capital surplusfrom retained earnings 584,350 (584,350) -Net change during the year (1,992) 4,068 (19,561) (17,485)
BALANCE, March 31, 2019 $ 4,625,290 $ 717,590 $ - $ 447 $ 137,654 $ 2,642,326 $ 42,618 $ (161,868) $ (340,699) $ 7,663,358
Note: U.S. dollar amounts, presented solely for the readers' convenience, are translated at ¥110.74=U.S.$1.00, the rate of exchange prevailing on the Tokyo foreign exchange market on March 31, 2019.
116
NONCONSOLIDATED STATEMENT OF CHANGES IN EQUITY (UNAUDITED)

Capital Adequacy Requirement (Basel Accord) Pillar III (Market Discipline) Disclosure
SHINSEI BANK, LIMITED Integrated Report 2019
2019/07/10 8:14:49 / 19509947_株式会社新生銀行_総会その他(C)
CAPITAL ADEQUACY REQUIREMENT(BASEL ACCORD) PILLAR III(MARKET DISCIPLINE) DISCLOSUREThis chapter describes information that needs to be disclosed in disclosure documents related to the reported business year pursuant to the Financial Services Agency Notice No. 7 of 2014 (Basel Accord - Pillar III: Market Discipline) as the “matters concerning the status of capital adequacy separately prescribed by the Commissioner of the Financial Services Agency” as provided in Article 19-2 (1)(v)(d) of the Ordinance for Enforcement of the Banking Act (Ministry of Finance Ordinance No. 10 of 1982). “Accord” in this chapter refers to the Financial Services Agency Notice No. 19 of 2006 (Basel Accord - Pillar I: Minimum Capital Ratio).QUALITATIVE DISCLOSURE
1. RANGE OF CONSOLIDATION
(1) D IFFERENCES BETWEEN COMPANIES WHICH B E L O N G T O T H E G R O U P O F C O M P A N I E S (C O N S O L I D A T E D G R O U P ) S U B J E C T E D T O CALCULATION OF THE CONSOLIDATED CAPITAL RATIOS BASED ON THE ACCORD'S ARTICLE 26 AND C O M P A N I E S I N C L U D E D I N T H E S C O P E O F ACCOUNTING CONSOLIDATION AND REASONS FOR DIFFERENCES
• There are no differences.
(2) NUMBER OF CONSOLIDATED SUBSIDIARIES AND NAMES AND BUSINESS OF MAJOR CONSOLIDATED SUBSIDIARIES
i) Number of consolidated subsidiaries83 consolidated subsidiaries.
ii) Major consolidated subsidiaries• Shinsei Trust & Banking Co., Ltd. (trust banking)• Shinsei Securities Co., Ltd. (securities)• APLUS FINANCIAL Co., Ltd. (installment credit)• Showa Leasing Co., Ltd. (leasing)• Shinsei Personal Loan Co., Ltd. (consumer finance)• SHINSEI FINANCIAL Co., Ltd. (consumer finance)• Shinsei Investment & Finance Limited (financial instruments business)
(3) NUMBER AND NAMES OF FINANCIAL AFFILIATES UNDER ARTICLE 32 OF THE ACCORD AND TOTAL ASSETS AND NET ASSETS AMOUNTS ON BALANCE SHEET AND MAJOR BUSINESS OF THOSE FINANCIAL AFFILIATES
• There are no financial affiliate companies.
(4) NAMES OF COMPANIES WHICH BELONG TO THE CONSOLIDATED GROUP BUT ARE NOT INCLUDED IN THE SCOPE OF ACCOUNTING CONSOLIDATION OR COMPANIES WHICH DO NOT BELONG TO THE CONSOLIDATED GROUP BUT ARE INCLUDED IN THE SCOPE OF ACCOUNTING CONSOLIDATION, AND TOTAL ASSETS AND NET ASSETS AMOUNTS ON BALANCE SHEET AND MAJOR BUSINESS OF THOSE COMPANIES
• There are no companies that are subject to the above.
(5) SUMMARY OF RESTRICTIONS ON TRANSFER OF CASH AND CAPITAL IN THE CONSOLIDATED GROUP
• There are no particular restrictions.
2. TYPES OF CAPITAL INSTRUMENTS
The Bank has raised capital through the issuance of common shares. During the fiscal year 2018, all perpetual subordinated loans and dated subordinated bonds and loans issued before March 31, 2014, which had been included in “Core capital: instruments and reserves” under transitional arrangements, have been repaid or redeemed prior to their maturities.
3. ENHANCEMENT OF GROUP GOVERNANCE SYSTEMS
The Group Integrated Risk Management Division, the Group Portfolio Risk Management Division and the Group Individual Banking Risk Management Division were established in order to integrate and centralize the risk management functions of the Bank and the Group member companies along with the establishment of the Group Headquarters. The group will advance the system to improve the overall productivity by centralization of risk management tasks of the Group member companies.
4. ASSESSMENT OF CAPITAL ADEQUACY OFTHE BANK GROUP
As part of its comprehensive risk management, Risk Capital is under the budget control on a consolidated basis. In concrete terms, the Bank determines a Risk Capital budget in consideration of its source of capital. The amount of Risk Capital compared to its source of capital and its budget is monitored on a monthly basis, and senior management, e. g. the Group Executive Committee of each month, receives a report on a regular basis. Additionally, in regards to regulatory capital, capital ratio is reported at the above mentioned reporting to the Group Executive Committee, allowing senior management to monitor and assess the overall availability of capital. At least once a year, the Bank performs stress tests on its estimates of Risk Capital and regulatory capital.
5. CREDIT RISK MANAGEMENT POLICIES ANDPROCEDURES
CREDIT RISK MANAGEMENT SYSTEMCredit r isk is def ined as the r isk of loss due to a counterpart defaulting on contractual debt obligations. Our model for credit risk management focuses on securing adequate return on risk, avoiding excessive concentration in particular sectors or to particular obligors, and managing the risk with an awareness of maximum loss amount from credit portfolio. To achieve these goals, the Bank defines the policy to gain or restrict risk regarding customer attributes, products, markets, the type of industry and the form of transaction, etc. in the “Credit Risk Policy,” and clarifies basic policies of credit operations and specific guidelines for credit risk management in this “Credit Risk Policy,” “Credit Procedures” and other procedures. And Risk Integrated Section of the Group Headquarters which is organizationally independent from credit business line, designs the system of managing risk objectively. The credit risk management processes are roughly classified into credit risk management for individual transactions and portfolio-based credit risk management, as follows.
117
本文

Capital Adequacy Requirement (Basel Accord) Pillar III (Market Discipline) Disclosure
SHINSEI BANK, LIMITED Integrated Report 2019
2019/07/10 8:14:49 / 19509947_株式会社新生銀行_総会その他(C)
QUALITATIVE DISCLOSURE (CONTINUED)
CREDIT RISK MANAGEMENT FORINDIVIDUAL TRANSACTIONS(1) Organization and SystemsIn principle, a credit provision is consulted jointly by the sales promotion divisions and the credit risk management divisions that are independent from the sales promotion divisions and have veto rights. Thus the transparent and strict decision making processes are secured and the framework to put a brake on the sales promotion division has been established. Each transaction is discussed and approved by the Transaction Committee, etc. The level of approval authority over the obl igor whose group companies should be taken into consideration is decided based mainly on the total exposure to the obligor group and ratings, and the decision is made strictly. Among receivables that must be paid attention, for those that falls under a certain category decided by rating, the exposure, reserve, etc. , the obligor's business performance are monitored by the Doubtful Debt Committee so that the Bank is able to take preventive measures, and by deciding the measures to handle the obligor in future, the Bank is making efforts to minimize credit-related costs and to ensure soundness of assets.
(2) Obligor Rating SystemFor corporate exposures, the Bank uses an internal obligor rating system with the following characteristics:
• Increasing model accuracy and reflecting appropriate qualitative factors
• Benchmarked against external ratings• Ensuring conformity with rating systems among industry
classifications
More specifically, obligor ratings are determined by applying adjustments with qualitative factors to the model ratings calculated by our estimation models, which are based on external ratings etc. Obligor ratings shall be determined by credit risk management divisions, and reviewed regularly and continuously. Obligor ratings are used in the standards of credit approval authority procedures and portfolio controls, and are the foundation for credit risk management. Furthermore, the Bank also applies a facility rating system based on expected losses that al lows for improvement in the credit status, such as collateral and/or covenants, from the perspective of obligor ratings and the credit status of individual transactions. An obligor rating system and facility rating system similar to those adopted in the Bank have been implemented for large amount leasing receivables of Showa Leasing.
(3) Pool ClassificationThe Bank assigns retail exposures to specific pools based on risk profi le such as obligor characteristics and transaction characteristics that create reasonably homogeneous sub-portfolios. Major retail exposures to which pool classification is applied are housing loans and unsecured personal loans of the Bank, installment sales credit receivables of APLUS, unsecured personal loans of Shinsei Financial, and small-lot leasing receivables of Showa Leasing.
PORTFOLIO-BASED CREDIT RISK MANAGEMENTIt is essential that credit risks are diversified in terms of industries as well as ratings. This is done on a portfolio basis, which is an aggregation of transactions, and operations of individual transactions must be conducted based on appropriate risk analyses. The bank monitors the segment-specific risk diversification status including industry classifications, ratings, products, and regions, and under takes ana lyses f rom the p roduct - spec i f i c perspectives based on each risk profile. Portfolio Risk Management Division uses this information to improve
portfolio management operations and provide reports to senior management on a monthly as well as on an ad hoc basis.
PRINCIPAL “CREDIT RISK MANAGEMENT STANDARDS”For Basel Regulation, the Foundation Internal Ratings-Based Approach (F-IRB) has been adopted by the Bank for calculat ion of credit r isk-weighted assets . In accordance with this approach, the Bank established “Credit Risk Management Standards,” a set of policy, standards/guideline and procedures, which define the Bank's internal rating system design and operations, in te rna l cont ro l , use o f in te rna l ra t ing and r i sk quantification. These Standards contain “Basic Principles of the Internal Rating System for Credit Risk” as the highest level policy to define basic framework of overall internal rating systems. Details of management policy and procedures are defined in the form of subordinate specific rules for each group of exposures in the portfolio. Summary of internal rating system of each group of exposures is shown in “EXHIBIT.”
INTERNAL CONTROL ROLES AND RESPONSIBILITIESThe Bank Group's internal control system for credit risk management has been set up in accordance with current regulations.
(1) Credit Risk Management DivisionsGroup Portfolio Risk Management Division undertake the roles and responsibilities for management of credit risk of the bank and is responsible for integrated management of credit risk across the bank group.
(2) Senior Management Control/OversightControl and oversight for internal rating systems by senior management is defined in “Credit Risk Management Standards,” and is performed in an appropriate manner.
(3) Audit SectionThe Internal Audit Divisions within the Bank and its subsidiaries evaluate the internal rating system employed by the Bank Group and ensures the system is in compliance with existing regulations.
APPLICATION OF THE INTERNAL RATING SYSTEMThe Bank uses its own internal rating systems for portfolios to which the F-IRB Approach are applied. These items are listed in the “Exhibit” for each portfolio. The internal rating system is applied to corporate and retail exposures as categorized below. The rules for applying the internal rating system are part of the Bank's overall “Credit Risk Management Standards.”
(1) Corporate ExposureCorporate exposure, financial institution exposure, and sovereign exposure are included. Basic standards and related detailed rules for design and operations of internal rating system, which are benchmarked against R&I rating and categorized as 0A, and 1A-9E, are applied. Corporate exposure includes Specialized Lending such as Non-Recourse Real Estate Loans, Project Finance, etc. using slotting criteria categorized as Strong, Good, Satisfactory, Weak, and Default . Speci f ic rat ing standards are established for each type of finance.
118
本文

Capital Adequacy Requirement (Basel Accord) Pillar III (Market Discipline) Disclosure
SHINSEI BANK, LIMITED Integrated Report 2019
2019/07/10 8:14:49 / 19509947_株式会社新生銀行_総会その他(C)
QUALITATIVE DISCLOSURE (CONTINUED)
(2) Retail ExposureRetail exposures are defined as:• Exposures subject to pool management• Claims against an individual (except for a claim for the
purpose of funding business operations), or claims against a corporation(including an individual with the purpose of funding a business) with an outstanding amount of less than ¥100 mi l l ion a f te r the “aggregat ion ” (nayose) on a consolidated basis. Features of these products and credit analysis s tandards may vary between the Bank and i t s subsidiaries. As such, specific pool classification systems for each product are appl ied at each ent i ty , in accordance with established guidelines.
ESTIMATION AND VALIDATION OF PARAMETERSThe approach for estimation and validation of parameters such as Probability of Default (PD), Loss Given Default (LGD), and Exposure at Default (EAD) is set forth in “Credit Risk Management Standards.” Ratings, pool classifications and estimated parameters are also used for internal control.
STRESS TESTSSpecific implementation guidelines are established for stress tests used in the assessment of capital adequacy, and credit risk stress tests to assess the effect of certain specific conditions on the Bank's regulatory capital requirements. Stress test results are reported to senior management at least once a year.
RESERVE POLICYA reserve for credit losses of the Bank and its subsidiaries i s p rov ided as deta i led be low, pursuant to the predetermined internal rules for providing such reserves according to the obligor categorizations based on the self assessment of their assets. A general reserve for claims against normal obligors, needcaution obligors and substandard obligors is provided based on the specific actual past loss experience. A specific reserve for claims to possibly bankrupt, virtually bankrupt and legally bankrupt obligors is provided based on the full amount of the unsecured, un-guaranteed port ion of the respect ive claims after a solvency assessment. For claims against obligors that are possibly bankrupt (that is, those that are not presently bankrupt but are likely to go bankrupt in the future), a specific reserve is provided for the amount considered to be necessary based on an overall solvency assessment performed for the amount of claims, net of amounts expected to be collected through the disposal of collateral or execution of guarantees. For claims against obligors that are legally bankrupt (due to bankruptcy and special liquidation) or virtually bankrupt, a specific reserve is provided based on the amount of claims, net of amounts expected to be collected through the disposal of collateral or execution of guarantees. The reserve for loans to restructuring countries is provided based on the amount of expected losses due to the political and economic situation in each country. Additionally, with regard to claims against possibly bankrupt obligors and substandard obligors, a reserve is provided based on the discounted cash flow method when the obligor's future cash flows for debt service are reasonably estimable and the balance of claims to such obligors is large.
TRANSITION PLAN FOR MOVING A PORTION OF THE BANK'S PORTFOLIO, WHICH HAS NOT YET APPLIED F-IRB, FROM THE STANDARDIZED APPROACH TO THE F-IRB APPROACHExpected IRB roll-out periods of assets currently evaluated using the Standardized Approach, and the F-IRB Approach will be applied at a future date to secure sufficient data observation periods are as follows:Not applicable.
In the case of portfolios to which the Standardized Approach is applied, the Bank will use ratings from the following qualified rating agencies to determine exposure risk weights: S&P, Moody's, Fitch, R&I and JCR.
6. CREDIT RISK MITIGATION POLICIES AND PROCEDURES
(1) Policies and framework for mitigating credit riskThe Bank mitigates credit exposure with collateral and guarantees to reduce the credit risk of obligors. The Bank has a clear framework regarding methods for mitigating credit risk. Basic procedures and descriptions of controls, as well as types of standard collateral, guarantees necessary in granting credit, evaluation methods for different types of credit and collateral, possible “haircuts” to collateral and regular revaluation of collateral, are stipulated in the Bank's credit procedures.
(2) Controls concerning overall methods to mitigate credit risk
The Bank uses net exposure for capital calculations after netting deposit and loan claims. All collateral and guarantees are registered in a dedicated system. The information is linked to obligor and credit account data. Collateral and guarantees are revalued at least once a year. Perfection of security interest, currency, date and correlation between collateral and counterparty are checked.
(3) Eligible financial asset collateralFinancial asset collateral types are defined by the Bank to include deposits, fixed income securities, equities and commercial paper.
(4) Eligible collateralized claimsCollateral types in this category include commercial bills, rights to claim return of security deposits, rights to claim return of construction funds, loan receivables, leasing and sales installment receivables and beneficial interests in trust.
(5) Eligible real estate collateralCollateral types in this category include land and buildings, plants and foundations including industrial foundations.
(6) Other asset-backed collateralEligible other asset-backed collateral is defined by the Bank as aircraft and ships.
(7) GuaranteesGuarantors are classified into the following categories: governments, central banks, municipalit ies, public institutions, credit guarantee associations, banks, general business entities and individuals.
119
本文

Capital Adequacy Requirement (Basel Accord) Pillar III (Market Discipline) Disclosure
SHINSEI BANK, LIMITED Integrated Report 2019
2019/07/10 8:14:49 / 19509947_株式会社新生銀行_総会その他(C)
QUALITATIVE DISCLOSURE (CONTINUED)
7. POLICIES AND PROCEDURES FOR COUNTERPARTIES OF DERIVATIVE PRODUCT AND TRANSACTIONS WITH LONG-HORIZON SETTLEMENT PERIODS
(1) COUNTERPARTY RISKCounterparty credit risk arising from market trading, such as derivatives, is controlled based on current fair value and estimation of future fair value volatility. Estimation of future fair value volatility covers various products including exotic derivatives, and considers risk mitigation effect by collateral as well as netting effect by the ISDA Credit Support Annex (CSA) etc. As the risk associated with market trade changes by market rate fluctuation after the trade, the Bank controls it based on estimation of future fair value volatility.
(2) ALLOCATION OF CREDIT LIMITSCounterparty limits due to derivatives transactions are established based on counterparty's specific situation, and credit limits are managed as appropriate on both a counterparty limit basis, and total credit limit basis where counterparty limit is added to any other credit exposure for each obligor in order to reflect the Bank's overall exposure.
(3) CREDIT ENHANCEMENT BASED ON COLLATERAL AND RESERVES
Credit enhancement measures are taken to mitigate the Bank's concerns regarding certain obligors' credit quality as well as concentration risk in the Bank's portfolio. The Bank follows the guidelines outlined in the ISDA CSA, which has been accepted by many f inancial institutions. Reserves are calculated based on expected losses according to the counterparty's credit quality, and are taken into consideration in the mark-to-market process.
(4) POSSIBILITY OF THE BANK POSTING ADDITIONAL COLLATERAL DUE TO A DECLINE IN THE BANK'S CREDIT QUALITY
I f the Bank's credit quality were to decline and be reflected as such in the assignment of lower external ratings, the Bank may be required to provide additional collateral to counterparties in transactions subject to the ISDA CSA.
8. EQUITY RISK MANAGEMENT
The Bank's equity investments are mainly composed of strategic merger/acquisition or business alliance related transactions, which are approved by the Group Executive Committee, and investment business related transactions, which are approved by the Transaction Committee (TC). The r isk management methodologies for these investments are determined based on their investment types and purposes. Each r isk is recognized and monitored appropriately by evaluating underlying assets/enterprise value. For securities that do not have fair market value, self assessment is conducted every quarter. Investments in subsidiaries and affiliates are carried at cost determined by the moving average method. Available-for-sale securities are carried at fair value at the balance sheet date (cost of securities sold is determined by the moving average method) in principle, with the exception of those whose fair value cannot be reliably determined, which are carried at cost determined by the moving average method.
9. SECURITIZATION EXPOSURE RISK MANAGEMENT POLICIES AND RISK CHARACTERISTICS
BANK RULESThe Bank manages securitization transactions as follows:
(1) OriginatorFor fundraising, mitigation of exposure concentration, transfer of credit risk and balance sheet management purposes, the Bank securitizes loans and the Bank's subsidiaries securitize financial assets such as credit card and consumer loan receivables. As an originator, the Bank manages the credit risk of its securitized transactions using the assumption that original assets are maintained on its books. Since the purpose of these transactions includes acquiring funds, mitigating exposure concentration, transferring credit risk and managing the Bank's balance sheet, securit ization transactions are a tool to control liquidity risk.
(2) InvestorIn order to invest in assets whose credit risks are different from those of existing corporate exposure and to enhance the profitearning opportunity, the Bank selectively invests in securitization transactions, including re-securitization as well as securitization defined as non-re-securitization as per Clause 2 a or b in Article 1 of Administrative Notice, which are backed by various financial products. The Bank also re-securitizes some securitized products of which the Bank has purchased and may hold the subordinated/residual portion.
As a general rule, Risk Management Section which is fully independent from Business Sections, manages the risks a r i s i ng f r om secu r i t i z a t i on exposu re , and r i s k management/monitor ing methodologies and r isk taking/reduction policies are specified according to the types of products. Although the Bank does not actively intend to increase securitization exposure at this moment, aforementioned procedure defined in “5. Credit Risk Management and Procedures, Credit Risk Management of Spec i f i c Transact ions” wi l l be fo l lowed for new investments after specifying and recognizing the risk profile, product specifics, nature of underlying assets and structure including credit enhancement, etc.
(3) ServicerThe Bank acts as a servicer when loans, which were originated by the Bank, are used as underlying assets in securitization. Similarly, when financial assets such as credit card and consumer loan receivables originated by the Bank's subs id iar ies are used as under ly ing assets for a securitization, the subsidiary serves as a servicer.
(4) Swap providerIn some transactions wherein the Bank is the arranger, the Bank provides swaps in order to mitigate interest rate risk within a specified range or to manage any cashflow difference between interest from underlying assets and coupons from the securities backed by the same assets.
Securitized exposure includes various risk characteristics that are unique to each product, as well as general risks, such as credit risk, market risk, and liquidity risk. The Bank does not act as a credit enhancement provider/liquidity provider in any transaction. The Bank does not conduct ABCP business as well.
120
本文

Capital Adequacy Requirement (Basel Accord) Pillar III (Market Discipline) Disclosure
SHINSEI BANK, LIMITED Integrated Report 2019
2019/07/10 8:14:49 / 19509947_株式会社新生銀行_総会その他(C)
QUALITATIVE DISCLOSURE (CONTINUED)
When the Bank acquires and monitors securit ized exposures, outside ratings and their changes are closely watched as one of the effective indicators. Moreover, when the Bank assigns internal ratings, risk characteristics and structural characteristics are understood and future performance forecast is analyzed, without depending solely on outside ratings. Investment decisions are made based on the results of such analysis and expected return. Even after an investment is made, various covenants and triggers are checked based on trustee reports and servicer reports. A cont inuous and regular monitor ing f ramework is established whereby information on comprehensive risk characteristics and performance of securitized exposures and underlying assets is captured in a timely manner. Risk capital is measured based on internal ratings assigned for each transaction. For investments in securities without a fair market value or its track record, risks are understood and controlled through self-assessments. In terms of the reporting, overall situation of the Bank's portfolio including the securitization exposure is reported to the senior management via the Group Risk Policy Committee etc on a monthly or a quarterly basis. The r epo r t i n c l udes i n f o rma t i on o f e xposu re , r i s k quantification, change in the portfolio, and risk profiles.
POLICIES USING SECURITIZATION TRANSACTIONS FOR CREDIT RISK MITIGATIONThe Bank is not using securitization transactions for credit risk mitigation.
CALCULATION METHODS FOR DETERMININGTHE AMOUNT OF CREDIT RISK IN THE CONTEXT OFSECURITIZATION EXPOSURERisk weights are calculated based on internal rules entitled “Standards for Administering Risk Weight Calculation for Securitization Exposure.” The amount of credit risk assets related to securitization exposures is calculated using the Internal Ratings-Based Approach (IRBA), the External Ratings-Based Approach (ERBA), or the Standardized Approach (SA). The risk assets of securitization exposures for which any methods mentioned above are not avai lable, are calculated in 1,250%.
CALCULATION METHODS FOR DETERMININGTHE AMOUNT OF MARKET RISK IN THE CONTEXTOF SECURITIZATION EXPOSUREThe amount of the general market risk of the market risk related to securitization exposures is calculated using the internal model approach. The amount of the specific risk of the market risk related to securitization exposures is calculated using the Internal Ratings-Based Approach (IRBA), the External Ratings-Based Approach (ERBA), or the Standardized Approach (SA).
TYPE OF SECURITIZATION-PURPOSE-CONDUITS FOR SECURITIZATION TRANSACTIONS OF THIRD PARTIES' ASSETS, AND WHETHER THE BANK HOLDS RELATED SECURITIZATION EXPOSUREThe Bank securitizes third parties' assets using “trust” as a part of its businesses. However, the Bank does not hold related securitization exposure.
NONCONSOLIDATED SUBUSIDIARIES ANDAFFILIATES WHO HOLD SECURITIZATION EXPOSURESRELATED TO THE BANK'S ORIGINATEDSECURITIZATION TRANSACTIONSNo securit ization exposures related to the Bank's originated securitization transactions are held by the Bank's nonconsolidated subsidiaries and affiliates.
ACCOUNTING POLICY ADOPTED FORSECURITIZATION TRANSACTIONS(1) When assets to be securitized are owned by the Bank, securitization assets are removed from the balance sheet and assignment of gains and losses are calculated based on the f inancial component (zaimu-kousei-youso) approach. The assets sold and retained interests are recognized as separate components of a transfer of financial assets. Those components in the transferred assets are measured by allocating the previous carrying amount between the assets sold and retained interests based on the relative fair values at the time of transfer. Based on the calculated values of assets that are sold, gains or losses on the transfer are recognized. However, when assets are securitized for fundraising purposes, the book value to be credited on the balance sheet is adjusted in order to prevent generating any initial profits, after removing the assets from the balance sheet using the financial component approach.
(2) When the Bank purchases securitized products, Accounting Standards for Financial Products apply to each financial asset.
(3) Fee income earned by the Bank in arranging securitization for other parties (no investment) is treated as noninterest income.
QUALIFIED RATING AGENCIES WHOSE RATINGS AREUSED BY THE BANK IN DETERMINING SECURITIZEDEXPOSURE TYPE-SPECIFIC RISK WEIGHTS:S&P, Moody's, Fitch, R&I, and JCR.
SUMMARY OF INTERNAL VALUATION METHODFOR SECURITIZATIONThe Bank is not using the internal valuation method for securitization.
SIGNIFICANT CHANGES OF QUANTITATIVEINFORMATIONThere are no s ign i f icant changes of quant i tat ive information.
10. MARKET RISK MANAGEMENT POLICIESAND PROCEDURES
a) POLICY AND PROCEDURE FOR RISK MANAGEMENT
(1) DEFINITION OF MARKET RISKMarket risk is the risk of incurring losses due to changes in interest rates, FX rates, stock prices, etc.
121
本文

Capital Adequacy Requirement (Basel Accord) Pillar III (Market Discipline) Disclosure
SHINSEI BANK, LIMITED Integrated Report 2019
2019/07/10 8:14:49 / 19509947_株式会社新生銀行_総会その他(C)
QUALITATIVE DISCLOSURE (CONTINUED)
(2) MARKET RISK MANAGEMENT POLICYThe Executive Committee makes important decisions concerning trading business. The Committee approves important items relating to market risk, including “Trading Business Risk Management Policy” and qualitative limits of Value at Risk and Loss limit for the Bank and its Securities. The Market Business Management Committee regularly controls market risk management and risk review of trading businesses. The Committee reviews monthly individual limit settings, customer related business movement, profit and loss/market risk situation and inherent market products risk in the business as a whole and makes decision on risk management. The market risk reports are delivered to the Head of Integrated Risk Management and to the front office.
(3) MARKET RISK MANAGEMENT FRAMEWORKWe have established effective organizational framework for check and balance by making front office unit, back o f f i ce un i t and m idd le o f f i ce management un i t i ndependent respec t i ve l y . The I n teg ra ted R i sk Management Division, the middle office unit, is responsible for the objective and timely recognition, monitoring and reporting of these market risks and carries out regular risk analysis and recommendations, as well as timely and appropriately providing management and front office unit.
(4) QUANTITATIVE MARKET RISK MANAGEMENTThe market risk is managed based on the VaR limit and loss l imit which are determined by the Executive Committee. The bank also set sensitivity limits relating to interest rate and FX rate etc. and implement stress testing based on various market shocks to enhance market risk management. The Integrated Risk Management Division is consistently responsible for r isk measurement and its control stipulating its definitions and rules.
b) NAME OF METHODOLOGY FORMARKET RISK MEASUREMENT
The internal-model method has been adopted for general market r isk at market r isk measurement and the standardized method for specif ic r isk (except for securities) since March 31, 2007 for the Bank and Shinsei Securities. The standardized method is applied for FX related risks except Trading.
Market Risk Methodologies
TradingFX-related Risks except Trading
Shinsei Bank GeneralMarket Risk
Internal ModelMethod• HistoricalSimulation Method
StandardizedMethod
Specif ic Risk (excep t f o r securities)
Standardized method
ShinseiSecurities
GeneralMarket Risk
Internal ModelMethod• HistoricalSimulation Method
StandardizedMethod
Specif ic Risk (excep t f o r securities)
Standardized Method
OtherSubsidiaries - Standardized
Method
c) ADEQUATE PRICING METHOD ACCORDING TO
TRANSACTION PROFILE TAKING POSSIBILITIES INTO CONSIDERATION THAT ACTUAL HOLDING PERIOD MAY EXCEED EXPECTED HOLDING PERIOD
The VaR framework is using this 10-day for holding period. Market liquidity of all trading book's products are high enough, and we evaluate adequately the pricing according to the products profile including the independent price valuation process.
d) INTERNAL MODEL METHOD AND BACK-TESTING,STRESS-TESTING
The Bank and Shinsei Securities use a historical simulation VaR fo r i n te rna l mode l a t gene ra l ma rke t r i s k measurement (a 99% confidential level, 10 day holding period, 250 observation days). Please refer to following table for VaR data and Stressed VaR.
Millions of yenConsolidated Nonconsolidated
VaR at the end of year 1,098 1,040through FY High 1,577 1,527
Mean 904 854Low 631 570
Millions of yenConsolidated Nonconsolidated
Stressed VaR at the end of year 3,879 3,692through FY High 4,625 4,497
Mean 3,328 3,163Low 2,605 2,350
The validity of the VaR is verified through back-testing etc., which examines how frequently hypothetical daily loss that would have occurred if the position remained unchanged exceeds VaR for a one-day holding period. The back-testing results for fiscal year 2018 show that the number of days in which loss amount exceeded VaR for one-day holding period on a consolidated basis was zero. For complementing the Internal Model method and figuring out loss possibility at stress, the Bank implements stress testing on a weekly basis. And the stress test results are reported to the Market Business Management Committee and etc.
e) INTERNAL MODEL SUMMARY IN CASE THATINCREMENTAL RISK IS MEASURED BY INTERNALMODEL
Not applicable.
f) INTERNAL MODEL SUMMARY IN CASE THATCOMPREHENSIVE RISK IS MEASURED BY INTERNALMODEL
Not applicable.
g) ASSUMPTIONS AND VALUATION METHOD FOR INTERNAL EVALUATION OF CAPITAL SUFFICIENCY ON MARKET RISK
When we evaluate capital sufficiency for market risk using risk capital, we convert the above mentioned VaR calculation method into a one year horizon basis.
122
本文

Capital Adequacy Requirement (Basel Accord) Pillar III (Market Discipline) Disclosure
SHINSEI BANK, LIMITED Integrated Report 2019
2019/07/10 8:14:49 / 19509947_株式会社新生銀行_総会その他(C)
QUALITATIVE DISCLOSURE (CONTINUED)
11. BANKING BOOK INTEREST RATE RISK MANAGEMENT
A. Overview of risk management policy and procedureInterest rate risk is the risk of losses on the current value of assets and liabilities whose cash flow mismatch may be impacted by interest rates due to market interest rate fluctuations. The interest rate risk of the banking account is managed and administered pursuant to the Group Asset Liability Management Policy. In order to appropriately control interest rate risk, at the beginning of each fiscal year the Group ALM Committee determines limits for the Bank and its group companies, such as the interest rate sensitivity limit and the loss limit. At the monthly meetings, the Group ALM Committee makes comprehensive decisions on assets and liabilities based on the monitoring of the limits and net interest income (NII). In addition to monthly reporting to the Group ALM Committee, the Group Integrated Risk Management Division, which is independent of the front offices, monitors the status of acquiring the risk and observing the l imits on a dai ly basis and reports the results to management.
B. Overview of the interest rate risk calculation method for the bank ing accoun t used by the Bank and i t s consolidated subsidiaries for internal controlBased on the banking IR sensitivity calculation procedure, a ru le subord inate to the Group Asset L iab i l i t y Management Policy and the procedure related to interest rate risk of banking account is calculated as follows.
1) Calculation methodWe measure the change of economic value of the banking book (ΔEVE) per currency by means the three scenarios of IRRBB: parallel shock up, parallel shock down and steepener shock. and use maximum ΔEVE across three scenarios. The aggregation of ΔEVE for each currency is performed by simple addition of only positive values. In the measurement, future cash flows use interest rates including spreads, but discount rates do not include spreads.
2) Subject assets and liabilitiesSubject assets and liabilities of the Bank and its main subsidiaries are deposits, loans, JGBs, and other assets and liabilities whose future cash flow is impacted by interest rates fluctuation.
3) Measurement premiseΔEVE is significantly impacted by the recognition of maturit ies and prepayments. Accordingly, we are endeavoring to appropriately capture interest rate risk by adopting the following models.
a. Housing loansWe calculate the interest rate risk of retail housing loans by statistically analyzing prepayment data and estimating future cash flow based on a proportional hazard model using periods lapsed from the loan origination.
b. Core depositsCore deposits (Up to 20 years, average period 2.9 year) are defined as retail ordinary yen deposits and 2-week yen denominated time deposits which are left with financial institutions for a long term without withdrawal. We model depositors' behaviors by statistically analyzing deposit balance data and estimating maturities by customer group.
c. Time depositsWe use a model for early withdrawal rates for retail time deposits, and use conservative assumptions for other early withdrawal rates for time deposits.
Millions of yenIRRBB1:Interest rate risk
No
A B C DΔEVE ΔNII
End of the year
End of last year
End of the year
End of last year
1 parallel shock up 63,397 - - -
2 parallel shock down 11,644 - - -
3 s t e e p e n e r shock 29,041 - - -
4 Flattener shock - - - -
5 Short rate up shock - - - -
6 S h o r t r a t e down shock - - - -
7 Max 63,397 - - -E F
End of the year End of last year8 Core capital 795,301 -
12. OPERATIONAL RISK MANAGEMENT POLICIES AND
PROCEDURES
MANAGEMENT POLICIES AND PROCEDURES(1) Definition of Operational RiskThe Bank classifies operational risk into several risk categories, such as operational and administrative risk, compliance risk, labor-related risk, systems risk, extensive disaster risk and material object risk, which are applied across the Bank and its consolidated subsidiaries.
123
本文

Capital Adequacy Requirement (Basel Accord) Pillar III (Market Discipline) Disclosure
SHINSEI BANK, LIMITED Integrated Report 2019
2019/07/10 8:14:49 / 19509947_株式会社新生銀行_総会その他(C)
QUALITATIVE DISCLOSURE (CONTINUED)
(2) Operational Risk Management SystemThe Bank manages operational risk at multiple levels as follows:• Management by business lines according to the nature of
each business
• Cross-organizational management by designated management divisions for respective risk categories mentioned above (hereinafter “designated management divisions”) and by the firmwide management division of operational risk (hereinafter “firm-wide management division”)
• Verification by the Group Internal Audit Division on the appropriateness and effectiveness of the overall risk management system
• Based on reports and proposals, the Board of Directors etc. makes decisions on important items, including general rules and organizational changes related to operational risk management
The designated management divisions and the firm-wide management division are independent from business lines, which are accountable for earnings, and promoting management of overall operational risk and each risk category. The divisions develop uniform management standards and procedures, capture and evaluate errors and irregularities, conduct causal analysis and support establishment of recurrence prevention measures. Moreover, the divisions meet on a regular basis to discuss cha l l enges and measu re s f o r ope ra t i ona l r i s k management, as well as to share information. Operational risk is recognized and evaluated through review of internal errors and irregularities that have occurred, as well as through consideration of potential errors and irregularity scenarios that may occur less frequently but may have a significant impact. Uniform standards for collection and evaluation of errors and irregularities are established to capture and/or evaluate significant actual errors and/or irregularities on a regular basis. Procedures are determined to ensure that potential errors and irregular scenarios for each business operation are specif ied and their frequency and severity are evaluated in a complete and appropriate manner on an at least an annual basis. Such identified and evaluated risks are reported to senior management by the designated management divisions and the firm-wide management division and are used i n R i sk Cap i t a l measu rement fo r i n te rna l management purposes.
(3) “Operational Risk Management Standards”“Operational Risk Management Standards” are a set of policies and procedures used to define the organizational f ramework , spec i f ic methods and processes for operational risk management. They are composed of the following:• “Operational Risk Management Policy”• Specific management rules• Management rules at consolidated subsidiaries
“Operational Risk Management Policy” is the highest set of rules on operational r isk management. To ensure comprehens ive and cons i s tent operat iona l r i sk management within the Bank Group, the Policy establishes r isk definit ions, governance and basic policies on operational risk management, and the basic framework for risk capture, evaluation, monitoring, reporting, control and mitigation. Specif ic management rules include management standards and procedures for each respective operational risk category, and for new businesses and products.
Management rules at each consolidated subsidiary are composed of comprehensive rules on overall operational r isk management and specif ic rules for respective operational risk categories. Consolidated subsidiaries establish, revise and repeal rules with the approval of their Board of Directors, according to their risk characteristics and specific internal controls. Their establishment, revision and repeal are subject to prior discussions with and after-the-fact reports to the Bank to ensure consistency with the Bank's risk management rules.
METHODOLOGY TO CALCULATE OPERATIONAL RISKUNDER BASEL REGULATIONThe Standardized Approach is adopted by the Bank.
Amount of required capital for Operational Risk at the end of fiscal year 2018:
Millions of yenRequired capital
amount(Consolidated)
Required capital amount
(Nonconsolidated)The Standardized Approach ¥ 30,347 ¥ 15,025
124
本文
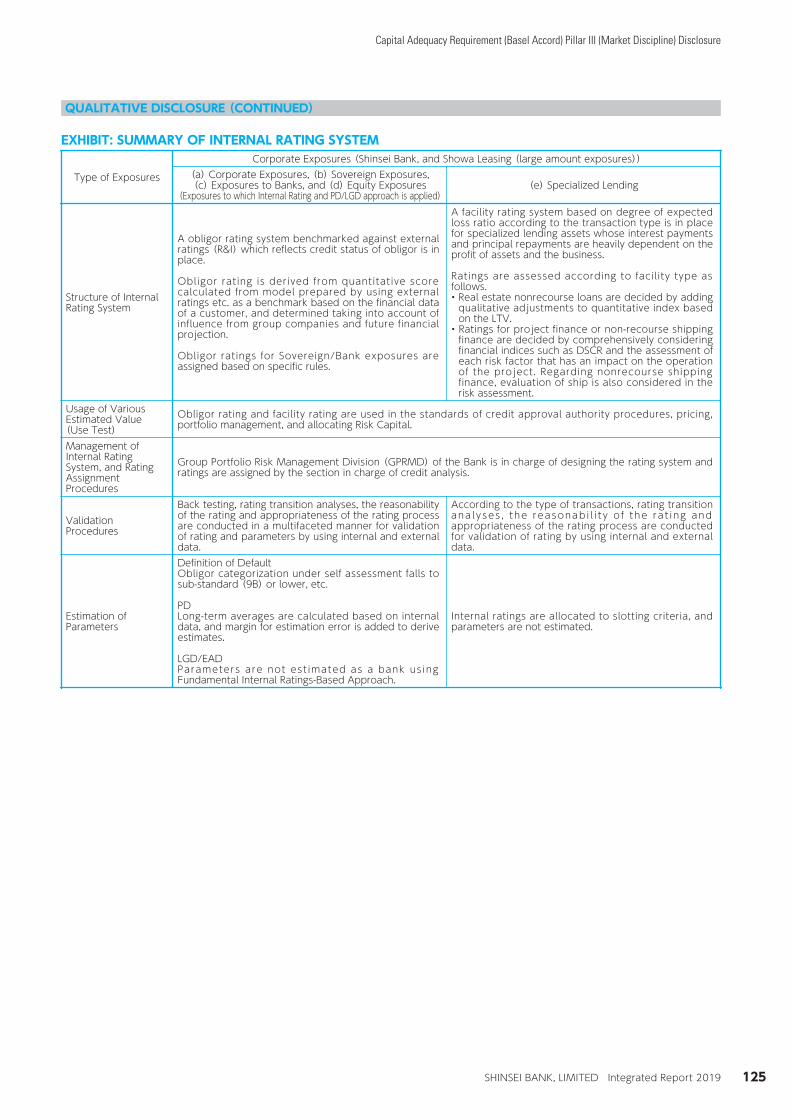
Capital Adequacy Requirement (Basel Accord) Pillar III (Market Discipline) Disclosure
SHINSEI BANK, LIMITED Integrated Report 2019
2019/07/10 8:14:49 / 19509947_株式会社新生銀行_総会その他(C)
QUALITATIVE DISCLOSURE (CONTINUED)
EXHIBIT: SUMMARY OF INTERNAL RATING SYSTEM
Type of Exposures
Corporate Exposures (Shinsei Bank, and Showa Leasing (large amount exposures))(a) Corporate Exposures, (b) Sovereign Exposures,(c) Exposures to Banks, and (d) Equity Exposures
(Exposures to which Internal Rating and PD/LGD approach is applied)(e) Specialized Lending
Structure of InternalRating System
A obligor rating system benchmarked against external ratings (R&I) which reflects credit status of obligor is in place.
Obligor rating is derived from quantitative score calculated from model prepared by using external ratings etc. as a benchmark based on the financial data of a customer, and determined taking into account of influence from group companies and future financial projection.
Obligor ratings for Sovereign/Bank exposures are assigned based on specific rules.
A facility rating system based on degree of expected loss ratio according to the transaction type is in place for specialized lending assets whose interest payments and principal repayments are heavily dependent on the profit of assets and the business.
Ratings are assessed according to facility type as follows.• Real estate nonrecourse loans are decided by adding
qualitative adjustments to quantitative index based on the LTV.
• Ratings for project finance or non-recourse shipping finance are decided by comprehensively considering financial indices such as DSCR and the assessment of each risk factor that has an impact on the operation of the project. Regarding nonrecourse shipping finance, evaluation of ship is also considered in the risk assessment.
Usage of VariousEstimated Value(Use Test)
Obligor rating and facility rating are used in the standards of credit approval authority procedures, pricing, portfolio management, and allocating Risk Capital.
Management ofInternal RatingSystem, and RatingAssignmentProcedures
Group Portfolio Risk Management Division (GPRMD) of the Bank is in charge of designing the rating system and ratings are assigned by the section in charge of credit analysis.
ValidationProcedures
Back testing, rating transition analyses, the reasonability of the rating and appropriateness of the rating process are conducted in a multifaceted manner for validation of rating and parameters by using internal and external data.
According to the type of transactions, rating transition ana lyses , the reasonab i l i t y o f the ra t ing and appropriateness of the rating process are conducted for validation of rating by using internal and external data.
Estimation ofParameters
Definition of DefaultObligor categorization under self assessment falls to sub-standard (9B) or lower, etc.
PDLong-term averages are calculated based on internal data, and margin for estimation error is added to derive estimates.
LGD/EADParameters are not est imated as a bank us ing Fundamental Internal Ratings-Based Approach.
Internal ratings are allocated to slotting criteria, and parameters are not estimated.
125
別表:内部格付制度の概要

Capital Adequacy Requirement (Basel Accord) Pillar III (Market Discipline) Disclosure
SHINSEI BANK, LIMITED Integrated Report 2019
2019/07/10 8:14:49 / 19509947_株式会社新生銀行_総会その他(C)
QUALITATIVE DISCLOSURE (CONTINUED)
EXHIBIT: SUMMARY OF INTERNAL RATING SYSTEM
Type of Exposures
Retail Exposures (Shinsei Bank)
Retail Exposures (APLUS FINANCIAL, APLUS, APLUS
PERSONAL LOAN, Zen-Nichi Shinpan, Shinsei Financial, Shinsei Personal Loan and Showa Leasing)
(f) Residential Mortgage Exposures (g) Qualifying Revolving Retail Exposures
(h) Qualifying Revolving Retail Exposures, (i) Other Retail
Exposures
Structure of InternalRating System
Assignment of Pool Category to each exposure shall be conducted so t ha t r i s k i s app rop r i a t e l y categorized, taking into account the ob l igor ' s r i sk character i s t i cs , transaction's risk characteristics and the de l inquency s tatus o f the exposure.
( I n add i t ion to hous ing loans described above, housing loans originated by lenders other than the Bank and purchased as portfolios by t he Bank a re managed as purchased receivables.)
Portfolios which the bank originated are classified as qualifying revolving retail exposures.Pools are classified quantitatively by obligor risk characteristics and etc.
Portfolios of the Bank's subsidiaries are classified as qualifying revolving retail exposures (such as unsecured personal loans, credit cards) or other retail exposures (such as installment sales credit receivables, sma l l - l o t l e a se r e ce i v ab l e s ) according to credit facility types.(Housing loan portfolios of APLUS and Zen-Nichi Shinpan are classified as residential mortgage exposures).
E x p o s u r e s a r e a s s i g n e d t o appropriate pools established for each subsidiary, considering obligor risk characteristics, transaction risk characteristics, and delinquency status.
Usage of VariousEstimated Value(Use Test)
Pool classification and PD/LGD/EAD estimates are used for calculating and allocating Risk Capital.
Pool classification and PD/LGD/EAD estimates are used for calculating and allocating Risk Capital.
Pool classification and PD/LGD/EAD estimates are used for calculating and allocating Risk Capital.
Management ofInternal RatingSystem, and RatingAssignmentProcedures
Group Portfolio Risk Management Division (GPRMD) of the Bank is in charge of internal rating system design, pool assignment and also estimates/validates parameters.
GPRMD of the Bank is in charge of internal rating system design, pool a s s i g n m e n t a n d a l s o estimates/validates parameters with guarantee company in the Shinsei group.
GPRMD of the Bank is in charge of internal rating system design, pool a s s i g n m e n t a n d a l s o estimates/validates parameters with subsidiaries.
ValidationProcedures
Key methodologies of validation are as follows:
• PD : Va l ida t ion whether gap between PD estimates/theoretical PD values by age of exposures based on the PD seasoning curve and historical PD
• LGD: Val idat ion whether gap between LGD est imates and historical LGD remain within a certain conf idence level , and val idation whether estimated collateral sale price is conservative.
Key methodologies of validation are as follows:
• PD: Val idation of accordance b e t w e e n P D e s t i m a t e s a n d historical PD, and validation of PD and rating goodness of fit
• LGD: Validation if gap between LGD estimates and historical LGD remain within a certain confidence level
• Pool classification: Validation on default predictive power
Key methodologies of validation are as follows:
• PD: Val idation of accordance be tween PD e s t ima te s and historical PD, and validation of PD and rating goodness of fit
• LGD: Validation if gap between LGD estimates and historical LGD remain within a certain confidence level
• Pool classification: Validation on default predictive power
Estimation ofParameters
Definition of DefaultAny of the following:i) past due three months or more,
ii) relaxation of terms and conditions,
iii) legal bankruptcy
PD/LGDPD/LGD are estimated using the Bank 's h istor ical data and the margin for estimation error is added to derive estimates. The seasoning characteristics of default for PD and collection from collateral sale value for LGD are taken into consideration.
Definition of DefaultSubrogated for late payment and etc.
PD/LGD/EADPD/LGD/EAD are estimated on pool by pool basis, using the historical data . Long - term averages are calculated based on these data, and margin for estimation error is added to derive estimates.
Definition of DefaultAny of the following:i) past due three months or more,
ii) relaxation of terms and conditions,
iii) legal bankruptcy, etc.
PD/LGD/EADPD/LGD/EAD are estimated on pool by pool basis, using the Bank's subsidiaries' historical data.Long-term averages are calculated based on these data, and margin for estimation error is added to derive estimates.
126
別表:内部格付制度の概要

Capital Adequacy Requirement (Basel Accord) Pillar III (Market Discipline) Disclosure
SHINSEI BANK, LIMITED Integrated Report 2019
2019/07/10 8:14:49 / 19509947_株式会社新生銀行_総会その他(C)
QUALITATIVE DISCLOSURE (CONTINUED)
SHINSEI BANK CORPORATE OBLIGOR RATING SYSTEMObligor Rating
CategoriesCorresponding Rating
Assigned by R & I Summary
0A 1. Japanese Government, BOJ.
2. Government-affiliated agencies, expected high certainty from strong backup by the Government.
1A AAA Highest capability to meet its financial commitments on the obligations and many other positive factors.
2A AA+Very high capability to meet its financial commitment on the obligation and other positive factors.2B AA
2C AA-3A A+
High capability to meet its financial commitments on the obligations and some good factors.3B A3C A-4A BBB+
There is adequate certainty of the fulfillment of obligations, but there are also some factors requiring attention in the event of serious adverse economic conditions in the future.4B BBB
4C BBB-5A BB+ No problem regarding the certainty of the fulfillment of obligations for the time being, but
some factors need to be closely watched in the event of adverse economic conditions in the future.
5B BB5C BB-6A B+ No problem regarding the certainty of the fulfillment of obligations in the present situation,
but special supervision is needed to monitor the trends in business performance and the protection of credit exposure.
6B B6C B-9A Classified as “Other Need Caution” in the self-assessment.9B Classified as “Sub-Standard” in the self-assessment.9C Classified as “Possibly Bankrupt” in the self-assessment.9D Classified as “Virtually Bankrupt” in the self-assessment.9E Classified as “Bankrupt” in the self-assessment.
127
当行コーポレート格付体系

Capital Adequacy Requirement (Basel Accord) Pillar III (Market Discipline) Disclosure
SHINSEI BANK, LIMITED Integrated Report 2019
2019/07/10 8:14:49 / 19509947_株式会社新生銀行_総会その他(C)
With regard to the internal controls related to the calculation of the capital adequacy ratio, we received an independent audit by Deloitte Touche Tohmatsu LLC in accordance with “Treatment of Inspection of the Capital Ratio Calculation Framework Based on Agreed-Upon Procedures” (JICPA Professional Business Practice Guidelines 4465, as per Industry Committee Report No. 30 ). The certain procedures performed by the external auditor are not a part of the audit of the financial statements. The certain procedures are agreed with us and the external auditor and are not a validation of appropriateness of the capital ratio itself or opinion on the internal controls related to the capital ratio.
COMPOSITION OF CAPITAL DISCLOSURE (CONSOLIDATED)
Shinsei Bank and subsidiaries Millions of yen (except percentages)
As of March 31Items
March 31, 2019Basel III
(Domestic Standard)
March 31, 2018Basel III
(Domestic Standard)
Amounts excludedunder transitional
arrangementsCore capital: instruments and reserves (1)Directly issued qualifying common share capital or preferred share capital
with a compulsory conversion clause plus related capital surplus and retained earnings ¥ 897,092 ¥ 860,010
of which: capital and capital surplus 590,710 590,710of which: retained earnings 346,562 361,368of which: treasury stock (–) 37,729 89,540of which: earning to be distributed (–) 2,452 2,528of which: other than above - -
Accumulated other comprehensive income (amount allowed to be included in Core capital) (1,149) 98 ¥ 417of which: foreign currency translation adjustment (1,527) (1,573)of which: amount related defined benefit 378 1,671 417
Stock acquisition right to common shares and preferred shares with a compulsory conversion clause 49 318Adjusted noncontrolling interests (amount allowed to be included in Core capital) 10 10Total of reserves included in Core capital: instruments and reserves 611 431
of which: general reserve for loan losses included in Core capital 611 431of which: eligible provision included in Core capital - -
Eligible noncumulative perpetual preferred shares subject to transitional arrangements(amount allowed to be included in Core capital: instruments and reserves) - -
Eligible capital instruments subject to transitional arrangements(amount allowed to be included in Core capital: instruments and reserves) - 37,400
Capital instruments issued through measures for capital enhancement by public institutions(amount allowed to be included in Core capital: instruments and reserves) - -
Land revaluation excess after 55% discount(amount allowed to be included in Core capital: instruments and reserves) - -
Noncontrolling interests subject to transitional arrangements(amount allowed to be included in Core capital: instruments and reserves) 2,964 1,647
Core capital: instruments and reserves (A) ¥ 899,577 ¥ 899,917Core capital: regulatory adjustments (2)Total amount of intangible assets (excluding those relating to mortgage servicing rights) ¥ 52,790 ¥ 38,495 ¥ 6,422
of which: goodwill (including those equivalent) 13,798 11,910 -of which: other intangibles other than goodwill and mortgage servicing rights 38,991 26,585 6,422
Deferred tax assets that rely on future profitability excluding those arisingfrom temporary differences (net of related tax liability) 7,251 5,599 1,399
Shortfall of eligible provisions to expected losses 36,650 28,976 -Gain on sale of securitization - 5,370 -Gains and losses due to changes in own credit risk on fair valued liabilities - - -Net defined benefit asset 7,584 7,360 1,840Investments in own shares (excluding those reported in the net assets section) 0 - -Reciprocal cross-holdings in common equity - - -Investments in the capital banking, financial and insurance entities that are outside the scope of
regulatory consolidation (“Other Financial Institutions”), net of eligible short positions, where thebank does not own more than 10% of the issued share capital (amount above the 10% threshold)
- - -
Amount exceeding the 10% threshold on specific items - - -of which: significant investments in the common stock of
Other Financial Institutions, net of eligible short positions - - -
of which: mortgage servicing rights - - -of which: deferred tax assets arising from temporary differences (net of related tax liability) - - -
Amount exceeding the 15% threshold on specific items - - -of which: significant investments in the common stock of
Other Financial Institutions, net of eligible short positions - - -
of which: mortgage servicing rights - - -of which: deferred tax assets arising from temporary differences (net of related tax liability) - - -
Core capital: regulatory adjustments (B) ¥ 104,276 ¥ 85,801Capital (consolidated)Capital (consolidated)((A)–(B))(C) ¥ 795,301 ¥ 814,115Risk-weighted assets, etc.Total amount of credit risk-weighted assets ¥ 6,177,810 ¥ 5,809,201
of which: total amount included in risk-weighted assets by transitional arrangements (330) 6,964of which: intangible assets (excluding those relating to goodwill and mortgage servicing rights) 6,422of which: deferred tax assets that rely on future profitability excluding those arising from
temporary differences (net of related tax liability) 1,399
of which: net defined benefit asset 1,840of which: significant investments in the common stock of
Other Financial Institutions (net of eligible short positions) (330) (2,697)
of which: other than above - -Market risk (derived by multiplying the capital requirement by 12.5) 154,082 161,545Operational risk (derived by multiplying the capital requirement by 12.5) 379,341 371,960Credit risk-weighted assets adjustments - -Operational risk adjustments - -Total amount of Risk-weighted assets (D) ¥ 6,711,235 ¥ 6,342,708Capital ratio (consolidated)Capital ratio (consolidated)((C)/(D)) 11.85% 12.83%
Note:Composition of Capital as of March 31,2019 is disclosed in the form of the Schedule No.12 of FSA Notice for Disclosure as the period for transitional arrangement has ended.
128
自己資本の構成に関する開示事項(連結自己資本比率)

Capital Adequacy Requirement (Basel Accord) Pillar III (Market Discipline) Disclosure
SHINSEI BANK, LIMITED Integrated Report 2019
2019/07/10 8:14:49 / 19509947_株式会社新生銀行_総会その他(C)
COMPOSITION OF CAPITAL DISCLOSURE (NONCONSOLIDATED)
Shinsei Bank Millions of yen (except percentages)
As of March 31Items
March 31, 2019Basel III
(Domestic Standard)
March 31, 2018Basel III
(Domestic Standard)
Amounts excludedunder transitional
arrangementsCore capital: instruments and reserves (1)Directly issued qualifying common share capital or preferred share capital
with a compulsory conversion clause plus related capital surplus and retained earnings ¥ 859,343 ¥ 839,251of which: capital and capital surplus 591,670 591,670of which: retained earnings 307,855 339,650of which: treasury stock (–) 37,729 89,540of which: earning to be distributed (–) 2,452 2,528of which: other than above - -
Stock acquisition right to common shares and preferred shares with a compulsory conversion clause 49 270Total of reserves included in Core capital: instruments and reserves 9 16
of which: general reserve for loan losses included in Core capital 9 16of which: eligible provision included in Core capital - -
Eligible noncumulative perpetual preferred shares subject to transitional arrangements(amount allowed to be included in Core capital: instruments and reserves) - -
Eligible capital instruments subject to transitional arrangements(amount allowed to be included in Core capital: instruments and reserves) - 37,400
Capital instruments issued through measures for capital enhancement by public institutions(amount allowed to be included in Core capital: instruments and reserves) - -
Land revaluation excess after 55% discount(amount allowed to be included in Core capital: instruments and reserves) - -
Core capital: instruments and reserves (A) ¥ 859,402 ¥ 876,938Core capital: regulatory adjustments (2)Total amount of intangible assets (excluding those relating to mortgage servicing rights) ¥ 18,589 ¥ 13,249 ¥ 3,070
of which: goodwill (including those equivalent) 703 869 -of which: other intangibles other than goodwill and mortgage servicing rights 17,886 12,380 3,070
Deferred tax assets that rely on future profitability excluding those arisingfrom temporary differences (net of related tax liability) 2,545 1,630 407
Shortfall of eligible provisions to expected losses 24,866 21,321 -Gain on sale of securitization - 5,370 -Gains and losses due to changes in own credit risk on fair valued liabilities - - -Prepaid pension cost 4,752 3,531 882Investments in own shares (excluding those reported in the net assets section) 0 - -Reciprocal cross-holdings in common equity - - -Investments in the capital banking, financial and insurance entities that are outside the scope of
regulatory consolidation (“Other Financial Institutions”), net of eligible short positions, where thebank does not own more than 10% of the issued share capital (amount above the 10% threshold)
- - -
Amount exceeding the 10% threshold on specific items - - -of which: significant investments in the common stock of
Other Financial Institutions, net of eligible short positions - - -
of which: mortgage servicing rights - - -of which: deferred tax assets arising from temporary differences (net of related tax liability) - - -
Amount exceeding the 15% threshold on specific items - - -of which: significant investments in the common stock of
Other Financial Institutions, net of eligible short positions - - -
of which: mortgage servicing rights - - -of which: deferred tax assets arising from temporary differences (net of related tax liability) - - -
Core capital: regulatory adjustments (B) ¥ 50,754 ¥ 45,103Capital (nonconsolidated)Capital (nonconsolidated)((A)–(B))(C) ¥ 808,647 ¥ 831,835Risk-weighted assets, etc.Total amount of credit risk-weighted assets ¥ 5,554,802 ¥ 5,260,100
of which: total amount included in risk-weighted assets by transitional arrangements (330) 1,663of which: intangible assets (excluding those relating to goodwill and mortgage servicing rights) 3,070of which: deferred tax assets that rely on future profitability excluding those arising from
temporary differences (net of related tax liability) 407
of which: prepaid pension cost 882of which: significant investments in the common stock of
Other Financial Institutions (net of eligible short positions) (330) (2,697)
of which: other than above - -Market risk (derived by multiplying the capital requirement by 12.5) 143,617 151,634Operational risk (derived by multiplying the capital requirement by 12.5) 187,814 188,537Credit risk-weighted assets adjustments - -Operational risk adjustments - -Total amount of Risk-weighted assets (D) ¥ 5,886,234 ¥ 5,600,271Capital ratio (nonconsolidated)Capital ratio (nonconsolidated)((C)/(D)) 13.73% 14.85%
Note:Composition of Capital as of March 31,2019 is disclosed in the form of the Schedule No.11 of FSA Notice for Disclosure as the period for transitional arrangement has ended.
129
自己資本の構成に関する開示事項(単体自己資本比率)

Capital Adequacy Requirement (Basel Accord) Pillar III (Market Discipline) Disclosure
SHINSEI BANK, LIMITED Integrated Report 2019
2019/07/10 8:14:49 / 19509947_株式会社新生銀行_総会その他(C)
QUANTITATIVE DISCLOSURE (CONSOLIDATED)
1. NAMES OF SUBSIDIARIES THAT ARE OUTSIDE THE SCOPE OF REGULATORY CONSOLIDATION WITH LOWER LEVEL OF CAPITAL THAN REQUIRED LEVEL OF ADEQUACY CAPITAL AND AMOUNT OF SHORTAGE
• There are no companies that are subject to the above.
2. CAPITAL ADEQUACY
(1) AMOUNT OF REQUIRED CAPITAL FOR CREDIT RISKPortfolios under the Standardized Approach (SA)
Millions of yen2019 2018
As of March 31Required capital
amountRequired capital
amountShinsei Bank ¥ 370 ¥ 411Subsidiaries 5,827 3,992
Portfolios under the Internal Ratings-Based Approach (IRB)Millions of yen
2019 2018
As of March 31Required capital
amountRequired capital
amountCorporate (Excluding Specialized Lending)1 ¥ 151,474 ¥ 157,125Specialized Lending2 95,739 83,800Sovereign 5,675 5,581Bank 14,197 9,911Residential mortgages 10,211 11,777Qualified revolving retails 131,920 143,012Other retails 163,258 153,545Equity 19,980 19,304Fund 16,337 16,854Securitization 30,733 22,351Purchase receivables 10,842 10,302Other assets 3,432 4,351CVA risk 10,520 8,875CCP risk 92 85Total ¥ 664,417 ¥ 646,880
Note:1.“Corporate” includes “Small and Medium-sized Entities.”2.“Specialized Lending” refers to a claim whose source of recovery is solely dependent on the cash flow generated from a transaction such as a real estate nonrecourse loan.
(2) AMOUNT OF REQUIRED CAPITAL FOR EQUITY EXPOSURE UNDER IRBMillions of yen
2019 2018
As of March 31Required capital
amountRequired capital
amountMarket-Based Approach Simplified Method ¥ 4,269 ¥ 4,327PD/LGD Method 2,600 2,414RW100% Applied 4 4RW250% Applied 13,106 12,558Total ¥ 19,980 ¥ 19,304
(3) EXPOSURE RELATING TO INVESTMENT FUNDSMillions of yen
2019 2018
As of March 31Required capital
amountRequired capital
amountBefore revision Look Through ¥ 1,604Before revision Revised Naivete Majority 14,569Before revision Simplified [400%] 679Before revision Simplified [1,250%] 0Look-through approach ¥ 1,428Mandate-based approach -Probability-based approach[250%] -Probability-based approach[400%] 14,909Fall-back approach[1,250%] 0Total ¥ 16,337 ¥ 16,854
130
規制上の所要自己資本を下回った会社の名称と所要自己資本を下回った額の総額、自己資本の充実度に関する開示事項

Capital Adequacy Requirement (Basel Accord) Pillar III (Market Discipline) Disclosure
SHINSEI BANK, LIMITED Integrated Report 2019
2019/07/10 8:14:49 / 19509947_株式会社新生銀行_総会その他(C)
QUANTITATIVE DISCLOSURE (CONSOLIDATED) (continued)
(4) AMOUNT OF REQUIRED CAPITAL FOR MARKET RISKMillions of yen
2019 2018
As of March 31Required capital
amountRequired capital
amountThe Standardized Approach ¥ 549 ¥ 275
Interest rate risk 26 38Equity position risk 3 5FX risk 486 165Securitization risk 32 65
The Internal Models Approach (IMA) (General Market Risk) 11,777 12,648
(5) AMOUNT OF REQUIRED CAPITAL FOR OPERATIONAL RISKMillions of yen
2019 2018
As of March 31Required capital
amountRequired capital
amountThe Standardized Approach ¥ 30,347 ¥ 29,756
(6) TOTAL REQUIRED CAPITAL (DOMESTIC STANDARD)Millions of yen
As of March 31 2019 2018Total Required Capital (Risk-weighted Assets x 4%) ¥ 268,449 ¥ 253,708
3.CREDIT RISK EXPOSURE (EXCLUDING SECURITIZATION AND EXPOSURES RELATING TO INVESTMENT FUNDS)
(1) AMOUNT OF CREDIT RISK EXPOSUREGeographic, Industries or Maturity
Millions of yen2019 2018
Amount of Credit Risk Exposure Amount of Credit Risk ExposureAs of March 31 Total Loans, etc.1 Securities2 Derivatives3 Total Loans, etc.1 Securities2 Derivatives3
Manufacturing ¥ 316,377 ¥ 299,301 ¥ 1,000 ¥ 16,075 ¥ 319,212 ¥ 304,196 ¥ 50 ¥ 14,966Agriculture 337 337 - - 290 290 - -Mining 916 914 - 1 1,364 1,362 - 2Construction 49,082 48,882 200 - 44,060 44,060 - -Electric power, gas, water supply 418,610 398,856 - 19,753 338,343 324,938 - 13,404Information and communication 55,913 55,911 - 1 78,009 78,005 - 3Transportation 217,108 216,811 - 297 233,957 229,542 3,699 715Wholesale and retail 202,430 189,350 100 12,980 203,341 189,034 100 14,207Finance and insurance 2,084,941 1,924,388 138,599 21,953 2,093,459 1,998,752 70,644 24,062Real estate 729,721 600,703 126,404 2,613 715,145 583,631 128,750 2,763Services 534,336 533,148 801 386 532,768 531,699 921 146Government 561,576 60,863 500,713 - 572,768 67,964 504,804 -Individuals 3,215,767 3,215,476 - 290 3,189,368 3,189,169 - 199Others 1,598 1,598 - - 4,041 4,041 - -Domestic Total 8,388,718 7,546,545 767,817 74,354 8,326,130 7,546,688 708,970 70,471Foreign 975,647 698,720 214,243 62,683 954,813 650,320 235,999 68,493Total ¥ 9,364,365 ¥ 8,245,266 ¥ 982,061 ¥ 137,038 ¥ 9,280,943 ¥ 8,197,009 ¥ 944,969 ¥ 138,964To 1 year 1,646,275 1,491,754 138,853 15,667 1,576,314 1,412,655 144,216 19,4421 to 3 years 1,889,961 1,522,330 347,489 20,141 1,831,389 1,506,182 299,623 25,5843 to 5 years 1,063,870 889,137 150,362 24,370 1,150,244 884,760 247,028 18,455Over 5 years 3,116,650 2,695,938 343,853 76,857 2,914,747 2,586,166 253,099 75,481Undated 1,647,606 1,646,104 1,501 - 1,808,247 1,807,245 1,001 -Total ¥ 9,364,365 ¥ 8,245,266 ¥ 982,061 ¥ 137,038 ¥ 9,280,943 ¥ 8,197,009 ¥ 944,969 ¥ 138,964
Note:1 Excluding purchased receivables.2 Excluding equity exposures.3 Credit equivalent amount basis.
131
自己資本の充実度に関する開示事項、信用リスクに関する開示事項

Capital Adequacy Requirement (Basel Accord) Pillar III (Market Discipline) Disclosure
SHINSEI BANK, LIMITED Integrated Report 2019
2019/07/10 8:14:49 / 19509947_株式会社新生銀行_総会その他(C)
QUANTITATIVE DISCLOSURE (CONSOLIDATED) (continued)
(2) AMOUNT OF DEFAULT EXPOSURE BEFORE PARTIAL WRITE-OFFGeographic, Industries
Millions of yen2019 2018
As of March 31 Default Exposure Default ExposureManufacturing ¥ 4,163 ¥ 3,998Agriculture 47 -Mining - -Construction 910 996Electric power, gas, water supply - -Information and communication 576 269Transportation 2,810 1,823Wholesale and retail 4,491 6,522Finance and insurance 267 257Real estate 5,358 221Services 3,148 3,623Government - -Individuals 120,854 128,731Others 659 2,614Domestic Total 143,288 149,059Foreign 5,285 4,687Total ¥ 148,573 ¥ 153,747
(3) AMOUNT OF LOAN LOSS RESERVES (GENERAL, SPECIFIC AND COUNTRY RISK) BEFORE PARTIAL WRITE-OFFMillions of yen
2019 2018As of March 31 Start Amount Change Amount End Amount Start Amount Change Amount End AmountGeneral ¥ 77,520 ¥ (5,654) ¥ 71,866 ¥ 70,977 ¥ 6,543 ¥ 77,520Specific 86,823 (6,149) 80,674 135,712 (48,889) 86,823Country - - - 0 (0) -Total ¥ 164,343 ¥ (11,803) ¥ 152,540 ¥ 206,690 ¥ (42,346) ¥ 164,343
GeographicMillions of yen
2019 2018Reserve Amount Reserve Amount
As of March 31 Total General Specific Country Total General Specific CountryDomestic ¥ 146,176 ¥ 67,648 ¥ 78,528 ¥ - ¥ 152,591 ¥ 66,862 ¥ 85,729 ¥ -Foreign 6,363 4,217 2,145 - 11,752 10,658 1,094 -Total ¥ 152,540 ¥ 71,866 ¥ 80,674 ¥ - ¥ 164,343 ¥ 77,520 ¥ 86,823 ¥ -
IndustriesMillions of yen
2019 2018As of March 31 Reserve Amount Reserve AmountManufacturing ¥ 3,453 ¥ 4,000Agriculture 43 10Mining 6 40Construction 762 841Electric power, gas, water supply 2,868 814Information and communication 988 457Transportation 1,335 2,824Wholesale and retail 4,055 5,325Finance and insurance 2,081 1,600Real estate 5,418 3,763Services 5,571 5,817Government 44 31Individuals 117,109 124,621Others 566 576Foreign 6,363 11,752Non-classified 1,871 1,866Total ¥ 152,540 ¥ 164,343
Note:Although the specific allowance for credit losses does not include the allowance relating to any securitization exposures and exposures relating to funds, the allowance relating to these exposures is not excluded from both the general allowance for credit losses and the allowance for loans to specific foreign borrowers, because we do not manage provisioning with respect to each asset class based on Basel III.
132
信用リスクに関する開示事項

Capital Adequacy Requirement (Basel Accord) Pillar III (Market Discipline) Disclosure
SHINSEI BANK, LIMITED Integrated Report 2019
2019/07/10 8:14:49 / 19509947_株式会社新生銀行_総会その他(C)
QUANTITATIVE DISCLOSURE (CONSOLIDATED) (continued)
(4) AMOUNT OF WRITE-OFFSIndustries
Millions of yenFY2018 FY2017
Amount ofwrite-off
Amount ofwrite-off
Manufacturing ¥ 41 ¥ 402Agriculture - -Mining 0 -Construction 30 19Electric power, gas, water supply - -Information and communication 0 3Transportation 0 6Wholesale and retail 88 179Finance and insurance - 4Real estate 0 -Services 69 466Government - -Individuals 45,499 56,249Others - -Foreign 215 1,864Non-classified - -Total ¥ 45,947 ¥ 59,196
(5) AMOUNT OF EXPOSURES UNDER SA (AFTER CREDIT RISK MITIGATION)Millions of yen
2019 2018As of March 31 Rated Unrated Rated Unrated0% ¥ 67 ¥ 10,120 ¥ 51 ¥ 8,04310% - - - -20% 20,324 29 23,995 2935% - 3,039 - 3,21150% 273 241 46 24375% - 41,228 - 26,343100% 385 38,791 724 27,271150% - 1,325 - 1,017350% - - - -1,250% - - - -Total ¥ 21,050 ¥ 94,775 ¥ 24,818 ¥ 66,160
(6) SPECIALIZED LENDING EXPOSURE UNDER SLOTTING CRITERIA AND EQUITY EXPOSURE UNDER MARKET-BASED
SIMPLIFIED METHODSpecialized lending excluding high-volatility commercial real estate
Millions of yenAs of March 31 2019 2018
Risk weight ratioAmount ofExposure
Amount ofExposure
50% ¥ 224,936 ¥ 141,47970% 441,397 431,58290% 121,918 124,124115% 77,574 55,764250% 42,456 35,8580% (Default) 1,894 -Total ¥ 910,177 ¥ 788,810
133
信用リスクに関する開示事項

Capital Adequacy Requirement (Basel Accord) Pillar III (Market Discipline) Disclosure
SHINSEI BANK, LIMITED Integrated Report 2019
2019/07/10 8:14:49 / 19509947_株式会社新生銀行_総会その他(C)
QUANTITATIVE DISCLOSURE (CONSOLIDATED) (continued)
Specialized lending for high-volatility commercial real estateMillions of yen
As of March 31 2019 2018
Risk weight ratioAmount ofExposure
Amount ofExposure
70% ¥ 13,151 ¥ 11,10895% 26,461 32,208120% 3,211 6,077140% 30,518 45,532250% 52,290 40,3060% (Default) 3,432 -Total ¥ 129,066 ¥ 135,233
Equity exposure under Market-Based Simplified MethodMillions of yen
As of March 31 2019 2018
Risk weight ratioAmount ofExposure
Amount ofExposure
300% ¥ 6,092 ¥ 5,131400% 8,016 8,909Total ¥ 14,109 ¥ 14,041
(7) PORTFOLIOS UNDER IRB EXCLUDING THE AMOUNT OF EXPOSURES UNDER SA (AFTER CREDIT RISK MITIGATION)
• Estimated average PD, LGD, Risk Weight Ratio and Exposure at Default (EAD) (on-balance and off-balance) for Corporate, Sovereign and Bank exposure
CorporateMillions of yen (except percentages)
As of March 31 2019 2018
Credit Rating PD LGD Risk WeightEAD
(On-balance)EAD
(Off-balance) PD LGD Risk WeightEAD
(On-balance)EAD
(Off-balance)0–4 0.14% 44.83% 37.84% ¥1,573,544 ¥ 159,750 0.15% 44.87% 39.50% ¥1,539,812 ¥ 162,6745–6 1.48% 44.01% 94.41% 695,731 91,660 1.59% 44.04% 97.55% 701,607 86,6569A 9.39% 44.84% 185.49% 78,019 5,165 9.72% 44.78% 188.60% 79,095 2,318Default 100.00% 49.32% - 20,174 - 100.00% 48.63% - 23,262 535
Note: LGD is shown after credit risk mitigation
SovereignMillions of yen (except percentages)
As of March 31 2019 2018
Credit Rating PD LGD Risk WeightEAD
(On-balance)EAD
(Off-balance) PD LGD Risk WeightEAD
(On-balance)EAD
(Off-balance)0–4 0.00% 45.00% 3.25% ¥2,031,451 ¥ 2,600 0.00% 45.00% 2.85% ¥2,213,597 ¥ 5,7275–6 0.81% 45.00% 66.61% 0 - 0.56% 45.00% 55.42% 3,012 -9A - - - - - - - - - -Default 100.00% 45.00% - 10 - 100.00% 45.00% - 10 -
Note: LGD is shown after credit risk mitigation
BankMillions of yen (except percentages)
As of March 31 2019 2018
Credit Rating PD LGD Risk WeightEAD
(On-balance)EAD
(Off-balance) PD LGD Risk WeightEAD
(On-balance)EAD
(Off-balance)0–4 0.07% 44.97% 35.24% ¥ 171,117 ¥ 80,799 0.07% 44.97% 33.01% ¥ 178,652 ¥ 88,9865–6 0.95% 45.00% 107.83% 20,365 2,391 0.73% 45.00% 82.40% 24,211 3,7009A 9.39% 13.55% 51.72% 53,888 21,825 9.72% 45.00% 183.01% 1,417 -Default 100.00% 45.00% - 267 - - - - - -
Note: LGD is shown after credit risk mitigation
134
信用リスクに関する開示事項

Capital Adequacy Requirement (Basel Accord) Pillar III (Market Discipline) Disclosure
SHINSEI BANK, LIMITED Integrated Report 2019
2019/07/10 8:14:49 / 19509947_株式会社新生銀行_総会その他(C)
QUANTITATIVE DISCLOSURE (CONSOLIDATED) (continued)
• Estimated average PD, risk weight ratio and amount of exposure for equity exposure under PD/LGD methodMillions of yen (except percentages)
As of March 31 2019 2018Credit Rating PD LGD Risk Weight Amount PD LGD Risk Weight Amount0–4 0.13% 90.00% 207.43% ¥ 8,281 0.13% 90.00% 207.13% ¥ 8,9955–6 1.65% 90.00% 354.76% 3,084 1.28% 90.00% 309.12% 2,1439A 9.39% 90.00% 722.77% 350 9.72% 90.00% 560.92% 572Default 100.00% 90.00% 1,125.00% 0 100.00% 90.00% 1,125.00% 0
• Estimated average PD, LGD, risk weight ratio, Exposure at Default (EAD) (on- and off-balance), amount of undrawn commitments and estimated average Credit Conversion Factors (CCF) of undrawn commitments for residential mortgage exposure, qualified revolving retail exposure and other retail exposure
Residential mortgage exposureMillions of yen (except percentages)
As of March 31 2019 2018
Pool PD LGDRisk
WeightEAD
(On-balance)EAD
(Off-balance)UndrawnAmount
CommitmentCCF PD LGD
RiskWeight
EAD(On-balance)
EAD(Off-balance)
UndrawnAmount
CommitmentCCF
Normal 0.23% 16.27% 7.74% ¥ 1,186,746 ¥ 2,964 ¥ - - 0.25% 16.53% 8.50% ¥ 1,265,424 ¥ 3,610 ¥ - -Need caution 64.90% 20.55% 76.63% 2,088 80 - - 66.13% 20.46% 73.40% 1,963 84 - -Default 100.00% 40.32% 48.42% 3,197 14 - - 100.00% 39.11% 47.82% 3,600 31 - -
Note: LGD is shown after credit risk mitigation
Qualified revolving retail exposureMillions of yen (except percentages)
As of March 31 2019 2018
Pool PD LGDRisk
WeightEAD
(On-balance)EAD
(Off-balance)UndrawnAmount
CommitmentCCF PD LGD
RiskWeight
EAD(On-balance)
EAD(Off-balance)
UndrawnAmount
CommitmentCCF
Normal 5.75% 76.35% 88.86% ¥ 536,398 ¥ 147,318 ¥ 3,644,066 4.04% 5.98% 77.45% 91.78% ¥ 553,473 ¥ 133,272 ¥ 2,818,156 4.72%Need caution 80.90% 80.85% 117.73% 2,871 48 3,184 1.51% 81.61% 81.73% 115.57% 3,003 50 3,408 1.46%Default 100.00% 71.34% - 64,387 - - - 100.00% 74.61% - 71,500 - - -
Note: LGD is shown after credit risk mitigation
Other retail exposureMillions of yen (except percentages)
As of March 31 2019 2018
Pool PD LGDRisk
WeightEAD
(On-balance)EAD
(Off-balance)UndrawnAmount
CommitmentCCF PD LGD
RiskWeight
EAD(On-balance)
EAD(Off-balance)
UndrawnAmount
CommitmentCCF
Normal 3.39% 64.35% 86.08% ¥ 624,275 ¥ 688,058 ¥ 138,266 3.24% 3.51% 63.78% 85.78% ¥ 562,425 ¥ 645,997 ¥ 110,768 3.74%Need caution 66.80% 52.60% 105.28% 5,250 2,084 16 0.00% 68.05% 53.03% 104.74% 5,587 1,974 4 0.09%Default 100.00% 59.47% 4.62% 56,034 592 - - 100.00% 58.41% 1.38% 56,725 418 - -
Note: LGD is shown after credit risk mitigation
(8) COMPARATIVE RESULTS OF ACTUAL LOSSES AND EXPECTED LOSSES FOR THE LAST THREE YEARS UNDER F-IRB APPROACH
CorporateMillions of yen
FY2018 FY2017 FY2016Results of actual losses (a) ¥ 1,736 ¥ 3,957 ¥ 3,328Expected losses (b) 9,548 9,527 9,544Differences ((b) - (a)) 7,812 5,570 6,216
SovereignMillions of yen
FY2018 FY2017 FY2016Results of actual losses (a) ¥ - ¥ - ¥ -Expected losses (b) 28 34 26Differences ((b) - (a)) 28 34 26
135
信用リスクに関する開示事項

Capital Adequacy Requirement (Basel Accord) Pillar III (Market Discipline) Disclosure
SHINSEI BANK, LIMITED Integrated Report 2019
2019/07/10 8:14:49 / 19509947_株式会社新生銀行_総会その他(C)
QUANTITATIVE DISCLOSURE (CONSOLIDATED) (continued)
BankMillions of yen
FY2018 FY2017 FY2016Results of actual losses (a) ¥ 70 ¥ - ¥ -Expected losses (b) 117 218 77Differences ((b) - (a)) 47 218 77
Residential mortgage exposureMillions of yen
FY2018 FY2017 FY2016Results of actual losses (a) ¥ 156 ¥ 304 ¥ 247Expected losses (b) 931 1,197 1,104Differences ((b) - (a)) 774 893 857
Qualified revolving retail exposureMillions of yen
FY2018 FY2017 FY2016Results of actual losses (a) ¥ 23,718 ¥ 24,482 ¥ 21,768Expected losses (b) 38,842 35,921 32,694Differences ((b) - (a)) 15,123 11,439 10,926
Other retail exposureMillions of yen
FY2018 FY2017 FY2016Results of actual losses (a) ¥ 8,076 ¥ 7,916 ¥ 7,118Expected losses (b) 24,934 21,771 19,234Differences ((b) - (a)) 16,858 13,854 12,115
[Analysis]The result of actual losses for the year ended March 31, 2019 was decreased ¥2.9 billion compared with in the previoues fiscal year.The principal reason is to be increased the specific reserves for Corporate exposure in the previous fiscal year.
The above matrix shows the results of default (downgrade below substandard) losses (increase of reserve, write-offs and loss on sale) for the twelve-month period ended March 31, 2017, 2018 and 2019 for the Bank Group's non-default exposures at the start of the twelve-month period, with expected losses. The exposures for the Shinsei Bank Lake business are calculated through the F-IRB approach starting from March 31, 2017.
136
信用リスクに関する開示事項
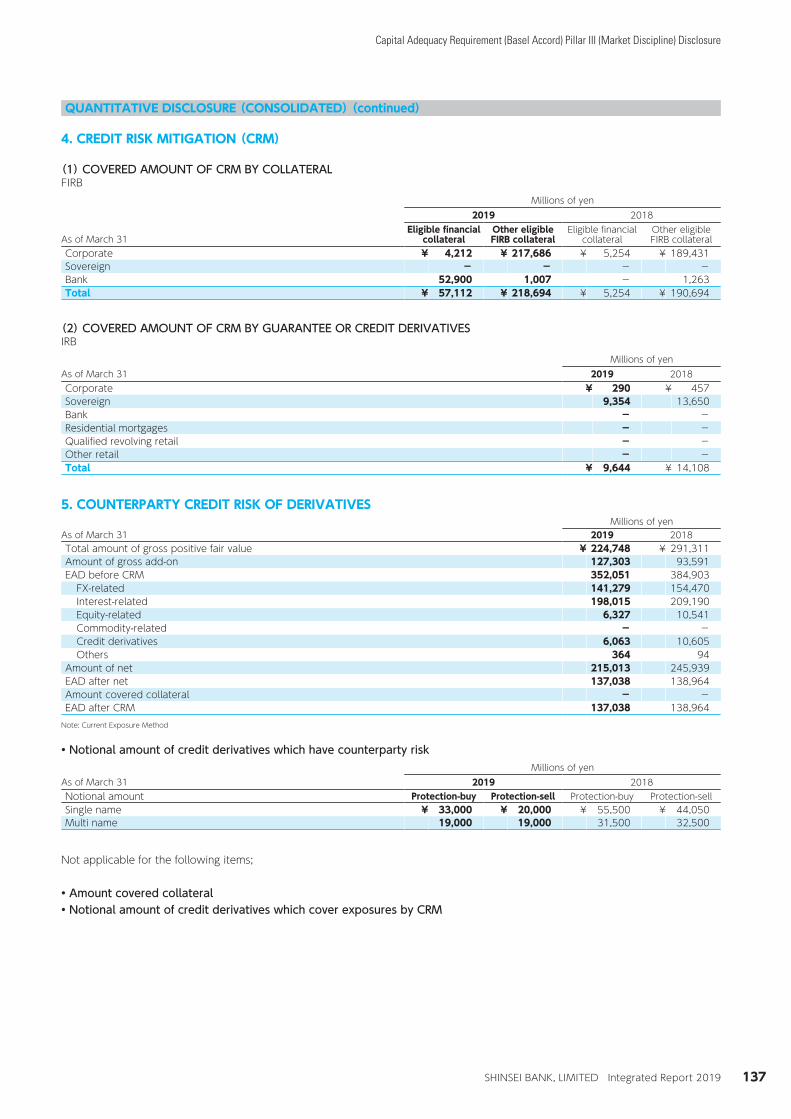
Capital Adequacy Requirement (Basel Accord) Pillar III (Market Discipline) Disclosure
SHINSEI BANK, LIMITED Integrated Report 2019
2019/07/10 8:14:49 / 19509947_株式会社新生銀行_総会その他(C)
QUANTITATIVE DISCLOSURE (CONSOLIDATED) (continued)
4. CREDIT RISK MITIGATION (CRM)
(1) COVERED AMOUNT OF CRM BY COLLATERALFIRB
Millions of yen2019 2018
As of March 31Eligible financial
collateralOther eligibleFIRB collateral
Eligible financialcollateral
Other eligibleFIRB collateral
Corporate ¥ 4,212 ¥ 217,686 ¥ 5,254 ¥ 189,431Sovereign - - - -Bank 52,900 1,007 - 1,263Total ¥ 57,112 ¥ 218,694 ¥ 5,254 ¥ 190,694
(2) COVERED AMOUNT OF CRM BY GUARANTEE OR CREDIT DERIVATIVESIRB
Millions of yenAs of March 31 2019 2018Corporate ¥ 290 ¥ 457Sovereign 9,354 13,650Bank - -Residential mortgages - -Qualified revolving retail - -Other retail - -Total ¥ 9,644 ¥ 14,108
5. COUNTERPARTY CREDIT RISK OF DERIVATIVESMillions of yen
As of March 31 2019 2018Total amount of gross positive fair value ¥ 224,748 ¥ 291,311Amount of gross add-on 127,303 93,591EAD before CRM 352,051 384,903
FX-related 141,279 154,470Interest-related 198,015 209,190Equity-related 6,327 10,541Commodity-related - -Credit derivatives 6,063 10,605Others 364 94
Amount of net 215,013 245,939EAD after net 137,038 138,964Amount covered collateral - -EAD after CRM 137,038 138,964
Note: Current Exposure Method
• Notional amount of credit derivatives which have counterparty riskMillions of yen
As of March 31 2019 2018Notional amount Protection-buy Protection-sell Protection-buy Protection-sellSingle name ¥ 33,000 ¥ 20,000 ¥ 55,500 ¥ 44,050Multi name 19,000 19,000 31,500 32,500
Not applicable for the following items;
• Amount covered collateral• Notional amount of credit derivatives which cover exposures by CRM
137
信用リスク削減手法に関する開示事項、派生商品取引の取引相手のリスクに関する開示事項

Capital Adequacy Requirement (Basel Accord) Pillar III (Market Discipline) Disclosure
SHINSEI BANK, LIMITED Integrated Report 2019
2019/07/10 8:14:49 / 19509947_株式会社新生銀行_総会その他(C)
QUANTITATIVE DISCLOSURE (CONSOLIDATED) (continued)
6. SECURITIZATION
The amout of securitization exposure and required capital as of March 31, 2019 is calculated based on 「Accord」 amended on March 31, 2019.
SECURITIZATION EXPOSURE ORIGINATED BY THE BANK GROUP (CREDIT RISK)(1) Amount of original assetsSecuritization by transfer of assets
Millions of yenAs of March 31 2019 2018
Type of original assetsAmount of
original assetsAmount of
original assetsResidential mortgages ¥ - ¥ 5,270Consumer loans - -Commercial real estate loans - -Corporate loans - -Others - -Total ¥ - ¥ 5,270
Note: Includes originally securitized assets originated by the Bank Group during the period, even though the Bank Group had no exposure to these particular assets.
(2) Amount of original assets in default or past due 3 months or moreSecuritization by transfer of assets
Millions of yenAs of March 31 2019 2018Type of original assets Amount of Default Amount of DefaultResidential mortgages ¥ - ¥ 176Consumer loans - -Commercial real estate loans - -Corporate loans - -Others - -Total ¥ - ¥ 176
Note: Includes originally securitized assets originated by the Bank Group during the period, even though the Bank Group had no exposure to these particular assets.
138
証券化エクスポージャーに関する開示事項

Capital Adequacy Requirement (Basel Accord) Pillar III (Market Discipline) Disclosure
SHINSEI BANK, LIMITED Integrated Report 2019
2019/07/10 8:14:49 / 19509947_株式会社新生銀行_総会その他(C)
QUANTITATIVE DISCLOSURE (CONSOLIDATED) (continued)
(3) Amount of increase of capital by securitization (to be deducted from capital)Millions of yen
As of March 31 2019 2018Type of original assets Amount AmountResidential mortgages ¥ - ¥ 5,370Consumer loans - -Commercial real estate loans - -Corporate loans - -Others - -Total ¥ - ¥ 5,370
(4) Amount of securitization exposure applied risk weight 1,250%Millions of yen
As of March 31 2019 2018Type of original assets Amount AmountResidential mortgages ¥ - ¥ 40Consumer loans - -Commercial real estate loans - -Corporate loans - -Others - -Total ¥ - ¥ 40
Not applicable for the following items;
• Amount of securitization exposure the Bank Group has by type of original assets• Amount of securitization exposure and required capital the Bank Group has by risk weight ratio• Amount of assets held for securitization trade• Summary of current year's securitization activities• Amount of recognized gain/loss by original asset type during the period.• Securitization exposure subject to early amortization• Credit risk mitigation for resecuritization exposure
139
証券化エクスポージャーに関する開示事項

Capital Adequacy Requirement (Basel Accord) Pillar III (Market Discipline) Disclosure
SHINSEI BANK, LIMITED Integrated Report 2019
2019/07/10 8:14:49 / 19509947_株式会社新生銀行_総会その他(C)
QUANTITATIVE DISCLOSURE (CONSOLIDATED) (continued)
SECURITIZATION EXPOSURE IN WHICH THE BANK GROUP INVESTS(1) Amount of securitization exposure the Bank Group has by type of original asset
Excluding resecuritization exposureMillions of yen
As of March 31 2019 2018
Type of original assetsAmount ofExposure
Amount ofExposure
Residential mortgages ¥ 32,772 ¥ 21,372Consumer loans - -Commercial real estate loans 94,717 65,568Corporate loans 62,097 34,981Others 33,609 20,372Total ¥ 223,196 ¥ 142,294
※There is no resecutization exposure.
(2) Amount of securitization exposure and required capital for the Bank Group has by risk weight ratio
Excluding resecuritization exposureMillions of yen
As of March 31 2019 2018
Band of risk weight ratio AmountRequired
capital amount AmountRequired
capital amountTo 20% ¥ 61,657 ¥ 935 ¥ 79,025 ¥ 656Over 20% to 50% 7,533 236 - -Over 50% to 100% 58,460 3,215 8,314 644Over 100% to 400% 78,465 17,238 33,177 5,646Over 400% to 625% 14,400 6,998 21,776 9,750Over 625% to 1,250% 2,678 2,108 - -Total ¥ 223,196 ¥ 30,733 ¥ 142,294 ¥ 16,697
※There is no resecutization exposure.
140
証券化エクスポージャーに関する開示事項

Capital Adequacy Requirement (Basel Accord) Pillar III (Market Discipline) Disclosure
SHINSEI BANK, LIMITED Integrated Report 2019
2019/07/10 8:14:49 / 19509947_株式会社新生銀行_総会その他(C)
QUANTITATIVE DISCLOSURE (CONSOLIDATED) (continued)
(3) Amount of securitization exposure applied risk weight 1,250%Millions of yen
As of March 31 2019 2018Type of original assets Amount AmountResidential mortgages ¥ - ¥ 227Consumer loans - -Commercial real estate loans - -Corporate loans - -Others - -Total ¥ - ¥ 227
Not applicable for the following items;
• Credit risk mitigation for resecuritization exposure
SECURITIZATION EXPOSURE IN WHICH THE BANK GROUP INVESTS (MARKET RISK)
(1) Amount of securitization exposure the Bank Group has by type of original assetExcluding resecuritization exposure
Millions of yenAs of March 31 2019 2018
Type of original assetsAmount ofExposure
Amount ofExposure
Residential mortgages ¥ 2,029 ¥ 4,086Consumer loans - -Commercial real estate loans - -Corporate loans - -Others - -Total ¥ 2,029 ¥ 4,086
※There is no resecutization exposure.
(2) Amount of securitization exposure and required capital for the Bank Group has by risk weight ratioExcluding resecuritization exposure
Millions of yenAs of March 31 2019 2018
Band of risk weight ratio AmountRequired
capital amount AmountRequired
capital amountTo 1.6% ¥ 2,029 ¥ 32 ¥ 4,086 ¥ 65Over 1.6% to 4% - - - -Over 4% to 8% - - - -Over 8% to 32%% - - - -Over 32% to 50% - - - -Over 50% under 100% - - - -Total ¥ 2,029 ¥ 32 ¥ 4,086 ¥ 65
※There is no resecutization exposure.
141
証券化エクスポージャーに関する開示事項

Capital Adequacy Requirement (Basel Accord) Pillar III (Market Discipline) Disclosure
SHINSEI BANK, LIMITED Integrated Report 2019
2019/07/10 8:14:49 / 19509947_株式会社新生銀行_総会その他(C)
QUANTITATIVE DISCLOSURE (CONSOLIDATED) (continued)
Not applicable for the following items;
• Amount of securitization exposure targeted for comprehensive risk• Amount of securitization exposure applied Risk weight 1,250% under the Accord Article 302-2.2
7. MARKET RISK (UNDER INTERNAL MODEL APPROACH)
(1) VAR AT THE END OF MARCH 2019 AND MARCH 2018 AND THE HIGH, MEAN AND LOW VARMillions of yen
As of March 31 2019 2018VaR at term end ¥ 1,098 ¥ 783VaR through this term
High 1,577 1,391Mean 903 956Low 631 572
(2) STRESSED VAR AT THE END OF MARCH 2019 AND MARCH 2018 AND THE HIGH, MEAN AND LOW VARMillions of yen
As of March 31 2019 2018VaR at term end ¥ 3,879 ¥ 3,915VaR through this term
High 4,625 4,161Mean 3,338 2,869Low 2,605 1,832
The trading portfolio experienced no losses that exceeded the specified VaR threshold.Back-Testing is described in "Overview of the Group's Risk Management Sytems"
Not applicable for the following items;
• The amount of required capital related to additional risk and comprehensive risk as of the period-end, as well as the maximum, minimum and average values for the amount of required capital for additional risk and comprehensive risk during the disclosure period
8. EQUITY EXPOSURE IN BOOK
(1) BOOK VALUE AND FAIR VALUEMillions of yen
As of March 31 2019 2018Market-based approach
Listed equity exposure ¥ 6,092 ¥ 5,131Unlisted equity exposure 8,016 8,909
PD/LGD methodListed equity exposure 8,970 9,879Unlisted equity exposure 2,746 1,832
142
証券化エクスポージャーに関する開示事項、マーケット・リスクに関する開示事項、出資等又は株式等エクスポージャーに関する開示事項

Capital Adequacy Requirement (Basel Accord) Pillar III (Market Discipline) Disclosure
SHINSEI BANK, LIMITED Integrated Report 2019
2019/07/10 8:14:49 / 19509947_株式会社新生銀行_総会その他(C)
QUANTITATIVE DISCLOSURE (CONSOLIDATED) (continued)
(2) GAIN OR LOSS ON SALE OR DEPRECIATION OF EQUITY EXPOSUREMillions of yen
FY2018 FY2017Gain (loss) on sale ¥ 1,010 ¥ 8,337Loss of depreciation 1,622 656
(3) UNREALIZED GAIN OR LOSS WHICH IS RECOGNIZED ON BALANCE SHEET AND NOT RECOGNIZED ON PROFIT AND LOSS STATEMENT
Millions of yenAs of March 31 2019 2018Unrealized gain (loss) ¥ 9,593 ¥ 11,306
(4) AMOUNT FOR EACH PORTFOLIO CLASSIFICATION OF EQUITY EXPOSUREMillions of yen
As of March 31 2019 2018Market-based approach ¥ 14,109 ¥ 14,041PD/LGD Method 11,717 11,712RW100% Applied 51 51RW250% Applied 61,823 59,236
Not applicable for the following items;
• UNREALIZED GAIN OR LOSS WHICH IS NOT RECOGNIZED BOTH ON BALANCE SHEET AND ON PROFIT AND LOSS STATEMENT
9.BEFORE RIVISION EXPOSURE RELATING TO INVESTMENT FUNDSMillions of yen
As of March 31 2018Regarded exposure (fund) ¥ 52,720
10. EXPOSURE RELATING TO INVESTMENT FUNDS
The accord article 167 was amended on march 31, 2019.Describe the present disclosure based on the "notice" and "notice of disclosure" after amended.
Millions of yenAs of March 31 2019Look-through approach ¥ 4,209Mandate-based approach -Probability-based approach (250%) -Probability-based approach (400%) 43,954Fall-back approach 0Total 48,163
Note: 1."Look-through approach" requires a bank to risk weight the underlying exposures of a fund as if the exposures were held directly by the bank. 2."Mandate-based approach" is a method of conservatively estimating the asset structure based on the fund management method. 3."Probability-based approach (250%)" can be selected when each asset of fund will be highly probable that the risk weight is less than 250%. 4."Probability-based approach (400%)" can be selected when each asset of fund will be highly probable that the risk weight is more than 250% and less than 400%. 5."Fall-back approach" is requires to apply if above approaches are not feasible.
143
出資等又は株式等エクスポージャーに関する開示事項、信用リスク・アセットのみなし計算が適用されるエクスポージャーの額

Capital Adequacy Requirement (Basel Accord) Pillar III (Market Discipline) Disclosure
SHINSEI BANK, LIMITED Integrated Report 2019
2019/07/10 8:14:49 / 19509947_株式会社新生銀行_総会その他(C)
QUANTITATIVE DISCLOSURE (CONSOLIDATED) (continued)
11. INTEREST RATE RISK (IRRBB) THE INCREASE/DECREASE IN ECONOMIC VALUE FOR UPWARD/DOWNWARD RATE SHOCKS ACCORDING TO MANAGEMENT'S METHOD FOR IRRBB
Change in economic values from a 2% interest-rate shock:Billions of yen
As of March 31 2018JPY ¥ (89.8)USD (4.0)Others (12.6)Total ¥ (106.5)
12. INTEREST RATE RISK
This item has been described using the form No.11-2 of revised Accord for Disclosure from March 31, 2019,instead of the above-mentioned item "INTEREST RATE RISK (IRRBB) THE INCREASE/DECREASE IN ECONOMIC VALUE FOR UPWARD/DOWNWARD RATE SHOCKS ACCORDING TO MANAGEMENT'S METHOD FOR IRRBB".
Decrease in economic values from interest-rate shockMillions of yen
IRRBB1:Interest rate risk
NoA B C D
⊿EVE ⊿NII2019 2018 2019 2018
1 Parallel shock up 63,3972 Parallel shock down 11,6443 Steepener shock 29,0414 Flattener shock -5 Short rate up shock -6 Short rate down shock -7 Max 63,397
E F2019 2018
8 Core capital 795,301
Note:The “IRRBB1: Interest rate risk” column B, column C, column D and column F above are not described due to the transitonal arrangements of revised Accord for Disclosure .
144
金利リスクに関して連結グループが内部管理上使用した金利ショックに対する損益又は経済的価値の増減額

Capital Adequacy Requirement (Basel Accord) Pillar III (Market Discipline) Disclosure
SHINSEI BANK, LIMITED Integrated Report 2019
2019/07/10 8:14:49 / 19509947_株式会社新生銀行_総会その他(C)
QUANTITATIVE DISCLOSURE (NONCONSOLIDATED)
1. CAPITAL ADEQUACY
(1) AMOUNT OF REQUIRED CAPITAL FOR CREDIT RISKPortfolios under the Standardized Approach (SA)
Millions of yen2019 2018
As of March 31Required capital
amountRequired capital
amountShinsei Bank ¥ 370 ¥ 411
Portfolios under the Internal Ratings-Based Approach (IRB)Millions of yen
2019 2018
As of March 31Required capital
amountRequired capital
amountCorporate (Excluding Specialized Lending)1 ¥ 130,909 ¥ 131,640Specialized Lending2 90,316 76,851Sovereign 5,638 5,544Bank 13,275 8,890Residential mortgages 9,723 11,170Qualified revolving retails 46,820 59,430Other retails 1 3Equity 117,286 122,091Fund 12,173 10,673Securitization 34,523 23,534Purchase receivables 16,881 9,981Other assets 1,259 1,677CVA risk 10,451 8,795CCP risk 92 85Total ¥ 489,352 ¥ 470,372
Note: 1.“Corporate” includes “Small and Medium-sized Entities.” 2.“Specialized Lending” refers to a claim whose source of recovery is solely dependent on the cash flow generated from a transaction such as a real estate nonrecourse loan.
(2) AMOUNT OF REQUIRED CAPITAL FOR EQUITY EXPOSURE UNDER IRBMillions of yen
2019 2018
As of March 31Required capital
amountRequired capital
amountMarket-Based Approach Simplified Method ¥ 4,982 ¥ 5,016PD/LGD Method 111,191 115,995RW100% Applied 4 4RW250% Applied 1,108 1,075Total ¥ 117,286 ¥ 122,091
(3) EXPOSURE RELATING TO INVESTMENT FUNDSMillions of yen
2019 2018
As of March 31Required capital
amountRequired capital
amount Before revision Look Through ¥ 1,753Before revision Revised Naivete Majority 7,984Before revision Simplified [400%] 935Before revision Simplified [1,250%] -Look-through approach ¥ 1,265Mandated-based approach -Probability-based approach[250%] -Probability-based approach[400%] 10,908Fall-back approach[1,250%] -Total ¥ 12,173 ¥ 10,673
145
自己資本の充実度に関する開示事項

Capital Adequacy Requirement (Basel Accord) Pillar III (Market Discipline) Disclosure
SHINSEI BANK, LIMITED Integrated Report 2019
2019/07/10 8:14:49 / 19509947_株式会社新生銀行_総会その他(C)
QUANTITATIVE DISCLOSURE (NONCONSOLIDATED) (continued)
(4) AMOUNT OF REQUIRED CAPITAL FOR MARKET RISKMillions of yen
2019 2018
As of March 31Required capital
amountRequired capital
amountThe Standardized Approach ¥ 419 ¥ 193
Interest rate risk 3 35Equity position risk 3 5FX risk 411 151Securitization risk - -
The Internal Models Approach (IMA) (General Market Risk) 11,069 11,937
(5) AMOUNT OF REQUIRED CAPITAL FOR OPERATIONAL RISKMillions of yen
2019 2018
As of March 31Required capital
amountRequired capital
amountThe Standardized Approach ¥ 15,025 ¥ 15,083
(6) TOTAL REQUIRED CAPITAL (DOMESTIC STANDARD)Millions of yen
As of March 31 2019 2018Total Required Capital (Risk-weighted Assets x 4%) ¥ 235,449 ¥ 224,010
2.CREDIT RISK EXPOSURE (EXCLUDING SECURITIZATION AND EXPOSURES RELATING TO INVESTMENT FUNDS)
(1) AMOUNT OF CREDIT RISK EXPOSUREGeographic, Industries or Maturity
Millions of yen2019 2018
Amount of Credit Risk Exposure Amount of Credit Risk ExposureAs of March 31 Total Loans, etc.1 Securities2 Derivatives3 Total Loans, etc.1 Securities2 Derivatives3
Manufacturing ¥ 257,509 ¥ 240,433 ¥ 1,000 ¥ 16,075 ¥ 258,849 ¥ 243,833 ¥ 50 ¥ 14,966Agriculture - - - - - - - -Mining 490 488 - 1 528 526 - 2Construction 25,799 25,599 200 - 23,326 23,326 - -Electric power, gas, water supply 409,633 389,879 - 19,753 326,933 313,528 - 13,404Information and communication 43,832 43,831 - 1 58,464 58,460 - 3Transportation 175,268 174,997 - 270 190,116 185,700 3,699 715Wholesale and retail 125,970 112,890 100 12,980 128,159 113,852 100 14,207Finance and insurance 2,201,211 2,041,279 138,782 21,149 2,158,416 2,063,428 70,892 24,095Real estate 705,785 576,767 126,404 2,613 700,404 568,890 128,750 2,763Services 396,521 395,333 801 386 410,026 408,958 921 146Government 550,967 52,292 498,674 - 563,609 58,804 504,804 -Individuals 1,489,536 1,489,245 - 290 1,573,267 1,573,068 - 199Others 580 580 - - 656 656 - -Domestic Total 6,383,107 5,543,621 765,962 73,522 6,392,758 5,613,035 709,218 70,504Foreign 946,456 670,174 214,243 62,039 933,020 612,795 254,185 66,038Total ¥ 7,329,563 ¥ 6,213,795 ¥ 980,205 ¥ 135,562 ¥ 7,325,778 ¥ 6,225,831 ¥ 963,404 ¥ 136,542To 1 year 1,573,664 1,418,884 138,853 15,926 1,437,473 1,256,116 162,403 18,9531 to 3 years 1,373,821 1,007,281 346,485 20,054 1,353,779 1,028,546 299,623 25,6103 to 5 years 811,234 638,314 149,328 23,591 892,522 627,889 247,028 17,604Over 5 years 2,307,704 1,887,678 344,036 75,989 2,192,684 1,864,961 253,348 74,375Undated 1,263,138 1,261,636 1,501 - 1,449,319 1,448,317 1,001 -Total ¥ 7,329,563 ¥ 6,213,795 ¥ 980,205 ¥ 135,562 ¥ 7,325,778 ¥ 6,225,831 ¥ 963,404 ¥ 136,542
Note:1 Excluding purchased receivables.2 Excluding equity exposures.3 Credit equivalent amount basis.
146
自己資本の充実度に関する開示事項、信用リスクに関する開示事項

Capital Adequacy Requirement (Basel Accord) Pillar III (Market Discipline) Disclosure
SHINSEI BANK, LIMITED Integrated Report 2019
2019/07/10 8:14:49 / 19509947_株式会社新生銀行_総会その他(C)
QUANTITATIVE DISCLOSURE (NONCONSOLIDATED) (continued)
(2) AMOUNT OF DEFAULT EXPOSURE BEFORE PARTIAL WRITE-OFFGeographic, Industries
Millions of yen2019 2018
As of March 31 Default Exposure Default ExposureManufacturing ¥ 3,090 ¥ 3,150Agriculture - -Mining - -Construction - 19Electric power, gas, water supply - -Information and communication 576 264Transportation 44 50Wholesale and retail 225 1,524Finance and insurance 267 257Real estate 5,151 0Services 1,516 1,882Government - -Individuals 3,265 4,134Others - -Domestic Total 14,138 11,283Foreign 4,378 2,899Total ¥ 18,517 ¥ 14,183
(3) AMOUNT OF LOAN LOSS RESERVES (GENERAL, SPECIFIC AND COUNTRY RISK) BEFORE PARTIAL WRITE-OFFMillions of yen
2019 2018As of March 31 Start Amount Change Amount End Amount Start Amount Change Amount End AmountGeneral ¥ 24,391 ¥ (3,098) ¥ 21,292 ¥ 22,896 ¥ 1,494 ¥ 24,391Specific 6,531 667 7,198 34,709 (28,177) 6,531Country - - - 0 (0) -Total ¥ 30,922 ¥ (2,431) ¥ 28,490 ¥ 57,605 ¥ (26,683) ¥ 30,922
GeographicMillions of yen
2019 2018As of March 31 Total General Specific Country Total General Specific CountryDomestic ¥ 22,684 ¥ 17,317 ¥ 5,367 ¥ - ¥ 20,060 ¥ 14,304 ¥ 5,756 ¥ -Foreign 5,805 3,975 1,830 - 10,861 10,086 774 -Total ¥ 28,490 ¥ 21,292 ¥ 7,198 ¥ - ¥ 30,922 ¥ 24,391 ¥ 6,531 ¥ -
IndustriesMillions of yen
2019 2018As of March 31 Reserve Amount Reserve AmountManufacturing ¥ 2,483 ¥ 2,759Agriculture - -Mining 4 4Construction 75 74Electric power, gas, water supply 2,824 778Information and communication 875 370Transportation 631 2,081Wholesale and retail 975 1,985Finance and insurance 3,322 2,399Real estate 5,293 3,658Services 3,408 3,017Government - -Individuals 2,789 2,929Others 0 0Foreign 5,805 10,861Non-classified - -Total ¥ 28,490 ¥ 30,922
Note:Although the specific allowance for credit losses does not include the allowance relating to any securitization exposures and exposures relating to funds, the allowance relating to these exposures is not excluded from both the general allowance for credit losses and the allowance for loans to specific foreign borrowers, because we do not manage provisioning with respect to each asset class based on Basel III.
147
信用リスクに関する開示事項

Capital Adequacy Requirement (Basel Accord) Pillar III (Market Discipline) Disclosure
SHINSEI BANK, LIMITED Integrated Report 2019
2019/07/10 8:14:49 / 19509947_株式会社新生銀行_総会その他(C)
QUANTITATIVE DISCLOSURE (NONCONSOLIDATED) (continued)
(4) AMOUNT OF WRITE-OFFSIndustries
Millions of yenFY2018 FY2017
Amount ofwrite-off
Amount ofwrite-off
Manufacturing ¥ - ¥ 306Agriculture - -Mining - -Construction - 5Electric power, gas, water supply - -Information and communication - -Transportation - -Wholesale and retail 33 144Finance and insurance - -Real estate - -Services 11 392Government - -Individuals 74 644Others - -Foreign 215 1,864Non-classified - -Total ¥ 334 ¥ 3,357
(5) AMOUNT OF EXPOSURES UNDER SA (AFTER CREDIT RISK MITIGATION)Millions of yen
2019 2018As of March 31 Rated Unrated Rated Unrated0% ¥ - ¥ - ¥ - ¥ -10% - - - -20% - - - -35% - 3,039 - 3,21150% - - - -75% - 4,764 - 5,261100% - - - 79150% - - - -350% - - - -1,250% - - - -Total ¥ - ¥ 7,803 ¥ - ¥ 8,552
(6) SPECIALIZED LENDING EXPOSURE UNDER SLOTTING CRITERIA AND EQUITY EXPOSURE UNDER MARKET-BASED
SIMPLIFIED METHODSpecialized lending excluding high-volatility commercial real estate
Millions of yenAs of March 31 2019 2018
Risk weight ratioAmount ofExposure
Amount ofExposure
50% ¥ 224,936 ¥ 138,86270% 441,397 431,58290% 121,918 124,124115% 77,574 55,764250% 23,883 12,4410% (Default) 1,894 -Total ¥ 891,605 ¥ 762,776
Specialized lending for high-volatility commercial real estateMillions of yen
As of March 31 2019 2018
Risk weight ratioAmount ofExposure
Amount ofExposure
70% ¥ 13,151 ¥ 11,10895% 26,461 32,208120% 3,211 6,077140% 30,518 45,532250% 52,290 40,3060% (Default) 3,432 -Total ¥ 129,066 ¥ 135,233
148
信用リスクに関する開示事項

Capital Adequacy Requirement (Basel Accord) Pillar III (Market Discipline) Disclosure
SHINSEI BANK, LIMITED Integrated Report 2019
2019/07/10 8:14:49 / 19509947_株式会社新生銀行_総会その他(C)
QUANTITATIVE DISCLOSURE (NONCONSOLIDATED) (continued)
Equity exposure under Market-Based Simplified MethodMillions of yen
As of March 31 2019 2018
Risk weight ratioAmount ofExposure
Amount ofExposure
300% ¥ 5,770 ¥ 4,939400% 10,360 11,083Total ¥ 16,131 ¥ 16,023
(7) PORTFOLIOS UNDER IRB EXCLUDING THE AMOUNT OF EXPOSURES UNDER SA (AFTER CREDIT RISK MITIGATION)
• Estimated average PD, LGD, Risk Weight Ratio and Exposure at Default (EAD) (on-balance and off-balance) for Corporate, Sovereign and Bank exposure
CorporateMillions of yen (except percentages)
As of March 31 2019 2018
Credit Rating PD LGD Risk WeightEAD
(On-balance)EAD
(Off-balance) PD LGD Risk WeightEAD
(On-balance)EAD
(Off-balance)0–4 0.14% 44.84% 37.58% ¥1,653,966 ¥ 177,704 0.15% 44.87% 39.65% ¥1,575,535 ¥ 180,5535–6 1.46% 43.87% 94.68% 595,787 91,437 1.55% 43.87% 96.52% 586,414 86,6569A 9.39% 44.63% 185.33% 29,230 5,162 9.72% 44.45% 186.32% 29,650 2,308Default 100.00% 54.68% - 9,003 - 100.00% 53.87% - 9,217 535
Note: LGD is shown after credit risk mitigation
SovereignMillions of yen (except percentages)
As of March 31 2019 2018
Credit Rating PD LGD Risk WeightEAD
(On-balance)EAD
(Off-balance) PD LGD Risk WeightEAD
(On-balance)EAD
(Off-balance)0–4 0.00% 45.00% 3.27% ¥2,008,237 ¥ 2,600 0.00% 45.00% 2.85% ¥2,200,922 ¥ 5,7275–6 0.81% 45.00% 66.61% 0 - 0.56% 45.00% 55.42% 3,012 -9A - - - - - - - - - -Default 100.00% 45.00% - 10 - 100.00% 45.00% - 10 -
Note: LGD is shown after credit risk mitigation
BankMillions of yen (except percentages)
As of March 31 2019 2018
Credit Rating PD LGD Risk WeightEAD
(On-balance)EAD
(Off-balance) PD LGD Risk WeightEAD
(On-balance)EAD
(Off-balance)0–4 0.07% 44.97% 39.34% ¥ 115,399 ¥ 84,766 0.08% 44.97% 36.55% ¥ 119,936 ¥ 92,6535–6 0.95% 45.00% 108.26% 20,140 2,391 0.73% 45.00% 83.60% 21,976 4,7459A 9.39% 13.46% 51.32% 53,662 21,825 9.72% 45.00% 182.11% 1,201 -Default 100.00% 45.00% - 267 - - - - - -
Note: LGD is shown after credit risk mitigation
• Estimated average PD, risk weight ratio and amount of exposure for equity exposure under PD/LGD methodMillions of yen (except percentages)
As of March 31 2019 2018Credit Rating PD LGD Risk Weight Amount PD LGD Risk Weight Amount0–4 0.19% 90.00% 300.60% ¥ 369,581 0.22% 90.00% 301.10% ¥ 370,1025–6 1.06% 90.00% 325.73% 8,514 0.70% 90.00% 305.77% 25,7669A 9.39% 90.00% 870.26% 19,819 9.72% 90.00% 881.32% 19,819Default 100.00% 90.00% 1,125.00% 0 100.00% 90.00% 1,125.00% 0
• Estimated average PD, LGD, risk weight ratio, Exposure at Default (EAD) (on- and off-balance), amount of undrawn commitments and estimated average Credit Conversion Factors (CCF) of undrawn commitments for residential mortgage exposure, qualified revolving retail exposure and other retail exposure
149
信用リスクに関する開示事項

Capital Adequacy Requirement (Basel Accord) Pillar III (Market Discipline) Disclosure
SHINSEI BANK, LIMITED Integrated Report 2019
2019/07/10 8:14:49 / 19509947_株式会社新生銀行_総会その他(C)
QUANTITATIVE DISCLOSURE (NONCONSOLIDATED) (continued)
Residential mortgage exposureMillions of yen (except percentages)
As of March 31 2019 2018
Pool PD LGDRisk
WeightEAD
(On-balance)EAD
(Off-balance)UndrawnAmount
CommitmentCCF PD LGD
RiskWeight
EAD(On-balance)
EAD(Off-balance)
UndrawnAmount
CommitmentCCF
Normal 0.22% 16.07% 7.41% ¥ 1,184,604 ¥ - ¥ - - 0.25% 16.28% 8.10% ¥ 1,262,621 ¥ - ¥ - -Need caution 64.08% 19.49% 76.40% 2,084 - - - 65.16% 19.28% 73.68% 1,960 - - -Default 100.00% 40.07% 49.88% 3,117 - - - 100.00% 38.87% 49.14% 3,533 - - -
Note: LGD is shown after credit risk mitigation
Qualified revolving retail exposureMillions of yen (except percentages)
As of March 31 2019 2018
Pool PD LGDRisk
WeightEAD
(On-balance)EAD
(Off-balance)UndrawnAmount
CommitmentCCF PD LGD
RiskWeight
EAD(On-balance)
EAD(Off-balance)
UndrawnAmount
CommitmentCCF
Normal 7.63% 83.10% 115.58% ¥ 264,597 ¥ 18,777 ¥ 459,903 4.08% 8.82% 86.30% 129.63% ¥ 287,364 ¥ 24,424 ¥ 487,184 5.01%Need caution 85.85% 83.10% 103.22% 1,149 37 1,213 3.08% 86.53% 86.30% 102.83% 1,477 48 1,560 3.12%Default 100.00% 83.10% - 125 - - - 100.00% 86.30% - 147 - - -
Note: LGD is shown after credit risk mitigation
Other retail exposureMillions of yen (except percentages)
As of March 31 2019 2018
Pool PD LGDRisk
WeightEAD
(On-balance)EAD
(Off-balance)UndrawnAmount
CommitmentCCF PD LGD
RiskWeight
EAD(On-balance)
EAD(Off-balance)
UndrawnAmount
CommitmentCCF
Normal 0.27% 15.11% 7.51% ¥ 224 ¥ - ¥ - - 0.45% 17.13% 11.56% ¥ 338 ¥ - ¥ - -Need caution - - - - - - - - - - - - - -Default - - - - - - - - - - - - - -
Note: LGD is shown after credit risk mitigation
(8) COMPARATIVE RESULTS OF ACTUAL LOSSES AND EXPECTED LOSSES FOR THE LAST THREE YEARS UNDER F-IRB APPROACH
CorporateMillions of yen
FY2018 FY2017 FY2016Results of actual losses (a) ¥ 1,454 ¥ 1,080 ¥ 2,812Expected losses (b) 6,822 6,893 6,797Differences ((b) - (a)) 5,368 5,813 3,985
SovereignMillions of yen
FY2018 FY2017 FY2016Results of actual losses (a) ¥ - ¥ - ¥ -Expected losses (b) 28 34 26Differences ((b) - (a)) 28 34 26
BankMillions of yen
FY2018 FY2017 FY2016Results of actual losses (a) ¥ 70 ¥ - ¥ -Expected losses (b) 117 219 86Differences ((b) - (a)) 47 219 86
Residential mortgage exposureMillions of yen
FY2018 FY2017 FY2016Results of actual losses (a) ¥ 154 ¥ 299 ¥ 230Expected losses (b) 847 1,089 976Differences ((b) - (a)) 693 790 746
150
信用リスクに関する開示事項
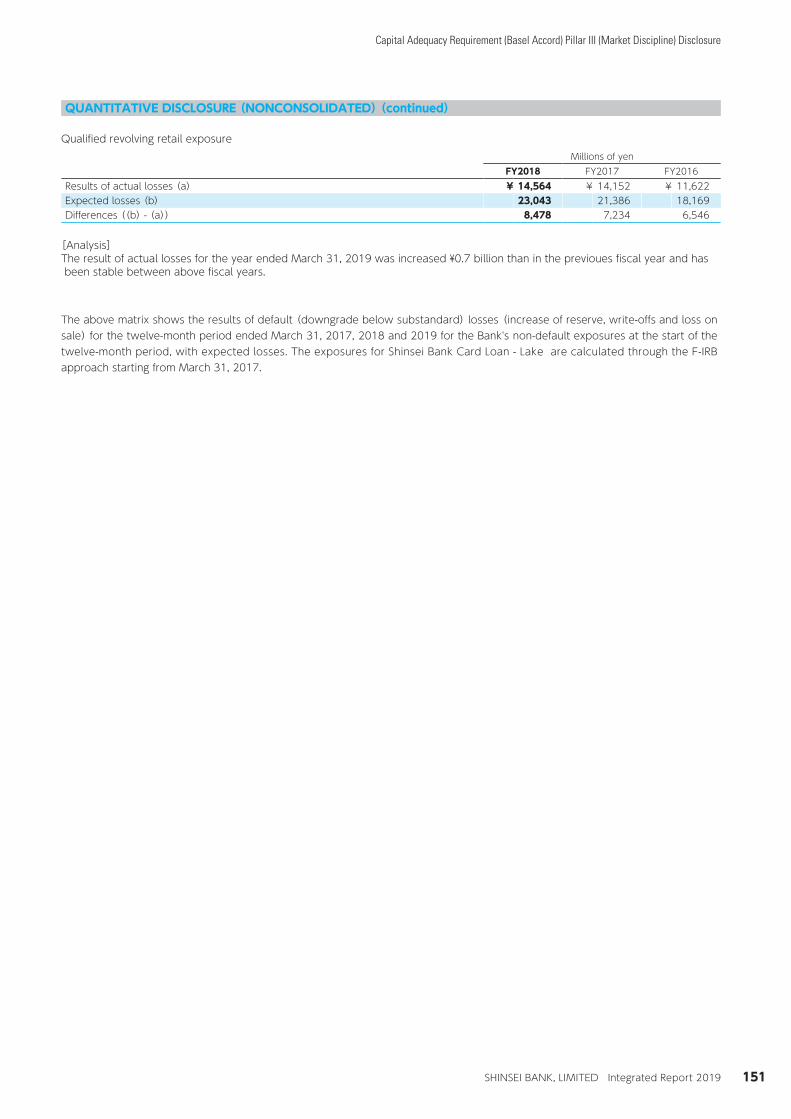
Capital Adequacy Requirement (Basel Accord) Pillar III (Market Discipline) Disclosure
SHINSEI BANK, LIMITED Integrated Report 2019
2019/07/10 8:14:49 / 19509947_株式会社新生銀行_総会その他(C)
QUANTITATIVE DISCLOSURE (NONCONSOLIDATED) (continued)
Qualified revolving retail exposureMillions of yen
FY2018 FY2017 FY2016Results of actual losses (a) ¥ 14,564 ¥ 14,152 ¥ 11,622Expected losses (b) 23,043 21,386 18,169Differences ((b) - (a)) 8,478 7,234 6,546
[Analysis]The result of actual losses for the year ended March 31, 2019 was increased ¥0.7 billion than in the previoues fiscal year and has been stable between above fiscal years.
The above matrix shows the results of default (downgrade below substandard) losses (increase of reserve, write-offs and loss on sale) for the twelve-month period ended March 31, 2017, 2018 and 2019 for the Bank's non-default exposures at the start of the twelve-month period, with expected losses. The exposures for Shinsei Bank Card Loan - Lake are calculated through the F-IRB approach starting from March 31, 2017.
151
信用リスクに関する開示事項
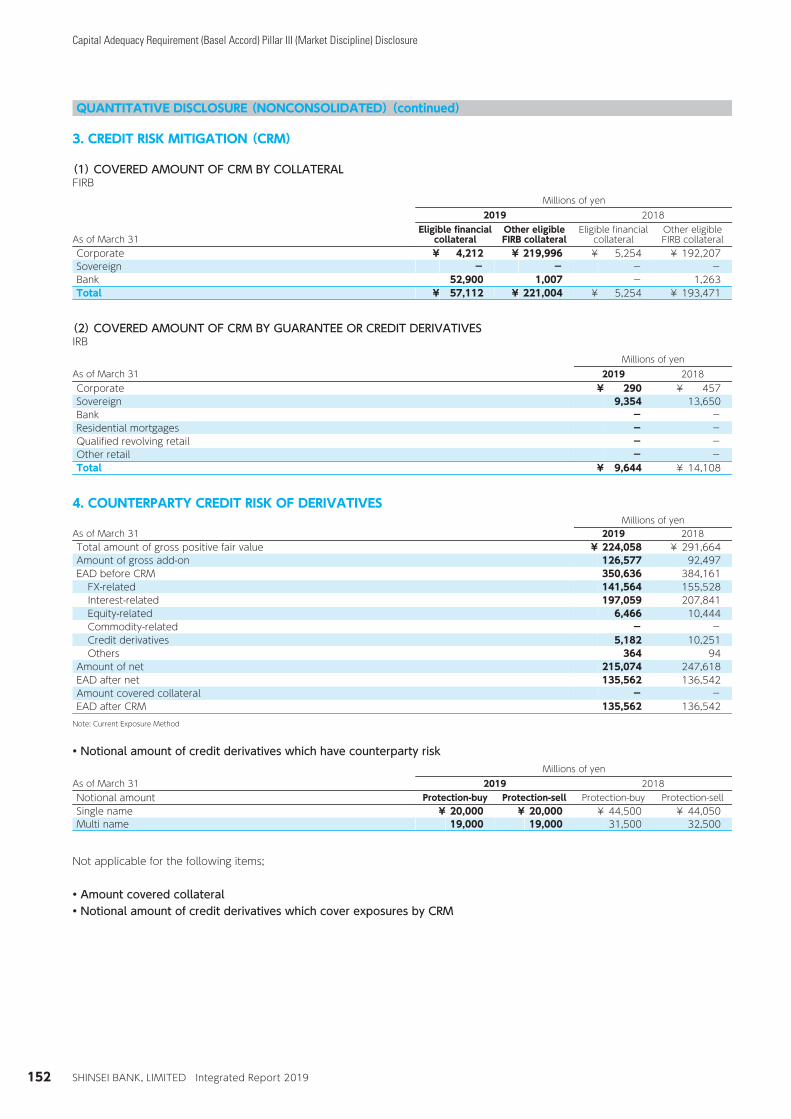
Capital Adequacy Requirement (Basel Accord) Pillar III (Market Discipline) Disclosure
SHINSEI BANK, LIMITED Integrated Report 2019
2019/07/10 8:14:49 / 19509947_株式会社新生銀行_総会その他(C)
QUANTITATIVE DISCLOSURE (NONCONSOLIDATED) (continued)
3. CREDIT RISK MITIGATION (CRM)
(1) COVERED AMOUNT OF CRM BY COLLATERALFIRB
Millions of yen2019 2018
As of March 31Eligible financial
collateralOther eligibleFIRB collateral
Eligible financialcollateral
Other eligibleFIRB collateral
Corporate ¥ 4,212 ¥ 219,996 ¥ 5,254 ¥ 192,207Sovereign - - - -Bank 52,900 1,007 - 1,263Total ¥ 57,112 ¥ 221,004 ¥ 5,254 ¥ 193,471
(2) COVERED AMOUNT OF CRM BY GUARANTEE OR CREDIT DERIVATIVESIRB
Millions of yenAs of March 31 2019 2018Corporate ¥ 290 ¥ 457Sovereign 9,354 13,650Bank - -Residential mortgages - -Qualified revolving retail - -Other retail - -Total ¥ 9,644 ¥ 14,108
4. COUNTERPARTY CREDIT RISK OF DERIVATIVESMillions of yen
As of March 31 2019 2018Total amount of gross positive fair value ¥ 224,058 ¥ 291,664Amount of gross add-on 126,577 92,497EAD before CRM 350,636 384,161
FX-related 141,564 155,528Interest-related 197,059 207,841Equity-related 6,466 10,444Commodity-related - -Credit derivatives 5,182 10,251Others 364 94
Amount of net 215,074 247,618EAD after net 135,562 136,542Amount covered collateral - -EAD after CRM 135,562 136,542
Note: Current Exposure Method
• Notional amount of credit derivatives which have counterparty riskMillions of yen
As of March 31 2019 2018Notional amount Protection-buy Protection-sell Protection-buy Protection-sellSingle name ¥ 20,000 ¥ 20,000 ¥ 44,500 ¥ 44,050Multi name 19,000 19,000 31,500 32,500
Not applicable for the following items;
• Amount covered collateral• Notional amount of credit derivatives which cover exposures by CRM
152
信用リスク削減手法に関する開示事項、派生商品取引の取引相手のリスクに関する開示事項

Capital Adequacy Requirement (Basel Accord) Pillar III (Market Discipline) Disclosure
SHINSEI BANK, LIMITED Integrated Report 2019
2019/07/10 8:14:49 / 19509947_株式会社新生銀行_総会その他(C)
QUANTITATIVE DISCLOSURE (NONCONSOLIDATED) (continued)
5. SECURITIZATION
The amout of securitization exposure and required capital as of March 31, 2019 is calculated based on 「Accord」 amended on March 31, 2019.
SECURITIZATION EXPOSURE ORIGINATED BY THE BANK (CREDIT RISK)(1) Amount of original assetsSecuritization by transfer of assets
Millions of yenAs of March 31 2019 2018
Type of original assetsAmount of
original assetsAmount of
original assetsResidential mortgages ¥ - ¥ 5,270Consumer loans - -Commercial real estate loans - -Corporate loans - -Others - 116,327Total ¥ - ¥ 121,597
Note: Includes originally securitized assets originated by the Bank during the period, even though the Bank had no exposure to these particular assets.
(2) Amount of original assets in default or past due 3 months or moreSecuritization by transfer of assets
Millions of yenAs of March 31 2019 2018Type of original assets Amount of Default Amount of DefaultResidential mortgages ¥ - ¥ 176Consumer loans - -Commercial real estate loans - -Corporate loans - -Others - -Total ¥ - ¥ 176
Note: Includes originally securitized assets originated by the Bank during the period, even though the Bank had no exposure to these particular assets.
(3) Amount of securitization exposure the Bank has by type of original assetsSecuritization by transfer of assetsExcluding resecuritization
Millions of yenAs of March 31 2019 2018
Type of original assetsAmount ofExposure
Amount ofExposure
Residential mortgages ¥ - ¥ -Consumer loans - -Commercial real estate loans - -Corporate loans - -Others - 100,000Total ¥ - ¥ 100,000
※There is no resecuritization exposure.
153
証券化エクスポージャーに関する開示事項

Capital Adequacy Requirement (Basel Accord) Pillar III (Market Discipline) Disclosure
SHINSEI BANK, LIMITED Integrated Report 2019
2019/07/10 8:14:49 / 19509947_株式会社新生銀行_総会その他(C)
QUANTITATIVE DISCLOSURE (NONCONSOLIDATED) (continued)
(4) Amount of securitization exposure and required capital the Bank has by risk weight ratioSecuritization by transfer of assetsExcluding resecuritization exposure
Millions of yenAs of March 31 2019 2018
Band of risk weight ratio AmountRequired
capital amount AmountRequired
capital amountTo 20% ¥ - ¥ - ¥ 100,000 ¥ 593Over 20% to 50% - - - -Over 50% to 100% - - - -Over 100% to 400% - - - -Over 400% to 625% - - - -Over 625% under 1,250% - - - -Total ¥ - ¥ - ¥ 100,000 ¥ 593
※There is no resecuritization exposure.
(5) Amount of increase of capital by securitization (to be deducted from capital)Millions of yen
As of March 31 2019 2018Type of original assets Amount AmountResidential mortgages ¥ - ¥ 5,370Consumer loans - -Commercial real estate loans - -Corporate loans - -Others - -Total ¥ - ¥ 5,370
(6) Amount of securitization exposure applied risk weight 1,250%Millions of yen
As of March 31 2019 2018Type of original assets Amount AmountResidential mortgages ¥ - ¥ 40Consumer loans - -Commercial real estate loans - -Corporate loans - -Others - -Total ¥ - ¥ 40
Not applicable for the following items;
• Amount of assets held for securitization trade• Summary of current year's securitization activities• Amount of recognized gain/loss by original asset type during the period.• Securitization exposure subject to early amortization• Credit risk mitigation for resecuritization exposure
154
証券化エクスポージャーに関する開示事項

Capital Adequacy Requirement (Basel Accord) Pillar III (Market Discipline) Disclosure
SHINSEI BANK, LIMITED Integrated Report 2019
2019/07/10 8:14:49 / 19509947_株式会社新生銀行_総会その他(C)
QUANTITATIVE DISCLOSURE (NONCONSOLIDATED) (continued)
SECURITIZATION EXPOSURE IN WHICH THE BANK INVESTS(1) Amount of securitization exposure the Bank has by type of original asset
Excluding resecuritization exposureMillions of yen
As of March 31 2019 2018
Type of original assetsAmount ofExposure
Amount ofExposure
Residential mortgages ¥ 32,772 ¥ 21,372Consumer loans - -Commercial real estate loans 94,717 65,568Corporate loans 62,097 34,981Others 272,569 98,130Total ¥ 462,156 ¥ 220,052
※There is no resecuritization exposure.
(2) Amount of securitization exposure and required capital for the Bank by risk weight ratio
Excluding resecuritization exposureMillions of yen
As of March 31 2019 2018
Band of risk weight ratio AmountRequired
capital amount AmountRequired
capital amountTo 20% ¥ 273,617 ¥ 3,645 ¥ 156,783 ¥ 1,245Over 20% to 50% 34,533 1,316 - -Over 50% to 100% 58,460 3,215 8,314 644Over 100% to 400% 78,465 17,238 33,177 5,646Over 400% to 625% 14,400 6,998 21,776 9,750Over 625% under 1,250% 2,678 2,108 - -Total ¥ 462,156 ¥ 34,523 ¥ 220,052 ¥ 17,286
※There is no resecuritization exposure.
155
証券化エクスポージャーに関する開示事項

Capital Adequacy Requirement (Basel Accord) Pillar III (Market Discipline) Disclosure
SHINSEI BANK, LIMITED Integrated Report 2019
2019/07/10 8:14:49 / 19509947_株式会社新生銀行_総会その他(C)
QUANTITATIVE DISCLOSURE (NONCONSOLIDATED) (continued)
(3) Amount of securitization exposure applied risk weight 1,250%Millions of yen
As of March 31 2019 2018Type of original assets Amount AmountResidential mortgages ¥ - ¥ 227Consumer loans - -Commercial real estate loans - -Corporate loans - -Others - -Total ¥ - ¥ 227
Not applicable for the following items;
• Credit risk mitigation for resecuritization exposure
6. MARKET RISK (UNDER INTERNAL MODEL APPROACH)
(1) VAR AT THE END OF MARCH 2019 AND MARCH 2018 AND THE HIGH, MEAN AND LOW VARMillions of yen
As of March 31 2019 2018VaR at term end ¥ 1,040 ¥ 740VaR through this term
High 1,527 1,353Mean 854 917Low 570 540
(2) STRESSED VAR AT THE END OF MARCH 2019 AND MARCH 2018 AND THE HIGH, MEAN AND LOW VARMillions of yen
As of March 31 2019 2018VaR at term end ¥ 3,692 ¥ 3,690VaR through this term
High 4,497 4,017Mean 3,163 2,728Low 2,350 1,755
The trading portfolio experienced no losses that exceeded the specified VaR thresholdBack-Testing is described in "Overview of the Group's Risk Management Sytems".
Not applicable for the following items;
• The amount of required capital related to additional risk and comprehensive risk as of the period-end, as well as the maximum, minimum and average values for the amount of required capital for additional risk and comprehensive risk during the disclosure period
156
証券化エクスポージャーに関する開示事項、マーケット・リスクに関する開示事項

Capital Adequacy Requirement (Basel Accord) Pillar III (Market Discipline) Disclosure
SHINSEI BANK, LIMITED Integrated Report 2019
2019/07/10 8:14:49 / 19509947_株式会社新生銀行_総会その他(C)
QUANTITATIVE DISCLOSURE (NONCONSOLIDATED) (continued)
7. EQUITY EXPOSURE IN BOOK
(1) BOOK VALUE AND FAIR VALUEMillions of yen
As of March 31 2019 2018Market-based approach
Listed equity exposure ¥ 5,770 ¥ 4,939Unlisted equity exposure 10,360 11,083
PD/LGD methodListed equity exposure 7,745 8,529Unlisted equity exposure 390,171 407,160
(2) GAIN OR LOSS ON SALE OR DEPRECIATION OF EQUITY EXPOSUREMillions of yen
FY2018 FY2017Gain (loss) on sale ¥ 998 ¥ 4,535Loss of depreciation 386 164
(3) UNREALIZED GAIN OR LOSS WHICH IS RECOGNIZED ON BALANCE SHEET AND NOT RECOGNIZED ON PROFIT AND LOSS STATEMENT
Millions of yenAs of March 31 2019 2018Unrealized gain (loss) ¥ 6,451 ¥ 9,464
(4) AMOUNT FOR EACH PORTFOLIO CLASSIFICATION OF EQUITY EXPOSUREMillions of yen
As of March 31 2019 2018Market-based approach ¥ 16,131 ¥ 16,023PD/LGD Method 397,916 415,690RW100% Applied 51 51RW250% Applied 5,228 5,074
Not applicable for the following items;
• UNREALIZED GAIN OR LOSS WHICH IS NOT RECOGNIZED BOTH ON BALANCE SHEET AND ON PROFIT AND LOSS STATEMENT
8. BEFORE RIVISION EXPOSURE RELATING TO INVESTMENT FUNDSMillions of yen
As of March 31 2018Regarded exposure (fund) ¥ 34,500
157
出資等又は株式等エクスポージャーに関する開示事項、信用リスク・アセットのみなし計算が適用されるエクスポージャーの額

Capital Adequacy Requirement (Basel Accord) Pillar III (Market Discipline) Disclosure
SHINSEI BANK, LIMITED Integrated Report 2019
2019/07/10 8:14:49 / 19509947_株式会社新生銀行_総会その他(C)
QUANTITATIVE DISCLOSURE (NONCONSOLIDATED) (continued)
9. EXPOSURE RELATING TO INVESTMENT FUNDS
The accord article 167 was amended on march 31, 2019.Describe the present disclosure based on the "notice" and "notice of disclosure" after amended.
Millions of yenAs of March 31 2019Look-through approach ¥ 3,743Mandate-based approach -Probability-based approach (250%) -Probability-based approach (400%) 32,159Fall-back approach -Total ¥ 35,902
Note: 1."Look-through approach" requires a bank to risk weight the underlying exposures of a fund as if the exposures were held directly by the bank. 2."Mandate-based approach" is a method of conservatively estimating the asset structure based on the fund management method. 3."Probability-based approach (250%)" can be selected when each asset of fund will be highly probable that the risk weight is less than 250%. 4."Probability-based approach (400%)" can be selected when each asset of fund will be highly probable that the risk weight is more than 250% and less than 400%. 5."Fall-back approach" is requires to apply if above approaches are not feasible.
10. INTEREST RATE RISK (IRRBB) THE INCREASE/DECREASE IN ECONOMIC VALUE FOR UPWARD/DOWNWARD RATE SHOCKS ACCORDING TO MANAGEMENT'S METHOD FOR IRRBB
Change in economic values from a 2% interest-rate shock:Billions of yen
As of March 31 2018JPY ¥ (65.9)USD (4.0)Others (12.6)Total ¥ (82.6)
11. INTEREST RATE RISK
This item has been described using the form No.11-2 of revised Accord for Disclosure from March 31, 2019,instead of the above-mentioned item "INTEREST RATE RISK (IRRBB) THE INCREASE/DECREASE IN ECONOMIC VALUE FOR UPWARD/DOWNWARD RATE SHOCKS ACCORDING TO MANAGEMENT'S METHOD FOR IRRBB".
Decrease in economic values from interest-rate shockMillions of yen
IRRBB1:Interest rate risk
NoA B C D
⊿EVE ⊿NII2019 2018 2019 2018
1 Parallel shock up 38,4692 Parallel shock down 34,8023 Steepener shock 21,5704 Flattener shock -5 Short rate up shock -6 Short rate down shock -7 Max 38,469
E F2019 2018
8 Core capital 808,647
Note:The “IRRBB1: Interest rate risk” column B, column C, column D and column F above are not described due tothe transitonal arrangements of revised Accord for Disclosure .
158
信用リスク・アセットのみなし計算が適用されるエクスポージャーの額、金利リスクに関して当行が内部管理上使用した金利ショックに対する損益又は経済的価値の増減額

Disclosure Items Concerning Remuneration, etc.
SHINSEI BANK, LIMITED Integrated Report 2019
2019/07/10 8:14:49 / 19509947_株式会社新生銀行_総会その他(C)
DISCLOSURE ITEMS CONCERNING REMUNERATION, ETC.
1. ORGANIZAT IONAL STRUCTURE REGARDING REMUNERATION, ETC. FOR APPLICABLE OFFICERS AND EMPLOYEES OF SHINSEI BANK (GROUP)
(1) Scope of “Applicable Officers and Employees”The scope of “Applicable Officers” and “Applicable Employees, etc.” (collectively, “Applicable Officers and Employees”) prescr ibed in the announcement on remuneration subject to disclosure is as shown below.
1) “Applicable Officers”Applicable Officers refer to the Directors and Audit & Supervisory Board Members of Shinsei Bank, excluding outside Directors and outside Audit & Supervisory Board Members.
2) “Applicable Employees, etc.”At Shinsei Bank, “Applicable Employees, etc.” who are subject to disclosure refer to the “persons who receive a high level of remuneration, etc.” and who have a material impact on business operations or the situation of assets of Shinsei Bank and its major consolidated subsidiaries, etc. among the officers and employees of Shinsei Bank and officers and employees of its major consolidated subsidiaries, etc., excluding Applicable Officers. There are no officers or employees of Shinsei Bank or officers or employees of its major consolidated subsidiaries, etc., excluding Applicable Officers, who fall under the definition of “Applicable Employees, etc.”
(a) Scope of “major consolidated subsidiaries, etc.”Major consolidated subsidiaries etc. refer to the subsidiaries that are independently mentioned in the business report and consolidated financial statements and which are important for the operations of the Shinsei Bank Group, taking into account the significance of their impact on the financial conditions and business results of the Shinsei Bank Group. More specifically, they refer to the following seven companies. While there are three consolidated subsidiaries, etc. with total assets accounting for 2% or more of consolidated total asset, all of those three companies are included in the following seven companies.
APLUS FINANCIAL Co., Ltd.Showa Leasing Co., Ltd.Shinsei Personal Loan Co., Ltd.Shinsei Financial Co., Ltd.Shinsei Trust & Banking Co., Ltd.Shinsei Securities Co., Ltd.Shinsei Investment & Finance Limited
(b) Scope of the “persons who receive a high level of remuneration, etc.”The “pe rsons who rece i ve a h i gh l eve l o f remuneration, etc.” refer to the persons who receive remuneration, etc. at the amount equal to or above the “average amount of remuneration paid to Applicable Officers (which was 45 million yen in the f iscal year reported) . ” In the f iscal year reported, there was no Applicable Employee who received remuneration at the amount equal to or above the “average amount of remuneration paid to Applicable Officers.” With respect to lump-sum retirement allowances, the amount calculated by deducting from the amount of remuneration etc. the entire amount of the lump-sum retirement allowance and then adding the “amount obtained by dividing the lump-sum retirement allowance by the number of years of service” shall be deemed as the amount of remuneration, etc. for the relevant person in judging whether the said person is within the scope of “persons who receive a high level of remuneration, etc.”
(c) Scope of the “persons who have a material impact on business operation or the situation of assets of the Shinsei Bank Group”The “persons who have a material impact on business operation or the situation of assets of the Shinsei Bank Group” refer to the persons who, in their normal duties, execute transactions and manage matters which have a significant degree of impact on the business operations of Shinsei Bank, Shinsei Bank Group, and its major consolidated subsidiaries, etc. or who have a material impact on the situation of assets through losses incurred in transactions, etc. More specifically, these include the Executive Officers and persons in similar positions at Shinsei Bank, and Directors, Executive Officers, etc. of its major consolidated subsidiaries.
(2) Names, compositions, and duties of the Committee and other major bodies , etc . superv is ing the determination of remuneration, etc. for Applicable Officers and Employees, the payment of remuneration, etc . , and other business execut ion related to remuneration, etc.
159
報酬等に関する開示事項

Disclosure Items Concerning Remuneration, etc.
SHINSEI BANK, LIMITED Integrated Report 2019
2019/07/10 8:14:49 / 19509947_株式会社新生銀行_総会その他(C)
DISCLOSURE ITEMS CONCERNING REMUNERATION, ETC. (CONTINUED)
1) Es tab l i sh ing and secur ing the Compensat ion Committee, etc.In March 2019, Shinsei Bank has established the Nomination and Compensation Committee, an optional body, to discuss and respond to the Board concerning agenda items for the general meeting of shareholders related to the election/dismissal of Directors, matters related to the election/dismissal of the President and CEO, and matters related to remuneration of Directors, based on a request from the Board of Directors. The Nominat ion and Compensat ion Commit tee i s composed of outside directors only. Even before the establishment of the Nomination and Compensation Committee, the majority of the Bank’s Board of Directors is presently composed of outside directors (five of the seven directors are outside directors), ensuring objective and transparent discussions for appointment of candidates for directors and decisions on the directors’ remuneration system and their specific remuneration levels. The allocation to each individual of the remuneration of Directors approved at the General Meeting of Shareholders is left to the discretion of the Board of Directors. The allocation to each individual of the remuneration for Audit & Supervisory Board Members is left to the consultations among Audit & Supervisory Board Members within the total amount of remuneration approved at the General Meeting of Shareholders.
2) Total amount of remuneration, etc. paid to the members of the Compensation Committee, etc. and the number of the meet ings of the Compensat ion Committee, etc. held
Number of meetings held(April 2018 to March 2019)
Total amount of remuneration, etc.
Board of Directors 3 -Audit & Supervisory Board 1 -(Notes)1. The number of meetings held represents the number of meetings which discussed
remuneration-related items.2. The total amount of remuneration, etc. is not indicated because the portion
equivalent to consideration for business execution by the Compensation Committee, etc. cannot be calculated separately.
2. EVALUATION OF THE APPROPRIATENESS OF THE DESIGN AND APPLICATION OF THE SYSTEM RELATED TO REMUNERATION, ETC. FOR APPLICABLE OFFICERS AND EMPLOYEES OF SHINSEI BANK (GROUP)
(1) Policy on remuneration, etc. for Applicable Officers and Applicable Employees, etc.
Policy on remuneration, etc. for “Applicable Officers”The General Meeting of Shareholders determines the total maximum amount of remuneration paid to its officers (for Directors: up to 180 million yen a year (of this amount, 60 million yen is for outside directors and the amount the restricted stock remuneration is up to 20 mil l ion yen) ; for Audit & Supervisory Board Members: up to 60 million yen a year) and separately from this maximum remuneration the total maximum amount of the Subscription Warrants to be allotted as equity remuneration type stock options (for Full-Time Directors: up to 50 million yen a year). Remuneration for Applicable Officers of Shinsei Bank is determined at the Board of Directors attended by five outside Directors, Audit & Supervisory Board Members (Full-T ime) , and two outs ide Aud i t & Superv i so ry BoardMembers, based on an appropriate evaluation of the responsibilities, and contributions to the Bank's
performance, of each officer in his/her duties and sufficient discussions taking into account the Bank's business results, market standards, etc.
In 2018, the Bank implemented a restricted stock compensation plan targeting the Bank’s full-time Directors, for giving the Directors an incentive to achieve sustained improvement of the corporate value of the Bank and of sharing more of that value with our shareholders, in addition to equity remuneration type stock options introduced in 2016.
(2) Explanation on the categories of persons included in Applicable Officers and Employees and the number of persons by categoryThe definitions of “Applicable Officers” and “Applicable Employees, etc.” are as indicated in 1. (1). There are four “Applicable Officers” and there are no persons who fall under the definition of “Applicable Employees, etc.”
3. C O N S I S T E N C Y B E T W E E N T H E S Y S T E M F O R REMUNERATION, ETC. OF APPLICABLE OFFICERS AND EMPLOYEES OF SHINSEI BANK (GROUP) AND RISK MANAGEMENT AND THE L INKAGE BETWEEN REMUNERATION, ETC. OF APPLICABLE OFFICERS AND EMPLOYEES OF SHINSEI BANK (GROUP) AND BUSINESS RESULTS
When determining remuneration, etc. of Applicable Officers, the total amounts of remuneration payable to Directors and Audit & Supervisory Board Members are each determined at the General Meeting of Shareholders, while the amount of remuneration, etc. payable to each Director and Audit & Supervisory Board Member is determined at the Board of Directors or through consultations among Audit & Supervisory Board Members, respectively.
Moreover, the performance-l inked remuneration accounts for a very small percentage of the amount of remuneration, etc. for Applicable Officers, and we have not adopted a remuneration system which may have a negative impact on risk management. The compensation of full-time Directors is comprised of the following three elements: fixed compensation, Equity Remuneration Type Stock Options and restricted stock.
<Types of remuneration, etc. placing emphasis on creating corporate value from a longer perspective in accordance with the duties and operations of Applicable Officers and Employees, and remuneration, etc. payment method taking into account the period until risk is materialized>
The Shinsei Bank Group has adopted equity remuneration-type stock options in order to share the r isk and advantage of share price fluctuations with shareholders and enhance motivation to contribute to medium- and long-term performance and share price increases. The exercise periods are as follows. The stock option contract stipulates that exercise shall be deferred to the resignation of the Bank’s Director even during the exercise period.
Exercise periodShinsei Bank, Ltd.
1st Warrant May 27, 2016 to May 26, 2046
Shinsei Bank, Ltd.2nd Warrant May 26, 2017 to May 25, 2047
Shinsei Bank, Ltd.3rd Warrant May 29, 2018 to May 28, 2048
160
報酬等に関する開示事項
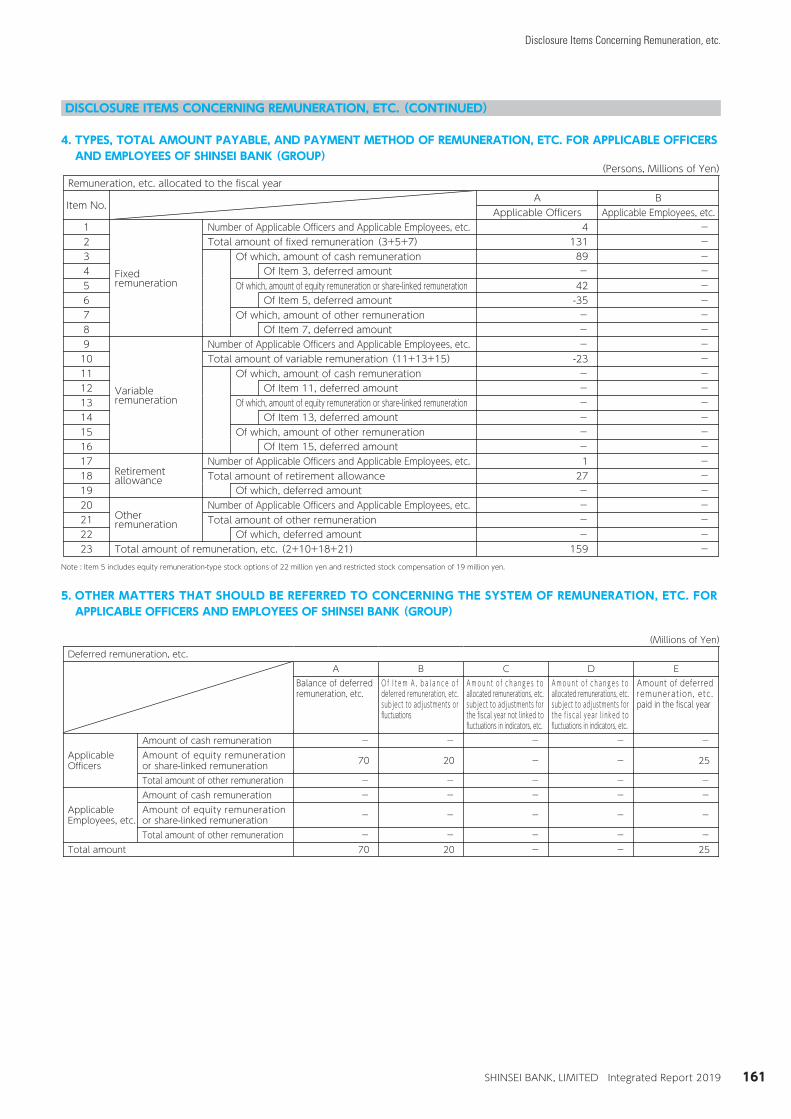
Disclosure Items Concerning Remuneration, etc.
SHINSEI BANK, LIMITED Integrated Report 2019
2019/07/10 8:14:49 / 19509947_株式会社新生銀行_総会その他(C)
DISCLOSURE ITEMS CONCERNING REMUNERATION, ETC. (CONTINUED)
4. TYPES, TOTAL AMOUNT PAYABLE, AND PAYMENT METHOD OF REMUNERATION, ETC. FOR APPLICABLE OFFICERS AND EMPLOYEES OF SHINSEI BANK (GROUP)
(Persons, Millions of Yen)Remuneration, etc. allocated to the fiscal year
Item No.A B
Applicable Officers Applicable Employees, etc.1
Fixedremuneration
Number of Applicable Officers and Applicable Employees, etc. 4 -2 Total amount of fixed remuneration (3+5+7) 131 -3 Of which, amount of cash remuneration 89 -4 Of Item 3, deferred amount - -5 Of which, amount of equity remuneration or share-linked remuneration 42 -6 Of Item 5, deferred amount -35 -7 Of which, amount of other remuneration - -8 Of Item 7, deferred amount - -9
Variableremuneration
Number of Applicable Officers and Applicable Employees, etc. - -10 Total amount of variable remuneration (11+13+15) -23 -11 Of which, amount of cash remuneration - -12 Of Item 11, deferred amount - -13 Of which, amount of equity remuneration or share-linked remuneration - -14 Of Item 13, deferred amount - -15 Of which, amount of other remuneration - -16 Of Item 15, deferred amount - -17
Retirementallowance
Number of Applicable Officers and Applicable Employees, etc. 1 -18 Total amount of retirement allowance 27 -19 Of which, deferred amount - -20
Otherremuneration
Number of Applicable Officers and Applicable Employees, etc. - -21 Total amount of other remuneration - -22 Of which, deferred amount - -23 Total amount of remuneration, etc. (2+10+18+21) 159 -
Note : Item 5 includes equity remuneration-type stock options of 22 million yen and restricted stock compensation of 19 million yen.
5. OTHER MATTERS THAT SHOULD BE REFERRED TO CONCERNING THE SYSTEM OF REMUNERATION, ETC. FOR APPLICABLE OFFICERS AND EMPLOYEES OF SHINSEI BANK (GROUP)
(Millions of Yen)Deferred remuneration, etc.
A B C D EBalance of deferred remuneration, etc.
O f I t e m A , b a l a n c e o f deferred remuneration, etc. subject to adjustments or fluctuations
A m o u n t o f c h a n g e s t o allocated remunerations, etc. subject to adjustments for the fiscal year not linked to fluctuations in indicators, etc.
A m o u n t o f c h a n g e s t o allocated remunerations, etc. subject to adjustments for t he f i s ca l yea r l i nked to fluctuations in indicators, etc.
Amount of deferred remunerat ion, etc. paid in the fiscal year
ApplicableOfficers
Amount of cash remuneration - - - - -Amount of equity remuneration or share-linked remuneration 70 20 - - 25
Total amount of other remuneration - - - - -
ApplicableEmployees, etc.
Amount of cash remuneration - - - - -Amount of equity remuneration or share-linked remuneration - - - - -
Total amount of other remuneration - - - - -Total amount 70 20 - - 25
161
報酬等に関する開示事項

2019/07/10 8:14:49 / 19509947_株式会社新生銀行_総会その他(C)
白頁

For further information, please contact:Group Investor Relations & Corporate Communications Division
Shinsei Bank, Limited4-3, Nihonbashi-muromachi 2-chome, Chuo-ku, Tokyo 103-8303, Japan
Tel: 81-3-6880-8303 Fax: 81-3-4560-1706URL: https://www.shinseibank.com/english/ E-mail: [email protected]

4-3, Nihonbashi-muromachi 2-chome, Chuo-ku, Tokyo 103-8303, Japan
TEL: 81-3-6880-7000
URL: https://www.shinseibank.com/english/


![Untitled-1 [] · 16. Those members who have so far not en-cashed their Final Dividend for the years March 31, 2009, March 31, 2010, March 31, 2011, March 31, 2012 March 31, 2013 March](https://static.documents.pub/doc/80x56/5f0a630d7e708231d42b62a6/untitled-1-16-those-members-who-have-so-far-not-en-cashed-their-final-dividend.jpg)


