Form 6-K http://www.sec.gov/Archives/edgar/data/932782/000095012310051992/c01389e6vk.htm[13/07/2010 12:05:03 p.m.] 6-K 1 c01389e6vk.htm FORM 6-K UNITED STATES SECURITIES AND EXCHANGE COMMISSION Washington, D.C. 20549 FORM 6-K REPORT OF FOREIGN PRIVATE ISSUER PURSUANT TO RULE 13a-16 OR 15d-16 UNDER THE SECURITIES EXCHANGE ACT OF 1934 For the month of May 2010 Commission File Number 0-99 PETRÓLEOS MEXICANOS (Exact name of registrant as specified in its charter) MEXICAN PETROLEUM (Translation of registrant’s name into English) United Mexican States (Jurisdiction of incorporation or organization) Avenida Marina Nacional No. 329 Colonia Huasteca Mexico, D.F. 11311 Mexico (Address of principal executive offices) Indicate by check mark whether the registrant files or will file annual reports under cover of Form 20-F or Form 40-F. Form 20-F Form 40-F Indicate by check mark if the registrant is submitting the Form 6-K in paper as permitted by Regulation S-T Rule 101(b)(1). Yes No Indicate by check mark if the registrant is submitting the Form 6-K in paper as permitted by Regulation S-T Rule 101(b)(7). Yes No Indicate by check mark whether the registrant by furnishing the information contained in this form is also thereby furnishing the information to the Commission pursuant to Rule 12g3-2(b) under the Securities Exchange Act of 1934. Yes No
PURSUANT TO RULE 13a-16 OR 15d-16 UNDERTHE SECURITIES EXCHANGE ACT OF 1934
For the month of May 2010
Commission File Number 0-99
PETRÓLEOS MEXICANOS(Exact name of registrant as specified in its charter)
MEXICAN PETROLEUM(Translation of registrant’s name into English)
United Mexican States(Jurisdiction of incorporation or organization)
Avenida Marina Nacional No. 329Colonia Huasteca
Mexico, D.F. 11311Mexico
(Address of principal executive offices)
Indicate by check mark whether the registrant files or will file annual reports under cover of Form 20-F or Form40-F.
Form 20-F Form 40-F
Indicate by check mark if the registrant is submitting the Form 6-K in paper as permitted by Regulation S-TRule 101(b)(1).
Yes No
Indicate by check mark if the registrant is submitting the Form 6-K in paper as permitted by Regulation S-TRule 101(b)(7).
Yes No
Indicate by check mark whether the registrant by furnishing the information contained in this form is also therebyfurnishing the information to the Commission pursuant to Rule 12g3-2(b) under the Securities Exchange Act of 1934.
Financial Results of Petróleos Mexicanos, Subsidiary Entities and Subsidiary Companies as ofMarch 31, 20101
• During the first quarter of 2010, PEMEX recorded a net income of Ps. 1.4 billion.
• During the first quarter of 2010, PEMEX recorded a net operating income of Ps. 137.6 billion, primarilyexplained by an increase in total sales of 36.0% or Ps. 81.5 billion.
• On January 16, 2010, crude oil production of project Ku-Maloob-Zaap reached a new maximum historicalvalue of 882 million barrels.
• On February 1, 2010, natural gas production of project Burgos reached a new maximum historical value of1,624 million cubic feet.
Table 1Petróleos Mexicanos, Subsidiary Entities and Subsidiary Companies
Operating income (loss) 93,223 137,559 47.6% 44,336 10,753 Taxes and duties 96,897 172,039 77.5% 75,142 13,448 Net income (loss) (26,998) 1,443 28,441 113 EBITDA(1) 137,551 211,008 53.4% 73,457 16,494
EBITDA / Financial cost(2) 5.7 9.5
* Unaudited consolidated financial statements prepared in accordance with Normas de Informacion Financiera(Mexican Financial Reporting Standards, FRS) -formerly Mexican GAAP-issued by the Consejo Mexicano para laInvestigación y Desarrollo de Normas de Información Financiera (CINIF). Based on the adoption of FRS B-10“Inflation effects”, 2009 and 2010 amounts are expressed in nominal terms.
** Convenience translations into U.S. dollars of amounts in pesos have been made at the average exchange rate ofPs. 12.7928 = US$1.00 for the first quarter of 2010. Such translations should not be construed as arepresentation that the peso amounts have been or could be converted into U.S. dollars at the foregoing or anyother rate.
(1) Earnings before interest, taxes, depreciation and amortization is a non-FRS measure, therefore we provide areconciliation with net income in the EBITDA section. This measure includes the cost of reserve for laborobligations.
(2) Excludes capitalized interest.
Note: Numbers may not total due to rounding figures.
1 If no further specification is included, for purposes of analysis, changes are made against the same period of thelast year. The financial statements included in this report are non-audited.
PEMEX Unaudited Financial Results Report as of March 31, 2010
1
PEMEX
Corporate Finance Office — Investor
Relations
Financial Results as of March 31, 2010
Net income 1Q10
In the first quarter of 2010, PEMEX recorded a net income of Ps. 1.4 billion (US$ 0.1 billion), whichrepresents a Ps. 28.4 billion increase primarily explained by:
• Increased sales of crude oil exports due to an increase in the weighted average export price of the
Mexican crude oil basket, from US$39.4 to US$71.5 per barrel;
• a foreign exchange gain explained due to a 5.6% appreciation of the Mexican peso against the U.S.dollar during the first quarter of 2010, as compared to a 4.5% depreciation during the first quarter of2009; and
• increased domestic sales primarily due to higher unit prices for the main petroleum products; and to a
lesser extent, larger sales volume; and • an increase in other income and expenses explained, which is explained by a larger IEPS2 credit.
2 Under PEMEX’s current fiscal regime, the Special Tax on Production and Services (IEPS) applicable to gasolineand diesel is regulated under the Federal Income Law. PEMEX is an intermediary between the Secretary ofFinance and Public Credit (SHCP) and the final consumer; PEMEX retains the amount of IEPS and transfers it tothe Federal Government. The IEPS rate is calculated as the difference between the retail or “final price”, and the“producer price”. The final prices of gasoline and diesel are established by the SHCP. PEMEX’s producer price iscalculated in reference to that of an efficient refinery operating in the Gulf of Mexico.
PEMEX Unaudited Financial Results Report as of March 31, 2010
2
PEMEX
Corporate Finance Office — Investor
Relations
Total Sales 1Q10
Total sales, including revenues from services, increased by 36%, to Ps. 307.9 billion (US$24.1 billion),primarily due to higher prices of crude oil exports and increased domestic sales, which are explained byhigher unit prices for the main petroleum products; and to a lesser extent, larger sales volume.
Table 2Petróleos Mexicanos, Subsidiary Entities and Subsidiary Companies
Informacion Financiera (Mexican Financial Reporting Standards, FRS) -formerly Mexican GAAP-issued by theConsejo Mexicano para la Investigación y Desarrollo de Normas de Información Financiera (CINIF). Based onthe adoption of FRS B-10 “Inflation effects”, 2009 and 2010 amounts are expressed in nominal terms.
** Convenience translations into U.S. dollars of amounts in pesos have been made at the average exchangerates of Ps. 12.7928 = US$1.00 for first quarter of 2010. Such translations should not be construed as arepresentation that the peso amounts have been or could be converted into U.S. dollars at the foregoing orany other rate.
(1) Liquefied Petroleum Gas
Note: Numbers may not total due to rounding.
PEMEX Unaudited Financial Results Report as of March 31, 2010
3
PEMEX
Corporate Finance Office — Investor
Relations
Domestic sales 1Q10 Domestic sales increased by 24.7% to Ps. 165.8 billion (US$13.0 billion), which is primarily explained by:
• Sales of petroleum products, which increased by 24.6% to Ps. 138.4 billion, primarily due to higher
gasoline prices and increased volumes of gasoline, LP gas and diesel sales.
• Sales of dry natural gas, which increased by 18.3%, to Ps. 19.9 billion, due to a 6.5% increase involume, from 2,999 to 3,193 million cubic feet per day (MMcfd); the weighted average price decreasedfrom US$5.4 to US$4.2 per million British Thermal Units (MMBtu).
• Sales of petrochemical products, which increased by 48.4%, to Ps. 7.4 billion, primarily as a result ofhigher prices for the main petrochemical products, and an increase in sales volume, from 1,048 to1,116 thousand tons (Mt).
Table 3Petróleos Mexicanos, Subsidiary Entities and Subsidiary Companies
Volume of domestic sales First quarter (Jan.-Mar.) 2009 2010 Change Dry natural gas (MMcfd) 2,999 3,193 6.5% 194 Petroleum products (Mbd) 1,754 1,767 0.8% 13
to an 81.6% increase in the weighted average Mexican crude oil basket export price from US$39.4 toUS$71.5 per barrel. Total volume decreased by 1.9%, from 1,279 to 1,255 thousand barrels per day(Mbd).
• petroleum products export sales, which increased by 29.2% to Ps. 18.1 billion, primarily due to prices
increases, that were partially offset by a 20.7% decrease in export volume, from 269 to 214 Mbd.
• petrochemical products export sales, which increased by 95.5% to Ps. 0.6 billion, as a result of a
48.6% increase in export volume, from 125 to 186 Mt.
• dry natural gas export sales, which in contrast decreased by 33.9% to Ps. 0.3 billion, primarily due to
reduced availability as a result of increased demand in the Mexican electric sector.
PEMEX Unaudited Financial Results Report as of March 31, 2010
4
PEMEX
Corporate Finance Office — Investor
Relations
Table 4Petróleos Mexicanos, Subsidiary Entities and Subsidiary Companies
International Trade(1) First quarter (Jan.-Mar.) 2009 2010 Change Exports
(2) Includes 70 Mbd and 78 Mbd of LPG for the first quarter of 2009 and 2010, respectively.
Note: Numbers may not total due to rounding.
Cost of Sales 1Q10
In the first quarter of 2010, cost of sales increased by 30.4%, to Ps. 144.6 billion, primarily as a result of aPs. 33.1 billion increase in imported products purchases.
The cost of sales as a percentage of total sales amounted to 47.0%, a decrease of 2.0 percentage points,primarily explained by increased crude oil export sales.
In the first quarter of 2010, general expenses increased by 15.6% as compared to the first quarter of 2009,to Ps. 25.7 billion, primarily due to a Ps. 3.8 billion increase in the net cost of the period for employeebenefits.
Net Cost of the Period for Employee Benefits3 1Q10
The net cost of the period for employee benefits increased by 22.1%, to Ps. 29.4 billion. This increase isprimarily explained by an adjustment to reflect the independent actuarial valuation results.
3 The cost of the reserve for employee benefits comprises provisions over the year to account for the increase ofthe reserve for employee benefits, which is recognized in our financial statements in accordance with MexicanFRS D-3 “Employee benefits”. This cost is allocated among cost of sales, distribution expenses andadministrative expenses. Changes in the cost of the reserve for employee benefits reflect the recognition of anemployee’s additional year of employment and age; wage, pensions and benefits increases; and changes inactuarial valuations.
PEMEX Unaudited Financial Results Report as of March 31, 2010
5
PEMEX
Corporate Finance Office — Investor
Relations
Table 5Petróleos Mexicanos, Subsidiary Entities and Subsidiary Companies
Other operating costs and expenses First quarter (Jan.-Mar.) 2009 2010 Change 2010 (Ps. MM) (US$MM) Cost of sales 110,946 144,630 30.4% 33,684 11,306 General expenses 22,224 25,687 15.6% 3,463 2,008
Net cost of the period foremployee benefits 24,093 29,413 22.1% 5,320 2,299
* Indicative figures from unaudited consolidated financial statements prepared in accordance with Normas deInformacion Financiera (Mexican Financial Reporting Standards, FRS) -formerly Mexican GAAP- issued by theConsejo Mexicano para la Investigación y Desarrollo de Normas de Información Financiera (CINIF). Based onthe adoption of FRS B-10 “Inflation effects”, of 2009 and 2010 amounts are expressed in nominal terms.
** Convenience translations into U.S. dollars of amounts in pesos have been made at the average exchange rateof Ps. 12.7928 = US$1.00 for the first quarter of 2010. Such translations should not be construed as arepresentation that the peso amounts have been or could be converted into U.S. dollars at the foregoing orany other rate.
Note: Numbers may not total due to rounding figures.
Operating Income 1Q10
In the first quarter of 2010, operating income increased by 47.6%, to Ps. 137.6 billion, primarily as a resultof an increase in export sales due to higher crude oil prices.
In the first quarter of 2010, other revenues (expenses)-net totaled Ps. 22.1 billion, primarily due to higherIEPS tax credit in the amount of Ps. 20.1 billion.
Comprehensive Financing Result 1Q10
In the first quarter of 2010, the comprehensive financing result totaled Ps. 14.2 billion, which represented again of Ps. 34.5 billion as compared to the same quarter of 2009. The benefit was due to a foreignexchange rate gain of Ps. 34.8 billion as a result of a 5.6% appreciation of the peso against the U.S. dollarduring the period, as compared to a 4.5% depreciation of the peso against the U.S. dollar during the firstquarter of 2009.
PEMEX Unaudited Financial Results Report as of March 31, 2010
6
PEMEX
Corporate Finance Office — Investor
Relations
Table 6Petróleos Mexicanos, Subsidiary Entities and Subsidiary Companies
* Unaudited consolidated financial statements prepared in accordance with Normas de Informacion Financiera(Mexican Financial Reporting Standards, FRS) -formerly Mexican GAAP-issued by the Consejo Mexicano parala Investigación y Desarrollo de Normas de Información Financiera (CINIF). Based on the adoption of FRS B-10 “Inflation effects”, 2009 and 2010 amounts are expressed in nominal terms.
** Convenience translations into U.S. dollars of amounts in pesos have been made at the average exchange rateof Ps. 12.7928 = US$1.00 for the first quarter of 2010. Such translations should not be construed as arepresentation that the peso amounts have been or could be converted into U.S. dollars at the foregoing orany other rate.
(1) These financial cost and financial income include the effect of financial derivatives.
Note: Numbers may not total due to rounding figures.
Participation in Results of Subsidiary Entities and Affiliates 1Q10
During the first quarter of 2010, participation in the results of subsidiary entities and affiliates increasedfrom a loss of Ps. 0.2 billion to a loss of Ps. 0.4 billion, primarily due to increased losses recorded by theDeer Park refinery during the first quarter of 2010.
Income before Taxes and Duties 1Q10 In the first quarter of 2010, income before taxes and duties increased by 148.2%, to Ps. 173.5 billion,
• an increase of Ps. 44.3 billion in operating income, as a result of higher prices of crude oil exports;
and
• a gain of Ps. 34.5 billion in the comprehensive financing result, due to a favorable exchange rate
effect.
Taxes and Duties4 1Q10
In the first quarter of 2010, taxes and duties paid increase by 77.5%, to Ps. 172 billion (US$13.4 billion),primarily due to higher reference prices.
4 Since January 1, 2006, PEMEX has been subject to a new fiscal regime. Pemex-Exploration and Production’s(PEP) tax regime is governed by the Federal Duties Law, while the tax regimes of the other Subsidiary Entitiescontinue to be governed by Mexico’s Income Tax Law. The most important duty paid by PEP is the OrdinaryHydrocarbons Duty (OHD), the tax base of which is a quasi operating profit. In addition to the payment of theOHD, PEP is required to pay other duties.
PEMEX Unaudited Financial Results Report as of March 31, 2010
7
PEMEX
Corporate Finance Office — Investor
Relations
Table 7Petróleos Mexicanos, Subsidiary Entities and Subsidiary Companies
Taxes and duties* ** First quarter (Jan.-Mar.) 2009 2010 Change 2010 (Ps. MM) (US$MM) Total taxes and duties 96,897 172,039 77.5% 75,142 13,448
* Unaudited consolidated financial statements prepared in accordance with Normas de Informacion Financiera(Mexican Financial Reporting Standards, FRS) formerly Mexican GAAP-issued by the Consejo Mexicano parala Investigación y Desarrollo de Normas de Información Financiera (CINIF). Based on the adoption of FRS B-10 “Inflation effects”, 2009 and 2010 amounts are expressed in nominal terms.
** Convenience translations into U.S. dollars of amounts in pesos have been made at the average exchange rateof Ps. 12.7928 = US$1.00 for the first quarter of 2010. Such translations should not be construed as arepresentation that the peso amounts have been or could be converted into U.S. dollars at the foregoing orany other rate.
(1) Includes provisions.
Note: Numbers may not total due to rounding figures.
Changes in the Fiscal Regimes for Chicontepec and the Deep Waters in the Gulf of Mexico
On October 21, 2009, the Chamber of Deputies approved the following changes to the fiscal regimes forChicontepec and Deep Waters fields in the Gulf of Mexico, which took effect on January 1, 2010: Special Duty
The rate of the Special Duty was reduced to 30%; which is applicable to the value of productionless authorized deductions.5 This rate increases to 36% when cumulative production of theapplicable region exceeds 240 MM barrels of crude oil equivalent (boe).
The deductible limit (cost cap) applicable to the Special Duty was increased to the lesser ofUS$32.5 per boe and 60% of the price of one boe6. In addition, the cost recovery period forcosts that exceed the deductible limit was extended to 15 years for both regions.7
HydrocarbonsExtractionDuty
The rate of the Hydrocarbon Extraction Duty was modified from a variable rate between 10% and20% (depending on the weighted average Mexican crude oil export price) to a fixed rate of 15%of applicable total income.
AdditionalHydrocarbonsDuty
The Additional Hydrocarbons Duty was created, and will be applied, if and only if, the equivalentprice of crude oil exceeds US$60.0 per boe. This duty is calculated by applying a rate of 52% ontotal production volume multiplied by the difference between the equivalent crude oil price andUS$60.0.
5 The rate of the Special Duty for Chicontepec was 71.5% and the rate of the Special Duty for deep waters in theGulf of Mexico was a variable rate between 60% and 71.5%, depending on the average Mexican crude oil exportprice.
6 The former deductible limit for Chicontepec was US$11.0 per boe and US$2.7 per Mcf. The former deductiblelimit for deep waters in the Gulf of Mexico was US$16.5 per boe and US$4.0 per Mcf.
7 The former recovery periods for costs that exceeded the deductible limit was seven years for fields inChicontepec, and ten years for fields in the deep waters in the Gulf of Mexico.
PEMEX Unaudited Financial Results Report as of March 31, 2010
In the first quarter of 2010, operating income per boe of Pemex-Exploration and Production(PEP) increased by 81.3%, to US$8.2 per barrel. This increase was primarily due to higher crude oilprices. In addition, the ratio of taxes and duties to operating income decreased by 1.9 percentage points to93.5%.
As a result, PEP recorded net income of Ps. 21.5 billion, as compared to a net loss of Ps. 14.2 billionduring the same quarter of 2009.
Table 8Petróleos Mexicanos, Subsidiary Entities and Subsidiary Companies
Selected indices* ** First quarter (Jan.-Mar.) Pemex - Exploration and Production 2009 2010 Change 2010 (US$/boe) Sales / Hydrocarbons production (Ps. /
boe) 471.4 719.2 52.6% 247.8 56.2 Operating income / Hydrocarbons
production (Ps. / boe) 292.4 535.7 83.2% 243.3 41.9 Net income / Hydrocarbons production (Ps.
/ boe) (41.4) 63.4 104.8 5.0 Taxes and duties / Operating income 95.3% 93.5% (1.9)
* Indicative figures from unaudited consolidated financial statements prepared in accordance with Normas deInformacion Financiera (Mexican Financial Reporting Standards, FRS) -formerly Mexican GAAP- issued by theConsejo Mexicano para la Investigación y Desarrollo de Normas de Información Financiera (CINIF). Based onthe adoption of FRS B-10 “Inflation effects”, 2009 and 2010 amounts are expressed in nominal terms.
** Convenience translations into U.S. dollars of amounts in pesos have been made at the average exchange rate ofPs. 12.7928 = US$1.00 for the first quarter of 2010. Such translations should not be construed as arepresentation that the peso amounts have been or could be converted into U.S. dollars at the foregoing or anyother rate.
Note: boe stands for barrels of crude oil equivalent. PR
The variable refining margin of the National Refining System8 was negative US$1.01 per barrel, comparedto the positive US$3.56 recorded during the first quarter of 2009. The net operating loss of Pemex-Refining (PR) was Ps. 41.5 billion and total net loss totaled Ps. 22.8 billion, compared to Ps. 13.3 billionduring the first quarter of 2009. This reduction is mainly explained by (i) the behavior of crude oil andpetroleum prices in the international markets; (ii) non-scheduled production breaks of equipment thatgenerate greater value-added products; and (iii) heavier crude oil processing that decreased conversionlevels.
8 PEMEX’s variable refining margin is an estimate of operating income per barrel of crude oil processed. Operatingincome is calculated by subtracting from total revenues the cost of raw materials, internal consumption(consisting of fuel oil and natural gas used to operate the refineries) and auxiliary services (electric power, waterand catalysts).
PEMEX Unaudited Financial Results Report as of March 31, 2010
9
PEMEX
Corporate Finance Office — InvestorRelations
PGPB
During the first quarter of 2010, Pemex-Gas and Basic Petrochemicals (PGPB) recorded a net operatingloss of Ps. 1.5 billion, compared to a net operating income of Ps. 0.3 billion recorded during the firstquarter of 2009.
As a result, PGPB recorded a net loss of Ps. 0.3 billion during the first quarter of 2010, as compared tonet income of Ps. 1.1 billion during the first quarter of 2009. The main driver of PGPB loss is the decreaseof the natural gas price and the difference in international and domestic LP gas prices.
PPQ
The operating loss of Pemex-Petrochemicals (PPQ) decreased by 23.6% to Ps. 3.9 billion. The net loss ofPPQ decreased to Ps. 4.3 billion, as compared to a loss of Ps. 5.0 billion. This result was primarily due tothe shut-down of lesser profitable production chains.
EBITDA 1Q10
In the first quarter of 2010, earnings before interest, taxes, depreciation and amortization, or EBITDA,increased by 53.4%, to Ps. 211.0 billion (US$16.5 billion).
Table 9Petróleos Mexicanos, Subsidiary Entities and Subsidiary Companies
EBITDA reconciliation* ** First quarter (Jan.-Mar.) 2009 2010 Change 2010 (Ps. MM) (US$MM) Net income (loss) (26,998) 1,443 28,441 113 + Taxes and duties 96,897 172,039 77.5% 75,142 13,448 - Comprehensive financing result (20,271) 14,233 34,503 1,113 + Depreciation and amortization 23,289 22,346 -4.0% (943) 1,747 + Net cost for the period of
* Indicative figures from unaudited consolidated financial statements prepared in accordance with Normas deInformacion Financiera (Mexican Financial Reporting Standards, FRS) -formerly Mexican GAAP- issued by theConsejo Mexicano para la Investigación y Desarrollo de Normas de Información Financiera (CINIF). Based onthe adoption of FRS B-10 “Inflation effects”, 2009 and 2010 amounts are expressed in nominal terms.
** Convenience translations into U.S. dollars of amounts in pesos have been made at the average exchange rateof Ps. 12.7928 = US$1.00 for first quarter of 2010. Such translations should not be construed as arepresentation that the peso amounts have been or could be converted into U.S. dollars at the foregoing orany other rate.
Note: Numbers may not total due to rounding figures.
PEMEX Unaudited Financial Results Report as of March 31, 2010
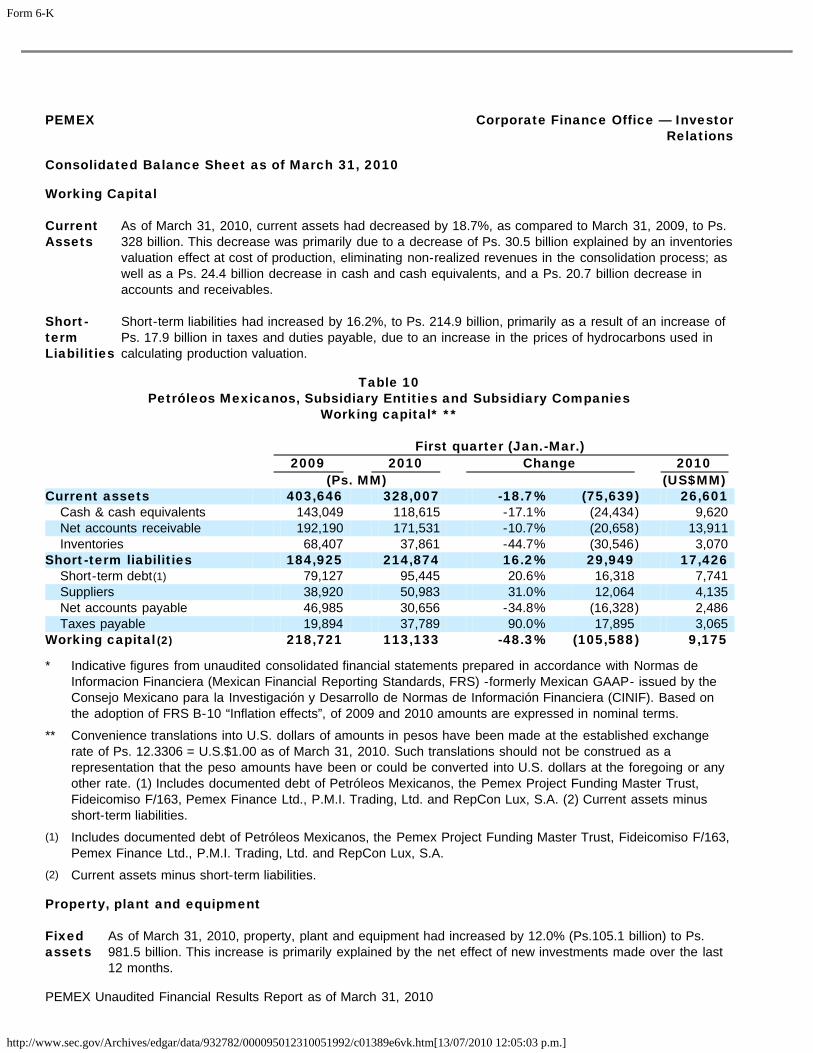
As of March 31, 2010, current assets had decreased by 18.7%, as compared to March 31, 2009, to Ps.328 billion. This decrease was primarily due to a decrease of Ps. 30.5 billion explained by an inventoriesvaluation effect at cost of production, eliminating non-realized revenues in the consolidation process; aswell as a Ps. 24.4 billion decrease in cash and cash equivalents, and a Ps. 20.7 billion decrease inaccounts and receivables.
Short-term Liabilities
Short-term liabilities had increased by 16.2%, to Ps. 214.9 billion, primarily as a result of an increase ofPs. 17.9 billion in taxes and duties payable, due to an increase in the prices of hydrocarbons used incalculating production valuation.
Table 10Petróleos Mexicanos, Subsidiary Entities and Subsidiary Companies
Working capital* ** First quarter (Jan.-Mar.) 2009 2010 Change 2010 (Ps. MM) (US$MM) Current assets 403,646 328,007 -18.7% (75,639) 26,601
Working capital(2) 218,721 113,133 -48.3% (105,588) 9,175
* Indicative figures from unaudited consolidated financial statements prepared in accordance with Normas deInformacion Financiera (Mexican Financial Reporting Standards, FRS) -formerly Mexican GAAP- issued by theConsejo Mexicano para la Investigación y Desarrollo de Normas de Información Financiera (CINIF). Based onthe adoption of FRS B-10 “Inflation effects”, of 2009 and 2010 amounts are expressed in nominal terms.
** Convenience translations into U.S. dollars of amounts in pesos have been made at the established exchangerate of Ps. 12.3306 = U.S.$1.00 as of March 31, 2010. Such translations should not be construed as arepresentation that the peso amounts have been or could be converted into U.S. dollars at the foregoing or anyother rate. (1) Includes documented debt of Petróleos Mexicanos, the Pemex Project Funding Master Trust,Fideicomiso F/163, Pemex Finance Ltd., P.M.I. Trading, Ltd. and RepCon Lux, S.A. (2) Current assets minusshort-term liabilities.
(1) Includes documented debt of Petróleos Mexicanos, the Pemex Project Funding Master Trust, Fideicomiso F/163,Pemex Finance Ltd., P.M.I. Trading, Ltd. and RepCon Lux, S.A.
(2) Current assets minus short-term liabilities.
Property, plant and equipment Fixed assets
As of March 31, 2010, property, plant and equipment had increased by 12.0% (Ps.105.1 billion) to Ps.981.5 billion. This increase is primarily explained by the net effect of new investments made over the last12 months.
PEMEX Unaudited Financial Results Report as of March 31, 2010
As of March 31, 2010, total debt, including accrued interests, decreased by 1.0%, to Ps. 624.1 billion(US$50.6 billion). This decrease was primarily due to a 12.9% appreciation of the Mexican peso againstthe U.S. dollar.
Total debt over the sum of equity and total liabilities represented 47.1%. Net Net debt increased by 3.7% to Ps. 505.5 billion (US$41.0 billion).
Table 11Petróleos Mexicanos, Subsidiary Entities and Subsidiary Companies
Consolidated Debt* ** As of March 31, 2009 2010 Change 2010 (Ps. MM) (US$MM) Total debt 630,406 624,124 -1.0% (6,282) 50,616
* Indicative figures from unaudited consolidated financial statements prepared in accordance with Normas deInformacion Financiera (Mexican Financial Reporting Standards, FRS) -formerly Mexican GAAP- issued by theConsejo Mexicano para la Investigación y Desarrollo de Normas de Información Financiera (CINIF). Based onthe adoption of FRS B-10 “Inflation effects”, of 2009 and 2010 amounts are expressed in nominal terms.
** Convenience translations into U.S. dollars of amounts in pesos have been made at the established exchangerate of Ps. 12.3306 = U.S.$1.00 as of March 31, 2010. Such translations should not be construed as arepresentation that the peso amounts have been or could be converted into U.S. dollars at the foregoing orany other rate.
Note: Numbers may not total due to rounding figures.
Table 12Petróleos Mexicanos, Subsidiary Entities and Subsidiary Companies
Maturity profile* ** As of March 31, (Ps. MM) (US$MM) Documented debt in pesos 127,031 10,302 2010 12,645 1,025 January 2010 - March 2010 7,033 570 April 2010 - March 2011 30,883 2,505 April 2011 - March 2012 18,621 1,510 April 2012 - March 2013 1,333 108 April 2013 and beyond 56,515 4,583 Documented debt in other
January 2010 - March 2010 4,564 370 April 2010 - March 2011 45,228 3,668 April 2011 - March 2012 45,433 3,685 April 2012 - March 2013 50,810 4,121 April 2013 and beyond 279,854 22,696 Total debt 624,124 50,616
* Indicative figures from unaudited consolidated financial statements prepared in accordance with Normas deInformacion Financiera (Mexican Financial Reporting Standards, FRS) -formerly Mexican GAAP- issued by theConsejo Mexicano para la Investigación y Desarrollo de Normas de Información Financiera (CINIF). Based onthe adoption of FRS B-10 “Inflation effects”, of 2009 and 2010 amounts are expressed in nominal terms.
** Convenience translations into U.S. dollars of amounts in pesos have been made at the established exchangerate of Ps. 12.3306 = U.S.$1.00 as of March 31, 2010. Such translations should not be construed as arepresentation that the peso amounts have been or could be converted into U.S. dollars at the foregoing orany other rate.
Note: Numbers may not total due to rounding figures.
PEMEX Unaudited Financial Results Report as of March 31, 2010
12
PEMEX
Corporate Finance Office — InvestorRelations
Investing Activities 2010
PEMEX expects to invest approximately Ps. 263.4 billion9.during 2010 The estimated allocation of theseinvestments is10:
• Ps. 220.0 billion to Pemex-Exploration and Production11; • Ps. 32.0 billion to Pemex-Refining; • Ps. 5.7 billion to Pemex-Gas and Basic Petrochemicals; • Ps. 4.8 billion to Pemex-Petrochemicals; and • Ps. 0.9 billion to Petróleos Mexicanos.
During the first quarter of 2010, Ps. 59.8 billion have been invested, which amount represents 22.7% ofexpected investments for the year.
Financing Activities
Capital Raising Credit Lines
• During the first quarter of 2010, Petróleos Mexicanos obtained US$654.5 millions in loans madeor guaranteed by export credit agencies (ECA’s).
Capital Markets
The following are the capital market transactions realized during 2010. It is worth mentioning thatthese transactions were reported as part of our earnings report as of December 31, 2009.
• On February 5, 2010, Petróleos Mexicanos issued US$1.0 billion of 6.00% Notes due 2020 with a
6.0% semi-annual coupon (commented in the 4Q09 Earning Report).
• On February 8, 2010, Petróleos Mexicanos issued in the domestic Mexican Market approximatelyPs.15 billion pesos of the publicly traded notes in three tranches (commented in the 4Q09 EarningReport):
• Ps. 8 billon at a spread of 28 basis points over the Tasa de Interés Interbancaria de Equilibrio
(Mexican Interbank Exchange Rate), which matures in 2015; • Ps. 5 billion at a fixed rate of 9.10% which matures in 2020; and • Ps. 2 billion at a fixed rate of 4.2% which matures in 2020.
• On February 26, 2010, Petróleos Mexicanos reopened Swiss Franc 150 million of its 3.5% Notes
due 2014 (commented in the 4Q09 Earning Report).
The proceeds from these activities will be used to finance PEMEX’s investment program and refinancing activities.
Liquidity Management 1Q10
As of March 31, 2010, US$2.5 billion of the syndicated revolving credit facility established onSeptember 7, 2007 remained available.
9 Based on 2010 Federal Budget.
10 Investment figures may change based on further budgeting adjustments.
11 Includes upstream maintenance expenditures.
PEMEX Unaudited Financial Results Report as of March 31, 2010
13
PEMEX
Corporate Finance Office — InvestorRelations
Equity
As of March 31, 2010, PEMEX had negative equity totaling Ps. 66.9 billion, as compared to positive equity of Ps.9.6 billion recorded as of March 31, 2009. This decrease of Ps. 76.5 billion was primarily due to the net lossrecorded during 2009, which was partially offset by the net income generated during the first quarter of 2010.
We note that the credit contracts to which PEMEX is currently a party do not implicate any financial or paymentdefaults as a consequence of its negative equity.
Table 13Petróleos Mexicanos, Subsidiary Entities and Subsidiary Companies
Equity* ** As of March 31, 2009 2010 Change 2010 (Ps. MM) (US$MM) Total equity 9,631 (66,913) -794.8% (76,544) (5,427)
Certificates of contribution 96,958 96,958 0.0% — 7,863 Increase in equity 195,011 180,382 -7.5% (14,628) 14,629 Social capital 4,146 3,474 -16.2% (672) 282 Legal reserve 1,023 918 -10.3% (105) 74 Donations 600 1,077 79.3% 476 87
Comprehensive profit (loss) 731 5,337 630.5% 4,606 433 Accumulated net income
(losses) (288,837) (355,059) 22.9% (66,221) (28,795)From prior years (261,840) (356,502) 36.2% (94,662) (28,912)Net income (loss) for the
period (26,997) 1,443 -105.3% 28,441 117
* Unaudited consolidated financial statements prepared in accordance with Normas de Informacion Financiera(Mexican Financial Reporting Standards, FRS) -formerly Mexican GAAP-issued by the Consejo Mexicano parala Investigación y Desarrollo de Normas de Información Financiera (CINIF). Based on the adoption of FRS B-10 “Inflation effects”, 2009 and 2010 amounts are expressed in nominal terms.
** Convenience translations into U.S. dollars of amounts in pesos have been made at the established exchangerate of Ps. 12.3306 = U.S.$1.00 as of March 31, 2010. Such translations should not be construed as arepresentation that the peso amounts have been or could be converted into U.S. dollars at the foregoing orany other rate.
Note: Numbers may not total due to rounding figures.
PEMEX Unaudited Financial Results Report as of March 31, 2010
14
PEMEX
Corporate Finance Office — InvestorRelations
Other relevant topics Appointments On February 25, 2010, the Board of Directors of Petróleos Mexicanos appointed:
• Guadalupe Merino Bañuelos, as Deputy Director of Corporate Services of Petróleos
Mexicanos;
• Ignacio López Rodríguez, as Deputy Director of Equity Management of Petróleos
Mexicanos; and • Ramón Guerrero Esquivel, as Deputy Director of Supplies of Petróleos Mexicanos. On March 29, 2010, the Board of Directors of Petróleos Mexicanos appointed:
• Miguel Angel Pérez Fernández, as Coordinator of Governmental and Strategic Consolidation
Programs of Petróleos Mexicanos;
• Luis Felipe Luna Melo, as Deputy Director of Economic Planning of Petróleos Mexicanos;
and
• Luis Fernando Betancourt Sánchez, as Deputy Director of Operational Discipline, Safety,
Health and Environmental Protection of Petróleos Mexicanos. Collaboration
Agreements
On March 2, 2010, Petróleos Mexicanos and the government of the State of Campeche signed acollaboration agreement that contemplates the creation of an inter-institutional evaluation andplanning group to address topics relating to oil industry activities in the region. These topics include,among others, goals with respect to: (i) productive projects that generate greater investments,(ii) infrastructure projects that promote social development, and (iii) development of contingencymechanisms.
On April 15, 2010, Petróleos Mexicanos and the Principality of Asturias signed a collaboration
agreement that establishes guidelines for technical assistance in energy, information technologiesand geospatial information, among others. This agreement will allow both parties to celebratefurther, more specific collaboration agreements.
Performance Relating to the status of the implementation of the performance contracts:Contracts
• There is already an applicable legal framework: (i) Ley de Petróleos Mexicanos,(ii) Reglamento de la Ley de Petróleos Mexicanos, y (iii) Disposiciones Administrativas deContratación (Law of Petróleos Mexicanos, its regulation, and administrative contractdispositions).
• PEMEX developed a performance contract model for mature fields and for fields located inthe Paleocanal of Chicontepec, which is being analyzed by the Acquisitions, Leasing, Worksand Services Committee of the Board of Directors of Petróleos Mexicanos.
• Once it is approved, PEMEX will publish on www.pemex.com all the relevant information of
the first round, which will be for mature fields.
PEMEX Unaudited Financial Results Report as of March 31, 2010
15
PEMEX
Corporate Finance Office — InvestorRelations
Annex
Table A1Petróleos Mexicanos, Subsidiary Entities and Subsidiary Companies
Consolidated balance sheet* ** As of March 31, 2009 2010 Change 2010 (Ps. MM) (US$MM) Current assets 403,646 328,007 -18.7% (75,639) 26,601
Reserve for employee benefits 508,859 592,505 16.4% 83,646 48,052
Reserve for sundry creditorsand others 42,072 49,332 17.3% 7,260 4,001
Deferred taxes 7,188 6,790 -5.5% (399) 551
Total liabilities 1,294,324 1,392,180 7.6% 97,856 112,904 Total equity 9,631 (66,913) -794.8% (76,544) (5,427) Total liabilities and equity 1,303,955 1,325,267 1.6% 21,312 107,478
* Unaudited consolidated financial statements prepared in accordance with Normas de Informacion Financiera(Mexican Financial Reporting Standards, FRS) formerly Mexican GAAP-issued by the Consejo Mexicano parala Investigación y Desarrollo de Normas de Información Financiera (CINIF). Based on the adoption of FRS B-10 “Inflation effects”, 2009 and 2010 amounts are expressed in nominal terms.
** Convenience translations into U.S. dollars of amounts in pesos have been made at the established exchangerate of Ps. 12.3306 = U.S.$1.00 as of March 31, 2010. Such translations should not be construed as arepresentation that the peso amounts have been or could be converted into U.S. dollars at the foregoing orany other rate.
(1) Includes documented debt of Petróleos Mexicanos, the Pemex Project Funding Master Trust, FideicomisoF/163, Pemex Finance Ltd., P.M.I. Trading, Ltd.and Repcon Lux, S.A.
Note: Numbers may not total due to rounding figures.
PEMEX Unaudited Financial Results Report as of March 31, 2010
16
PEMEX
Corporate Finance Office — InvestorRelations
Table A2Petróleos Mexicanos, Subsidiary Entities and Subsidiary Companies
Consolidated income statement* ** First quarter (Jan.-Mar.) 2009 2010 Change 2010 (Ps. MM) (US$MM) Total sales 226,392 307,875 36.0% 81,483 24,066
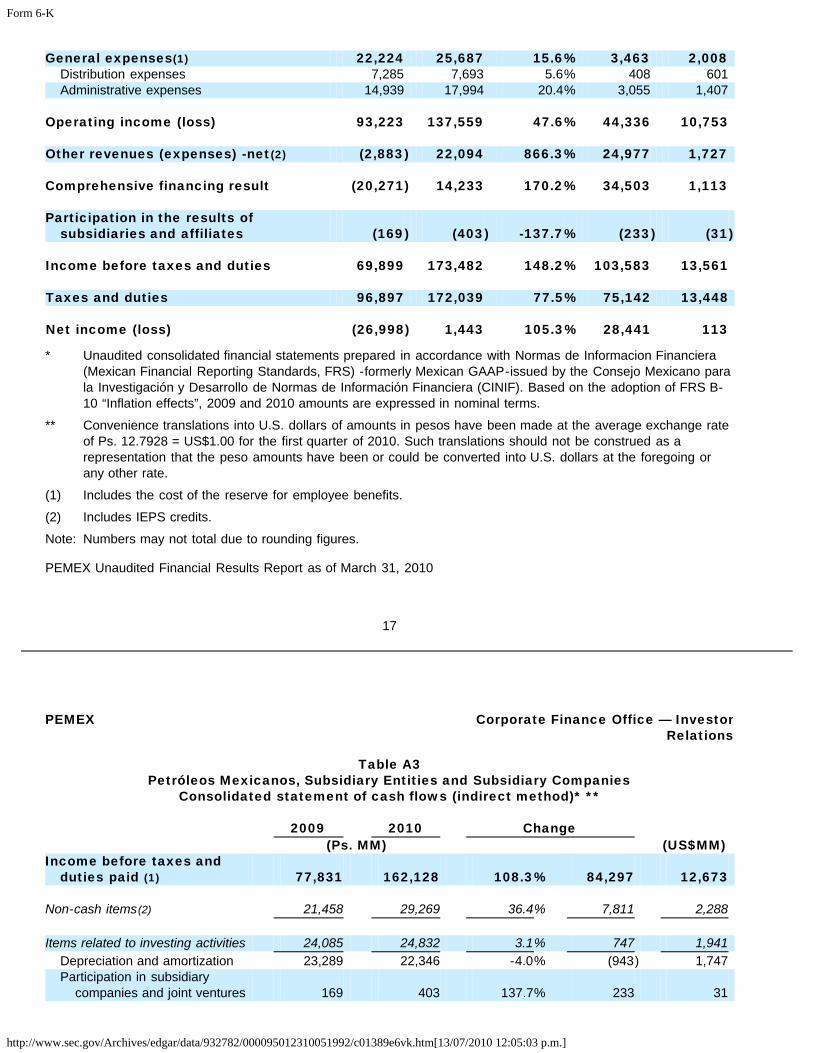
Operating income (loss) 93,223 137,559 47.6% 44,336 10,753 Other revenues (expenses) -net(2) (2,883) 22,094 866.3% 24,977 1,727 Comprehensive financing result (20,271) 14,233 170.2% 34,503 1,113 Participation in the results of
subsidiaries and affiliates (169) (403) -137.7% (233) (31) Income before taxes and duties 69,899 173,482 148.2% 103,583 13,561 Taxes and duties 96,897 172,039 77.5% 75,142 13,448 Net income (loss) (26,998) 1,443 105.3% 28,441 113
* Unaudited consolidated financial statements prepared in accordance with Normas de Informacion Financiera(Mexican Financial Reporting Standards, FRS) -formerly Mexican GAAP-issued by the Consejo Mexicano parala Investigación y Desarrollo de Normas de Información Financiera (CINIF). Based on the adoption of FRS B-10 “Inflation effects”, 2009 and 2010 amounts are expressed in nominal terms.
** Convenience translations into U.S. dollars of amounts in pesos have been made at the average exchange rateof Ps. 12.7928 = US$1.00 for the first quarter of 2010. Such translations should not be construed as arepresentation that the peso amounts have been or could be converted into U.S. dollars at the foregoing orany other rate.
(1) Includes the cost of the reserve for employee benefits.
(2) Includes IEPS credits.
Note: Numbers may not total due to rounding figures.
PEMEX Unaudited Financial Results Report as of March 31, 2010
17
PEMEX
Corporate Finance Office — InvestorRelations
Table A3Petróleos Mexicanos, Subsidiary Entities and Subsidiary Companies
Consolidated statement of cash flows (indirect method)* ** 2009 2010 Change (Ps. MM) (US$MM) Income before taxes and
at the beginning of theyear 114,224 128,180 12.2% 13,955 10,020
Cash and cash equivalents
at the end of the year 143,049 118,615 -17.1% (24,434) 9,272
* Unaudited consolidated financial statements prepared in accordance with Normas de Informacion Financiera(Mexican Financial Reporting Standards, FRS) -formerly Mexican GAAP-issued by the Consejo Mexicano parala Investigación y Desarrollo de Normas de Información Financiera (CINIF). Based on the adoption of FRS B-10 “Inflation effects”, 2009 and 2010 amounts are expressed in nominal terms.
** Convenience translations into U.S. dollars of amounts in pesos have been made at the average exchange rate
of Ps. 12.7928 = US$1.00 for 2010. Such translations should not be construed as a representation that thepeso amounts have been or could be converted into U.S. dollars at the foregoing or any other rate.
(1) The starting point is income before taxes and duties paid, not accrued as presented in the income statement.
(2) Includes the net cost of employees benefits
Note: Numbers may not total due to rounding figures.
PEMEX Unaudited Financial Results Report as of March 31, 2010
18
PEMEX
Corporate Finance Office — InvestorRelations
Table A412Petróleos Mexicanos, Subsidiary Entities and Subsidiary Companies
Business Segment Information Exploration Subsidiary and Gas and Basic Entities and Intersegment Production Refining Petrochemicals Petrochemicals Corporate eliminations Total (Ps. MM) Three months
* Indicative figures from unaudited consolidated financial statements prepared in accordance with Normas deInformacion Financiera (Mexican Financial Reporting Standards, FRS) -formerly Mexican GAAP- issued by theConsejo Mexicano para la Investigación y Desarrollo de Normas de Información Financiera (CINIF). Based onthe adoption of FRS B-10 “Inflation effects”, of 2009 and 2010 amounts are expressed in nominal terms.
Note: Numbers may not total due to rounding figures.
12 As of March 31, 2010, as established in the Mexican Financial Reporting Standard related to consolidated orcombined financial statements (NIF B-8 “Estados Financieros Consolidados o Combinados”), the businesssegment results for consolidation effects are net of non-realized profits and losses. Therefore, they are not thesame as the ones recorded in the “Results by Subsidiary Entities” section.
PEMEX Unaudited Financial Results Report as of March 31, 2010
19
PEMEX
Corporate Finance Office — Investor
Relations
Table A5Petróleos Mexicanos, Subsidiary Entities and Subsidiary Companies
Selected financial indices* First quarter (Jan.-Mar.) 2009 2010 Change Consolidated income statement ratios
Cost of sales / Total sales 49.0% 47.0% -0.02 Depreciation / Cost of sales and General expenses 17.5% 13.1% -0.04 Operating income / Total sales 41.2% 44.7% 0.04 Taxes and duties / Total sales 42.8% 55.9% 0.13
Consolidated balance sheet ratios(1)
Properties and equipment / Total Assets 67.2% 74.1% 0.07 Total debt / Total liabilities and equity 48.3% 47.1% -0.01
* Indicative figures from unaudited consolidated financial statements prepared in accordance with Normas deInformacion Financiera (Mexican Financial Reporting Standards, FRS) -formerly Mexican GAAP- issued by theConsejo Mexicano para la Investigación y Desarrollo de Normas de Información Financiera (CINIF). Based onthe adoption of FRS B-10 “Inflation effects”, of 2009 and 2010 amounts are expressed in nominal terms.
Table A6Petróleos Mexicanos, Subsidiary Entities and Subsidiary Companies
* Convenience translations into US dollars of amounts in pesos have been made at the established exchangerate of Ps. 12.3306 = US$1.00 as of March 31, 2010. Such translations should not be construed as arepresentation that the peso amounts have been or could be converted into US dollars at the foregoing or anyother rate.
(1) Asset swaps include options over Repsol YPF, S.A. shares.
Note: Numbers may not total due to rounding.
13 Derivative financial instruments are accounted at fair value in the financial statements, in accordance withMexican FRS C-10 “Derivative Financial Instruments and Hedging Operations.” However, some of theseinstruments do not comply with the accounting standards required to be designated as hedges even cash flowsgenerated by these instruments are offset by cash flows generated by the associated positions.
PEMEX Unaudited Financial Results Report as of March 31, 2010
21
PEMEX
Corporate Finance Office — Investor
Relations
Supplement of Operating Results for the First Quarter of 20101
Table S1Petróleos Mexicanos, Subsidiary Entities and Subsidiary Companies
Operating information summary First quarter (Jan.-Mar.) 2009 2010 Change Hydrocarbons production Total hydrocarbons (Mboed) 3,815 3,816 0.0% 1
Total crude oil (Mbd) 2,667 2,607 -2.2% (60)Offshore crude oil / Total crude oil production 78.6% 76.4% -2.2%
Total gas equivalent (Mboed)(1) 1,148 1,210 5.4% 61 Total gas (MMcfd) 7,018 6,946 -1.0% (71)
Dry natural gas production (MMcfd) 3,503 3,683 5.2% 180 Natural gas liquids production (Mbd)(2) 378 387 2.5% 9 Petroleum products production(3) 1,385 1,308 -5.6% (77)Net production of petrochemicals 1,140 1,064 -6.7% (76)
(1) Includes condensates.
(2) Includes condensates and other streams to fractionating process.
(3) Excludes butylenes and propylene; includes isobutanes from Pemex-Gas and Basic Petrochemicals and butanefrom Pemex-Petrochemicals.
Note: Numbers may not total due to rounding. Mboed stands for thousand barrels of oil equivalent per day.
During the first quarter of 2010, total crude oil production decreased by 2.2% as comparedto the same quarter of 2009, from 2,667 to 2,607 Mbd. During the first quarter of 2010,crude oil production excluding Cantarell, increased by 156 Mbd.
Production of heavy crude oil decreased by 9.4%, primarily due to lower production at theCantarell project, which resulted from the natural decline of that project, and the shutdownof wells due to an increase in the oil-gas ratio also that project. Cantarell’s decline waspartially offset by a 6.4% increase in production at the Ku-Maloob-Zaap (KMZ) project,which reached a new maximum historical production level of 882 Mbd on January 16,2010.
Production of light crude oil increased by 2.9%, primarily due to higher production at theYaxché and Ixtal-Manik projects in the Southwestern Marine region. Production of extra-light crude oil increased by 28.5%, due to the completion of wells in the Delta del Grijalvaand Costero Terrestre projects in the Southern region, as well as in the Crudo LigeroMarino project in the Southwestern Marine region.
1 If no further specification is included, for purposes of analysis, changes are made against the same period of thelast year. The financial statements included in this report are non-audited.
PEMEX Unaudited Financial Results Report as of March 31, 2010
S-1
PEMEX
Corporate Finance Office — Investor
Relations
Table S2Petróleos Mexicanos, Subsidiary Entities and Subsidiary Companies
Production of liquid hydrocarbons First quarter (Jan.-Mar.) 2009 2010 Change (Mbd) Liquid hydrocarbons 3,045 2,994 -1.7% (51)
PEMEX Unaudited Financial Results Report as of March 31, 2010
S-2
PEMEX
Corporate Finance Office — Investor
Relations Natural GasProduction
During the first quarter of 2010, total natural gas production decreased by 1.0%, from 7,018 to6,946 MMcfd.
The production of associated natural gas decreased by 3.9%, primarily due to optimizationworks in the transition zone at the Cantarell project2. In contrast, production of non-associatednatural gas increased by 4.2%, primarily due to the completion of wells in the Burgos project inthe Northern region.
During the first quarter of 2010, the Burgos and Veracruz projects reached a combinedproduction level of 2,434 MMcfd, representing 35% of total natural gas production. OnFebruary 1, 2010, the Burgos project reached its maximum historical production level of 1,624MMcf.
Table S4Petróleos Mexicanos, Subsidiary Entities and Subsidiary Companies
Production of natural gas and gas flaring First quarter (Jan.-Mar.) 2009 2010 Change (MMcfd) Total 7,018 6,946 -1.0% (71)
2 The transition zone is where gas-and oil-producing areas meet. It is characterized by greater associated naturalgas production with high nitrogen content.
PEMEX Unaudited Financial Results Report as of March 31, 2010
S-3
PEMEX
Corporate Finance Office — Investor
Relations Gas Flaring
In the first quarter of 2010, gas flaring decreased by 62.7% as compared to the first quarter of2009. This decrease was primarily due to measures implemented at the Cantarell project tomanage the exploitation of the transition zone, and the construction of infrastructure for handlingand transportation of gas in the marine platforms.
Completion of Wells
During the first quarter of 2010, the number of wells completed increased by 49.6% ascompared to the same quarter of 2009, from 236 wells to 353 wells, primarily due to an increaseof 122 in the number of development wells, which is explained by increased activity in theAceite Terciario del Golfo (ATG) project. We drilled seven exploratory wells in the first quarter of2010, which is five fewer than were drilled during the same quarter of 2009, due to a scheduleddecrease in the activity in the exploration projects of the South region.
Table S6Petróleos Mexicanos, Subsidiary Entities and Subsidiary Companies
Inventory of wells and operating equipment First quarter (Jan.-Mar.) 2009 2010 Change Wells drilled 236 353 49.6% 117
Development 224 346 54.5% 122 Exploration 12 7 -41.7% (5)
(2) As of March 31, 2010, PEMEX owns 126 of these drilling rigs.
Note: Numbers may not total due to rounding. Seismic Information
During the first quarter of 2010, 2D seismic studies acquisition reached 558 km, which is 8,080km fewer than were covered in the same quarter of 2009. This decrease is primarily due to ouronly acquiring information for the Burgos project during the quarter.
In contrast, 3D seismic studies covered 6,499 km2, an increase of 2,641 km2 as compared tothe area covered during the same quarter of 2009. This increase was primarily due to increasedactivity in the deep Gulf of Mexico and in the southeastern basins, as well as in the ATGproject.
Table S7Petróleos Mexicanos, Subsidiary Entities and Subsidiary Companies
Seismic studies First quarter (Jan.-Mar.) 2009 2010 Change Seismic information
During the first quarter of 2010, the main activities focused on counteracting the decline of theCantarell project were:
• completion of 1 development well; • 16 major and 7 minor well workovers; and • installation of 4 well recovery platforms: Akal-TTM, Akal-TI, Akal-TH and Akal-TKL.
During the first quarter of 2010, the annual rate of decline in the Cantarell project wasmaintained at 15% as a result of optimization works at the project.
KMZ
During the first quarter of 2010, the main activities focused on maintaining production at the KMZproject were:
• completion of 2 development wells; and • 4 major and 12 minor well workovers; During the first quarter of 2010, average hydrocarbons production at KMZ was 848 Mbd. ATG
During the first quarter of 2010, the main activities aimed at expanding capacity and maintaininghigh production levels at the ATG project were:
• completion of 226 development wells; and • 68 major and 97 minor well workovers.
Towards the end of the first quarter of 2010, average hydrocarbons production at the ATG(Chicontepec) project was 39 Mbd.
PEMEX Unaudited Financial Results Report as of March 31, 2010
S-5
PEMEX
Corporate Finance Office — Investor
Relations
Tenders
The main tenders conducted by Pemex-Exploration and Production during the first quarter of 2010 were:
MATERIAL AND LIGHTEQUIPMENT TRANSPORTSERVICES IN THE GULF OFMEXICO
1 lot 41.6
AWARDED
MANTENIMIENTO EXPRESSMARITIMO S.A.P.I DE C.V.
1 lot 41.7
AWARDED
CONSULTORIA Y SERVICIOSPETROLEROS, S.A. DE C.V.
1 lot 41.8
AWARDED
TIDEWATER DE MEXICO, S.A.DE C.V.
1 lot 51.8
AWARDED
NAVIERA BOURBONTAMAULIPAS, S.A. DE C.V.
1 lot 52.0
AWARDED
NAVIERA INTEGRAL, S.A. DEC.V.
18575088-006-09 219.0 1-Mar-10 CHRISTMAS TREE 5 lots
75.0
CHRISTMAS TREE
AWARDED
COOPER CAMERON DEMEXICO, S.A. DE C.V.
5 lots 41.4
CHRISTMAS TREE
AWARDED
FMC TECHNOLOGIES DEMÉXICO, S.A. DE C.V.
14 lots 80.6
CHRISTMAS TREE
AWARDED
VETCO GRAY MÈXICO S.A.DE C.V.
5 lots
21.9
CHRISTMAS TREE ANDSPINDLE HEAD FOR PIPELINES
AWARDED
WOOD GROUP PRESSURECONTROL DE MEXICO S.A.DE C.V.
18575107-057-09
167.2
18-Jan-10
MATERIAL, EQUIPMENT ANDREMNANTS TRANSPORTSERVICES
AWARDED
TIDEWATER DE MEXICO, S.A.DE C.V.
18575107-002-10
164.0
25-Feb-10
MATERIAL AND LIGHTEQUIPMENT TRANSPORTSERVICES IN THE GULF OFMEXICO
2 lots 116.4
AWARDED
NAVIERA INTEGRAL, S.A. DEC.V.
1 lots 47.8
AWARDED
TIDEWATER DE MEXICO, S.A.DE C.V.
18575004-006-10
161.7
26-Feb-10
REHABILITATION OF ELECTRICMEASURING EQUIPMENTS,QUALITY, AUTOMATIZATION ANDSAFETY ON THE OPERATIONALSECTORS OF THE HIDROCARBON TRANSPORTAND DISTRIBUTION OFFICE
AWARDED
INGENIERIA ORCO, S.A. DEC.V.
18575107-061-09 159.9
26-Jan-10
MATERIAL AND EQUIPMENTTRANSPORT SERVICES
AWARDED
TRANSPORTACION MARITIMAMEXICANA SA DE CV
18575008-039-09 139.7 29-Jan-10 CONSTRUCTION, AWARDED CONSTRUCCIONES Y
INTEGRAL REHABILITATION OFMEASURING SYSTEMS,CONTROL AND SAFETY OFTHE HIDROCARBONRECIPIENTS IN THEEXPLOITATION FACILITIES OFTHE VERACRUZ ASSET
AWARDED
SISTEMAS INTEGRALES DECOMPRESION, S.A. DE C.V
18575107-053-09
101.1
25-Jan-10
SELF-PROPELING CRANESERVICES FOR LOADING,OFFLOADING ANDMANEUVERING IN THEOPERATIONAL AND STORAGEFACILITIES OF THE MARINEREGION
AWARDED
MAQUINARIAINTERCONTINENTAL, S.A. DEC.V.
18575108-016-09
100.8
17-Mar-10
BUILDING CONSTRUCTION
AWARDED
CMT CAMPECHECONSTRUCCIONES, S.A DEC.V.
Note: For further information on these and other tenders, consult www.compranet.gob.mx.
Refining Processing
During the first quarter of 2010, total crude oil processing decreased by 4.9 percent, due tononscheduled maintenance activities. The proportion of light crude oil in total crude processedincreased by one percentage point.
Table S9Petróleos Mexicanos, Subsidiary Entities and Subsidiary Companies
Crude oil processing First quarter (Jan.-Mar.) 2009 2010 Change (Mbd) Total processed 1,324 1,259 -4.9% (65)
(1) Excludes reconstituted crude.Note: Numbers may not total due to rounding. CapacityUtilization
During the first quarter of 2010, the primary distillation capacity utilization rate decreased to82.3% or 4.5 percentage points less than the rate registered during the same quarter of 2009,due to increased maintenance activities and electric disruptions.
PEMEX Unaudited Financial Results Report as of March 31, 2010
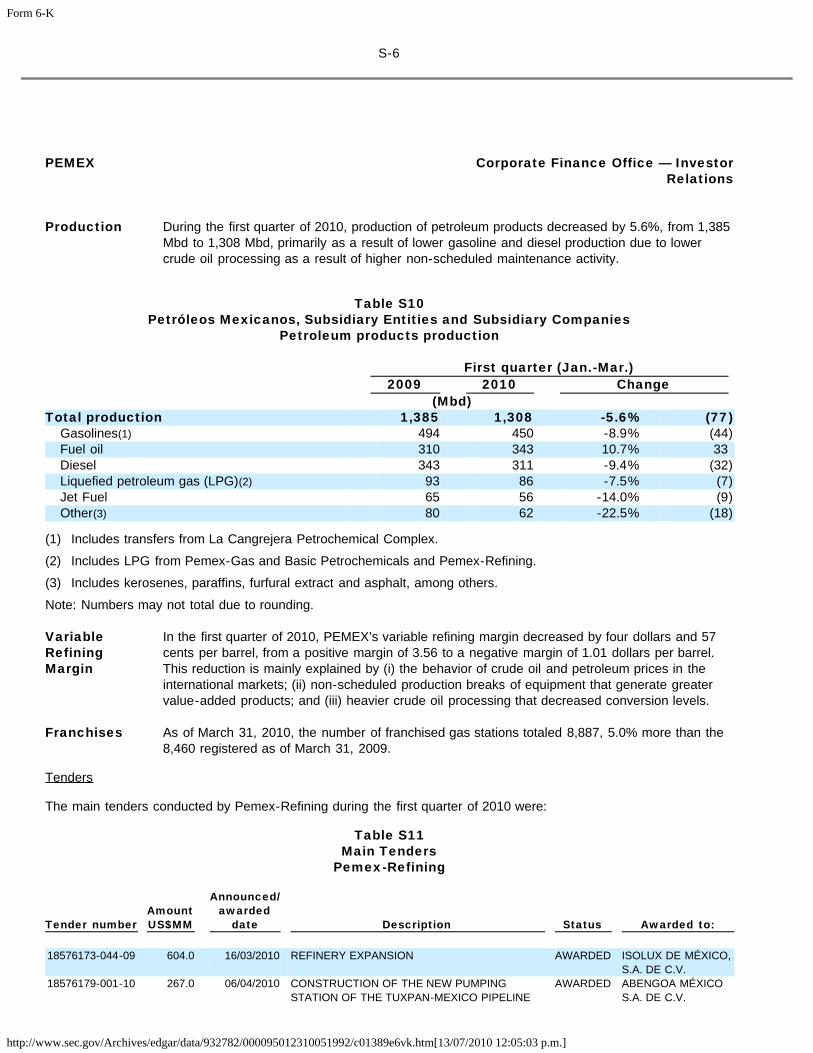
During the first quarter of 2010, production of petroleum products decreased by 5.6%, from 1,385Mbd to 1,308 Mbd, primarily as a result of lower gasoline and diesel production due to lowercrude oil processing as a result of higher non-scheduled maintenance activity.
Table S10Petróleos Mexicanos, Subsidiary Entities and Subsidiary Companies
Petroleum products production First quarter (Jan.-Mar.) 2009 2010 Change (Mbd) Total production 1,385 1,308 -5.6% (77)
(1) Includes transfers from La Cangrejera Petrochemical Complex.
(2) Includes LPG from Pemex-Gas and Basic Petrochemicals and Pemex-Refining.
(3) Includes kerosenes, paraffins, furfural extract and asphalt, among others.
Note: Numbers may not total due to rounding. VariableRefiningMargin
In the first quarter of 2010, PEMEX’s variable refining margin decreased by four dollars and 57cents per barrel, from a positive margin of 3.56 to a negative margin of 1.01 dollars per barrel.This reduction is mainly explained by (i) the behavior of crude oil and petroleum prices in theinternational markets; (ii) non-scheduled production breaks of equipment that generate greatervalue-added products; and (iii) heavier crude oil processing that decreased conversion levels.
Franchises
As of March 31, 2010, the number of franchised gas stations totaled 8,887, 5.0% more than the8,460 registered as of March 31, 2009.
Tenders
The main tenders conducted by Pemex-Refining during the first quarter of 2010 were:
Table S11Main Tenders
Pemex-Refining Announced/ Amount awarded Tender number US$MM date Description Status Awarded to: 18576173-044-09
604.0
16/03/2010
REFINERY EXPANSION
AWARDED
ISOLUX DE MÉXICO,S.A. DE C.V.
18576179-001-10
267.0
06/04/2010
CONSTRUCTION OF THE NEW PUMPINGSTATION OF THE TUXPAN-MEXICO PIPELINE
Note: For further information on these and other tenders, consult www.compranet.gob.mx.
Gas and Basic Petrochemicals GasProcessing
During the first quarter of 2010, total onshore natural gas processing increased by 4.9%, mainlydue to higher availability of sour wet gas in the marine regions, which increased by 3.3%.Additionally, sweet wet gas processing increased by 10.2%, due to the incorporation of new wellsin the north of Mexico.
As a result, dry natural gas production increased by 5.2%, and natural gas liquids productionincreased by 2.5%.
PEMEX Unaudited Financial Results Report as of March 31, 2010
S-7
PEMEX
Corporate Finance Office — Investor
Relations
Table S12Petróleos Mexicanos, Subsidiary Entities and Subsidiary Companies
Natural gas processed and dry gas production First quarter (Jan.-Mar.) 2009 2010 Change (MMcfd) On-shore gas processed 4,355 4,568 4.9% 212
Sour wet gas 3,345 3,454 3.3% 109 Sweet wet gas 1,011 1,114 10.2% 103
Production
Dry natural gas 3,503 3,683 5.2% 180 Natural gas liquids (Mbd)(1) 378.09 387.44 2.5% 9
(1) Includes condensates and other streams to fractionating process.Note: Numbers may not total due to rounding. Xalapa bypass
Advancements in the construction of 22km of 48” natural gas pipeline bypass to the city ofXalapa, Veracruz from the Emiliano Zapata compression station, included the following as ofMarch 31, 2010:
• overhauling of 20.9 km of rights of way; • transportation and installation of 19.7 km of pipeline
As of March 31, 2010, the construction of the pipeline bypass has been 45.4% completed. Theproject was expected to be completed by April 2010, but because of drawbacks at theconstruction site, this date has been postponed.
Poza RicaGPC
The project to expand capacity at the Poza Rica Gas Processing Center (GPC) includes theconstruction of a cryogenic plant with a capacity of 200 MMcfd, in order to process sweet wetgas from the ATG project. As of March 31, 2010, the main results of the project were:
• advancement of 37% in the detailed engineering study;
• placing of 100% of the purchase orders for critical equipment (electrical equipment, cooling
spheres, turbocompressors, cold boxes, separation columns) • continuation of field compaction; and • advancement of 60% in the construction of operating platforms.
The total estimated investment in this project for the 2009-2011 period amounts to Ps. 4.2 billion.This amount was adjusted in Ps 0.3 billion as compared to the fourth quarter of 2009 report dueto new economies as a result of a revision of the original project.
PEMEX Unaudited Financial Results Report as of March 31, 2010
S-8
PEMEX
Corporate Finance Office — Investor
Relations Nuevo PEMEX Cogeneration
The cogeneration project at the Nuevo PEMEX GPC is the first high-caliber cogeneration projectdevoted to supply steam and electricity to that GPC, and to provide surplus electricity to otherworking centers.
As of March 31, 2010, the main results of this project were the following:
• completion of land clearing, topographic and geotechnical studies related with the field and
access roads; • initiation of structural work in the areas where heat recovery equipment will be located; • allocation of purchase orders for an electric substation and a potency transformer;
• continuation of topographic and soil mechanics studies relating to development of the
transmission system.
Tenders
The main tenders conducted by Pemex-Gas and Basic Petrochemicals during the first quarter of 2010 were:
Table S13Main Tenders
Pemex-Gas and Basic Petrochemicals Amount Announced/awarded Tender number US$MM date Description Status Awarded to:18577001-010-09
237.6
21-Jan-10
HEAT RECOVERYEQUIPMENT
AWARDED
CERREY, S.A. DEC.V.
Note: For further information on these and other tenders, consult www.compranet.gob.mx.
Petrochemicals Production During the first quarter of 2010, total petrochemicals production decreased by 6.7%, from 1,140
to 1,064 thousand tons (Mt). This decrease was primarily due to:
• a decrease in production of methane derivatives, particularly ammonia, due tononscheduled maintenance activity in the Ammonia VI plant of the CosoleacaquePetrochemical Complex;
• a decrease in production of aromatics and derivatives, primarily due to decreasedproduction of high-octane hydrocarbons, as a result of a change in the production schemefor imported naphta; and
• an increase in the production of ethane derivatives, particularly ethylene oxide and vinyl
chloride.
PEMEX Unaudited Financial Results Report as of March 31, 2010
S-9
PEMEX
Corporate Finance Office — Investor
Relations
Table S14Petróleos Mexicanos, Subsidiary Entities and Subsidiary Companies
Net production of petrochemicals First quarter (Jan.-Mar.) 2009 2010 Change (Mt) Total production 1,140 1,064 -6.7% (76)
(1) Includes glycols, heavy reformed, oxygen, hydrogen, nitrogen, chlorhydric acid, muriatic acid, hexane, heptanes,benzene, carbon dioxide, TX liquids, amorphous gasoline, heavy naphtha, butadiene and others. Figures excludelong residue.
Note: Numbers may not total due to rounding. InfrastructureProjects
As of March 31, 2010, physical construction on the project to modernize and increase thecapacity of the aromatics train at the Cangrejera Petrochemical Complex (PC) was 9.3%complete. The modernized aromatics train is expected to begin operations in 2012.
In the same way, physical construction of the first stage of the project to expand the capacity ofthe ethylene oxide plant in the Morelos PC was 99.6% complete.
Tenders
During the first quarter of 2010 Pemex-Petrochemicals did not announce or award any tenderswith a value greater than Ps. 100 million.
InternationalTrade3
Crude Oil
During the first quarter of 2010, the volume of crude oil exports decreased by 1.9% as comparedto the same quarter of 2009, from 1,279 to 1,255 Mbd, primarily as a result of lower crude oilproduction.
Approximately 80.0% of total crude oil exports was composed of heavy crude oil (Maya andAltamira); the remainder consisted of light and extra-light crude oil (Isthmus and Olmeca).
PEMEX exported 78.6% of its total crude oil exports to the United States of America, while theremaining 21.4% was distributed among Europe (13.8%), the rest of the Americas (2.7%) and theFar East (4.9%).
The weighted average export price of the Mexican crude oil basket increased by 81.6%, fromUS$39.4 to US$71.5.
3 According to data provided by P.M.I.®, except natural gas.
PEMEX Unaudited Financial Results Report as of March 31, 2010
S-10
PEMEX
Corporate Finance Office — Investor
Relations Dry Gas
During the first quarter of 2010, dry gas exports decreased, from 64 to 49 MMcfd, and dry gasimports increased from 395 to 434 MMcfd, primarily due to higher demand from the country’selectricity sector.
Petroleumproducts andPetrochemicals
During the first quarter of 2010, exports of petroleum products decreased from 269 to 214 Mbd,primarily due to decreased exports of long residue as a result of the shut-down of theprocessing residual plant at Cangrejera; which was partially offset by an increase in fuel oilexports. Petroleum products imports increased from 452 to 570 Mbd, primarily due to increasedgasoline and diesel purchases as a result of lower production and domestic demand.
By volume, the main petroleum product exported during the first quarter of 2010 was fuel oil,while the main imported products were gasoline and diesel as a result of decreased productionand increased internal demand respectively.
Petrochemical exports increased from 125 to 186 Mt, primarily due to increased sulfur4 andbenzene sales. In addition, petrochemical imports decreased from 138 to 93 Mt, primarily as aresult of increased methanol and isobutene purchases.
By volume, the main petrochemicals exported during the first quarter of 2010, were sulfur andethylene; the main petrochemicals imported were ammonia, methanol and isobutene.
(2) Includes 70 Mbd and 78 Mbd of LPG for the first quarter of 2009 and 2010, respectively.Note: Numbers may not total due to rounding.
4 Sulfur is included as a petrochemical product for categorization purposes only.
PEMEX Unaudited Financial Results Report as of March 31, 2010
S-11
PEMEX
Corporate Finance Office — Investor
Relations
Industrial Safety, Environmental Protection and Social Development IndustrialSafety
During the first quarter of 2010, the frequency index of industrial accidents decreased 0.11 units,as compared to the first quarter of 2009, to 0.31 incapacitating accidents per million man-hoursworked (MMhw). Similarly, the severity index decreased 10 units to 8.4 days lost per MMhw. Theimprovements in both indexes are primarily explained by the reinforcement of PEMEX-SSPA5,which implements several tools to decrease accidents occurrence, among them, (i) effectiveaudits on critical processes; (ii) operational discipline on high-risk processes; (iii) analysis of laborsafety; and (iv) analysis of recurring incidents.
EnvironmentalProtection
During the first quarter of 2010, the sulfur oxide emissions index decreased to 2.16 tons perthousand tons (t/Mt), 0.68 units fewer as compared to the first quarter of 2009, primarily due tolower sour gas recovery by Pemex — Exploration and Production, and sulfur recovery in theNational Refining System6.
Petróleos Mexicanos, Subsidiary Entities and Subsidiary CompaniesIndustrial safety and environmental protection
First quarter (Jan.-Mar.) 2009 2010 Change Selected indexes
Frequency index (1) 0.62 0.33 -46.8% (0.29)Severity index (2) 41.0 23.0 -43.9% (18.00)Sulfur oxide emissions (t/Mt) 2.15 2.53 17.7% 0.38 Reused water / Use and management 0.03 0.06 100.0% 0.03
(1) PEMEX incapacitating work accidents frequency index per million man-hours of risk exposure. Quarterlyfigures include information for the last month of the period.
(2) PEMEX incapacitating work accidents severity index measures the number of days lost to incapacitating workaccidents. Quarterly figures include information for the last month of the period.
Note: Numbers may not total due to rounding.
5 The frequency index is the number of accidents that result in incapacitating injuries per MMhw of risk exposureduring the relevant period. An incapacitating accident is a sudden or unexpected event that provokes a bodilyinjury, functional disability or death, immediately or at later time, while working or as a result of work. Riskexposure man hours are the number of hours worked by all personnel, inside or outside of working facilities,during and outside standard working hours, including overtime hours. The “severity index” is the number of dayslost per MMhw of risk exposure during the relevant period. Lost days are those missed due to medical incapacityas a result of work accident injuries or rewarded as compensation for partial, total or permanent incapacity, or fordeath.
6 Average sulfur oxide emissions (SOX) by thousand tons.
PEMEX Unaudited Financial Results Report as of March 31, 2010
S-12
PEMEX
Corporate Finance Office — Investor
Relations
If you would like to contact Investor Relations, please call or send an e-mail to: Telephone: (52 55) 1944 9700Voice mail: (52 55) 1944 2500 ext. 59412
If you would like to be included in our distribution list, please access www.ri.pemex.com and then “Distribution List”.
PEMEX’s e-mails were modified since April 19, 2010. The new Investor Relations Office’s e-mails are the following: Celina Torres Mario Luis [email protected]
PEMEX is Mexico’s national oil and gas company. Created in 1938, it is the exclusive producerof Mexico’s oil and gas resources. The operating subsidiary entities are Pemex-Exploration andProduction, Pemex-Refining, Pemex-Gas and Basic Petrochemicals and Pemex-Petrochemicals.The principal subsidiary company is PMI Comercio Internacional, S.A. de C.V., Pemex’sinternational trading arm.
Convenience translations into US dollars of amounts in pesos for the Balance Sheet have been made at theestablished exchange rate, at March 31, 2010, of Ps. 12.3306 = US$1.00; other translations into US dollars ofamounts in pesos have been made at the average exchange rates of Ps. 12.7928 = US$1.00 for the first quarter of2010. Such translations should not be construed as a representation that the peso amounts have been or could beconverted into US dollars at the foregoing or any other rate.
This report contains forward-looking statements. We may also make written or oral forward-looking statements in ourperiodic reports to the Comisión Nacional Bancaria y de Valores (Mexican National Banking and SecuritiesCommission, or CNBV) and the U.S. Securities and Exchange Commission (SEC), in our annual report, in ouroffering circulars and prospectuses, in press releases and other written materials and in oral statements made by ourofficers, directors or employees to third parties. We may include forward-looking statements that address, among other things, our:
• drilling and other exploration activities; • import and export activities; • projected and targeted capital expenditures and other costs, commitments and revenues; and liquidity, etc..
Actual results could differ materially from those projected in such forward-looking statements as a result of variousfactors that may be beyond our control. These factors include, but are not limited to:
• changes in international crude oil and natural gas prices; • effects on us from competition; • limitations on our access to sources of financing on competitive terms; • significant economic or political developments in Mexico; • developments affecting the energy sector; and • changes in our regulatory environment.
Accordingly, you should not place undue reliance on these forward-looking statements. In any event, thesestatements speak only as of their dates, and we undertake no obligation to update or revise any of them, whether asa result of new information, future events or otherwise. These risks and uncertainties are more fully detailed inPEMEX’s most recent Form 20-F filing, as amended, with the SEC (www.sec.gov) and the PEMEX prospectus filedwith the CNBV and available through the Mexican Stock Exchange (www.bmv.com.mx). These factors could causeactual results to differ materially from those contained in any forward-looking statement.
The SEC permits flings of oil and gas companies to disclose only proved reserves that a company has demonstratedby actual production or conclusive formation tests to be economically and legally producible under existing economicand operating conditions. We use certain terms in this document, such as total reserves, probable reserves andpossible reserves, that the SEC’s guidelines strictly prohibit us from including in filings with the SEC. Investors areurged to consider closely the disclosure in our Form 20-F “File No. 0-99”, available from us at www.pemex.com orMarina Nacional 329, Floor 38, Col. Huasteca, Mexico City 11311 or at (52 55) 1944 9700. You can also obtain thisForm from the SEC ‘s website, www.sec.gov. Investors are also welcome to review the annual report to the CNBV,available at www.pemex.com.
PEMEX Unaudited Financial Results Report as of March 31, 2010
SIGNATURES
Pursuant to the requirements of the Securities Exchange Act of 1934, the registrant has duly caused this reportto be signed on its behalf by the undersigned, thereunto duly authorized. Petróleos Mexicanos
By: /S/ ARTURO DELPECH DEL ÁNGEL Name: Arturo Delpech del Ángel Title: Associate Managing Director of Finance
Date: May 21, 2010
FORWARD-LOOKING STATEMENTS
This report contains words, such as “believe,” “expect,” “anticipate” and similar expressions that identify forward-looking statements, which reflect our views about future events and financial performance. We have made forward-looking statements that address, among other things, our:
• drilling and other exploration activities;
• import and export activities;
• projected and targeted capital expenditures and other costs, commitments and revenues; and
• liquidity.
Actual results could differ materially from those projected in such forward-looking statements as a result ofvarious factors that may be beyond our control. These factors include, but are not limited to:
• changes in international crude oil and natural gas prices;
• effects on us from competition;
• limitations on our access to sources of financing on competitive terms;
• significant economic or political developments in Mexico;
• developments affecting the energy sector; and
• changes in our regulatory environment.
Accordingly, you should not place undue reliance on these forward-looking statements. In any event, thesestatements speak only as of their dates, and we undertake no obligation to update or revise any of them, whether asa result of new information, future events or otherwise.