65
INTERIM RESULTS FOR THE SIX MONTHS ENDED 31 DECEMBER 2017 We do it better

INTERIM RESULTSFOR THE SIX MONTHS ENDED
31 DECEMBER 2017
We do it better
Investor relations Jongisa MagagulaCorporate Development and Head of Investor RelationsTelephone: +27 11 779 1300Email: [email protected]
Company secretaryAlyson D’Oyley, BCom, LLB, LLMTelephone: +27 11 779 1300Email: [email protected]
Shareholder informationIssued share capital at 31 December 2017 219 691 837 shares
Market capitalisation at 31 December 2017 ZAR29.5 billion
Market capitalisation at 31 December 2017 US$2.4 billion
Closing share price at 31 December 2017 R134.24
Six-months high (1 July 2017 – 31 December 2017) R140.97
Six-months low (1 July 2017 – 31 December 2017) R78.01
Average daily volume traded for the six months 795 558 shares
Primary listing JSE Limited
JSE Share Code ARI
ADR ticker symbol AFRBY
Interim results for the six months ended 31 December 2017
ContentsPresentation
2 Overview and strategy Patrice Motsepe, Executive Chairman
14 Operational review Mike Schmidt, Chief Executive Officer
Results commentary
37 Salient features
38 Overview
42 Financial commentary
44 ARM Ferrous
48 ARM Platinum
55 ARM Coal
59 ARM Copper
60 Harmony Gold Mining Company Limited
61 Outlook
62 Dividends
63 Review by Independent Auditors
Group financial statements
66 Group statement of financial position
67 Group income statement
68 Group statement of comprehensive income
70 Group statement of changes in equity
72 Group statement of cash flows
73 Notes to the financial statements
Contact details
37
Salient features
Headline earnings (R million)
0
500
1 000
1 500
2 000
2 500 2 33
1
1 76
7
718
544
1 50
3
1 40
6
2 34
1
1 02
6
507
1 69
3 1 94
5
F2018F2017F2016F2015F2014F2013
First half (1H) Second half (2H)
Segmental EBITDA margins (%)
(10) 0 10 20 30 40 50
38
43
41
26
12
(2)
44
30
30
24
18
(7)Copper
Nickel
PGMs
Manganese
Coal (GGV)
Iron ore
1H F2017 1H F2018
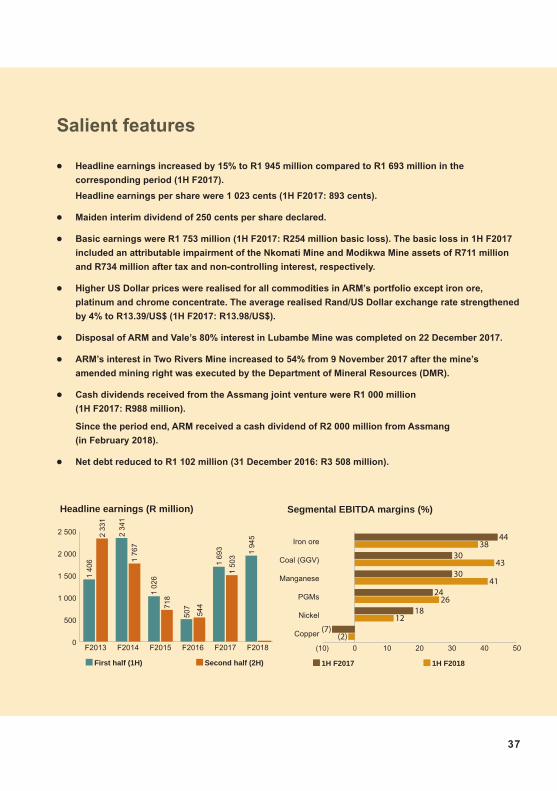
• Headline earnings increased by 15% to R1 945 million compared to R1 693 million in the
corresponding period (1H F2017).
Headline earnings per share were 1 023 cents (1H F2017: 893 cents).
• Maiden interim dividend of 250 cents per share declared.
• Basic earnings were R1 753 million (1H F2017: R254 million basic loss). The basic loss in 1H F2017
included an attributable impairment of the Nkomati Mine and Modikwa Mine assets of R711 million
and R734 million after tax and non-controlling interest, respectively.
• Higher US Dollar prices were realised for all commodities in ARM’s portfolio except iron ore,
platinum and chrome concentrate. The average realised Rand/US Dollar exchange rate strengthened
by 4% to R13.39/US$ (1H F2017: R13.98/US$).
• Disposal of ARM and Vale’s 80% interest in Lubambe Mine was completed on 22 December 2017.
• ARM’s interest in Two Rivers Mine increased to 54% from 9 November 2017 after the mine’s
amended mining right was executed by the Department of Mineral Resources (DMR).
• Cash dividends received from the Assmang joint venture were R1 000 million
(1H F2017: R988 million).
Since the period end, ARM received a cash dividend of R2 000 million from Assmang
(in February 2018).
• Net debt reduced to R1 102 million (31 December 2016: R3 508 million).
Interim results for the six months ended 31 December 2017
38
OverviewThe ARM Board of Directors (the Board) announces a 15% increase in headline earnings for the six months ended 31 December 2017 to R1 945 million (1H F2017: R1 693 million). This increase was mainly as a result of improved headline earnings from the Manganese Division, ARM Coal, Modikwa Mine and ARM Copper.
As part of ARM’s commitment to shareholder returns, ARM declared a maiden interim dividend of 250 cents per share.
ARM Ferrous headline earnings from continuing operations of R1 765 million were 26% higher (1H F2017: R1 401 million) driven mainly by a 131% increase in headline earnings from the Manganese Division. Significant improvement in the Manganese Division’s earnings was mainly due to increased manganese ore and alloy sales volumes, proportionately more high-grade manganese ore being sold (which resulted in higher average realised manganese ore prices) as well as a 69% increase in manganese alloy prices.
ARM Ferrous headline earnings (including discontinued operations) of R 1 779 million in 1H F2017 included a non-recurring amount of R378 million relating to the sale of ARM’s effective 50% stake in the Dwarsrivier Mine (which was disclosed as a discontinued operation in 1H F2017).
ARM Platinum headline earnings increased by 26% to R226 million (1H F2017: R179 million) as Modikwa Mine improved from a headline loss of R54 million in 1H F2017 to headline earnings of R36 million. Two Rivers Mine headline earnings were 16% lower at R173 million (1H F2017: R205 million) mainly as a result of a decrease in PGM volumes due to a reduction in grades at the mine. Nkomati Mine reported reduced headline earnings as a result of lower sales volumes due to shipment delays. Chrome concentrate sales volumes at Nkomati Mine increased by 105%, however, the average US Dollar price realised for chrome concentrate was 62% lower.
ARM Coal headline earnings were R160 million (1H F2017: R99 million). Goedgevonden (GGV) Mine contributed headline earnings of R35 million (1H F2017: R26 million headline loss) while the PCB operations contributed headline earnings of R125 million (1H F2017: R125 million).
ARM Copper, which is disclosed as a discontinued operation in the period under review, recorded a headline loss of R6 million for the period (1H F2017: R72 million headline loss).
The ARM Corporate and other segment showed an improved headline loss of R200 million (1H F2017: R292 million). The improvement is mainly made up of:• a decrease in foreign exchange losses of R145 million on the revaluation of ARM’s US Dollar loans to Lubambe Mine
prior to and on the disposal of Lubambe Mine;• R60 million lower bonus provision raised; and• higher management fee income of R28 million.
The above was partly offset by a R170 million higher income tax expense recorded for 1H F2018.
The ARM Corporate and other segment includes ARM Exploration costs of R10 million (1H F2017: R12 million).
39
Headline earnings by division/operation
six months ended 31 December
R million2017 2016
Re-presented % change
ARM Platinum 226 179 26
Two Rivers Mine 173 205 (16)
Modikwa Mine 36 (54)
Nkomati Mine 17 28 (39)
ARM Ferrous 1 765 1 779 (1)
Iron Ore Division 873 1 023 (15)
Manganese Division 872 378 131
Chrome Division* (9) 374 (102)
Consolidation adjustment 29 4
ARM Coal 160 99 62
Goedgevonden Mine 35 (26)
PCB Operations 125 125 –
ARM Copper (6) (72) 92
ARM Corporate and other** (200) (292) 32
Headline earnings 1 945 1 693 15
Headline earnings from continuing operations 1 951 1 387 41
Headline earnings from discontinued operations (6) 306 (102)
* The 1H F2017 Chrome Division headline earnings include R378 million relating to the sale of ARM’s effective 50% stake in the Dwarsrivier Chrome Mine.
** The 1H F2017 results have been re-presented following the classification of Lubambe Mine as an asset held for sale. As such, intercompany interest accrued to ARM Company from Lubambe Mine of R130 million (1H F2017: R106 million) has been eliminated from both ARM Copper and Corporate and other segments.
These results have been achieved in conjunction with ARM’s partners at the various operations, Anglo American Platinum Limited (Anglo Platinum), Assore Limited (Assore), Impala Platinum Holdings Limited (Implats), Norilsk Nickel Africa (Pty) Ltd (Norilsk), Glencore South Africa (Glencore), Vale S.A. (Vale) and Zambian Consolidated Copper Mines Investment Holdings (ZCCM-IH).
The interim results for the six months ended 31 December 2017 have been prepared in accordance with International Financial Reporting Standards (IFRS) and the disclosures are in accordance with IAS 34: Interim Financial Reporting.
Rounding of figures may result in minor computational discrepancies on the tabulations.
Interim results for the six months ended 31 December 2017
40
Operating safelyARM is committed to creating a safe and healthy work environment for all employees.
Regrettably an employee, Mr Fabian Majoro, was fatally injured when he was exposed to irrespirable atmosphere underground at Modikwa Mine on 9 October 2017. The Board and management express their sincerest condolences to the family, friends and colleagues of Mr Majoro. Prior to this accident, ARM’s operations had been fatality-free since May 2015.
The Lost Time Injury Frequency Rate (LTIFR) for 1H F2018 was 0.41 per 200 000 man-hours (1H F2017: 0.33). There were 51 Lost Time Injuries (LTIs) for the six months under review compared to 37 in the corresponding period.
Safety achievements in the period under review:• On 3 July 2017, Modikwa Mine completed 4 million fatality-free shifts.• On 18 August 2017, Two Rivers Mine completed 4 million fatality-free shifts.• On 18 October 2017, Beeshoek Mine recorded 16 000 fatality-free production shifts and received a certificate from the
DMR for an outstanding safety achievement as the “Most Consistent Surface Mine” in the 2017 Northern Cape Mine Safety Competition.
• On 7 November 2017, Nkomati Mine achieved 6 million fatality-free shifts.
Safety figures and statistics in this report are presented on a 100% basis and exclude the ARM Coal operations which are managed by ARM’s partner.
Corporate transactionsThe disposal of Lubambe Mine was completed on 22 December 2017 when all conditions precedent were met. Lubambe Mine is disclosed as a discontinued operation in terms of IFRS. The 1H F2017 Income Statement has, therefore, been re-presented.
The 1H F2017 results included income from the discontinued chrome operation relating to the sale of ARM’s effective 50% interest in Dwarsrivier Mine. Machadodorp Works is the only remaining operation in Assmang’s Chrome Division.
Further to the consent received by Two Rivers Mine during August 2017 (i) to transfer the Tamboti rights to it, and (ii) to have Two Rivers Mine’s mining right amended accordingly, the amended mining right was executed. This resulted in ARM’s interest in Two Rivers Mine increasing from 51% to 54% from 9 November 2017.
Restructuring loss-making operationsLubambe Mine
The total cash proceeds, in respect of the disposal of ARM and Vale’s 80% interest in Lubambe Mine was US$97.10 million adjusted for: • settlement of Lubambe Mine’s general banking facility of US$26 million; • payment of property transfer tax of US$10 million;• payment of withholding tax of US$5 million; and • reimbursement of funding provided to Lubambe Mine after 1 May 2017 of US$25 million.
The final proceeds were received by ARM and Vale in December 2017. Refer to note 12 to the financial statements for more details.
41
Nkomati Mine
Nkomati Mine headline earnings were 39% lower than the corresponding period mainly as a result of reduced sales volumes due to shipping delays. Nkomati Mine’s tonnes milled increased by 14% to 4.08 million tonnes. Nickel units produced were, however, only 2% higher as insufficient availability of high-grade MMZ ore and the processing of Very Low Grade (VLG) MMZ stockpile material resulted in a reduction of the mine’s head grade from 0.28% to 0.24%. Nickel produced was 6 733 tonnes (1H F2017: 6 627 tonnes) while by-products PGM and copper volumes increased by 37% and 38% respectively.
As previously reported, Nkomati Mine is in a challenging period which is expected to continue until the end of F2020. Increased waste stripping is required to increase mining flexibility and the pit requires piling work to improve slope stability. Construction of pile wall 2 in the Western Section to improve slope stability was completed in the period under review and the mine continues to progress with buttressing work. Waste stripping continues to be a challenge. In the period under review waste mined was lower than planned at 11 million tonnes due to rescheduling and reallocation of equipment between the Eastern and Western sections of the pit. Waste stripping is expected to remain challenging at an annualised rate of approximately 23 million tonnes per annum (compared to the 27 million tonnes per annum required to ensure mining flexibility). This is expected to impact nickel volumes to F2020.
Modikwa Mine
Modikwa Mine headline earnings of R36 million represent a turnaround from the R54 million headline loss reported for 1H F2017. Modikwa Mine delivered a 16% increase in PGM volumes.
The South 2 Shaft Project is advancing well. The first phase of the project is expected to enhance mining flexibility while also contributing to the overall production build-up of the mine. Phase one of the project has been completed and is expected to take the production capacity to 50 000 tonnes of ore per month by F2019.
ARM Coal
Negotiations with Glencore to restructure the ARM Coal debt to improve ARM’s obligations in terms of these loans are ongoing.
Changes to Mineral Resources and Mineral ReservesThere has been no material change to ARM’s Mineral Resources and Reserves as disclosed in the Integrated Annual
Report for the financial year ended 30 June 2017, other than depletion due to continued mining activities at the operations
with the exception of:
• Lubambe Mine Mineral Resources and Mineral Reserves which are no longer reported by ARM after completion of the
disposal of ARM’s interest in December 2017.
• Two Rivers Mine, where the transfer of Tamboti Platinum (Kalkfontein RE portion) was completed in November 2017.
The Mineral Resources and Mineral Reserves of the Kalkfontein RE portion will now be reported as part of Two Rivers
Mine, and in terms of the agreement, ARM’s attributable interest in Two Rivers Mine will increase from 51% to 54%.
An updated Mineral Resources and Mineral Reserves Statement will be issued in the Company’s F2018 Integrated Annual
Report.
Interim results for the six months ended 31 December 2017
42
Financial commentary
EarningsHeadline earnings for the six-month period to 31 December 2017 were R1 945 million or 15% higher than the corresponding period’s headline earnings (1H F2017: R1 693 million). This equates to headline earnings per share of 1 023 cents (1H F2017: 893 cents).
Basic earnings for 1H F2018 were R1 753 million (1H F2017: R254 million basic loss) and were impacted by an after-tax and non-controlling interest loss on the disposal of Lubambe Mine of R179 million. The 1H F2017 basic loss included:• an attributable impairment of the Nkomati assets of R711 million after tax; • an attributable impairment of the Modikwa assets of R734 million after tax and non-controlling interest; and• an impairment loss of R422 million within the Assmang joint venture related to the sale of Dwarsrivier Mine.
The reconciliation of basic earnings to headline earnings is provided in note 8 to the financial statements. Basic earnings per share increased from a basic loss of 134 cents to basic earnings of 922 cents.
Sales from continuing operations for the reporting period were 2% higher in 1H F2018 at R4 260 million (1H F2017: R4 176 million). Sales for ARM Ferrous increased by 12% to R6 816 million (1H F2017: R6 088 million).
The average gross profit margin increased to 19% (1H F2017: 16%). The gross profit margins achieved at each operating division may be ascertained from the detailed segment reports provided in note 2 to the financial statements.
ARM’s earnings before interest, tax, depreciation and amortisation (EBITDA) from continuing operations, excluding special items and income from associates and joint ventures, were R999 million (1H F2017: R693 million). This is 44% (R306 million) higher than 1H F2017, largely as a result of higher EBITDA contributions from ARM Platinum (R16 million), ARM Coal (R93 million) and ARM Corporate (R230 million), respectively.
The income from joint venture (ARM Ferrous) was R1 765 million (1H F2017: R1 356 million) after special items and is 30% higher than the corresponding period. The detailed and expanded segmental contribution analysis is provided in note 2 to the financial statements.
Exchange rateThe 1H F2018 average Rand/US Dollar was R13.39/US$ (1H F2017: R13.98/US$). For reporting purposes, the closing exchange rate at 31 December 2017 was R12.29/US$ (31 December 2016: R13.73/US$).
CashAt 31 December 2017 cash and cash equivalents were R1 919 million (31 December 2016: R1 335 million) the details of which are reflected in note 5 to the financial statements. This excludes the attributable cash and cash equivalents held at ARM Ferrous (50% of Assmang) of R3 198 million (31 December 2016: R2 588 million).
Dividends paid to ARM shareholders in October 2017 were R1 236 million (1H F2017: R426 million).
Capital expenditure was 23% (R114 million) higher at R603 million for the period (1H F2017: R489 million). Attributable capital expenditure at the Assmang joint venture was flat at R558 million (1H F2017: R555 million).

43
DebtGross debt at the end of the period was 38% lower than the corresponding period at R3 021 million (31 December 2016: R4 843 million). This was mainly due to a reduction in the amount owing on the ARM Corporate facility as well as the discontinued consolidation of the Vale/ARM joint operation loans following the disposal of Lubambe Mine. There was no debt at ARM Ferrous at 31 December 2017 (31 December 2016: nil).
The decrease in gross debt coupled with the proceeds received from the disposal of investments of R741 million resulted in a reduced net debt at 31 December 2017 of R1 102 million (31 December 2016: R3 508 million).
AssetsThe consolidated ARM total assets of R32.5 billion (1H F2017: R31.7 billion) include ARM’s investment in Harmony on 31 December 2017 of R1 444 million (31 December 2016: R2 006 million). Harmony’s share price was R22.69 per share at 31 December 2017 (31 December 2016: R31.53 per share, 30 June 2017: R21.68 per share and 30 June 2016: R52.47 per share).
Events after the reporting date Events after the reporting date are set out in note 16 to the financial statements. Since 31 December 2017, ARM received a dividend of R2 000 million from Assmang.
Interim results for the six months ended 31 December 2017
44
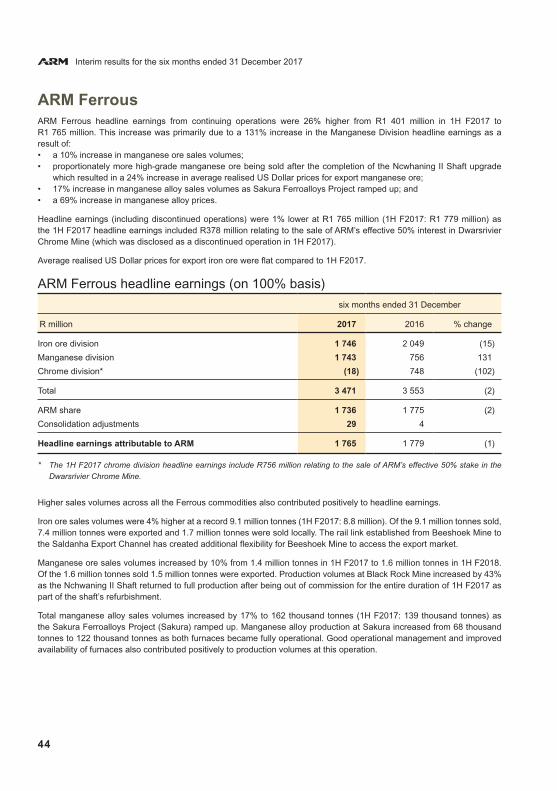
ARM FerrousARM Ferrous headline earnings from continuing operations were 26% higher from R1 401 million in 1H F2017 to R1 765 million. This increase was primarily due to a 131% increase in the Manganese Division headline earnings as a result of:• a 10% increase in manganese ore sales volumes; • proportionately more high-grade manganese ore being sold after the completion of the Ncwhaning II Shaft upgrade
which resulted in a 24% increase in average realised US Dollar prices for export manganese ore;• 17% increase in manganese alloy sales volumes as Sakura Ferroalloys Project ramped up; and • a 69% increase in manganese alloy prices.
Headline earnings (including discontinued operations) were 1% lower at R1 765 million (1H F2017: R1 779 million) as the 1H F2017 headline earnings included R378 million relating to the sale of ARM’s effective 50% interest in Dwarsrivier Chrome Mine (which was disclosed as a discontinued operation in 1H F2017).
Average realised US Dollar prices for export iron ore were flat compared to 1H F2017.
ARM Ferrous headline earnings (on 100% basis)
six months ended 31 December
R million 2017 2016 % change
Iron ore division 1 746 2 049 (15)
Manganese division 1 743 756 131
Chrome division* (18) 748 (102)
Total 3 471 3 553 (2)
ARM share 1 736 1 775 (2)
Consolidation adjustments 29 4
Headline earnings attributable to ARM 1 765 1 779 (1)
* The 1H F2017 chrome division headline earnings include R756 million relating to the sale of ARM’s effective 50% stake in the Dwarsrivier Chrome Mine.
Higher sales volumes across all the Ferrous commodities also contributed positively to headline earnings.
Iron ore sales volumes were 4% higher at a record 9.1 million tonnes (1H F2017: 8.8 million). Of the 9.1 million tonnes sold, 7.4 million tonnes were exported and 1.7 million tonnes were sold locally. The rail link established from Beeshoek Mine to the Saldanha Export Channel has created additional flexibility for Beeshoek Mine to access the export market.
Manganese ore sales volumes increased by 10% from 1.4 million tonnes in 1H F2017 to 1.6 million tonnes in 1H F2018. Of the 1.6 million tonnes sold 1.5 million tonnes were exported. Production volumes at Black Rock Mine increased by 43% as the Nchwaning II Shaft returned to full production after being out of commission for the entire duration of 1H F2017 as part of the shaft’s refurbishment.
Total manganese alloy sales volumes increased by 17% to 162 thousand tonnes (1H F2017: 139 thousand tonnes) as the Sakura Ferroalloys Project (Sakura) ramped up. Manganese alloy production at Sakura increased from 68 thousand tonnes to 122 thousand tonnes as both furnaces became fully operational. Good operational management and improved availability of furnaces also contributed positively to production volumes at this operation.
45
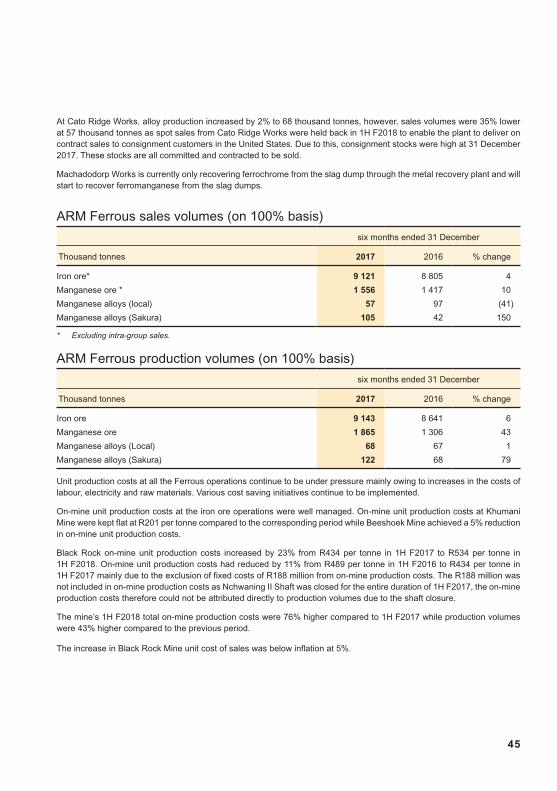
At Cato Ridge Works, alloy production increased by 2% to 68 thousand tonnes, however, sales volumes were 35% lower at 57 thousand tonnes as spot sales from Cato Ridge Works were held back in 1H F2018 to enable the plant to deliver on contract sales to consignment customers in the United States. Due to this, consignment stocks were high at 31 December 2017. These stocks are all committed and contracted to be sold.
Machadodorp Works is currently only recovering ferrochrome from the slag dump through the metal recovery plant and will start to recover ferromanganese from the slag dumps.
ARM Ferrous sales volumes (on 100% basis)
six months ended 31 December
Thousand tonnes 2017 2016 % change
Iron ore* 9 121 8 805 4
Manganese ore * 1 556 1 417 10
Manganese alloys (local) 57 97 (41)
Manganese alloys (Sakura) 105 42 150
* Excluding intra-group sales.
ARM Ferrous production volumes (on 100% basis)
six months ended 31 December
Thousand tonnes 2017 2016 % change
Iron ore 9 143 8 641 6
Manganese ore 1 865 1 306 43
Manganese alloys (Local) 68 67 1
Manganese alloys (Sakura) 122 68 79
Unit production costs at all the Ferrous operations continue to be under pressure mainly owing to increases in the costs of labour, electricity and raw materials. Various cost saving initiatives continue to be implemented.
On-mine unit production costs at the iron ore operations were well managed. On-mine unit production costs at Khumani Mine were kept flat at R201 per tonne compared to the corresponding period while Beeshoek Mine achieved a 5% reduction in on-mine unit production costs.
Black Rock on-mine unit production costs increased by 23% from R434 per tonne in 1H F2017 to R534 per tonne in 1H F2018. On-mine unit production costs had reduced by 11% from R489 per tonne in 1H F2016 to R434 per tonne in 1H F2017 mainly due to the exclusion of fixed costs of R188 million from on-mine production costs. The R188 million was not included in on-mine production costs as Nchwaning II Shaft was closed for the entire duration of 1H F2017, the on-mine production costs therefore could not be attributed directly to production volumes due to the shaft closure.
The mine’s 1H F2018 total on-mine production costs were 76% higher compared to 1H F2017 while production volumes were 43% higher compared to the previous period.
The increase in Black Rock Mine unit cost of sales was below inflation at 5%.

Interim results for the six months ended 31 December 2017
46
ARM Ferrous cost and EBITDA margin performanceOn-mine unit
Unit cost production EBITDA
of sales* cost* margin
Commodity group % change % change %
Iron ore 9 (1) 38
Manganese ore 5 23 44
Manganese alloys (12) 23 26
* Brackets refer to a decrease in unit costs while no brackets refer to an increase in unit costs in the above table.
At Beeshoek Mine, the capital expenditure was R182 million, mainly due to waste-rock removal from the Village Pit as well as replacement of mining equipment. Khumani Mine’s capital expenditure was R426 million, consisting mainly of waste stripping at King Pit, infill drilling, and replacement of mining equipment and fleet.
At Black Rock Mine, capital expenditure was R540 million, consisting mainly of the Black Rock Project, fire protection, finalising the construction of the Hotazel Rail Link line and replacement of mining equipment and fleet.
ARM Ferrous capital expenditure (on 100% basis)
six months ended 31 December
R million 2017 2016
Iron ore 609 368
Manganese 557 786
Total 1 166 1 154
Projects Black Rock ProjectThe modernisation project at Black Rock Mine is continuing on time and within budget. Ramp up of production volumes from the project will proceed as planned in close synchronisation with Transnet.
The new load-out facility and rail loop system have been completed and are being commissioned.
The underground silo and the Graben conveyor system at Nchwaning II Shaft is still under construction and is progressing as planned. The underground work will take a further 24 months to complete where after an increase in production output from Nchwaning II Shaft can be expected.

47
LogisticsAssmang’s manganese ore export volumes are fully contracted with Transnet for F2018 and F2019 through both the Port Elizabeth and Saldanha export channels. In terms of the long-term allocation, Assmang is in ongoing negotiations with Transnet to synchronise the ramp up of Black Rock Mine with the medium- and longer-term (MECA2 and MECA3) Transnet capacity process.
Transnet provided the regular service on the iron ore export supply route from the Khumani Mine to the Port of Saldanha.
Assmang continued to support a junior iron ore producer and exporter by loading rail wagons at its Khumani Mine load-out facility.
The ARM Ferrous operations, held through its 50% investment in Assmang, consist of three divisions: iron ore, manganese and chrome. Assore Limited, ARM’s partner in Assmang, owns the remaining 50%.
Interim results for the six months ended 31 December 2017
48
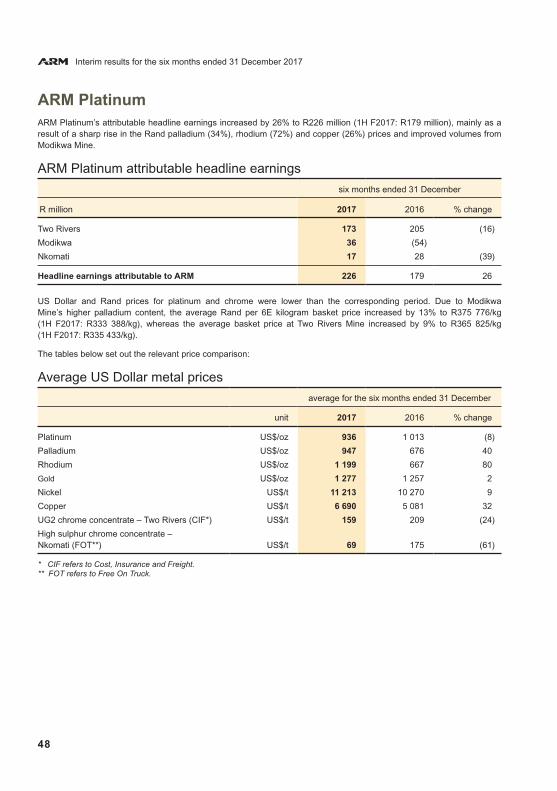
ARM PlatinumARM Platinum’s attributable headline earnings increased by 26% to R226 million (1H F2017: R179 million), mainly as a result of a sharp rise in the Rand palladium (34%), rhodium (72%) and copper (26%) prices and improved volumes from Modikwa Mine.
ARM Platinum attributable headline earnings
six months ended 31 December
R million 2017 2016 % change
Two Rivers 173 205 (16)
Modikwa 36 (54)
Nkomati 17 28 (39)
Headline earnings attributable to ARM 226 179 26
US Dollar and Rand prices for platinum and chrome were lower than the corresponding period. Due to Modikwa Mine’s higher palladium content, the average Rand per 6E kilogram basket price increased by 13% to R375 776/kg (1H F2017: R333 388/kg), whereas the average basket price at Two Rivers Mine increased by 9% to R365 825/kg (1H F2017: R335 433/kg).
The tables below set out the relevant price comparison:
Average US Dollar metal prices
average for the six months ended 31 December
unit 2017 2016 % change
Platinum US$/oz 936 1 013 (8)
Palladium US$/oz 947 676 40
Rhodium US$/oz 1 199 667 80
Gold US$/oz 1 277 1 257 2
Nickel US$/t 11 213 10 270 9
Copper US$/t 6 690 5 081 32
UG2 chrome concentrate – Two Rivers (CIF*) US$/t 159 209 (24)
High sulphur chrome concentrate – Nkomati (FOT**) US$/t 69 175 (61)
* CIF refers to Cost, Insurance and Freight.** FOT refers to Free On Truck.
49
Average Rand metal prices
average for the six months ended 31 December
unit 2017 2016 % change
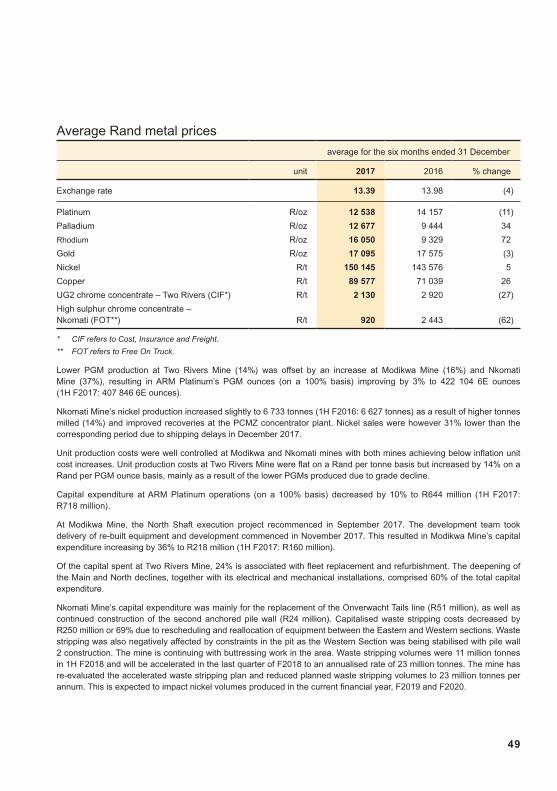
Exchange rate 13.39 13.98 (4)
Platinum R/oz 12 538 14 157 (11)
Palladium R/oz 12 677 9 444 34
Rhodium R/oz 16 050 9 329 72
Gold R/oz 17 095 17 575 (3)
Nickel R/t 150 145 143 576 5
Copper R/t 89 577 71 039 26
UG2 chrome concentrate – Two Rivers (CIF*) R/t 2 130 2 920 (27)
High sulphur chrome concentrate – Nkomati (FOT**) R/t 920 2 443 (62)
* CIF refers to Cost, Insurance and Freight.
** FOT refers to Free On Truck.
Lower PGM production at Two Rivers Mine (14%) was offset by an increase at Modikwa Mine (16%) and Nkomati Mine (37%), resulting in ARM Platinum’s PGM ounces (on a 100% basis) improving by 3% to 422 104 6E ounces (1H F2017: 407 846 6E ounces).
Nkomati Mine’s nickel production increased slightly to 6 733 tonnes (1H F2016: 6 627 tonnes) as a result of higher tonnes milled (14%) and improved recoveries at the PCMZ concentrator plant. Nickel sales were however 31% lower than the corresponding period due to shipping delays in December 2017.
Unit production costs were well controlled at Modikwa and Nkomati mines with both mines achieving below inflation unit cost increases. Unit production costs at Two Rivers Mine were flat on a Rand per tonne basis but increased by 14% on a Rand per PGM ounce basis, mainly as a result of the lower PGMs produced due to grade decline.
Capital expenditure at ARM Platinum operations (on a 100% basis) decreased by 10% to R644 million (1H F2017: R718 million).
At Modikwa Mine, the North Shaft execution project recommenced in September 2017. The development team took delivery of re-built equipment and development commenced in November 2017. This resulted in Modikwa Mine’s capital expenditure increasing by 36% to R218 million (1H F2017: R160 million).
Of the capital spent at Two Rivers Mine, 24% is associated with fleet replacement and refurbishment. The deepening of the Main and North declines, together with its electrical and mechanical installations, comprised 60% of the total capital expenditure.
Nkomati Mine’s capital expenditure was mainly for the replacement of the Onverwacht Tails line (R51 million), as well as continued construction of the second anchored pile wall (R24 million). Capitalised waste stripping costs decreased by R250 million or 69% due to rescheduling and reallocation of equipment between the Eastern and Western sections. Waste stripping was also negatively affected by constraints in the pit as the Western Section was being stabilised with pile wall 2 construction. The mine is continuing with buttressing work in the area. Waste stripping volumes were 11 million tonnes in 1H F2018 and will be accelerated in the last quarter of F2018 to an annualised rate of 23 million tonnes. The mine has re-evaluated the accelerated waste stripping plan and reduced planned waste stripping volumes to 23 million tonnes per annum. This is expected to impact nickel volumes produced in the current financial year, F2019 and F2020.
Interim results for the six months ended 31 December 2017
50
ARM Platinum capital expenditure (on 100% basis)
six months ended 31 December
R million 2017 2016
Modikwa 218 160
Two Rivers 226 175
Nkomati 86 19
Nkomati capitalised waste stripping 114 364
Total 644 718
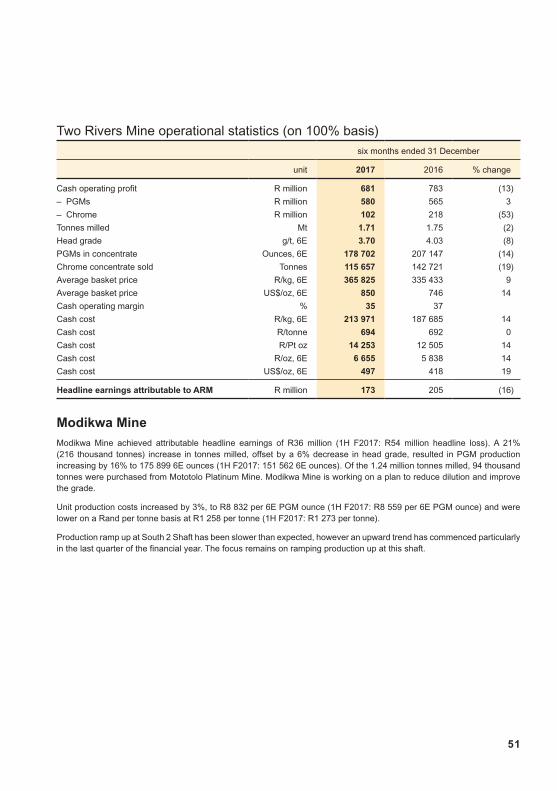
Two Rivers MineHeadline earnings at Two Rivers Mine reduced by 16% to R173 million (1H F2017: R205 million). A 2% decrease in tonnes milled and an 8% reduction in grade, led to PGMs produced declining by 14% to 178 702 6E ounces (1H F2017: 207 147 6E ounces).
The decrease in tonnes milled can be ascribed to a two-day safety-related stoppage at the plant while the decline in head grade is largely attributed to an increase in split reef proportion in the ore mix following the depletion of normal reef in the upper levels of both the Main and North declines. There is currently limited flexibility in blending the ore from split reef and normal reef sources due to face length constraints at Main Decline. Thick areas of split reef are expected to continue affecting the overall mining grade negatively for the next 14 months, resulting in overall mining grades being between 3.70 and 3.80 6E grams per tonne (1H F2017: 3.85 6E grams per tonne). To mitigate the declining grade, there is a drive to increase mining volumes from high-grade panels to enhance the ore mix as well as undercutting the internal waste wherever practically possible.
An attempt to scalp internal waste, both underground and on surface, by means of burden controls within the UG2 internal waste band and the ‘waste scalper screen’, has shown very limited improvement in grade due to the nature of fragmentation of internal waste (i.e. finer fragmentations).
The accelerated sinking at the Main Decline into the Tamboti area is in progress after the Two Rivers Mine amended mining right, including the Tamboti mining rights was executed by the DMR from 9 November 2017.
Chrome sales volumes decreased as a result of lower tonnes milled and lower grade. This, combined with a 27% decline in the Rand chrome price, resulted in chrome cash operating profit declining by 53% to R102 million (1H F2017: R218 million). Chrome concentrate sales volumes declined by 19% to 115 657 tonnes as a result of a lower chrome yield, a direct consequence of the lower PGM grade.
Unit production costs on a Rand per tonne milled basis were flat at R694 per tonne (1H F2017: R692 per tonne). The Rand per PGM ounce produced, however, increased by 14% to R6 655 per 6E ounce (1H F2017: R5 838 per 6E ounce), primarily as a direct result of the decline in PGM ounces produced due to the low grade. These unit production costs were flat compared to 2H F2017 which were R6 599 per 6E ounce. There was a 56 222 tonne decrease in the UG2 Run-of-Mine stockpile to a total of 251 663 tonnes of ore as at 31 December 2017.
51
Two Rivers Mine operational statistics (on 100% basis)six months ended 31 December
unit 2017 2016 % change
Cash operating profit R million 681 783 (13)
– PGMs R million 580 565 3
– Chrome R million 102 218 (53)
Tonnes milled Mt 1.71 1.75 (2)
Head grade g/t, 6E 3.70 4.03 (8)
PGMs in concentrate Ounces, 6E 178 702 207 147 (14)
Chrome concentrate sold Tonnes 115 657 142 721 (19)
Average basket price R/kg, 6E 365 825 335 433 9
Average basket price US$/oz, 6E 850 746 14
Cash operating margin % 35 37
Cash cost R/kg, 6E 213 971 187 685 14
Cash cost R/tonne 694 692 0
Cash cost R/Pt oz 14 253 12 505 14
Cash cost R/oz, 6E 6 655 5 838 14
Cash cost US$/oz, 6E 497 418 19
Headline earnings attributable to ARM R million 173 205 (16)
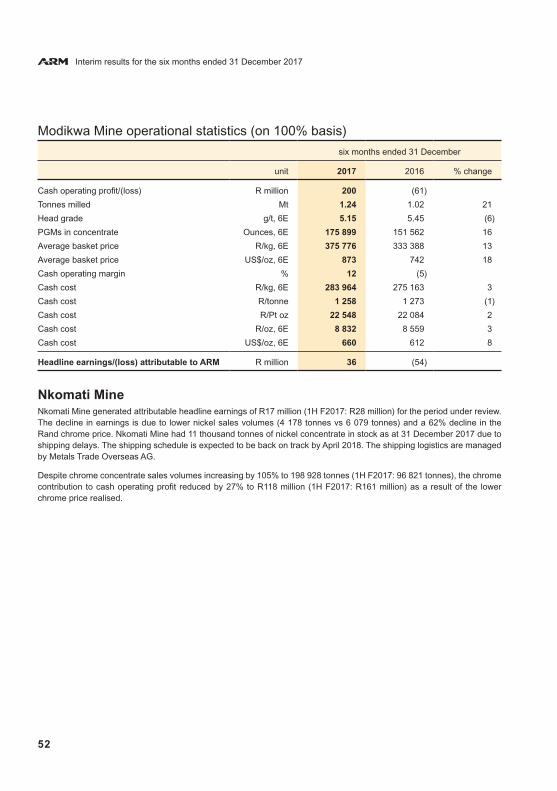
Modikwa MineModikwa Mine achieved attributable headline earnings of R36 million (1H F2017: R54 million headline loss). A 21% (216 thousand tonnes) increase in tonnes milled, offset by a 6% decrease in head grade, resulted in PGM production increasing by 16% to 175 899 6E ounces (1H F2017: 151 562 6E ounces). Of the 1.24 million tonnes milled, 94 thousand tonnes were purchased from Mototolo Platinum Mine. Modikwa Mine is working on a plan to reduce dilution and improve the grade.
Unit production costs increased by 3%, to R8 832 per 6E PGM ounce (1H F2017: R8 559 per 6E PGM ounce) and were lower on a Rand per tonne basis at R1 258 per tonne (1H F2017: R1 273 per tonne).
Production ramp up at South 2 Shaft has been slower than expected, however an upward trend has commenced particularly in the last quarter of the financial year. The focus remains on ramping production up at this shaft.
Interim results for the six months ended 31 December 2017
52
Modikwa Mine operational statistics (on 100% basis)
six months ended 31 December
unit 2017 2016 % change
Cash operating profit/(loss) R million 200 (61)
Tonnes milled Mt 1.24 1.02 21
Head grade g/t, 6E 5.15 5.45 (6)
PGMs in concentrate Ounces, 6E 175 899 151 562 16
Average basket price R/kg, 6E 375 776 333 388 13
Average basket price US$/oz, 6E 873 742 18
Cash operating margin % 12 (5)
Cash cost R/kg, 6E 283 964 275 163 3
Cash cost R/tonne 1 258 1 273 (1)
Cash cost R/Pt oz 22 548 22 084 2
Cash cost R/oz, 6E 8 832 8 559 3
Cash cost US$/oz, 6E 660 612 8
Headline earnings/(loss) attributable to ARM R million 36 (54)
Nkomati MineNkomati Mine generated attributable headline earnings of R17 million (1H F2017: R28 million) for the period under review. The decline in earnings is due to lower nickel sales volumes (4 178 tonnes vs 6 079 tonnes) and a 62% decline in the Rand chrome price. Nkomati Mine had 11 thousand tonnes of nickel concentrate in stock as at 31 December 2017 due to shipping delays. The shipping schedule is expected to be back on track by April 2018. The shipping logistics are managed by Metals Trade Overseas AG.
Despite chrome concentrate sales volumes increasing by 105% to 198 928 tonnes (1H F2017: 96 821 tonnes), the chrome contribution to cash operating profit reduced by 27% to R118 million (1H F2017: R161 million) as a result of the lower chrome price realised.
53
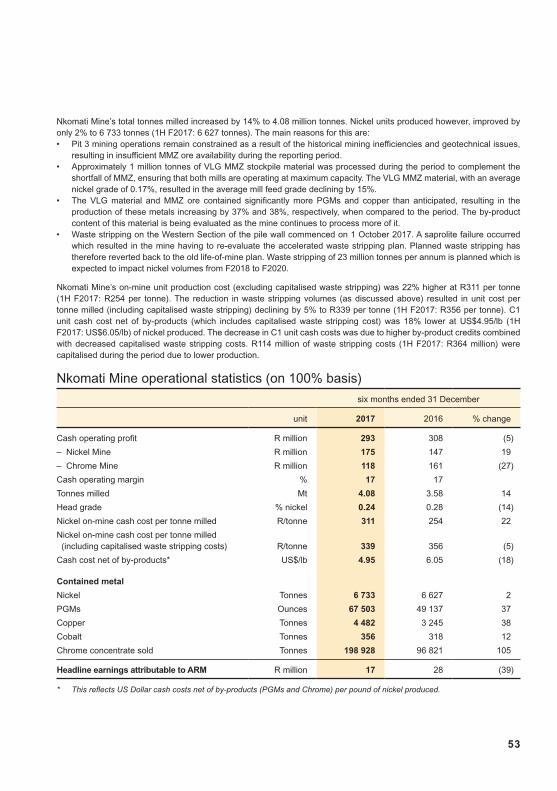
Nkomati Mine’s total tonnes milled increased by 14% to 4.08 million tonnes. Nickel units produced however, improved by only 2% to 6 733 tonnes (1H F2017: 6 627 tonnes). The main reasons for this are:• Pit 3 mining operations remain constrained as a result of the historical mining inefficiencies and geotechnical issues,
resulting in insufficient MMZ ore availability during the reporting period. • Approximately 1 million tonnes of VLG MMZ stockpile material was processed during the period to complement the
shortfall of MMZ, ensuring that both mills are operating at maximum capacity. The VLG MMZ material, with an average nickel grade of 0.17%, resulted in the average mill feed grade declining by 15%.
• The VLG material and MMZ ore contained significantly more PGMs and copper than anticipated, resulting in the production of these metals increasing by 37% and 38%, respectively, when compared to the period. The by-product content of this material is being evaluated as the mine continues to process more of it.
• Waste stripping on the Western Section of the pile wall commenced on 1 October 2017. A saprolite failure occurred which resulted in the mine having to re-evaluate the accelerated waste stripping plan. Planned waste stripping has therefore reverted back to the old life-of-mine plan. Waste stripping of 23 million tonnes per annum is planned which is expected to impact nickel volumes from F2018 to F2020.
Nkomati Mine’s on-mine unit production cost (excluding capitalised waste stripping) was 22% higher at R311 per tonne (1H F2017: R254 per tonne). The reduction in waste stripping volumes (as discussed above) resulted in unit cost per tonne milled (including capitalised waste stripping) declining by 5% to R339 per tonne (1H F2017: R356 per tonne). C1 unit cash cost net of by-products (which includes capitalised waste stripping cost) was 18% lower at US$4.95/lb (1H F2017: US$6.05/lb) of nickel produced. The decrease in C1 unit cash costs was due to higher by-product credits combined with decreased capitalised waste stripping costs. R114 million of waste stripping costs (1H F2017: R364 million) were capitalised during the period due to lower production.
Nkomati Mine operational statistics (on 100% basis)
six months ended 31 December
unit 2017 2016 % change
Cash operating profit R million 293 308 (5)
– Nickel Mine R million 175 147 19
– Chrome Mine R million 118 161 (27)
Cash operating margin % 17 17
Tonnes milled Mt 4.08 3.58 14
Head grade % nickel 0.24 0.28 (14)
Nickel on-mine cash cost per tonne milled R/tonne 311 254 22
Nickel on-mine cash cost per tonne milled (including capitalised waste stripping costs) R/tonne 339 356 (5)
Cash cost net of by-products* US$/lb 4.95 6.05 (18)
Contained metal
Nickel Tonnes 6 733 6 627 2
PGMs Ounces 67 503 49 137 37
Copper Tonnes 4 482 3 245 38
Cobalt Tonnes 356 318 12
Chrome concentrate sold Tonnes 198 928 96 821 105
Headline earnings attributable to ARM R million 17 28 (39)
* This reflects US Dollar cash costs net of by-products (PGMs and Chrome) per pound of nickel produced.
Interim results for the six months ended 31 December 2017
54
Projects Modikwa MineIn order to maintain the current production profile and ramp-up the operation, Modikwa Mine initiated the North Shaft Deepening Project and the South 2 Shaft Project. The current status of these projects are detailed below:
• Deepening of North Shaft – This project entails the deepening of North Shaft from Level 7 to Level 9 thereby establishing three new mining levels. To curtail capital expenditure, portions of this project were deferred during F2015, resulting in current development being delayed at Level 9. Level 7 and 8 are both fully equipped with all the required mining infrastructure. The chairlift installation was commissioned in February 2017.
• Sinking of South 2 Shaft – This project scope includes the establishment of a decline shaft system South of the current South Shaft Infrastructure. The first phase of the project is expected to enhance mining flexibility while also contributing to the overall production build-up of the mine. Phase one of the project has been completed and is expected to take the production capacity to 50 000 tonnes of ore per month by F2019. The second phase will follow and increase the design capacity of this shaft system to 100 000 tonnes per month.
The ARM Platinum division comprises:
• Three operating mines:
o Modikwa – ARM Mining Consortium has an effective 41.5% interest in Modikwa where local communities hold an 8.5% effective interest. The remaining 50% is held by Anglo American Platinum.
o Two Rivers – an ARM subsidiary in which ARM has a 54% shareholding and Implats 46%. The increase in shareholding is effective 9 November 2017, when Two Rivers’ amended mining right, including the mining rights transferred to it, was executed by the DMR.
o Nkomati – a 50:50 partnership between ARM and Norilsk Nickel Africa.
• Two prospecting rights:
o the “Kalplats prospecting right” in which ARM Platinum holds 46% and Platinum Australia (PLA) holds 44%, with Anglo American holding 10%.
o the “Kalplats Extended Area prospecting right” in which ARM Platinum and PLA each have a 50% interest.
55
ARM CoalARM Coal’s attributable headline earnings increased by 62% to R160 million (1H F2017: R99 million). This improvement was mainly due to the average realised US Dollar export prices being 20% higher compared to 1H F2017 with the realised price exceeding US$75 per tonne.
Seaborne coal prices were positively impacted by an increase in demand from India and China, largely due to gas supply shortages in China over the winter months. The impact of the higher prices was partially reduced by a strengthening of the average realised Rand/US Dollar exchange rate. Realised Rand prices increased from R873 per tonne in 1H F2017 to R1 000 per tonne in 1H F2018.
More than 70% of the export volumes at GGV Mine were high quality (RB1) coal while only 34% of PCB exports were RB1 quality. This resulted in PCB’s average received export price being lower compared to GGV Mine.
ARM attributable saleable tonnes produced of 2.59 million tonnes were slightly higher than the 2.54 million tonnes produced in 1H F2017.
ARM Coal attributable profit analysis
six months ended 31 December
R million 2017 2016 % change
Cash operating profit 751 687 9
Less: Interest paid (257) (271) 5
Less: Amortisation (249) (246) (1)
Less: Fair value adjustments (29) (32) 9
Less: Impairment (19) –
Profit before tax 197 138 43
Add: Impairment 19 –
Less: Tax (51) (39) (31)
Tax on impairment (5) –
Headline earnings attributable to ARM 160 99 62
Goedgevonden (GGV) MineGGV Mine’s attributable cash operating profit increased by 63% from R147 million in 1H F2017 to R240 million in 1H F2018.
Average received export US Dollar prices increased by 34% compared to 1H F2017. The impact of the higher prices was partially reduced by a 4% reduction in export sales volumes and a 4% strengthening of the Rand versus the US Dollar. This resulted in an increase in attributable export revenue of R86 million.
Production volumes at GGV Mine were 9% lower than 1H F2017 partially due to a rollover of low in-pit inventory levels from 2H F2017. The in-pit inventory levels have since improved during 1H F2018. Production was further impacted by safety-related stoppages and community protests.
On-mine unit production costs per saleable tonne increased by 9% to R315, mainly as a result of a decrease in production volumes.
Attributable headline earnings increased by R61 million, from a headline loss of R26 million in 1H F2017 to headline earnings of R35 million in 1H F2018.
Interim results for the six months ended 31 December 2017
56
Goedgevonden Mine operational statistics
six months ended 31 December
unit 2017 2016 % change
Total production sales (100% basis)
Saleable production Mt 3.30 3.61 (9)
Export thermal coal sales Mt 1.64 1.71 (4)
Eskom thermal coal sales Mt 1.72 1.67 3
Local thermal coal sales Mt 0.03 0.20 (85)
Attributable production and sales
Saleable production Mt 0.86 0.94 (9)
Export thermal coal sales Mt 0.43 0.44 (2)
Eskom thermal coal sales Mt 0.45 0.43 5
Local thermal coal sales Mt 0.01 0.05 (80)
Average received coal price
Export (FOB*) US$/tonne 80.22 59.99 34
Eskom (FOT**) R/tonne 232 228 2
Local (FOR***) R/tonne 995 509 95
On-mine saleable cost R/tonne 315 289 9
Cash operating profit
Total R million 923 567 63
Attributable (26%) R million 240 147 63
Headline earnings/(loss) attributable to ARM R million 35 (26)
* FOB refers to Free On Board.** FOT refers to Free On Truck.*** FOR refers to Free On Rail.
Goedgevonden Mine attributable profit analysis
six months ended 31 December
R million 2017 2016 % change
Cash operating profit 240 147 63
Less: Interest paid (113) (105) (8)
Less: Amortisation (78) (72) (8)
Less: Fair value adjustments (6) (7) 14
Profit/(loss) before tax 43 (37)
Less: Tax (8) 10 (180)
Headline earnings/(loss) attributable to ARM 35 (26)
57
Participating Coal Business (PCB)PCB attributable cash operating profit decreased by 5% to R511 million (1H F2017: R539 million).
An 11% increase in average received US Dollar coal prices together with a 1% increase in export coal sales volumes, improved revenue by R146 million. This was partially offset by a 4% strengthening of the Rand versus the US Dollar which negatively impacted revenue by R52 million. Revenue from inland coal sales was R31 million lower than the previous period, mainly due to a decrease in local coal sales volumes.
Unit production costs per saleable tonne increased by 22% from R273 per tonne in 1H F2017 to R334 per tonne in 1H F2018. On-mine production costs in the previous period benefited from processing of stockpile ore built up during the Tweefontein Optimisation Project (TOP). The Tweefontein operation has since stabilised and is now operating at the planned unit production costs which was estimated at approximately R300 per tonne. The 8% increase in saleable production together with the reduction in the benefits obtained from the low cost stockpile resulted in an increase in on-mine costs of R142 million.
Headline earnings attributable to ARM were flat at R125 million.
PCB operational statistics
six months ended 31 December
unit 2017 2016 % change
Total production sales (100% basis)
Saleable production Mt 8.57 7.93 8
Export thermal coal sales Mt 6.71 6.62 1
Eskom thermal coal sales Mt 0.83 0.77 8
Local thermal coal sales Mt 0.14 0.54 (74)
Attributable production and sales
Saleable production Mt 1.73 1.60 8
Export thermal coal sales Mt 1.36 1.34 1
Eskom thermal coal sales Mt 0.17 0.16 6
Local thermal coal sales Mt 0.03 0.11 (73)
Average received coal price
Export (FOB*) US$/tonne 71.13 63.97 11
Eskom (FOT**) R/tonne 244 246 (1)
Local (FOR***) R/tonne 998 523 91
On-mine saleable cost R/tonne 334 273 22
Cash operating profit
Total R million 2 529 2 669 (6)
Attributable (20.2%) R million 511 539 (5)
Headline earnings attributable to ARM R million 125 125 –
* FOB refers to Free On Board.** FOT refers to Free On Truck.*** FOR refers to Free On Rail.

Interim results for the six months ended 31 December 2017
58
PCB attributable profit analysis
six months ended 31 December
R million 2017 2016 % change
Cash operating profit 511 539 (5)
Less: Interest paid (144) (166) 13
Amortisation (171) (173) (1)
Fair value adjustments (23) (26) 12
Impairment (19) –
Profit before tax 154 174 (11)
Add: Impairment 19 –
Less: Tax (43) (49) 12
Tax on impairment (5) –
Headline earnings attributable to ARM 125 125 –
ARM’s economic interest in PCB is 20.2%. PCB consists of two large mining complexes situated in Mpumalanga. ARM has a 26% effective interest in the Goedgevonden Mine situated near Ogies in Mpumalanga.
Attributable refers to 20.2% of PCB whilst total refers to 100%.
59
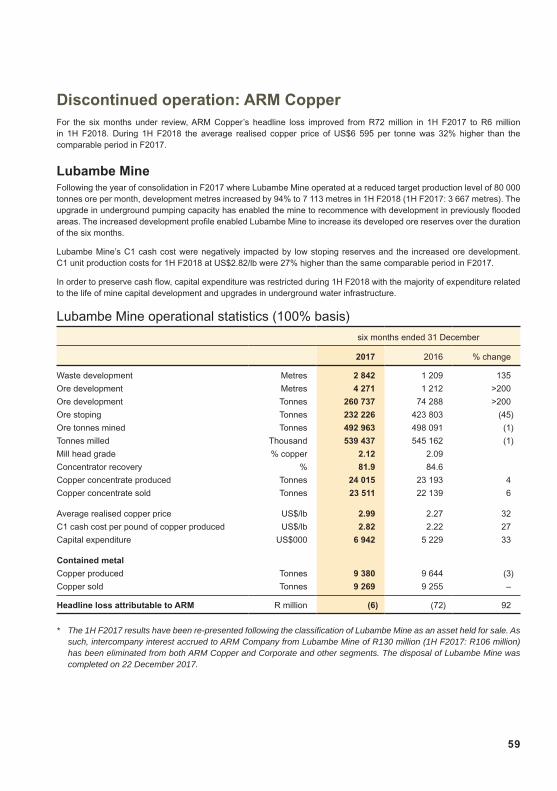
Discontinued operation: ARM Copper For the six months under review, ARM Copper’s headline loss improved from R72 million in 1H F2017 to R6 million in 1H F2018. During 1H F2018 the average realised copper price of US$6 595 per tonne was 32% higher than the comparable period in F2017.
Lubambe MineFollowing the year of consolidation in F2017 where Lubambe Mine operated at a reduced target production level of 80 000 tonnes ore per month, development metres increased by 94% to 7 113 metres in 1H F2018 (1H F2017: 3 667 metres). The upgrade in underground pumping capacity has enabled the mine to recommence with development in previously flooded areas. The increased development profile enabled Lubambe Mine to increase its developed ore reserves over the duration of the six months.
Lubambe Mine’s C1 cash cost were negatively impacted by low stoping reserves and the increased ore development. C1 unit production costs for 1H F2018 at US$2.82/lb were 27% higher than the same comparable period in F2017.
In order to preserve cash flow, capital expenditure was restricted during 1H F2018 with the majority of expenditure related to the life of mine capital development and upgrades in underground water infrastructure.
Lubambe Mine operational statistics (100% basis)
six months ended 31 December
2017 2016 % change
Waste development Metres 2 842 1 209 135
Ore development Metres 4 271 1 212 >200
Ore development Tonnes 260 737 74 288 >200
Ore stoping Tonnes 232 226 423 803 (45)
Ore tonnes mined Tonnes 492 963 498 091 (1)
Tonnes milled Thousand 539 437 545 162 (1)
Mill head grade % copper 2.12 2.09
Concentrator recovery % 81.9 84.6
Copper concentrate produced Tonnes 24 015 23 193 4
Copper concentrate sold Tonnes 23 511 22 139 6
Average realised copper price US$/lb 2.99 2.27 32
C1 cash cost per pound of copper produced US$/lb 2.82 2.22 27
Capital expenditure US$000 6 942 5 229 33
Contained metal
Copper produced Tonnes 9 380 9 644 (3)
Copper sold Tonnes 9 269 9 255 –
Headline loss attributable to ARM R million (6) (72) 92
* The 1H F2017 results have been re-presented following the classification of Lubambe Mine as an asset held for sale. As such, intercompany interest accrued to ARM Company from Lubambe Mine of R130 million (1H F2017: R106 million) has been eliminated from both ARM Copper and Corporate and other segments. The disposal of Lubambe Mine was completed on 22 December 2017.
Interim results for the six months ended 31 December 2017
60
Harmony Gold Mining Company Limited (Harmony)Harmony reported a 49% increase in headline earnings to R990 million (1H F2017: R657 million) or 224 cents per share (1H F2017: 150 cents per share).
Revenue for the six months under review remained relatively flat in comparison to 1H F2017 as the average gold price received decreased by 1% to R580 672/kg (US$1 348/oz) and total gold sales increased by 2%. Forward gold sale contracts of 3 359kg or 108 000oz, with an average price of R692 836/kg (US$1 609/oz), matured during 1H F2018. This contributed R503 million (US$38 million) to revenue.
The hedging programmes realised gains of R771 million (US$58 million) for the December 2017 period. Management continues to top-up these programmes when the market presents attractive opportunities to do so. The gold hedging programme currently provides cover for approximately 19% of the expected gold production over the next two years. A summary of all the open hedging contracts is included in the Harmony 1H F2018 results published on 13 February 2018.
Production costs decreased by R264 million or 4% compared to the corresponding period. The decrease in Rand terms was mainly due to the capitalisation of production costs as a result of the re-investment into Hidden Valley.
Harmony’s net profit for 1H F2018 was R897 million compared to R1 539 million for the comparative period which included a gain on bargain purchase of R848 million.
Harmony completed the acquisition of the Moab Khotsong operations effective 1 March 2018 – which includes the Great Noligwa underground mine and related infrastructure from AngloGold Ashanti Limited for a consideration of US$300 million in cash. The Moab Khotsong acquisition is expected to increase Harmony’s cash flow from year one and unlock value by expanding the reserves and extending life-of-mine.
The Harmony investment is reflected on the ARM Statement of Financial Position at R1 444 million based on the Harmony share price at 31 December 2017 of R22.69 per share. Changes in the value of the investment in Harmony, to the extent that they represent a significant or prolonged decline below the cost of the investment, are adjusted through the Income Statement, net of tax. Gains are accounted for, net of deferred capital gains tax, through the Statement of Comprehensive Income. Dividends from Harmony are recognised in the ARM Income Statement on the last day of registration following dividend declaration.
Harmony’s results for the six months ended 31 December 2017 can be viewed on Harmony’s website at www.harmony.co.za.
ARM owns 14.3% of Harmony’s issued share capital.
61
OutlookUS Dollar commodity prices for most of the commodities that ARM produces remain strong into 2H F2018. In particular, premiums for the high-quality iron ore and manganese ore appear to be underpinned by ongoing Chinese supply-side reforms, improved efficiencies in the Chinese steel industry and increasingly stringent environmental policies. Commodity prices are, however, expected to remain volatile.
Uncertainties into 2H F2018 include (i) the outlook for the Rand versus US Dollar exchange rate; (ii) changes in South African mining regulations; (iii) the dynamic socio-economic environment around mines; and (iv) above-inflation unit cost increases.
Re-engagement between government, the mining industry and other stakeholders on Mining Charter III is positive for the South African mining industry and is contributing towards improved investor sentiment.
ARM continues to proactively manage cost pressures whilst ensuring efficient production levels to maximise profit margins.
We are also focused on the allocation of capital to ensure that a responsible balance is achieved between re-investment into the business, shareholder returns, maintaining a robust financial position and value enhancing growth. We are pleased to have declared a maiden interim dividend and will continue to consider interim and annual dividends taking into account amongst things our financial position, the outlook for our operations and commodity markets, capital expenditure and growth.
Further, ARM is committed to managing the impact of our mining activities on all stakeholders. We are committed to investing in ways that will ensure mutual benefit to surrounding communities, Government and the environments in which we operate.
ARM remains confident about the future of our business.
Interim results for the six months ended 31 December 2017
62
DividendsThe Board has approved and declared an interim dividend of 250 cents per share (gross) in respect of the six months ended 31 December 2017 (1H F2017: Nil). The amount to be paid is approximately R549 million.
This dividend is consistent with ARM’s commitment, as a globally competitive company, to pay dividends while retaining the ability to fund efficiency improvements and sustaining production.
The dividend will be subject to Dividend Withholding Tax. In accordance with paragraphs 11.17(a) (i) to (x) and 11.17(c) of the JSE Listings Requirements the following additional information is disclosed:• The dividend has been declared out of income reserves;• The South African Dividends Tax (“Dividends Tax”) rate is 20%;• The gross local dividend amount is 250 cents per ordinary share for shareholders exempt from the Dividends Tax;• The net local dividend amount is 200.00000 cents per share for shareholders liable to pay the Dividends Tax;• As at the date of this declaration ARM has 219 691 837 ordinary shares in issue; and• ARM’s income tax reference number is 9030/018/60/1.
A gross dividend of 250 cents per ordinary share, being the dividend for the six months ended 31 December 2017 has been declared payable on Monday, 16 April 2018 to those shareholders recorded in the books of the Company at the close of business on Friday, 13 April 2018. The dividend is declared in the currency of South Africa. Any change in address or dividend instruction to apply to this dividend must be received by the Company’s transfer secretaries or registrar not later than Friday, 13 April 2018. The last day to trade ordinary shares cum dividend is Tuesday, 10 April 2018. Ordinary shares trade ex-dividend from Wednesday, 11 April 2018. The record date is Friday, 13 April 2018 whilst the payment date is Monday, 16 April 2018.
No dematerialisation or rematerialisation of share certificates may occur between Wednesday, 11 April 2018 and Friday, 13 April 2018, both dates inclusive, nor may any transfers between registers take place during this period.
63
Review by independent auditorsThe financial results for the six months ended 31 December 2017 have not been reviewed or audited by the Company’s registered auditors, Ernst & Young Inc.
Signed on behalf of the Board:
P T Motsepe M P SchmidtExecutive Chairman Chief Executive Officer
Johannesburg16 March 2018

Interim results for the six months ended 31 December 2017
64
NOTES
Group financial statements
Contents
66 Group statement of financial position
67 Group income statement
68 Group statement of comprehensive income
70 Group statement of changes in equity
72 Group statement of cash flows
73 Notes to the financial statements
Interim results for the six months ended 31 December 2017
66
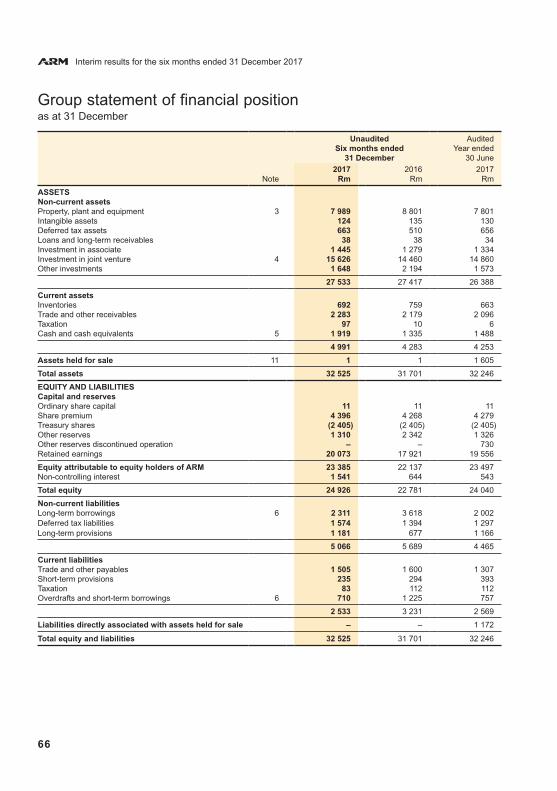
Group statement of financial positionas at 31 December
Unaudited AuditedSix months ended Year ended
31 December 30 June
2017 2016 2017Note Rm Rm Rm
ASSETSNon-current assets Property, plant and equipment 3 7 989 8 801 7 801 Intangible assets 124 135 130 Deferred tax assets 663 510 656 Loans and long-term receivables 38 38 34 Investment in associate 1 445 1 279 1 334 Investment in joint venture 4 15 626 14 460 14 860 Other investments 1 648 2 194 1 573
27 533 27 417 26 388
Current assets Inventories 692 759 663 Trade and other receivables 2 283 2 179 2 096 Taxation 97 10 6 Cash and cash equivalents 5 1 919 1 335 1 488
4 991 4 283 4 253
Assets held for sale 11 1 1 1 605
Total assets 32 525 31 701 32 246
EQUITY AND LIABILITIESCapital and reserves Ordinary share capital 11 11 11 Share premium 4 396 4 268 4 279 Treasury shares (2 405) (2 405) (2 405)Other reserves 1 310 2 342 1 326 Other reserves discontinued operation – – 730 Retained earnings 20 073 17 921 19 556
Equity attributable to equity holders of ARM 23 385 22 137 23 497 Non-controlling interest 1 541 644 543
Total equity 24 926 22 781 24 040
Non-current liabilities Long-term borrowings 6 2 311 3 618 2 002 Deferred tax liabilities 1 574 1 394 1 297 Long-term provisions 1 181 677 1 166
5 066 5 689 4 465
Current liabilities Trade and other payables 1 505 1 600 1 307Short-term provisions 235 294 393Taxation 83 112 112Overdrafts and short-term borrowings 6 710 1 225 757
2 533 3 231 2 569
Liabilities directly associated with assets held for sale – – 1 172
Total equity and liabilities 32 525 31 701 32 246
67
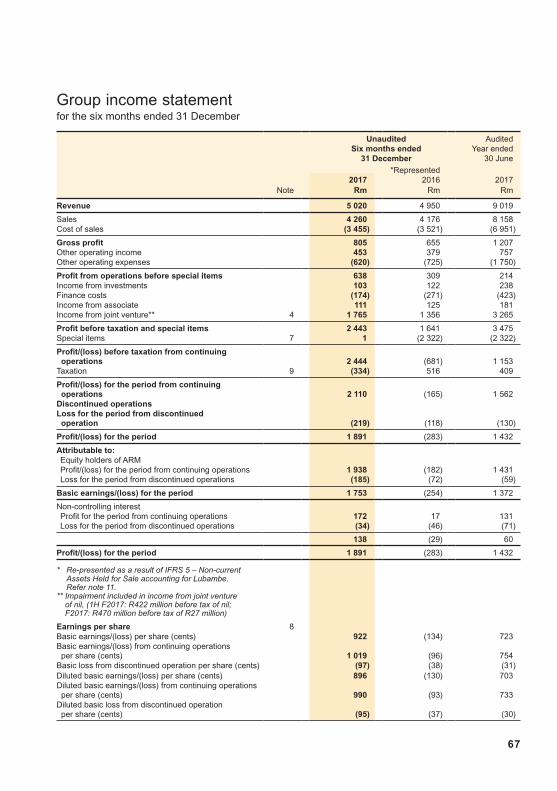
Group income statement for the six months ended 31 December
Unaudited AuditedSix months ended Year ended
31 December 30 June
*Represented 2017 2016 2017
Note Rm Rm Rm
Revenue 5 020 4 950 9 019
Sales 4 260 4 176 8 158 Cost of sales (3 455) (3 521) (6 951)
Gross profit 805 655 1 207 Other operating income 453 379 757 Other operating expenses (620) (725) (1 750)
Profit from operations before special items 638 309 214 Income from investments 103 122 238 Finance costs (174) (271) (423)Income from associate 111 125 181 Income from joint venture** 4 1 765 1 356 3 265
Profit before taxation and special items 2 443 1 641 3 475 Special items 7 1 (2 322) (2 322)
Profit/(loss) before taxation from continuing operations 2 444 (681) 1 153 Taxation 9 (334) 516 409
Profit/(loss) for the period from continuing operations 2 110 (165) 1 562Discontinued operationsLoss for the period from discontinued operation (219) (118) (130)
Profit/(loss) for the period 1 891 (283) 1 432
Attributable to: Equity holders of ARM Profit/(loss) for the period from continuing operations 1 938 (182) 1 431 Loss for the period from discontinued operations (185) (72) (59)
Basic earnings/(loss) for the period 1 753 (254) 1 372
Non-controlling interestProfit for the period from continuing operations 172 17 131 Loss for the period from discontinued operations (34) (46) (71)
138 (29) 60
Profit/(loss) for the period 1 891 (283) 1 432
* Re-presented as a result of IFRS 5 – Non-current Assets Held for Sale accounting for Lubambe. Refer note 11.
** Impairment included in income from joint venture of nil, (1H F2017: R422 million before tax of nil; F2017: R470 million before tax of R27 million)
Earnings per share 8Basic earnings/(loss) per share (cents) 922 (134) 723 Basic earnings/(loss) from continuing operations per share (cents) 1 019 (96) 754 Basic loss from discontinued operation per share (cents) (97) (38) (31)Diluted basic earnings/(loss) per share (cents) 896 (130) 703 Diluted basic earnings/(loss) from continuing operations per share (cents) 990 (93) 733 Diluted basic loss from discontinued operation per share (cents) (95) (37) (30)
Interim results for the six months ended 31 December 2017
68
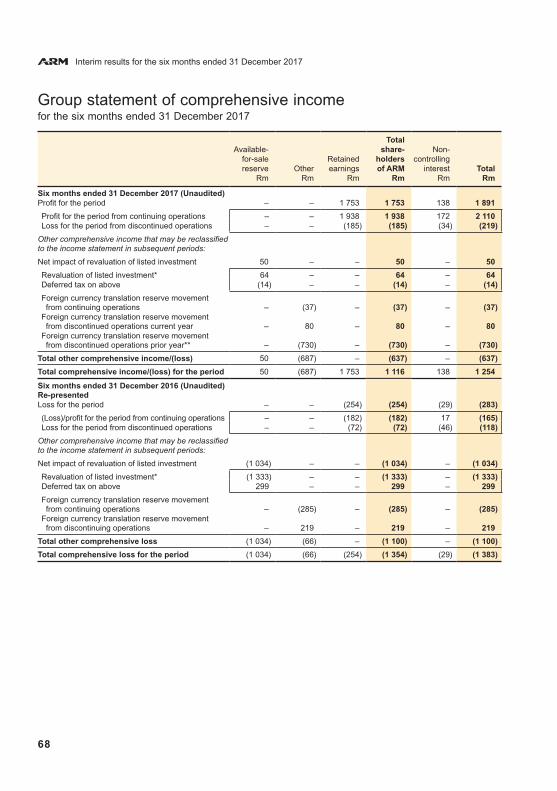
Group statement of comprehensive incomefor the six months ended 31 December 2017
TotalAvailable- share- Non-
for-sale Retained holders controllingreserve Other earnings of ARM interest Total
Rm Rm Rm Rm Rm Rm
Six months ended 31 December 2017 (Unaudited) Profit for the period – – 1 753 1 753 138 1 891
Profit for the period from continuing operations – – 1 938 1 938 172 2 110 Loss for the period from discontinued operations – – (185) (185) (34) (219)
Other comprehensive income that may be reclassified to the income statement in subsequent periods:
Net impact of revaluation of listed investment 50 – – 50 – 50
Revaluation of listed investment* 64 – – 64 – 64 Deferred tax on above (14) – – (14) – (14)
Foreign currency translation reserve movement from continuing operations – (37) – (37) – (37)Foreign currency translation reserve movement from discontinued operations current year – 80 – 80 – 80 Foreign currency translation reserve movement from discontinued operations prior year** – (730) – (730) – (730)
Total other comprehensive income/(loss) 50 (687) – (637) – (637)
Total comprehensive income/(loss) for the period 50 (687) 1 753 1 116 138 1 254
Six months ended 31 December 2016 (Unaudited) Re-presentedLoss for the period – – (254) (254) (29) (283)
(Loss)/profit for the period from continuing operations – – (182) (182) 17 (165)Loss for the period from discontinued operations – – (72) (72) (46) (118)
Other comprehensive income that may be reclassified to the income statement in subsequent periods:
Net impact of revaluation of listed investment (1 034) – – (1 034) – (1 034)
Revaluation of listed investment* (1 333) – – (1 333) – (1 333)Deferred tax on above 299 – – 299 – 299
Foreign currency translation reserve movement from continuing operations – (285) – (285) – (285)Foreign currency translation reserve movement from discontinuing operations – 219 – 219 – 219
Total other comprehensive loss (1 034) (66) – (1 100) – (1 100)
Total comprehensive loss for the period (1 034) (66) (254) (1 354) (29) (1 383)
69
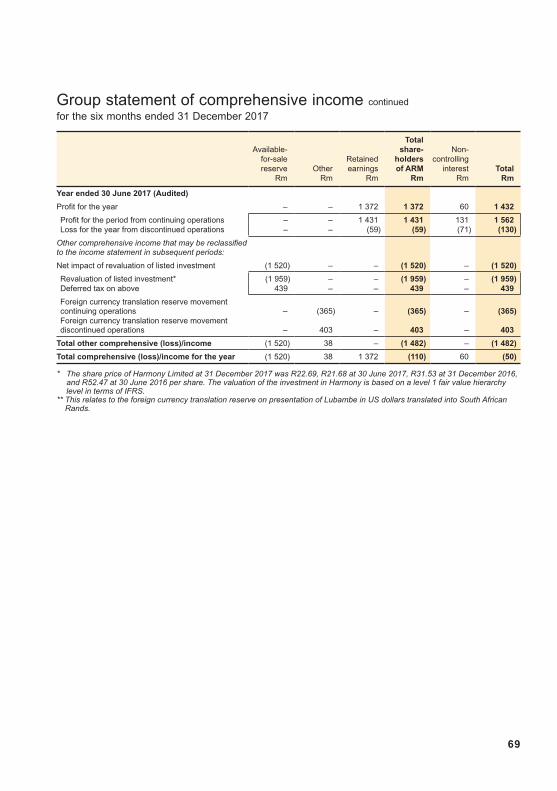
Group statement of comprehensive income continued
for the six months ended 31 December 2017
TotalAvailable- share- Non-
for-sale Retained holders controllingreserve Other earnings of ARM interest Total
Rm Rm Rm Rm Rm Rm
Year ended 30 June 2017 (Audited)
Profit for the year – – 1 372 1 372 60 1 432
Profit for the period from continuing operations – – 1 431 1 431 131 1 562 Loss for the year from discontinued operations – – (59) (59) (71) (130)
Other comprehensive income that may be reclassified to the income statement in subsequent periods:
Net impact of revaluation of listed investment (1 520) – – (1 520) – (1 520)
Revaluation of listed investment* (1 959) – – (1 959) – (1 959)Deferred tax on above 439 – – 439 – 439
Foreign currency translation reserve movement continuing operations – (365) – (365) – (365)Foreign currency translation reserve movement discontinued operations – 403 – 403 – 403
Total other comprehensive (loss)/income (1 520) 38 – (1 482) – (1 482)
Total comprehensive (loss)/income for the year (1 520) 38 1 372 (110) 60 (50)
* The share price of Harmony Limited at 31 December 2017 was R22.69, R21.68 at 30 June 2017, R31.53 at 31 December 2016, and R52.47 at 30 June 2016 per share. The valuation of the investment in Harmony is based on a level 1 fair value hierarchy level in terms of IFRS.
** This relates to the foreign currency translation reserve on presentation of Lubambe in US dollars translated into South African Rands.
Interim results for the six months ended 31 December 2017
70
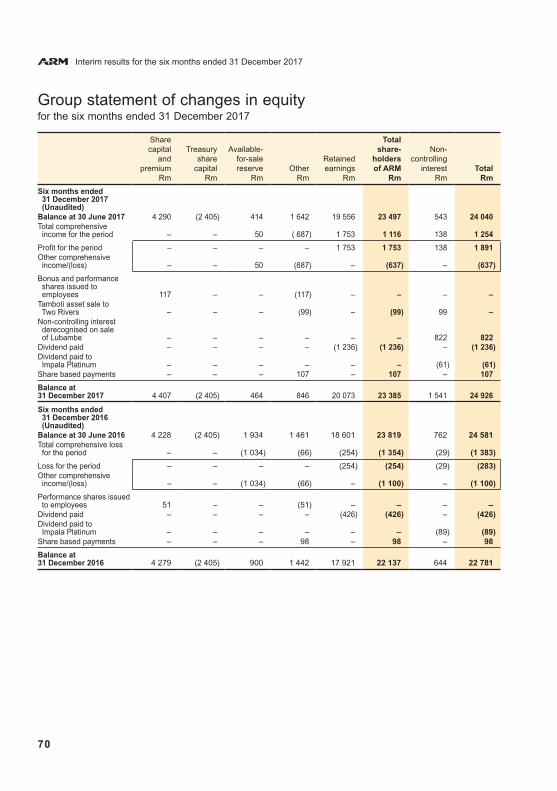
Group statement of changes in equityfor the six months ended 31 December 2017
Share Totalcapital Treasury Available- share- Non-
and share for-sale Retained holders controllingpremium capital reserve Other earnings of ARM interest Total
Rm Rm Rm Rm Rm Rm Rm Rm
Six months ended 31 December 2017
(Unaudited)Balance at 30 June 2017 4 290 (2 405) 414 1 642 19 556 23 497 543 24 040 Total comprehensive income for the period – – 50 ( 687) 1 753 1 116 138 1 254
Profit for the period – – – – 1 753 1 753 138 1 891 Other comprehensive income/(loss) – – 50 (687) – (637) – (637)
Bonus and performance shares issued to
employees 117 – – (117) – – – –Tamboti asset sale to Two Rivers – – – (99) – (99) 99 –Non-controlling interest derecognised on sale of Lubambe – – – – – – 822 822
Dividend paid – – – – (1 236) (1 236) – (1 236)Dividend paid to Impala Platinum – – – – – – (61) (61)Share based payments – – – 107 – 107 – 107
Balance at 31 December 2017 4 407 (2 405) 464 846 20 073 23 385 1 541 24 926
Six months ended 31 December 2016
(Unaudited) Balance at 30 June 2016 4 228 (2 405) 1 934 1 461 18 601 23 819 762 24 581 Total comprehensive loss for the period – – (1 034) (66) (254) (1 354) (29) (1 383)
Loss for the period – – – – (254) (254) (29) (283)Other comprehensive income/(loss) – – (1 034) (66) – (1 100) – (1 100)
Performance shares issued to employees 51 – – (51) – – – – Dividend paid – – – – (426) (426) – (426)Dividend paid to Impala Platinum – – – – – – (89) (89)Share based payments – – – 98 – 98 – 98
Balance at 31 December 2016 4 279 (2 405) 900 1 442 17 921 22 137 644 22 781
71
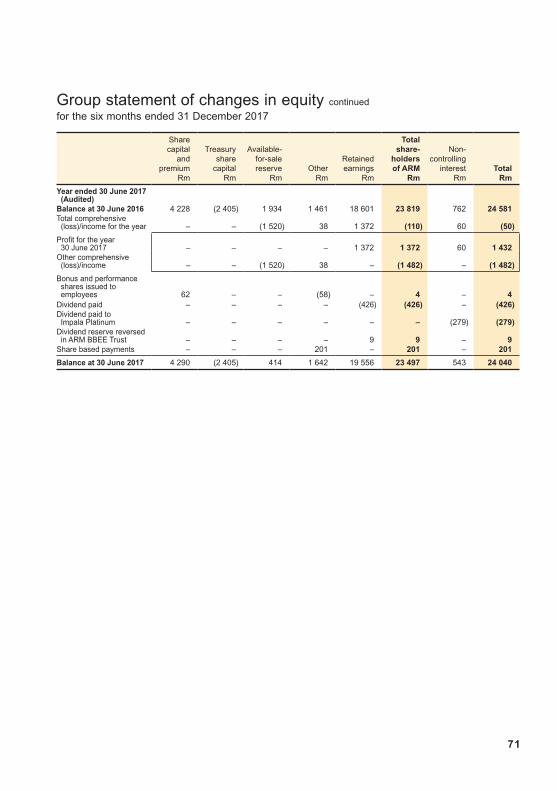
Group statement of changes in equity continued
for the six months ended 31 December 2017
Share Totalcapital Treasury Available- share- Non-
and share for-sale Retained holders controllingpremium capital reserve Other earnings of ARM interest Total
Rm Rm Rm Rm Rm Rm Rm Rm
Year ended 30 June 2017 (Audited)Balance at 30 June 2016 4 228 (2 405) 1 934 1 461 18 601 23 819 762 24 581 Total comprehensive (loss)/income for the year – – (1 520) 38 1 372 (110) 60 (50)
Profit for the year 30 June 2017 – – – – 1 372 1 372 60 1 432 Other comprehensive (loss)/income – – (1 520) 38 – (1 482) – (1 482)
Bonus and performance shares issued to
employees 62 – – (58) – 4 – 4 Dividend paid – – – – (426) (426) – (426)Dividend paid to Impala Platinum – – – – – – (279) (279)Dividend reserve reversed in ARM BBEE Trust – – – – 9 9 – 9 Share based payments – – – 201 – 201 – 201
Balance at 30 June 2017 4 290 (2 405) 414 1 642 19 556 23 497 543 24 040
Interim results for the six months ended 31 December 2017
72
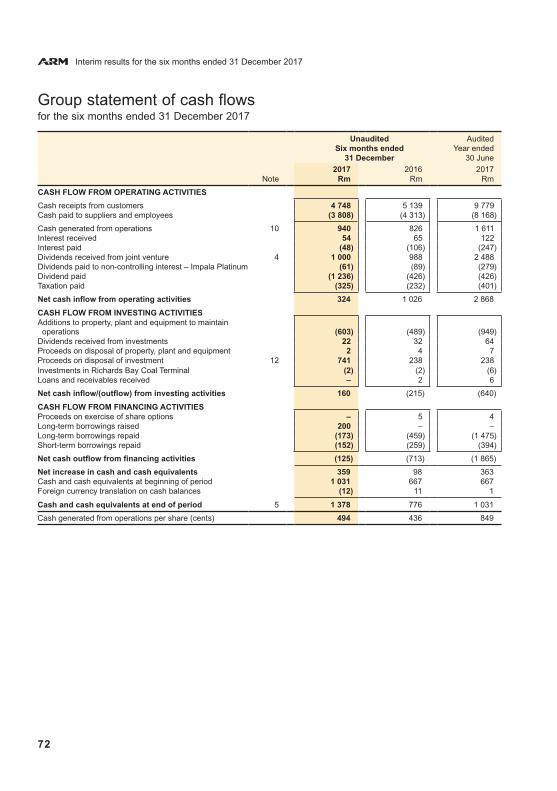
Group statement of cash flowsfor the six months ended 31 December 2017
Unaudited AuditedSix months ended Year ended
31 December 30 June
2017 2016 2017Note Rm Rm Rm
CASH FLOW FROM OPERATING ACTIVITIES
Cash receipts from customers 4 748 5 139 9 779 Cash paid to suppliers and employees (3 808) (4 313) (8 168)
Cash generated from operations 10 940 826 1 611 Interest received 54 65 122 Interest paid (48) (106) (247)Dividends received from joint venture 4 1 000 988 2 488 Dividends paid to non-controlling interest – Impala Platinum (61) (89) (279)Dividend paid (1 236) (426) (426)Taxation paid (325) (232) (401)
Net cash inflow from operating activities 324 1 026 2 868
CASH FLOW FROM INVESTING ACTIVITIES Additions to property, plant and equipment to maintain operations (603) (489) (949)Dividends received from investments 22 32 64 Proceeds on disposal of property, plant and equipment 2 4 7 Proceeds on disposal of investment 12 741 238 238 Investments in Richards Bay Coal Terminal (2) (2) (6)Loans and receivables received – 2 6
Net cash inflow/(outflow) from investing activities 160 (215) (640)
CASH FLOW FROM FINANCING ACTIVITIES Proceeds on exercise of share options – 5 4 Long-term borrowings raised 200 – –Long-term borrowings repaid (173) (459) (1 475)Short-term borrowings repaid (152) (259) (394)
Net cash outflow from financing activities (125) (713) (1 865)
Net increase in cash and cash equivalents 359 98 363 Cash and cash equivalents at beginning of period 1 031 667 667 Foreign currency translation on cash balances (12) 11 1
Cash and cash equivalents at end of period 5 1 378 776 1 031
Cash generated from operations per share (cents) 494 436 849

73
Notes to the financial statements for the six months ended 31 December 2017
1. Statement of compliance The Group financial statements for the six months ended 31 December 2017 have been prepared in accordance with and
contain the information required by IAS 34 – Interim Financial Reporting and comply with International Financial Reporting Standards (IFRS) and Interpretations of those standards, as adopted by the International Accounting Standards Board (IASB), requirements of the South African Companies Act 2008, the SAICA Financial Reporting Guides as issued by the Accounting Practices Committee and Financial Pronouncements as issued by the Financial Reporting Standards Council and the Listings Requirements of the JSE Limited.
Basis of preparation The Group financial statements for the six months ended 31 December 2017 have been prepared on the historical cost
basis, except for certain financial instruments, which include listed investments, that are fairly valued by mark-to-market. The accounting policies used are consistent with those in the most recent annual financial statements except for those listed below and comply with IFRS.
The Group financial statements for the period have been prepared under the supervision of the financial director, Miss AM Mukhuba CA(SA).
Adoption of new and revised accounting standards The Group has adopted the following new and/or and revised standards and interpretations issued by the International Financial
Reporting Interpretation Committee (IFRIC) of the IASB during the period under review.
Effective date IAS 7 Disclosure initiative – Amendments to IAS 7 1 January 2017 IAS 12 Recognition of Deferred Tax Assets or Unrealised losses – Amendments to IAS 12 1 January 2017 IFRS 12 Disclosure of Interest in Other Entities – Clarification of the scope
of the disclosure requirements in IFRS 12 AIP* 1 January 2017
The adoption of these had no significant effect on the Group financial statements.
The following amendments, standards or interpretations have been issued but are not yet effective. The effective date refers to periods beginning on or after, unless otherwise indicated.
Standard Subject Effective date IAS 28 Investment in associates and joint ventures – clarification that measuring investees at fair value through profit or loss is an investment – by – investment choice 1 January 2018 IFRS 1 First-time adoption of International Financial Reporting Standards – Deletion of short-term exemptions for first-time adopters 1 January 2018 IFRS 2 Share-based payment (Amendment) 1 January 2018 IFRS 4 and IFRS 9 Applying IFRS 9 Financial Instruments with IFRS 4 Insurance Contracts – Amendments to IFRS 4 1 January 2018 IFRS 9 Financial Instruments – Classification and Measurement (Amendment) 1 January 2018 IFRS 15 Revenue from Contracts with Customers 1 January 2018 IFRS 16 Leases 1 January 2019 IFRS 17 Insurance Contracts 1 January 2018 IFRIC 22 Foreign currency transactions and Advance Consideration 1 January 2018 IFRIC 23 Uncertainty over Income Tax Treatments 1 January 2018
*AIP: Annual Improvement Project
The Group does not intend early adopting any of the above amendments, standards or interpretations
ARM continuously evaluates the impact of these standards and amendments, the most prominent being IFRS 9 Financial Instruments, IFRS 15 Revenue from Contracts with Customers and IFRS 16 Leases. In summary the following are the current expectations in relation to IFRS 9, IFRS 15 and IFRS 16. (Refer next page).
Interim results for the six months ended 31 December 2017
74
Notes to the financial statements continued
for the six months ended 31 December 2017
IFRS 9 Financial InstrumentsAs previously reported, ARM has decided not to adopt IFRS 9 until it becomes mandatory for annual periods beginning on or after 1 January 2018 (i.e. for the financial year beginning 1 July 2018 for ARM).
The actual impact of adopting IFRS 9 on the financial statements is not currently known and cannot be reliably estimated as the impact will be dependent on the financial instruments that ARM holds and economic conditions prevailing at that time as well as accounting elections and judgements which ARM make in the future.
The new standard may require ARM to revise its accounting processes and internal controls related to reporting financial instruments and these possible changes have not yet been ascertained.
ARM has embarked on the process of determining the impact that the new impairment model, on the basis of expected credit losses, will have on the impairment provisions. As part of this process ARM will finalise the impairment methodologies that it will apply under IFRS 9.
Disclosure requirements and changes in presentation are expected to change the nature and extent of ARM’s disclosures about its financial instruments, particularly in the year of the adoption of the new standard.
ARM continues with a process of identifying changes to systems and controls which may be necessary to capture the required data. This process is expected to be completed before 30 June 2018.
IFRS 15 Revenue from Contracts with Customers The standard is effective for annual periods beginning on or after 1 January 2018 (i.e. for the financial year beginning 1 July 2018 for ARM).
ARM has completed a diagnostic impact assessment to identify IFRS 15 gaps between existing and future requirements, as well as to establish implementation efforts to be compliant when the standard is implemented. The impact of IFRS 15 was completed by assessing the impact across three dimensions: i) scoped-in entities of the group and identified revenue streams, ii) accounting principles identified in IFRS 15 on income statement (revenue, EBITDA) and statement of financial position (assets and liabilities) items; and iii) Changes to policies and disclosures.
From this, ARM has developed a detailed project plan for the implementation of IFRS 15 and in line with this plan: – has identified all significant contracts with customers, in the various entities in the Group, in line with the IFRS 15 five-step
model; – has evaluated the different sale contracts in place with its customers, which vary per entity and commodity – there are various
contracts with complex terms including consignment sales, various shipping terms and provisional pricing; – has engaged its various partners on their interpretation of the various contracts; – has evaluated practical expedients to be used; – has established that a fully retrospective approach will be adopted; and – is in the process of finalising its evaluation of the changes required to controls and Information Technology systems relating
to revenue recognition.
The new standard will have an impact on revenue recognised arising from most of the existing contracts. The critical impact identified thus far (amongst others) will be on:
Financial impact – Split of performance obligations impacts on timing of revenue recognition; – Fair value adjustments of provisional pricing index are recognised in fair value adjustments rather than revenue. Judgements
to use in estimating transaction price in exchange for sale of mining products, including the reasonableness of applying the constraint;
– Possible change in amount of revenue recognised due to estimating transaction price at inception which is not reflective of costs incurred or forecasting on the allocation of transaction price to performance obligation – for management services; and
– EBITDA impact due to customer contract costs and Profit or loss changes due to costs capitalisation.
Disclosure impact – Provisional pricing values at year end for open contracts; – Additional disclosure regarding assumptions used in estimating variable consideration for transaction price, including variable
consideration on management fees; and – Process of assessing recoverability of contract cost including reassessment of useful lives.
Accounting policies – Disclosure of qualitative information on performance obligations.
75
Notes to the financial statements continued
for the six months ended 31 December 2017
IFRS 16 Leases The standard is effective for annual periods beginning on or after 1 January 2019 (i.e. for the financial year beginning 1 July 2019 for ARM). Early adoption is permitted provided that IFRS 15 is adopted at or before the date of initial application of IFRS 16.
As previously reported, ARM continues with the initial assessment of the potential impact of this standard on the financial statements but has not yet reached a conclusion if this standard will be early adopted with the implementation of IFRS 15. The decision of the date of adoption is expected to be made before 30 June 2018.
ARM must still make a decision on the transition method to be applied as well as the practical expedients to be used, if elected.
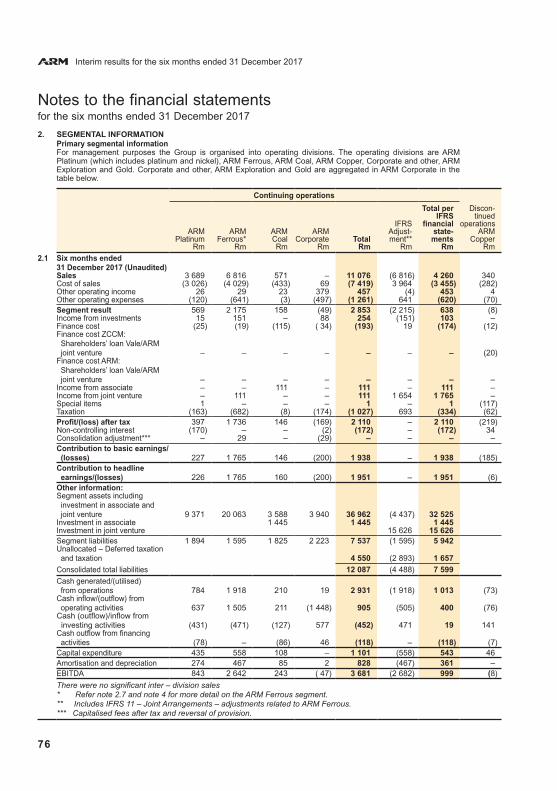
Interim results for the six months ended 31 December 2017
76
Notes to the financial statements for the six months ended 31 December 2017
2. SEGMENTAL INFORMATION Primary segmental information
For management purposes the Group is organised into operating divisions. The operating divisions are ARM Platinum (which includes platinum and nickel), ARM Ferrous, ARM Coal, ARM Copper, Corporate and other, ARM Exploration and Gold. Corporate and other, ARM Exploration and Gold are aggregated in ARM Corporate in the table below.
Continuing operations
Total per Discon-IFRS tinued
IFRS financial operationsARM ARM ARM ARM Adjust- state- ARM
Platinum Ferrous* Coal Corporate Total ment** ments CopperRm Rm Rm Rm Rm Rm Rm Rm
2.1 Six months ended 31 December 2017 (Unaudited) Sales 3 689 6 816 571 – 11 076 (6 816) 4 260 340 Cost of sales (3 026) (4 029) (433) 69 (7 419) 3 964 (3 455) (282)Other operating income 26 29 23 379 457 (4) 453 4 Other operating expenses (120) (641) (3) (497) (1 261) 641 (620) (70)Segment result 569 2 175 158 (49) 2 853 (2 215) 638 (8)Income from investments 15 151 – 88 254 (151) 103 –Finance cost (25) (19) (115) ( 34) (193) 19 (174) (12)Finance cost ZCCM: Shareholders’ loan Vale/ARM
joint venture – – – – – – – (20) Finance cost ARM: Shareholders’ loan Vale/ARM
joint venture – – – – – – – –Income from associate – – 111 – 111 – 111 –Income from joint venture – 111 – – 111 1 654 1 765 –Special items 1 – – – 1 – 1 (117)Taxation (163) (682) (8) (174) (1 027) 693 (334) (62)Profit/(loss) after tax 397 1 736 146 (169) 2 110 – 2 110 (219)Non-controlling interest (170) – – (2) (172) – (172) 34 Consolidation adjustment*** – 29 – (29) – – – –Contribution to basic earnings/ (losses) 227 1 765 146 (200) 1 938 – 1 938 (185)Contribution to headline earnings/(losses) 226 1 765 160 (200) 1 951 – 1 951 (6)Other information:Segment assets including investment in associate and
joint venture 9 371 20 063 3 588 3 940 36 962 (4 437) 32 525 Investment in associate 1 445 1 445 1 445 Investment in joint venture 15 626 15 626 Segment liabilities 1 894 1 595 1 825 2 223 7 537 (1 595) 5 942 Unallocated – Deferred taxation and taxation 4 550 (2 893) 1 657 Consolidated total liabilities 12 087 (4 488) 7 599 Cash generated/(utilised) from operations 784 1 918 210 19 2 931 (1 918) 1 013 (73)Cash inflow/(outflow) from operating activities 637 1 505 211 (1 448) 905 (505) 400 (76)Cash (outflow)/inflow from investing activities (431) (471) (127) 577 (452) 471 19 141 Cash outflow from financing activities (78) – (86) 46 (118) – (118) (7)Capital expenditure 435 558 108 – 1 101 (558) 543 46 Amortisation and depreciation 274 467 85 2 828 (467) 361 –EBITDA 843 2 642 243 ( 47) 3 681 (2 682) 999 (8)
There were no significant inter – division sales * Refer note 2.7 and note 4 for more detail on the ARM Ferrous segment. ** Includes IFRS 11 – Joint Arrangements – adjustments related to ARM Ferrous. *** Capitalised fees after tax and reversal of provision.
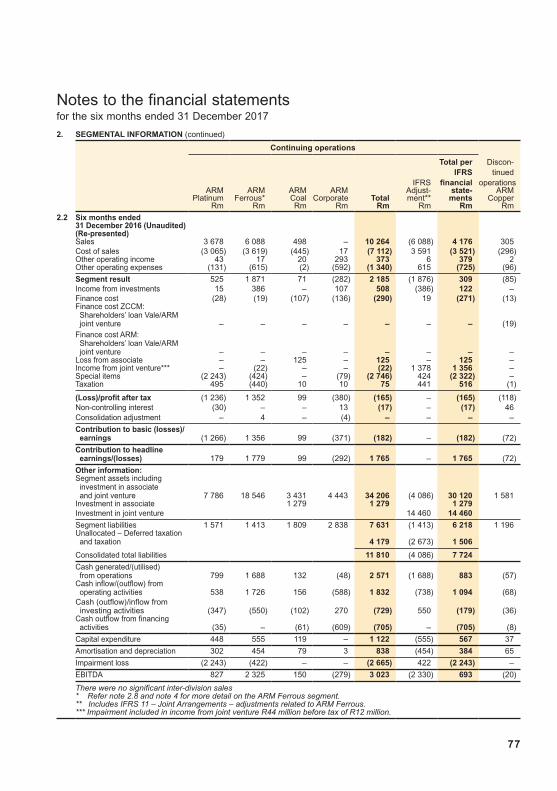
77
Notes to the financial statements for the six months ended 31 December 2017
2. SEGMENTAL INFORMATION (continued)
Continuing operations
Total per Discon-IFRS tinued
IFRS financial operationsARM ARM ARM ARM Adjust- state- ARM
Platinum Ferrous* Coal Corporate Total ment** ments CopperRm Rm Rm Rm Rm Rm Rm Rm
2.2 Six months ended 31 December 2016 (Unaudited)(Re-presented)Sales 3 678 6 088 498 – 10 264 (6 088) 4 176 305 Cost of sales (3 065) (3 619) (445) 17 (7 112) 3 591 (3 521) (296)Other operating income 43 17 20 293 373 6 379 2 Other operating expenses (131) (615) (2) (592) (1 340) 615 (725) (96)
Segment result 525 1 871 71 (282) 2 185 (1 876) 309 (85)Income from investments 15 386 – 107 508 (386) 122 –Finance cost (28) (19) (107) (136) (290) 19 (271) (13)Finance cost ZCCM: Shareholders’ loan Vale/ARM
joint venture – – – – – – – (19)Finance cost ARM: Shareholders’ loan Vale/ARM
joint venture – – – – – – – –Loss from associate – – 125 – 125 – 125 –Income from joint venture*** – (22) – – (22) 1 378 1 356 –Special items (2 243) (424) – (79) (2 746) 424 (2 322) –Taxation 495 (440) 10 10 75 441 516 (1)
(Loss)/profit after tax (1 236) 1 352 99 (380) (165) – (165) (118)Non-controlling interest (30) – – 13 (17) – (17) 46 Consolidation adjustment – 4 – (4) – – – –
Contribution to basic (losses)/ earnings (1 266) 1 356 99 (371) (182) – (182) (72)
Contribution to headline earnings/(losses) 179 1 779 99 (292) 1 765 – 1 765 (72)
Other information:Segment assets including investment in associate and joint venture 7 786 18 546 3 431 4 443 34 206 (4 086) 30 120 1 581
Investment in associate 1 279 1 279 1 279 Investment in joint venture 14 460 14 460
Segment liabilities 1 571 1 413 1 809 2 838 7 631 (1 413) 6 218 1 196 Unallocated – Deferred taxation and taxation 4 179 (2 673) 1 506
Consolidated total liabilities 11 810 (4 086) 7 724
Cash generated/(utilised) from operations 799 1 688 132 (48) 2 571 (1 688) 883 (57)Cash inflow/(outflow) from operating activities 538 1 726 156 (588) 1 832 (738) 1 094 (68)Cash (outflow)/inflow from investing activities (347) (550) (102) 270 (729) 550 (179) (36)Cash outflow from financing activities (35) – (61) (609) (705) – (705) (8)
Capital expenditure 448 555 119 – 1 122 (555) 567 37
Amortisation and depreciation 302 454 79 3 838 (454) 384 65
Impairment loss (2 243) (422) – – (2 665) 422 (2 243) –
EBITDA 827 2 325 150 (279) 3 023 (2 330) 693 (20)
There were no significant inter-division sales* Refer note 2.8 and note 4 for more detail on the ARM Ferrous segment.** Includes IFRS 11 – Joint Arrangements – adjustments related to ARM Ferrous.*** Impairment included in income from joint venture R44 million before tax of R12 million.

Interim results for the six months ended 31 December 2017
78
Notes to the financial statements for the six months ended 31 December 2017
2. SEGMENTAL INFORMATION (continued)
Continuing operations
Total per Discon-IFRS tinued
IFRS financial operationsARM ARM ARM ARM Adjust- state- ARM
Platinum Ferrous* Coal Corporate Total ment** ments CopperRm Rm Rm Rm Rm Rm Rm Rm
2.3 Year ended 30 June 2017 (Audited)Sales 7 247 13 140 911 – 21 298 (13 140) 8 158 600 Cost of sales (6 097) (7 405) (866) 40 (14 328) 7 377 (6 951) (601)Other operating income 78 35 37 595 745 12 757 4 Other operating expenses (276) (1 214) (4) (1 470) (2 964) 1 214 (1 750) (238)
Segment result 952 4 556 78 (835) 4 751 (4 537) 214 (235)Income from investments 30 537 – 208 775 (537) 238 –Finance cost (70) (48) (215) (138) (471) 48 (423) (19)Finance cost ZCCM: Shareholders’ loan Vale/ARM
joint venture – – – – – – – (56)Finance cost ARM: Shareholders’ loan Vale/ARM
joint venture – – – – – – – –Profit from associate – – 181 – 181 – 181 –Income form joint venture*** – (23) – – (23) 3 288 3 265 –Special items before tax (2 243) (471) – (79) (2 793) 471 (2 322) 180 Taxation 376 (1 272) 38 – (858) 1 267 409 –
(Loss)/profit after tax (955) 3 279 82 (844) 1 562 – 1 562 (130)Non-controlling interest (140) – – 9 (131) – (131) 71 Consolidation adjustment – (14) – 14 – – – –
Contribution to basic (losses)/ earnings (1 095) 3 265 82 (821) 1 431 – 1 431 (59)
Contribution to headline earnings/(losses) 350 3 709 82 (742) 3 399 – 3 399 203
Other information:Segment assets including investment in associate 8 234 19 249 3 785 3 763 35 031 (4 389) 30 642 1 604 Investment in associate 1 334 1 334 1 334 Investment in joint venture 14 860 14 860
Segment liabilities 1 819 1 617 1 848 1 958 7 242 (1 617) 5 625 1 172 Unallocated – Deferred taxation and taxation 4 181 (2 772) 1 409
Consolidated total liabilities 11 423 (4 389) 7 034
Cash inflow/(outflow) generated from operations 1 419 4 933 222 54 6 628 (4 933) 1 695 (84)Cash inflow/(outflow) from operating activities 868 4 396 222 (555) 4 931 (1 908) 3 023 (155)Cash (outflow)/inflow from investing activities (727) (1 142) (181) 300 (1 750) 1 142 (608) (32)Cash outflow from financing activities (15) – (40) (1 806) (1 861) – (1 861) (4)
Capital expenditure 783 1 361 196 2 2 342 (1 361) 981 41
Amortisation and depreciation 546 913 159 3 1 621 (913) 708 107 (Impairment)/reversal before tax (2 243) (470) – – (2 713) 470 (2 243) 180
EBITDA 1 498 5 469 237 (832) 6 372 (5 450) 922 (128)
There were no significant inter-division sales* Refer note 2.9 and note 4 for more detail on the ARM Ferrous segment.** Includes IFRS 11 – Joint Arrangements – adjustments related to ARM Ferrous.*** Impairment included in income from joint venture R470 million after tax of R27 million.

79
Notes to the financial statements for the six months ended 31 December 2017
2. SEGMENTAL INFORMATION (continued)
Additional informationThe ARM platinum segment is analysed further into Nkomati, Two Rivers Platinum Proprietary Limited and ARM Mining Consortium Limited which includes 50% of the Modikwa Platinum Mine.
ARM Two Rivers Modikwa Nkomati Platinum
Rm Rm Rm Rm
2.4 Six months ended 31 December 2017 (Unaudited)Sales 1 950 877 862 3 689 Cost of sales (1 418) (822) (786) (3 026)Other operating income 11 12 3 26 Other operating expenses (58) (12) (50) (120)
Segment result 485 55 29 569Income from investments 6 6 3 15 Finance cost (14) (2) (9) (25)Special items before tax – – 1 1 Taxation (141) (16) (6) (163)
Profit after tax 336 43 18 397 Non-controlling interest (163) (7) – (170)
Contribution to earnings 173 36 18 227
Contribution to headline earnings 173 36 17 226
Other information: Segment and consolidated assets 5 143 2 367 1 861 9 371 Segment liabilities 1 153 431 310 1 894
Cash inflow from operating activities 347 177 113 637 Cash outflow from investing activities (223) (110) (98) (431)Cash outflow from financing activities (17) – (61) (78)
Capital expenditure 226 109 100 435
Amortisation and depreciation 151 45 78 274
EBITDA 636 100 107 843
2.5 Six months ended 31 December 2016 (Unaudited)Sales 2 143 618 917 3 678 Cost of sales (1 485) (706) (874) (3 065)Other operating income 8 6 29 43 Other operating expenses (93) (9) (29) (131)
Segment result 573 (91) 43 525 Income from investments 7 5 3 15 Finance cost (16) (4) (8) (28)Special items before tax – (1 255) (988) (2 243)Taxation (162) 390 267 495
Profit/(loss) after tax 402 (955) (683) (1 236)Non-controlling interest (197) 167 – (30)
Contribution to basic earnings 205 (788) (683) (1 266)
Contribution to headline earnings 205 (54) 28 179
Other information: Segment and consolidated assets 4 095 1 961 1 730 7 786 Segment liabilities 847 332 392 1 571
Cash inflow/(outflow) from operating activities 246 29 263 538 Cash outflow from investing activities (77) (80) (190) (347)Cash outflow from financing activities (24) – (11) (35)
Capital expenditure 175 80 193 448
Amortisation and depreciation 128 55 119 302 Impairment loss – (1 255) (988) (2 243)
EBITDA 701 (36) 162 827
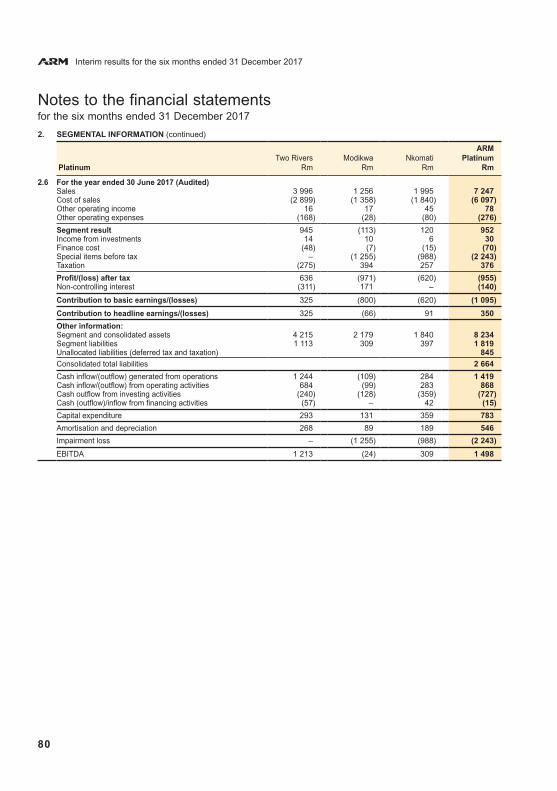
Interim results for the six months ended 31 December 2017
80
Notes to the financial statements for the six months ended 31 December 2017
2. SEGMENTAL INFORMATION (continued)
ARM Two Rivers Modikwa Nkomati Platinum
Platinum Rm Rm Rm Rm
2.6 For the year ended 30 June 2017 (Audited)Sales 3 996 1 256 1 995 7 247 Cost of sales (2 899) (1 358) (1 840) (6 097)Other operating income 16 17 45 78 Other operating expenses (168) (28) (80) (276)
Segment result 945 (113) 120 952 Income from investments 14 10 6 30 Finance cost (48) (7) (15) (70)Special items before tax – (1 255) (988) (2 243)Taxation (275) 394 257 376
Profit/(loss) after tax 636 (971) (620) (955)Non-controlling interest (311) 171 – (140)
Contribution to basic earnings/(losses) 325 (800) (620) (1 095)
Contribution to headline earnings/(losses) 325 (66) 91 350
Other information: Segment and consolidated assets 4 215 2 179 1 840 8 234 Segment liabilities 1 113 309 397 1 819 Unallocated liabilities (deferred tax and taxation) 845 Consolidated total liabilities 2 664
Cash inflow/(outflow) generated from operations 1 244 (109) 284 1 419 Cash inflow/(outflow) from operating activities 684 (99) 283 868 Cash outflow from investing activities (240) (128) (359) (727)Cash (outflow)/inflow from financing activities (57) – 42 (15)
Capital expenditure 293 131 359 783
Amortisation and depreciation 268 89 189 546
Impairment loss – (1 255) (988) (2 243)
EBITDA 1 213 (24) 309 1 498
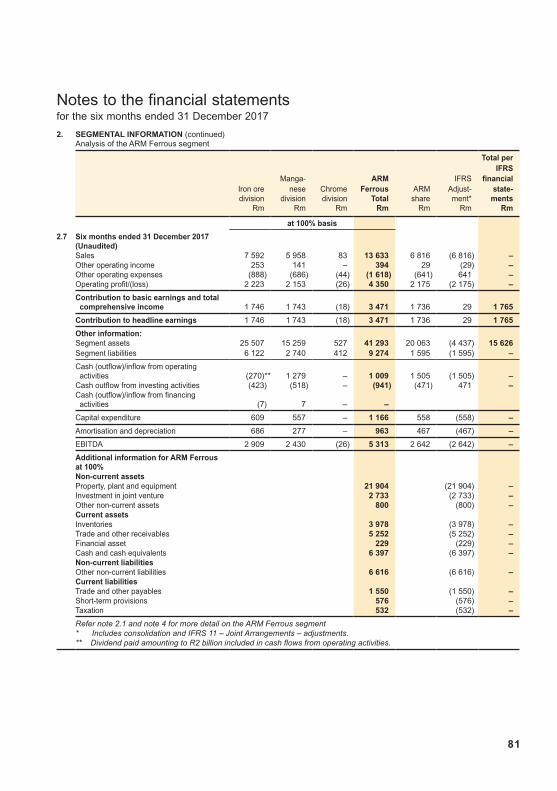
81
Notes to the financial statements for the six months ended 31 December 2017
2. SEGMENTAL INFORMATION (continued)Analysis of the ARM Ferrous segment
Total perIFRS
Manga- ARM IFRS financialIron ore nese Chrome Ferrous ARM Adjust- state-division division division Total share ment* ments
Rm Rm Rm Rm Rm Rm Rm
at 100% basis
2.7 Six months ended 31 December 2017 (Unaudited)Sales 7 592 5 958 83 13 633 6 816 (6 816) –Other operating income 253 141 – 394 29 (29) –Other operating expenses (888) (686) (44) (1 618) (641) 641 –Operating profit/(loss) 2 223 2 153 (26) 4 350 2 175 (2 175) –
Contribution to basic earnings and total comprehensive income 1 746 1 743 (18) 3 471 1 736 29 1 765
Contribution to headline earnings 1 746 1 743 (18) 3 471 1 736 29 1 765
Other information:Segment assets 25 507 15 259 527 41 293 20 063 (4 437) 15 626 Segment liabilities 6 122 2 740 412 9 274 1 595 (1 595) –
Cash (outflow)/inflow from operating activities (270)** 1 279 – 1 009 1 505 (1 505) –Cash outflow from investing activities (423) (518) – (941) (471) 471 –Cash (outflow)/inflow from financing activities (7) 7 – –
Capital expenditure 609 557 – 1 166 558 (558) –
Amortisation and depreciation 686 277 – 963 467 (467) –
EBITDA 2 909 2 430 (26) 5 313 2 642 (2 642) –
Additional information for ARM Ferrous at 100% Non-current assetsProperty, plant and equipment 21 904 (21 904) –Investment in joint venture 2 733 (2 733) –Other non-current assets 800 (800) –Current assetsInventories 3 978 (3 978) –Trade and other receivables 5 252 (5 252) –Financial asset 229 (229) –Cash and cash equivalents 6 397 (6 397) –Non-current liabilitiesOther non-current liabilities 6 616 (6 616) –Current liabilitiesTrade and other payables 1 550 (1 550) –Short-term provisions 576 (576) –Taxation 532 (532) –
Refer note 2.1 and note 4 for more detail on the ARM Ferrous segment* Includes consolidation and IFRS 11 – Joint Arrangements – adjustments. ** Dividend paid amounting to R2 billion included in cash flows from operating activities.
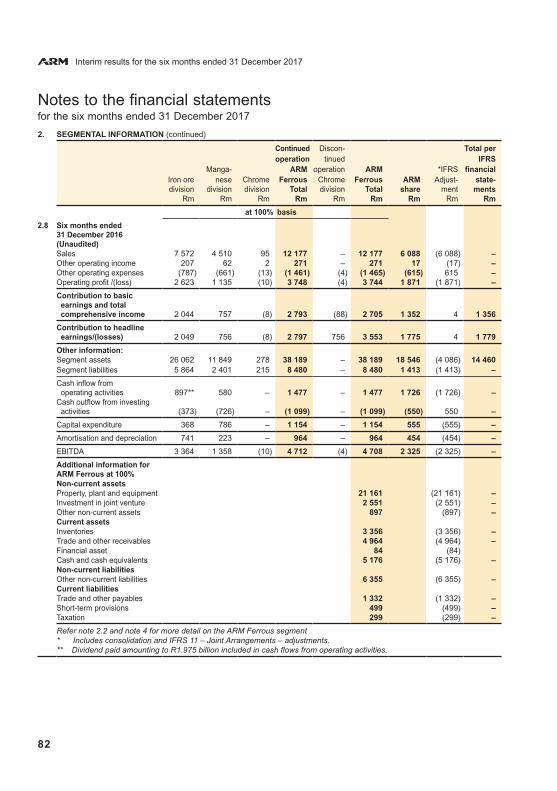
Interim results for the six months ended 31 December 2017
82
Notes to the financial statements for the six months ended 31 December 2017
2. SEGMENTAL INFORMATION (continued)
Continued Discon- Total peroperation tinued IFRS
Manga- ARM operation ARM *IFRS financialIron ore nese Chrome Ferrous Chrome Ferrous ARM Adjust- state-division division division Total division Total share ment ments
Rm Rm Rm Rm Rm Rm Rm Rm Rm
at 100% basis
2.8
Six months ended 31 December 2016 (Unaudited) Sales 7 572 4 510 95 12 177 – 12 177 6 088 (6 088) – Other operating income 207 62 2 271 – 271 17 (17) – Other operating expenses (787) (661) (13) (1 461) (4) (1 465) (615) 615 – Operating profit /(loss) 2 623 1 135 (10) 3 748 (4) 3 744 1 871 (1 871) –
Contribution to basic earnings and total
comprehensive income 2 044 757 (8) 2 793 (88) 2 705 1 352 4 1 356
Contribution to headline earnings/(losses) 2 049 756 (8) 2 797 756 3 553 1 775 4 1 779
Other information:Segment assets 26 062 11 849 278 38 189 – 38 189 18 546 (4 086) 14 460 Segment liabilities 5 864 2 401 215 8 480 – 8 480 1 413 (1 413) –
Cash inflow from operating activities 897** 580 – 1 477 – 1 477 1 726 (1 726) – Cash outflow from investing activities (373) (726) – (1 099) – (1 099) (550) 550 –
Capital expenditure 368 786 – 1 154 – 1 154 555 (555) –
Amortisation and depreciation 741 223 – 964 – 964 454 (454) –
EBITDA 3 364 1 358 (10) 4 712 (4) 4 708 2 325 (2 325) –
Additional information for ARM Ferrous at 100% Non-current assetsProperty, plant and equipment 21 161 (21 161) –Investment in joint venture 2 551 (2 551) –Other non-current assets 897 (897) –Current assetsInventories 3 356 (3 356) –Trade and other receivables 4 964 (4 964) –Financial asset 84 (84)Cash and cash equivalents 5 176 (5 176) –Non-current liabilitiesOther non-current liabilities 6 355 (6 355) – Current liabilitiesTrade and other payables 1 332 (1 332) – Short-term provisions 499 (499) – Taxation 299 (299) –
Refer note 2.2 and note 4 for more detail on the ARM Ferrous segment* Includes consolidation and IFRS 11 – Joint Arrangements – adjustments. ** Dividend paid amounting to R1.975 billion included in cash flows from operating activities.
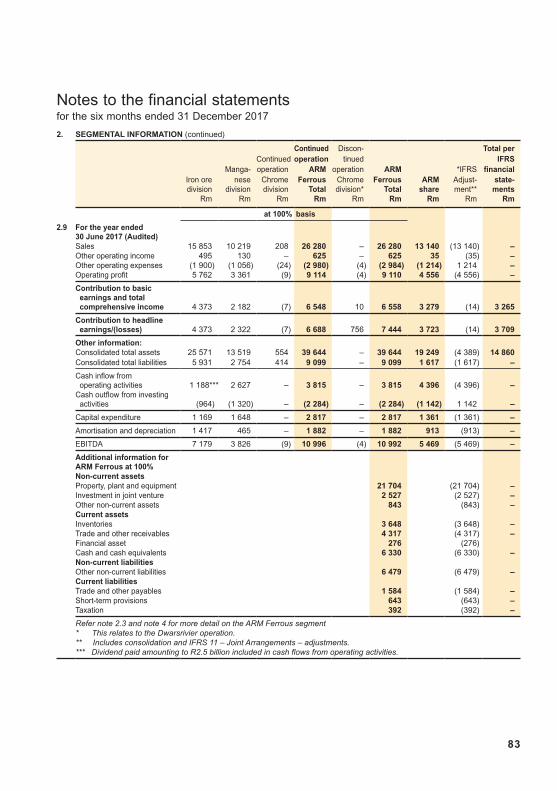
83
Notes to the financial statements for the six months ended 31 December 2017
2. SEGMENTAL INFORMATION (continued)
Continued Discon- Total perContinued operation tinued IFRS
Manga- operation ARM operation ARM *IFRS financialIron ore nese Chrome Ferrous Chrome Ferrous ARM Adjust- state-division division division Total division* Total share ment** ments
Rm Rm Rm Rm Rm Rm Rm Rm Rm
at 100% basis
2.9 For the year ended 30 June 2017 (Audited) Sales 15 853 10 219 208 26 280 – 26 280 13 140 (13 140) –Other operating income 495 130 – 625 – 625 35 (35) –Other operating expenses (1 900) (1 056) (24) (2 980) (4) (2 984) (1 214) 1 214 –Operating profit 5 762 3 361 (9) 9 114 (4) 9 110 4 556 (4 556) –
Contribution to basic earnings and total
comprehensive income 4 373 2 182 (7) 6 548 10 6 558 3 279 (14) 3 265
Contribution to headline earnings/(losses) 4 373 2 322 (7) 6 688 756 7 444 3 723 (14) 3 709
Other information:Consolidated total assets 25 571 13 519 554 39 644 – 39 644 19 249 (4 389) 14 860 Consolidated total liabilities 5 931 2 754 414 9 099 – 9 099 1 617 (1 617) –
Cash inflow from operating activities 1 188*** 2 627 – 3 815 – 3 815 4 396 (4 396) –Cash outflow from investing activities (964) (1 320) – (2 284) – (2 284) (1 142) 1 142 –
Capital expenditure 1 169 1 648 – 2 817 – 2 817 1 361 (1 361) –
Amortisation and depreciation 1 417 465 – 1 882 – 1 882 913 (913) –
EBITDA 7 179 3 826 (9) 10 996 (4) 10 992 5 469 (5 469) –
Additional information for ARM Ferrous at 100% Non-current assetsProperty, plant and equipment 21 704 (21 704) –Investment in joint venture 2 527 (2 527) –Other non-current assets 843 (843) –Current assetsInventories 3 648 (3 648) –Trade and other receivables 4 317 (4 317) –Financial asset 276 (276)Cash and cash equivalents 6 330 (6 330) –Non-current liabilitiesOther non-current liabilities 6 479 (6 479) –Current liabilitiesTrade and other payables 1 584 (1 584) –Short-term provisions 643 (643) –Taxation 392 (392) –
Refer note 2.3 and note 4 for more detail on the ARM Ferrous segment* This relates to the Dwarsrivier operation.** Includes consolidation and IFRS 11 – Joint Arrangements – adjustments.*** Dividend paid amounting to R2.5 billion included in cash flows from operating activities.
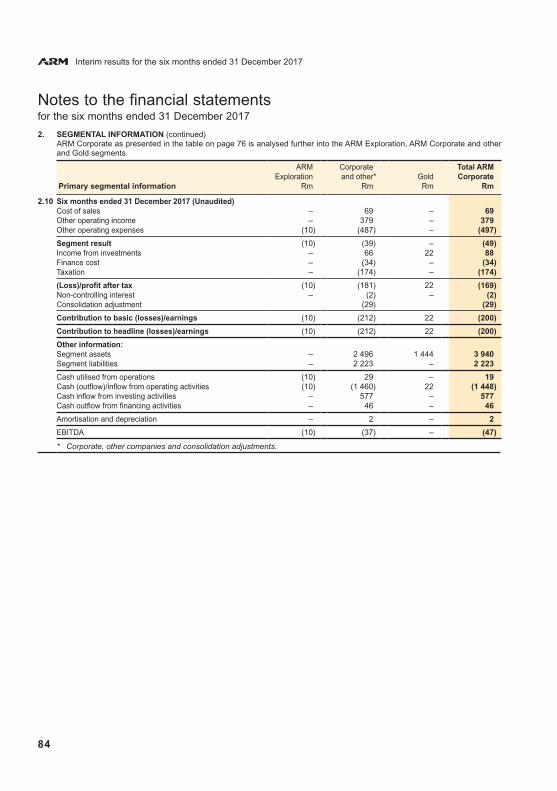
Interim results for the six months ended 31 December 2017
84
Notes to the financial statements for the six months ended 31 December 2017
2. SEGMENTAL INFORMATION (continued)ARM Corporate as presented in the table on page 76 is analysed further into the ARM Exploration, ARM Corporate and other and Gold segments.
ARM Corporate Total ARM Exploration and other* Gold Corporate
Primary segmental information Rm Rm Rm Rm
2.10 Six months ended 31 December 2017 (Unaudited) Cost of sales – 69 – 69 Other operating income – 379 – 379Other operating expenses (10) (487) – (497)
Segment result (10) (39) – (49)Income from investments – 66 22 88 Finance cost – (34) – (34)Taxation – (174) – (174)
(Loss)/profit after tax (10) (181) 22 (169)Non-controlling interest – (2) – (2)Consolidation adjustment (29) (29)
Contribution to basic (losses)/earnings (10) (212) 22 (200)
Contribution to headline (losses)/earnings (10) (212) 22 (200)
Other information: Segment assets – 2 496 1 444 3 940 Segment liabilities – 2 223 – 2 223
Cash utilised from operations (10) 29 – 19 Cash (outflow)/inflow from operating activities (10) (1 460) 22 (1 448)Cash inflow from investing activities – 577 – 577 Cash outflow from financing activities – 46 – 46
Amortisation and depreciation – 2 – 2
EBITDA (10) (37) – (47)
* Corporate, other companies and consolidation adjustments.

85
Notes to the financial statements for the six months ended 31 December 2017
2. SEGMENTAL INFORMATION (continued)ARM Corporate as presented in the table on page 77 is analysed further into the ARM Exploration, ARM Corporate and other and Gold segments.
ARM Corporate Total ARM Exploration and other* Gold Corporate
Rm Rm Rm Rm
2.11 Six months ended 31 December 2016 (Unaudited)Cost of sales – 17 17 Other operating income – 293 293 Other operating expenses (12) (580) (592)
Segment result (12) (270) (282)Income from investments – 75 32 107 Finance cost – (136) (136)Special items before tax – (79) (79)Taxation – 10 10
(Loss)/profit after tax (12) (400) 32 (380)Non-controlling interest – 13 13 Consolidation adjustment (4) (4)
Contribution to basic (losses)/earnings (12) (391) 32 (371)
Contribution to headline (losses)/earnings (12) (312) 32 (292)
Other information: Segment assets – 2 437 2 006 4 443 Segment liabilities – 2 838 2 838
Cash (utilised)/generated from operations (12) (36) (48)Cash outflow from operating activities (12) (576) (588)Cash inflow from investing activities – 238 32 270 Cash inflow from financing activities – (609) (609)
Amortisation and depreciation – 3 3
EBITDA (12) (267) (279)
* Corporate, other companies and consolidation adjustments.

Interim results for the six months ended 31 December 2017
86
Notes to the financial statements for the six months ended 31 December 2017
2. SEGMENTAL INFORMATION (continued),ARM Corporate as presented in the table on page 78 is analysed further into the ARM Exploration, ARM Corporate and other and Gold segments.
ARM Corporate Total ARM Exploration and other* Gold Corporate
Rm Rm Rm Rm
2.12 For the year ended 30 June 2017 (Audited)Cost of sales – 40 40 Other operating income – 595 595 Other operating expenses (28) (1 442) (1 470)
Segment result (28) (807) (835)Income from investments – 144 64 208 Finance cost – (138) (138)Special items before tax – (79) (79)
(Loss)/profit after tax (28) (880) 64 (844)Non-controlling interest – 9 9 Consolidation adjustment 14 14
Contribution to basic (losses)/earnings (28) (857) 64 (821)
Contribution to headline (losses)/earnings (28) (778) 64 (742)
Other information: Segment and consolidated assets – 2 383 1 380 3 763 Segment liabilities – 1 958 1 958
Cash outflow from operating activities (28) (527) (555)Cash inflow from investing activities – 236 64 300 Cash outflow from financing activities – (1 806) (1 806)
Capital expenditure – 2 2
Amortisation and depreciation – 3 3
EBITDA (28) (804) (832)
* Corporate, other companies and consolidation adjustments.

87
Notes to the financial statements for the six months ended 31 December 2017
3. PROPERTY, PLANT AND EQUIPMENT3.1 Lubambe Copper Mine
At year end 30 June 2017, there was an impairment reversal following the classification of Lubambe as an asset held for sale (refer note 11 and 12). There were no further impairments or impairment reversals at time of sale.
3.2 Nkomati Nickel MineAt 31 December 2016, an impairment loss of the Nkomati Nickel Mine cash generating unit was recognised, largely as a result of: i) A revision of the mine plan with a resultant lower metal output profile. ii) A significant decline from the prior year forecast long-term price of nickel and a further strengthening of the R/US$ exchange
rate.
ARM’s attributable share of the impairment charge amounted to R988 million before tax and R711 million after tax.
The recoverable amount of the cash generating unit was determined based on the value-in-use calculation performed in terms of International Financial Reporting Standards.
A pre-tax discount rate of 20.72% was used for the impairment calculation together with the following metal prices and exchange rate assumptions.
2H F2017 Nominal
F2018 Nominal
F2019 F2020 Nominal
Long-term Real
Nickel – US$/tonne 11 053 11 561 12 606 14 029 16 475
Platinum – US$/ounce 986 1 073 1 171 1 247 1 270
Palladium – US$/ounce 712 751 805 825 790
Gold – US$/ounce 1 221 1 260 1 295 1 307 1 194
Copper – US$/tonne 5 356 5 362 5 555 5 803 5 975
Cobalt – US$/lb 14.00 13.89 13.51 13.58 11.86
Chrome concentrate – US$/tonne 235 180 160 165 175
Exchange rate – R/US$ 13.84 14.24 14.22 14.30 14.00
At 30 June and 31 December 2017 there were no further impairments.
3.3 Modikwa Platinum MineAt 31 December 2016, an impairment loss of the Modikwa Platinum Mine cash generating unit attributable to ARM, was recognised largely as a result of : (i) Lower forecast PGM output over the short- to medium-term;(ii) Higher forecast unit cost of production; and(iii) A reduction in the forecast long-term platinum price and a further strengthening of the R/US$ exchange rate.
ARM’s attributable share of the impairment amounted to R1 255 million before tax, R890 million after tax and R734 million after non-controlling interest and tax.
The recoverable amount of the cash generating unit was determined based on the value-in-use calculation performed in terms of International Financial Reporting Standards.
A pre-tax discount rate of 18.72% as used for the impairment calculation together with the following metal prices and exchange rate assumptions.
2H F2017 Nominal
F2018 Nominal
F2019 Nominal
F2020 Nominal
Long-term Real
Platinum – US$/ounce 986 1 073 1 171 1 247 1 270
Palladium – US$/ounce 712 751 805 825 790
Rhodium – US$/ounce 845 800 800 850 850
Gold – US$/ounce 1 221 1 260 1 295 1 307 1 194
Iridium – US$/ounce 500 500 500 500 500
Ruthenium – US$/ounce 40 40 50 50 55
Nickel – US$/tonne 11 053 11 561 12 606 14 029 16 475
Copper – US$/tonne 5 356 5 362 5 555 5 803 5 975
Cobalt – US$/lb 14.00 13.89 13.51 13.58 11.86
Exchange rate – R/US$ 13.84 14.24 14.22 14.30 14.00
At 30 June and 31 December 2017 there were no further impairments.
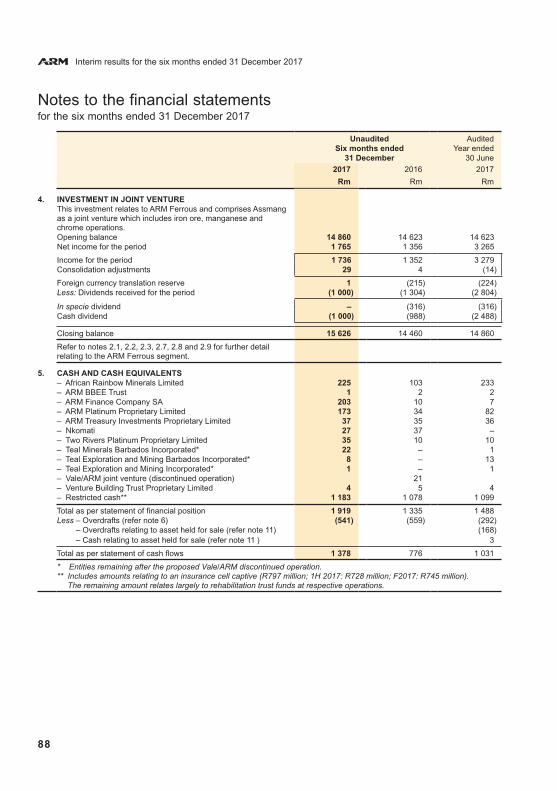
Interim results for the six months ended 31 December 2017
88
Notes to the financial statements for the six months ended 31 December 2017
Unaudited AuditedSix months ended Year ended
31 December 30 June
2017 2016 2017
Rm Rm Rm
4. INVESTMENT IN JOINT VENTURE This investment relates to ARM Ferrous and comprises Assmang as a joint venture which includes iron ore, manganese and chrome operations.Opening balance 14 860 14 623 14 623 Net income for the period 1 765 1 356 3 265
Income for the period 1 736 1 352 3 279 Consolidation adjustments 29 4 (14)
Foreign currency translation reserve 1 (215) (224)Less: Dividends received for the period (1 000) (1 304) (2 804)
In specie dividend – (316) (316)Cash dividend (1 000) (988) (2 488)
Closing balance 15 626 14 460 14 860
Refer to notes 2.1, 2.2, 2.3, 2.7, 2.8 and 2.9 for further detail relating to the ARM Ferrous segment.
5. CASH AND CASH EQUIVALENTS – African Rainbow Minerals Limited 225 103 233 – ARM BBEE Trust 1 2 2 – ARM Finance Company SA 203 10 7 – ARM Platinum Proprietary Limited 173 34 82 – ARM Treasury Investments Proprietary Limited 37 35 36 – Nkomati 27 37 –– Two Rivers Platinum Proprietary Limited 35 10 10 – Teal Minerals Barbados Incorporated* 22 – 1 – Teal Exploration and Mining Barbados Incorporated* 8 – 13 – Teal Exploration and Mining Incorporated* 1 – 1 – Vale/ARM joint venture (discontinued operation) 21 – Venture Building Trust Proprietary Limited 4 5 4 – Restricted cash** 1 183 1 078 1 099
Total as per statement of financial position 1 919 1 335 1 488 Less – Overdrafts (refer note 6) (541) (559) (292)
– Overdrafts relating to asset held for sale (refer note 11) (168) – Cash relating to asset held for sale (refer note 11 ) 3
Total as per statement of cash flows 1 378 776 1 031
* Entities remaining after the proposed Vale/ARM discontinued operation. ** Includes amounts relating to an insurance cell captive (R797 million; 1H 2017: R728 million; F2017: R745 million).
The remaining amount relates largely to rehabilitation trust funds at respective operations.

89
Notes to the financial statements for the six months ended 31 December 2017
Unaudited AuditedSix months ended Year ended
31 December 30 June
2017 2016 2017Rm Rm Rm
6. BORROWINGSLong-term borrowings are held as follows:– African Rainbow Minerals Limited 200 1 025 –– ARM BBEE Trust 473 500 528 – ARM Coal Proprietary Limited (partner loan) 1 578 1 358 1 433 – Nkomati 9 15 13 – Two Rivers Platinum Proprietary Limited 51 43 28 – Vale/ARM joint operation* 8 – Vale/ARM joint operation (partner loan)* 669
2 311 3 618 2 002
Short-term borrowings are held as follows:– Anglo Platinum Limited (partner loan) 114 114 114 – ARM Coal Proprietary Limited (partner loan) – 206 172 – ARM Finance Company SA – 274 78 – Nkomati 7 9 64 – Two Rivers Platinum Proprietary Limited 48 48 37 – Vale/ARM joint operation* 15
169 666 465
Overdrafts are held as follows:– African Rainbow Minerals Limited 190 1 – – ARM Mining Consortium Limited – 31 – – Nkomati – – 11 – Two Rivers Platinum Proprietary Limited 327 301 261 – Vale/ARM joint operation* 205 – Other 24 21 20
541 559 292
Overdrafts and short-term borrowings 710 1 225 757
Total borrowings 3 021 4 843 2 759
* Asset held for sale and discontinued operation (refer note 11)Long-term borrowing 656 Short-term borrowing 15 Overdraft 168
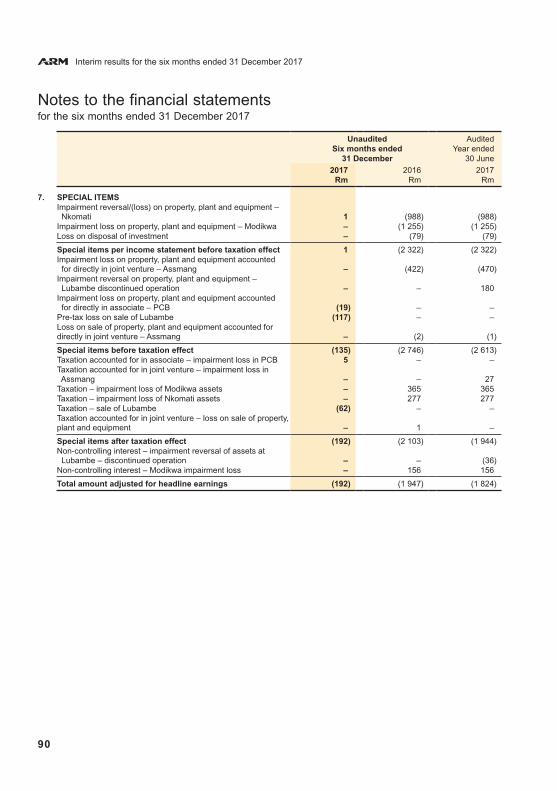
Interim results for the six months ended 31 December 2017
90
Notes to the financial statements for the six months ended 31 December 2017
Unaudited AuditedSix months ended Year ended
31 December 30 June
2017 2016 2017Rm Rm Rm
7. SPECIAL ITEMSImpairment reversal/(loss) on property, plant and equipment – Nkomati 1 (988) (988)Impairment loss on property, plant and equipment – Modikwa – (1 255) (1 255)Loss on disposal of investment – (79) (79)
Special items per income statement before taxation effect 1 (2 322) (2 322)Impairment loss on property, plant and equipment accounted for directly in joint venture – Assmang – (422) (470)Impairment reversal on property, plant and equipment – Lubambe discontinued operation – – 180Impairment loss on property, plant and equipment accounted for directly in associate – PCB (19) – – Pre-tax loss on sale of Lubambe (117) – – Loss on sale of property, plant and equipment accounted for directly in joint venture – Assmang – (2) (1)
Special items before taxation effect (135) (2 746) (2 613)Taxation accounted for in associate – impairment loss in PCB 5 – –Taxation accounted for in joint venture – impairment loss in Assmang – – 27Taxation – impairment loss of Modikwa assets – 365 365 Taxation – impairment loss of Nkomati assets – 277 277 Taxation – sale of Lubambe (62) – – Taxation accounted for in joint venture – loss on sale of property, plant and equipment – 1 –
Special items after taxation effect (192) (2 103) (1 944)Non-controlling interest – impairment reversal of assets at Lubambe – discontinued operation – – (36)Non-controlling interest – Modikwa impairment loss – 156 156
Total amount adjusted for headline earnings (192) (1 947) (1 824)

91
Unaudited AuditedSix months ended Year ended
31 December 30 June
2017 2016 2017Rm Rm Rm
8. EARNINGS PER SHARE (Re-presented)
Headline earnings (R million) 1 945 1 693 3 196 Headline earnings from continuing operations (R million) 1 951 1 765 3 399 Headline loss from discontinued operation (R million) (6) (72) (203) Headline earnings per share (cents) 1 023 893 1 684 Headline earnings per share from continuing operations (cents) 1 026 931 1 791 Headline loss per share from discontinued operation (cents) (3) (38) (107)Basic earnings/(loss) per share (cents) 922 (134) 723 Basic earnings/(loss) from continuing operations per share (cents) 1 019 (96) 754 Basic loss from discontinued operation per share (cents) (97) (38) (31)Diluted headline earnings per share (cents) 994 869 1 638 Diluted headline earnings per share from continuing operations (cents) 997 906 1 742 Diluted headline loss per share from discontinued operation (cents) (3) (37) (104)Diluted basic earnings/(loss) per share (cents) 896 (130) 703 Diluted basic earnings/(loss) from continuing operations per share (cents) 990 (93) 733 Diluted basic loss from discontinued operation per share (cents) (95) (37) (30)Number of shares in issue at end of the period (thousands) 219 692 218 577 218 702 Weighted average number of shares (thousands) 190 163 189 529 189 768 Weighted average number of shares used in calculating diluted earnings per share (thousands) 195 740 194 880 195 112 Net asset value per share (cents) 10 644 10 128 10 744 EBITDA (R million) 991 673 794 EBITDA from continuing operations (R million) 999 693 922 Dividend declared after period end (cents per share) 250 – 650
Reconciliation to headline earningsBasic earnings/(loss) attributable to equity holders of ARM 1 753 (254) 1 372 Impairment loss on property, plant and equipment – Modikwa – 1 255 1 255 Impairment (reversal)/loss on property, plant and equipment – Nkomati (1) 988 988 Impairment loss of property, plant and equipment in joint venture – Assmang – 422 470 Impairment loss of property, plant and equipment in associate – PCB 19 – –Pre-tax loss on sale of Lubambe 117 – –Loss on disposal of investment – 79 79 Loss on sale of property, plant and equipment in joint venture – Assmang – 2 1 Reversal of impairment on property, plant and equipment Lubambe – – (180)
1 888 2 492 3 985 Taxation accounted for directly in associate and joint venture (5) (1) (27)Taxation – impairment loss of Modikwa assets – (365) (365)Taxation – impairment loss of Nkomati assets – (277) (277)Taxation – sale of Lubambe 62 – –
1 945 1 849 3 316 Non-controlling interest – impairment reversal of assets at Lubambe – discontinued operation – – 36 Non-controlling interest – Modikwa impairment loss – (156) (156)
Headline earnings 1 945 1 693 3 196
Notes to the financial statements for the six months ended 31 December 2017
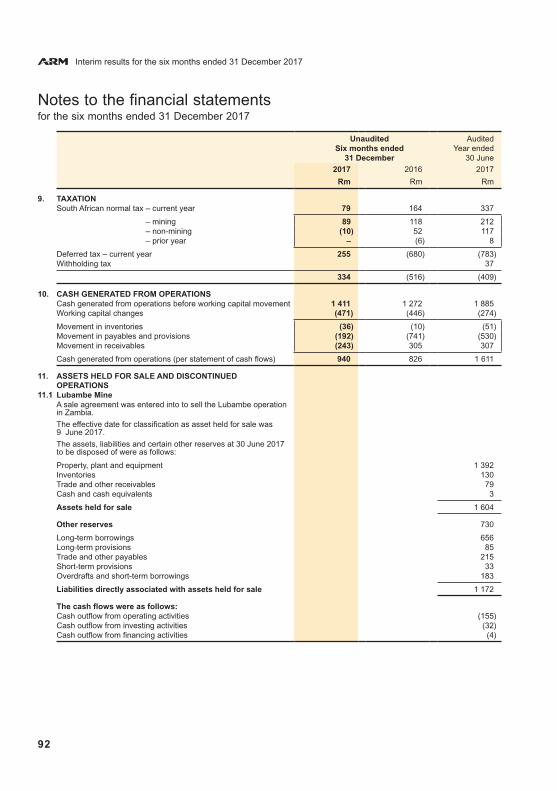
Interim results for the six months ended 31 December 2017
92
Notes to the financial statements for the six months ended 31 December 2017
Unaudited AuditedSix months ended Year ended
31 December 30 June
2017 2016 2017
Rm Rm Rm
9. TAXATIONSouth African normal tax – current year 79 164 337
South African normal tax – mining 89 118 212 South African normal tax – non-mining (10) 52 117 South African normal tax – prior year – (6) 8
Deferred tax – current year 255 (680) (783)Withholding tax 37
334 (516) (409)
10. CASH GENERATED FROM OPERATIONS Cash generated from operations before working capital movement 1 411 1 272 1 885 Working capital changes (471) (446) (274)
Movement in inventories (36) (10) (51)Movement in payables and provisions (192) (741) (530)Movement in receivables (243) 305 307
Cash generated from operations (per statement of cash flows) 940 826 1 611
11. ASSETS HELD FOR SALE AND DISCONTINUED OPERATIONS
11.1 Lubambe MineA sale agreement was entered into to sell the Lubambe operation in Zambia.
The effective date for classification as asset held for sale was 9 June 2017.
The assets, liabilities and certain other reserves at 30 June 2017 to be disposed of were as follows:
Property, plant and equipment 1 392 Inventories 130 Trade and other receivables 79 Cash and cash equivalents 3
Assets held for sale 1 604
Other reserves 730
Long-term borrowings 656 Long-term provisions 85 Trade and other payables 215 Short-term provisions 33 Overdrafts and short-term borrowings 183
Liabilities directly associated with assets held for sale 1 172
The cash flows were as follows:Cash outflow from operating activities (155)Cash outflow from investing activities (32)Cash outflow from financing activities (4)
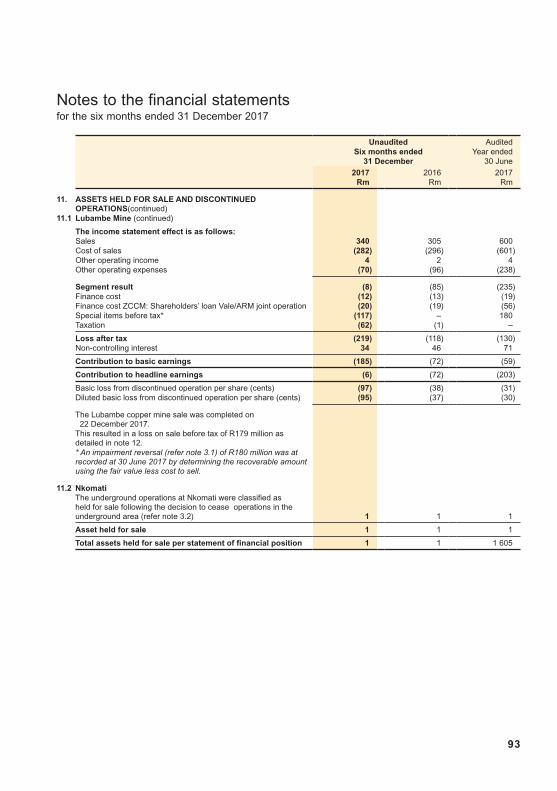
93
Unaudited AuditedSix months ended Year ended
31 December 30 June
2017 2016 2017Rm Rm Rm
11. ASSETS HELD FOR SALE AND DISCONTINUED OPERATIONS(continued)
11.1 Lubambe Mine (continued)
The income statement effect is as follows:Sales 340 305 600 Cost of sales (282) (296) (601)Other operating income 4 2 4 Other operating expenses (70) (96) (238)
Segment result (8) (85) (235)Finance cost (12) (13) (19)Finance cost ZCCM: Shareholders’ loan Vale/ARM joint operation (20) (19) (56)Special items before tax* (117) – 180 Taxation (62) (1) –
Loss after tax (219) (118) (130)Non-controlling interest 34 46 71
Contribution to basic earnings (185) (72) (59)
Contribution to headline earnings (6) (72) (203)
Basic loss from discontinued operation per share (cents) (97) (38) (31)Diluted basic loss from discontinued operation per share (cents) (95) (37) (30)
The Lubambe copper mine sale was completed on 22 December 2017. This resulted in a loss on sale before tax of R179 million as detailed in note 12. * An impairment reversal (refer note 3.1) of R180 million was at recorded at 30 June 2017 by determining the recoverable amount using the fair value less cost to sell.
11.2 NkomatiThe underground operations at Nkomati were classified as held for sale following the decision to cease operations in the underground area (refer note 3.2) 1 1 1
Asset held for sale 1 1 1
Total assets held for sale per statement of financial position 1 1 1 605
Notes to the financial statements for the six months ended 31 December 2017
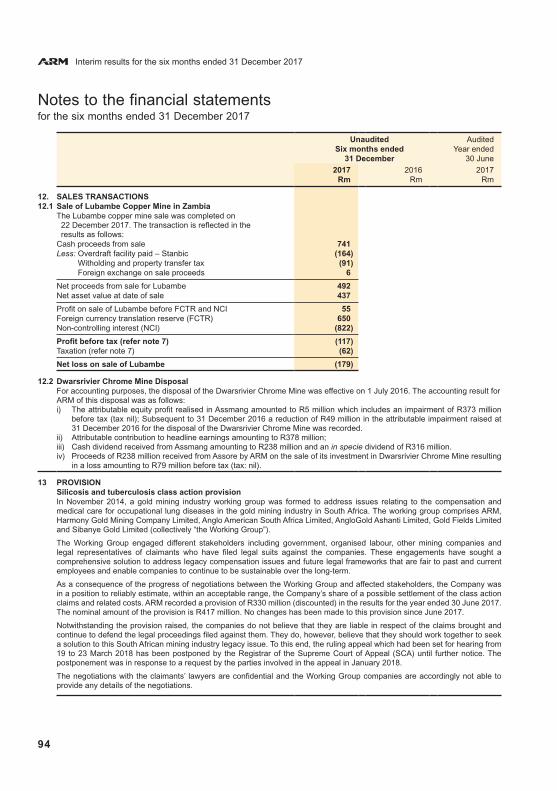
Interim results for the six months ended 31 December 2017
94
Notes to the financial statements for the six months ended 31 December 2017
Unaudited AuditedSix months ended Year ended
31 December 30 June
2017 2016 2017Rm Rm Rm
12. SALES TRANSACTIONS12.1 Sale of Lubambe Copper Mine in Zambia
The Lubambe copper mine sale was completed on 22 December 2017. The transaction is reflected in the results as follows:
Cash proceeds from sale 741 Less: Overdraft facility paid – Stanbic (164)
Witholding and property transfer tax (91)Foreign exchange on sale proceeds 6
Net proceeds from sale for Lubambe 492 Net asset value at date of sale 437
Profit on sale of Lubambe before FCTR and NCI 55 Foreign currency translation reserve (FCTR) 650 Non-controlling interest (NCI) (822)
Profit before tax (refer note 7) (117)Taxation (refer note 7) (62)
Net loss on sale of Lubambe (179)
12.2 Dwarsrivier Chrome Mine DisposalFor accounting purposes, the disposal of the Dwarsrivier Chrome Mine was effective on 1 July 2016. The accounting result for ARM of this disposal was as follows: i) The attributable equity profit realised in Assmang amounted to R5 million which includes an impairment of R373 million
before tax (tax nil); Subsequent to 31 December 2016 a reduction of R49 million in the attributable impairment raised at 31 December 2016 for the disposal of the Dwarsrivier Chrome Mine was recorded.
ii) Attributable contribution to headline earnings amounting to R378 million; iii) Cash dividend received from Assmang amounting to R238 million and an in specie dividend of R316 million.iv) Proceeds of R238 million received from Assore by ARM on the sale of its investment in Dwarsrivier Chrome Mine resulting
in a loss amounting to R79 million before tax (tax: nil).
13 PROVISIONSilicosis and tuberculosis class action provisionIn November 2014, a gold mining industry working group was formed to address issues relating to the compensation and medical care for occupational lung diseases in the gold mining industry in South Africa. The working group comprises ARM, Harmony Gold Mining Company Limited, Anglo American South Africa Limited, AngloGold Ashanti Limited, Gold Fields Limited and Sibanye Gold Limited (collectively “the Working Group”).
The Working Group engaged different stakeholders including government, organised labour, other mining companies and legal representatives of claimants who have filed legal suits against the companies. These engagements have sought a comprehensive solution to address legacy compensation issues and future legal frameworks that are fair to past and current employees and enable companies to continue to be sustainable over the long-term.
As a consequence of the progress of negotiations between the Working Group and affected stakeholders, the Company was in a position to reliably estimate, within an acceptable range, the Company’s share of a possible settlement of the class action claims and related costs. ARM recorded a provision of R330 million (discounted) in the results for the year ended 30 June 2017. The nominal amount of the provision is R417 million. No changes has been made to this provision since June 2017.
Notwithstanding the provision raised, the companies do not believe that they are liable in respect of the claims brought and continue to defend the legal proceedings filed against them. They do, however, believe that they should work together to seek a solution to this South African mining industry legacy issue. To this end, the ruling appeal which had been set for hearing from 19 to 23 March 2018 has been postponed by the Registrar of the Supreme Court of Appeal (SCA) until further notice. The postponement was in response to a request by the parties involved in the appeal in January 2018.
The negotiations with the claimants’ lawyers are confidential and the Working Group companies are accordingly not able to provide any details of the negotiations.
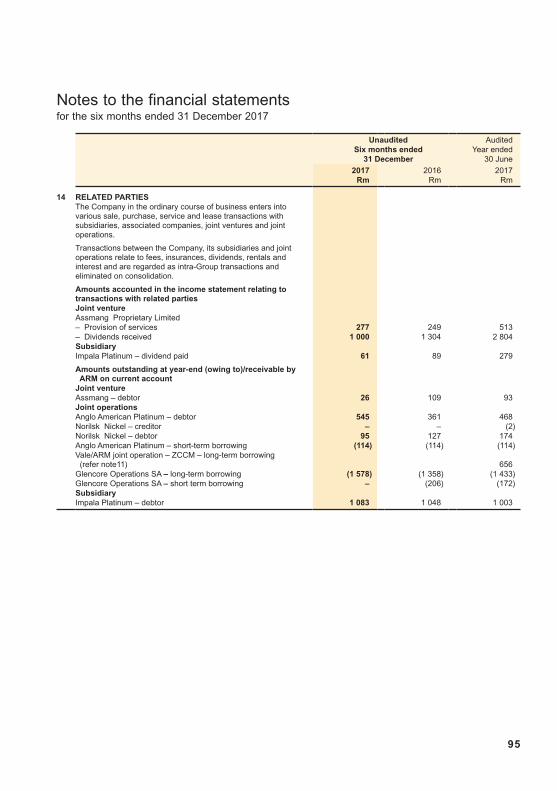
95
Notes to the financial statements for the six months ended 31 December 2017
Unaudited AuditedSix months ended Year ended
31 December 30 June
2017 2016 2017Rm Rm Rm
14 RELATED PARTIESThe Company in the ordinary course of business enters into various sale, purchase, service and lease transactions with subsidiaries, associated companies, joint ventures and joint operations.
Transactions between the Company, its subsidiaries and joint operations relate to fees, insurances, dividends, rentals and interest and are regarded as intra-Group transactions and eliminated on consolidation.
Amounts accounted in the income statement relating to transactions with related partiesJoint venture Assmang Proprietary Limited – Provision of services 277 249 513 – Dividends received 1 000 1 304 2 804 Subsidiary Impala Platinum – dividend paid 61 89 279
Amounts outstanding at year-end (owing to)/receivable by ARM on current account Joint venture Assmang – debtor 26 109 93 Joint operations Anglo American Platinum – debtor 545 361 468 Norilsk Nickel – creditor – – (2)Norilsk Nickel – debtor 95 127 174 Anglo American Platinum – short-term borrowing (114) (114) (114)Vale/ARM joint operation – ZCCM – long-term borrowing (refer note11) 656 Glencore Operations SA – long-term borrowing (1 578) (1 358) (1 433)Glencore Operations SA – short term borrowing – (206) (172)Subsidiary Impala Platinum – debtor 1 083 1 048 1 003
Interim results for the six months ended 31 December 2017
96
Notes to the financial statements for the six months ended 31 December 2017
Unaudited AuditedSix months ended Year ended
31 December 30 June
2017 2016 2017Rm Rm Rm
15 COMMITMENTS AND CONTINGENT LIABILITIESCommitments in respect of future capital expenditure which will be funded from operating cash flows and by utilising debt facilities at entity and corporate levels, are summarised below:Approved by directors– contracted for 92 105 134 – not contracted for 21 2 3
Total commitments 113 107 137
There have been no significant changes in the contingent liabilities of the Group as disclosed since 30 June 2017 integrated annual report.
For a detailed disclosure on contingent liabilities, refer to ARM’s integrated annual report for the year ended 30 June 2017 available on the group’s website (www.arm.co.za).
16. EVENTS AFTER REPORTING DATE Since the period end ARM received a dividend of R2 billion from Assmang.
No other significant events have occurred subsequent to the reporting date that could materially affect the reported results. affect the reported results.
Forward-looking statementsCertain statements in this report constitute forward-looking statements that are neither reported financial results nor other historical information. They include but are not limited to statements that are predictions of or indicate future earnings, savings, synergies, events, trends, plans or objectives. Such forward-looking statements may or may not take into account and may or may not be affected by known and unknown risks, uncertainties and other important factors that could cause the actual results, performance or achievements of the Company to be materially different from the future results, performance or achievements expressed or implied by such forward-looking statements. Such risks, uncertainties and other important factors include among others: economic, business and political conditions in South Africa; decreases in the market price of commodities; hazards associated with underground and surface mining; labour disruptions; changes in government regulations, particularly environmental regulations; changes in exchange rates; currency devaluations; inflation and other macro-economic factors; and the impact of the HIV and Aids epidemic in South Africa. These forward-looking statements speak only as of the date of publication of these pages. The Company undertakes no obligation to update publicly or release any revisions to these forward-looking statements to reflect events or circumstances after the date of publication of these pages or to reflect the occurrence of unanticipated events.
African Rainbow Minerals LimitedIncorporated in the Republic of South AfricaRegistration number 1933/004580/06ISIN code: ZAE000054045
Registered officeARM House29 Impala RoadChislehurston, Sandton, 2196South Africa
PO Box 786136, Sandton, 2146South Africa
Telephone: +27 11 779 1300E-mail: [email protected]
Website: http://www.arm.co.za
Transfer secretariesComputershare Investor Services Proprietary LimitedRosebank Towers, 15 Biermann AvenueRosebank, Johannesburg, 2196
PO Box 61051, Marshalltown, 2107
Telephone: +27 11 370 5000Telefax: +27 11 688 5222
E-mail: [email protected]: http://www.computershare.co.za
Sponsor Deutsche Securities (SA) Proprietary Limited
Contact details and administration
DirectorsP T Motsepe (Executive Chairman) M P Schmidt (Chief Executive Officer)F Abbott* M Arnold** Dr M M M Bakane-Tuoane*T A Boardman*A D Botha*J A Chissano (Mozambican)*
W M Gule*A K Maditsi*H L MkatshanaJ P Möller*A M MukhubaD C Noko*Dr R V Simelane*J C Steenkamp**Z B Swanepoel*A J Wilkens
* Independent Non-executive** Non-executive

www.arm.co.za


