Liberty University DigitalCommons@Liberty University Faculty Publications and Presentations Department of Biology and Chemistry 2008 Force-Velocity Curves of Motor Proteins Cooperating In Vivo David A. Dewi Liberty University, [email protected]T. Cahyuti B. Townsend J.C. Macosko Y. Shtridelman Follow this and additional works at: hp://digitalcommons.liberty.edu/bio_chem_fac_pubs is Article is brought to you for free and open access by the Department of Biology and Chemistry at DigitalCommons@Liberty University. It has been accepted for inclusion in Faculty Publications and Presentations by an authorized administrator of DigitalCommons@Liberty University. For more information, please contact [email protected]. Recommended Citation Dewi, David A.; Cahyuti, T.; Townsend, B.; Macosko, J.C.; and Shtridelman, Y., "Force-Velocity Curves of Motor Proteins Cooperating In Vivo" (2008). Faculty Publications and Presentations. 17. hp://digitalcommons.liberty.edu/bio_chem_fac_pubs/17
Transcript
Liberty UniversityDigitalCommons@Liberty
University
Faculty Publications and Presentations Department of Biology and Chemistry
2008
Force-Velocity Curves of Motor ProteinsCooperating In VivoDavid A. DewittLiberty University, [email protected]
T. Cahyuti
B. Townsend
J.C. Macosko
Y. Shtridelman
Follow this and additional works at: http://digitalcommons.liberty.edu/bio_chem_fac_pubs
This Article is brought to you for free and open access by the Department of Biology and Chemistry at DigitalCommons@Liberty University. It hasbeen accepted for inclusion in Faculty Publications and Presentations by an authorized administrator of DigitalCommons@Liberty University. Formore information, please contact [email protected].
Recommended CitationDewitt, David A.; Cahyuti, T.; Townsend, B.; Macosko, J.C.; and Shtridelman, Y., "Force-Velocity Curves of Motor ProteinsCooperating In Vivo" (2008). Faculty Publications and Presentations. 17.http://digitalcommons.liberty.edu/bio_chem_fac_pubs/17
Abstract Motor proteins convert chemical energy into work, thereby generating persistent motion of cellular and subcellular objects. The velocities of motor proteins as a function of opposing loads have been previously determined in vitro for single motors. These single molecule "force-velocity curves" have been useful for elucidating motor kinetics and for estimating motor performance under physiological loads due to, for example, the cytoplasmic drag force on transported organelles. Here we report forcevelocity curves for single and multiple motors measured in vivo. Using motion enhanced differential interference contrast (MEDIC) movies of living NT2 (neuron-committed teratocarcinoma) cells at 37°C, three parameters were measured-velocity (v), radius (a), and effective cytoplasmic viscosity ('1')-as they applied to moving vesicles. These parameters were combined in Stokes' equation, F::: 61W'1'V, to determine the force, F, required to transport a single intracellular particle at velocity, v. In addition, the number of active motors was inferred from the multimodal pattern seen in a normalized velocity histogram. Using this inference, the resulting in vivo force-velocity curve for a single motor agrees with previously reported in vitro single motor force-velocity curves. Interestingly, however, the
Electronic supplementary material The online version of this article (doi: I 0.1 007/s 120 13-008-9021-8) contains supplementary material, which is available to authorized users.
Y. Shtridelman . T. Cahyuti . 1. C. Macosko ([81)
Department of Physics, Wake Forest University, Winston-Salem, NC 27109, USA e-mail: [email protected] URL: http://www.wfu.edu/~macoskjc
B. Townsend· D. DeWitt Department of Biology and Chemistry, Liberty University, Lynchburg, VA 24502, USA
curves for two and three motors lie significantly higher in both measured velocity and computed force, which suggests that motors can work cooperatively to attain higher transport forces and velocities.
Keywords Processive molecular motors . Cooperative fast vesicle transport . Anterograde retrograde traffic . Video enhanced differential interference contrast microscopy (VE-DIC) . Intracellular motion
Nanoscopic protein motors are responsible for a host of cellular processes. Intracellular transport of vesicular cargo, for example, is accomplished by bipedal molecular machines such as kinesin, dynein, and myosin, and understanding the biophysical basis of vesicle transport is critical for elucidating many physiological and pathological cellular processes such as axonal transport, drug addiction (e.g., in the case of opioid receptor trafficking [I, 2]), and neurodegeneration (see below). Thankfully, the properties of motor proteins can be succinctly conveyed and analyzed with the aid of force-velocity diagrams [3-5]. These diagrams, which often plot a motor's speed versus the opposing load at different ATP concentrations, afford a rich understanding of reaction rates, cooperativity, and extent of inhibition due to opposing force or other factors [6, 7]. Such information can, in tum, be used to construct more accurate models of motor function [8, 9] that can aid
20
in efforts to understand how motors influence healthy or diseased cellular functions.
The medical importance of understanding vesicletransporting motors is highlighted by several recent studies, which describe the potential role of axonal transport deficiencies in neurodegenerative conditions such as Alzheimer's disease [10-12]. Previously, the over-expression of the microtubule associated protein tau was shown to inhibit kinesin dependent transport [13]. However, other Alzheimer-related proteins including Presenilin 1 [14] and Af3PP [15] also appear to be involved in the regulation of kinesin transport. Disruptions of axonal transport have been confirmed in an in vivo model demonstrating that transport rates decrease before plaque formation [16]. Thus, a clearer picture of in vivo force-velocity relationships for vesicle-transporting motors may shed light on the molecular mechanisms involved in neurodegeneration.
The insights provided by force-velocity curves are similar to those offered by saturation plots in the context of enzyme kinetics [17]. For example, the textbook case of hemoglobin and myoglobin [18, 19], for which saturation plots reveal the cooperativity of hemoglobin's four subunits relative to myoglobin, has a more recent analog in the realm of molecular motors. In 2000, Ryu et al. constructed force-velocity curves of the Escherichia coli flagellar motor, which revealed that the individual torque generating units can work cooperatively to achieve higher speeds at a given resistive torque [20].
Electron microscopy studies suggest that vesicular cargo, such as mitochondria [21] and large vesicles [22], are attached to cytoskeletal filaments by a number (1-4) of motors. Thus, it is unfortunate that force-velocity curves have, for the most part, been obtained neither for motors operating in groups nor for motors in vivo. There are a small number of notable exceptions to this, such as the flagellar motor complex mentioned above [20] and a few other motors that operate on the external surfaces of cells [23-25]. Within cells, stall forces, which represent an important first step toward full force-velocity curves, have been measured for mUltiple motors [21, 26, 27]. But the lack of multimotor and intracellular force-velocity curves presents a problem, particularly if naturally occurring motors tend to operate cooperatiVely.
In this paper, we have taken a four-step approach to construct force-velocity curves in vivo. First, motor velocity and intracellular viscosity were determined in neuron committed teratocarcinoma (NT2) cells from the time-dependent displacements of endogenous 0.45-1.05 /lm particles that, based on their size, were presumably mitochondria «800 nm [28]), Iysosomes (100-500 nm [29]), peroxisomes (150-300 nm [30]), and endosomes «500 nm [31]). Second, these viscosity and motor velocity measurements were combined, via Stokes' law [32], with particle size
Cell Biochem Biophys (2008) 52:19-29
measurements to obtain estimates of drag forces. Third, from a velocity histogram that was normalized to each particle's slowest transported velocity, the numbers of actively transporting motors were deduced. Finally, simple force velocity relationships for I, 2, and 3 motors were constructed. The 1 motor force-velocity data agrees well with previously published in vitro data on single motors of kinesin-I, a dimeric ATPase that transports cargo toward the fast growing (plus) end of microtubules. However, the force-velocity data for 2 and 3 motors suggests that multiple motors can cooperate to achieve higher velocities.
Materials and Methods
Cell Preparation
Human teratocarcinoma (NT2) precursor cells were obtained from Stratagene (LaJolla, CA) Catalog #204101 and were grown in a media of Dulbecco's Modified Eagle's Medium/Ham's F-12 (DMEM-F-12) with 10% (v/v) fetal bovine serum, 2 mM L-glutamine, and 1 % (v/v) penicillinstreptomycin (0.1 mg/ml streptomycin and 0.06 mg/ml penicillin, final concentration) in a 5% CO2 environment at 37°C. NT2 cells were differentiated into a neuronal phenotype by treatment with retinoic acid for 6 weeks and by replating with mitotic inhibitors (1 mM cytosine arabinoside, 10 mM fluorodeoxyuridine, and 10 mM uridine) followed by growth in a 50/50 mixture of DMEM-F-12 and conditioned media (i.e., media used to grow undifferentiated NT2 cells) that was supplemented with 5% FBS and 1% v/v penicillin-streptomycin. The resulting cells were cryopreserved with dimethyl sulfoxide (DMSO) in liquid nitrogen. NT2 N cells were plated on glass bottom dishes (FluoroDish, WPI, Sarasota, FL) coated with polY-D-lysine and laminin with DMEM-F-12 conditioned media. Cells were allowed to adhere for more than 24 h prior to analysis.
Microscopy and Image Processing
A Nikon Eclipse E600FN microscope with differential interference contrast (DIC) optics, a 60x water immersion objective (NA 1.0, wd 2 mm), and a 0.9 NA condenser was used to view NT2 cells attached to glass-bottom dishes. A digital camera (Hamamatsu ORCA-ER C4742-95) with a 12 bit, 1.35 megapixel progressive scan CCD (8.3 frames/s) attached to the microscope produced high quality digital images of the cell's vesicular cargo (for clarity, these objects will be referred to as "vesicles" if they are undergoing active transport and "Brownian particles" if they are undergoing diffusive motion). These DIC images were processed in real time using a contrast enhancing program
Cell Biochem Biophys (2008) 52: 19-29
(named motion enhanced DIC, or "MEDIC") written for a Matrox Genesis image processing board (Matrox, Montreal, Canada) housed in a PC desktop computer. This program subtracts a continually updated background image from the incoming images. The background image is a rolling average of the eight preceding frames. The specifics of the increased contrast due to the MEDIC process have been described elsewhere [33]. Two hundred consecutive frames of DIC images (12 bit, 512 x 512 pixels) and MEDIC images (8 bit, 512 x 512 pixels) were saved as movies, and multiple movies were recorded for each cell.
Size Measurements
DIC microscopy creates images of a sample based on differences in refractive index. In this differential technique, locations at which the refractive index is changing most rapidly, along the direction of the DIC shear axis, display the highest and lowest intensities. Therefore, to find the diameter of a vesicle, such as shown in Fig. I a, we developed a MATLAB program that calculated the average intensities of a linescan that ran parallel to a diagonal through the particle (Fig. Ib). This program recorded the pixel intensities along 25 adjacent parallel lines centered at the point in the middle of the pattern specified by the tracking program (see below). Although this middle point was not necessarily aligned with the center of the vesicle, the use of 25 lines, spaced at intervals of half a pixel diagonal (0.0755 11m), ensured that one of these lines would cross at the vesicles' center. When the intensity along each line was plotted, the resulting linescan graph,
B O.50j.lm ,;.
pixel diagonals
Fig. 1 Example of a vesicle size measurement. (a) A 55 x 55 11m DIC image of an NT2 cell. A dashed curve marks cell boundary and a circle marks a vesicle (barely visible before motion enhancement) that was tracked. Inset: Motion enhanced DIC (MEDIC) image of the tracked vesicle. The increased contrast of moving vesicles is due to continually updated background subtraction (e.g., Movie 1). Arrowheads mark ends of the diagonal linescan (~2.5 11m). (b) The tracked vesicle's diameter is taken as the calibrated trough-to-peak distance (0.50 11m) of a double Gaussian fit (curve) to the central points (filled squares) of the diagonal Iinescan averaged over all frames for which the vesicle was tracked
21
averaged over all trackable frames, consisted of one positive peak and one negative peak (e.g., Fig. lb). To improve precision and to compensate for the fact that the linescans are diagonal relative to the pixel lattice, each averaged linescan was interpolated with additional points that are averages of the two nearest off-diagonal pixels and the two on-diagonal pixels (0.151 11m/pixel diagonals or 0.0755 11m/interpolated point). Two Gaussians were then fit to each linescan: one to the positive peak and one to the negative peak. The distance between the positive and negative peaks of the central linescan was considered the diameter of the vesicle.
We tested the precision of this method (Fig. 2) using latex beads produced by Interfacial Dynamics Corp with reported diameters in 11m (mean ± standard deviation) of 1.2 ± 0.03, 1.1 ± 0.03, 0.81 ± 0.02, 0.58 ± 0.01,0.42 ± 0.02, and 0.21 ± 0.01. We also used streptavidin coated beads from Bangs Laboratories, Inc. (Fishers, IN) that had a reported diameter of 0.12 ± 0.01 11m (catalog code CP01 N). Figure 2 shows that, for DIC movies of polystyrene bead standards moved at ~ 1 l1m/s on a piezoelectric stage (Wye Creek Instruments, Frederick MD [34]), the averaged trough-to-peak distance is linearly correlated to the manufacturer's reported diameters (R2 = 0.97) in a range where resolution was not limiting (::::0.4 11m). However, the slope of the fitted line was 0.53 rather than unity in this
0.9
+~
- 0.8 E ::::I. -II> 0.7 u c C'CI /'r -1/1 0.6 :s
.:.:: / C'CI II>
0.5 .' c. I
0 -I f .I:. !. Cl 0.4 :I ! 0 ... I-
0.3
0.2 +--------.------r-------, o 0.5 1 1.5
Bead diameter (J-Im)
Fig. 2 A comparison of measured peak-to-trough distance versus manufacturer's reported diameter for polystyrene beads. The sloped gray line (y = 0.58x + 0.17, R2 = 0.97) is a fit to the measured trough-to-peak distances for the five largest bead sizes. The horizontal gray line indicates that, for beads smaller than 0.4 11m, the measured size does not reflect the actual size due to the diffraction limit (Je ~ 550 nm for this study)
22
2.1
1.8
i'1.5 III e:. 1.2·
·co 0.9
0.6
10'
10'
w(rad/s)
Fig. 3 Frequency dependent viscosity of NT2 cell cytoplasm calculated from analysis of the Brownian motion analysis of 36 endogenous vesicular Brownian particles (average radius, 0.31 !Jm, i.e., a computed average diameter of 0.62 !Jm) via generalized Stokes-Einstein methods. Brownian particles were tracked at 8.3 frame/s through a maximum of 200 frames (24 s). The limiting viscosity at the lowest frequency is 1.8 Pa s (black line). Inset: Mean squared displacement (8,.1) vs. time, averaged over 36 Brownian particles. Deviation from a slope of unity (dotted line) at t > 0.1 s corresponds to the deviation from constant viscosity for w < 10 S-1
on the main graph
range, most likely because the DIC offset was held constant (i.e., not optimized for the larger beads). Since our method for measuring vesicles does not involve optimizing the DIC offset for each vesicle, we use the calibration curve in Fig. 2 to determine vesicle sizes, all of which were in the linear range of this calibration (i.e., the computed diameters ranged from 0.48 to 1.05 /lm).
Viscosity Measurements
To determine effective cell viscosity (Fig. 3) we used a free, downloadable tracking program called 'Video Spot Tracker' to track the motion in the raw DIC images of intracellular particles that were not being actively transported and that appeared to exhibit Brownian motion [35] (an x-y plot of each particle's position was visually inspected to screen for
Fig. 4 Example of vesicle velocity measurement. (a) MEDIC image series of a moving vesicle (arrows). Bar is 5 !Jm. (b) The distance vs. time trajectory of the vesicle shown in A. Five line segments best fit the data as determined by a X;ed minimization for 2-7 segments (inset). For the reduced X;ed, U
was empirically determined from the standard deviation of the best fitting lines in other trajectories [19]
Cell Biochem Biophys (2008) 52:19-29
overall shape, i.e., rough symmetry in all directions, without the aid of scale bars-so as not to bias against large or small total particle displacements). The sizes of these Brownian particles were determined by the same methods that were used for the actively transported vesicles (see above, and Fig. 2). The time-dependent mean squared displacements, i1r;(t)2, were calculated from the Brownian particle tracks using a MatLab (The Math-Works, Natick, MA) program written by Jeremy Cribb and a Microsoft Excel template provided by Dr. David Hill, both at the Univ. of North Carolina. These mean squared displacements were used in a generalized Stokes-Einstein (GSE) equation to determine the effective cellular viscosity for the vesicles examined in this study [36].
Vesicle Tracking
Moving vesicles in the MEDIC images (Fig. 4a) were tracked by a cross-correlation pattern recognition algorithm native to the Matrox image processing board. An 8 x 8 to 12 x 12 pixel2 area of interest around a given vesicle was used to define the pattern, beginning with the first frame in which the vesicle was visible. In subsequent frames, the tracking program found the position of the best match to this pattern. Inter-pixel interpolation of the cross-correlation matching scores allowed the position of the best match to be determined with subpixel accuracy. The x and y positions of the vesicles in each frame were stored in a tracking file.
Velocity Measurements
Constant velocity segment fits to the tracking files (Fig. 4b) were obtained using a program that takes advantage of the non-linear, constrained, least-squares minimization algorithm, fmincon, found in MATLAB [33,37]. This program fits up to 12 line segments to each graph of position vs.
B 6
0' = 0.05
4
2 C\I ~ 10 X
0234567 o~ ____ ~ _____ N_u~m_b_e_r_o_f_S_e~m_e_nts o 2 4 6
t (s)
Cell Biochem Biophys (2008) 52: 19-29
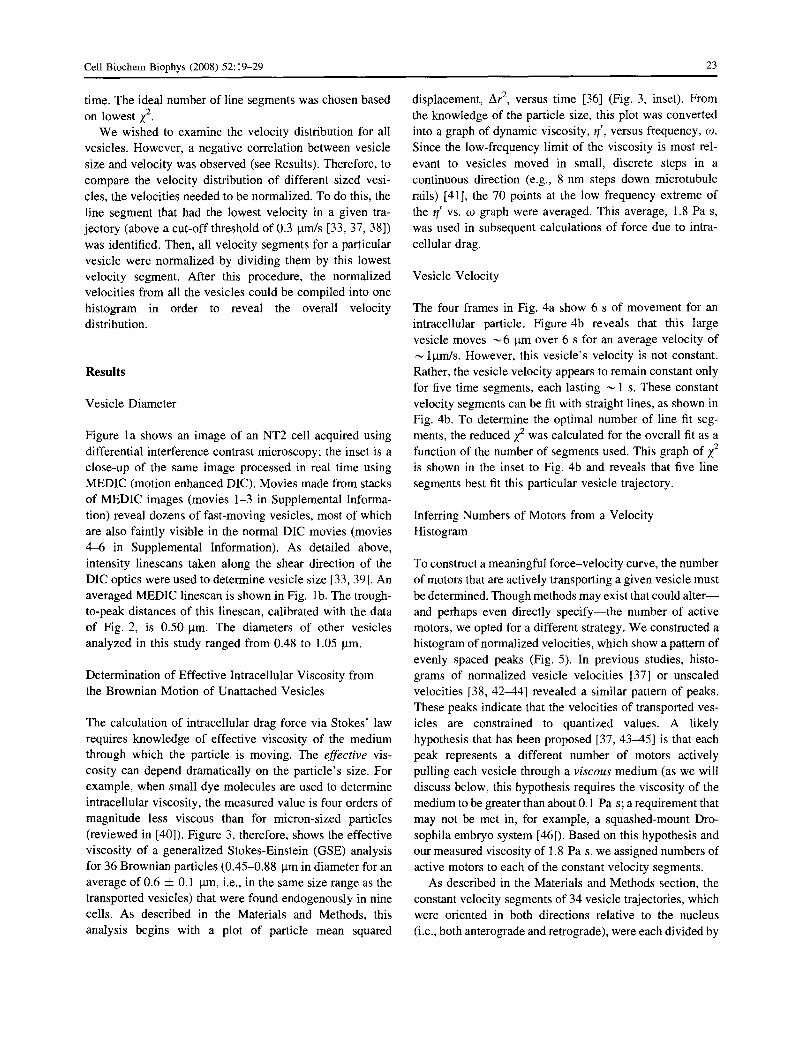
time. The ideal number of line segments was chosen based on lowest l.
We wished to examine the velocity distribution for all vesicles. However, a negative correlation between vesicle size and velocity was observed (see Results). Therefore, to compare the velocity distribution of different sized vesicles, the velocities needed to be normalized. To do this, the line segment that had the lowest velocity in a given trajectory (above a cut-off threshold of 0.3 J..tmls [33, 37, 38]) was identified. Then, all velocity segments for a particular vesicle were normalized by dividing them by this lowest velocity segment. After this procedure, the normalized velocities from all the vesicles could be compiled into one histogram in order to reveal the overall velocity distribution.
Results
'Vesicle I>iameter
Figure I a shows an image of an NT2 cell acquired using differential interference contrast microscopy; the inset is a close-up of the same image processed in real time using MEI>IC (motion enhanced I>IC). Movies made from stacks of MEI>IC images (movies 1-3 in Supplemental Information) reveal dozens of fast-moving vesicles, most of which are also faintly visible in the normal I>IC movies (movies 4-6 in Supplemental Information). As detailed above, intensity linescans taken along the shear direction of the mc optics were used to determine vesicle size [33, 39]. An averaged MEI>IC linescan is shown in Fig. I b. The troughto-peak distances of this linescan, calibrated with the data of Fig. 2, is 0.50 J..tm. The diameters of other vesicles analyzed in this study ranged from 0.48 to 1.05 J..tm.
I>etermination of Effective Intracellular 'Viscosity from the Brownian Motion of Unattached 'Vesicles
The calculation of intracellular drag force via Stokes' law requires knowledge of effective viscosity of the medium through which the particle is moving. The effective viscosity can depend dramatically on the particle's size. For example, when small dye molecules are used to determine intracellular viscosity, the measured value is four orders of magnitude less viscous than for micron-sized particles (reviewed in [40]). Figure 3, therefore, shows the effective viscosity of a generalized Stokes-Einstein (GSE) analysis for 36 Brownian particles (0.45-0.88 J..tm in diameter for an average of 0.6 ± 0.1 J..tm, i.e., in the same size range as the transported vesicles) that were found endogenously in nine cells. As described in the Materials and Methods, this analysis begins with a plot of particle mean squared
23
displacement, 11?-, versus time [36] (Fig. 3, inset). From the knowledge of the particle size, this plot was converted into a graph of dynamic viscosity, rl', versus frequency, w. Since the low-frequency limit of the viscosity is most relevant to vesicles moved in small, discrete steps in a continuous direction (e.g., 8 nm steps down microtubule rails) [41], the 70 points at the low frequency extreme of the fI' vs. w graph were averaged. This average, 1.8 Pa s, was used in subsequent calculations of force due to intracellular drag.
'Vesicle 'Velocity
The four frames in Fig. 4a show 6 s of movement for an intracellular particle. Figure 4b reveals that this large vesicle moves ~ 6 J..tm over 6 s for an average velocity of ~ IJ..tmls. However, this vesicle's velocity is not constant. Rather, the vesicle velocity appears to remain constant only for five time segments, each lasting ~ 1 s. These constant velocity segments can be fit with straight lines, as shown in Fig. 4b. To determine the optimal number of line fit segments, the reduced l was calculated for the overall fit as a function of the number of segments used. This graph of l is shown in the inset to Fig. 4b and reveals that five line segments best fit this particular vesicle trajectory.
Inferring Numbers of Motors from a 'Velocity Histogram
To construct a meaningful force-velocity curve, the number of motors that are actively transporting a given vesicle must be determined. Though methods may exist that could alterand perhaps even directly specify-the number of active motors, we opted for a different strategy. We constructed a histogram of normalized velocities, which show a pattern of evenly spaced peaks (Fig. 5). In previous studies, histograms of normalized vesicle velocities [37] or unscaled velocities [38, 42-44] revealed a similar pattern of peaks. These peaks indicate that the velocities of transported vesicles are constrained to quantized values. A likely hypothesis that has been proposed [37, 43-45] is that each peak represents a different number of motors actively pulling each vesicle through a viscous medium (as we will discuss below, this hypothesis requires the viscosity of the medium to be greater than about 0.1 Pa s; a requirement that may not be met in, for example, a squashed-mount I>rosophila embryo system [46]). Based on this hypothesis and our measured viscosity of 1.8 Pa s, we assigned numbers of active motors to each of the constant velocity segments.
As described in the Materials and Methods section, the constant velocity segments of 34 vesicle trajectories, which were oriented in both directions relative to the nucleus (i.e., both anterograde and retrograde), were each divided by
24
300 en Q) u c:
~ :::J U 200 u 0
'0 Q; .0 E 100 :::J Z
0.5 1.0 1.5 2.0 2.5 3.0 3.5 4.0 4.5 5.0
Normalized velocity (v Iv 1)
Fig. 5 Histogram of normalized vesicle velocities (1,729 total data points). The constant velocity segments for each vesicle were divided by Vj, the lowest velocity in its trajectory above a threshold of 0.3 Ilm/s. Peaks, as determined by Gaussian fits (thin curves), appear at regular intervals above VI (1.8, 2.8, 3.6, and 4.2 for V2, V3, V4, and V5, respectively; 0.9 average interval), and are likely due to the cooperative action of 2, 3, 4, or 5 motors over each velocity segment. A led of 2.5 for the overall fit (thick curve) indicates a reasonable fit of this multipeak model. Symbols under the first three peaks correspond to the symbols in Fig. 7 that use these same data
VI-the slowest velocity segment within the same trajectory that was above a threshold of 0.3 l1m/s. This normalization standardizes the velocity patterns of vesicles that are different sizes and experience different drag forces. The resulting V/VI values, binned at 0.2 l1m/s intervals, are plotted in Fig. 5. The sharp peak centered at 1.0 is due to the fact that all trajectories have at least one constant velocity segment (i.e., VI) where V/VI = 1. Subsequent peaks occur at V/VI = 1.8, 2.8, 3.6, and 4.2. The centers of these peaks were determined by fits to five unconstrained Gaussians (15 parameters) that minimize the reduced chi-squared, X;ed' The resulting X;ed of 2.5 for the overall fit indicates acceptable agreement between the 5-Gaussian model and the data. The relative area under the Gaussians was 29, 43,12, 11, and 5% for VI through Vs (naverage = 2.3). This suggests that most vesicles are pulled by 1 or 2 motors, with lesser contributions from groups of 3, 4, or 5 motors.
Velocity with Respect to Number of Motors and Vesicle Diameter
Before constructing force-velocity curves, we examined the relationship between vesicle size and velocity, using the numbers of active motors determined from Fig. 5 (V/VI
values from 0.7 to 1.3 for 1 motor, 1.3-2.4 for 2 motors, 2.4-3.3 for 3 motors, and 3.3-3.9 for 4 motors). As shown in Fig. 6, larger vesicles, up to 1.05 11m, tend to move more slowly than small vesicles. This negative correlation was significant (P < 0.05) for vesicles pulled by 1 or 2 motors, with correlations of -0.47 (P = 0.02) and -0.43
"-,. 0
1.5
0
~ E <:> .E: e ~ '(3 0 Qi >
0.5
0.4
Cell Biochem Biophys (2008) 52:19-29
'-, 0
'G" 8 0 "-0 .~
8 0 c
0
0.7 Diameter (flm)
---""'" 4
3
2
Fig. 6 Segment velocity versus vesicle diameter. The areas of the markers (e, @I, , and 0 for data from peaks 1,2,3, and 4 in Fig. 4, respectively) are proportional to the number of data points (i.e., movie frames) in each constant velocity segment. In units of S-I, the four linear fits have the following slopes, -0.3 (e) -0.6 (e), -0.6 ( ), and -0.7 (0)
(P = 0.006), respectively. The correlations for vesicles pulled by 3 or 4 motors had similar values (-0.45 and -0.43, respectively) but were statistically less significant (P = 0.08 and 0.21, respectively). The high P-value for the 4-motor data limited the multimotor force-velocity curves to 1, 2, and 3 motors, as described below.
In Vivo Force-Velocity Curves
Figure 6 shows that a vesicle's size (and thus the magnitude of its drag) is negatively correlated with its velocity-for a given number of active motors. In Fig. 7, the relationship between resistive drag force and velocity is displayed in a standard force-velocity curve format using Stokes' law to calculate force, F, as described in Materials and Methods. Briefly, the average intracellular viscosity (I'I' = 1.8 ± 0.3 Pa s) for Brownian particles (n = 36) was determined for all NT2 cells (n = 10) via the GSE method [36]. Brownian particle sizes (n = 16) were determined from MEDIC images (e.g., Fig. I b) using the calibration curve shown in Fig. 2. The data was segregated by size, with larger vesicles (n = 8, diameters> 0.65 11m) binned and plotted with closed symbols in Fig. 7 and smaller vesicles (n = 8, diameters < 0.65 11m) with open symbols. The data of Fig. 7 marked with diamonds, triangles, and circles correspond to the data of
Fig. 7 In vivo force-velocity curves for 1, 2, and 3 motors-<>+, .6.6., and oe, respectively, taken from the data in the first three peaks of the velocity histogram (see corresponding symbols in Fig. 5). Open symbols are for smaller average vesicle radii (0.29, 0.29, and 0.26 !lm, respectively) and closed symbols are for larger radii (0040, 0.36, and DAD !lm, respectively), Velocities were measured directly (at 37°C in NT2 ceIls) and forces were calculated from vesicle radii, vesicle velocities, and intracellular viscosity (1.8 Pa s) according to Stokes' law. The l-motorforce-velocity curve falls between a single kinesin force-velocity curve collected at 35°C (gray squares fit with line, [33]) and two earlier single kinesin curves (black squares fit with dotted and dashed curves, [48, 49]) obtained at 25°C but scaled here according to a previously determined Arrhenius relation [33]
Fig. 5 marked with the same symbols. These symbols are also labeled with the presumed number of motors (l, 2, or 3) responsible for generating the data.
In addition to this in vivo force-velocity data, three previously reported single motor in vitro force-velocity curves of conventional kinesin are plotted in Fig. 7. One of these in vitro force-velocity curves (grey line and accompanying points [47]) was collected by Kawaguchi and Ishiwata at approximately the same temperature (35°C) as our NT2 force-velocity data (37°C). The other two in vitro curves (black dotted and dashed curves and accompanying points, [48, 49]) was obtained by Meyh6fer and Howard [50] and by Visscher et al. [49] at 25°C, so in Fig. 7 these curves have been scaled according to the velocity-temperature dependence found by Kawaguchi and Ishiwata (an Arrhenius slope of 50 kllmol [47]).
Discussion
The above results provide for the first time force-velocity relationships of 1, 2, and 3 motors cooperating inside living cells. Our procedure for measuring vesicle transport velocity is a straightforward application of the motion
25
enhanced DIC (MEDIC) technique [51], whereas our calculation of drag force and our inference of numbers of cooperating motors both involve more assumptions, the strengths and weaknesses of which are discussed below. Vesicle velocity impacts cellular growth, intra- and intercellular communication, and ultimately cell death (apoptotic or otherwise), so the cell must carefully regulate its transport speed (for example see [52]). We discuss implications of our results on the mechanism of vesicle transport regulation and provide a model whereby motors work cooperatively to achieve higher velocities.
The Relationship between Vesicle Size Measurements and Force Calculations
Stokes' Law states that drag force, F, on a sphere in an infinite medium is linearly proportional to the radius, a, of, for example, a spherical vesicle transported in a cell:
F = 6nal']v (1)
Therefore, the reliability of our vesicle diameter measurements directly affects the reliability of the forcevelocity curves. Interestingly, however, if there was a systematic error in our vesicle diameter measurements, such an error would not necessarily transfer to the calculated forces in Fig. 7. This is because Stokes' Law states that drag force is linearly proportional to viscosity, which, by the GSE method [36] is inversely proportional to the radius, a, of a vesicle undergoing Brownian motion:
where 11']*1 is the magnitude of the complex viscosity, 1']' is the (dynamic) viscosity, 1']" is the elastic viscosity, kB is Boltzmann's constant, T is temperature, w is frequency, Ll? is the mean squared displacement, r is the Gamma function, and ()( is the slope of the log-log plot of Ll? as a function of time. Therefore, the calibration of vesicle size enters the force calculation (Eq. I) twice--once for the transported vesicle as a, and once for the Brownian vesicles as lIa in the expression for the average effective viscositycanceling out systematic errors in the determination of vesicle size. For example, if our measured diameter of vesicles and Brownian particles were half of their actual diameters, our reported viscosity would be too large by a factor of two, but our reported forces would still be correct. This said, it is unlikely that any systematic errors-e.g., due to an error in the slope shown in Fig. 2-would exceed the already quite large (>15%, see error bars in Fig. 3) random errors due to cell-to-cell variation and due to using the GSE method on a small number (n = 36) of Brownian particles [53].
26
The Relationship Between Linear Velocity Fits and Inferred Number of Motors
Although the measurement of vesicle displacement versus time (Fig. 4b) is straightforward and model-independent, fitting linear segments to the data in order to determine vesicle velocity requires examination. In particular, this method assumes that each vesicle moves at a constant velocity until, within a very short interval, its movement changes to a new constant velocity. The observed average X;ed of 1.50 (nsegments = 306) demonstrates that this linesegment assumption is a statistically acceptable method of fitting the data. Moreover, the average length of each line segment (1.5 Ilm) matches the reported processivity of motors such as kinesin, either in vitro (l.4 Ilm) [54] or in vivo (l.0 Ilm) [55]-an intriguing consilience also observed in the PC12 system by Hill et al. [37]. Finally, the slopes of the linear fits were allowed to take on any values between an arbitrary minimum and maximum (these constraints were typically set to ±3 times the average velocity or were simply set at ±5 Ilmls, since the greatest positive slope under these constraints was 3.1 Ilmls and the greatest negative slope was -1.3 Ilmls). The fact that we constrained only the minimum and maximum allowed slope values-and not the relationship of each slope to the trajectory's lowest slopefurther indicates that the quantization seen in the normalized velocities (Fig. 5) is unlikely to be an artifact of our fitting methodology.
At least two different mechanisms would be consistent with our explanation for the peaks in the velocity histogram (Fig. 5). The first, proposed in 2004 by Zahn et al. [38], is that, since different motors operate at different velocities, the abrupt changes in speed are due to changes between the type of motor pulling the vesicle-when a faster motor pulls, the velocity increases, and vice versa for a slower motor. This proposed mechanism also states that fast and slow motors can work together to produce intermediate speeds (Fig. 8, top panel, far right). Thus, the peaks in Fig. 5 would be due to a linear combination of fast and slow motors. A second mechanism, proposed by Hill et al. in 2004 [37], is that cooperativity between motors of the same type accounts for the quantized peaks (Fig. 8, middle panel). Since we do not know which motors are responsible for movement at any given moment, the first mechanism cannot be directly ruled out. However, for the reasons discussed below, we favor the second mechanism.
One reason we favor the same-motors hypothesis is that it accounts for the regular spacing observed in Fig. 5. The different-motors hypothesis can explain the presence of peaks, but it does not provide any particular reason for the peaks to be regularly spaced. For example, one motor may pull a vesicle at I Ilmls, one at 1.5 Ilmls, and another at 3 Ilmls, thus creating a smaller gap between the first and
Cell Biochem Biophys (2008) 52:19-29
Different types of motors (Zahn et al.)
1~IQtlca,1 or different numbers of motors (Hill et al.)
I ctlCt: Ict. I yield similar displacement vs. time graphs
Fig. 8 Diagram of two mechanisms that are both consistent with the displacement versus time data that was fit with straight line segments to obtain velocities
second peaks than between the second and third. Moreover, even if these three motors worked together to produce intermediate speeds there is still no particular reason why the peaks should be evenly spaced. In the above example, this would require two intermediate speeds between the second and third peaks (i.e., at 2 and 2.5 Ilmls) and none between the first and second peaks. The same is true if one of the three motors moved in the opposite direction and slowed down the other two motors by a tug-of-war mechanism. What is more, there is in vivo evidence that a tug-of-war does not occur between motors moving in opposite directions [43]. It is important to keep in mind, however, that the same-motor hypothesis does not exclude the possibility that different motors could work together. The only requirement is that the average speeds of both motors are similar at the appropriate opposing forces. In Drosophila S2 cells, two motors that pull in opposite directions were shown to have similar average speeds under the same viscous drag (dynein:vavg = 1.7 Ilmlsandkinesin:vavg = 1.5 Ilmls)[43], indicating that different motors can indeed have similar force-velocity relationships. As more MEDIC data become available from NT2 cells and other systems-particularly as they are combined with simultaneous fluorescence imagesaspects of cargo and motor heterogeneity, which are beyond the scope of this study, can be explored in more detail.
It is worth noting that this multimodal velocity pattern (Fig. 5 and in the works cited above) has not been observed in all in vivo systems. In particular, lipid droplet transport
Cell Biochem Biophys (2008) 52: 19-29
1.4
1.2
~ .:: ~ O.S 'u 0 0.6 Gi >
0.4
0.2
0
_ . dp.ta would not yield multimodal velocity histogram . ... .... ~: ....... ...
0
"""""'"
".
5
""','\
, ,
data do yield\ multi modal " velocity \ histogram \
10
Force (pN) 15 20
Fig. 9 Experimental and theoretical force-velocity curves overlaid with Stokes' lines and three data points, labeled as in Fig. 7. The experimental data (squares) from an in vitro kinesin experiment ([49], scaled as in Fig. 7) are fit with a theoretical polynomial (dotted curve). Dashed and hatched curves represent the same polynomial scaled by a factor of 2 or 3, respectively, along the force axis. These three curves represent the theoretical force-velocity relationship for a load pulled by 1,2, or 3 motors, in which the motors perfectly share the load but are not otherwise cooperatively enhanced (see [37], Fig. I, for a similar model). Given that the intersections of these curves with the 0.1 Pa s Stokes' line all occur between 1.4 and 1.5 j.lm/s, it is unlikely that a velocity histogram for vesicles moved through such a low-viscosity medium would yield mUltiple, distinguishable peaks. (The term "Stokes' line" refers to the Stokes' Law drag force at a given viscosity for a given particle diameter, which, for the three data points shown here, is ~ 0.4 j.lm.) Interestingly, since cooperativity can occur in any coupled enzymatic system, such as in motors coupled mechanically via their common load, motor-motor cooperativity may explain why the spacing between the data points from Fig. 7 and the peaks in Fig. 5 are linear, and not sublinear as would normally be expected from the intersections between the Stokes' lines and the force-velocity curves shown here
in Drosophila embryos has not revealed a multi modal velocity pattern [26, 56]. However, as the authors point out in a subsequent paper, whether a multimodal pattern is observed may depend on the intracellular viscosity [46]. This dependence was elegantly demonstrated in vitro by Hunt, Gittes, and Howard by showing that-in a highly viscous medium-the number of kinesin motors moving a load determined the load's velocity [57]. Therefore, at viscosities ten fold lower (i.e., ~ 0.1 Pa s) than what we and Hill et al. have measured in NT2 and PC12 cells, respectively, the Stokes' line that determines the placement of data points on the force-velocity graph would be much steeper, and a multimodal pattern would be more difficult to observe (Fig. 9) [37]. Thus, it is likely that the Drosophila embryo system has a lower intracellular viscosity than the systems that have yielded multimodal velocity histograms.
Finally, a criticism that has been leveled against the reported multi modal velocity histograms is that, when the calculated drag forces are scaled per motor, the reSUlting "one motor" force-velocity curves appear unrealistically
27
steep [46]. This potential difficulty did not escape the investigators who first observed regularly spaced velocity histogram peaks. They remarked that "the Stokes' law curve in Fig. I predicts that vesicle velocity should be sublinear in the number of motors, but Fig. 6 suggests a linear relation" (where their Figs. 1 and 6 correspond to our Figs. 9 and 5, respectively), and they proposed an explanation related to the higher Vrnax in vivo relative to in vitro [37]. Indeed, a high Vrnax has been observed in several in vivo systems [43, 58-60], including the NT2 data reported here-the average speed of the data under the 5th peak in Fig. 5 is 2.0 ± 0.3 l-lmls, significantly higher than the 1.36 ± 0.04 l-lmls reported as the Vrnax for kinesin in vitro at 35°C.
Interestingly, the increased velocity seen in Fig. 7 for two or three motors is not entirely explained by loadsharing between motors. Indeed, if the effects of loadsharing are removed, by halving the total force due to two motors and dividing the force from three motors by three, the resulting single-motor force-velocity "curve" extrapolates to a zero-force velocity of 3.1 l-lmls, more than double the zero-force velocity for kinesin in vitro at 35°C [47]. This discrepancy arises entirely from the 2- and 3-motor data (by itself, the I-motor data only extrapolates to 0.9 l-lmls). In other words, the 2- and 3-motor data have higher velocities than expected, even after accounting for load-sharing. This suggests that motors are not only able to share their common load but are able to cooperatively enhance their inherent velocity.
Acknowledgments We thank George Holzwarth for help with preparing this manuscript and Keith Bonin for helpful discussions. We gratefully acknowledge Todd Fallesen and Clayton Bauer for input at various stages. This work was supported by a start-up grant by Wake Forest University to JCM and by an NIH grant (AG-020996) to DAD.
References
1. Koch, T., & Hollt, V. (2008). Role of receptor internalization in opioid tolerance and dependence. Pharmacology and Therapeutics, 117, 199-206.
2. Bie, B., & Pan, Z. Z. (2007). Trafficking of central opioid receptors and descending pain inhibition. Molecular Pain, 3, 37.
3. Ishijima, A., Kojima, H., Higuchi, H., Harada, Y., Funatsu, T., & Yanagida, T. (1996). Multiple- and single-molecule analysis of the actomyosin motor by nanometer-piconewton manipulation with a microneedle: Unitary steps and forces. Biophysical Journal, 70, 383-400.
4. Svoboda, K, & Block, S. M. (1994). Force and velocity measured for single kinesin molecules. Cell, 77, 773-784.
5. Wang, M. D., Schnitzer, M. J., Yin, H., Landick, R., Gelles, J., & Block, S. M. (1998). Force and velocity measured for single molecules of RNA polymerase. Science, 282, 902-907.
6. Hua, W., Young, E. C., Fleming, M. L., & Gelles, J. (1997). Coupling of kinesin steps to ATP hydrolysis. Nature, 388, 390-393.
28
7. Schnitzer, M. J., & Block, S. M. (1997). Kinesin hydrolyses one ATP per 8-nm step. Nature, 388, 386-389.
8. Lu, H., Macosko, J., Habel-Rodriguez, D., Keller, R. W., Brozik, J. A, & Keller, D. J. (2004). Closing of the fingers domain generates motor forces in the HIV reverse transcriptase. Journal of Biological Chemistry, 279, 54529-54532.
9. Keller, D. 1., & Brozik, J. A. (2005). Framework model for DNA polymerases. Biochemistry, 44, 6877--6888.
10. Dixit, R., Ross, J. L., Goldman, Y. E., & Holzbaur, E. L. (2008). Differential regulation of dynein and kinesin motor proteins by tau. Science, 319, 1086-1089.
11. Dewitt, D. A, Hurd, J. A, Fox, N., Townsend, B. E., Griffioen, K. J., Ghribi, 0., et al. (2006). Peri-nuclear clustering of mitochondria is triggered during aluminum maltolate induced apoptosis. Journal of Alzheimers Disease, 9, 195-205.
12. Lazarov, 0., Mortini, G. A, Pigino, G., Gadadhar, A., Chen, X., Robinson, J., et al. (2007). Impairments in fast axonal transport and motor neuron deficits in transgenic mice expressing familial Alzheimer's disease-linked mutant presenilin 1. Journal of Neuroscience, 27, 7011-7020.
13. Ebneth, A, Godemann, R., Stamer, K., IIIenberger, S., Trinczek, B., & MandeIkow, E. (1998). Overexpression of tau protein inhibits kinesin-dependent trafficking of vesicles, mitochondria, and endoplasmic reticulum: Implications for Alzheimer's disease. Journal of Cell Biology, 143, 777-794.
14. Pigino, G., Morfini, G., Pelsman, A, Mattson, M. P., Brady, S. T., & Busciglio, J. (2003). Alzheimer's presenilin 1 mutations impair kinesin-based axonal transport. Journal of Neuroscience, 23, 4499-4508.
15. Kamal, A, Almenar-Queralt, A, LeBlanc, J. F., Roberts, E. A, & Goldstein, L. S. (2001). Kinesin-mediated axonal transport of a membrane compartment containing beta-secretase and presenilin-1 requires APP. Nature, 414, 643-648.
16. Smith, K. D., Kallhoff, V., Zheng, H., & Pautler, R. G. (2007). In vivo axonal transport rates decrease in a mouse model of Alzheimer's disease. Neuroimage, 35, 1401-1408.
17. Segel, I. H. (1975). Enzyme kinetics: behavior and analysis of rapid equilibrium and steady state enzyme systems. New York: Wiley.
18. Perutz, M. F. (1989). Mechanisms of cooperativity and allosteric regulation in proteins. Quarterly Reviews of Biophysics, 22, 139-237.
19. Perutz, M. F., & TenEyck, L. F. (1972). Stereochemistry of cooperative effects in hemoglobin. Cold Spring Harbor Symposia on Quantitative Biology, 36, 295-310.
20. Ryu, W. S., Berry, R. M., & Berg, H. C. (2000). Torque-generating units of the flagellar motor of Escherichia coli have a high duty ratio. Nature, 403,444-447.
21. Ashkin, A, Schuetze, K., Dziedzic, J. M., Euteneuer, U., & Schliwa, M. (1990). Force generation of organelle transport measured in vivo by an infrared laser trap. Nature, 348, 346-348.
22. Hirokawa, N. (1998). Kinesin and dynein superfamily proteins and the mechanism of organelle transport. Science, 279, 519-526.
23. Maier, B., Chen, I., Dubnau, D., & Sheetz, M. P. (2004). DNA transport into Bacillus subtilis requires proton motive force to generate large molecular forces. Nature Structural & Molecular Biology, 11,643-649.
24. Smith, D. E., Tans, S. J., Smith, S. B., Grimes, S., Anderson, D. L., & Bustamante, C. (2001). The bacteriophage straight phi29 portal motor can package DNA against a large internal force. Nature, 413, 748-752.
25. Wilcox, A J., Choy, J., Bustamante, c., & Matouschek, A (2005). Effect of protein structure on mitochondrial import. Proceedings of the National Academy of Sciences of the United States of America, 102, 15435-15440.
Cell Biochem Biophys (2008) 52:19-29
26. Welte, M. A, Gross, S., Postner, M., Block, S., & Wieschaus, E. (1998). Developmental regulation of vesicle transport in Drosophila embryos: Forces and kinetics. Cell, 92, 547-557.
27. Vershinin, M., Carter, B. C., Razafsky, D. S., King, S. J., & Gross, S. P. (2007). Multiple-motor based transport and its regulation by Tau. Proceedings of the National Academy of Sciences of the United States of America, 104, 87-92.
28. Friberg, H., Ferrand-Drake, M., Bengtsson, F., Halestrap, A. P., & Wieloch, T. (1998). Cyclosporin A, but not FK 506, protects mitochondria and neurons against hypoglycemic damage and implicates the mitochondrial permeability transition in cell death. Journal of Neuroscience, 18,5151-5159.
29. Bednarski, E., Ribak, C. E., & Lynch, G. (1997). Suppression of cathepsins Band L causes a proliferation of Iysosomes and the formation of meganeurites in hippocampus. Journal of Neuroscience, 17,4006-4021.
30. Moreno, S., Nardacci, R., & Ceru, M. P. (1997). Regional and ultrastructural immunolocalization of copper-zinc superoxide dismutase in rat central nervous system. Journal of Histochemistry and Cytochemistry, 45, 1611-1622.
31. Martin, E. J., Kim, M., Velier, J., Sapp, E., Lee, H. S., Laforet, G., et al. (1999). Analysis of Huntingtin-associated protein 1 in mouse brain and immortalized striatal neurons. Journal of Comparative Neurology, 403,421-430.
32. Stokes, G. G. (1851). On the effect of the internal friction of fluids on the motion of pendulums. Cambridge Philosophical Society Transactions, 9, 8-106.
33. Hill, D. B. (2003). Changes in the number of molecular motors driving vesicle transport in PC12. In his physics Ph.D. dissertation, Wake Forest University, Winston-Salem.
34. Chisena, E. N., Wall, R. A, Macosko, J. C., & Holzwarth, G. (2007). Speckled microtubules improve tracking in motor-protein gliding assays. Physical Biology, 4, 10-15.
35. Cribb, J. (Retrieved Aug 4, 2008 from http://www.cs.unc.edu/ Researchinano/cismmldownload/spottracker/video_spoCtracker.html).
36. Mason, T. G. (2000). Estimating the viscoelastic moduli of complex fluids using the generalized Stokes-Einstein equation. Rheologica Acta, 39, 371-378.
37. HilI, D. B., Plaza, M. J., Bonin, K., & Holzwarth, G. (2004). Fast vesicle transport in PC 12 neurites: Velocities and forces. European Biophysics Journal, 33, 623--632.
38. Zahn, T. R., Angleson, J. K., MacMorris, M. A, Domke, E., Hutton, J. F., Schwartz, C., et al. (2004). Dense core vesicle dynamics in Caenorhabditis elegans neurons and the role of kinesin UNC-104. Traffic, 5, 544-559.
39. Young, D., Glasbey, C. A, Gray, A J., & Martin, N. J. (1998). Towards automatic cell identification in DIC microscopy. Journal of Microscopy, 192, 186-193.
40. Valberg, P. A, & Feldman, H. A (1987). Magnetic particle motions within living cells measurement of cytoplasmic viscosity and motile activity. Biophysical Journal, 52,551-561.
41. Holzwarth, G., Bonin, K., & Hill, D. B. (2002). Forces required of kinesin during processive transport through cytoplasm. Biophysical Journal, 82, 1784-1790.
42. Breuer, A C., Christian, C. N., Henkart, M., & Nelson, P. G. (1975). Computer analysis of organelle translocation in primary neuronal cultures and continuous cell lines. Journal of Cell Biology, 65, 562-576.
43. Kural, c., Kim, H., Syed, S., Goshima, G., Gelfand,. V. I., & Selvin, P. R. (2005). Kinesin and dynein move a peroxisome in vivo: A tug-of-war or coordinated movement? Science, 308, 1469-1472.
44. Macosko, J. c., Newbern, J. M., Rockford, J., Chisena, E. N., Brown, C. M., Holzwarth, G., & Milligan, C. E. (2008). Fewer motors per vesicle explains slowed vesicle transport in chick motoneurons after three days in vitro. Brain Research, 1211,6-12.
Cell Biochem Biophys (2008) 52:19-29
45. Levi, V., Serpinskaya, A. S., Gratton, E., & Gelfand, V. (2006). Organelle transport along microtubules in Xenopus melanophores: Evidence for cooperation between multiple motors. Biophysical Journal, 90, 318-327.
46. Martinez, J. E., Vershinin, M. D., Shubeita, G. T., & Gross, S. P. (2007). On the use of in vivo cargo velocity as a biophysical marker. Biochemical and Biophysical Research Communications, 353, 835-840.
47. Kawaguchi, K., & Ishiwata, S. (2000). Temperature dependence of force, velocity, and processivity of single kinesin molecules. Biochemical and Biophysical Research Communications, 272, 895-899.
48. Meyhofer, E., & Howard, J. (1995). The force generated by a single kinesin molecule against an elastic load. Proceedings of the National Academy of Sciences of the United States of America, 92,574-578.
49. Visscher, K., Schnitzer, M. J., & Block, S. M. (1999). Single kinesin molecules studied with a molecular force clamp. Nature, 400, 184-189.
50. Meyhoefer, E., & Howard, J. (1995). The force generated by a single kinesin molecule against an elastic load. Proceedings of the National Academy of Sciences of the United States of America, 92, 574-578.
51. Hill, D. B., Macosko, J. c., & Holzwarth, G. M. (accepted). Motion-enhanced, differential interference contrast (MEDIC) microscopy of moving vesicles in live cells: VE-DIC updated. Journal of Microscopy.
29
52. Goldstein, L. S. B. (2003). Do disorders of movement cause movement disorders and dementia? Neuron, 40, 415-425.
53. Weihs, D., Mason, T. G, TeiteIl, & M. A. (2007). Effects of cytoskeletal disruption on transport, structure, and rheology within mammalian cells. Physics of Fluids, 19, 103102-1-103102-6.
54. Block, S. M., Goldstein, L., & BJ, S. (1990). Bead Movement by single kinesin molecules studied with optical tweezers. Nature, 348, 348-352.
55. Courty, S., Luccardini, C., Bellaiche, Y., Cappello, G., & Dahan, M. (2006). Tracking individual kinesin motors in living cells using single quantum-dot imaging. Nano Letters, 6, 1491-1495.
56. Petrov, D. Y., Mallik, R., Shubeita, G. T., Vershinin, M., Gross, S. P., & Yu, C. c. (2007). Studying molecular motor-based cargo transport: What is real and what is noise? Biophysical Journal, 92, 2953-2963.
57. Hunt, A. J., Gittes, E, & Howard, J. (1994). The force exerted by a single kinesin molecule against a viscous load. Biophysical Journal, 67,766-781.
58. Brady, S. T., Lasek, R. J., & Allen, R. D. (1982). Fast axonal transport in extruded axoplasm from squid giant axon. Science, 218, 1129-1131.
59. Grafstein, B., & Forman, D. S. (1980). Intracellular-tranpsort in neurons. Physiological Review, 60, 1167-1283.
60. Kaether, c., Skehel, P., & Dotti, C. G. (2000). Axonal membrane proteins are transported in distinct carriers: A two-color video microscopy study in cultured hippocampal neurons. Molecular Biology of the Cell, 11, 1213-1224.