Page 1
1 Contents 26 Retail Gas Prices
2 Countywide Assessed Value 27 Diesel & Gas Wholesale
3 Unincorporated Assessed Value 28 Recorded Documents
4 Countywide New Construction 29 Gambling Tax
5 Unincorporated New Construction 30 E-911 Tax
6 Sales and Use Taxbase 31 P&I on Property Taxes
7 Local and Option Sales Tax 32 Current Expense
8 Metro Transit Sales Tax 33 DD/MH
9 Mental Health Sales Tax 34 Veteran's Aid
10 Criminal Justice Sales Tax 35 AFIS
11 Health Through Housing Sales Tax 36 Parks
12 Seattle TBD Sales Tax 37 VSHSL
13 Hotel Sales Tax 38 PSERN
14 Hotel Tax (HB 2015) 39 BSFK
15 Rental Car Sales Tax 40 EMS
16 Real Estate Excise Tax (REET 1) 41 Conservation Futures
17 Investment Pool Nominal Rate of Return 42 UAL/Roads
18 Investment Pool Real Rate of Return 43 Roads addendum
19 National CPI-U 44 Flood
20 National CPI-W 45 Marine
21 Seattle CPI-U 46 Transit
22 Seattle CPI-W 47 UTGO
23 COLA 48 KC I+P Index
24 Pharmaceuticals PPI 49 Appendix
25 Transportation CPI
Forecast adopted by the Forecast Council on August 27th, 2021 (KCFC 2021-03)
August 27, 2021
Office of Economic and Financial Analysis
August 2021 King County Economic and Revenue Forecast
Page 2
Tax
YearValue
Annual
Growth
% Change from
July 2021
Forecast
$ Change from
July 2021
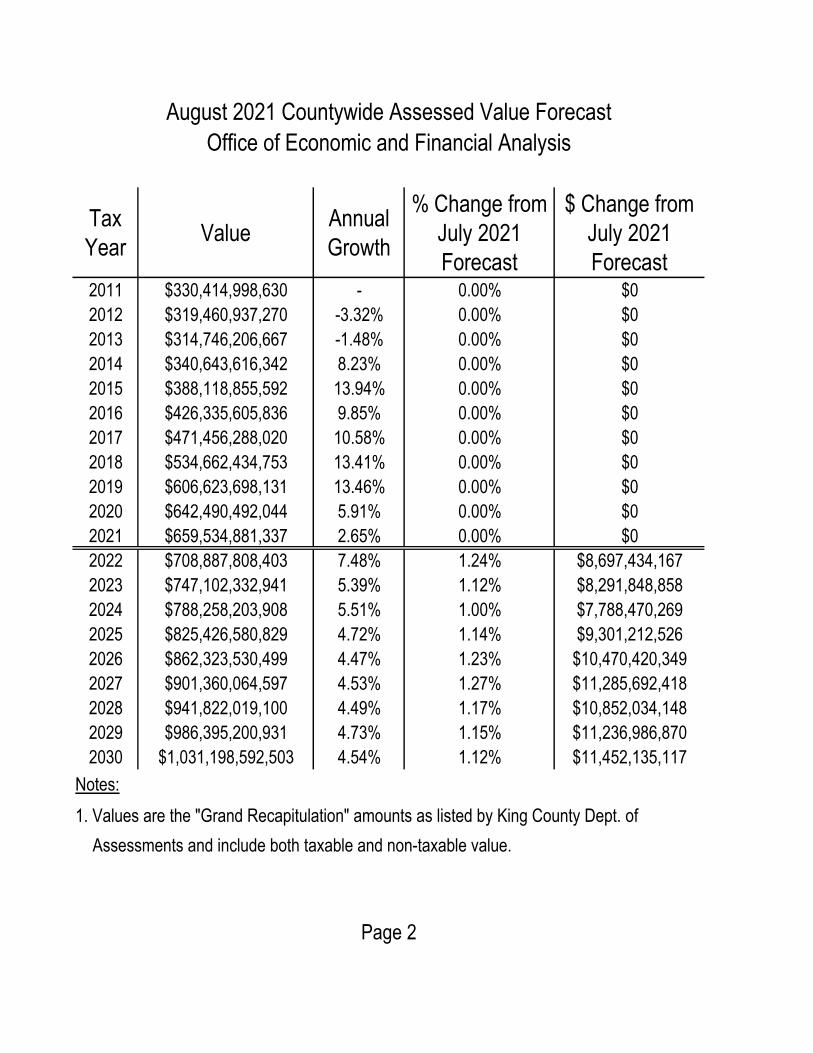
Forecast2011 $330,414,998,630 - 0.00% $0
2012 $319,460,937,270 -3.32% 0.00% $0
2013 $314,746,206,667 -1.48% 0.00% $0
2014 $340,643,616,342 8.23% 0.00% $0
2015 $388,118,855,592 13.94% 0.00% $0
2016 $426,335,605,836 9.85% 0.00% $0
2017 $471,456,288,020 10.58% 0.00% $0
2018 $534,662,434,753 13.41% 0.00% $0
2019 $606,623,698,131 13.46% 0.00% $0
2020 $642,490,492,044 5.91% 0.00% $0
2021 $659,534,881,337 2.65% 0.00% $0
2022 $708,887,808,403 7.48% 1.24% $8,697,434,167
2023 $747,102,332,941 5.39% 1.12% $8,291,848,858
2024 $788,258,203,908 5.51% 1.00% $7,788,470,269
2025 $825,426,580,829 4.72% 1.14% $9,301,212,526
2026 $862,323,530,499 4.47% 1.23% $10,470,420,349
2027 $901,360,064,597 4.53% 1.27% $11,285,692,418
2028 $941,822,019,100 4.49% 1.17% $10,852,034,148
2029 $986,395,200,931 4.73% 1.15% $11,236,986,870
2030 $1,031,198,592,503 4.54% 1.12% $11,452,135,117
Notes:
1. Values are the "Grand Recapitulation" amounts as listed by King County Dept. of
Assessments and include both taxable and non-taxable value.
Page 2
Office of Economic and Financial Analysis
August 2021 Countywide Assessed Value Forecast
Page 3
Tax
YearValue
Annual
Growth
% Change from
July 2021
Forecast
$ Change from
July 2021
Forecast2011 $39,449,376,050 - 0.00% $0
2012 $32,758,485,327 -16.96% 0.00% $0
2013 $30,016,733,778 -8.37% 0.00% $0
2014 $31,876,016,756 6.19% 0.00% $0
2015 $36,080,918,262 13.19% 0.00% $0
2016 $36,633,108,444 1.53% 0.00% $0
2017 $39,044,967,515 6.58% 0.00% $0
2018 $43,501,122,097 11.41% 0.00% $0
2019 $48,607,292,257 11.74% 0.00% $0
2020 $50,973,173,419 4.87% 0.00% $0
2021 $51,792,407,263 1.61% 0.00% $0
2022 $58,360,777,661 12.68% 0.85% $491,444,859
2023 $61,879,792,999 6.03% 1.50% $911,929,540
2024 $61,394,977,878 -0.78% 1.75% $1,053,821,294
2025 $61,015,047,325 -0.62% 1.81% $1,084,386,411
2026 $58,782,770,327 -3.66% 1.87% $1,077,914,339
2027 $60,128,550,029 2.29% 1.92% $1,131,439,800
2028 $58,869,242,003 -2.09% 1.69% $980,030,073
2029 $62,069,340,778 5.44% 1.66% $1,015,011,573
2030 $65,245,636,171 5.12% 1.63% $1,049,273,316
Notes:
1. Includes taxable value only.
2. Unincorporated assessed values are affected by annexations (see appendix).
Office of Economic and Financial Analysis
August 2021 Unincorporated Assessed Value Forecast
Page 3
Page 4
Tax
YearValue
Annual
Growth
% Change from
July 2021
Forecast
$ Change from
July 2021
Forecast2011 $2,457,642,885 - 0.00% $0
2012 $1,925,434,669 -21.66% 0.00% $0
2013 $1,983,503,613 3.02% 0.00% $0
2014 $3,406,198,290 71.73% 0.00% $0
2015 $4,994,659,235 46.63% 0.00% $0
2016 $6,111,997,054 22.37% 0.00% $0
2017 $8,438,451,607 38.06% 0.00% $0
2018 $9,789,738,887 16.01% 0.00% $0
2019 $11,561,210,136 18.10% 0.00% $0
2020 $11,025,221,474 -4.64% 0.00% $0
2021 $10,610,155,850 -3.76% 0.00% $0
2022 $9,481,967,650 -10.63% -14.15% ($1,562,961,701)
2023 $9,255,966,890 -2.38% -8.82% ($894,896,846)
2024 $9,880,974,092 6.75% -1.92% ($193,180,245)
2025 $10,184,986,973 3.08% 0.01% $1,151,414
2026 $10,350,616,576 1.63% -1.13% ($118,796,704)
2027 $10,602,137,332 2.43% -1.25% ($133,687,933)
2028 $10,736,153,039 1.26% -1.61% ($175,446,316)
2029 $11,010,204,688 2.55% -1.85% ($207,632,606)
2030 $11,353,105,838 3.11% -1.88% ($216,996,628)
Notes:
1. Values are local area new construction only. Change in state assessed utility value
not included.
Page 4
August 2021 Countywide New Construction Forecast
Office of Economic and Financial Analysis
Page 5
Tax
YearValue
Annual
Growth
% Change from
July 2021
Forecast
$ Change from
July 2021
Forecast2011 $267,511,475 - 0.00% $0
2012 $180,324,673 -32.59% 0.00% $0
2013 $198,251,903 9.94% 0.00% $0
2014 $299,208,000 50.92% 0.00% $0
2015 $251,120,765 -16.07% 0.00% $0
2016 $311,033,282 23.86% 0.00% $0
2017 $333,644,251 7.27% 0.00% $0
2018 $368,351,577 10.40% 0.00% $0
2019 $451,503,571 22.57% 0.00% $0
2020 $457,269,700 1.28% 0.00% $0
2021 $381,854,790 -16.49% 0.00% $0
2022 $337,839,280 -11.53% -6.99% ($25,408,445)
2023 $329,786,950 -2.38% -1.22% ($4,056,576)
2024 $334,607,880 1.46% 6.26% $19,707,423
2025 $328,645,395 -1.78% 8.35% $25,321,420
2026 $306,601,203 -6.71% 7.11% $20,342,786
2027 $304,656,247 -0.63% 6.99% $19,895,329
2028 $288,800,819 -5.20% 6.59% $17,864,999
2029 $296,172,765 2.55% 6.33% $17,633,035
2030 $305,396,751 3.11% 6.30% $18,110,251
Notes:
1. Unincorporated new construction values are affected by annexations (see appendix).
2. Change in state assessed utility value not included.
Page 5
Office of Economic and Financial Analysis
August 2021 Unincorporated New Construction Forecast
Page 6
Tax
YearValue
Annual
Growth
% Change from
July 2021
Forecast
$ Change from
July 2021
Forecast2011 $42,349,096,619 - 0.00% $0
2012 $45,178,847,087 6.68% 0.00% $0
2013 $48,553,937,856 7.47% 0.00% $0
2014 $52,335,343,480 7.79% 0.00% $0
2015 $57,615,757,460 10.09% 0.00% $0
2016 $62,234,630,017 8.02% 0.00% $0
2017 $65,826,124,662 5.77% 0.00% $0
2018 $72,726,583,626 10.48% 0.00% $0
2019 $76,486,164,464 5.17% 0.00% $0
2020 $70,728,682,615 -7.53% 0.00% $0
2021 $79,482,976,036 12.38% -0.36% ($288,946,481)
2022 $84,024,426,249 5.71% -0.08% ($69,732,472)
2023 $88,795,680,632 5.68% -0.10% ($93,219,932)
2024 $93,686,692,970 5.51% -0.07% ($66,552,301)
2025 $99,039,701,353 5.71% 0.01% $8,335,845
2026 $103,632,165,869 4.64% -0.01% ($11,724,738)
2027 $108,865,579,036 5.05% -0.06% ($62,255,633)
2028 $114,363,138,216 5.05% 0.07% $82,997,495
2029 $119,749,063,543 4.71% 0.09% $103,432,576
2030 $126,247,309,902 5.43% 0.01% $11,562,502
Notes:
1. Actual values are taxable sales for King County as reported by the Washington DOR.
2. Forecast values include estimated sales associated with marketplace facilitators,
remote sellers and referrers.
Office of Economic and Financial Analysis
August 2021 King County Sales and Use Taxbase Forecast
Page 6
Page 7
Tax
YearValue
Annual
Growth
% Change from
July 2021
Forecast
$ Change from
July 2021
Forecast2012 $83,194,189 - 0.00% $0
2013 $89,323,495 7.37% 0.00% $0
2014 $96,310,935 7.82% 0.00% $0
2015 $104,719,894 8.73% 0.00% $0
2016 $112,704,886 7.63% 0.00% $0
2017 $118,621,546 5.25% 0.00% $0
2018 $131,938,849 11.23% 0.00% $0
2019 $137,639,197 4.32% 0.00% $0
2020 $132,079,220 -4.04% 0.00% $0
2021 $150,410,818 13.88% -0.44% ($661,214)
2022 $156,120,073 3.80% -0.08% ($129,565)
2023 $161,174,416 3.24% -0.10% ($169,205)
2024 $165,245,231 2.53% -0.07% ($120,800)
2025 $172,179,447 4.20% 0.01% $15,131
2026 $177,615,720 3.16% -0.01% ($21,282)
2027 $185,030,967 4.17% -0.06% ($113,001)
2028 $191,260,524 3.37% 0.08% $150,650
2029 $200,270,287 4.71% 0.09% $187,742
2030 $211,124,138 5.42% 0.01% $20,987
Notes:
1. Distribution is 1% of taxable sales in unincorporated KC and 0.15% of taxable sales in
incorporated cities per WA DOR.
2. All revenue is allocated to the General Fund (Fund 0010/Acct 31310).
3. Forecasts are impacted by out-year annexations (see appendix).
Office of Economic and Financial Analysis
August 2021 Local and Option Sales Tax Forecast
Page 7
Page 8
Tax
YearValue
Annual
Growth
% Change from
July 2021
Forecast
$ Change from
July 2021
Forecast2011 $399,483,215 - 0.00% $0
2012 $412,549,492 3.27% 0.00% $0
2013 $442,835,695 7.34% 0.00% $0
2014 $479,433,577 8.26% 0.00% $0
2015 $526,663,508 9.85% 0.00% $0
2016 $566,774,755 7.62% 0.00% $0
2017 $590,585,094 4.20% 0.00% $0
2018 $651,379,307 10.29% 0.00% $0
2019 $684,963,001 5.16% 0.00% $0
2020 $636,716,490 -7.04% 0.00% $0
2021 $726,154,026 14.05% -0.89% ($6,556,553)
2022 $754,546,004 3.91% -0.08% ($626,701)
2023 $797,426,317 5.68% -0.10% ($837,788)
2024 $841,382,921 5.51% -0.07% ($598,120)
2025 $889,491,585 5.72% 0.01% $74,916
2026 $930,765,074 4.64% -0.01% ($105,373)
2027 $977,798,909 5.05% -0.06% ($559,505)
2028 $1,027,206,683 5.05% 0.07% $745,917
2029 $1,075,611,179 4.71% 0.09% $929,571
2030 $1,134,012,348 5.43% 0.01% $103,915
Notes:
1. Distribution is 0.9% of countywide taxable sales less sales at lodging establishments with
60 or more rooms, which are capped at 0.6% per WA DOR.
2. All revenue is allocated to the Public Transit Fund (Fund 4641/Acct 31310).
August 2021 Metro Transit Sales Tax Forecast
Office of Economic and Financial Analysis
Page 8
Page 9
Tax
YearValue
Annual
Growth
% Change from
July 2021
Forecast
$ Change from
July 2021
Forecast2011 $43,099,478 - 0.00% $0
2012 $45,000,360 4.41% 0.00% $0
2013 $48,298,263 7.33% 0.00% $0
2014 $52,288,413 8.26% 0.00% $0
2015 $57,487,652 9.94% 0.00% $0
2016 $61,907,550 7.69% 0.00% $0
2017 $64,979,114 4.96% 0.00% $0
2018 $71,198,452 9.57% 0.00% $0
2019 $74,773,247 5.02% 0.00% $0
2020 $70,393,210 -5.86% 0.00% $0
2021 $80,230,476 13.97% -0.91% ($736,235)
2022 $82,245,514 2.51% -0.08% ($68,310)
2023 $86,919,469 5.68% -0.10% ($91,319)
2024 $91,710,738 5.51% -0.07% ($65,195)
2025 $96,954,583 5.72% 0.01% $8,166
2026 $101,453,393 4.64% -0.01% ($11,486)
2027 $106,580,081 5.05% -0.06% ($60,986)
2028 $111,965,528 5.05% 0.07% $81,305
2029 $117,241,618 4.71% 0.09% $101,323
2030 $123,607,346 5.43% 0.01% $11,327
Notes:
1. Distribution is 0.1% of countywide taxable sales less sales at lodging establishments with
60 or more rooms, which do not pay MIDD sales tax per WA DOR.
2. All revenue is allocated to the MIDD Fund (Fund 1135/Acct 31314).
Page 9
August 2021 Mental Health Sales Tax Forecast
Office of Economic and Financial Analysis
Page 10
Tax
YearValue
Annual
Growth
% Change from
July 2021
Forecast
$ Change from
July 2021
Forecast2012 $10,262,902 - 0.00% $0
2013 $10,758,499 4.83% 0.00% $0
2014 $11,528,620 7.16% 0.00% $0
2015 $12,564,407 8.98% 0.00% $0
2016 $13,243,628 5.41% 0.00% $0
2017 $13,671,508 3.23% 0.00% $0
2018 $14,808,960 8.32% 0.00% $0
2019 $15,478,453 4.52% 0.00% $0
2020 $14,206,605 -8.22% 0.00% $0
2021 $16,112,503 13.42% -0.59% ($96,109)
2022 $16,798,475 4.26% -0.08% ($13,952)
2023 $17,753,120 5.68% -0.10% ($18,652)
2024 $18,486,118 4.13% -0.07% ($13,141)
2025 $18,840,420 1.92% 0.01% $1,587
2026 $18,923,488 0.44% -0.01% ($2,142)
2027 $18,931,273 0.04% -0.06% ($10,833)
2028 $19,456,436 2.77% 0.07% $14,128
2029 $19,480,514 0.12% 0.09% $16,836
2030 $20,538,224 5.43% 0.01% $1,882
Notes:
1. Distribution is 0.1% of countywide sales allocated 10% to counties and 90% by population
to cities/counties per WA DOR.
2. All revenue is allocated to the General Fund (Fund 0010/Acct 31370).
August 2021 Criminal Justice Sales Tax Forecast
Office of Economic and Financial Analysis
Page 10
Page 11
Tax
YearValue
Annual
Growth
% Change from
July 2021
Forecast
$ Change from
July 2021
Forecast2011 - - - -
2012 - - - -
2013 - - - -
2014 - - - -
2015 - - - -
2016 - - - -
2017 - - - -
2018 - - - -
2019 - - - -
2020 - - - -
2021 $59,405,953 - -1.07% ($643,031)
2022 $62,159,546 4.64% -0.08% ($51,587)
2023 $65,689,222 5.68% -0.10% ($68,962)
2024 $69,307,493 5.51% -0.07% ($49,234)
2025 $73,267,539 5.71% 0.01% $6,167
2026 $76,664,950 4.64% -0.01% ($8,674)
2027 $80,536,521 5.05% -0.06% ($46,055)
2028 $84,603,503 5.05% 0.07% $61,400
2029 $88,587,900 4.71% 0.09% $76,517
2030 $93,395,169 5.43% 0.01% $8,554
Notes:
1. Distribution is 0.1% of countywide sales excluding Bellevue, Issaquah, North Bend,
Maple Valley, Snoqualmie, Renton, Covington and Kent.
August 2021 Health Through Housing Sales Tax Forecast
Office of Economic and Financial Analysis
Page 11
Page 12
Tax
YearValue
Annual
Growth
% Change from
July 2021
Forecast
$ Change from
July 2021
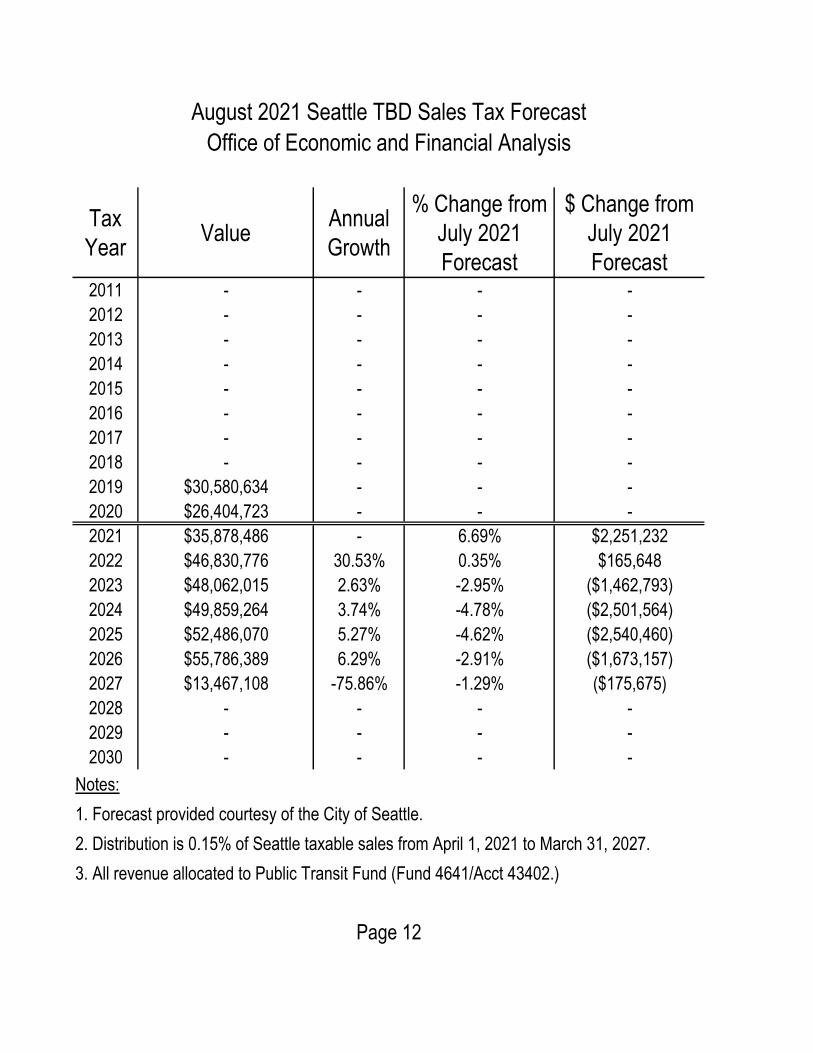
Forecast2011 - - - -
2012 - - - -
2013 - - - -
2014 - - - -
2015 - - - -
2016 - - - -
2017 - - - -
2018 - - - -
2019 $30,580,634 - - -
2020 $26,404,723 - - -
2021 $35,878,486 - 6.69% $2,251,232
2022 $46,830,776 30.53% 0.35% $165,648
2023 $48,062,015 2.63% -2.95% ($1,462,793)
2024 $49,859,264 3.74% -4.78% ($2,501,564)
2025 $52,486,070 5.27% -4.62% ($2,540,460)
2026 $55,786,389 6.29% -2.91% ($1,673,157)
2027 $13,467,108 -75.86% -1.29% ($175,675)
2028 - - - -
2029 - - - -
2030 - - - -
Notes:
1. Forecast provided courtesy of the City of Seattle.
2. Distribution is 0.15% of Seattle taxable sales from April 1, 2021 to March 31, 2027.
3. All revenue allocated to Public Transit Fund (Fund 4641/Acct 43402.)
August 2021 Seattle TBD Sales Tax Forecast
Office of Economic and Financial Analysis
Page 12
Page 13
Tax
YearValue
Annual
Growth
% Change from
July 2021
Forecast
$ Change from
July 2021
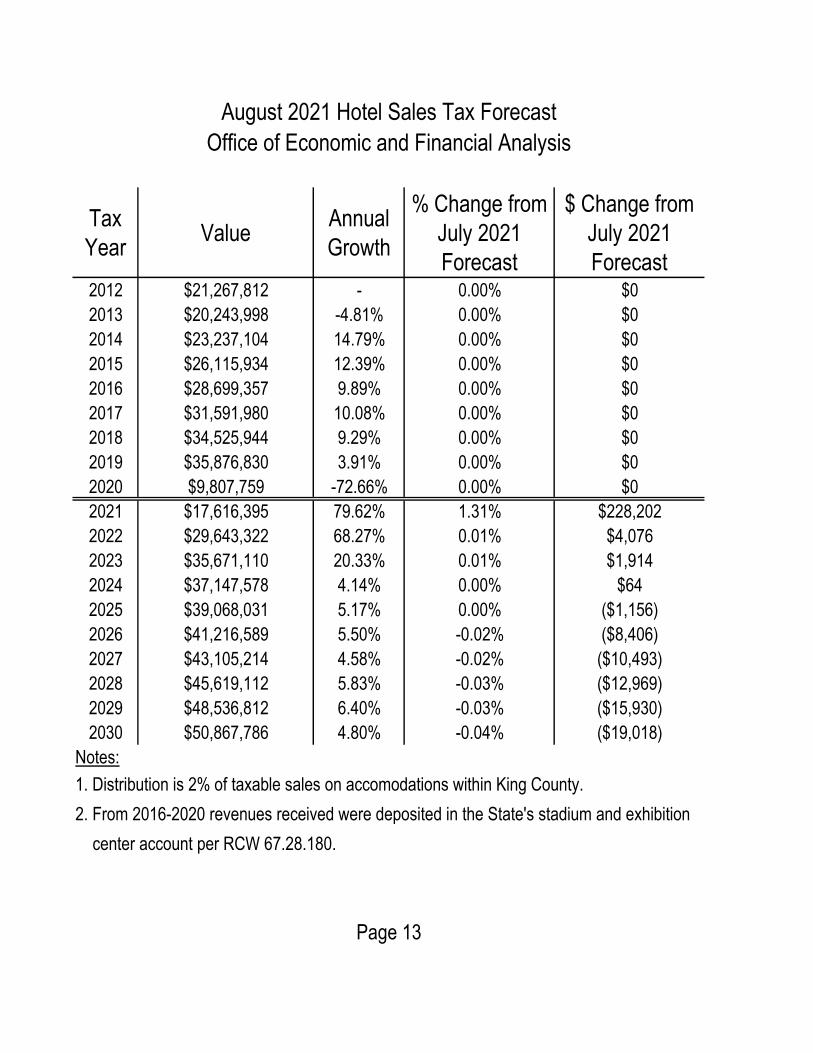
Forecast2012 $21,267,812 - 0.00% $0
2013 $20,243,998 -4.81% 0.00% $0
2014 $23,237,104 14.79% 0.00% $0
2015 $26,115,934 12.39% 0.00% $0
2016 $28,699,357 9.89% 0.00% $0
2017 $31,591,980 10.08% 0.00% $0
2018 $34,525,944 9.29% 0.00% $0
2019 $35,876,830 3.91% 0.00% $0
2020 $9,807,759 -72.66% 0.00% $0
2021 $17,616,395 79.62% 1.31% $228,202
2022 $29,643,322 68.27% 0.01% $4,076
2023 $35,671,110 20.33% 0.01% $1,914
2024 $37,147,578 4.14% 0.00% $64
2025 $39,068,031 5.17% 0.00% ($1,156)
2026 $41,216,589 5.50% -0.02% ($8,406)
2027 $43,105,214 4.58% -0.02% ($10,493)
2028 $45,619,112 5.83% -0.03% ($12,969)
2029 $48,536,812 6.40% -0.03% ($15,930)
2030 $50,867,786 4.80% -0.04% ($19,018)
Notes:
1. Distribution is 2% of taxable sales on accomodations within King County.
2. From 2016-2020 revenues received were deposited in the State's stadium and exhibition
center account per RCW 67.28.180.
August 2021 Hotel Sales Tax Forecast
Office of Economic and Financial Analysis
Page 13
Page 14
Quarter ValueYOY
Change
% Change from
July 2021
Forecast
$ Change from
July 2021
ForecastQ1 2019 $362,984 -584.06% 0.00% $0
Q2 2019 $514,938 -484.06% 0.00% $0
Q3 2019 $715,157 -384.06% 0.00% $0
Q4 2019 $324,770 -284.06% 0.00% $0
Q1 2020 $251,273 -184.06% 0.00% $0
Q2 2020 $139,898 -84.06% 0.00% $0
Q3 2020 $282,313 -70.33% 0.00% $0
Q4 2020 $230,047 -33.23% 0.00% $0
Q1 2021 $295,118 -18.70% 0.00% $0
Q2 2021 $386,329 176.15% 2.16% $8,174
Q3 2021 $510,055 80.67% 0.00% $0
Q4 2021 $434,605 88.92% 0.00% $0
Q1 2022 $506,069 71.48% 0.00% $0
Q2 2022 $583,640 51.07% 0.00% $0
Q3 2022 $644,131 26.29% 0.00% $0
Q4 2022 $421,506 -3.01% 0.00% $0
Q1 2023 $524,800 3.70% 0.00% $0
Q2 2023 $655,845 12.37% 0.00% $0
Q3 2023 $687,532 6.74% 0.00% $0
Q4 2023 $447,716 6.22% 0.00% $0
Notes:
1. Revenue reflects expanded lodging excise tax per 2SHB 2015 that went into effect in 2019.
August 2021 Hotel Tax (HB 2015) Forecast
Office of Economic and Financial Analysis
Page 14
Page 15
Tax
YearValue
Annual
Growth
% Change from
July 2021
Forecast
$ Change from
July 2021
Forecast2011 $2,811,097 - 0.00% $0
2012 $2,857,443 1.65% 0.00% $0
2013 $3,112,670 8.93% 0.00% $0
2014 $3,494,072 12.25% 0.00% $0
2015 $3,734,599 6.88% 0.00% $0
2016 $3,938,033 5.45% 0.00% $0
2017 $3,990,916 1.34% 0.00% $0
2018 $4,267,532 6.93% 0.00% $0
2019 $4,229,570 -0.89% 0.00% $0
2020 $2,104,431 -50.24% 0.00% $0
2021 $2,816,932 33.86% 3.19% $87,124
2022 $3,712,179 31.78% 0.32% $11,761
2023 $4,316,880 16.29% 0.16% $6,937
2024 $4,480,313 3.79% 0.93% $41,216
2025 $4,619,337 3.10% 0.60% $27,639
2026 $4,772,934 3.33% 0.16% $7,604
2027 $4,926,837 3.22% 0.16% $7,849
2028 $5,028,323 2.06% 0.05% $2,702
2029 $5,200,113 3.42% 0.11% $5,586
2030 $5,377,170 3.40% 0.16% $8,659
Notes:
1. Distribution is 1% of taxable sales on rental cars within King County.
August 2021 Rental Car Sales Tax Forecast
Office of Economic and Financial Analysis
Page 15
Page 16
Tax
YearValue
Annual
Growth
% Change from
July 2021
Forecast
$ Change from
July 2021
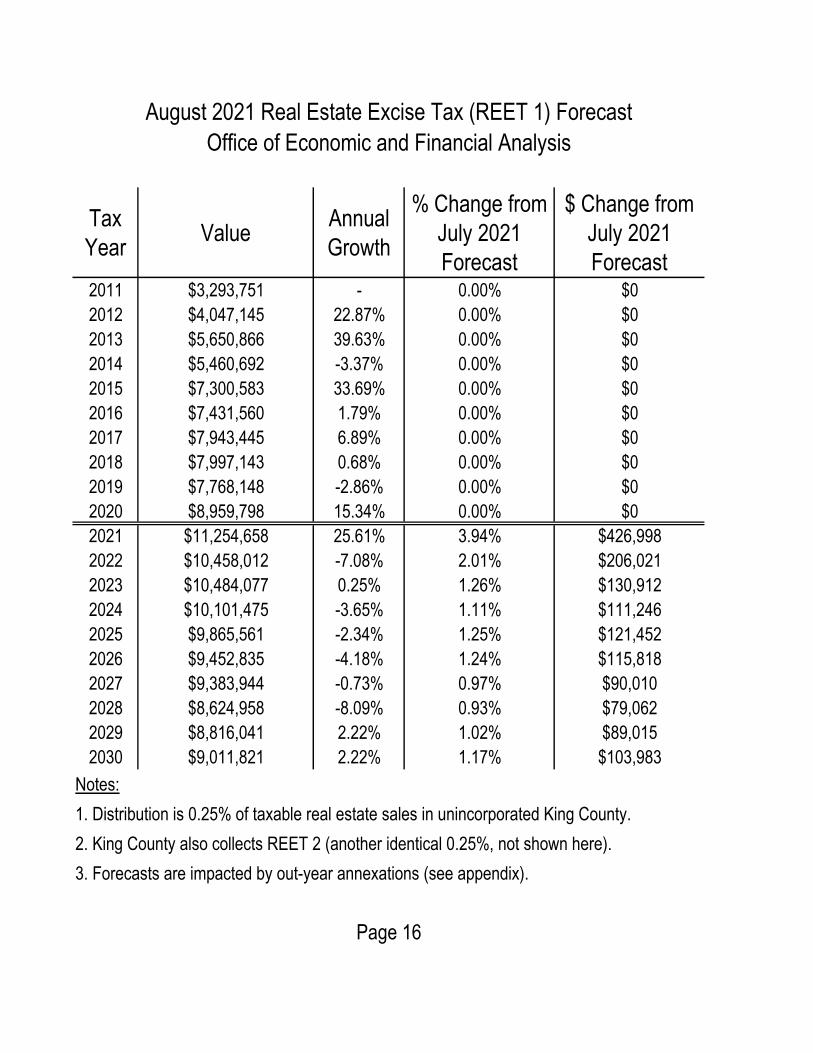
Forecast2011 $3,293,751 - 0.00% $0
2012 $4,047,145 22.87% 0.00% $0
2013 $5,650,866 39.63% 0.00% $0
2014 $5,460,692 -3.37% 0.00% $0
2015 $7,300,583 33.69% 0.00% $0
2016 $7,431,560 1.79% 0.00% $0
2017 $7,943,445 6.89% 0.00% $0
2018 $7,997,143 0.68% 0.00% $0
2019 $7,768,148 -2.86% 0.00% $0
2020 $8,959,798 15.34% 0.00% $0
2021 $11,254,658 25.61% 3.94% $426,998
2022 $10,458,012 -7.08% 2.01% $206,021
2023 $10,484,077 0.25% 1.26% $130,912
2024 $10,101,475 -3.65% 1.11% $111,246
2025 $9,865,561 -2.34% 1.25% $121,452
2026 $9,452,835 -4.18% 1.24% $115,818
2027 $9,383,944 -0.73% 0.97% $90,010
2028 $8,624,958 -8.09% 0.93% $79,062
2029 $8,816,041 2.22% 1.02% $89,015
2030 $9,011,821 2.22% 1.17% $103,983
Notes:
1. Distribution is 0.25% of taxable real estate sales in unincorporated King County.
2. King County also collects REET 2 (another identical 0.25%, not shown here).
3. Forecasts are impacted by out-year annexations (see appendix).
Page 16
Office of Economic and Financial Analysis
August 2021 Real Estate Excise Tax (REET 1) Forecast
Page 17
Tax Year ValueAnnual
Growth
% Change from
July 2021 Forecast
2011 0.62% - 0.00%
2012 0.56% -0.06% 0.00%
2013 0.51% -0.05% 0.00%
2014 0.51% 0.00% 0.00%
2015 0.60% 0.09% 0.00%
2016 0.83% 0.23% 0.00%
2017 1.12% 0.29% 0.00%
2018 1.73% 0.60% 0.00%
2019 2.23% 0.51% 0.00%
2020 1.39% -0.84% 0.00%
2021 0.60% -0.79% 0.00%
2022 0.40% -0.20% -0.05%
2023 0.50% 0.10% 0.00%
2024 0.78% 0.28% 0.07%
2025 1.07% 0.29% 0.12%
2026 1.37% 0.29% 0.16%
2027 1.67% 0.30% 0.19%
2028 1.94% 0.27% 0.18%
2029 2.16% 0.22% 0.14%
2030 2.34% 0.18% 0.10%
Notes:
1. Values are nominal annual returns for the King County investment pool.
August 2021 Investment Pool Nominal Rate of Return Forecast
Office of Economic and Financial Analysis
Page 17
Page 18
Tax Year ValueAnnual
Growth
% Change from
July 2021 Forecast
2011 -2.00% - 0.00%
2012 -1.93% 0.08% 0.00%
2013 -0.70% 1.23% 0.00%
2014 -1.31% -0.62% 0.00%
2015 -0.75% 0.56% 0.00%
2016 -1.36% -0.60% 0.00%
2017 -1.87% -0.52% 0.00%
2018 -1.43% 0.44% 0.00%
2019 -0.30% 1.13% 0.00%
2020 -0.30% 0.00% 0.00%
2021 -3.28% -2.98% -0.19%
2022 -2.23% 1.05% -0.05%
2023 -1.92% 0.31% 0.00%
2024 -1.63% 0.29% 0.07%
2025 -1.39% 0.23% 0.12%
2026 -0.94% 0.45% 0.16%
2027 -0.70% 0.25% 0.18%
2028 -0.46% 0.24% 0.18%
2029 -0.28% 0.18% 0.13%
2030 -0.13% 0.15% 0.10%
Notes:
1. Values are real annual returns for the King County investment pool using
STB CPI-U to adjust nominal values.
August 2021 Investment Pool Real Rate of Return Forecast
Office of Economic and Financial Analysis
Page 18
Page 19
Tax Year ValueAnnual
Growth
% Change from
July 2021 Forecast
2011 3.16% - 0.00%
2012 2.07% -1.09% 0.00%
2013 1.46% -0.60% 0.00%
2014 1.62% 0.16% 0.00%
2015 0.12% -1.50% 0.00%
2016 1.26% 1.14% 0.00%
2017 2.13% 0.87% 0.00%
2018 2.44% 0.31% 0.00%
2019 1.81% -0.63% 0.00%
2020 1.23% -0.58% 0.00%
2021 4.20% 2.97% 0.20%
2022 2.94% -1.26% 0.00%
2023 2.25% -0.69% 0.00%
2024 2.32% 0.07% 0.00%
2025 2.36% 0.05% 0.00%
2026 2.39% 0.03% 0.00%
2027 2.42% 0.03% 0.00%
2028 2.45% 0.03% 0.00%
2029 2.49% 0.04% 0.00%
2030 2.52% 0.03% 0.00%
Notes:
1. Series CUUR0000SAO. Values are annual growth.
August 2021 National CPI-U Forecast
Office of Economic and Financial Analysis
Page 19
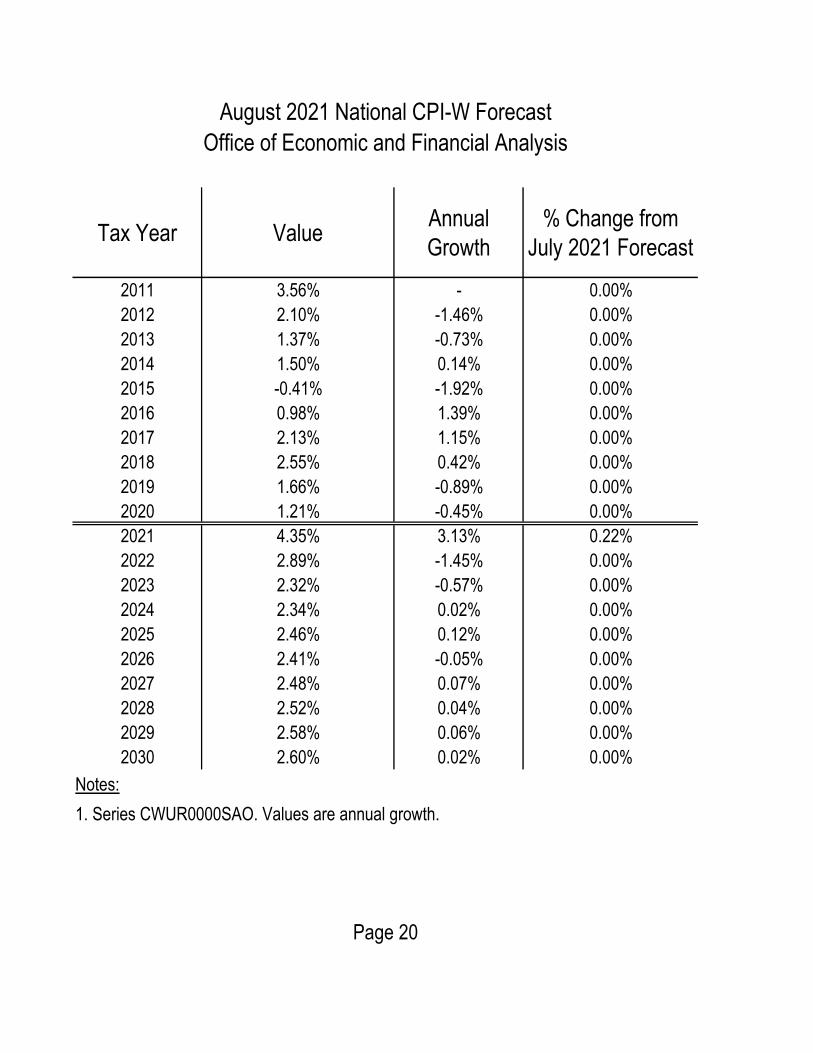
Page 20
Tax Year ValueAnnual
Growth
% Change from
July 2021 Forecast
2011 3.56% - 0.00%
2012 2.10% -1.46% 0.00%
2013 1.37% -0.73% 0.00%
2014 1.50% 0.14% 0.00%
2015 -0.41% -1.92% 0.00%
2016 0.98% 1.39% 0.00%
2017 2.13% 1.15% 0.00%
2018 2.55% 0.42% 0.00%
2019 1.66% -0.89% 0.00%
2020 1.21% -0.45% 0.00%
2021 4.35% 3.13% 0.22%
2022 2.89% -1.45% 0.00%
2023 2.32% -0.57% 0.00%
2024 2.34% 0.02% 0.00%
2025 2.46% 0.12% 0.00%
2026 2.41% -0.05% 0.00%
2027 2.48% 0.07% 0.00%
2028 2.52% 0.04% 0.00%
2029 2.58% 0.06% 0.00%
2030 2.60% 0.02% 0.00%
Notes:
1. Series CWUR0000SAO. Values are annual growth.
August 2021 National CPI-W Forecast
Office of Economic and Financial Analysis
Page 20
Page 21
Tax Year ValueAnnual
Growth
% Change from
July 2021 Forecast
2011 2.68% - 0.00%
2012 2.53% -0.14% 0.00%
2013 1.22% -1.32% 0.00%
2014 1.84% 0.63% 0.00%
2015 1.36% -0.48% 0.00%
2016 2.21% 0.85% 0.00%
2017 3.05% 0.84% 0.00%
2018 3.21% 0.15% 0.00%
2019 2.54% -0.66% 0.00%
2020 1.69% -0.85% 0.00%
2021 4.23% 2.54% 0.20%
2022 2.93% -1.30% 0.00%
2023 2.59% -0.34% 0.00%
2024 2.47% -0.12% 0.00%
2025 2.66% 0.19% 0.00%
2026 2.59% -0.07% 0.00%
2027 2.66% 0.08% 0.00%
2028 2.72% 0.05% 0.00%
2029 2.82% 0.10% 0.00%
2030 2.80% -0.02% 0.00%
Notes:
1. Series CUURS49DSA0. Values are annual growth.
August 2021 Seattle Annual CPI-U Forecast
Office of Economic and Financial Analysis
Page 21
Page 22
Tax Year ValueAnnual
Growth
% Change from
July 2021 Forecast
2011 3.70% - 0.00%
2012 2.67% -1.03% 0.00%
2013 1.16% -1.51% 0.00%
2014 2.23% 1.07% 0.00%
2015 1.08% -1.15% 0.00%
2016 1.99% 0.91% 0.00%
2017 3.03% 1.04% 0.00%
2018 3.65% 0.62% 0.00%
2019 1.68% -1.96% 0.00%
2020 1.01% -0.68% 0.00%
2021 6.29% 5.28% 0.00%
2022 3.03% -3.26% 0.00%
2023 2.38% -0.66% 0.00%
2024 2.48% 0.10% 0.00%
2025 2.56% 0.08% 0.00%
2026 2.62% 0.06% 0.00%
2027 2.69% 0.07% 0.00%
2028 2.73% 0.04% 0.00%
2029 2.79% 0.06% 0.00%
2030 2.81% 0.02% 0.00%
Notes:
1. Series CWURS49DSA0. Values are year over year change from June of
prior year to June of current year.
August 2021 June-June Seattle CPI-W Forecast
Office of Economic and Financial Analysis
Page 22
Page 23
Year New COLA
2017 1.78%
2018 2.70%
2019 3.32%
2020 2.43%
2021 1.79%
2022 2.82%
2023 3.54%
2024 2.33%
2025 2.31%
Notes:
1. The COLA values are calculated as 95% of the Seattle CPI-W where the CPI-W
value is the average of the six most recent July-June tax year values less the
average of the six prior July-June values.
2. There are multiple COLA agreements and this forecast only applies to those
units on the "new COLA" formula.
August 2021 Outyear COLA Comparison Forecast
Office of Economic and Financial Analysis
Page 23
Page 24
Tax Year ValueAnnual
Growth
% Change from
July 2021 Forecast
2011 -5.02% - 0.00%
2012 3.24% 8.26% 0.00%
2013 4.89% 1.65% 0.00%
2014 2.86% -2.03% 0.00%
2015 -4.17% -7.03% 0.00%
2016 -1.47% 2.70% 0.00%
2017 -1.52% -0.05% 0.00%
2018 3.15% 4.67% 0.00%
2019 2.68% -0.47% 0.00%
2020 1.75% -0.94% 0.00%
2021 2.25% 0.50% -0.30%
2022 3.49% 1.24% 0.00%
2023 3.66% 0.17% 0.00%
2024 3.90% 0.24% 0.00%
2025 3.98% 0.08% 0.00%
2026 3.95% -0.02% 0.00%
2027 3.96% 0.01% 0.00%
2028 3.85% -0.12% 0.00%
2029 3.65% -0.19% 0.00%
2030 3.50% -0.15% 0.00%
Notes:
1. Series PCU446110446110. Values are annual growth.
August 2021 Pharmaceuticals PPI Forecast
Office of Economic and Financial Analysis
Page 24
Page 25
Tax Year ValueAnnual
Growth
% Change from
July 2021 Forecast
2011 9.81% - 0.00%
2012 2.34% -7.47% 0.00%
2013 0.02% -2.32% 0.00%
2014 -0.66% -0.68% 0.00%
2015 -7.81% -7.15% 0.00%
2016 -2.10% 5.72% 0.00%
2017 3.42% 5.52% 0.00%
2018 4.51% 1.09% 0.00%
2019 -0.28% -4.80% 0.00%
2020 -4.16% -3.88% 0.00%
2021 12.53% 16.69% 0.20%
2022 3.40% -9.13% 0.00%
2023 1.99% -1.41% 0.00%
2024 2.22% 0.23% 0.00%
2025 2.35% 0.13% 0.00%
2026 2.40% 0.05% 0.00%
2027 2.54% 0.15% 0.00%
2028 2.25% -0.29% 0.00%
2029 2.30% 0.04% 0.00%
2030 2.35% 0.06% 0.00%
Notes:
1. Series CUUR0000SAT. Values are annual growth.
August 2021 Transportation CPI Forecast
Office of Economic and Financial Analysis
Page 25
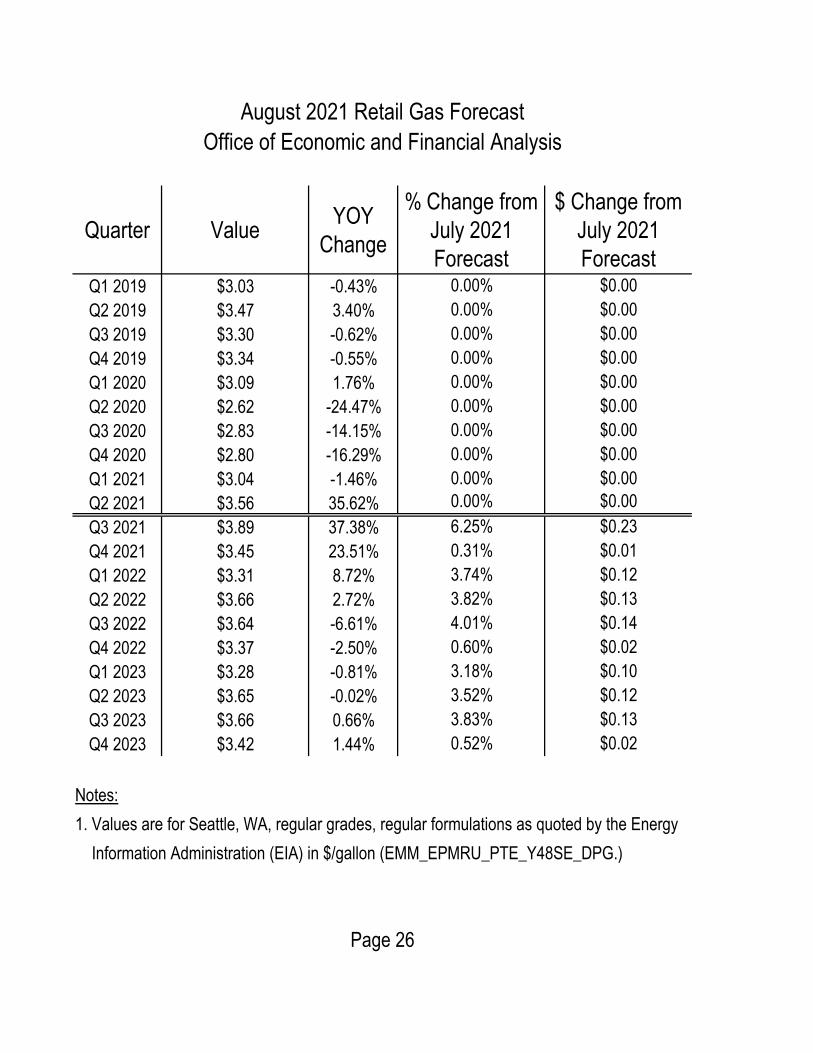
Page 26
Quarter ValueYOY
Change
% Change from
July 2021
Forecast
$ Change from
July 2021
ForecastQ1 2019 $3.03 -0.43% 0.00% $0.00
Q2 2019 $3.47 3.40% 0.00% $0.00
Q3 2019 $3.30 -0.62% 0.00% $0.00
Q4 2019 $3.34 -0.55% 0.00% $0.00
Q1 2020 $3.09 1.76% 0.00% $0.00
Q2 2020 $2.62 -24.47% 0.00% $0.00
Q3 2020 $2.83 -14.15% 0.00% $0.00
Q4 2020 $2.80 -16.29% 0.00% $0.00
Q1 2021 $3.04 -1.46% 0.00% $0.00
Q2 2021 $3.56 35.62% 0.00% $0.00
Q3 2021 $3.89 37.38% 6.25% $0.23
Q4 2021 $3.45 23.51% 0.31% $0.01
Q1 2022 $3.31 8.72% 3.74% $0.12
Q2 2022 $3.66 2.72% 3.82% $0.13
Q3 2022 $3.64 -6.61% 4.01% $0.14
Q4 2022 $3.37 -2.50% 0.60% $0.02
Q1 2023 $3.28 -0.81% 3.18% $0.10
Q2 2023 $3.65 -0.02% 3.52% $0.12
Q3 2023 $3.66 0.66% 3.83% $0.13
Q4 2023 $3.42 1.44% 0.52% $0.02
Notes:
1. Values are for Seattle, WA, regular grades, regular formulations as quoted by the Energy
Information Administration (EIA) in $/gallon (EMM_EPMRU_PTE_Y48SE_DPG.)
August 2021 Retail Gas Forecast
Office of Economic and Financial Analysis
Page 26
Page 27
Year DieselAnnual
GrowthGasoline
Annual
Growth
2011 $3.11 - - -
2012 $3.22 3.47% - -
2013 $3.07 -4.57% - -
2014 $2.88 -6.27% $2.82 -
2015 $1.77 -38.49% $2.11 -25.32%
2016 $1.43 -19.40% $1.81 -14.03%
2017 $1.81 26.77% $2.11 16.20%
2018 $2.22 22.40% $2.39 13.45%
2019 $2.05 -7.48% $2.37 -0.84%
2020 $1.32 -35.61% $1.85 -21.94%
2021 $2.20 66.67% $2.60 40.54%
2022 $2.43 10.45% $2.74 5.38%
2023 $2.51 3.29% $2.78 1.46%
2024 $2.58 2.79% $2.85 2.52%
2025 - - - -
2026 - - - -
2027 - - - -
2028 - - - -
2029 - - - -
2030 - - - -
Notes:
1. Forecast diesel values are average annual Tacoma rack price for King County's
ultra-low sulfur diesel purchases.
2. Forecast gasoline values are WA state fuel prices for UNL Regular 9.0 RVP
excluding delivery charges and taxes.
Page 27
August 2021 Diesel & Gasoline Dollar per Gallon Forecasts
Office of Economic and Financial Analysis
Page 28
Tax
YearValue
Annual
Growth
% Change from
July 2021
Forecast
# Change from
July 2021
Forecast2011 479,543 - 0.00% 0
2012 572,643 19.41% 0.00% 0
2013 589,799 3.00% 0.00% 0
2014 436,693 -25.96% 0.00% 0
2015 513,349 17.55% 0.00% 0
2016 532,500 3.73% 0.00% 0
2017 491,769 -7.65% 0.00% 0
2018 421,398 -14.31% 0.00% 0
2019 440,934 4.64% 0.00% 0
2020 638,986 44.92% 0.00% 0
2021 645,569 1.03% -0.15% -988
2022 527,302 -18.32% 0.00% 0
2023 479,914 -8.99% 0.00% 0
2024 474,521 -1.12% 0.00% 0
2025 474,578 0.01% 0.00% 0
2026 477,604 0.64% 0.00% 0
2027 466,405 -2.34% 0.00% 0
2028 471,511 1.09% 0.00% 0
2029 477,461 1.26% 0.00% 0
2030 481,365 0.82% 0.00% 0
Notes:
1. Values listed are the sum of official public records, recorded maps and marriage records.
August 2021 Recorded Documents Forecast
Office of Economic and Financial Analysis
Page 28
Page 29
Tax
YearValue
Annual
Growth
% Change from
July 2021
Forecast
$ Change from
July 2021
Forecast2011 $2,405,747 - 0.00% $0
2012 $1,826,238 -24.09% 0.00% $0
2013 $2,102,642 15.14% 0.00% $0
2014 $2,521,820 19.94% 0.00% $0
2015 $2,437,669 -3.34% 0.00% $0
2016 $2,609,974 7.07% 0.00% $0
2017 $2,731,608 4.66% 0.00% $0
2018 $2,313,241 -15.32% 0.00% $0
2019 $2,486,780 7.50% 0.00% $0
2020 $1,556,791 -37.40% 0.00% $0
2021 $2,170,509 39.42% 2.64% $55,766
2022 $2,469,064 13.76% 0.41% $10,048
2023 $2,734,432 10.75% 0.50% $13,733
2024 $2,199,266 -19.57% 4.50% $94,696
2025 $139,204 -93.67% -8.17% ($12,386)
2026 $105,075 -24.52% -14.46% ($17,761)
2027 $87,695 -16.54% -17.71% ($18,876)
2028 $76,522 -12.74% -17.68% ($16,430)
2029 $76,571 0.06% -17.50% ($16,247)
2030 $77,585 1.33% -23.05% ($23,235)
Notes:
1. Values are tax receipts reported for all taxable gambling activities.
2. Forecasts are impacted by out-year annexations (see appendix).
August 2021 Gambling Tax Forecast
Office of Economic and Financial Analysis
Page 29
Page 30
Tax
YearValue
Annual
Growth
% Change from
July 2021
Forecast
$ Change from
July 2021
Forecast2011 $0 - - $0
2012 $23,736,719 - 0.00% $0
2013 $23,317,378 -1.77% 0.00% $0
2014 $24,453,879 4.87% 0.00% $0
2015 $23,082,630 -5.61% 0.00% $0
2016 $23,228,850 0.63% 0.00% $0
2017 $24,263,242 4.45% 0.00% $0
2018 $24,268,747 0.02% 0.00% $0
2019 $24,438,615 0.70% 0.00% $0
2020 $25,506,633 4.37% 0.00% $0
2021 $25,702,391 0.77% 0.51% $129,282
2022 $25,746,175 0.17% -0.13% ($32,902)
2023 $26,044,253 1.16% -0.14% ($36,612)
2024 $26,364,213 1.23% -0.11% ($30,264)
2025 $26,634,375 1.02% -0.14% ($36,126)
2026 $26,885,001 0.94% -0.14% ($38,216)
2027 $27,120,569 0.88% -0.15% ($40,409)
2028 $27,368,714 0.91% -0.16% ($42,657)
2029 $27,628,631 0.95% -0.16% ($44,963)
2030 $27,899,588 0.98% -0.17% ($47,332)
Notes:
1. Values are tax revenues for cellular (regular and prepaid), landline and VOIP accounts.
2. Actual values are on an accrual basis as listed in EBS, Fund 000001110.
3. Forecast includes the 1% DOR administrative fee.
August 2021 E-911 Tax Forecast
Office of Economic and Financial Analysis
Page 30
Page 31
Tax
YearValue
Annual
Growth
% Change from
July 2021
Forecast
$ Change from
July 2021
Forecast2011 $21,889,467 - 0.00% $0
2012 $21,475,856 -1.89% 0.00% $0
2013 $20,868,553 -2.83% 0.00% $0
2014 $20,992,713 0.59% 0.00% $0
2015 $20,035,786 -4.56% 0.00% $0
2016 $17,563,229 -12.34% 0.00% $0
2017 $19,839,056 12.96% 0.00% $0
2018 $20,836,239 5.03% 0.00% $0
2019 $21,270,218 2.08% 0.00% $0
2020 $20,379,665 -4.19% -1.88% ($389,876)
2021 $25,936,452 27.27% 0.01% $1,731
2022 $23,541,677 -9.23% 3.89% $881,600
2023 $22,262,685 -5.43% 0.01% $2,097
2024 $22,795,740 2.39% -0.05% ($10,868)
2025 $23,087,694 1.28% 0.28% $64,611
2026 $23,533,991 1.93% 0.29% $68,279
2027 $23,808,287 1.17% -0.14% ($33,403)
2028 $24,042,965 0.99% -0.45% ($107,682)
2029 $24,316,159 1.14% -0.51% ($123,837)
2030 $24,556,274 0.99% -0.50% ($122,665)
Notes:
1. Actual values are as recorded in EBS, Fund 000000010, Acct. 31911.
2. The 2020 value reflects a June 1 due date for first half property taxes and the waiving
of the 3% June penalty for late payments.
August 2021 Penalties and Interest on Delinquent Property Taxes Forecast
Office of Economic and Financial Analysis
Page 31
Page 32
Tax
YearValue
Annual
Growth
% Change from
July 2021
Forecast
$ Change from
July 2021
Forecast2011 $278,152,152 - 0.00% $0
2012 $284,318,327 2.22% 0.00% $0
2013 $313,137,887 10.14% 0.00% $0
2014 $320,290,885 2.28% 0.00% $0
2015 $327,660,659 2.30% 0.00% $0
2016 $336,385,866 2.66% 0.00% $0
2017 $346,643,924 3.05% 0.00% $0
2018 $358,276,382 3.36% 0.00% $0
2019 $369,308,535 3.08% 0.00% $0
2020 $379,849,948 2.85% 0.00% $0
2021 $389,618,952 2.57% 0.00% $0
2022 $399,320,108 2.49% -0.23% ($915,768)
2023 $408,589,532 2.32% -0.37% ($1,516,229)
2024 $418,145,830 2.34% -0.41% ($1,721,065)
2025 $427,790,587 2.31% -0.42% ($1,812,356)
2026 $437,492,330 2.27% -0.45% ($1,976,219)
2027 $447,308,095 2.24% -0.48% ($2,155,293)
2028 $457,172,252 2.21% -0.51% ($2,360,431)
2029 $467,156,759 2.18% -0.55% ($2,577,090)
2030 $477,273,278 2.17% -0.58% ($2,799,953)
Notes:
1. Values are total levy amounts and have not been adjusted for undercollections.
2. Limited bond debt service included in CX Levy in 2013 and thereafter.
3. Levy amounts do not reflect forecasted new construction impacts from the TDR/TIF ILA
between the City of Seattle and King County.
Page 32
August 2021 Current Expense Property Tax Forecast
Office of Economic and Financial Analysis
Page 33
Tax
YearValue
Annual
Growth
% Change from
July 2021
Forecast
$ Change from
July 2021
Forecast2011 $5,737,359 - 0.00% $0
2012 $5,838,960 1.77% 0.00% $0
2013 $5,944,036 1.80% 0.00% $0
2014 $6,068,166 2.09% 0.00% $0
2015 $6,196,773 2.12% 0.00% $0
2016 $6,366,874 2.74% 0.00% $0
2017 $6,554,111 2.94% 0.00% $0
2018 $6,762,538 3.18% 0.00% $0
2019 $6,978,846 3.20% 0.00% $0
2020 $7,175,843 2.82% 0.00% $0
2021 $7,371,146 2.72% 0.00% $0
2022 $7,552,456 2.46% -0.23% ($17,551)
2023 $7,726,966 2.31% -0.37% ($28,901)
2024 $7,906,818 2.33% -0.41% ($32,764)
2025 $8,088,435 2.30% -0.43% ($34,533)
2026 $8,271,130 2.26% -0.45% ($37,665)
2027 $8,455,919 2.23% -0.48% ($41,076)
2028 $8,641,578 2.20% -0.52% ($44,947)
2029 $8,829,399 2.17% -0.55% ($49,057)
2030 $9,019,701 2.16% -0.59% ($53,279)
Notes:
1. Values are total levy amounts and have not been adjusted for undercollections.
Page 33
August 2021 Dev. Disabilities & Mental Health Property Tax Forecast
Office of Economic and Financial Analysis
Page 34
Tax
YearValue
Annual
Growth
% Change from
July 2021
Forecast
$ Change from
July 2021
Forecast2011 $2,556,438 - 0.00% $0
2012 $2,601,709 1.77% 0.00% $0
2013 $2,648,529 1.80% 0.00% $0
2014 $2,703,839 2.09% 0.00% $0
2015 $2,761,143 2.12% 0.00% $0
2016 $2,836,936 2.74% 0.00% $0
2017 $2,920,364 2.94% 0.00% $0
2018 $3,013,234 3.18% 0.00% $0
2019 $3,109,616 3.20% 0.00% $0
2020 $3,197,394 2.82% 0.00% $0
2021 $3,284,416 2.72% 0.00% $0
2022 $3,365,204 2.46% -0.23% ($7,820)
2023 $3,442,962 2.31% -0.37% ($12,877)
2024 $3,523,099 2.33% -0.41% ($14,599)
2025 $3,604,024 2.30% -0.43% ($15,387)
2026 $3,685,429 2.26% -0.45% ($16,783)
2027 $3,767,766 2.23% -0.48% ($18,302)
2028 $3,850,492 2.20% -0.52% ($20,027)
2029 $3,934,181 2.17% -0.55% ($21,859)
2030 $4,018,975 2.16% -0.59% ($23,740)
Notes:
1. Values are total levy amounts and have not been adjusted for undercollections.
Page 34
Office of Economic and Financial Analysis
August 2021 Veterans Aid Property Tax Forecast
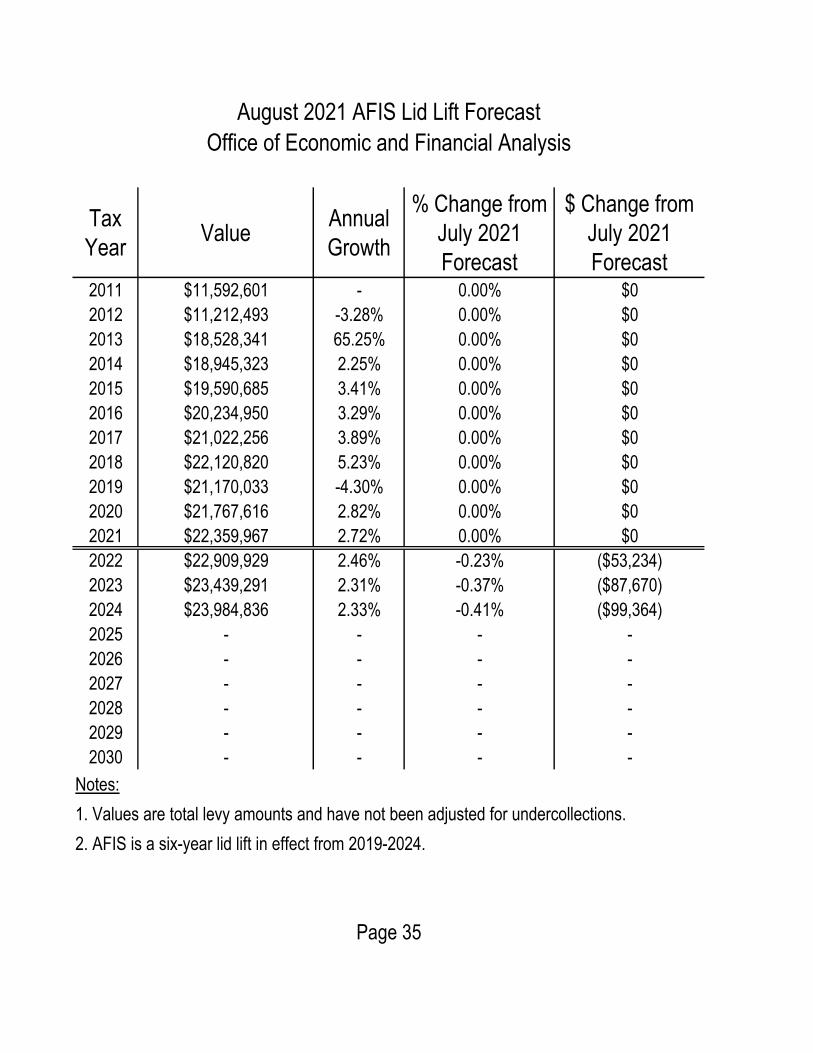
Page 35
Tax
YearValue
Annual
Growth
% Change from
July 2021
Forecast
$ Change from
July 2021
Forecast2011 $11,592,601 - 0.00% $0
2012 $11,212,493 -3.28% 0.00% $0
2013 $18,528,341 65.25% 0.00% $0
2014 $18,945,323 2.25% 0.00% $0
2015 $19,590,685 3.41% 0.00% $0
2016 $20,234,950 3.29% 0.00% $0
2017 $21,022,256 3.89% 0.00% $0
2018 $22,120,820 5.23% 0.00% $0
2019 $21,170,033 -4.30% 0.00% $0
2020 $21,767,616 2.82% 0.00% $0
2021 $22,359,967 2.72% 0.00% $0
2022 $22,909,929 2.46% -0.23% ($53,234)
2023 $23,439,291 2.31% -0.37% ($87,670)
2024 $23,984,836 2.33% -0.41% ($99,364)
2025 - - - -
2026 - - - -
2027 - - - -
2028 - - - -
2029 - - - -
2030 - - - -
Notes:
1. Values are total levy amounts and have not been adjusted for undercollections.
2. AFIS is a six-year lid lift in effect from 2019-2024.
Page 35
August 2021 AFIS Lid Lift Forecast
Office of Economic and Financial Analysis
Page 36
Tax
YearValue
Annual
Growth
% Change from
July 2021
Forecast
$ Change from
July 2021
Forecast2011 $38,260,504 - 0.00% $0
2012 $40,076,386 4.75% 0.00% $0
2013 $41,283,924 3.01% 0.00% $0
2014 $63,633,008 54.14% 0.00% $0
2015 $65,762,804 3.35% 0.00% $0
2016 $67,925,490 3.29% 0.00% $0
2017 $70,568,324 3.89% 0.00% $0
2018 $74,256,788 5.23% 0.00% $0
2019 $78,148,624 5.24% 0.00% $0
2020 $116,827,149 49.49% 0.00% $0
2021 $121,752,034 4.22% 0.00% $0
2022 $132,908,776 9.16% -0.22% ($291,023)
2023 $140,074,134 5.39% 0.02% $28,999
2024 $146,824,382 4.82% -0.02% ($27,444)
2025 $153,815,299 4.76% -0.03% ($47,628)
2026 - - - -
2027 - - - -
2028 - - - -
2029 - - - -
2030 - - - -
Notes:
1. Values are total levy amounts and have not been adjusted for undercollections.
2. Values for 2008-2013 include the Parks Operating & Expansion lid lifts (expired in 2013).
3. The Parks levy is in effect from 2020-2025 and values for 2020 and beyond are based
on a 18.32 cent first year levy rate.
Page 36
Office of Economic and Financial Analysis
August 2021 Parks Lid Lift Forecast
Page 37
Tax
YearValue
Annual
Growth
% Change from
July 2021
Forecast
$ Change from
July 2021
Forecast2011 $15,469,686 - 0.00% $0
2012 $15,882,255 2.67% 0.00% $0
2013 $16,409,992 3.32% 0.00% $0
2014 $16,774,932 2.22% 0.00% $0
2015 $17,350,514 3.43% 0.00% $0
2016 $17,918,894 3.28% 0.00% $0
2017 $18,616,034 3.89% 0.00% $0
2018 $53,265,713 186.13% 0.00% $0
2019 $56,301,126 5.70% 0.00% $0
2020 $59,351,012 5.42% 0.00% $0
2021 $62,489,739 5.29% 0.00% $0
2022 $65,502,554 4.82% -0.23% ($149,372)
2023 $68,653,634 4.81% -0.37% ($251,509)
2024 - - - -
2025 - - - -
2026 - - - -
2027 - - - -
2028 - - - -
2029 - - - -
2030 - - - -
Notes:
1. Values are total levy amounts and have not been adjusted for undercollections.
2. The VSHSL levy is in effect from 2018-2023.
Page 37
August 2021 Veterans, Seniors, and Human Services Lid Lift Forecast
Office of Economic and Financial Analysis
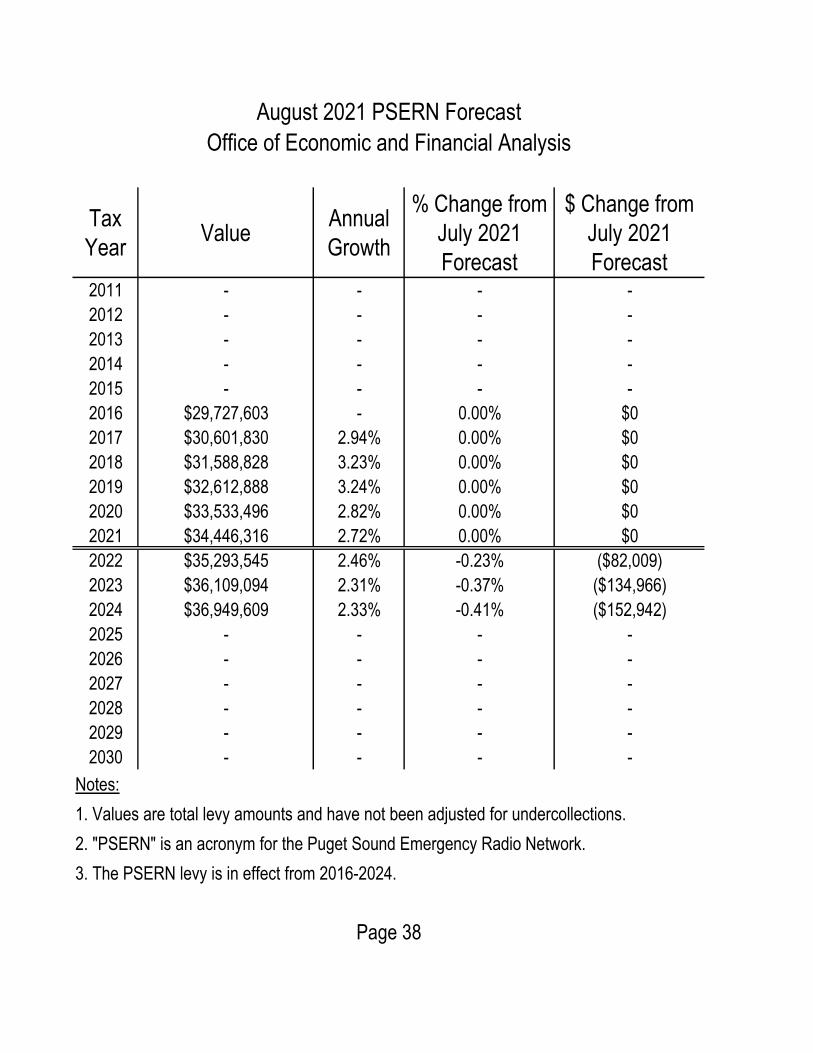
Page 38
Tax
YearValue
Annual
Growth
% Change from
July 2021
Forecast
$ Change from
July 2021
Forecast2011 - - - -
2012 - - - -
2013 - - - -
2014 - - - -
2015 - - - -
2016 $29,727,603 - 0.00% $0
2017 $30,601,830 2.94% 0.00% $0
2018 $31,588,828 3.23% 0.00% $0
2019 $32,612,888 3.24% 0.00% $0
2020 $33,533,496 2.82% 0.00% $0
2021 $34,446,316 2.72% 0.00% $0
2022 $35,293,545 2.46% -0.23% ($82,009)
2023 $36,109,094 2.31% -0.37% ($134,966)
2024 $36,949,609 2.33% -0.41% ($152,942)
2025 - - - -
2026 - - - -
2027 - - - -
2028 - - - -
2029 - - - -
2030 - - - -
Notes:
1. Values are total levy amounts and have not been adjusted for undercollections.
2. "PSERN" is an acronym for the Puget Sound Emergency Radio Network.
3. The PSERN levy is in effect from 2016-2024.
August 2021 PSERN Forecast
Office of Economic and Financial Analysis
Page 38
Page 39
Tax
YearValue
Annual
Growth
% Change from
July 2021
Forecast
$ Change from
July 2021
Forecast2011 - - - -
2012 - - - -
2013 - - - -
2014 - - - -
2015 - - - -
2016 $59,455,206 - - -
2017 $62,379,867 4.92% 0.00% $0
2018 $65,652,750 5.25% 0.00% $0
2019 $69,094,328 5.24% 0.00% $0
2020 $72,426,449 4.82% 0.00% $0
2021 $75,846,946 4.72% 0.00% $0
2022 $133,656,602 76.22% 1.24% $1,639,850
2023 $139,424,934 4.32% 1.10% $1,519,015
2024 $145,458,685 4.33% 1.06% $1,527,994
2025 $151,709,011 4.30% 1.05% $1,575,269
2026 $158,169,866 4.26% 1.02% $1,598,830
2027 $164,867,028 4.23% 0.99% $1,618,101
2028 - - - -
2029 - - - -
2030 - - - -
Notes:
1. Values are total levy amounts and have not been adjusted for undercollections.
2. The first BSFK levy was in effect from 2016 thru 2021.
3. The BSFK levy is in effect from 2022-2027 and is based on a 19 cent first year
levy rate and 1.03 limit factor.
August 2021 Best Start For Kids Forecast
Office of Economic and Financial Analysis
Page 39
Page 40
Tax
YearValue
Annual
Growth
% Change from
July 2021
Forecast
$ Change from
July 2021
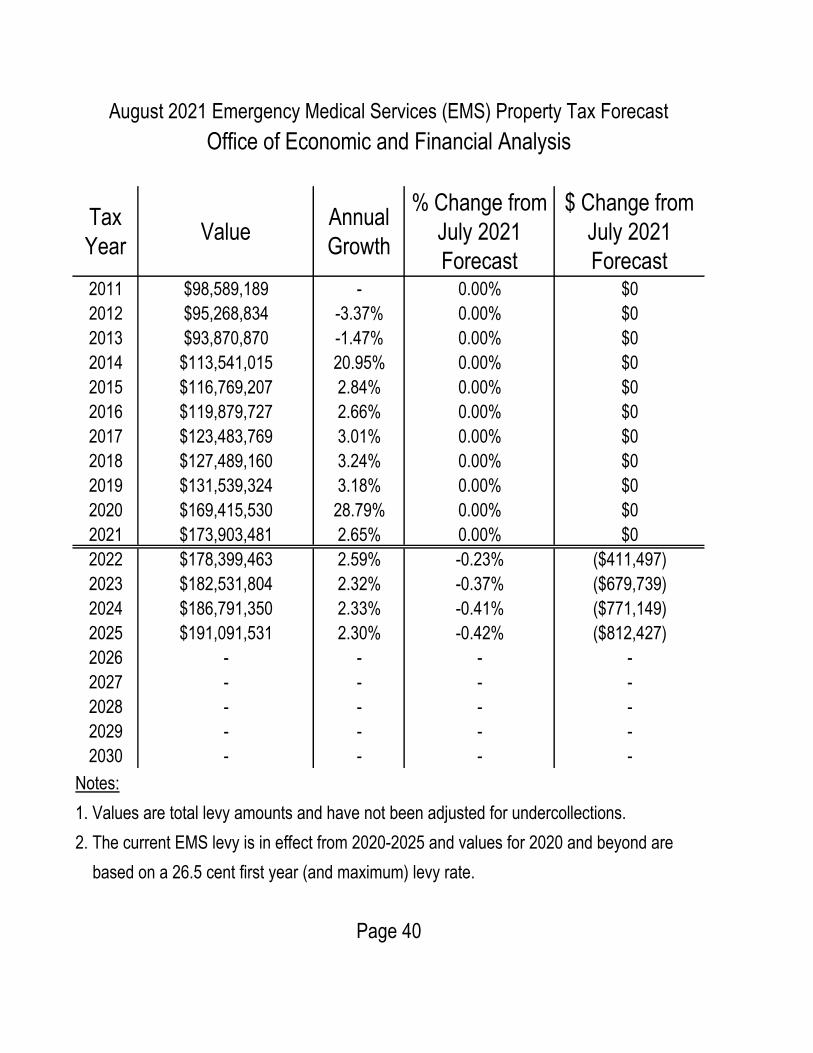
Forecast2011 $98,589,189 - 0.00% $0
2012 $95,268,834 -3.37% 0.00% $0
2013 $93,870,870 -1.47% 0.00% $0
2014 $113,541,015 20.95% 0.00% $0
2015 $116,769,207 2.84% 0.00% $0
2016 $119,879,727 2.66% 0.00% $0
2017 $123,483,769 3.01% 0.00% $0
2018 $127,489,160 3.24% 0.00% $0
2019 $131,539,324 3.18% 0.00% $0
2020 $169,415,530 28.79% 0.00% $0
2021 $173,903,481 2.65% 0.00% $0
2022 $178,399,463 2.59% -0.23% ($411,497)
2023 $182,531,804 2.32% -0.37% ($679,739)
2024 $186,791,350 2.33% -0.41% ($771,149)
2025 $191,091,531 2.30% -0.42% ($812,427)
2026 - - - -
2027 - - - -
2028 - - - -
2029 - - - -
2030 - - - -
Notes:
1. Values are total levy amounts and have not been adjusted for undercollections.
2. The current EMS levy is in effect from 2020-2025 and values for 2020 and beyond are
based on a 26.5 cent first year (and maximum) levy rate.
Page 40
August 2021 Emergency Medical Services (EMS) Property Tax Forecast
Office of Economic and Financial Analysis
Page 41
Tax
YearValue
Annual
Growth
% Change from
July 2021
Forecast
$ Change from
July 2021
Forecast2011 $17,061,273 - 0.00% $0
2012 $17,416,782 2.08% 0.00% $0
2013 $17,566,647 0.86% 0.00% $0
2014 $17,955,638 2.21% 0.00% $0
2015 $18,389,600 2.42% 0.00% $0
2016 $18,877,155 2.65% 0.00% $0
2017 $19,443,654 3.00% 0.00% $0
2018 $20,072,804 3.24% 0.00% $0
2019 $20,712,946 3.19% 0.00% $0
2020 $21,297,118 2.82% 0.00% $0
2021 $21,858,694 2.64% 0.00% $0
2022 $22,398,188 2.47% -0.22% ($48,991)
2023 $22,916,558 2.31% -0.37% ($84,228)
2024 $23,448,653 2.32% -0.43% ($100,095)
2025 $23,991,991 2.32% -0.41% ($98,637)
2026 $24,535,112 2.26% -0.44% ($109,440)
2027 $25,084,709 2.24% -0.48% ($121,149)
2028 $25,633,572 2.19% -0.53% ($135,979)
2029 $26,195,645 2.19% -0.54% ($141,227)
2030 $26,761,450 2.16% -0.59% ($157,701)
Notes:
1. Values are total levy amounts and have not been adjusted for undercollections.
Page 41
Office of Economic and Financial Analysis
August 2021 Conservation Futures Property Tax Forecast
Page 42
Tax
YearValue
Annual
Growth
% Change from
July 2021
Forecast
$ Change from
July 2021
Forecast2012 $73,706,592 - 0.00% $0
2013 $67,537,651 -8.37% 0.00% $0
2014 $71,721,038 6.19% 0.00% $0
2015 $81,182,066 13.19% 0.00% $0
2016 $82,424,494 1.53% 0.00% $0
2017 $87,678,035 6.37% 0.00% $0
2018 $89,353,349 1.91% 0.00% $0
2019 $91,211,126 2.08% 0.00% $0
2020 $92,987,997 1.95% 0.00% $0
2021 $94,573,079 1.70% 0.00% $0
2022 $96,137,113 1.65% -0.05% ($45,346)
2023 $97,645,486 1.57% -0.06% ($57,473)
2024 $99,154,004 1.54% -0.04% ($34,748)
2025 $100,679,837 1.54% 0.00% ($2,759)
2026 $102,196,001 1.51% 0.02% $22,349
2027 $103,751,278 1.52% 0.05% $48,110
2028 $105,290,900 1.48% 0.07% $70,606
2029 $106,877,762 1.51% 0.09% $94,789
2030 $108,352,474 1.38% 0.11% $117,776
Notes:
1. Values are total levy amounts and have not been adjusted for undercollections.
2. The UAL/Roads levy values are affected by annexations (see appendix).
3. Forecast values are total levy amounts and assume large annexations are removed
from unincorporated assessed value prior to setting the levy rates in the annexation year.
August 2021 Unincorporated Area/Roads Property Tax Levy Forecast
Office of Economic and Financial Analysis
Page 42
Page 43
Tax
Year
UAL/Roads
Levy Rate
Annexation
Area
Annexation Area
Assessed Value
UAL/Roads Levy
Annexation
Reduction
2013
2014
2015
2016
2017
2018
2019
2020
2021
2022 $1.65
2023 $1.58
2024 $1.62 North Highline Y $3,214,347,840
2025 $1.65 West Hill $3,051,210,765
2026 $1.74 Fairwood $5,379,091,434
2027 $1.73 East Renton $1,718,395,860
2028 $1.79
North Federal
Way & Lakeland
South
$4,179,293,201
2029 $1.72
2030 $1.66
August 2021 UAL/Roads Property Tax Annexation Addendum
Office of Economic and Financial Analysis
Page 43
Page 44
Tax
YearValue
Annual
Growth
% Change from
July 2021
Forecast
$ Change from
July 2021
Forecast2011 $36,070,313 - 0.00% $0
2012 $36,896,149 2.29% 0.00% $0
2013 $41,346,031 12.06% 0.00% $0
2014 $52,104,009 26.02% 0.00% $0
2015 $53,571,768 2.82% 0.00% $0
2016 $55,124,711 2.90% 0.00% $0
2017 $55,124,711 0.00% 0.00% $0
2018 $57,037,253 3.47% 0.00% $0
2019 $58,404,026 2.40% 0.00% $0
2020 $58,829,811 0.73% 0.00% $0
2021 $58,486,420 -0.58% 0.00% $0
2022 $59,340,077 1.46% -0.23% ($139,245)
2023 $60,117,814 1.31% -0.38% ($227,060)
2024 $60,915,925 1.33% -0.42% ($254,904)
2025 $61,705,991 1.30% -0.43% ($266,036)
2026 $62,482,695 1.26% -0.46% ($287,330)
2027 $63,253,817 1.23% -0.49% ($310,286)
2028 $64,010,088 1.20% -0.52% ($336,209)
2029 $64,761,218 1.17% -0.56% ($363,362)
2030 $65,509,420 1.16% -0.59% ($390,777)
Notes:
1. Values are total levy amounts and have not been adjusted for undercollections.
2. Values for 2022 and beyond assume increases are based on new construction only
(i.e. 1% increase not included).
Page 44
Office of Economic and Financial Analysis
August 2021 Flood District Property Tax Forecast
Page 45
Tax
YearValue
Annual
Growth
% Change from
July 2021
Forecast
$ Change from
July 2021
Forecast2011 $1,183,252 - 0.00% $0
2012 $1,183,252 0.00% 0.00% $0
2013 $1,183,252 0.00% 0.00% $0
2014 $1,183,252 0.00% 0.00% $0
2015 $1,183,252 0.00% 0.00% $0
2016 $1,183,252 0.00% 0.00% $0
2017 $5,769,754 387.62% 0.00% $0
2018 $5,927,796 2.74% 0.00% $0
2019 $6,117,419 3.20% 0.00% $0
2020 $6,290,100 2.82% 0.00% $0
2021 $6,461,231 2.72% 0.00% $0
2022 $6,620,130 2.46% -0.23% ($15,379)
2023 $6,773,098 2.31% -0.37% ($25,328)
2024 $6,930,747 2.33% -0.41% ($28,715)
2025 $7,089,944 2.30% -0.43% ($30,265)
2026 $7,250,085 2.26% -0.45% ($33,011)
2027 $7,412,062 2.23% -0.48% ($36,001)
2028 $7,574,803 2.20% -0.52% ($39,394)
2029 $7,739,438 2.17% -0.55% ($42,996)
2030 $7,906,248 2.16% -0.59% ($46,697)
Notes:
1. Values are total levy amounts and have not been adjusted for undercollections.
August 2021 Marine Levy Property Tax Forecast
Office of Economic and Financial Analysis
Page 45
Page 46
Tax
YearValue
Annual
Growth
% Change from
July 2021
Forecast
$ Change from
July 2021
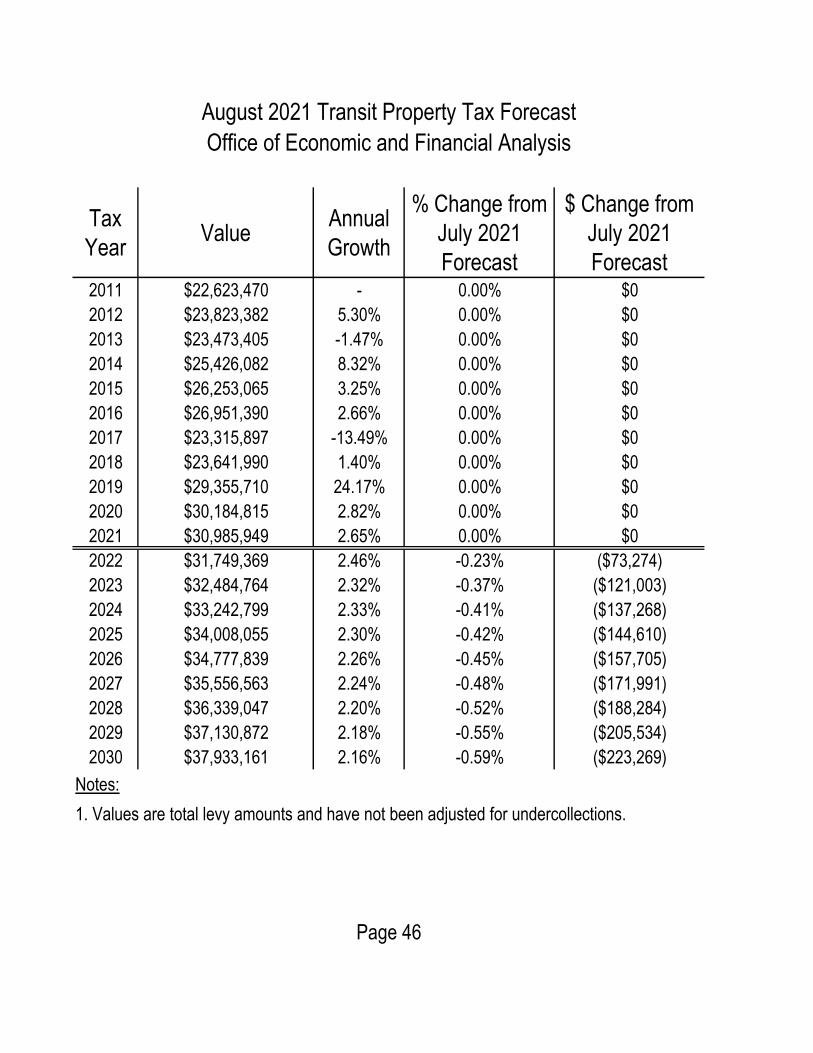
Forecast2011 $22,623,470 - 0.00% $0
2012 $23,823,382 5.30% 0.00% $0
2013 $23,473,405 -1.47% 0.00% $0
2014 $25,426,082 8.32% 0.00% $0
2015 $26,253,065 3.25% 0.00% $0
2016 $26,951,390 2.66% 0.00% $0
2017 $23,315,897 -13.49% 0.00% $0
2018 $23,641,990 1.40% 0.00% $0
2019 $29,355,710 24.17% 0.00% $0
2020 $30,184,815 2.82% 0.00% $0
2021 $30,985,949 2.65% 0.00% $0
2022 $31,749,369 2.46% -0.23% ($73,274)
2023 $32,484,764 2.32% -0.37% ($121,003)
2024 $33,242,799 2.33% -0.41% ($137,268)
2025 $34,008,055 2.30% -0.42% ($144,610)
2026 $34,777,839 2.26% -0.45% ($157,705)
2027 $35,556,563 2.24% -0.48% ($171,991)
2028 $36,339,047 2.20% -0.52% ($188,284)
2029 $37,130,872 2.18% -0.55% ($205,534)
2030 $37,933,161 2.16% -0.59% ($223,269)
Notes:
1. Values are total levy amounts and have not been adjusted for undercollections.
Page 46
Office of Economic and Financial Analysis
August 2021 Transit Property Tax Forecast
Page 47
Tax
YearValue
Annual
Growth
% Change from
July 2021
Forecast
$ Change from
July 2021
Forecast2011 $23,500,000 - 0.00% $0
2012 $22,460,000 -4.43% 0.00% $0
2013 $21,040,000 -6.32% 0.00% $0
2014 $19,630,000 -6.70% 0.00% $0
2015 $11,620,000 -40.80% 0.00% $0
2016 $16,820,000 44.75% 0.00% $0
2017 $16,880,000 0.36% 0.00% $0
2018 $17,300,000 2.49% 0.00% $0
2019 $17,910,000 3.53% 0.00% $0
2020 $13,620,000 -23.95% 0.00% $0
2021 $13,950,000 2.42% 0.00% $0
2022 $17,310,000 24.09% 0.00% $0
2023 $23,510,000 35.82% 0.00% $0
2024 $16,110,000 -31.48% 0.00% $0
2025 $26,910,000 67.04% 0.00% $0
2026 $42,300,000 57.19% 0.00% $0
2027 $62,220,000 47.09% 0.00% $0
2028 $89,340,000 43.59% 0.00% $0
2029 $116,150,000 30.01% 0.00% $0
2030 $123,840,000 6.62% 0.00% $0
Notes:
1. Values are total levy amounts and have been adjusted for undercollections.
2. Values for 2022 and beyond include the estimated amounts to support the new
Harborview Medical Center bonds approved by voters in 2020.
Page 47
August 2021 UTGO Bond Property Tax Forecast
Office of Economic and Financial Analysis
Page 48
Tax Year ValueAnnual
Growth
% Change from
July 2021 Forecast
2011 - - -
2012 - - -
2013 - - -
2014 - - -
2015 1.0401 - 0.00%
2016 1.0302 -0.99% 0.00%
2017 1.0458 1.56% 0.00%
2018 1.0519 0.62% 0.00%
2019 1.0535 0.15% 0.00%
2020 1.0317 -2.18% 0.00%
2021 1.0249 -0.68% 0.00%
2022 1.0770 5.21% 0.00%
2023 1.0408 -3.62% 0.40%
2024 1.0349 -0.59% 0.00%
2025 1.0346 -0.03% 0.00%
2026 1.0335 -0.11% 0.00%
2027 1.0330 -0.05% 0.00%
2028 1.0332 0.01% 0.00%
2029 1.0329 -0.03% 0.00%
2030 1.0326 -0.03% 0.00%
Notes:
1. Values shown are one plus the sum of the growth of STB CPI-W values from June
two-years prior to June of the prior year, and the most recent OEFA King County
population growth forecast for the same period.
August 2021 King County Inflation + Population Index Forecast
Office of Economic and Financial Analysis
Page 48
Page 49
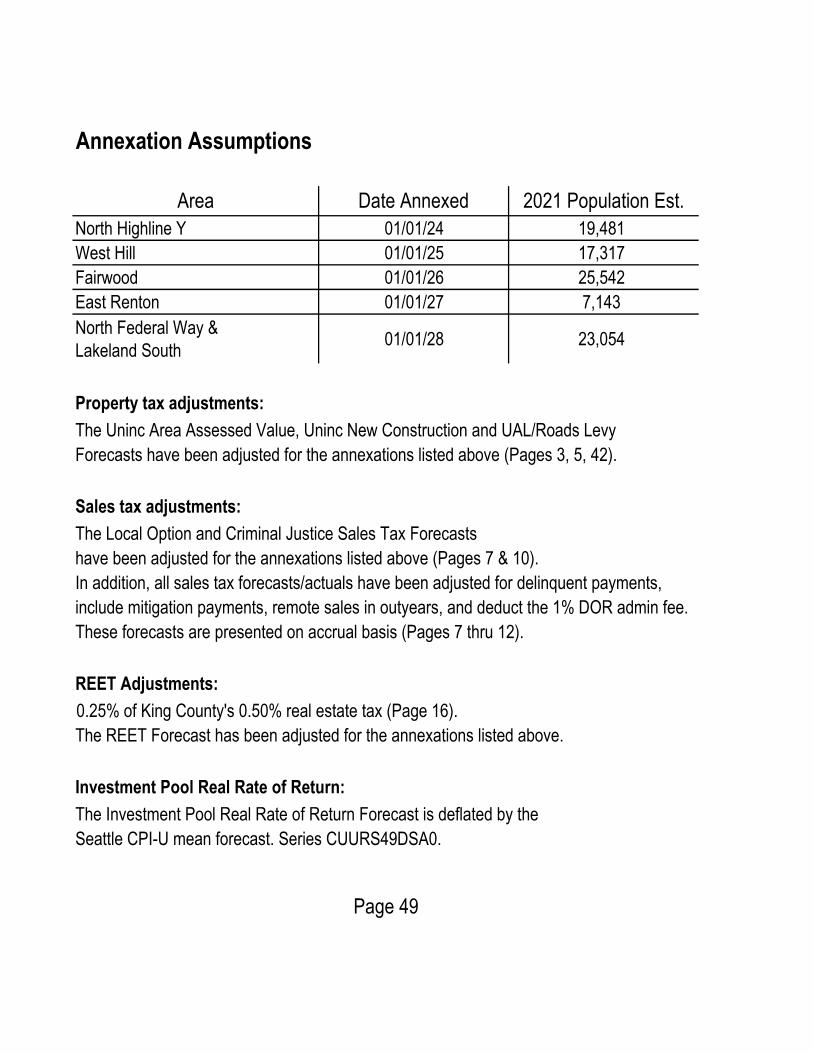
Area Date Annexed 2021 Population Est.
North Highline Y 01/01/24 19,481
West Hill 01/01/25 17,317
Fairwood 01/01/26 25,542
East Renton 01/01/27 7,143
North Federal Way &
Lakeland South01/01/28 23,054
Property tax adjustments:
The Uninc Area Assessed Value, Uninc New Construction and UAL/Roads Levy
Forecasts have been adjusted for the annexations listed above (Pages 3, 5, 42).
Sales tax adjustments:
The Local Option and Criminal Justice Sales Tax Forecasts
have been adjusted for the annexations listed above (Pages 7 & 10).
In addition, all sales tax forecasts/actuals have been adjusted for delinquent payments,
include mitigation payments, remote sales in outyears, and deduct the 1% DOR admin fee.
These forecasts are presented on accrual basis (Pages 7 thru 12).
REET Adjustments:
REET data presents 0.25% of King County's 0.50% real estate tax (Page 16).
The REET Forecast has been adjusted for the annexations listed above.
Investment Pool Real Rate of Return:
The Investment Pool Real Rate of Return Forecast is deflated by the
Seattle CPI-U mean forecast. Series CUURS49DSA0.
Annexation Assumptions
Page 49