13
Forecasting & Replenishment with IBM DIOS Dynamic Inventory Optimization Solution

Forecasting & Replenishment with IBM DIOS
Dynamic Inventory Optimization Solution

2
Retail Business is getting Bigger, Faster, Better ...
My Business is Growing:– More Products
– More Stores
– Higher Sales
My Business is Speeding Up:– Shorter Product Life Cycles
My Competitors are Getting Better:– Lower Margins
– Higher Quality Standards

3
Planning should improve at the same speed
The Retail Planning Dream:– Forecasting
• is done daily for all products in all stores• parameters are continuously adjusted to be optimal• automatically handles trends and seasonalities• properly accounts for all past and future promotions
– Replenishment Planning• is done daily for all products in all stores• parameters are continuously adjusted to be optimal• yields a very high availability at lowest total costs• properly accounts for bundles, franco limits, MOQs, ...
4
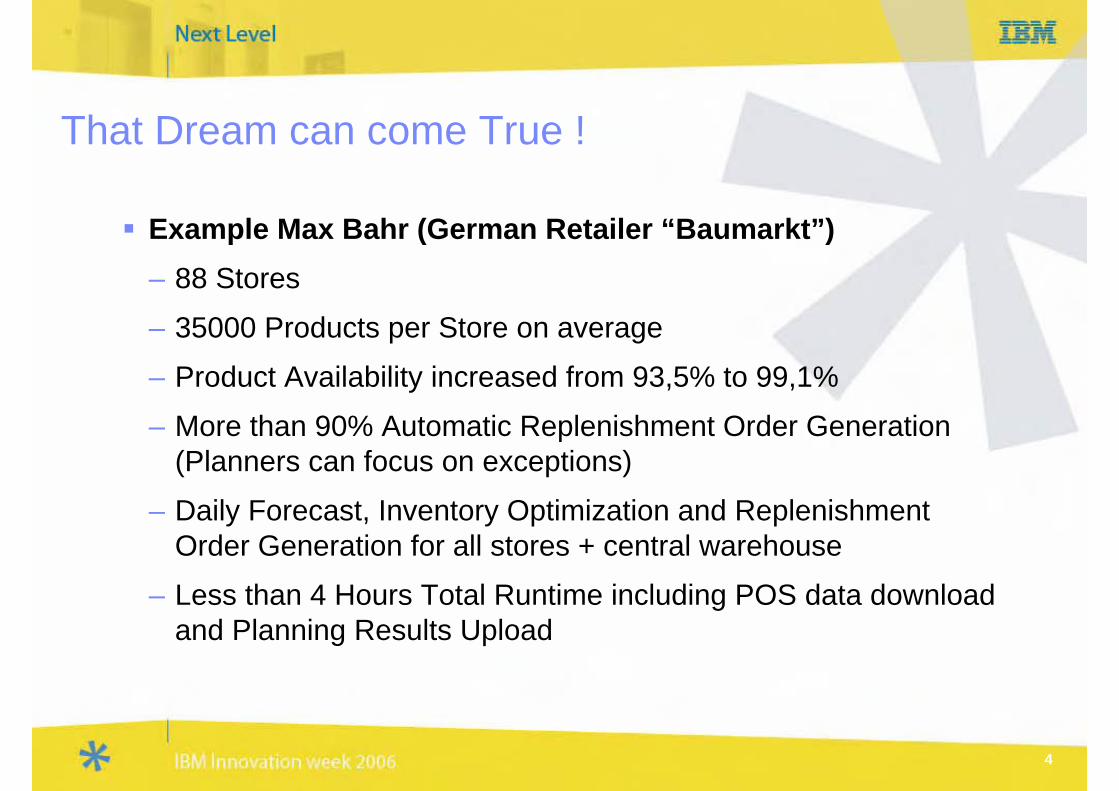
That Dream can come True !
Example Max Bahr (German Retailer “Baumarkt”)– 88 Stores
– 35000 Products per Store on average
– Product Availability increased from 93,5% to 99,1%
– More than 90% Automatic Replenishment Order Generation(Planners can focus on exceptions)
– Daily Forecast, Inventory Optimization and Replenishment Order Generation for all stores + central warehouse
– Less than 4 Hours Total Runtime including POS data download and Planning Results Upload

5
Featuring: IBM Dynamic Inventory Optimization Solution
Joint development IBM Research & IBM Global Business Services since 1998
More than 40 client engagements– Retail, distribution, raw materials, spare parts, CPG, …
– Automotive, electronics, chemical, pharmaceutical, …
Integrations into SAP, Baan and other ERP / legacy systems
Uses Best-of-Breed High-Speed Algorithms for– Forecasting
– Order Quantities
– Safety Stocks

6
DIOS Demand Forecasting
Historical Demand Data
Aggregation Level &Integration Hierarchy
External influences(promotions, new products,…)
Mathematical Forecasting Model

7
DIOS Demand Forecasting
How DIOS calculates demand forecasts:– Uses the outbound transactional data– Supports all common forecasting methods– On the fly data cleansing (e.g. removal of promotion effects)– Individual forecast time buckets for each SKU– Provides Pick Best Forecast including determination of optimal
forecasting parameters– Forecast generation based on rolling forecast buckets
• provides an updated forecast each time a forecast is calculated independent of the size of the time bucket
• fast reaction time even for large time buckets– Variable Forecast Horizons

8
DIOS Demand Forecasting

9
Benefits of Rolling Forecasting Buckets: Fast Reaction Time
06 Jun 2003 19 Mar 2004 21 Dec 2004
10.0
20.0
30.0
40.0
50.0
60.0
#
Day
Qty
12
34
5
Holt's Smoothing w ith trend (alpha = 0.2, beta = 0.7), forecast accuracy: 0.385
06 Jun 2003 19 Mar 2004 20 Dec 2004
10.0
20.0
30.0
40.0
50.0
60.0
#
Day
Qty
1 2 3 4 5
Holt's Smoothing w ith trend (alpha = 0.2, beta = 0.6), forecast accuracy: 0.380
06 Jun 2003 18 Mar 2004 18 Dec 2004
10.0
20.0
30.0
40.0
50.0
60.0
#
Day
Qty
1 2 3 4 5
Holt's Smoothing w ith trend (alpha = 0.2, beta = 0.5), forecast accuracy: 0.390
06 Jun 2003 18 Mar 2004 18 Dec 2004
10.0
20.0
30.0
40.0
50.0
#
Day
Qty
1 2 3 4 5
Holt's Smoothing w ith trend (alpha = 0.2, beta = 0.6), forecast accuracy: 0.365 Day 1demand: 0
Day 2demand: 2
Day 3demand: 0
Day 4demand: 0
Gradual built-up of a local negative trend
10
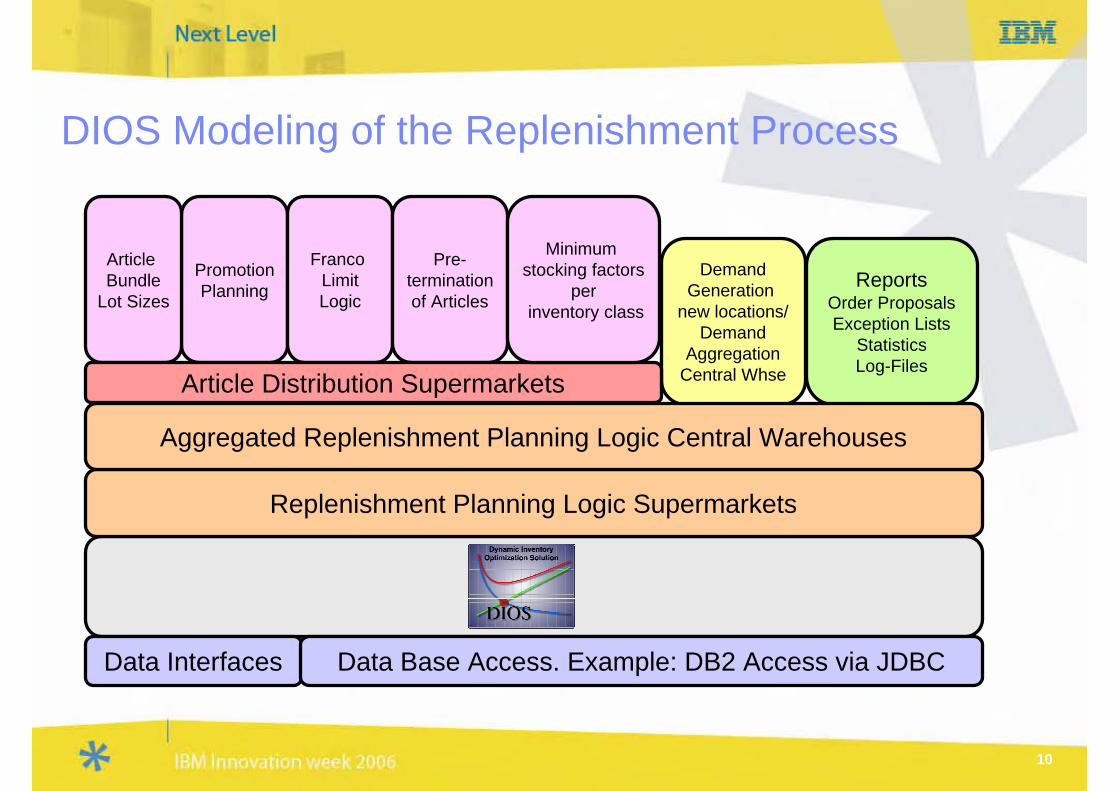
DIOS Modeling of the Replenishment Process
Data Interfaces Data Base Access. Example: DB2 Access via JDBC
PromotionPlanning
Franco LimitLogic
Pre-terminationof Articles
ReportsOrder ProposalsException Lists
StatisticsLog-Files
Replenishment Planning Logic Supermarkets
Article Bundle
Lot Sizes
DemandGeneration
new locations/Demand
AggregationCentral Whse
Aggregated Replenishment Planning Logic Central Warehouses
Article Distribution Supermarkets
Minimum stocking factors
perinventory class
11
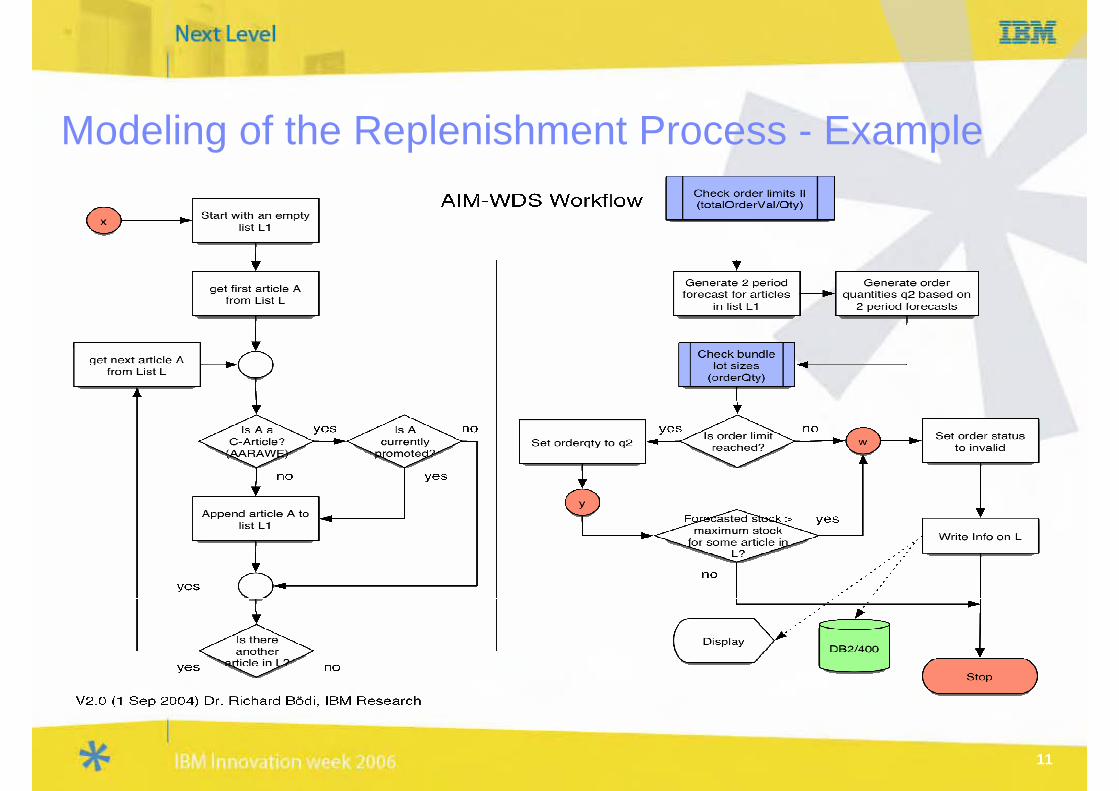
Modeling of the Replenishment Process - Example

12
Continuous Inventory Management
Inventory should be managed continuously– Smoother replenishment
– Use of rolling forecast buckets
– Forecast errors have less impact
– Forecasts can be renewed and adjusted every day
– Faster reaction to changes in demand
Continuous inventory Management not only means the use of a reorder point but also continuously updating all replenishment parameters for each SKU

13
DIOS 3-Phase Realization Approach
Phase 1: Assessment 6-8 Weeks– 1-2 Stores / Warehouses– Setting Optimal Replenishment Parameters– Evaluation of Savings Potential– Typical Finding: 20% – 25% Cost SavingsPhase 2: Pilot 2-4 Months– 2-3 Stores / Warehouses– Confirm Savings PotentialsPhase 3: Roll-Out 4-8 Months– Depends on number of locations– Integration into existing ERP System– Education & Training of Planners / Buyers– Parameters Settings for all Locations– Guidance, Support, Change Management


