Forecasting Uncertainty and Risk of Financial Development in Pakistan: Fan Chart Approach Muhammad Nadeem Khan * Abstract: This study is conducted to forecast the components of financial development of Pakistan for the period of 2016 to 2025. These components include M2, DCP, DCPB, and MC. Originally, 36 years’ time series data taken from 1980 to 2015. The present study is very much different in that it uses a newly developed technique that is Fan chart. It is used to forecast with given level of uncertainty. Risk information of upside and downside is another feature of fan chart approach. The results of M2 indicate that, downside risk at the start of forecasting in the year of 2016 initially, but after that it will start upside risk in the reaming period of 2017 to highest value in 2025. This shows that, chances of increase in value of M2 in the upcoming forecasted period. On the other side forecasted value of DCP will have an upside risk during the all period. Whereas, value of DCPB indicates a downside risk in the all forecasted period of 2016 to 2025. At the same time, value of MC has a downside risk in the all-time period. On the basis of these findings, it is recommended to policy makers to keep a diligent eye on risk uncertainty. Downside risk is an alarming situation in the coming years or the uncertainty around to the extent of that change. Upside risk should also be considered by the policy maker to make better decisions. Keywords: Forecasting, uncertainty, risk, financial development, fan chart. Introduction and Literature Review Financial development is a cost of obtaining information, administration of agreements and facilitation of financial transactions for the development of actual forms of financial con- tracts, markets and intermediaries (Levine, 2005). It includes institutions, policy, macroe- conomic factors and to some extent legal and regulatory framework that allows extended credit to private sector. It is basically, overcoming “costs” that is the part of financial sys- tem. When that happens, then the cost of getting information, contracts implementation, financial transaction and other related costs reduced. Recently, financial matters have been improved interest significantly among the other developments. It is also putting developing commitments on the part of economic frameworks in financial development. Research on the part of financial progress in development can be followed back by Bagehot (1873) who emphasizes that vast and efficient capital markets in England improved asset distribution towards more beneficial project. Developing nations that had been meeting surges in for- * Department of Business Administration, IQRA University, Karachi, Pakistan. E-mail: [email protected]This paper is a part of Muhammad Nadeem Khan’s Ph.D. Dissertation 156 South Asian Journal of Management Sciences Vol: 12(2): 156-172, 2018 DOI: 10.21621/sajms.2018122.03
Transcript
Forecasting Uncertainty and Risk of Financial Development in
Pakistan: Fan Chart Approach
Muhammad Nadeem Khan ∗
Abstract: This study is conducted to forecast the components of financial development ofPakistan for the period of 2016 to 2025. These components include M2, DCP, DCPB, and MC.Originally, 36 years’ time series data taken from 1980 to 2015. The present study is very muchdifferent in that it uses a newly developed technique that is Fan chart. It is used to forecast withgiven level of uncertainty. Risk information of upside and downside is another feature of fan chartapproach. The results of M2 indicate that, downside risk at the start of forecasting in the yearof 2016 initially, but after that it will start upside risk in the reaming period of 2017 to highestvalue in 2025. This shows that, chances of increase in value of M2 in the upcoming forecastedperiod. On the other side forecasted value of DCP will have an upside risk during the all period.Whereas, value of DCPB indicates a downside risk in the all forecasted period of 2016 to 2025.At the same time, value of MC has a downside risk in the all-time period. On the basis of thesefindings, it is recommended to policy makers to keep a diligent eye on risk uncertainty. Downsiderisk is an alarming situation in the coming years or the uncertainty around to the extent of thatchange. Upside risk should also be considered by the policy maker to make better decisions.
Keywords: Forecasting, uncertainty, risk, financial development, fan chart.
Introduction and Literature Review
Financial development is a cost of obtaining information, administration of agreements andfacilitation of financial transactions for the development of actual forms of financial con-tracts, markets and intermediaries (Levine, 2005). It includes institutions, policy, macroe-conomic factors and to some extent legal and regulatory framework that allows extendedcredit to private sector. It is basically, overcoming “costs” that is the part of financial sys-tem. When that happens, then the cost of getting information, contracts implementation,financial transaction and other related costs reduced. Recently, financial matters have beenimproved interest significantly among the other developments. It is also putting developingcommitments on the part of economic frameworks in financial development. Research onthe part of financial progress in development can be followed back by Bagehot (1873) whoemphasizes that vast and efficient capital markets in England improved asset distributiontowards more beneficial project. Developing nations that had been meeting surges in for-
∗Department of Business Administration, IQRA University, Karachi, Pakistan.E-mail: [email protected] paper is a part of Muhammad Nadeem Khan’s Ph.D. Dissertation
156
South Asian Journal of Management SciencesVol: 12(2): 156-172, 2018DOI: 10.21621/sajms.2018122.03
South Asian Journal of Management Sciences
eign capital inflows have needed to encounter a decrease in a similar capital inflow amid thecurrent international financial crisis (Kose, Prasad, & Taylor, 2009). Uncertainty in finan-cial streams has restored the long-standing verbal confrontation about whether the benefitsof recent financial structure far offset their development reliefs (Rodrik & Subramanian,2009).
Many studies have been conducted in the financial development to check the uncer-tainty and risk. Holod, Kitsul, and Torna (2017) investigated the mitigation of the bankrisk that was linked with the activities of trading if the capital requirements of the marketrisk based that was implemented in the year 1998. Valencia (2017) attempted to investigateand propose a capital channel of bank through which shocks of uncertainty can impact thefluctuations in macroeconomic variables. The author had first presented a dynamic modelof bank in which a mechanism of self-insurance contributed towards inducing the bank inorder to accumulate the capital with the increase in uncertainty. Asongu, Koomson, andTchamyou (2017) examined the impact of time-dynamic uncertainty globalization in thefinancial institutions on the development of financial sector in total 53 nations of Africa forthe years 2000 to the year 2011. Caldara, Fuentes-Albero, Gilchrist, and Zakrajsek (2016)had utilized an approach of penalty function within the framework of structural vectorautoregressive (SVAR) for the purpose of examining the association between uncertaintyin the economy and conditions of financial intermediaries as well as to examine the effect ofthese shocks to the economy of the nations. The findings of this research study showed thatshocks in the financial institutions have a significant and adverse impact on the differentoutcomes of the economy and also that these shocks are key sources of the fluctuations inthe business cycles since after the year 1980. Kitagawa and Okuda (2016) examined theforecasting in the management, idiosyncratic risk as well as environment of the informa-tion due to the fact that management forecast are considered to be a key source of theinformation in the stock market of Japan. The authors in this research study had utilizedan error of management forecast as a proxy variable for the quality of disclosure as well asidiosyncratic risk. Black, Correa, Huang, and Zhou (2016) had measured the systematicrisks of the banks of Europe due to the fact that banks of Europe have become a key risksource to the financial markets of the world during the crisis in the financial markets aswell as attention to the sector of banking has increased during the crisis of sovereign debt.One of the interesting results of the findings is that, traditional ratio of the capital ade-quacy as well as implicit support of the government resulted in the increase in systematicrisk. Bekaert, Hoerova, and Duca (2013) attempted to propose a first and important char-acterization of the dynamic association between uncertainty of risk as well as monetarypolicy through utilizing the framework of simple autoregressive model. Research study byMoshirian (2011) attempted to analyze the global crisis in the financial sector with regardto the different processes of the development in market as well as regulations. This paperdiscussed that in the absence of the framework of financial market that was integratedglobally, by the past and regulations in the present time period in reaction to the globalas well as national financial crisis failed to resolve the cross border arbitrage of the regu-lations. Bloom, Bond, and Van Reenen (2007) indicated that with the inclusion of partialirreversibility, uncertainty contributed toward reducing the investment’s responsiveness tothe shocks of demand.
157
South Asian Journal of Management Sciences
A number of studies have also been conducted in Pakistan linked financial developmentwith economic development, growth, and energy consumption. Rizwan-ul Hassan, Imam,and Salim (2017) analysis the impact of financial development on economic growth inPakistan. Javid and Sharif (2016) investigate the relationship of environmental Kuznetscurve and financial development in Pakistan. Komal and Abbas (2015) examine the linkageof economic growth, financial development and energy consumption in Pakistan. Kakar,Khilji, and Khan (2011) also examine the empirical relationship of financial developmentand energy consumption in Pakistan. Abbasi and Riaz (2016) pointed the relationshipof influence of economic and financial development on CO2 emission in the context of anemerging economy of Pakistan. Gokmenoglu, Amin, and Taspinar (2015) found the long-run relationship among financial development, international trade and economic growth inPakistan. Shahbaz and Rahman (2012) investigate the dynamics of financial development,imports, foreign direct investment and economic growth in Pakistan. Khan, Qayyum,Sheikh, and Siddique (2005) discussed the relationship between the financial depth andeconomic growth both in short and long-run. Shahbaz, Ahmed, and Ali (2008) find therelationship of stock market development and economic growth in Pakistan. Developingcountries also facing financial constraints, due to restrictions of giving loan imposed by thebanks to their favorable groups of investors and companies (Shahbaz et al., 2008).
The above mentioned discussion of the literatures follows two approaches. The firstapproach estimates bank risk that was linked with market risks, association between uncer-tainty and financial intermediaries, the effects of these shocks to the economy of the coun-try, and also time-dynamic uncertainty globalization in the financial institutions (Holodet al., 2017; Valencia, 2017; Asongu et al., 2017; Kitagawa & Okuda, 2016; Bekaert et al.,2013). Whereas, the second approach estimates the relationship between financial devel-opment, economic growth, and energy consumption by using the conventional unit roottest, cointegration and causality tests (Rizwan-ul Hassan et al., 2017; Javid & Sharif, 2016;Komal & Abbas, 2015; Kakar et al., 2011; Abbasi & Riaz, 2016; Gokmenoglu et al., 2015;Shahbaz et al., 2008; Shahbaz & Rahman, 2012). As these studies found that, financialdevelopment has significant impact on economic development and it is also seen that fi-nancial institutions play very important role in distribution and allocation of finance todifferent sectors of economy, which encourage economic activity. Preceding discussion intwo approaches were all about to cover different features of financial development, but ithad never been forecasted to see that how will be the financial services industry progressover the next decade is the substance of this study. Therefore, the objective of this studyis to forecast the components of financial development of Pakistan for the period of 2016to 2025. In time series analysis Autoregressive Integrated Moving Average (ARIMA) isused to forecast future trends. In ARIMA forecasting, residual uncertainty is considered,whereas uncertainty in parameters is overlooked (Fuller & Hasza, 1981; De Luna, 2000).On the contrary, density forecast contemplates parameters’ uncertainty (Akram, Binning,& Maih, 2016). The present study is very much different in that it uses a newly developedtechnique that is Fan chart. It is used to forecast with given level of range of uncertainty.Forecasting can be done by some other methods such as moving average and exponentialsmoothing but, Fan chart results provides range of uncertainties that would be useful tomake favorable strategies for policy makers. Recently, Castillo (2016); Dowd, Blake, and
158
South Asian Journal of Management Sciences
Cairns (2016); Jawaid, Waheed, et al. (2017); Fukac and Kirkby (2017) used for forecastingthis newly developed Fan chart technique.
Data and Methodology
This study is conducted to forecast the components of financial development of Pakistanfor the period of 2016 to 2025. These components include M2, DCP, DCPB, and MC.Originally, 36 years’ time series data taken from 1980 to 2015. All these data taken fromthe World Development Indicators (WDI), and from Handbook of Statistics of Pakistan.Software used to run the fan chart is Eviews-9.
Contextual Discussion- Measuring Financial Development
Financial crisis of 2008 is considered to be the worst disaster since 1930 of the Great De-pression. It was seen the failure of financial giants like Lemhan Brothers, Bears Stearmsetc. It was results of series of mortgage crisis occurred at that time. Different channelsspread the crisis through financial incorporation and trade (Latif, Nazar, Shah, & Shaikh,2011). During the previous few years, numerous countries have undergone serious cashand saving money emergencies, creating an amazing toll on their economies, especially indeveloping countries business sector. In many time, the banking sector keeping moneymore than 20 percent of GDP and output decreases in the wake of emergency have beenas large as 14 percent (Reinhart, 2000). Worldwide Financial Crisis troubled Pakistan’sfinancial development to some extent. Pakistan faces foremost of accomplishing macroeco-nomic consistency and pushing economy on track. Worldwide Financial Crisis has broughtconsideration towards numerous issues. Thus, there is a great deal of study required infinancial development of Pakistan.
This part of study starts from little explanation of the components of financial develop-ment. Many researchers used money supply as financial sector depth (Giedeman, Compton,et al., 2009; Anwar & Cooray, 2012). In addition to money supply several researchers alsoused ratio of domestic credit to private sector to GDP as measures of financial activities(Beck & Levine, 2004; Cole, Moshirian, & Wu, 2008). After these two primary measures,the effect of stock market also considered as an important tool of financial development(Atje & Jovanovic, 1993). The most common proxy used for stock market developmentis market capitalization ratio (Shen & Lee, 2006; Chakraborty, 2010; J.-S. Yu, Hassan, &Sanchez, 2012). Therefore, in this study these financial development measures used namelybroad money supply (M2), domestic credit to private sector (DCP) domestic credit to pri-vate sector by banks (DCPB), and market capitalization (MC). Reason for selection ofthese variables are availability of data and also importance of these variables very vital foran emerging country such as Pakistan’s economy.
Broad Money Supply (M2)
Three types of monetary combinations are used in Pakistan to measure and formulatemoney related policies. These three types include namely M0, M1 and M2. The M2 is
159
South Asian Journal of Management Sciences
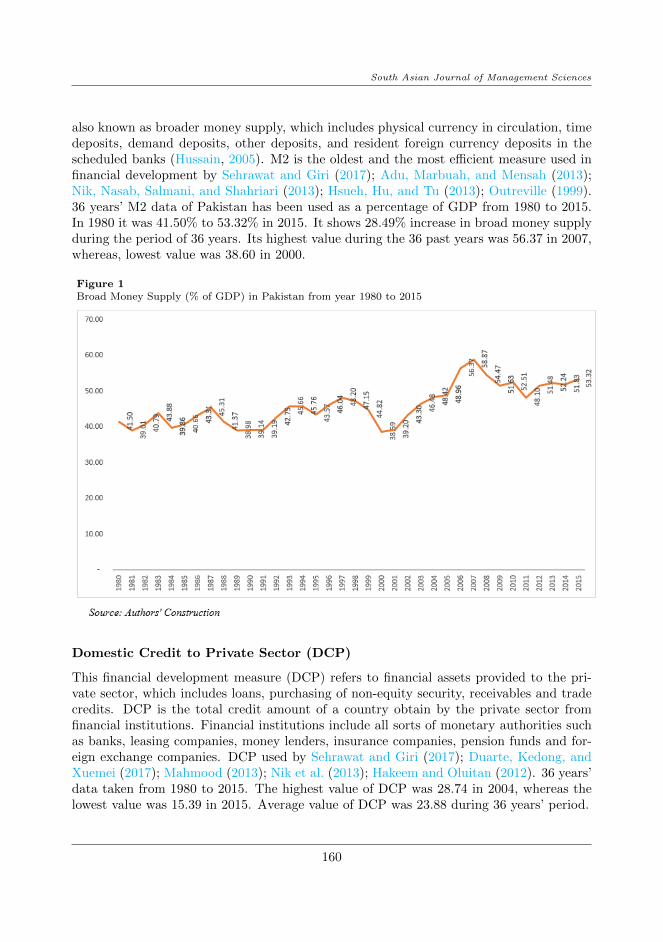
also known as broader money supply, which includes physical currency in circulation, timedeposits, demand deposits, other deposits, and resident foreign currency deposits in thescheduled banks (Hussain, 2005). M2 is the oldest and the most efficient measure used infinancial development by Sehrawat and Giri (2017); Adu, Marbuah, and Mensah (2013);Nik, Nasab, Salmani, and Shahriari (2013); Hsueh, Hu, and Tu (2013); Outreville (1999).36 years’ M2 data of Pakistan has been used as a percentage of GDP from 1980 to 2015.In 1980 it was 41.50% to 53.32% in 2015. It shows 28.49% increase in broad money supplyduring the period of 36 years. Its highest value during the 36 past years was 56.37 in 2007,whereas, lowest value was 38.60 in 2000.
Figure 1Broad Money Supply (% of GDP) in Pakistan from year 1980 to 2015
Domestic Credit to Private Sector (DCP)
This financial development measure (DCP) refers to financial assets provided to the pri-vate sector, which includes loans, purchasing of non-equity security, receivables and tradecredits. DCP is the total credit amount of a country obtain by the private sector fromfinancial institutions. Financial institutions include all sorts of monetary authorities suchas banks, leasing companies, money lenders, insurance companies, pension funds and for-eign exchange companies. DCP used by Sehrawat and Giri (2017); Duarte, Kedong, andXuemei (2017); Mahmood (2013); Nik et al. (2013); Hakeem and Oluitan (2012). 36 years’data taken from 1980 to 2015. The highest value of DCP was 28.74 in 2004, whereas thelowest value was 15.39 in 2015. Average value of DCP was 23.88 during 36 years’ period.
160
South Asian Journal of Management Sciences
Figure 2Domestic credit to private sector (% of GDP) in Pakistan from year 1980 to 2015
Domestic Credit to Private Sector by Banks (DCPB)
Another measure of financial development is domestic credit to private sector by bank as apercentage of GDP (DCPB). It refers to the resources provided by other depository institu-tions except central banks. Its value very much close to DCP, but sometimes DCPB valuechanges due to different resources used to calculate the value. DCPB used by Sehrawatand Giri (2017); Nik et al. (2013); Mahmood (2013). 36 years’ annual data from 1980to 2015 used to forecast the financial development of Pakistan. DCPB highest value was28.74 in 2004 and the lowest value was 15.31 in 2015.
Market Capitalization (MC)
Market capitalization is another measure of assessing the financial development in thecountry. It represents the total value of all the outstanding stocks based on current marketprice. Calculation is based on current market price multiply with the company’s sharesoutstanding. Atje and Jovanovic (1993) started to investigate the stock market as finan-cial development measure in country. After that proxy of stock market have been usingas market capitalization (MC) by Shen and Lee (2006); Chakraborty (2010); Valickova,Havranek, and Horvath (2015); J.-S. Yu et al. (2012).
161
South Asian Journal of Management Sciences
Figure 3Domestic credit to private sector by banks (% of GDP) in Pakistan from year 1980 to 2015
MC value of Pakistan Stock Exchange (PSE) was taken from 1993 to 2015. The majorissue of selecting this time period is the availability of data. MC value starting from Rs.355,604 million was in 1993 to move up to Rs. 7,421,032 million in 2015. During of thisperiod, it has been almost 2000% increase in the value of market capitalization of PSE.
PSE is considered smaller in size but very significant and more active stock market thanother stock market globally. In 2002 PSE stand as the best performing stock market. Oneof the reason of this, recent political and macroeconomic improvements are considered toexpand market liquidity and give higher capital additions to speculators. The other viewis that this abnormal state of exchanging is revealing of short term dealers who exploit arare carry forward exchanging course of action (Iqbal, 2012).
Fan Chart
Economic forecasting generally faces the issue of vulnerability. It’s not possible for anyoneto anticipate forthcoming activities with perfect confidence, since it is constantly certain invarious expectations and a range of positive and negative threats. The reservation is one ofthe crucial reasons of poor results and which may be the key cause of disappointments inforecasting. In spite of the fact that estimating philosophies have grown mostly, the issueof insecurity has not been settled in financial forecasting.
162
South Asian Journal of Management Sciences
Figure 4Market capitalization in Pakistan from year 1993 to 2015
Fan chart technique is useful for making economic forecasting, and it was first timeused in monetary policy of Bank of England for inflation prediction published in 1963.Subsequently, usefulness of fan chart has been increased in forecasting other economicelements such as predicting of GDP growth rate and other indicators. Similarly, fan charthas also been used for forecasting of world economic growth by international monetaryfund (IMF) since 2006. In Pakistan, Jawaid et al. (2017) have used the same methodfor forecasting Pakistan’s regional trade. Accordingly, in this study we used fan charttechnique (Kannan & Elekdag, 2009) for forecasting of growth in components of financialdevelopment (M2, DCP, DCPB, and MC) for the period of 2016 to 2025.
Steps involve in constructing of fan chart for growth of components of FDI are asfollows:
1. Calculation of growth estimate for M2, DCP, DCPB, and MC (denoted as π)
2. Parameter of uncertainty is calculated as historic estimate error variance (indicatedby επ)
3. Pearson Skewness indicator is calculated (denoted as Ωπ ) for construction of skewedfan chart
4. The confidence level (µ) i.e. 90 percent, 60 percent and 30 percent used to be revealedin the fan chart.
5. Established parameters are known as Skewness (Ωπ) and variance (επ), which cate-gorized distribution of factors of the 2 portion normal spreading i.e. the mean (µ)
163
South Asian Journal of Management Sciences
which signifies the dominant calculation and the left-hand and right-hand averagedeviation as (∂1 and ∂2) respectively for the said distribution.
Moreover, function of density of 2-piece normal distribution is presented as follows:Identical mean (µ) and changed deviations (∂1 and ∂2) arranged separate side is presentedas:
f(π) = Zexp
− (y − µ)2
2∂22
for π ≤ µ (1)
f(π) = Zexp
− (y − µ)2
2∂22
for π > µ (2)
Where
Z =
√2(∂1 + ∂2)−1
√π
(3)
At this point µ denotes the method of spreading if λ∂1 6= λ∂2 (i.e. spreading is skewed).Below are the equations which signify mean, variance and Skewness of two-portion standardspreading individually
S(π) = µ+2
π(λ∂1 − λ∂2) (4)
T (π) = λ∂1λ∂2 +
(1− 2
π
)(λ∂2 − λ∂1)2 (5)
γ(π) =2
π(λ∂2 − λ∂1)
[(4
π− 1
)(λ∂2 − λ∂1)2 + λ∂1λ∂2
](6)
Where S (π), T(π) and γ(π) symbolize the mean, variance and skewness of 2- portionstandard spreading individually. Blix and Sellin (1998) explained the skewness of 2- portionstandard distribution, which is calculated as follows:
γ(π) =
√2
π(λ∂2 − λ∂1) (7)
For construction of fan chart, the idea of Skewness of 2- section standard spreadingmake simpler calculation of λ∂1 and λ∂2. Next, value of λ∂1 and λ∂2 can be found fromT(π) and γ(π).
By substituting λ∂1 in with T(π) and λ∂2 with γ(π) we find the following equation:
λ∂21 +
√2
πγy λ∂1 −
[(1− π
2
)γ2y + λ∂2y
]= 0 (8)
164
South Asian Journal of Management Sciences
In the above equation gammay and λ∂y are used to estimate skewness and variance of2- section standard spreading respectively. After determining ofλ∂1 the other side of thestandard deviation λ∂1 can be defined as follows:
γ(y) =
√2
π(λ∂2 − λ∂1) (9)
6. The nearby confidence interval of each point for M2, DCP, DCPB, and MC growthestimate could be developed for every level of confidence (%), through explaining for
z1 = µ− λ∂1λ∂2
(z2 − µ) (10)
z2 = µ− λ∂2ω−1 1 + %
2(11)
Where ω−1(0 < ω−1 < 1) is the contrary of average standard spreading. Camilleri andVella (2015); H. Yu (2011) discussed in more detail of these procedures. All the data takenform world bank and handbook of statistics of Pakistan economy.
Empirical Results
This section provides the data structure, analysis, measurement, characteristics and mod-eling in order to highlight useful information.
Fan Chart Analysis
This segment provides the data analysis with respect of forecasting of components of fi-nancial development namely M2, DCP, DCPB, and MC in Pakistan.
From Figure 5 and also Table 1 represents the fan chart analysis of M2. It is noticeablethat, the average growth rate of M2 during the period of 2016 to 2025 would be 48.76percent.
Skewness result shows downside risk at the start of forecasting in the year of 2016initially, but after that it will start upside risk in the reaming period of 2017 to highestvalue in 2025. This shows that, chances of increase in value of M2 in the upcomingforecasted period.
Figure 5Fan Chart of Broad Money Supply Growth Rate
Figure 6 and Table 2 reports the forecasted value of DCP. The average growth rate ofDCP expected to be -1.106 percent during the period of 2016 to 2025. Forecasted value ofSkewness will have an upside risk during the all period. Negative growth in DCP could beinstability of economic and political environment, which increases the risk. In this scenariotendency of borrowing may be decreased by household and private sector to start newventure, which decrease the growth of DCP.
Figure 6Fan Chart of Domestic Credit to Private Growth Rate
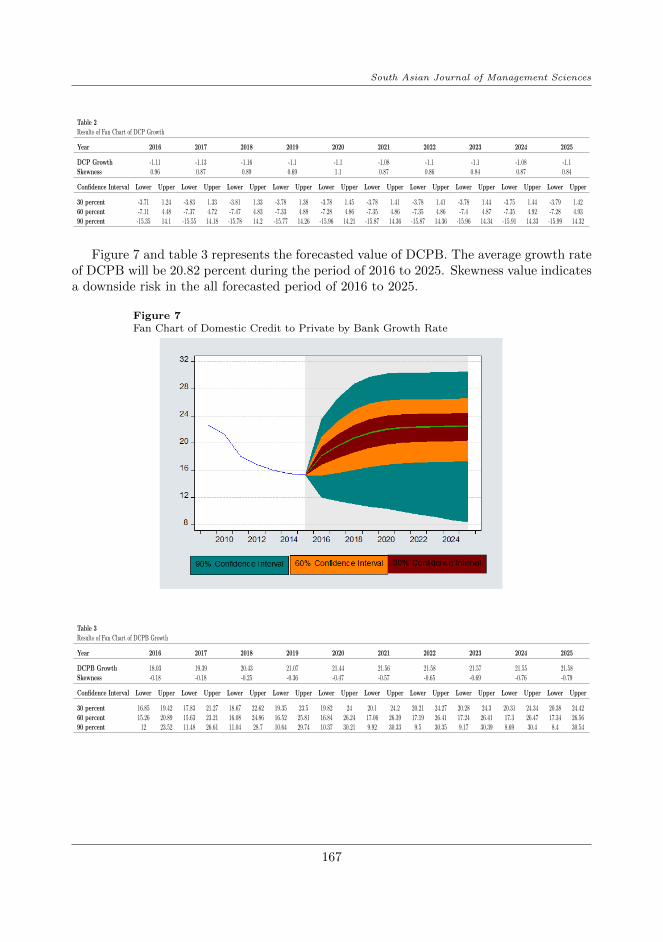
Figure 7 and table 3 represents the forecasted value of DCPB. The average growth rateof DCPB will be 20.82 percent during the period of 2016 to 2025. Skewness value indicatesa downside risk in the all forecasted period of 2016 to 2025.
Figure 7Fan Chart of Domestic Credit to Private by Bank Growth Rate
Last forecasted value of MC is showing in Figure 8 and Table 4. Average growth rateof MC will be 23.96 percent during the period of 2016 to 2025.Whereas value of Skewnesshas a downside risk in the same time period.
Figure 8Fan Chart of Market Capitalization Growth Rate
Table 4Results of Fan Chart of Market Capitalization Growth
This study is conducted to forecast the components of financial development of Pakistanfor the period of 2016 to 2025. These components include M2, DCP, DCPB, and MC.Originally, 36 years’ time series data taken from 1980 to 2015. The present study is verymuch different in that it uses a newly developed technique that is Fan chart. It is used toforecast with given level of rang of uncertainty. Risk information of upside and downsideis another feature of fan chart approach.
The results of M2 indicate that, downside risk at the start of forecasting in the yearof 2016 initially, but after that it will start upside risk in the reaming period of 2017 tohighest value in 2025. This shows that, chances to increase in value of M2 in the upcomingforecasted period. On the other side forecasted value of DCP will have an upside risk during
168
South Asian Journal of Management Sciences
the all period. Whereas, value of DCPB indicates a downside risk in the all forecastedperiod of 2016 to 2025. At the same time, value of MC has a downside risk in the all-timeperiod. These results also propose a reasonable consideration of uncertainty linked withall the forecasted components of FDI. On the basis of these findings, it is recommended topolicy makers to keep a diligent eye on downside risk of DCPB and MC. Downside risk isan alarming situation in the coming years or the uncertainty around to the extent of thatchange. Upside risk should also be considered by the policy maker for DCP. Upside risk isthe uncertainty with opportunity of improvement in the future. The policy implications isto control and retain the downside risk in the context of market capitalization of Pakistan.Whereas, growth of MC is 23.69 percent in the forecasted period of 2016-2025.
The policy implication of this investigation is consequently clear. It is evident to builda strong monetary policy to strengthen the features of central bank and also put effortscarefully to increase competitive financial environment in the market. Side by side, to ex-tend the financial division, upgrade the intensity of money and capital markets, constructsolid institutional and administrative system that will make capital mobility to incorporatefinancial system in a country. The central bank should also provide the conducive environ-ment to encourage financial inclusion to develop financial development in a country. Thiswill provide less risky financial environment in the country.
Therefore, this research is comprehended as a directorial step towards enhanced prac-tice and further empirical research in this field. The above discussed risk and uncertaintyis one of the area of research, but further analysis of different regions or groups’ financialdevelopment could be done. This study is done on the component of financial develop-ment, therefore it will help to analysis these component?s role to calculate the financialdevelopment.
169
South Asian Journal of Management Sciences
References
Abbasi, F., & Riaz, K. (2016). CO2 emissions and financial development in an emergingeconomy: An augmented VAR approach. Energy Policy , 90 , 102–114.
Adu, G., Marbuah, G., & Mensah, J. T. (2013). Financial development and economicgrowth in Ghana: Does the measure of financial development matter? Review ofDevelopment Finance, 3 (4), 192–203.
Akram, Q. F., Binning, A., & Maih, J. (2016). Joint prediction bands for macroeconomicrisk management.
Anwar, S., & Cooray, A. (2012). Financial development, political rights, civil liberties andeconomic growth: Evidence from South Asia. Economic Modelling , 29 (3), 974–981.
Asongu, S. A., Koomson, I., & Tchamyou, V. S. (2017). Financial globalisation un-certainty/instability is good for financial development. Research in InternationalBusiness and Finance, 41 , 280–291.
Atje, R., & Jovanovic, B. (1993). Stock markets and development. European EconomicReview , 37 (2-3), 632–640.
Bagehot, W. (1873). Lombard street: A description of the money market. Scribner,Armstrong & Company.
Beck, T., & Levine, R. (2004). Stock markets, banks, and growth: Panel evidence. Journalof Banking & Finance, 28 (3), 423–442.
Bekaert, G., Hoerova, M., & Duca, M. L. (2013). Risk, uncertainty and monetary policy.Journal of Monetary Economics, 60 (7), 771–788.
Black, L., Correa, R., Huang, X., & Zhou, H. (2016). The systemic risk of European banksduring the financial and sovereign debt crises. Journal of Banking & Finance, 63 ,107–125.
Blix, M., & Sellin, P. (1998). Uncertainty bands for inflation forecasts (Tech. Rep.).Sveriges Riksbank Working Paper No 65.
Bloom, N., Bond, S., & Van Reenen, J. (2007). Uncertainty and investment dynamics.The Review of Economic Studies, 74 (2), 391–415.
Caldara, D., Fuentes-Albero, C., Gilchrist, S., & Zakrajsek, E. (2016). The macroeconomicimpact of financial and uncertainty shocks. European Economic Review , 88 , 185–207.
Camilleri, G., & Vella, K. (2015). Interpolating forecast errors for assess-ing uncertaintyin macroeconomic fore-casts: An analysis for malta.
Castillo, M. A. (2016). Template for external sustainability assessment (Tech. Rep.).Inter-American Development Bank.
Chakraborty, I. (2010). Financial development and economic growth in India: An analysisof the post-reform period. South Asia Economic Journal , 11 (2), 287–308.
Cole, R. A., Moshirian, F., & Wu, Q. (2008). Bank stock returns and economic growth.Journal of Banking & Finance, 32 (6), 995–1007.
De Luna, X. (2000). Prediction intervals based on autoregression forecasts. Journal of theRoyal Statistical Society: Series D (The Statistician), 49 (1), 87–93.
Dowd, K., Blake, D., & Cairns, A. J. (2016). The myth of methuselah and the uncertaintyof death: The mortality fan charts. Risks, 4 (3), 1–7.
170
South Asian Journal of Management Sciences
Duarte, L. d. R. V., Kedong, Y., & Xuemei, L. (2017). The relationship between fdi,economic growth and financial development in cabo verde. International Journal ofEconomics and Finance, 9 (5), 132.
Fukac, M., & Kirkby, R. (2017). Accounting for uncertainty in public debt targets. Aus-tralian Economic Review , 50 (1), 89–102.
Fuller, W. A., & Hasza, D. P. (1981). Properties of predictors for autoregressive timeseries. Journal of the American Statistical Association, 76 (373), 155–161.
Giedeman, D., Compton, R., et al. (2009). A note on finance, inflation, and economicgrowth. Economics Bulletin, 29 (2), 749–759.
Gokmenoglu, K. K., Amin, M. Y., & Taspinar, N. (2015). The relationship among inter-national trade, financial development and economic growth: The case of Pakistan.Procedia Economics and Finance, 25 , 489–496.
Hakeem, M., & Oluitan, O. (2012). Financial development and human capital in SouthAfrica: A time-series approach. Research in Applied Economics, 4 (3), 18–38.
Holod, D., Kitsul, Y., & Torna, G. (2017). Market risk-based capital requirements, tradingactivity, and bank risk. Journal of Banking & Finance.
Hsueh, S.-J., Hu, Y.-H., & Tu, C.-H. (2013). Economic growth and financial development inAsian countries: A bootstrap panel granger causality analysis. Economic Modelling ,32 , 294–301.
Hussain, F. (2005). Monetary aggregates in Pakistan: Theoretical and empirical under-pinnings.
Iqbal, J. (2012). Stock market in pakistan: An overview. Journal of Emerging MarketFinance, 11 (1), 61–91.
Javid, M., & Sharif, F. (2016). Environmental Kuznets curve and financial developmentin Pakistan. Renewable and Sustainable Energy Reviews, 54 , 406–414.
Jawaid, S. T., Waheed, A., et al. (2017). Uncertainty and risk analysis of Pakistan’sregional trade: Fan chart approach. Journal of Management Sciences, 4 (1), 55–81.
Kakar, Z. K., Khilji, B. A., & Khan, M. J. (2011). Financial development and energyconsumption: Empirical evidence from Pakistan. International Journal of Trade,Economics and Finance, 2 (6), 469–471.
Kannan, P., & Elekdag, S. (2009). Incorporating market information into the constructionof the fan chart (No. 9-178). International Monetary Fund.
Khan, M. A., Qayyum, A., Sheikh, S. A., & Siddique, O. (2005). Financial developmentand economic growth: The case of Pakistan. The Pakistan Development Review ,819–837.
Kitagawa, N., & Okuda, S. (2016). Management forecasts, idiosyncratic risk, and theinformation environment. The International Journal of Accounting , 51 (4), 487–503.
Komal, R., & Abbas, F. (2015). Linking financial development, economic growth andenergy consumption in Pakistan. Renewable and Sustainable Energy Reviews, 44 ,211–220.
Kose, M. A., Prasad, E. S., & Taylor, A. D. (2009). Thresholds in the process of interna-tional financial integration (Vol. 30) (No. 1). The World Bank.
Latif, A., Nazar, M. S., Shah, M. Z., & Shaikh, F. M. (2011). Global financial crisis:Macroeconomic linkage to Pakistan’s agriculture. Asian Social Science, 7 (7), 90.
171
South Asian Journal of Management Sciences
Levine, R. (2005). Finance and growth: Theory and evidence. Handbook of EconomicGrowth, 1 , 865–934.
Mahmood, A. (2013). Impact of financial development on economic growth of pakistan.Abasyn Journal of Social Sciences, 6 (2), 106–116.
Moshirian, F. (2011). The global financial crisis and the evolution of markets, institutionsand regulation. Journal of Banking & Finance, 35 (3), 502–511.
Nik, H., Nasab, Z., Salmani, Y., & Shahriari, N. (2013). The relationship between financialdevelopment indicators and human capital in Iran. Management Science Letters,3 (4), 1261–1272.
Outreville, J. F. (1999). Financial development, human capital and political stability.United Nations Conference on Trade and Development..
Reinhart, C. M. (2000). Mirage of floating exchange rates. American Economic Review ,90 (2), 65–70.
Rizwan-ul Hassan, M., Imam, S. G., & Salim, S. (2017). Analyzing the effects of financialdevelopment on economic growth: Empirical evidence from Pakistan through PCAapproach. Abasyn University Journal of Social Sciences, 10 (2).
Rodrik, D., & Subramanian, A. (2009). Why did financial globalization disappoint? IMFStaff Papers, 56 (1), 112–138.
Sehrawat, M., & Giri, A. (2017). An empirical relationship between financial developmentindicators and human capital in some selected Asian countries. International Journalof Social Economics, 44 (3), 337–349.
Shahbaz, M., Ahmed, N., & Ali, L. (2008). Stock market development and economicgrowth: ARDL causality in Pakistan. International Research Journal of Financeand Economics, 14 (1), 182–195.
Shahbaz, M., & Rahman, M. M. (2012). The dynamic of financial development, imports,foreign direct investment and economic growth: cointegration and causality analysisin Pakistan. Global Business Review , 13 (2), 201–219.
Shen, C.-H., & Lee, C.-C. (2006). Same financial development yet different economicgrowth: Why? Journal of Money, Credit and Banking , 38 (7), 1907–1944.
Valencia, F. (2017). Aggregate uncertainty and the supply of credit. Journal of Banking& Finance, 81 , 150–165.
Valickova, P., Havranek, T., & Horvath, R. (2015). Financial development and economicgrowth: A meta-analysis. Journal of Economic Surveys, 29 (3), 506–526.
Yu, H. (2011). Uncertainty and risk analysis of the langrun Chinese GDP forecast: Fancharts revisited. China Economic Journal , 4 (2-3), 81–104.
Yu, J.-S., Hassan, M. K., & Sanchez, B. (2012). A re-examination of financial development,stock markets development and economic growth. Applied Economics, 44 (27), 3479–3489.