49
TRANSPORTATION RESEARCH BOARD @NASEMTRB #TRBwebinar Forecasting Zero Emission Vehicles: Fleet Scenarios & Emissions Implications June 30, 2020 1:00-3:00 PM Eastern
TRANSPORTATION RESEARCH BOARD
@NASEMTRB#TRBwebinar
Forecasting Zero Emission Vehicles: Fleet Scenarios &
Emissions ImplicationsJune 30, 2020
1:00-3:00 PM Eastern
The Transportation Research Board
has met the standards and
requirements of the Registered
Continuing Education Providers
Program. Credit earned on completion
of this program will be reported to
RCEP. A certificate of completion will
be issued to participants that have
registered and attended the entire
session. As such, it does not include
content that may be deemed or
construed to be an approval or
endorsement by RCEP.
PDH Certification Information:
•2 Professional Development Hours (PDH) – see follow-up email for instructions•You must attend the entire webinar to be eligible to receive PDH credits•Questions? Contact Reggie Gillum at [email protected]
#TRBwebinar
Learning Objectives
#TRBwebinar
1. Identify different ZEV adoption models in the U.S.
2. Discuss how different fleet scenarios will effect emissions
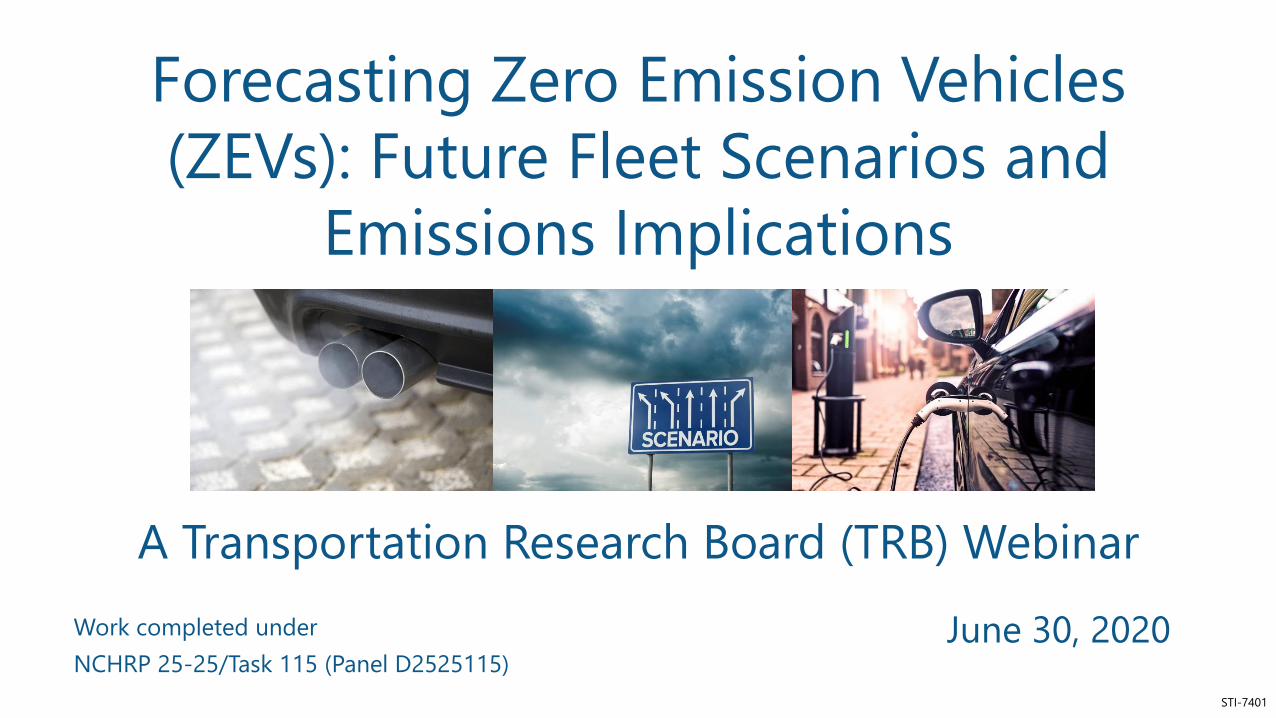
Forecasting Zero Emission Vehicles
(ZEVs): Future Fleet Scenarios and
Emissions Implications
A Transportation Research Board (TRB) Webinar
June 30, 2020
STI-7401
Work completed under
NCHRP 25-25/Task 115 (Panel D2525115)
Research Organizations: Louis Berger U.S. Inc. and Sonoma Technology, Inc. (STI)
2
Garnet Erdakos, PhD (Principal Investigator, STI)
Shih Ying Chang, PhD (STI)
Douglas Eisinger, PhD (Senior Advisor, STI)
Adrienne Heller, AICP, ENV SP (formerly Louis Berger/WSP)
Heather Unger, LEED AP, ENV SP (Louis Berger/WSP)
NCHRP Senior Program OfficerAnn M. Hartell, PhD
Author Acknowledgments
3
• Rick Baker, Eastern Research Group, Inc.
• John Davies, Federal Highway Administration (Liaison)
• Jeffrey R. Lidicker, California Air Resources Board
• Jane Jie Lin, University of Illinois – Chicago
• Natalie Ries, Minnesota Department of Transportation
• Melissa Savage, American Association of State Highway and Transportation Officials (Liaison)
• Lubna Shoaib, East West Gateway Council of Government
• Colleen M. Turner, Maryland Department of Transportation
• Benjamin P. VanGessel, U.S. Environmental Protection Agency
The research team also thanks Dr. Song Bai of the Bay Area Air Quality Management District for his input on the research
approach used in this study. In addition, appreciation goes to John Davies of the U.S. Federal Highway Administration, Dr.
Zhenhong Lin of the Oak Ridge National Laboratory, and Andrew Breck of the Volpe National Transportation Systems Center,
for their assistance regarding use of the MA3T model.
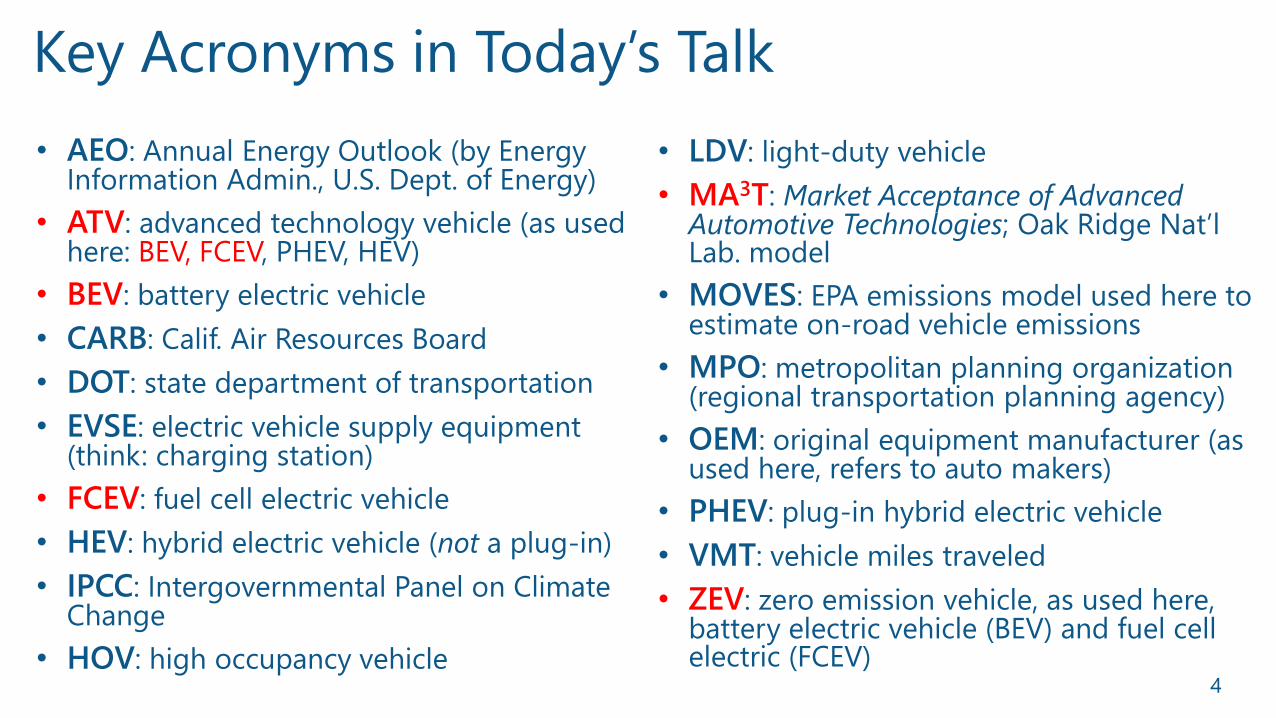
Key Acronyms in Today’s Talk
4
• AEO: Annual Energy Outlook (by Energy Information Admin., U.S. Dept. of Energy)
• ATV: advanced technology vehicle (as used here: BEV, FCEV, PHEV, HEV)
• BEV: battery electric vehicle
• CARB: Calif. Air Resources Board
• DOT: state department of transportation
• EVSE: electric vehicle supply equipment (think: charging station)
• FCEV: fuel cell electric vehicle
• HEV: hybrid electric vehicle (not a plug-in)
• IPCC: Intergovernmental Panel on Climate Change
• HOV: high occupancy vehicle
• LDV: light-duty vehicle
• MA3T: Market Acceptance of Advanced Automotive Technologies; Oak Ridge Nat’l Lab. model
• MOVES: EPA emissions model used here to estimate on-road vehicle emissions
• MPO: metropolitan planning organization (regional transportation planning agency)
• OEM: original equipment manufacturer (as used here, refers to auto makers)
• PHEV: plug-in hybrid electric vehicle
• VMT: vehicle miles traveled
• ZEV: zero emission vehicle, as used here, battery electric vehicle (BEV) and fuel cell electric (FCEV)
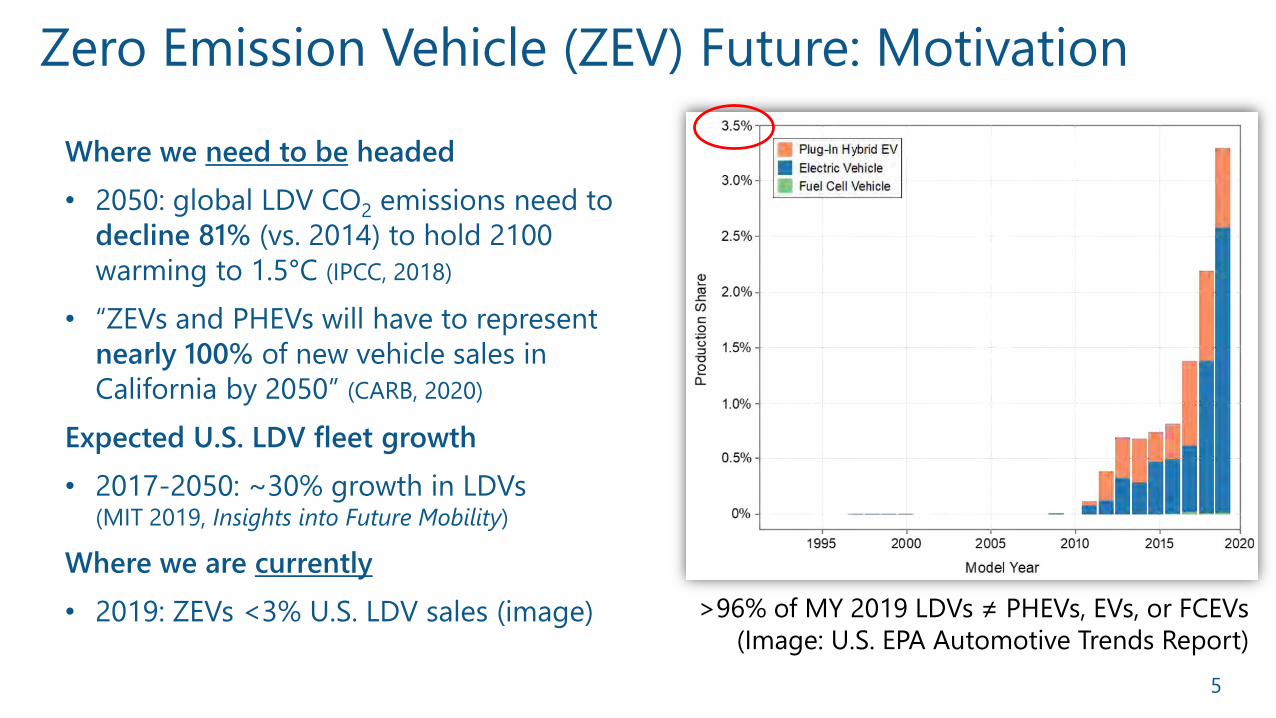
Zero Emission Vehicle (ZEV) Future: Motivation
Where we need to be headed
• 2050: global LDV CO2 emissions need to
decline 81% (vs. 2014) to hold 2100
warming to 1.5°C (IPCC, 2018)
• “ZEVs and PHEVs will have to represent
nearly 100% of new vehicle sales in
California by 2050” (CARB, 2020)
Expected U.S. LDV fleet growth
• 2017-2050: ~30% growth in LDVs (MIT 2019, Insights into Future Mobility)
Where we are currently
• 2019: ZEVs <3% U.S. LDV sales (image) >96% of MY 2019 LDVs ≠ PHEVs, EVs, or FCEVs
(Image: U.S. EPA Automotive Trends Report)
5
Learning Objective
6
• Describe how to support efforts to promote adoption of
ZEVs in the U.S.
Project Tasks
• Brief literature review
• Develop ZEV adoption analysis scenarios
• Assess emissions reductions
Outline
7
• Key findings from the literature review
• Rationale for using the MA3T model
• Guiding principles for development and selection of scenarios
• ZEV adoption scenarios
• Modeled ZEV population increases
• Modeled emissions reductions
• Implications and future research suggestions
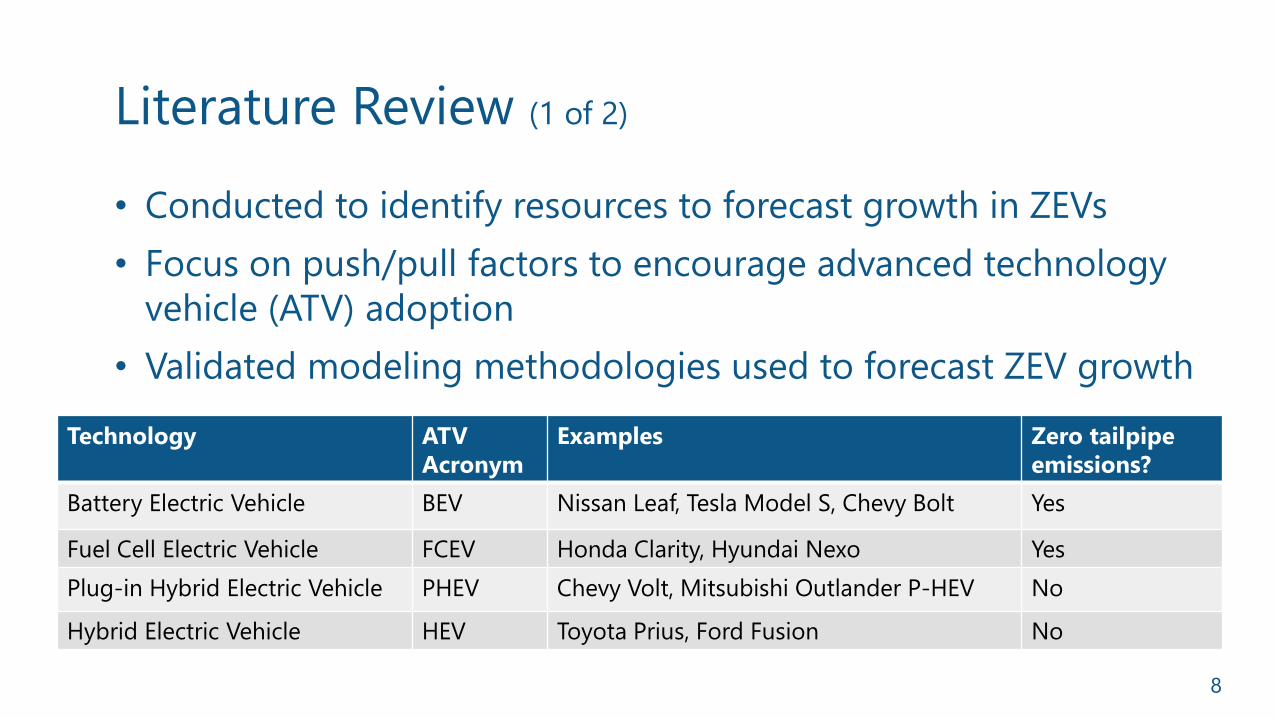
Literature Review (1 of 2)
8
Technology ATV
Acronym
Examples Zero tailpipe
emissions?
Battery Electric Vehicle BEV Nissan Leaf, Tesla Model S, Chevy Bolt Yes
Fuel Cell Electric Vehicle FCEV Honda Clarity, Hyundai Nexo Yes
Plug-in Hybrid Electric Vehicle PHEV Chevy Volt, Mitsubishi Outlander P-HEV No
Hybrid Electric Vehicle HEV Toyota Prius, Ford Fusion No
• Conducted to identify resources to forecast growth in ZEVs
• Focus on push/pull factors to encourage advanced technology
vehicle (ATV) adoption
• Validated modeling methodologies used to forecast ZEV growth
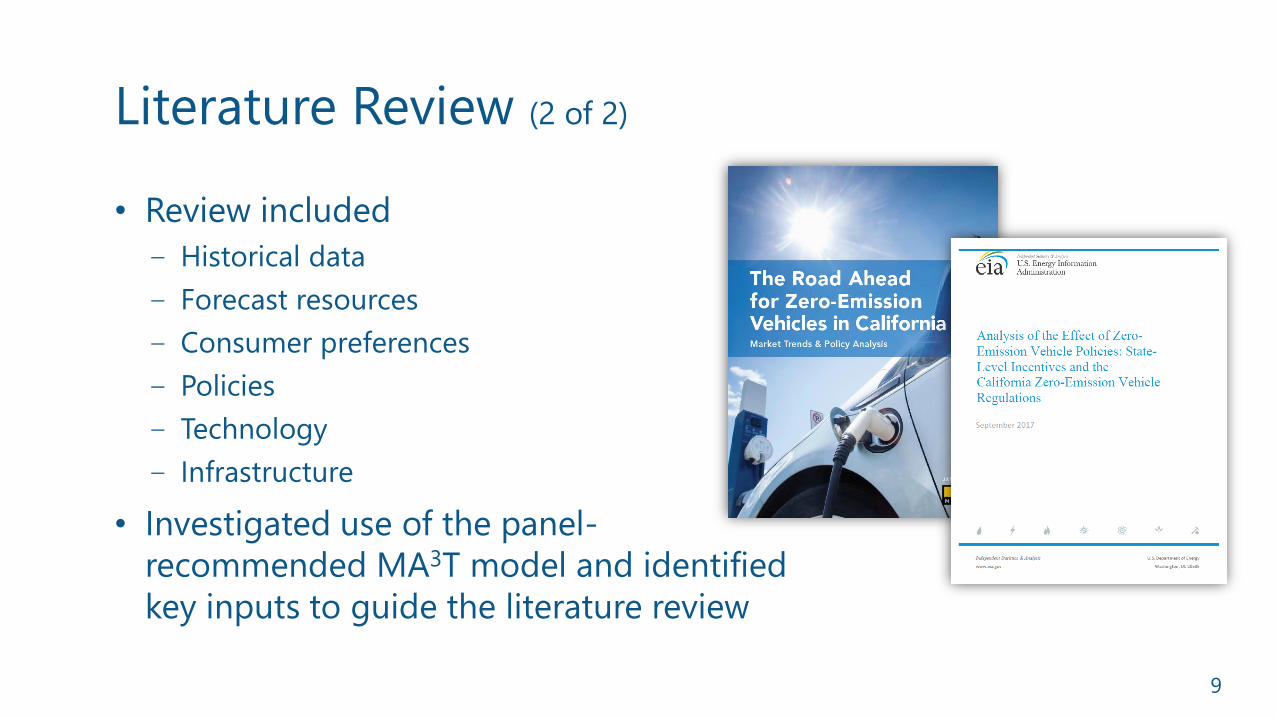
Literature Review (2 of 2)
9
• Review included
‒ Historical data
‒ Forecast resources
‒ Consumer preferences
‒ Policies
‒ Technology
‒ Infrastructure
• Investigated use of the panel-
recommended MA3T model and identified
key inputs to guide the literature review
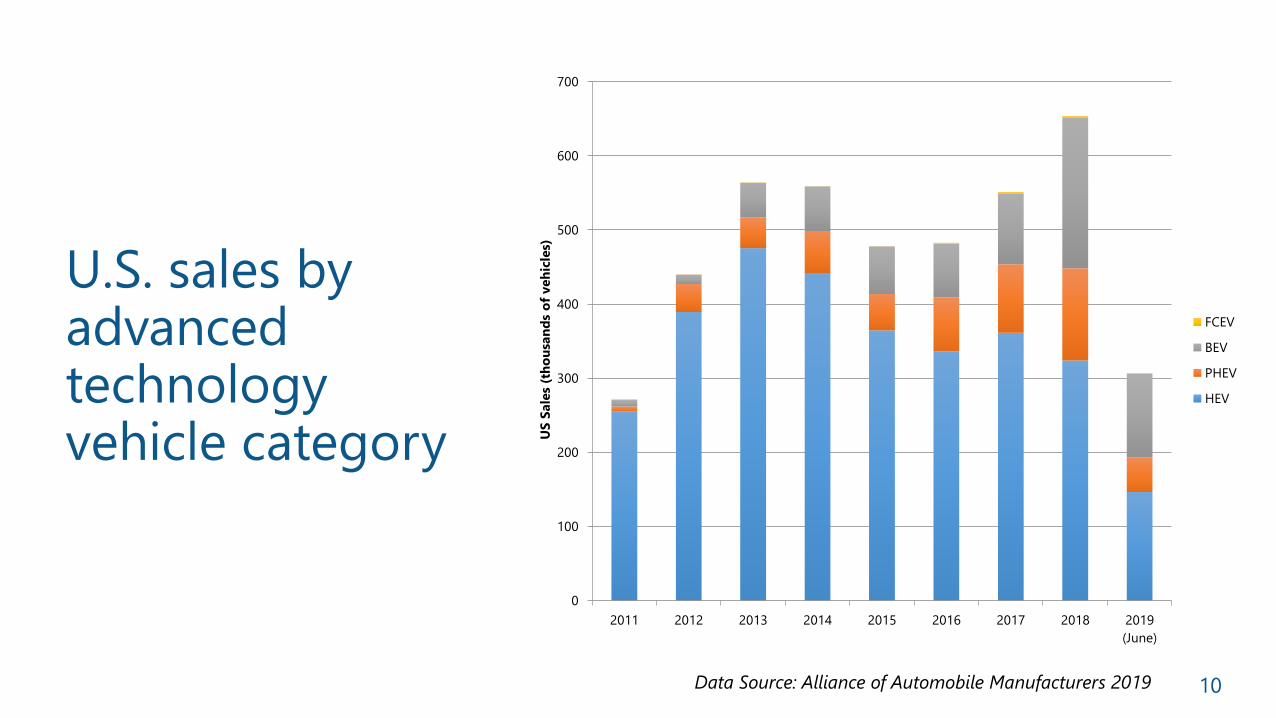
0
100
200
300
400
500
600
700
2011 2012 2013 2014 2015 2016 2017 2018 2019
(June)
US
Sale
s (t
ho
usa
nd
s o
f veh
icle
s)
FCEV
BEV
PHEV
HEV
U.S. sales by advanced technology vehicle category
Data Source: Alliance of Automobile Manufacturers 2019 10
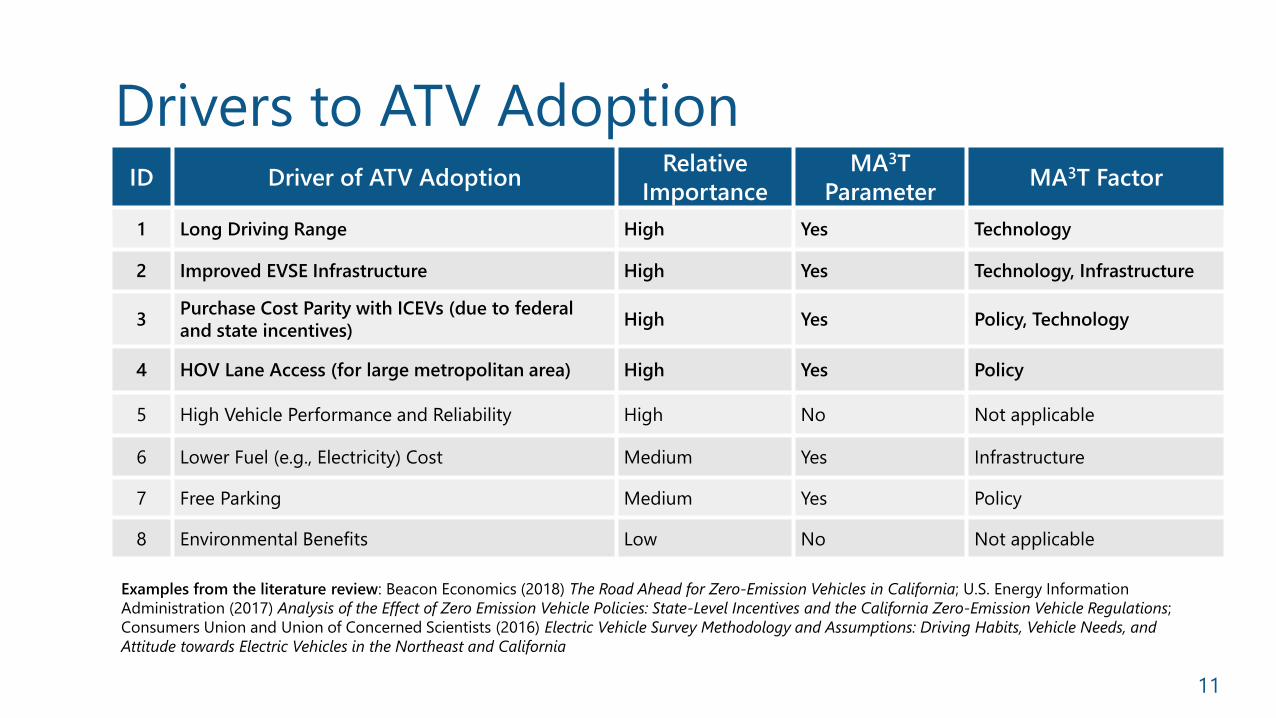
Drivers to ATV Adoption
11
ID Driver of ATV AdoptionRelative
Importance
MA3T
ParameterMA3T Factor
1 Long Driving Range High Yes Technology
2 Improved EVSE Infrastructure High Yes Technology, Infrastructure
3Purchase Cost Parity with ICEVs (due to federal
and state incentives)High Yes Policy, Technology
4 HOV Lane Access (for large metropolitan area) High Yes Policy
5 High Vehicle Performance and Reliability High No Not applicable
6 Lower Fuel (e.g., Electricity) Cost Medium Yes Infrastructure
7 Free Parking Medium Yes Policy
8 Environmental Benefits Low No Not applicable
Examples from the literature review: Beacon Economics (2018) The Road Ahead for Zero-Emission Vehicles in California; U.S. Energy Information
Administration (2017) Analysis of the Effect of Zero Emission Vehicle Policies: State-Level Incentives and the California Zero-Emission Vehicle Regulations;
Consumers Union and Union of Concerned Scientists (2016) Electric Vehicle Survey Methodology and Assumptions: Driving Habits, Vehicle Needs, and
Attitude towards Electric Vehicles in the Northeast and California
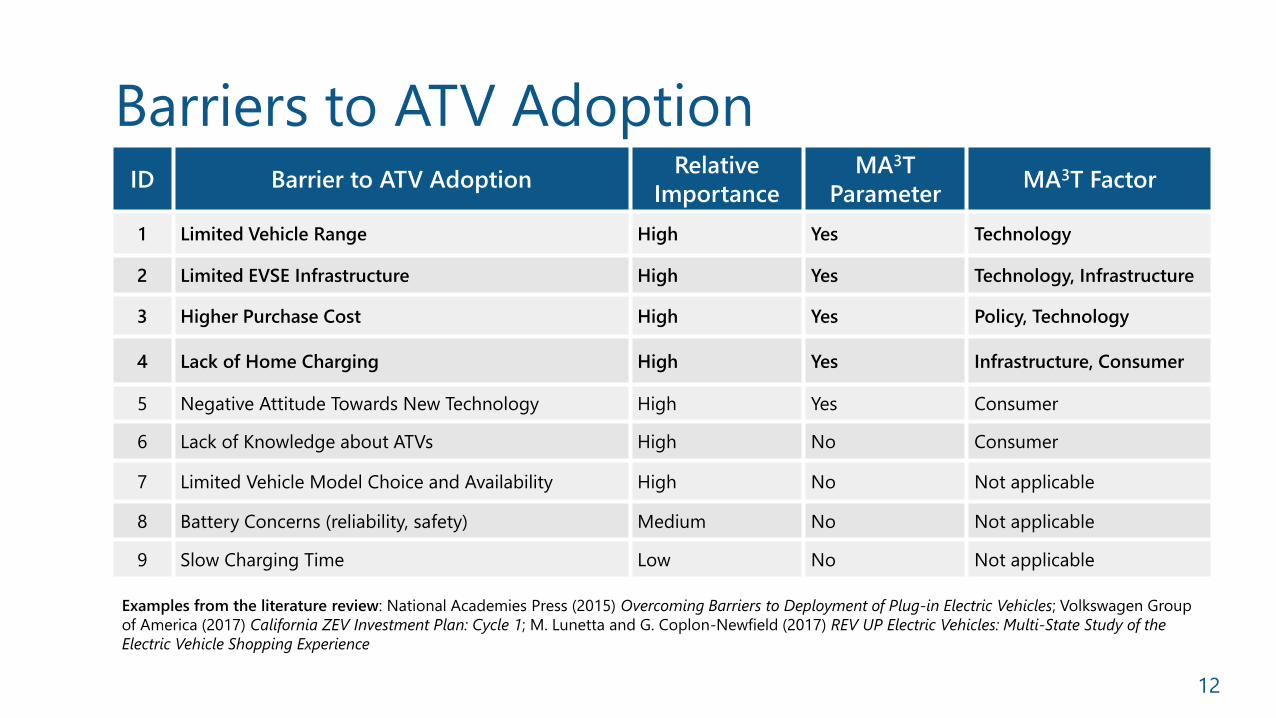
Barriers to ATV Adoption
12
ID Barrier to ATV AdoptionRelative
Importance
MA3T
ParameterMA3T Factor
1 Limited Vehicle Range High Yes Technology
2 Limited EVSE Infrastructure High Yes Technology, Infrastructure
3 Higher Purchase Cost High Yes Policy, Technology
4 Lack of Home Charging High Yes Infrastructure, Consumer
5 Negative Attitude Towards New Technology High Yes Consumer
6 Lack of Knowledge about ATVs High No Consumer
7 Limited Vehicle Model Choice and Availability High No Not applicable
8 Battery Concerns (reliability, safety) Medium No Not applicable
9 Slow Charging Time Low No Not applicable
Examples from the literature review: National Academies Press (2015) Overcoming Barriers to Deployment of Plug-in Electric Vehicles; Volkswagen Group
of America (2017) California ZEV Investment Plan: Cycle 1; M. Lunetta and G. Coplon-Newfield (2017) REV UP Electric Vehicles: Multi-State Study of the
Electric Vehicle Shopping Experience
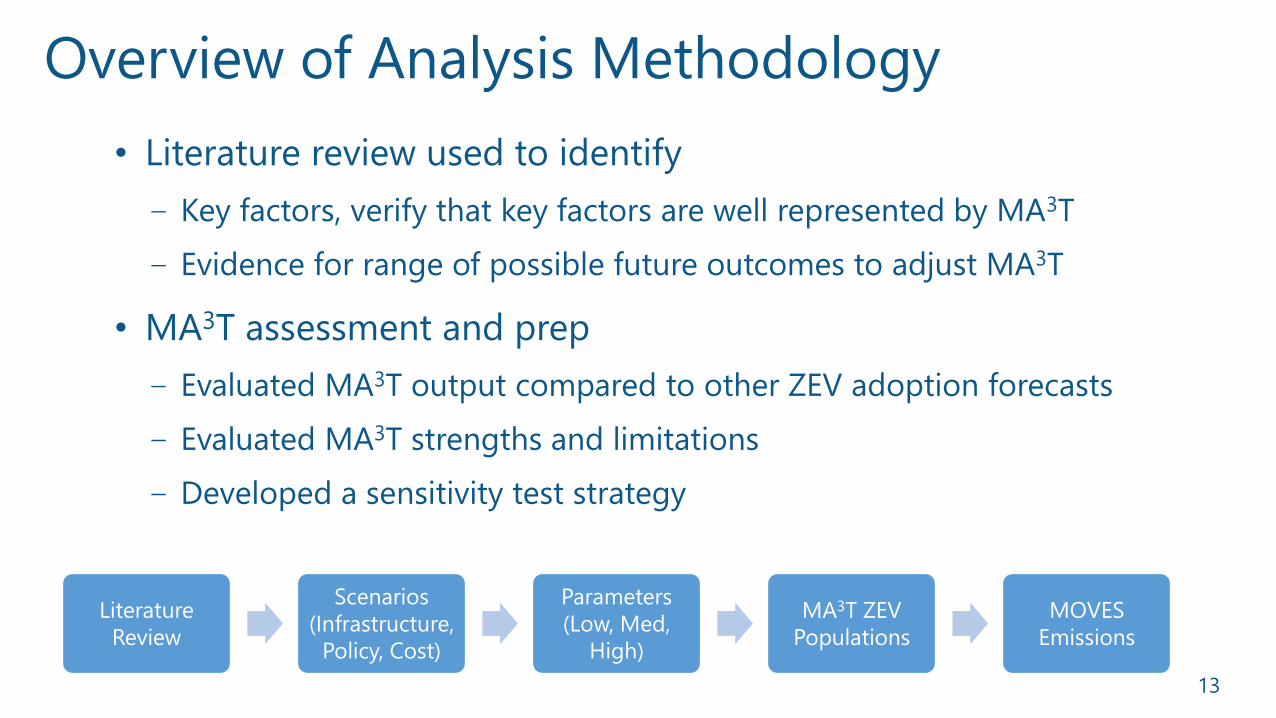
Overview of Analysis Methodology
13
• Literature review used to identify
‒ Key factors, verify that key factors are well represented by MA3T
‒ Evidence for range of possible future outcomes to adjust MA3T
• MA3T assessment and prep
‒ Evaluated MA3T output compared to other ZEV adoption forecasts
‒ Evaluated MA3T strengths and limitations
‒ Developed a sensitivity test strategy
Literature
Review
Scenarios
(Infrastructure,
Policy, Cost)
Parameters
(Low, Med,
High)
MA3T ZEV
Populations
MOVES
Emissions
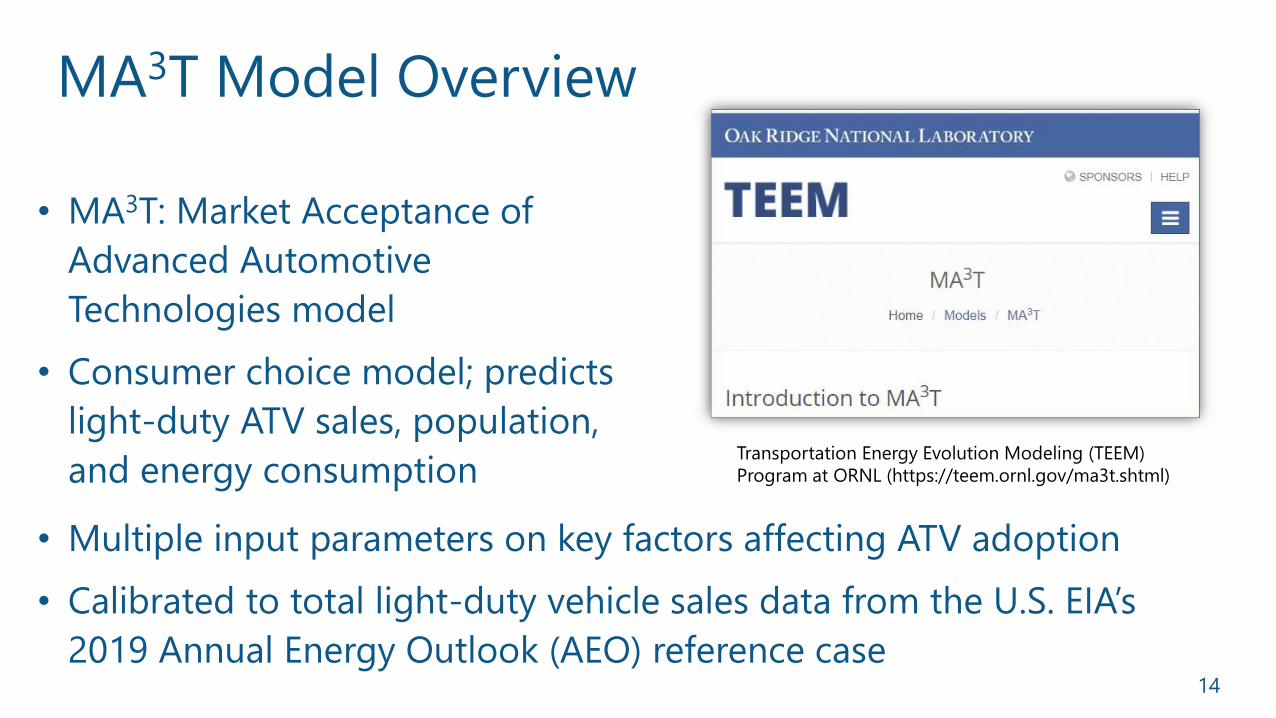
MA3T Model Overview
14
• MA3T: Market Acceptance of
Advanced Automotive
Technologies model
• Consumer choice model; predicts
light-duty ATV sales, population,
and energy consumption
• Multiple input parameters on key factors affecting ATV adoption
• Calibrated to total light-duty vehicle sales data from the U.S. EIA’s
2019 Annual Energy Outlook (AEO) reference case
Transportation Energy Evolution Modeling (TEEM)
Program at ORNL (https://teem.ornl.gov/ma3t.shtml)
Charts developed with data from the 2019 Annual Energy Outlook (AEO) and MA3T 1515
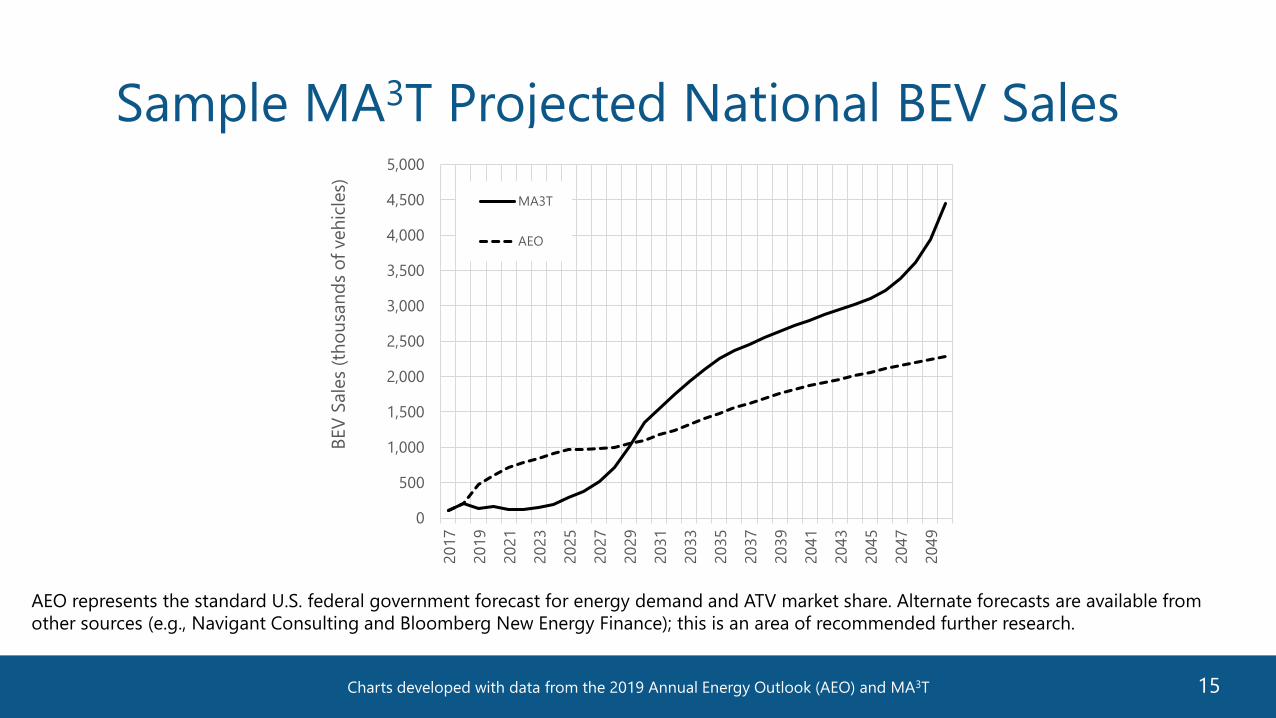
Sample MA3T Projected National BEV Sales
0
500
1,000
1,500
2,000
2,500
3,000
3,500
4,000
4,500
5,000
2017
2019
2021
2023
2025
2027
2029
2031
2033
2035
2037
2039
2041
2043
2045
2047
2049
BEV
Sale
s (t
ho
usa
nd
s o
f veh
icle
s)
MA3T
AEO
AEO represents the standard U.S. federal government forecast for energy demand and ATV market share. Alternate forecasts are available from
other sources (e.g., Navigant Consulting and Bloomberg New Energy Finance); this is an area of recommended further research.
Charts developed with data from the 2019 Annual Energy Outlook (AEO), the Auto Alliance Advanced Technology Vehicle Sales Dashboard, and MA3T 1616
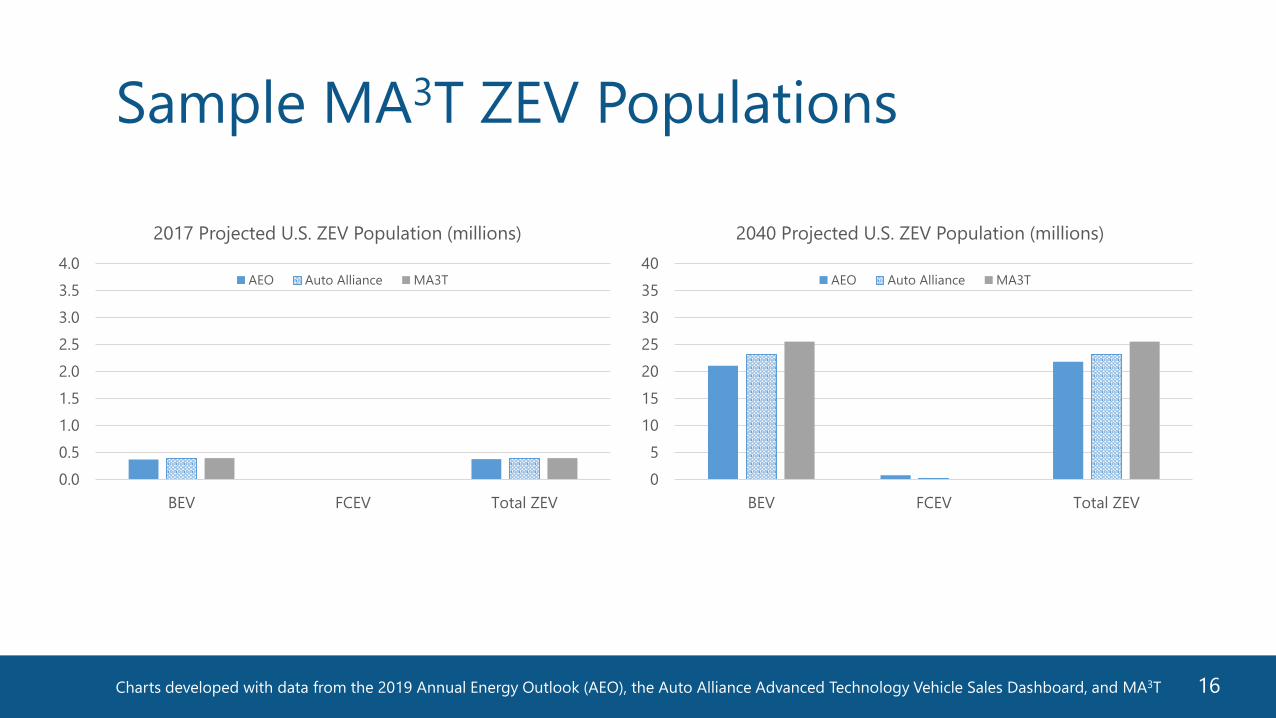
Sample MA3T ZEV Populations
0
5
10
15
20
25
30
35
40
BEV FCEV Total ZEV
2040 Projected U.S. ZEV Population (millions)
AEO Auto Alliance MA3T
0.0
0.5
1.0
1.5
2.0
2.5
3.0
3.5
4.0
BEV FCEV Total ZEV
2017 Projected U.S. ZEV Population (millions)
AEO Auto Alliance MA3T
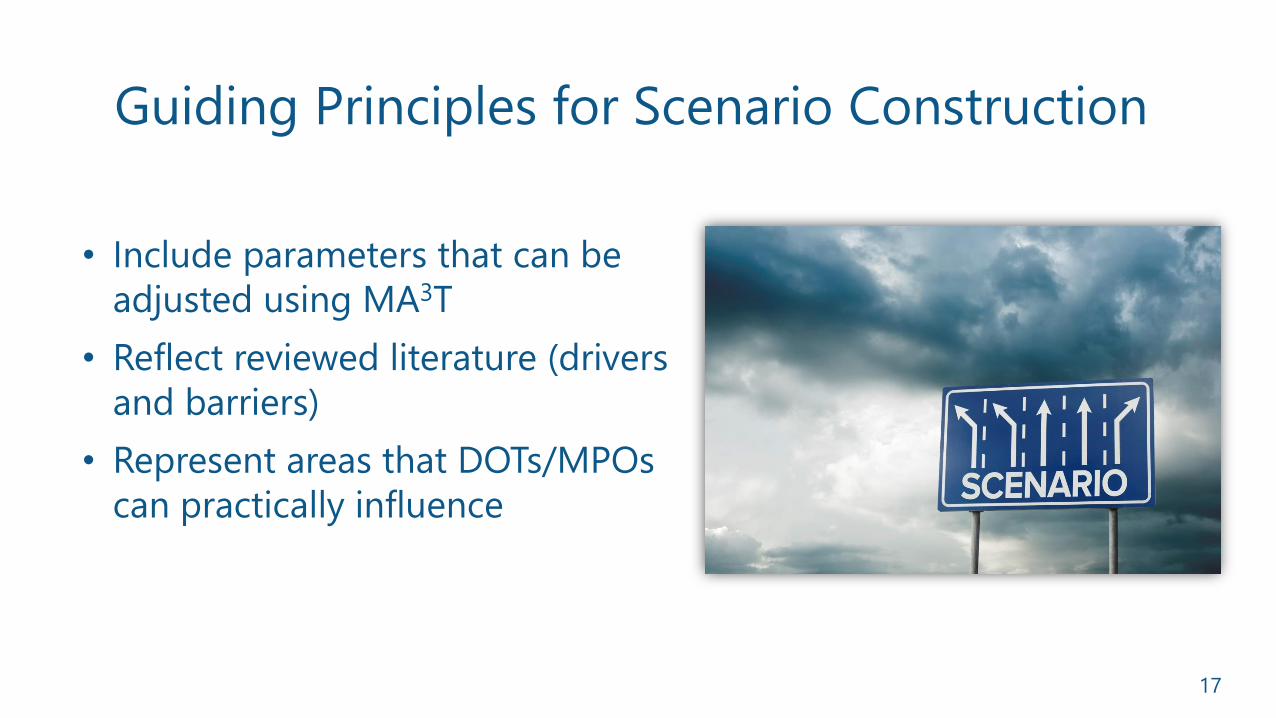
Guiding Principles for Scenario Construction
17
• Include parameters that can be
adjusted using MA3T
• Reflect reviewed literature (drivers
and barriers)
• Represent areas that DOTs/MPOs
can practically influence
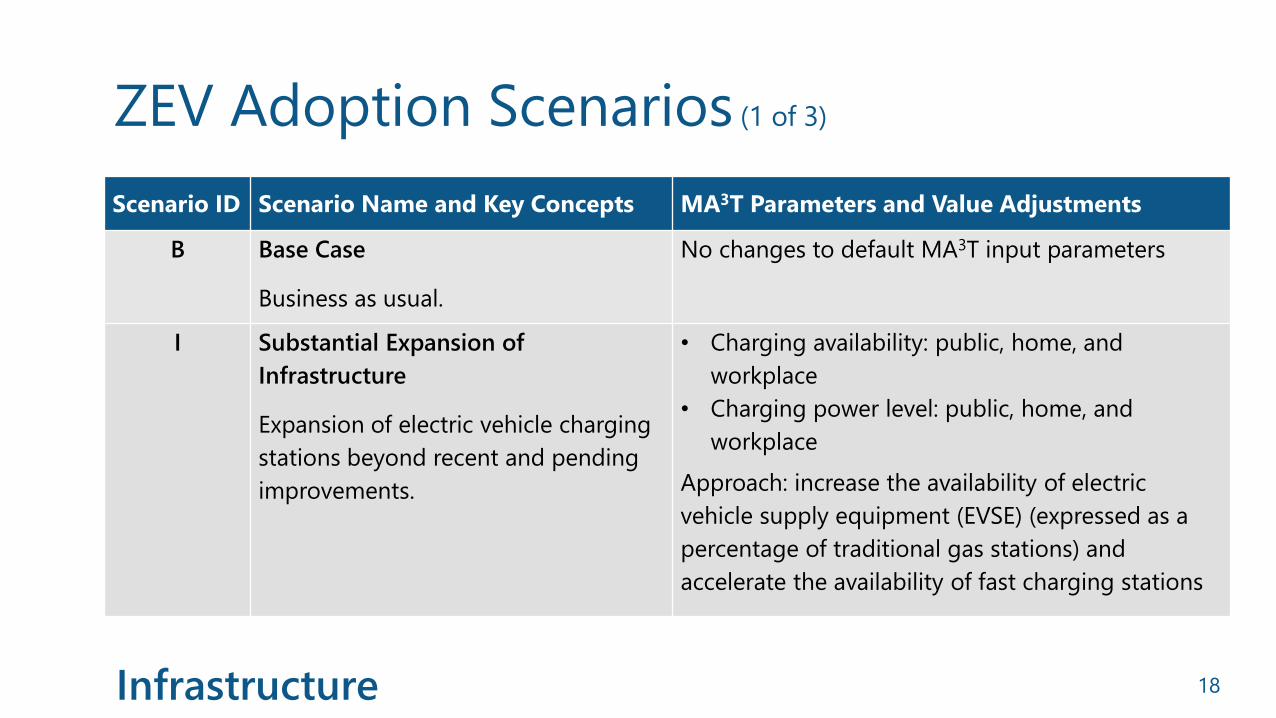
ZEV Adoption Scenarios (1 of 3)
18
Scenario ID Scenario Name and Key Concepts MA3T Parameters and Value Adjustments
B Base Case
Business as usual.
No changes to default MA3T input parameters
I Substantial Expansion of
Infrastructure
Expansion of electric vehicle charging
stations beyond recent and pending
improvements.
• Charging availability: public, home, and
workplace
• Charging power level: public, home, and
workplace
Approach: increase the availability of electric
vehicle supply equipment (EVSE) (expressed as a
percentage of traditional gas stations) and
accelerate the availability of fast charging stations
Infrastructure
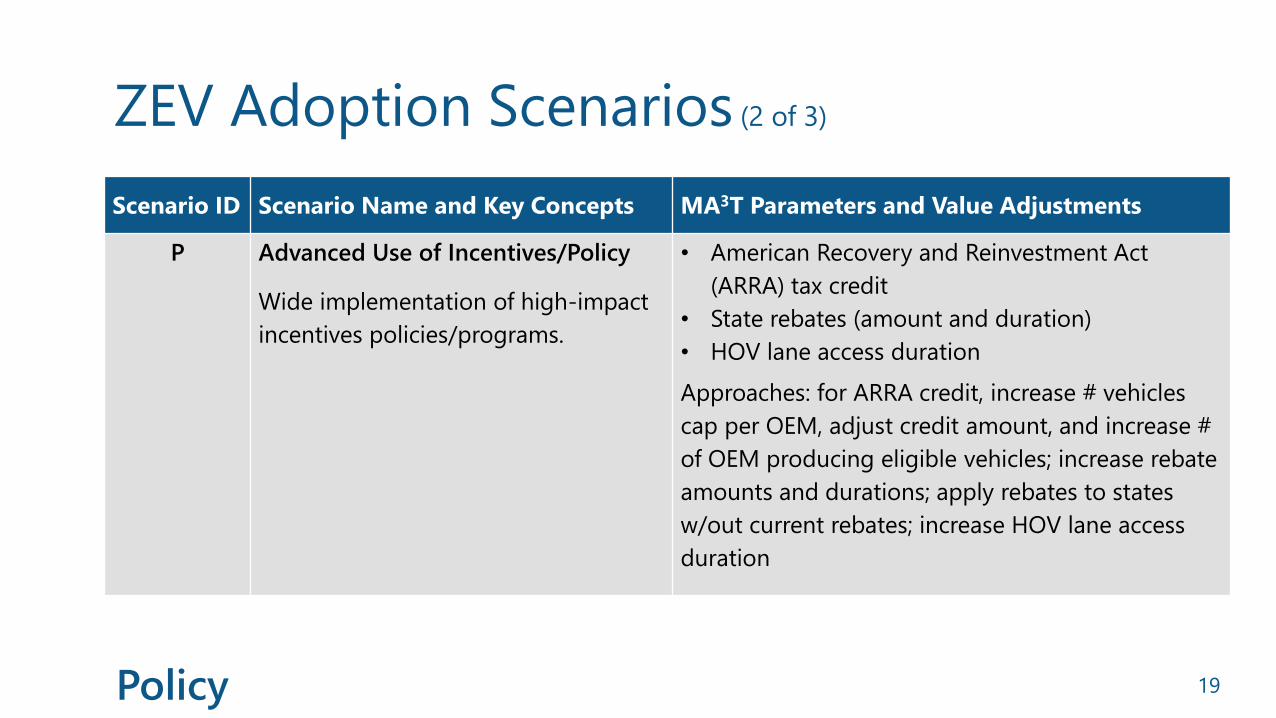
ZEV Adoption Scenarios (2 of 3)
19
Scenario ID Scenario Name and Key Concepts MA3T Parameters and Value Adjustments
P Advanced Use of Incentives/Policy
Wide implementation of high-impact
incentives policies/programs.
• American Recovery and Reinvestment Act
(ARRA) tax credit
• State rebates (amount and duration)
• HOV lane access duration
Approaches: for ARRA credit, increase # vehicles
cap per OEM, adjust credit amount, and increase #
of OEM producing eligible vehicles; increase rebate
amounts and durations; apply rebates to states
w/out current rebates; increase HOV lane access
duration
Policy
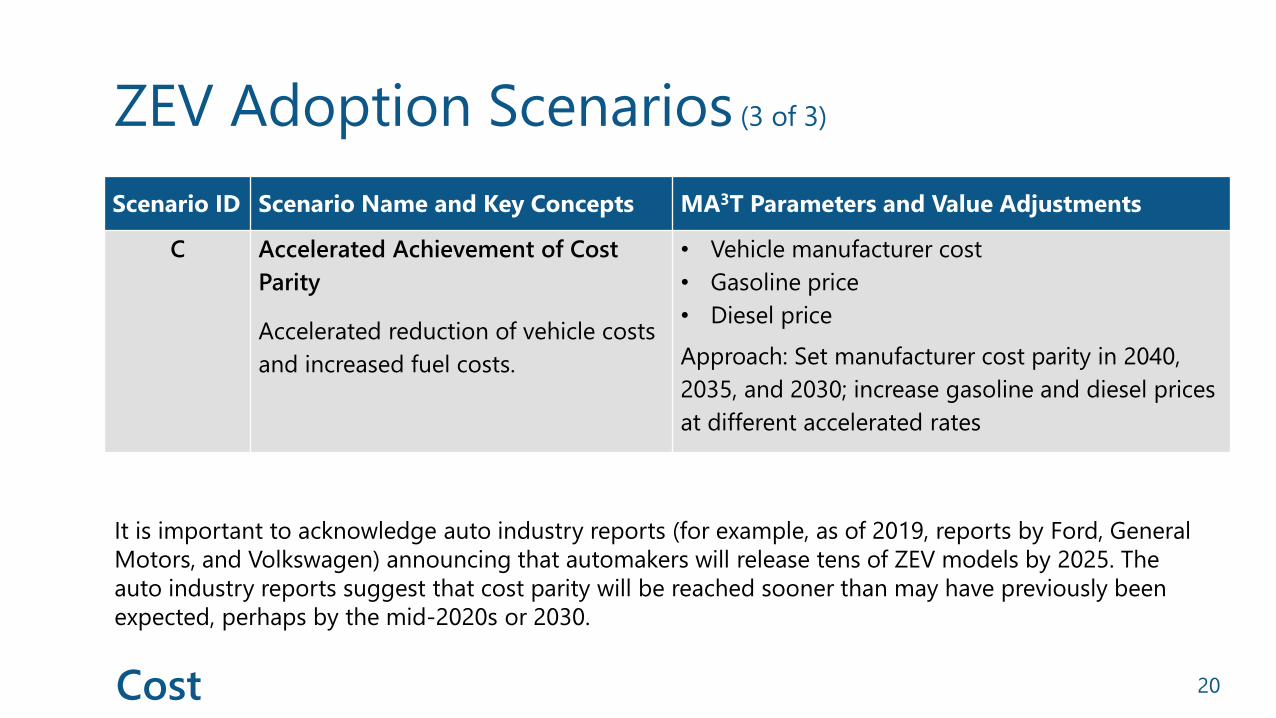
ZEV Adoption Scenarios (3 of 3)
20
Scenario ID Scenario Name and Key Concepts MA3T Parameters and Value Adjustments
C Accelerated Achievement of Cost
Parity
Accelerated reduction of vehicle costs
and increased fuel costs.
• Vehicle manufacturer cost
• Gasoline price
• Diesel price
Approach: Set manufacturer cost parity in 2040,
2035, and 2030; increase gasoline and diesel prices
at different accelerated rates
It is important to acknowledge auto industry reports (for example, as of 2019, reports by Ford, General
Motors, and Volkswagen) announcing that automakers will release tens of ZEV models by 2025. The
auto industry reports suggest that cost parity will be reached sooner than may have previously been
expected, perhaps by the mid-2020s or 2030.
Cost
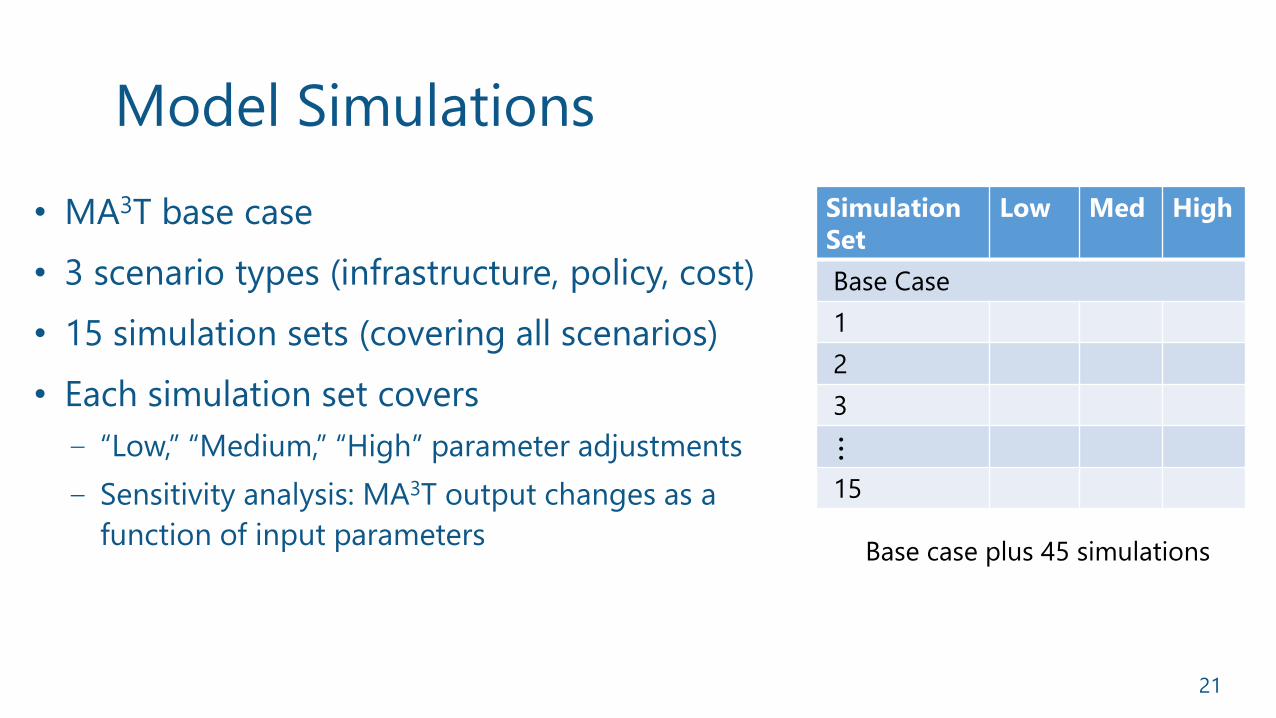
Model Simulations
21
• MA3T base case
• 3 scenario types (infrastructure, policy, cost)
• 15 simulation sets (covering all scenarios)
• Each simulation set covers
‒ “Low,” “Medium,” “High” parameter adjustments
‒ Sensitivity analysis: MA3T output changes as a
function of input parameters
Simulation
Set
Low Med High
Base Case
1
2
3…
15
Base case plus 45 simulations
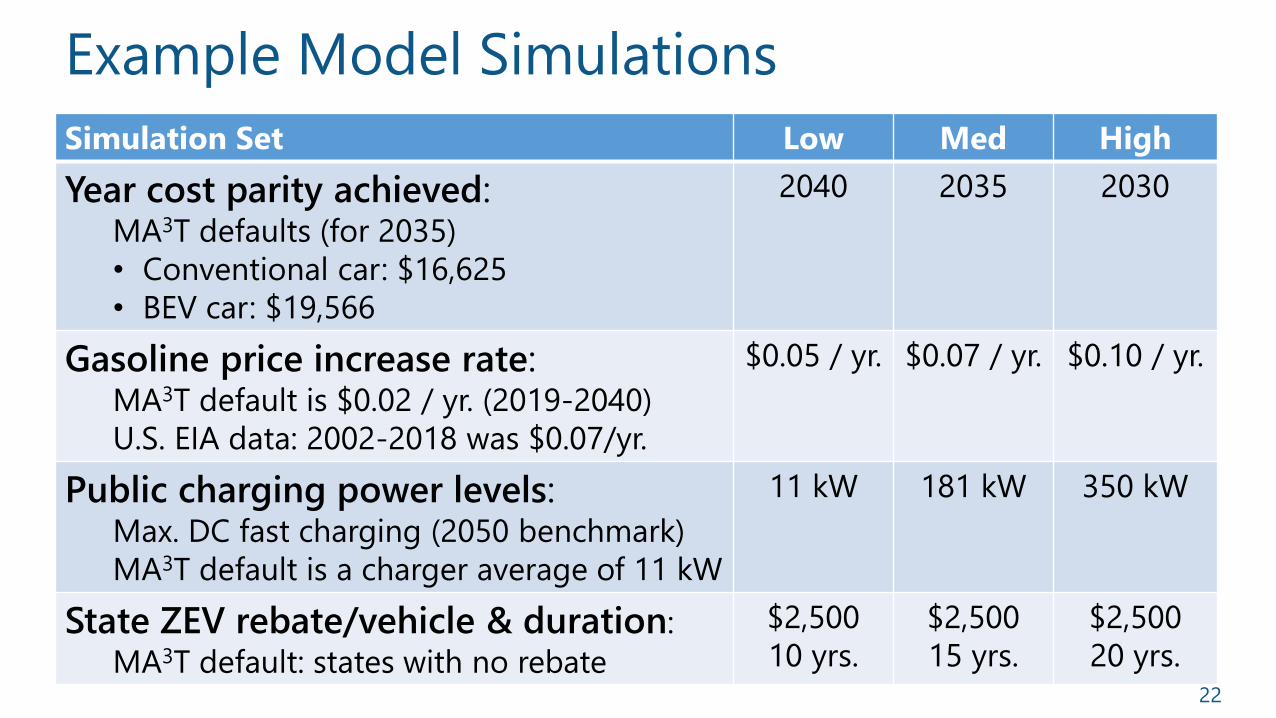
Example Model Simulations
22
Simulation Set Low Med High
Year cost parity achieved: MA3T defaults (for 2035)
• Conventional car: $16,625
• BEV car: $19,566
2040 2035 2030
Gasoline price increase rate:MA3T default is $0.02 / yr. (2019-2040)
U.S. EIA data: 2002-2018 was $0.07/yr.
$0.05 / yr. $0.07 / yr. $0.10 / yr.
Public charging power levels:Max. DC fast charging (2050 benchmark)
MA3T default is a charger average of 11 kW
11 kW 181 kW 350 kW
State ZEV rebate/vehicle & duration:
MA3T default: states with no rebate
$2,500
10 yrs.
$2,500
15 yrs.
$2,500
20 yrs.
Results: Forecasted ZEV Populations
23
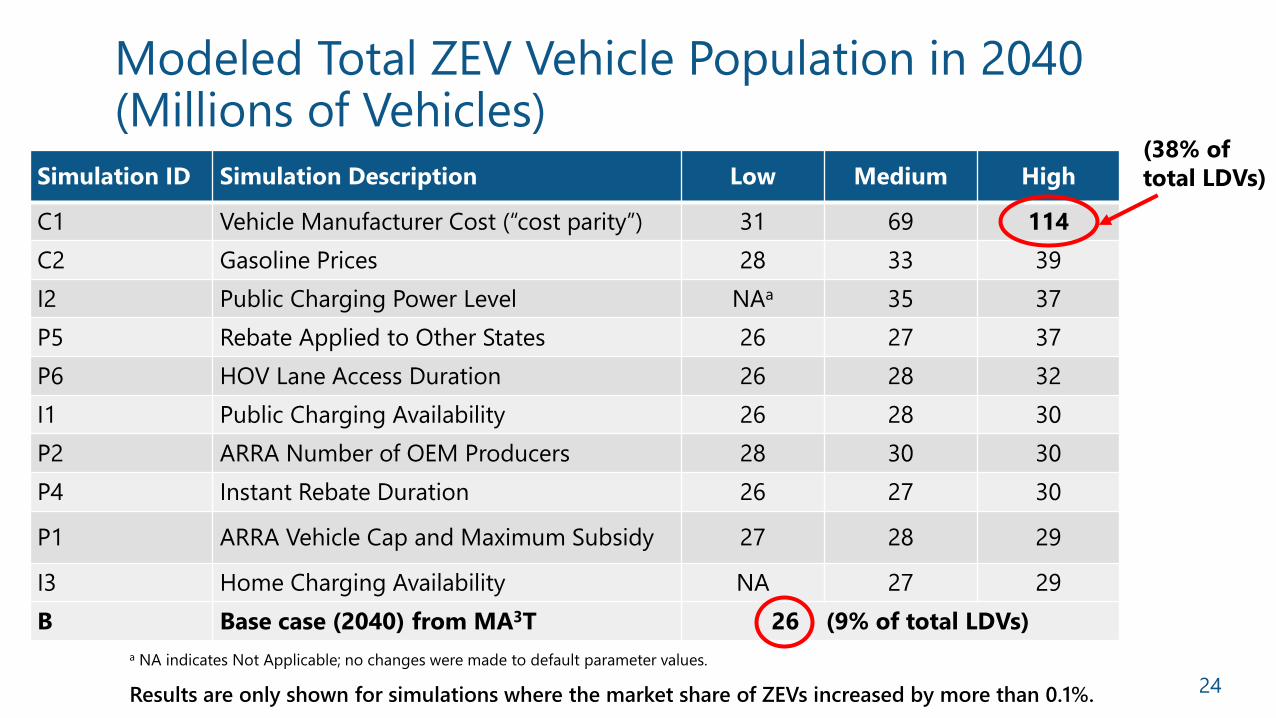
Modeled Total ZEV Vehicle Population in 2040 (Millions of Vehicles)
24
Simulation ID Simulation Description Low Medium High
C1 Vehicle Manufacturer Cost (“cost parity”) 31 69 114
C2 Gasoline Prices 28 33 39
I2 Public Charging Power Level NAa 35 37
P5 Rebate Applied to Other States 26 27 37
P6 HOV Lane Access Duration 26 28 32
I1 Public Charging Availability 26 28 30
P2 ARRA Number of OEM Producers 28 30 30
P4 Instant Rebate Duration 26 27 30
P1 ARRA Vehicle Cap and Maximum Subsidy 27 28 29
I3 Home Charging Availability NA 27 29
B Base case (2040) from MA3T 26 (9% of total LDVs)
a NA indicates Not Applicable; no changes were made to default parameter values.
Results are only shown for simulations where the market share of ZEVs increased by more than 0.1%.
(38% of
total LDVs)
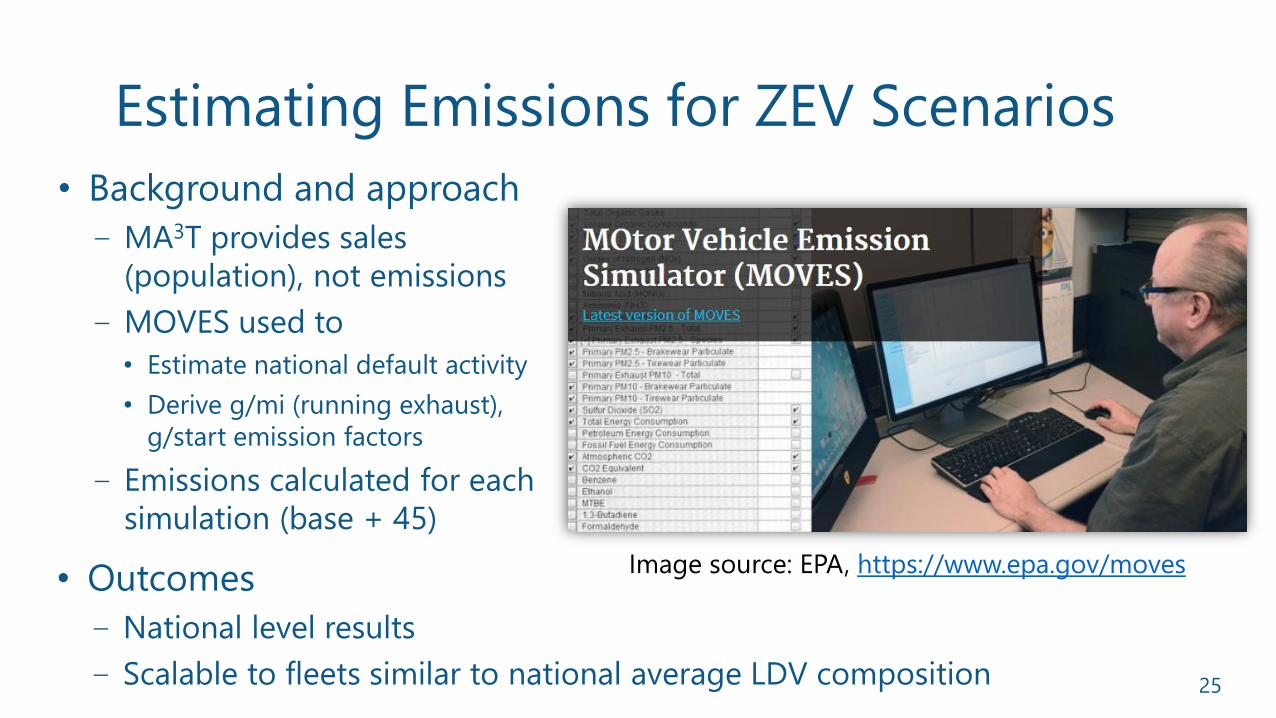
Estimating Emissions for ZEV Scenarios
25
• Background and approach
‒ MA3T provides sales
(population), not emissions
‒ MOVES used to
• Estimate national default activity
• Derive g/mi (running exhaust),
g/start emission factors
‒ Emissions calculated for each
simulation (base + 45)
Image source: EPA, https://www.epa.gov/moves• Outcomes
‒ National level results
‒ Scalable to fleets similar to national average LDV composition
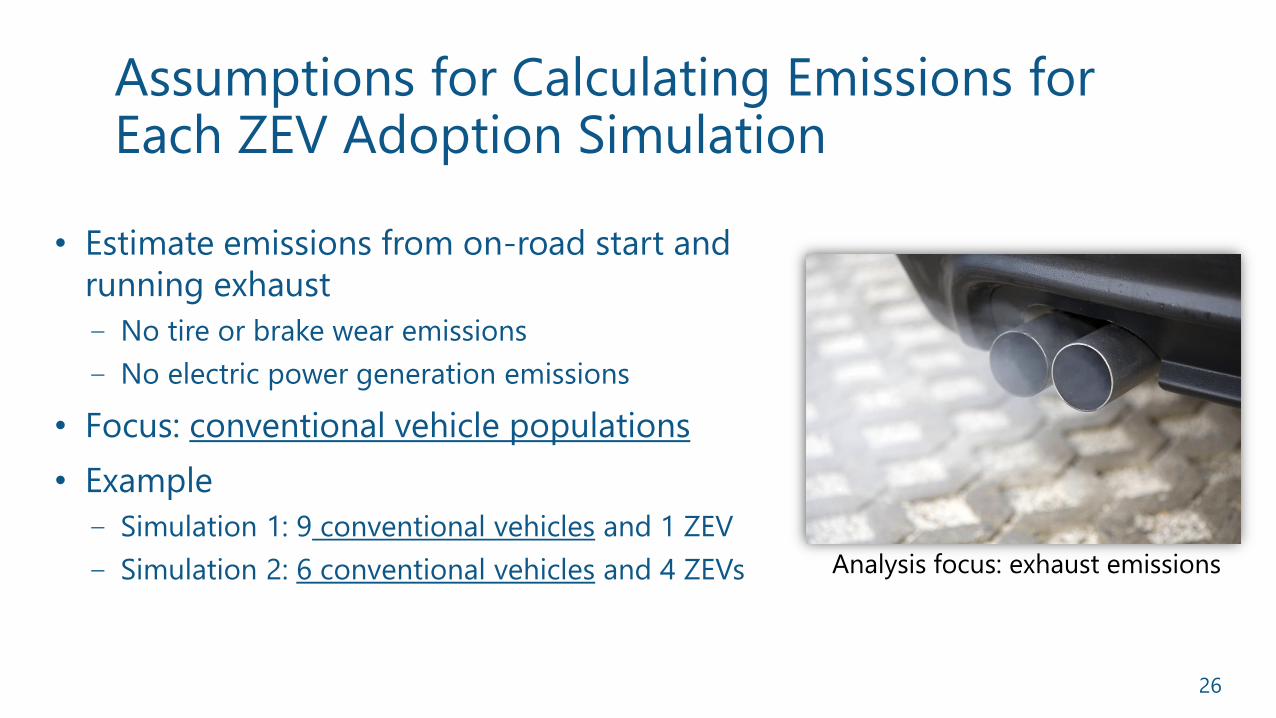
Assumptions for Calculating Emissions for Each ZEV Adoption Simulation
26
• Estimate emissions from on-road start and
running exhaust
‒ No tire or brake wear emissions
‒ No electric power generation emissions
• Focus: conventional vehicle populations
• Example
‒ Simulation 1: 9 conventional vehicles and 1 ZEV
‒ Simulation 2: 6 conventional vehicles and 4 ZEVs Analysis focus: exhaust emissions
27
Results: Forecasted Emissions Reductions
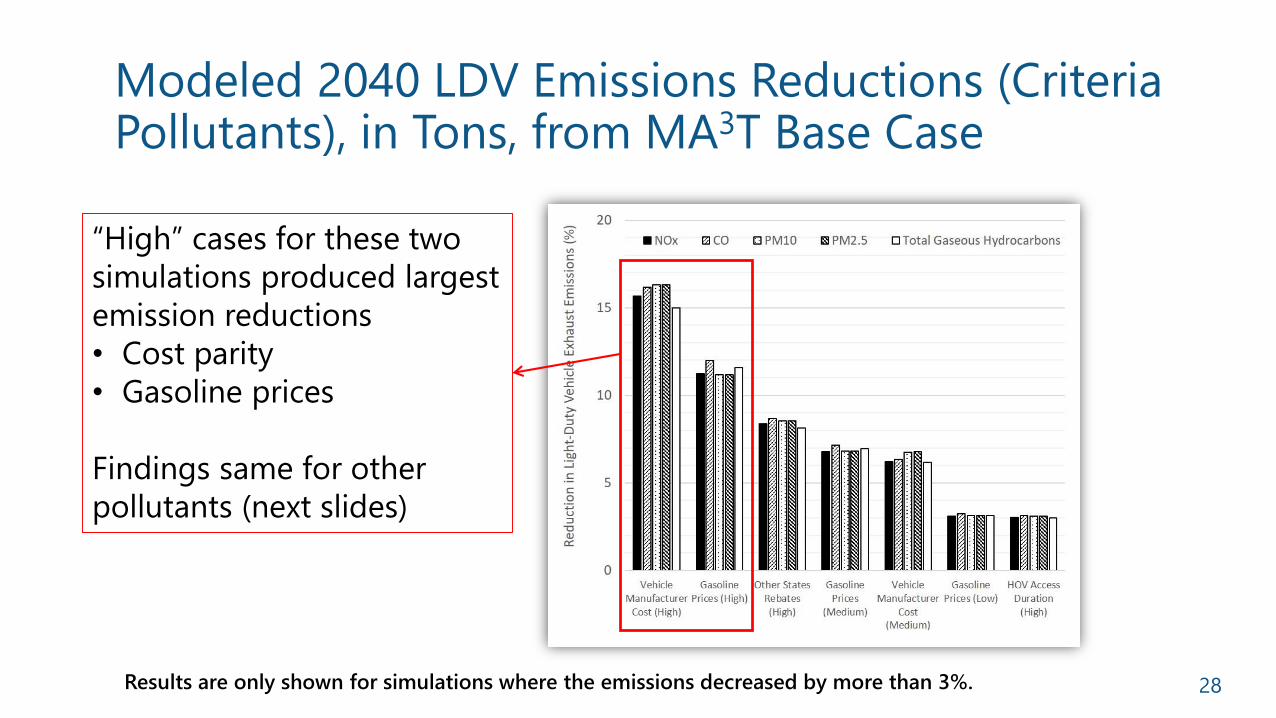
Modeled 2040 LDV Emissions Reductions (Criteria Pollutants), in Tons, from MA3T Base Case
28Results are only shown for simulations where the emissions decreased by more than 3%.
“High” cases for these two
simulations produced largest
emission reductions
• Cost parity
• Gasoline prices
Findings same for other
pollutants (next slides)
/
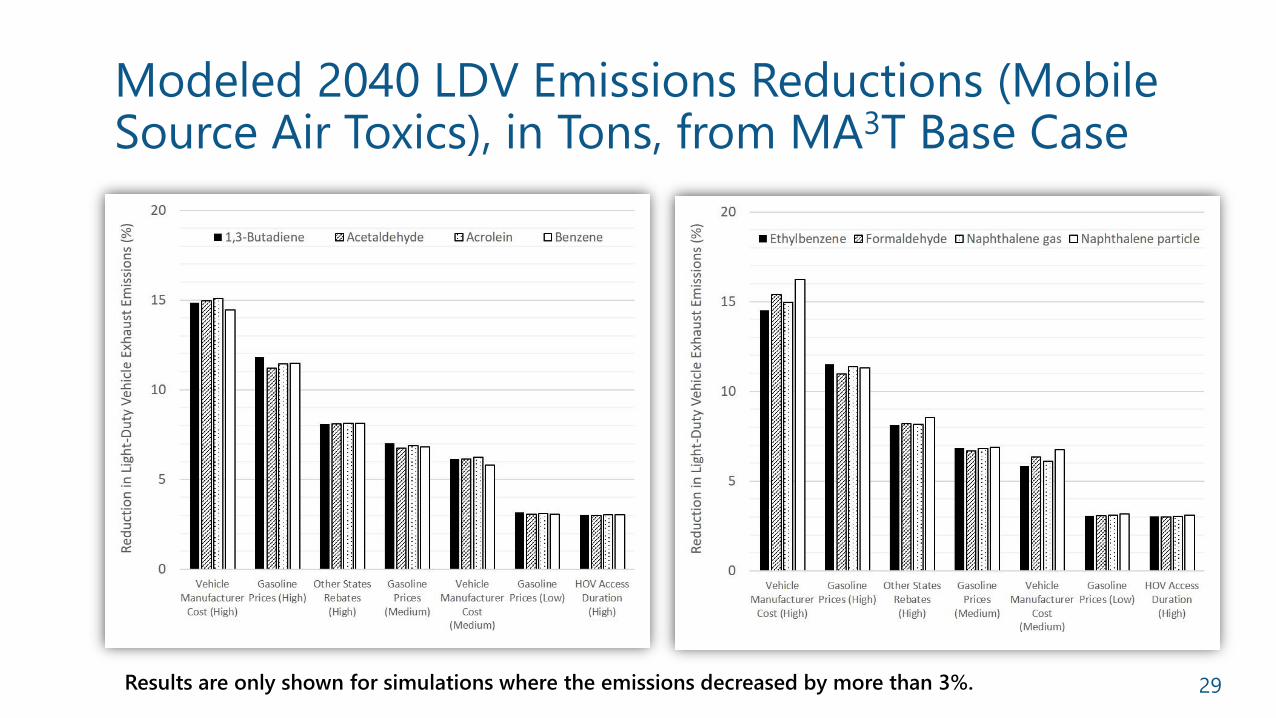
Modeled 2040 LDV Emissions Reductions (Mobile Source Air Toxics), in Tons, from MA3T Base Case
29Results are only shown for simulations where the emissions decreased by more than 3%.
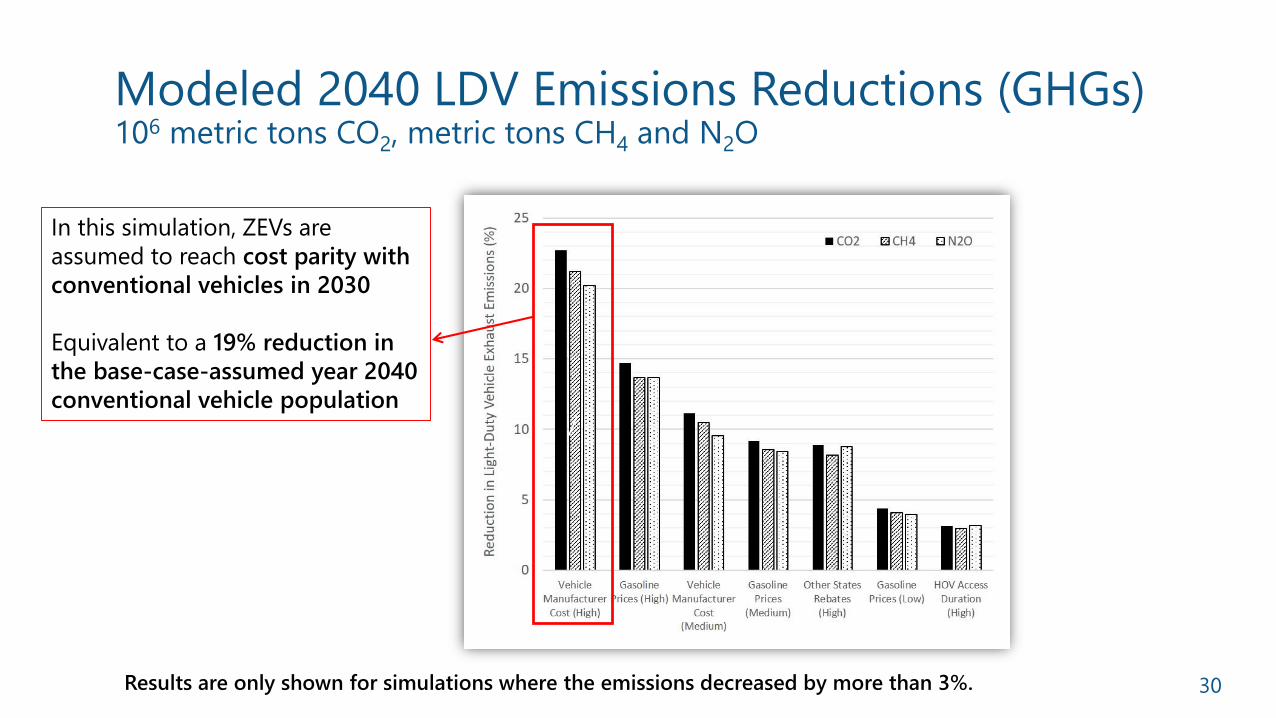
Modeled 2040 LDV Emissions Reductions (GHGs) 106 metric tons CO2, metric tons CH4 and N2O
30Results are only shown for simulations where the emissions decreased by more than 3%.
/
In this simulation, ZEVs are
assumed to reach cost parity with
conventional vehicles in 2030
Equivalent to a 19% reduction in
the base-case-assumed year 2040
conventional vehicle population
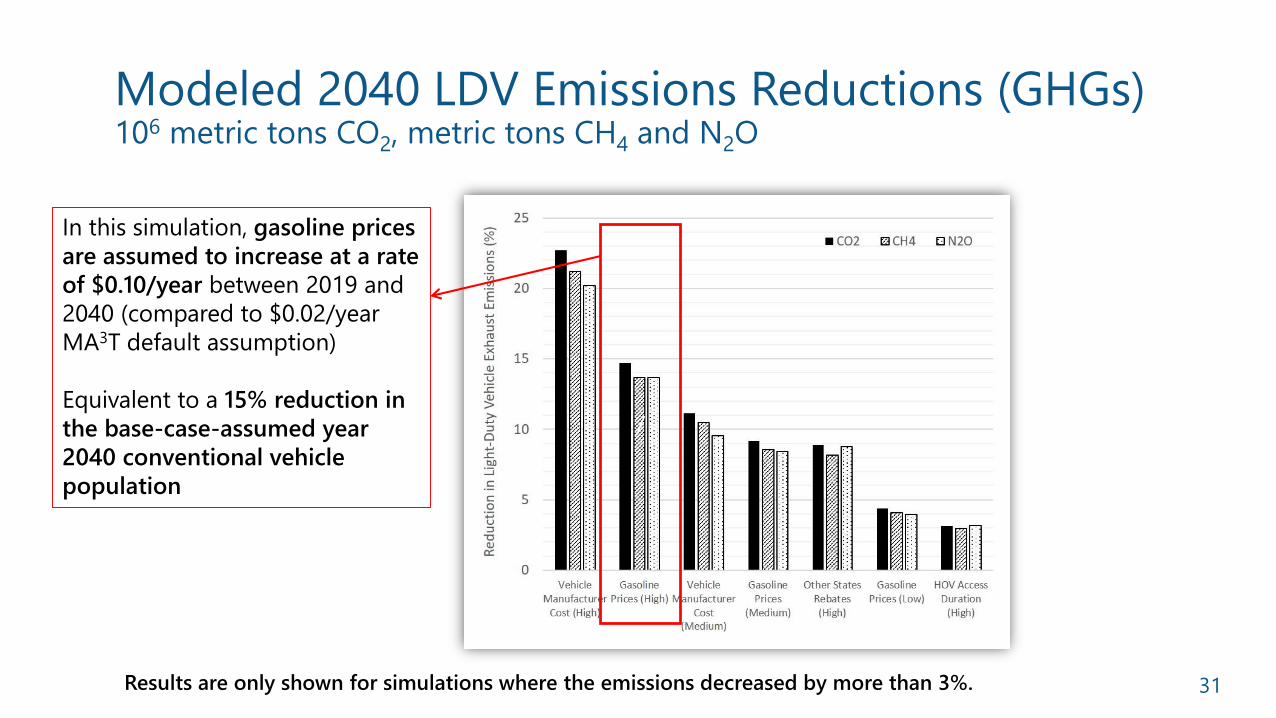
Modeled 2040 LDV Emissions Reductions (GHGs) 106 metric tons CO2, metric tons CH4 and N2O
31Results are only shown for simulations where the emissions decreased by more than 3%.
/
In this simulation, gasoline prices
are assumed to increase at a rate
of $0.10/year between 2019 and
2040 (compared to $0.02/year
MA3T default assumption)
Equivalent to a 15% reduction in
the base-case-assumed year
2040 conventional vehicle
population
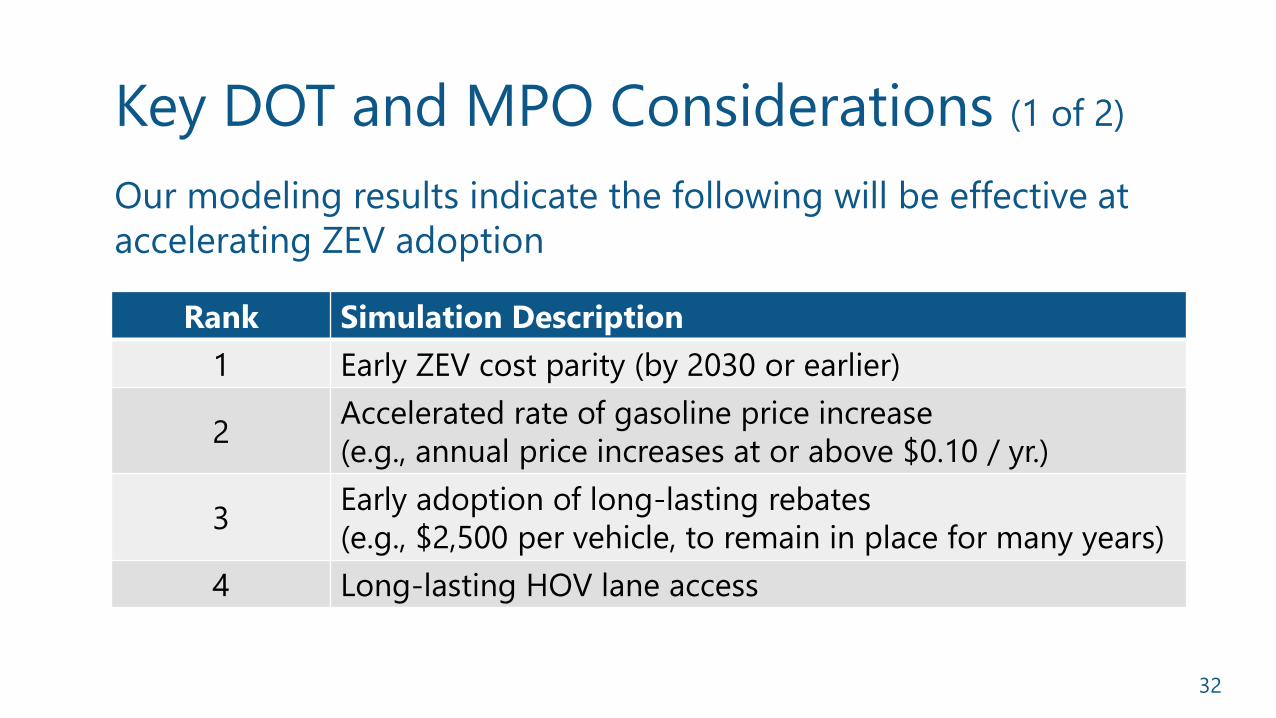
Key DOT and MPO Considerations (1 of 2)
32
Our modeling results indicate the following will be effective at
accelerating ZEV adoption
Rank Simulation Description
1 Early ZEV cost parity (by 2030 or earlier)
2Accelerated rate of gasoline price increase
(e.g., annual price increases at or above $0.10 / yr.)
3Early adoption of long-lasting rebates
(e.g., $2,500 per vehicle, to remain in place for many years)
4 Long-lasting HOV lane access
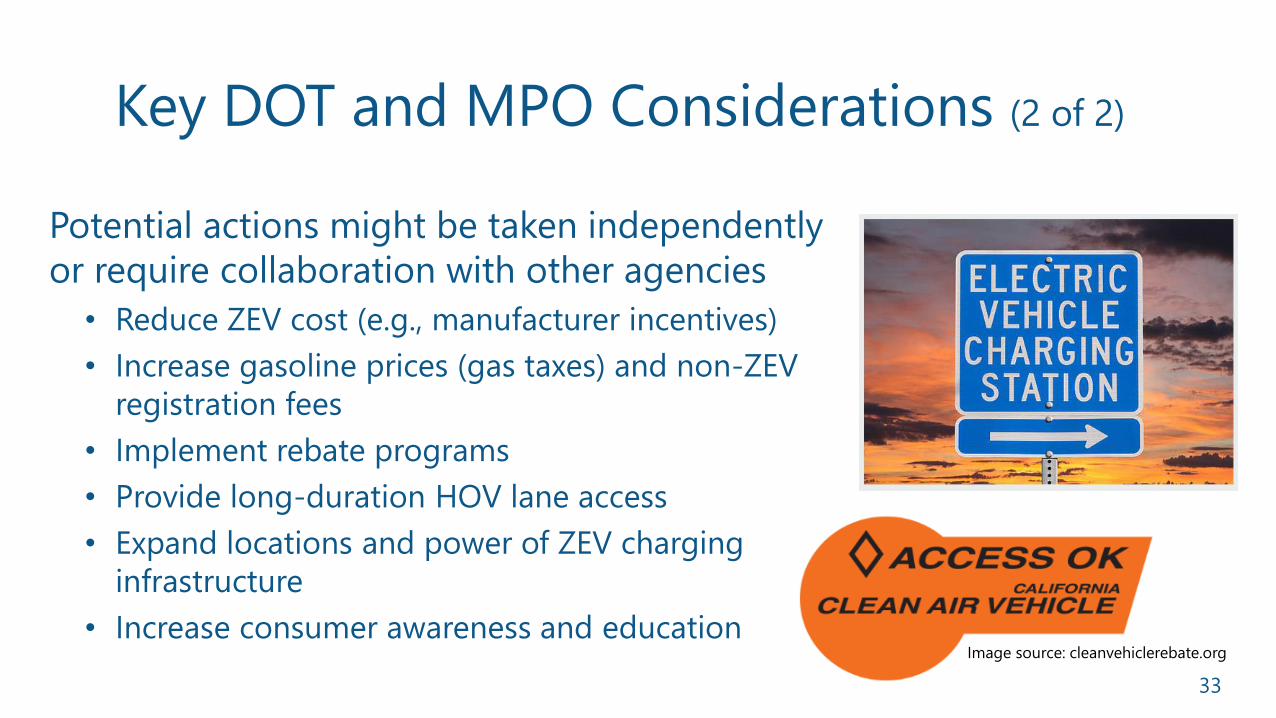
33
Potential actions might be taken independently
or require collaboration with other agencies
• Reduce ZEV cost (e.g., manufacturer incentives)
• Increase gasoline prices (gas taxes) and non-ZEV
registration fees
• Implement rebate programs
• Provide long-duration HOV lane access
• Expand locations and power of ZEV charging
infrastructure
• Increase consumer awareness and educationImage source: cleanvehiclerebate.org
Key DOT and MPO Considerations (2 of 2)
34
MA3T-focused General ZEV research
Suggestions for Future Research (1 of 7)
35
MA3T-focused R&D needs:
• Need: Assess, modify (if needed) MA3T
calibration; calibration is now to U.S. EIA AEO.
Others, e.g., Navigant Consulting, Bloomberg,
project greater ZEV adoption
• Benefit: Enhances MA3T by reflecting multiple
(“weight of evidence”) data sources
• Need: Manufacturer cost differences by ZEV
size classes
• Benefit: Improves MA3T as more large-class
ZEVs enter market
Suggestions for Future Research (2 of 7)
Suggestions for Future Research (3 of 7)
36
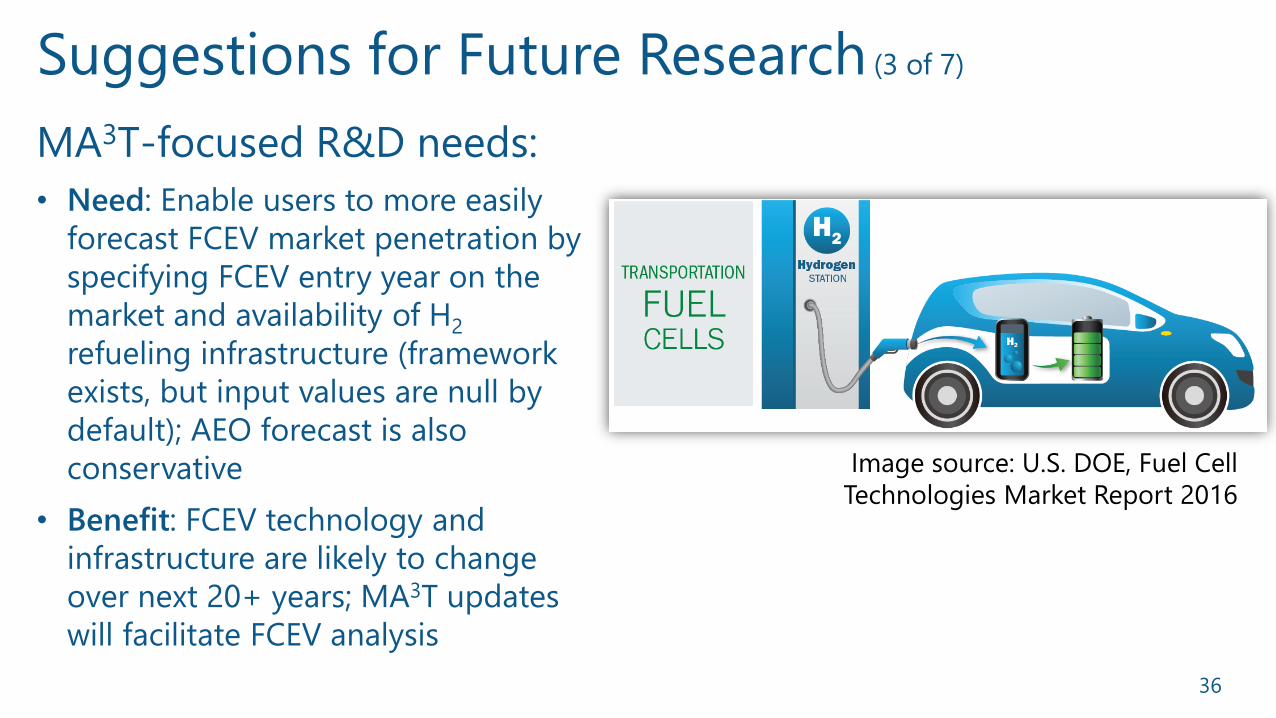
MA3T-focused R&D needs:
• Need: Enable users to more easily
forecast FCEV market penetration by
specifying FCEV entry year on the
market and availability of H2
refueling infrastructure (framework
exists, but input values are null by
default); AEO forecast is also
conservative
• Benefit: FCEV technology and
infrastructure are likely to change
over next 20+ years; MA3T updates
will facilitate FCEV analysis
Image source: U.S. DOE, Fuel Cell
Technologies Market Report 2016
Suggestions for Future Research (4 of 7)
37
MA3T-focused R&D needs:
• Need: Enable inflation-adjusted valuations
• Benefit: Will enable users to adjust inflation rates and sensitivity test outcomes;
Currently, MA3T uses 2018 dollars for costs, prices, tax credits and rebates
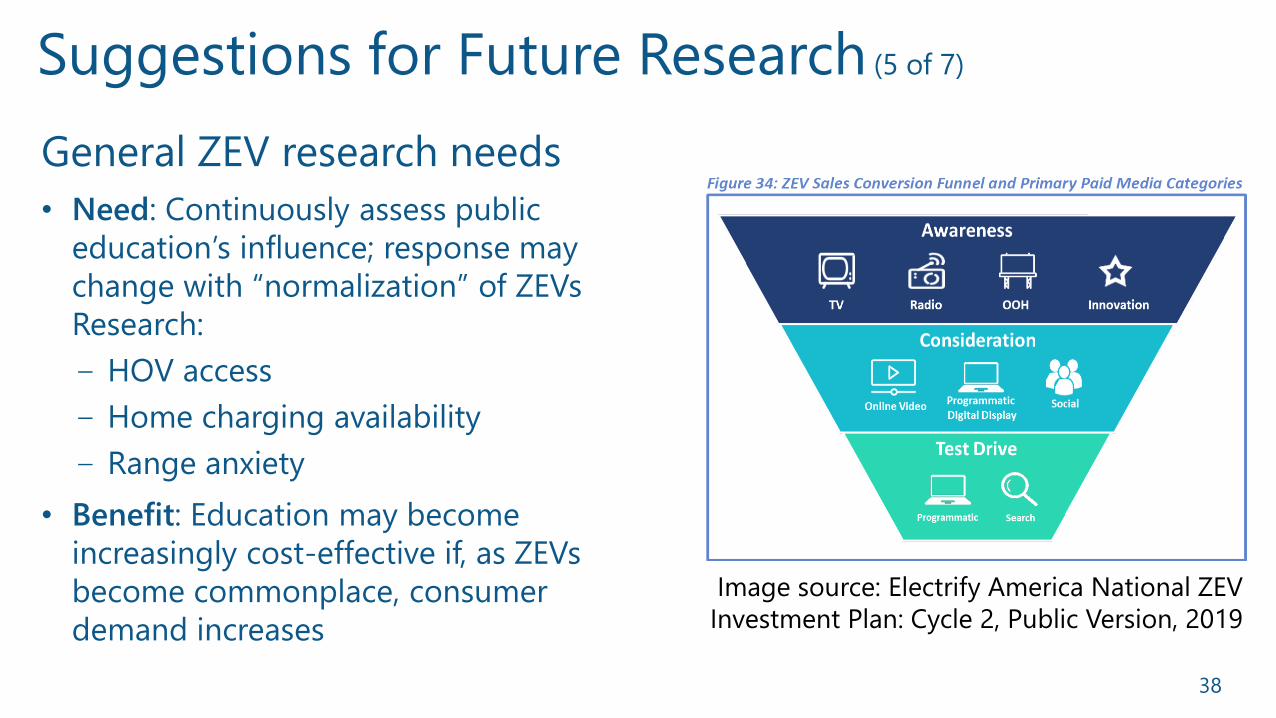
38
General ZEV research needs
• Need: Continuously assess public
education’s influence; response may
change with “normalization” of ZEVs
Research:
‒ HOV access
‒ Home charging availability
‒ Range anxiety
• Benefit: Education may become
increasingly cost-effective if, as ZEVs
become commonplace, consumer
demand increases
Image source: Electrify America National ZEV
Investment Plan: Cycle 2, Public Version, 2019
Suggestions for Future Research (5 of 7)
39
General ZEV research needs
• Need: ZEV-friendly revenue generating
mechanisms to replace lost gasoline tax revenue
• Benefit: Avoids increasing the effective cost of
ZEVs and potentially slowing the growth of ZEVs
• Need: Options to accelerate truck fleet
electrification
• Benefit: Medium- and heavy-duty vehicles
contribute nearly one quarter of GHG emissions
from the U.S. transportation sector
Suggestions for Future Research (6 of 7)
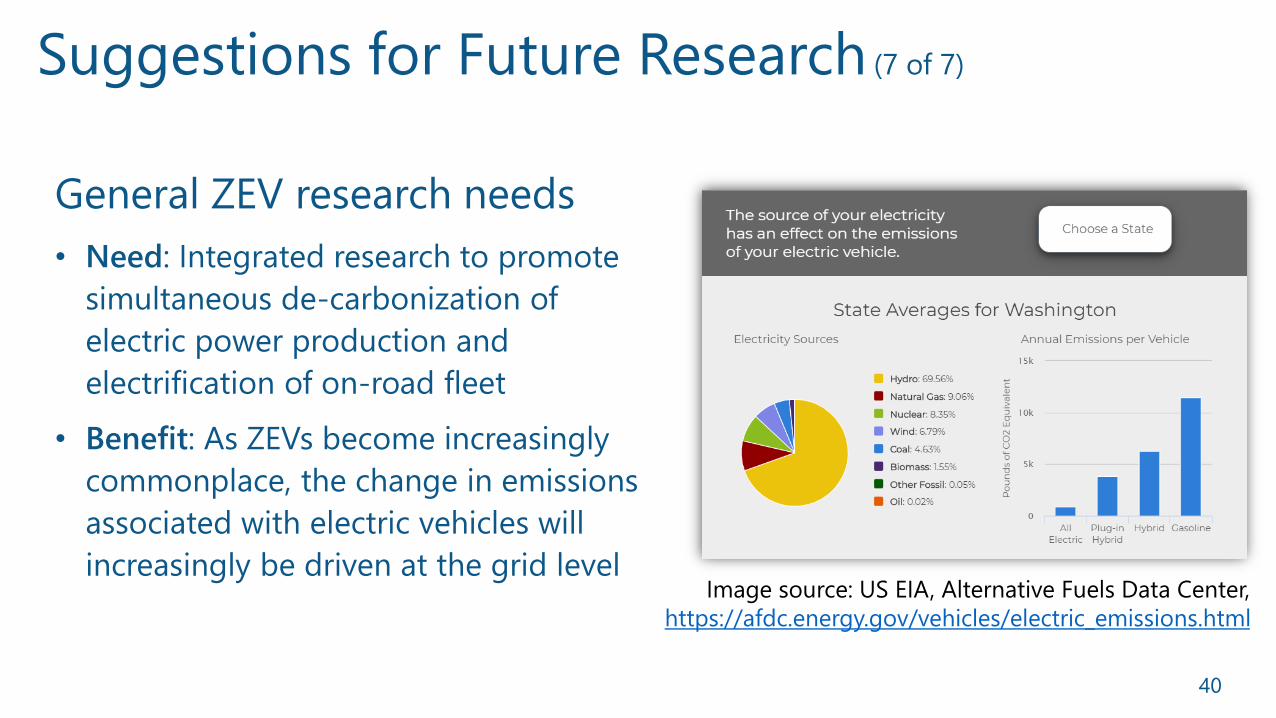
40
General ZEV research needs
• Need: Integrated research to promote
simultaneous de-carbonization of
electric power production and
electrification of on-road fleet
• Benefit: As ZEVs become increasingly
commonplace, the change in emissions
associated with electric vehicles will
increasingly be driven at the grid levelImage source: US EIA, Alternative Fuels Data Center,
https://afdc.energy.gov/vehicles/electric_emissions.html
Suggestions for Future Research (7 of 7)
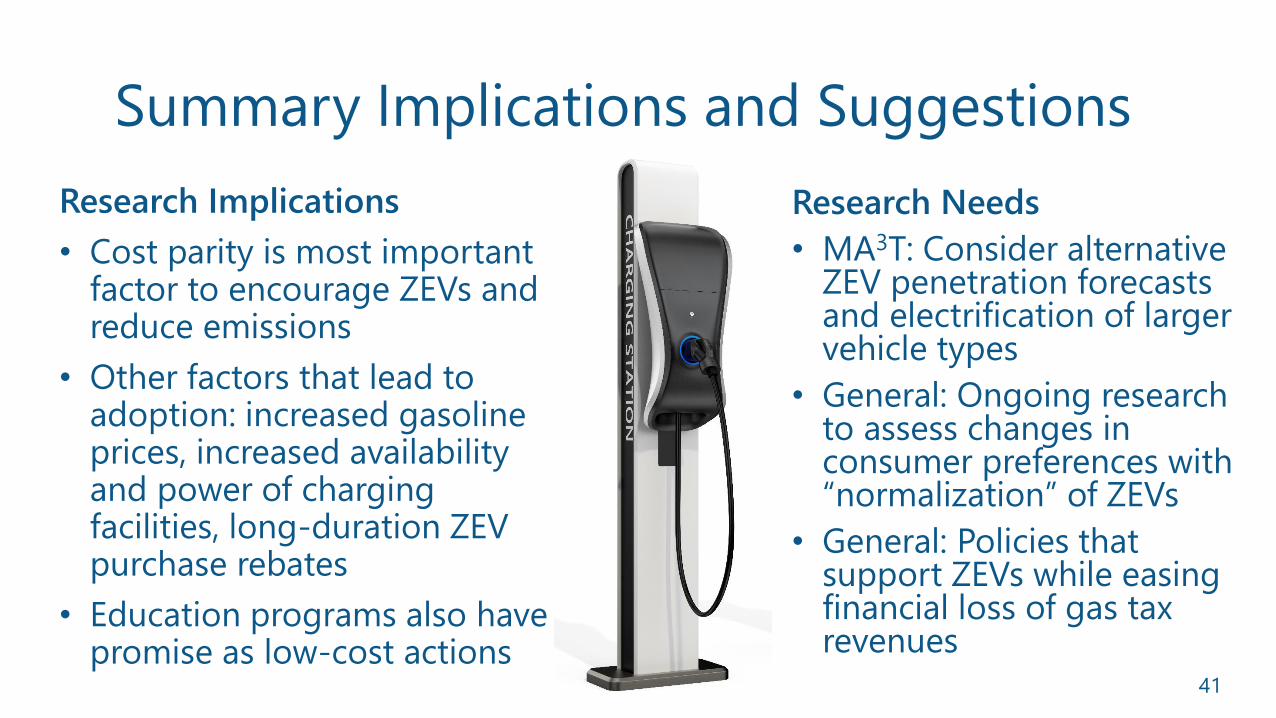
Summary Implications and Suggestions
41
Research Implications
• Cost parity is most important factor to encourage ZEVs and reduce emissions
• Other factors that lead to adoption: increased gasoline prices, increased availability and power of charging facilities, long-duration ZEV purchase rebates
• Education programs also have promise as low-cost actions
Research Needs
• MA3T: Consider alternative ZEV penetration forecasts and electrification of larger vehicle types
• General: Ongoing research to assess changes in consumer preferences with “normalization” of ZEVs
• General: Policies that support ZEVs while easing financial loss of gas tax revenues
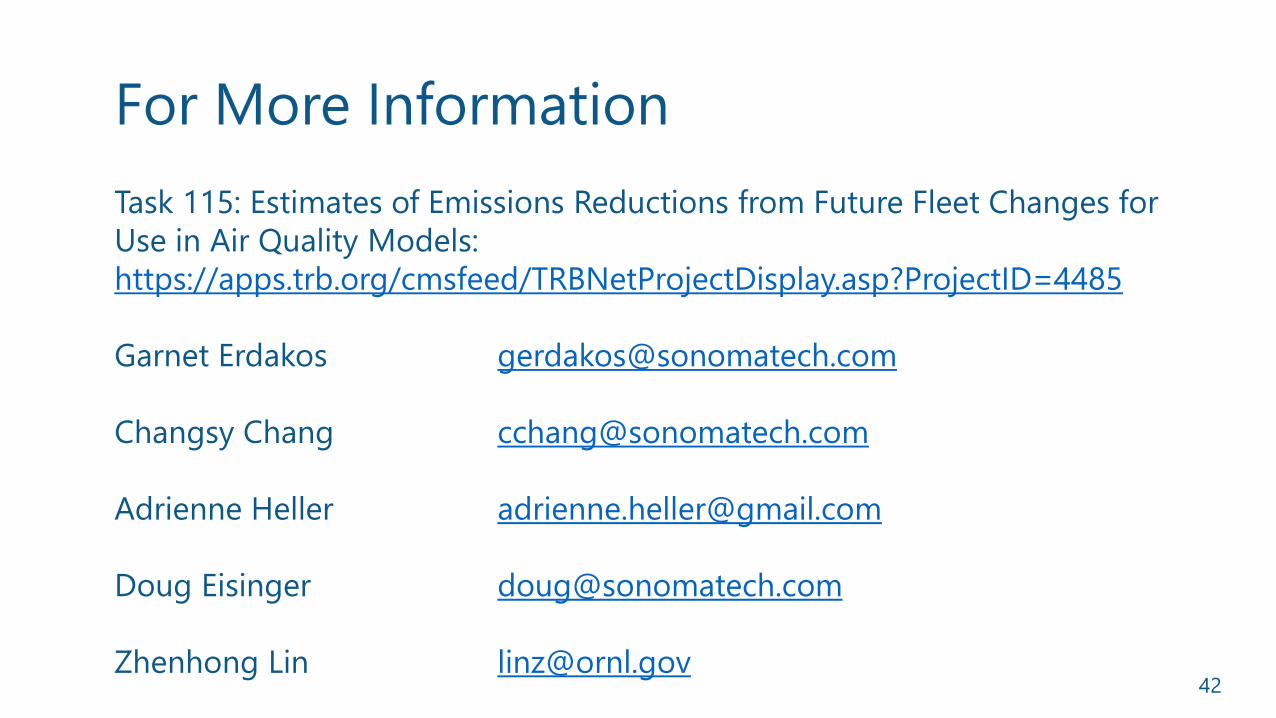
For More Information
42
Task 115: Estimates of Emissions Reductions from Future Fleet Changes for
Use in Air Quality Models:
https://apps.trb.org/cmsfeed/TRBNetProjectDisplay.asp?ProjectID=4485
Garnet Erdakos [email protected]
Changsy Chang [email protected]
Adrienne Heller [email protected]
Doug Eisinger [email protected]
Zhenhong Lin [email protected]

#TRBwebinar
Adrienne [email protected]
Doug Eisinger [email protected]
Garnet [email protected]
Shih Ying Chang (Changsy)[email protected]
Zhenhong [email protected] Ridge National Laboratory
Get Involved with TRB
#TRBwebinar
Receive emails about upcoming TRB webinarshttps://bit.ly/TRBemails
Find upcoming conferenceshttp://www.trb.org/Calendar
Get Involved with TRB
Be a Friend of a Committee bit.ly/TRBcommittees– Networking opportunities
– May provide a path to Standing Committee membership
Join a Standing Committee bit.ly/TRBstandingcommittee
Work with CRP https://bit.ly/TRB-crp
Update your information www.mytrb.org
#TRBwebinar
Getting involved is free!
#TRB100


![[XLS] - Mar15/District Reasi new proforma... · Web view2035 2300 2036 2300 2037 2300 2038 2300 2039 2300 2040 2300 2041 2300 2042 2300 2043 2300 2044 2300 2045 2300 2046 2300 2047](https://static.documents.pub/doc/80x56/5aa68dbc7f8b9a517d8ea409/xls-mar15district-reasi-new-proformaweb-view2035-2300-2036-2300-2037-2300.jpg)


