University of Pretoria Department of Economics Working Paper Series Foreign Direct Investment: South Africa’s Elixir of Life? C.E. Moolman, E.L. Roos, J.C. Le Roux and C.B. Du Toit University of Pretoria Working Paper: 2006-05 February 2006 __________________________________________________________ Department of Economics University of Pretoria 0002, Pretoria South Africa Tel: +27 12 420 2413 Fax: +27 12 362 5207 http://www.up.ac.za/up/web/en/academic/economics/index.html
Transcript
University of Pretoria Department of Economics Working Paper Series
Foreign Direct Investment: South Africa’s Elixir of Life? C.E. Moolman, E.L. Roos, J.C. Le Roux and C.B. Du Toit University of Pretoria Working Paper: 2006-05 February 2006 __________________________________________________________ Department of Economics University of Pretoria 0002, Pretoria South Africa Tel: +27 12 420 2413 Fax: +27 12 362 5207 http://www.up.ac.za/up/web/en/academic/economics/index.html
Foreign Direct Investment: South Africa’s Elixir of Life?
Moolman CE, Roos EL, Le Roux JC, Prof CB du Toit Department of Economics, University of Pretoria, South Africa
Abstract Foreign direct investment (FDI) has of late been revered as the solution to a great deal of the developing world’s problems. This paper seeks to examine the macroeconomic link between foreign direct investment in South Africa, and its resultant impact on potential output. Cointegration techniques and time-series data from 1970-2003 are utilized to construct a model suitable for policy analysis. Policy options, through which the level of foreign direct investment inflow can be raised, and its’ ultimate impact on output are investigated. Empirical results indicate that market size, openness, infrastructure and nominal exchange rate are factors on which South African policy makers should focus when seeking to attract foreign direct investment. JEL Classification: C5, C22, E22 Keywords: foreign direct investment, potential output, economic growth, macroeconomic model Presenting author: CE Moolman Contact details: Department of Economics University or Pretoria PRETORIA 0002 South Africa Tel: +27 12 420-3729 Fax: +27 12 362-5207 e-mail: [email protected]
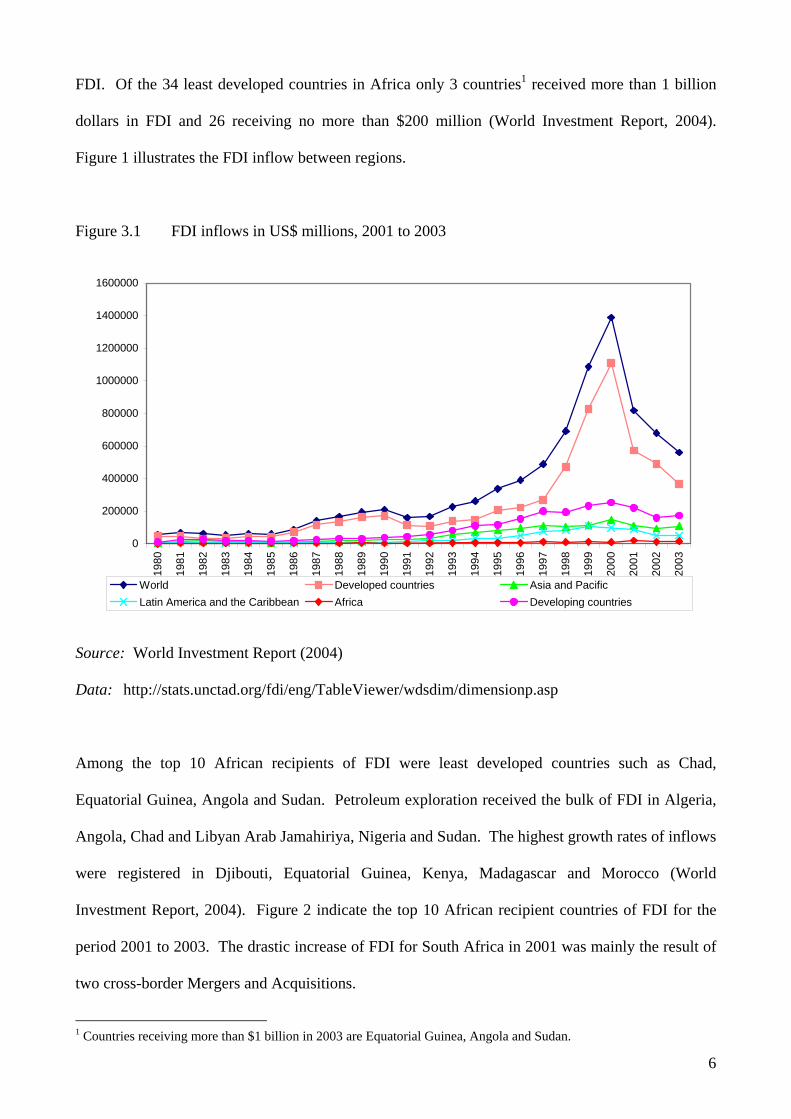
Countries that experience economic growth tend to exhibit political and economic stability and
implement policies that attract FDI. In addition FDI increase total capital, which leads to an overall
increase in GDP and productivity. The expected sign is positive. Nonnemberg and Cardoso de
Mendonca Bengoa showed in their panel data study of 38 developing countries that the average rate
of GNP growth in pervious periods to be significant and that the current rate of product growth not
to be significant
The markets size of the foreign direct investment receiving country exhibits a positive relationship
with levels of FDI. This relationship exists as the receiving country’s market size may indicate a
country’s economic conditions as well as potential demand for produced goods. Investors may also
prefer larger countries in order to benefit from economies of scale. Chakrabarti (2003) interestingly
points out that an increase in one regions’ FDI levels may be beneficial to other regions provided
these regions trade the goods produced by the foreign firm. Fung, Iizaka and Parker (2002) also
found a positive relationship between the market size and FDI and suggest that the magnitude of the
positive coefficient should be larger if the foreign investors target local markets instead of exporting
the produced goods. The expected sign is positive.
The degree of political, economic and social stability plays an important role regarding
investment decisions. A positive relationship seems to exist between these factors and FDI.
Bengoa and Sanchez-Robles (2003) find, in their study of 18 Latin American countries, that
economic freedom, a stable economy and liberalized markets are requirements for FDI. Bevan,
Estrin and Meyer (2004) examining the institutional framework in transitional Eastern European
economies, find that FDI is positively related to the degree of private business ownership, legal
development, foreign exchange and trade liberalization and the degree of banking sector reform.
8
Therefore, economic freedom is an important factor considered by investors and has a positive
impact on output growth.
Countries experiencing an increase in their debt burden have higher risk ratings and tend to be less
attractive to foreign investors. This high-risk rating implies that the probability of defaulting on the
foreign debt becomes greater. This could lead to the implementation of restrictions on the outflows
of international capital. Nonnemberg and Cardoso de Mendonca Bengoa showed in their panel data
study of 38 developing countries that risk is highly significant and affects FDI negatively. Sanchez-
Robles (2003) includes in their study, as a measurement of debt service, the debt/GDP ratio. This
ratio was found not to be significant at conventional levels. As an alternative measurement, dummy
variables were introduced. The first dummy variable captures the acute debt crisis experienced in
1980 to 1985 and the second dummy variable captures the effect of the devaluation of the Mexican
currency in 1994. During this time there was the fear that other Latin America countries will face
similar problems. Their study confirms the significant and negative impact large debt burdens and
financial crises have of FDI.
Inflation is often used as an indicator for monetary discipline and macroeconomic stability. A high
inflation rate illustrates a lack of discipline and commitment regarding policy issues. Bengoa and
Sanchez-Robles (2003) find inflation to be highly significant negatively correlated with FDI.
Nonnemberg and Cardoso de Mendonca Bengoa also used inflation as a proxy for macroeconomic
stability and found it to be negatively correlated with FDI. However, in a more restricted
estimation, this variable is not significant.
Opinions differ regarding the effect of currency strength on FDI movements. Chakrabarti (2003)
feels that two channels exist, the revenue and the cost channel. The revenue channel occurs as a
result of a strong currency translating local currency profits into larger foreign currency profits. The
9
cost channel exists as a result of immobile factors becoming more costly, resulting in product prices
rising and decreased competitiveness. The author thus claims that provided the revenue channel
exceeds the cost channel, a positive relationship will exist between FDI and currency appreciations.
Onyeiwu and Shrestha argue that inflation reduces a countries real effective exchange rate. This
depreciation reduces the amount of foreign exchange that an investor can repatriate as profits. If the
domestic asset prices do not increase, this inflation-induced depreciation may lead to a decrease in
net wealth. Ngowi (2001) on the other hand, feels that a weak currency is more likely to attract
FDI. In addition the cost of conversion will result in foreign firms ploughing profits back into the
FDI receiving country.
It is assumed that countries with an efficient and integrated infrastructure attract more FDI.
Onyeiwu and Shrestha and Zhang found a positive correlation between the level of infrastructure
and FDI. Fung, Iizaka and Parker on the other hand showed that infrastructure has no positive
influence on Japanese FDI in China and that infrastructure has a positive but very small coefficient
regarding US FDI In China. Bengoa and Sanchez-Robles (2003) found that although infrastructure
has a positive effect on FDI, the variable was not significant.
Empirical evidence on the effect of incentive policies indicates that they may prove effective in
attracting FDI. Marwah and Tavakoli (2004) investigate the relationship between FDI and
economic growth in Asia, with specific reference to Indonesia, Malaysia, the Philippines and
Thailand. The international policies of all four countries were changed after the 1970’s. The policy
shift generally included the relaxation of foreign investment regulations or alternatively the
implementation of initiatives to attract FDI. Based on data from 1970-1998, the results show that 20
to 25 per cent of the productivity of capital stock was generated by growth in foreign direct
investment. In addition, import tariffs in the FDI receiving country may create protectionary
10
incentives for a foreign firm to expand its business in a country rather than increase its exports to
that country.
Lui (2002) points out that China provides incentives for FDI, in the form of exemption from income
tax for the first two years and a 50 per cent reduction for three years thereafter. These incentives are
offered due to the belief that FDI promotes growth, specifically from the associated technology
transfers. Using data from 29 industries from 1993 to 1998 Lui (2002) investigates whether
technology spillovers, promoting growth, do in fact occur in China, as a result of FDI. The results
indicate that there are large spillover effects and that domestic sectors, specifically the
manufacturing sector, reap the benefits.
A country that implements trade liberalization policies, the more likely it is to attract FDI.
Nonnemberg and Cardoso de Mendonca are of the opinion that trade openness is a good proxy for
the type of relation a given country has with foreign capital. A country with a larger degree of trade
openness is more directed towards external markets and would be more open to foreign capital.
Onyeiwu and Shrestha found trade openness to be very important and although the coefficient is
small it is significant on a 1 per cent level of significance.
Onyeiwu and Shrestha argue that natural resource availability is a very important variable
explaining FDI inflows into Africa. Countries that are well endowed with natural resources seem to
attract more FDI than other countries. This might explain why Angola, Botswana, Nigeria and
Tunisia attract the most FDI in Africa.
There seems to be consensus regarding the effect of schooling on FDI. Fung, Iizaka and Parker
found that level of schooling might explain the major difference in FDI inflows. FDI from the US
and Japan are influenced significantly by the regional labour quality compared to FDI inflows from
11
Hong Kong and Taiwan that are not influenced by the level of schooling. This could be because
FDI form Hong Kong and Taiwan is concentrated in labour intensive industries that do not require
highly skilled labour.
The prevailing wage rate is identified as an important determinant of FDI levels, stemming from
changes in competitiveness. Higher relative wages may cause a foreign firm to be less competitive
in one region than in another and is therefore commonly associated with lower levels of foreign
direct investment. However, as Fung, Iizaka and Parker (2002) point out regional wages may
increase due to high local inflows of FDI.
Nonnemberg and Cardoso de Mendonca argues that the more sophisticated the industrial
structure, the more favourable are the strategic asset-seeking or efficiency-seeking FDI inflows. In
their study they use per capita energy consumption in host the countries to measure the degree of
development of the industrial structure. The expected sign is positive. They also argue that
investment is associated with international mergers and acquisitions. This is also strongly
influenced by stock market performance. Therefore, increases in the index DOWJONES reflect
moments of euphoria resulting in an increased willingness to make riskier investments. Their study
shows that the Dow Jones index is positively related to FDI.
12
13
Table 4.1 A summary of the determinants of some recent FDI studies
Author Method Determinants Proxy Sign and /or Significance Onyeiwu and Shrestha (2004)
Panel dataset for 29 African countries (1975 – 1999)
Economic growth Inflation Openness International reserves Natural resource availability Real interest rate External debt Tax Political rights Infrastructure
GDP growth rate Inflation rate Sum of imports and exports divided by GDP International reserves as a % of GDP Fuel exports as a % of total exports Real interest rate External debt as a % of GDP Corporate profit tax rate Freedom House Annual survey Main telephone lines per 1000 people
Positive and significant Negative and significant Positive and significant Wrong sign Positive and significant Not significant Significant only in random effects model Significant only in random effects model Not significant Not significant
Fung, Iizaka and Parker (2002)
Regional panel data (1991 –1997). Determine the relative importance of the determinants of US and Japanese direct investment in China.
Local market size Labour cost Human capital Density of roadway and railway Policy incentives
Gross domestic product Nominal wage lagged one period Number of student enrolled in higher education relative to the population Dummy variable take the value of 1 for the regions that are designated as SEZ and OCC or ETDZ2 or 0 otherwise
Positive Negative Positive
Bengoa and Sanchez-Robles (2002)
Panel data fir 18 Latin American countries (1970-1999)
Index of economic freedom Gross domestic product Debt services Inflation Railways Dummy (1980 –1985) Dummy (1990-1995)
Fraser index PPP Debt service divided by GDP Physical units of railway Alternative for debt services
Positive and significant Positive and significant Negative and not significant Negative and significant Positive but not significant Negative and significant Negative and significant
2 SEZ and OCC is the Special Economic Zones and Open Coastal Cities ETDZ is the Economic and Technological Development Zones
14
Zhang (2001) Cross section and Panel data: China
Market size Labour cost Labour Quality Agglomeration economies Transportation FDI incentives Cultural links Openness
Real GDP of a province Average real wage rate of manufacturing workers in a province Share of secondary-school students in total population in a province Share of manufacturing output in a province’s GDP Railroad and highways in km per square km of a province Dummy variable that takes value of 1 for coastal provinces with special economic zones/opened cities, and 0 for other provinces Dummy variable that takes a value of 1 for Guangdong and Fujian provinces, and 0 for other provinces Dummy variable that takes a value of 1 for the years since 1991, when the liberalized FDI regime was adopted, and 0 for other years
Panal data for 38 developing countries (including transition countries) (1975 – 2000)
Gross domestic product Average growth rate of GDP Level of schooling Trade openness Inflation Risk Energy consumption Dow Jones index Growth in FDI exporters
Average growth rate of GDP over the previous 5 years % of corresponding segment of the population enrolled in secondary school Proxy for the type of relation a given country has with foreign capital Proxy for the level of macroeconomic stability Risk rating measured by Euromoney Per capita energy consumption Measures stock market performance and euphoria Average rate of growth in the largest OECD exporters of FDI to developing countries
Positive and significant Positive and significant Positive and significant Positive and significant Negative and significant Negative and significant Not significant Positive and significant Positive and significant only if risk is not included
Own summary
5. Methodology and empirical model
5.1 A supply-side approach
Supply-side economics can be defined as a study of policies designed to stimulate economic growth
and promote price stability through measures such as lower taxation, increased savings, increased
productivity etc., that affect the supply of goods and services (Hailstones 1982:3). Keynesian
principles had been at the core of economic policy for many decades and although the term supply-
side economics was known as early as the 1960’s, it was only in the past few decades that supply-
side theory, policy and the modelling thereof, have become more popular in the field of economics.
The inadequacy of demand-oriented theory, policy and models to explain and solve problems such
as unemployment, stagflation, double-digit inflation, high interest rates, lagging productivity and
depreciating currencies led to the development of supply-side models.
The Keynesian approach focus on federal budgetary and monetary policies as means to stimulate
demand for goods and services to foster growth in production, based on the principles that an
increase in demand will automatically trickle down to increase aggregate supply. According to the
Keynesian approach, fiscal policy influences disposable income via spending, and the balanced
budget multiplier ensure that this change is transmitted to economic growth and employment. The
main difference between the classical and the supply-side approach is their view on savings. The
Keynesians consider savings as a leakage; an increase in savings will lead to a decline in economic
growth, while the supply-sider do not agree, since savings are not lost, but converted into
investment.
Supply-side economics stresses the necessity of understanding the structure of the production
process and the effect of each of the production factors on the level of output. A further aspect to be
taken into account when modelling supply-side behavioural equations is the incorporation of
15
supply-side policy instruments and their effect on the economy (Nickell 1988: 202). The purpose
of this paper is to estimate the impact of supply-side policy instruments through FDI on production
of the South African economy. In order to analyse the impact of FDI on the long-run economic
growth, an aggregate neoclassical production function for the South African economy is estimated.
5.2 The empirical model
It is evident from the literature review in section 4 that openness, infrastructure and market size
impacts positively on the attraction of FDI flows to a particular country. The empirical model
specification for FDI and portfolio investment is as follows:
sancdum)open,infra, rd,f(mkts,fdin = (5.1)
sancdum)crime, gdp_diff,rd,f(us_gdp,pin = (5.2)
A capital flows variable flows is created in order to capture the link between FDI and portfolio
investment through the net capital inflows variable reported in the national accounts, which feeds
Normailty Jarque-Bera 0.66 0.71 Normaly distributed Heteroscedasticity ARCH LM 0.02 0.88 No heteroskedasticity White 4.06 0.94 No heteroskedasticity Serial correlation BG LM 0.33 0.84 No serial correlation LB Q-statistic 1.86 0.93 No serial correlation Specification Ramsy RESET 4.53 0.10 Indicative of stability
6.3.2 Portfolio investment
Portfolio investment in the long run is specified and estimated in terms of US gdp and nominal
rand/dollar exchange rate. A dummy variable (Sancdum), being equal to 1 from 1985 to 1992,
accounting for the period when South Africa experienced sanctions from the rest of the world was
19
also included. The short-run dynamics of the system is influenced by the difference between South
African and US gdp, the nominal rand/dollar exchange rate and crime in South Africa. A dummy
variable (Dum99), equal to 1 in 1999, as well as a dummy variable (Dum00), equal to 1 from 2000
to 2003, was also included in order to capture impact of the Asian crises on South Africa. The
estimation results of the long run and error correction model are reported in equation 6.2 followed
by the results of the diagnostic tests.
∆Lpin t = 0.2779+ 2.6703 Lgdp_diff t + 0.3508∆ ∆ Lrd t + 0.7467∆Lcrime t - 0.3694Dum00 t +
Normailty Jarque-Bera 0.04 0.72 Normaly distributed Heteroscedasticity ARCH LM 0.02 0.88 No heteroskedasticity White 9.27 0.51 No heteroskedasticity Serial correlation BG LM 3.07 0.21 No serial correlation LB Q-statistic 7.30 0.29 No serial correlation Specification Ramsy RESET 0.67 0.72 Stable
6.3.3 Gross fixed capital formation
Gross fixed capital formation the long run is specified and estimated in terms of gross domestic
product, user cost of capital and financial constraints. The short-run dynamics of the system is
influenced by financial constraints and a dummy variable (Sancdum), being equal to 1 from 1985 to
1992, accounting for the period when South Africa experienced sanctions from the rest of the world
was also included. The estimation results of the long run and error correction model are reported in
equation 6.3 followed by the results of the diagnostic tests.
20
∆Lif t =0.0293+ 0.2815∆Lfin t - 0.0527Sancdum t -0.8272[LIF - 1.2288LGDP + 1−t 1−t
(4.9202) (7.1069) (-4.2667) (-8.5355)
0.1579LUCC2 + 0.4125LFIN - 10.0792] (6.3) 1−t
Adjusted R-squared: 0.86
Equation standard error: 0.0291
Purpose of test Test Test statistic
Probability Conclusion
Normailty Jarque-Bera 0.9479 0.6225 Normaly distributed Heteroscedasticity ARCH 0.0121 0.9121 No heteroskedasticity White 9.2868 0.0981 No heteroskedasticity Serial correlation Breusch-Godfrey LM 4.1066 0.1283 No serial correlation
Durbin Watson 1.5318 No serial correlation Q-Statistic 6.2184 0.399 No serial correlation Specification Ramsy RESET 5.5555 0.0622 Stable Parameter stability
CUSUM CUSUM of squares Recursive estimate Recursive residuals
All indicative of stability
6.3.4 Actual output
The actual output in the long run is specified and estimated in terms of capital and labor. A Cobb-
Douglas production function as fitted to the data and due to the nature of the South African Labour
market data; it was necessary to constrain the long-run actual output estimation to constant returns
to scale. A trend dummy variable (Tech), equal to 1 in 1995, was also included in order to capture
technological innovation. The estimation results of the long run model are reported in equation 6.4.
Lgdp t = 0.4338Lk t +0.5662Ln t + 0.0323Tech t + 6.0889 (6.4)
(0.0361) (12.6774) (13.8256)
Adjusted R-squared: 0.98
Equation standard error: 0.0276
21
7. Policy Implications
As noted in the introduction, the aim of this paper is to determine which factors are instrumental in
attracting foreign direct investment, and how a rise in FDI, as a result of policy implementation,
would ultimately influence output. In order to have a clear understanding of how a policy shift,
aimed at increasing FDI levels, will affect output, it is necessary to shock the determinants of FDI.
The degree of openness, market size, infrastructure and the nominal Rand/dollar exchange rate are
shocked with different percentages from 1988 to 2003.
7.1 Openness
It is evident from figure 7.1.1 below that FDI subsequently increase by 2.4 percent as a result of a 5
per cent increase in the degree of openness before returning to its equilibrium level over time. The
increase in FDI in turn increases output to a new equilibrium level 0.05 per cent higher than the
initial output.
Figure 7.1.1: Response characteristics of 5% shock of openness on FDI and output
0.0
0.4
0.8
1.2
1.6
2.0
2.4
2.8
1970 1975 1980 1985 1990 1995 2000
SHOCK_OPEN
.00
.01
.02
.03
.04
.05
.06
1970 1975 1980 1985 1990 1995 2000
SHOCK_OPEN_GDP
7.2 Market Size
22
Market size was identified as a long-run determinant of FDI. It is therefore not surprising that 2 per
cent increase in the market size variable translates into a permanent increase in FDI. A sizable
increase in FDI inflows is anticipated, with a rise in market size, and from figure 7.2.1 it is evident
that the 2 per cent rise in market size resulted in a new equilibrium for FDI 10 per cent higher than
the initial equilibrium. The increase in FDI in turn increases output by a large amount but it is not
evident to what equilibrium level output will return.
Figure 7.2.1: Response characteristics of 2% shock of market size on FDI and output
0
2
4
6
8
10
12
1970 1975 1980 1985 1990 1995 2000
SHOCK_MKTS
0.0
0.2
0.4
0.6
0.8
1.0
1.2
1.4
1.6
1970 1975 1980 1985 1990 1995 2000
SHOCK_MKTS_GDP
7.3 Infrastructure
Similar to the openness variable, the response characteristics of infrastructure increases after a 5 per
cent increase shock before returning to its initial equilibrium level. A 5 per cent increase in
infrastructure increases FDI by approximately 9 percent. The increase in infrastructure impacts
positively on output, raising it to a new equilibrium level of 0.4 per cent higher than the initial
equilibrium output.
23
Figure 7.3.1: Response characteristics of 5% shock of infrastructure on FDI and output
0
2
4
6
8
10
1970 1975 1980 1985 1990 1995 2000
SHOCK_INFRA
.0
.1
.2
.3
.4
.5
1970 1975 1980 1985 1990 1995 2000
SHOCK_INFRA_GDP
7.4 Rand/dollar exchange rate
The response characteristics of the Rand/dollar exchange rate are similar to the market size variable,
both determinants in the long-run equation of FDI, in that the long-run shock has a permanent effect
on FDI. A 4% depreciation of the Rand/dollar exchange rate results in a decrease in FDI, which
reaches a new equilibrium over time of 6.5 per cent lower than the initial equilibrium. It is not clear
what the size of the impact of the decrease in FDI will have on output in the long run but it is
evident that it is a negative effect.
Figure 7.4.1: Response characteristics of 4% shock of Rand/dollar on FDI and output
8. Conclusion
At a time when South Africa is struggling with poverty and the ravishes of HIV/AIDS, a recipe-like
formula for sustained economic growth would be warmly welcomed. It was perhaps the recent
success of the “Asian Miracle” countries that pushed the idea of foreign direct investment to the
24
forefront of many economists’ minds, leading them to believe that a solution to Africa’s growth
problems had indeed been found.
This study finds a link between FDI and economic growth. The empirical results of this study
indicate that policies aimed at improving openness, market size, infrastructure and appreciating
currency, would substantially increase FDI levels, which impacts on output.
This study has focused on the direct link between FDI and output, as it filters through new capital
formation. This link thus does not take other factors such as increased employment, improved skills
and new management techniques into account. All factors which have the potential to improve
(Nolan en Bohlies) productivity and thus output.
FDI should thus not blindly be regarded as the absolute answer to poverty reduction and improved
standards of living. As Devarajan, Easterly and Pack (2003) indicate, it is perhaps a case of
underlying structural fundamentals, resulting in unproductive investments, needing to be addressed
before additions to capital via FDI will result in improved potential output.
25
9. References
Akinlo, A 2004. “Foreign direct investment and growth in Nigeria An empirical investigation”
Journal of Policy Modeling 26:627-39
Bengoa, M & Sanchez-Robles, B 2003. “ Foreign direct investment and economic growth: New
evidence from Latin America” European Journal of Political Economy 19(3) 529-45.
Bevan, A; Estrin, S & Meyer, K 2004. “Foreign investment location and institutional development
in transition economies” International Business Review 13:43-64.
Chakrabarti, A 2003. “A theory of the special distribution of foreign direct investment”
International Review of Economics & Finance 12:149-69.
Durham, J 2004. “Absorptive capacity and the effects of foreign direct investment and equity
foreign portfolio investment of economic growth” European Economic Review 48(2):285-306.
Easterly, W 2002. The Elusive Quest for Growth Economists’ Adventures and Misadvetures in the
Tropics. The MIT Press Cambridge.
Hailstones, T.J. 1982. A Guide o Supply-Side Economics. New York: Robert F. Dame.
Lui, Z 2002. “Foreign direct investment and technology spillover: Evidence from China” Journal of
Comparative Economics 30:579-602.
Marwah, K & Tavakoli, A 2004. “The effect of foreign capital and imports on economic growth:
further evidence from four Asian countries (1970-1998)” Journal of Asian Economics 15:399-413.
Ngowi, H 2001. “Can Africa increase its global share of foreign direct investment” West Africa
Review Vol 2(2).
Van der Walt 1997. “A neoclassical model of foreign direct investment” Unpublished Thesis,
University of Pretoria.
26
Appendix A: Unit root tests
Table 1A Unit root tests Series Model ADF ADF ADF Philips Peron Lags ττ τµ τ φ3 φ1 lgdp T, c
C None
8 8 8
-2.5761 -1.2191
3.0099
3.6935 1.4864
-2.43 -1.15
5.54 lk T, c
C None
8 8 8
-3.4386* -2.9690
0.1973
232.22*** 270.92***
-3.42* -9.64***
3.30 ln T, c
C None
8 8 8
-2.6828 -2.0751 0.8916
15.21*** 9.658**
-2.14 -3.00**
1.45 lndirinvn
T, c C None
8 8 8
-1.5682 0.3310
3.4727
1.57 0.10
-1.61 0.61
4.42 lmkts T, c
C None
8 8 8
-2.6157 -2.1646
0.3962
3.48 4.01*
-2.36 -1.85
0.36 lrd T, c
C None
8 8 8
-2.9862 -0.2139
2.6593
3.84 0.04
-2.53 -0.29
2.48 linfra T, c
C None
8 8 8
-0.8213 -1.3291
2.3070
1.74 1.76
-0.33 -1.24
3.49 lcrime T, c
C None
8 8 8
-1.4553 -0.0027
1.5789
1.64 0.00
-1.63 -0.29
1.28 lif T, c
C None
8 8 8
-2.0914 -1.7236 1.4907
7.54** 9.46*
-2.23 -1.95 1.50
lucc2n T, c C None
8 8 8
0.1557 -2.5719
-1.8589*
3.61 6.61**
3.24 -2.72*
0.16 lfint T, c
C None
8 8 8
-2.3007 -1.9079
0.9735
2.66 3.64
-2.40 -1.89
1.32 linvestdef
T, c C None
8 8 8
-1.280111 -2.805128*
-3.318247***
9.81 12.03***
0.44 -1.79 -4.38***
lppi T, c C None
8 8 8
-0.499067 -1.889789
-2.156128**
12.91 19.88*
0.27 -1.55 -3.16***
* Statistically significant at 10% level ** Statistically significant at 5% level *** Statistically significant at 1% level
27
Table 2A Unit root tests, first differences Series Model ADF ADF ADF Philips Peron Lags ττ τµ τ φ3 φ1 ∆gdp T, c
C None
8 8 8
-4.13** -4.19*** -2.59**
8.64** 17.57***
-3.92** -4.01*** -2.42**
∆k T, c C None
8 8 8
-1.05 -1.17 -1.73
6.264018 8.368454
-1.43 -1.06 -1.62*
∆n T, c C None
8 8 8
3.06 -1.30 -1.04
3.69 1.70
-1.19 -1.76 -1.47
∆ndirinvn
T, c C None
8 8 8
-4.60*** -5.88*** -2.52**
11.77*** 4.65***
-6.11*** -5.89***
-4.50*** ∆mkts T, c
C None
8 8 8
-4.16** -4.22*** -4.28***
8.74** 17.8***
-3.95** -4.03***
-4.10*** ∆rd T, c
C None
8 8 8
-4.40*** -4.42*** -3.72***
7.93** 11.53***
-3.96** -4.09***
-3.76*** ∆infra T, c
C None
8 8 8
1.45 -4.11***
-3.06***
7.05 16.96***
-4.19** -4.12*** -3.06***
∆crime T, c C None
8 8 8
-4.40*** -4.36*** -4.18***
9.69*** 19.03***
-4.37*** -4.34*** -4.22***
∆if T, c C None
8 8 8
-4.36*** -4.48*** -4.14***
6.68* 10.31***
-2.52 -2.77* -2.74***
∆ucc2n T, c C None
8 8 8
-6.86*** -5.65*** -0.70
23.73*** 31.95***
-7.23*** -5.65*** -4.06***
∆fint T, c C None
8 8 8
-5.53*** -5.63*** -5.45
11.68*** 18.08***
-5.34*** -5.44*** -5.23***
∆investdef
T, c C None
8 8 8
-3.34* -2.68* -0.40
6.66* 7.20***
-3.31* -2.63* -0.85
∆ppi T, c C None
8 8 8
-2.51 -2.08 -0.86
4.04 4.36*
-1.95 -1.93 -0.72
* Statistically significant at 10% level ** Statistically significant at 5% level *** Statistically significant at 1% level The unit root test indicates that the ADF test statistics are smaller that the critical values and therefore the null hypothesis of non-stationary are rejected on at least a per cent level of significance. The Phillips-Perron statistics is smaller than the critical values and suggests that the null hypothesis can be rejected on at least a 10% level of significance.