80
FOREIGN OPERATIONS FY 2013 Performance Report

FOREIGN OPERATIONS
FY 2013 Performance Report

Introduction This section of the Fiscal Year 2015 Congressional Budget Justification contains the FY 2013 Foreign Operations Annual Performance Report (APR). The APR describes the work conducted by the U.S. Agency for International Development (USAID) and the Department of State to achieve foreign assistance goals under the current State - USAID strategic framework, and summarizes our performance through performance indicators and descriptive narrative. The FY 2013 APR will close out performance reporting under our current strategic framework consisting of seven goals. The Foreign Operations APR describes progress made against Strategic Goals 1, 3, and 4. Strategic Goals 2 and 5-7 are covered in the State Diplomatic Engagement APR.
1) Counter threats to the United States and the international order, and advance civilian security around the world.
2) Effectively manage transitions in the frontline states. 3) Expand and sustain the ranks of prosperous, stable and democratic states by promoting effective,
accountable, democratic governance; respect for human rights; sustainable, broad-based economic growth; and well-being.
4) Provide humanitarian assistance and support disaster mitigation. 5) Support American prosperity through economic diplomacy. 6) Advance U.S. interests and universal values through public diplomacy and programs that connect
the United States and Americans to the world. 7) Build a 21st century workforce; and achieve U.S. government operational and consular efficiency
and effectiveness, transparency and accountability; and a secure U.S. government presence internationally.
This section of the CBJ would typically include both the FY 2013 APR and the FY 2015 Annual Performance Plan (APP), however, a new reporting framework of performance goals and performance indicators aligned to the FY 2014-2017 State-USAID Joint Strategic Plan will commence with the FY 2015 APP. The FY 2015 APP and all future APRs and APPs aligned to the Joint Strategic Plan will be posted online at www.Performance.gov. Agency and Mission Information Department of State The U.S. Department of State (the Department) is the lead U.S. foreign affairs agency within the Executive Branch and the lead institution for the conduct of American diplomacy. Established by Congress in 1789, the Department is the nation’s oldest cabinet agency. The Department is led by the Secretary of State, who is nominated by the President and confirmed by the U.S. Senate. The Secretary of State is the President’s principal foreign policy advisor and a member of the President’s Cabinet. The Secretary carries out the President’s foreign policies through the Department and its employees. The Department of State advances U.S. objectives and interests in the world through its primary role in developing and implementing the President’s foreign policy worldwide. The Department also supports the foreign affairs activities of other U.S. Government entities including USAID. The Department carries out its foreign affairs mission and applies its values, globally, focusing its energies and resources on activities that best serve the American people and the world. The Department is headquartered in Washington, D.C. and has an extensive global presence, with more than 270 embassies, consulates, and other posts in over 180 countries. Host country Foreign Service National (FSN) and other Locally Employed (LE) staff contribute to advancing the work of the Department
Page 1 of 80
overseas. Both FSNs and other LE staff contribute local expertise and provide continuity as they work with their American colleagues to perform vital services for U.S. citizens. At the close of FY 2013, the Department was comprised of approximately 71,000 employees. USAID The mission of USAID is to partner to end extreme poverty and promote resilient, democratic societies while advancing our security and prosperity. Today, with the strong backing of the Obama Administration, the Agency is building on its legacy as one of the world’s premier development agencies and making new progress toward its ultimate goal: creating the conditions for U.S. assistance to no longer be needed. In 1961, the U.S. Congress passed the Foreign Assistance Act to administer long-range economic and humanitarian assistance to developing countries. Two months after passage of the act, President John F. Kennedy established the U.S. Agency for International Development. USAID unified pre-existing U.S. assistance programs and served as the U.S. Government’s lead international development and humanitarian assistance agency. USAID is an independent federal agency that receives overall foreign policy guidance from the Secretary of State. USAID is headed by an Administrator and Deputy Administrator, both appointed by the President and confirmed by the Senate. USAID plans its development and assistance programs in close coordination with the Department of State, and collaborates with a variety of other U.S. agencies, multilateral and bilateral organizations, private companies, academic institutions, and non-governmental organizations (NGO).With an official presence in over 80 countries and programs in several other non-presence countries, the Agency accelerates human progress in developing countries by reducing poverty, advancing democracy, empowering women, building market economies, promoting security, responding to crises, and improving the quality of life through investments in health and education. In 2013, the Agency’s mission was supported by 3,858 permanent and non-permanent direct hire employees, including 2,143 in the Foreign Service and 1,715 in the Civil Service. Additional support came from 4,223 Foreign Service Nationals, and 1,339 other non-direct hire employees (not counting institutional support contractors). Of these employees, 2,860 are based in Washington, D.C., and 6,561 are deployed overseas. USAID’s workforce and culture continue to serve as a reflection of core American values—values that are rooted in a belief in doing the right thing. Our Approach to Performance Management and Program Evaluation Department of State In February 2012, the Department of State issued its first evaluation policy, including guidance and training. The Department policy requires bureaus to evaluate all large programs, projects, and activities at least once in their lifetime, similar to the USAID requirement for missions. Since its implementation, the Department has aggressively moved forward on efforts to build a foundation for the use of evaluation findings to inform budgetary and programmatic decisions as well as joint strategic objectives with USAID. During FY 2013, the Department continued efforts to build capacity throughout the agency to ensure bureaus and program offices have the tools to use evidence, including evaluations, to inform program planning, ongoing performance analysis and resource requests. For the FY 2015 budget request, the Department asked bureaus and program offices to include a discussion in their CBJ chapter on their use of data and evidence—including evaluations—to inform leadership decision making. Additional information on the Department’s progress in implementing its evaluation policy can be found in the CBJ, Annex 1.
Page 2 of 80
The Department of State’s key achievements in strengthening evaluation include:
• More than 70 evaluations completed or in process by the end of FY2013 and more than 100 planned for 2014;
• Developing an evaluation management system (EMS) to house and track evaluations from statements of work to final reports. The EMS will eventually be able to deliver information on the number, type, and cost of evaluations as well as reveal trends in regions, topics and other areas;
• Providing graduate-level training in managing and designing evaluations to more than 150 staff members;
• Creating a community of practice that has more than 500 members to share best practices, tools, and information through monthly meetings, a web site that includes a virtual library and regular updates, and an internal bi-monthly newsletter;
• Providing technical assistance to more than 30 bureaus planning and contracting for evaluations-- from advice on statements of work, to evaluation design and methodology, to assistance with review of draft reports;
• Developing and implementing an evaluation funds competition to raise the profile of evaluation and provide supplemental funding and assistance to support Bureaus in implementing the evaluation policy. The third competition is underway as of the second quarter of FY 2014.
USAID Issued in 2011, the USAID Evaluation Policy has been called a “model for other Federal agencies” by the American Evaluation Association. The policy recognizes that evaluation is the means through which the Agency can obtain systematic, meaningful feedback about the successes and areas for improvement in its efforts. Evaluation provides the information and analysis to inform strategic and programmatic decisions; helps scale best practices and prevent less successful efforts from being repeated; and increases the chance that future investments will yield even more benefits than past investments. While evaluations must be embedded within a context that permits evidence-based decision-making and rewards learning and candor more than anecdotal success stories, the practice of conducting evaluations is fundamental to both the Department’s and USAID’s future strength. USAID’s Evaluation Policy can be found at http://www.usaid.gov/evaluation. USAID’s key achievements in strengthening evaluation include:
• In FY 2013, USAID completed 257 evaluations and had an additional 99 in process. Close to 300 evaluations are planned for FY 2014.
• Integrating evaluation throughout the USAID Program Cycle through six new supplementary guidance documents and related courses and workshops. Approximately 500 USAID staff and partners have been trained in evaluation this year (for a total of 1400 since 2011).
• Offering workshops and discussions for the Evaluation Interest Group, a voluntary community of practice for USAID staff to share evaluation good practices that has grown to more than 900 members.
• Sharing evaluation tools, resources and best practices on USAID’s two new online learning communities: the internal ProgramNet http://usaidlearninglab.org/faq/programnet and a public platform to learn with partners, Learning Lab (http://usaidlearninglab.org).
• Providing in-person technical support to at least 50 missions by Washington staff. Supporting evaluation points of contact in every USAID field mission through close coordination with regional bureau evaluation staff.
New guidance updates the requirement for missions to have Performance Management Plans that include
Page 3 of 80

Evaluation Plans for missions. Missions set the number of planned evaluations and resources required to accomplish them. Additional information about USAID’s efforts to use evidence in decision making can be found in the CBJ Annex 2 section, Acting on Evidence and Strengthening the Department of State and USAID Capacity to Build Evidence that Informs Foreign Assistance Decisions. Progress Update on the Agency Priority Goals and Federal Cross Agency Priority Goals Per the GPRA Modernization Act requirement to address Cross-Agency Priority (CAP) Goals in the Agency Strategic Plan, the Annual Performance Plan, and Annual Performance Report, please refer to www.performance.gov for our contributions to those goals and progress, where applicable. Major Management Challenges Department of State In FY 2013, the Department of State’s Office of Inspector General (OIG) identified management and performance challenges in the areas of: protection of people and facilities; contract and procurement management; information security and management; financial management; military to civilian-led transitions—Iraq and Afghanistan; foreign assistance coordination and oversight; public diplomacy; consular operations; leadership; and rightsizing. The Department promptly takes corrective actions in response to OIG findings and recommendations. More information on the management and performance challenges, and the Department’s response, can be found in the FY 2013 Agency Financial Report at: www.state.gov/documents/organization/217939.pdf. USAID USAID faces enormous challenges in executing humanitarian assistance and development programs in some of the most complex environments in the world. Agency work reaches farmers, students, government officials, women, children, and others in all sectors to spur agriculture, economic growth, transparent and accountable governance, education, and global health. In addition, Agency operations in conflict and post-crisis settings in Afghanistan and Pakistan support and affect U.S. national security interests. USAID faces its most serious management and performance challenges in six areas: ·work in non-permissive environments; sustainability; local solutions (formerly called implementation of procurement reform); performance management and reporting; management of information technology security; audits of U.S.-based for-profit entities. More information on these management challenges and USAID’s response can be found in the Agency Financial Report at: http://www.usaid.gov/results-and-data/progress-data/agency-financial-report.
Page 4 of 80
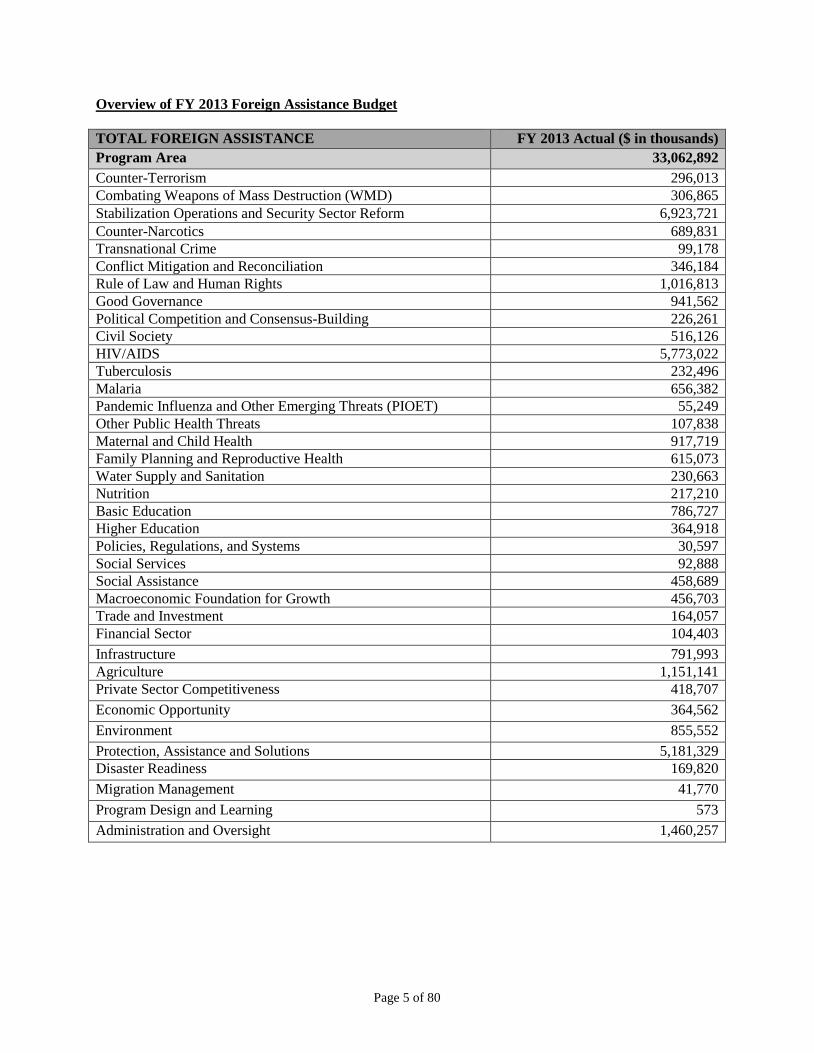
Overview of FY 2013 Foreign Assistance Budget TOTAL FOREIGN ASSISTANCE FY 2013 Actual ($ in thousands) Program Area 33,062,892 Counter-Terrorism 296,013 Combating Weapons of Mass Destruction (WMD) 306,865 Stabilization Operations and Security Sector Reform 6,923,721 Counter-Narcotics 689,831 Transnational Crime 99,178 Conflict Mitigation and Reconciliation 346,184 Rule of Law and Human Rights 1,016,813 Good Governance 941,562 Political Competition and Consensus-Building 226,261 Civil Society 516,126 HIV/AIDS 5,773,022 Tuberculosis 232,496 Malaria 656,382 Pandemic Influenza and Other Emerging Threats (PIOET) 55,249 Other Public Health Threats 107,838 Maternal and Child Health 917,719 Family Planning and Reproductive Health 615,073 Water Supply and Sanitation 230,663 Nutrition 217,210 Basic Education 786,727 Higher Education 364,918 Policies, Regulations, and Systems 30,597 Social Services 92,888 Social Assistance 458,689 Macroeconomic Foundation for Growth 456,703 Trade and Investment 164,057 Financial Sector 104,403 Infrastructure 791,993 Agriculture 1,151,141 Private Sector Competitiveness 418,707 Economic Opportunity 364,562 Environment 855,552 Protection, Assistance and Solutions 5,181,329 Disaster Readiness 169,820 Migration Management 41,770 Program Design and Learning 573 Administration and Oversight 1,460,257
Page 5 of 80
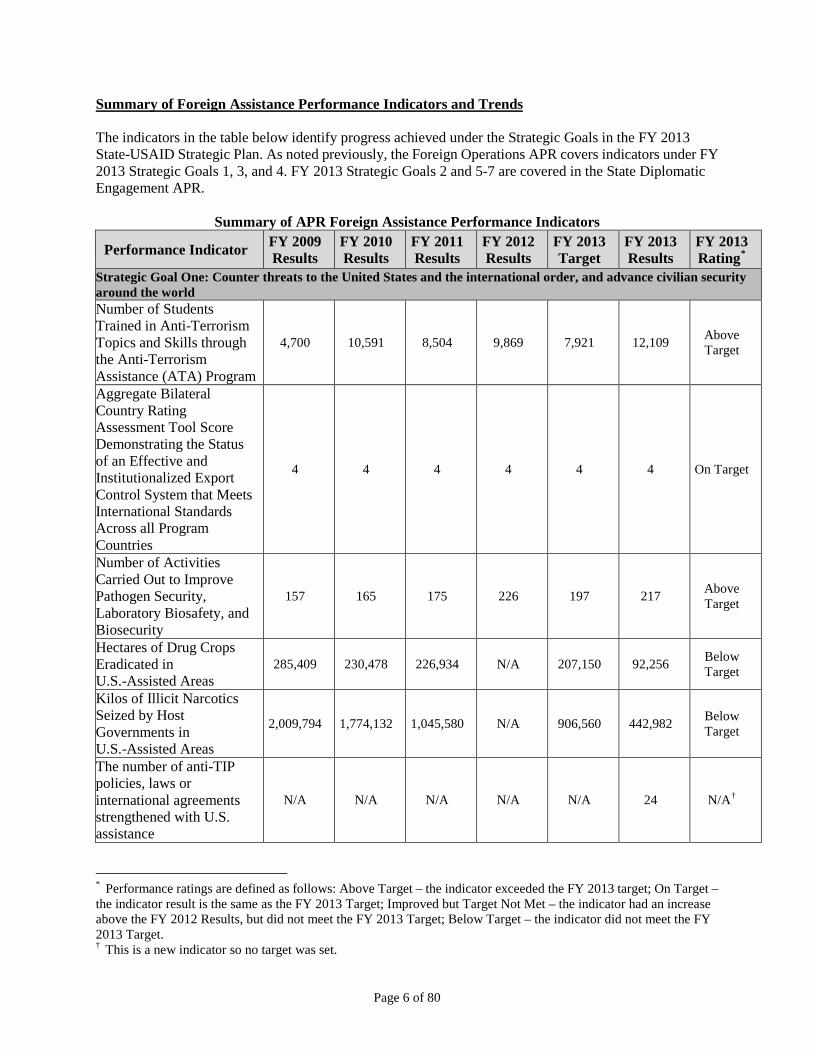
Summary of Foreign Assistance Performance Indicators and Trends The indicators in the table below identify progress achieved under the Strategic Goals in the FY 2013 State-USAID Strategic Plan. As noted previously, the Foreign Operations APR covers indicators under FY 2013 Strategic Goals 1, 3, and 4. FY 2013 Strategic Goals 2 and 5-7 are covered in the State Diplomatic Engagement APR.
Summary of APR Foreign Assistance Performance Indicators
Performance Indicator FY 2009 Results
FY 2010 Results
FY 2011 Results
FY 2012 Results
FY 2013 Target
FY 2013 Results
FY 2013 Rating*
Strategic Goal One: Counter threats to the United States and the international order, and advance civilian security around the world Number of Students Trained in Anti-Terrorism Topics and Skills through the Anti-Terrorism Assistance (ATA) Program
4,700 10,591 8,504 9,869 7,921 12,109 Above Target
Aggregate Bilateral Country Rating Assessment Tool Score Demonstrating the Status of an Effective and Institutionalized Export Control System that Meets International Standards Across all Program Countries
4 4 4 4 4 4 On Target
Number of Activities Carried Out to Improve Pathogen Security, Laboratory Biosafety, and Biosecurity
157 165 175 226 197 217 Above Target
Hectares of Drug Crops Eradicated in U.S.-Assisted Areas
285,409 230,478 226,934 N/A 207,150 92,256 Below Target
Kilos of Illicit Narcotics Seized by Host Governments in U.S.-Assisted Areas
2,009,794 1,774,132 1,045,580 N/A 906,560 442,982 Below Target
The number of anti-TIP policies, laws or international agreements strengthened with U.S. assistance
N/A N/A N/A N/A N/A 24 N/A†
* Performance ratings are defined as follows: Above Target – the indicator exceeded the FY 2013 target; On Target – the indicator result is the same as the FY 2013 Target; Improved but Target Not Met – the indicator had an increase above the FY 2012 Results, but did not meet the FY 2013 Target; Below Target – the indicator did not meet the FY 2013 Target. † This is a new indicator so no target was set.
Page 6 of 80

Performance Indicator FY 2009 Results
FY 2010 Results
FY 2011 Results
FY 2012 Results
FY 2013 Target
FY 2013 Results
FY 2013 Rating*
Number of New Groups or Initiatives Created through U.S. Funding with a Mission Related to Resolving the Conflict or the Drivers of the Conflict
N/A N/A 440 17,148 12,752 12,733 Below Target
Strategic Goal Three: Expand and sustain the ranks of prosperous, stable and democratic states by promoting effective, accountable, democratic governance; respect for human rights; sustainable, broad-based economic growth; and well-being Number of U.S.-Assisted Courts with Improved Case Management Systems
337 573 742 702 708 1,334 Above Target
Number of Domestic NGOs Engaged in Monitoring or Advocacy Work on Human Rights Receiving U.S. Support
3,484 4,679 4,662 818 449 914 Above Target
Number of Human Rights Defenders Trained and Supported
N/A N/A 3,345 15,426 12,322 21,078 Above Target
Number of Executive Oversight Actions Taken by Legislature Receiving U.S. Assistance
3,949 3,971 317 279 116 359 Above Target
Number of Training Days Provided to Executive Branch Personnel with U.S. Assistance
N/A N/A 315 5,394 6,121 7,490 Above Target
Number of Individuals Receiving Voter and Civic Education through U.S.-Assisted Programs
N/A N/A 19,108,679 58,020,113 59,878,338 140,950,044 Above Target
Number of Civil Society Organizations Receiving U.S. Assistance Engaged in Advocacy Interventions
1,772 2,629 4,362 11,247 23,937 13,570 Improved, but Target Not Met
Number of Non-State News Outlets Assisted by U.S. Government
1,761 1,769 1,507 2,791 1,361 1,116 Below Target
Number of Adults and Children with Advanced HIV Infection Receiving Antiretroviral Therapy (ART)
2.5M 3.2M 3.9M 5.1M 6.0M 6.7M Above Target
Number of Eligible Adults and Children Provided with a Minimum of One Care Service
11M 11.4M 12.9M 15.0M 16.5M 17.0M Above Target
Page 7 of 80

Performance Indicator FY 2009 Results
FY 2010 Results
FY 2011 Results
FY 2012 Results
FY 2013 Target
FY 2013 Results
FY 2013 Rating*
Percent of Registered New Smear Positive Pulmonary TB Cases That Were Cured and Completed Treatment Under DOTS Nationally (Treatment Success Rate)
83% 83% 86% 86% 87% 87% On Target
Case Notification Rate in New Sputum Smear Positive Pulmonary TB Cases per 100,000 Population Nationally
119/100,000 122/100,000 115/100,000 120/100,000 122/100,000 129/100,000 Above Target
Number of People Protected against Malaria with a Prevention Measure (Insecticide Treated Nets or Indoor Residual Spraying)
30M 40M 58M 50M 60M 45M Below Target
Number of Neglected Tropical Disease (NTD) Treatments Delivered through U.S.-funded Programs
130.6M 160.7M 186.7M 103.8M 150.0M 169.5M Above Target
Percent of Births Attended by a Skilled Doctor, Nurse or Midwife
47.80% 48.90% 50.00% 51.10% 52.20% 51.30% Improved, but Target Not Met
Percent of Children who Receive DPT3 Vaccine by 12 Months of Age
58.90% 59.00% 59.90% 60.80% 61.60% 60.40% Below Target
MCPR: Modern Method Contraceptive Prevalence Rate
27.30% 28.40% 29.80% 30.90% 31.90% 31.90% On Target
First Birth under 18 23.90% 24.40% 24.00% 23.30% 23% 22.50% Above Target‡
Percent of Households Using an Improved Drinking Water Source
N/A N/A N/A 37.50% 38.48% 38.39% On Target§
Percent of Households Using an Improved Sanitation Facility
N/A N/A N/A 12.60% 14.46% 13.44% Improved, but Target Not Met
Prevalence of Anemia among Women of Reproductive Age
46.00% N/A 41.40% 40.90% 40.40% 38.50% Above Target‡
‡ The intended targeted direction for this indicator is a decrease. § This indicator is considered On Target because the difference between the target and result is only 0.09%.
Page 8 of 80

Performance Indicator FY 2009 Results
FY 2010 Results
FY 2011 Results
FY 2012 Results
FY 2013 Target
FY 2013 Results
FY 2013 Rating*
Prevalence of Underweight Children under Five Years of Age
N/A N/A 22.90% 22.00% 21.30% 21.70% Improved, but Target Not Met**
Primary Net Enrollment Rate (NER) 78.90% 85.20% 81.80% 82.00% 83.00% 83.00% On Target
Number of People Benefitting from U.S.-Supported Social Assistance Programming
3,485,079 4,148,088 3,064,461 3,343,284 2,167,794 2,488,888 Above Target
Three-Year Average in the Fiscal Deficit as a Percent of Gross Domestic Product (GDP)
66.7% 60.0% 46.7% 26.7% 50% N/A Data Not Available††
Inflation Rate, Consumer Prices, Annual 4.20% 88.50% 53.80% 42.30% 55.00% 65.40% Above
Target Tax Administration and Compliance Improved (% Increase in Tax Collections) as a Result of U.S. Assistance
N/A N/A N/A 72% 25% 15%‡‡ Data Not Available
Time to Export/Import (Days) 74 days 72 days 72 days 70 days 69 days 69 days On Target
Number of Documents Required to Export Goods Across Borders Decreased
8 docs 8 docs 7 docs 7 docs 6 docs 7 docs Below Target**
Domestic Credit to the Private Sector as a Percent of GDP
64.10% 68.40% 65.80% 73.70% 70.00% 73.70% Above Target
Number of Beneficiaries Receiving Improved Infrastructure Services Due to U.S. Assistance
N/A N/A 5,820,641 225,725 765,227 11,607,794 Above Target
Number of Beneficiaries Receiving Improved Transport Services Due to U.S. Assistance
2,341,526 2,863,566 3,227,825 2,041,800 162,481 694,000 Above Target
Value of Incremental Sales (Collected at Farm-Level) Attributed to FTF Implementation
N/A 927,778 86,789,146 262,876,569 289,123,509 409,449,828 Above Target
** The intended targeted direction for this indicator is a decrease. †† CY 2012 data are not yet available to calculate FY 2013 results. ‡‡ Results for this indicator are from West Bank/Gaza only, so reporting is incomplete and an assessment of the FY 2013 Rating cannot be made at this time.
Page 9 of 80

Performance Indicator FY 2009 Results
FY 2010 Results
FY 2011 Results
FY 2012 Results
FY 2013 Target
FY 2013 Results
FY 2013 Rating*
Number of Farmers or Others who have Applied New Technologies or Management Practices as a Result of U.S. Assistance
659,384 1,506,187 5,271,629 7,375,877 8,528,161 6,063,450 Below Target
Global Competitiveness Index 42.10% 72.10% 76.20% 53.10% 70.00% 59.40%
Improved, but Target Not Met
Quantity of Greenhouse Gas (GHG) Emissions, Measured in Metric Tons of CO2e, Reduced or Sequestered as a Result of U.S. Assistance
120,000,000 120,000,000 200,000,000 165,057,815 129,757,454 134,270,462 Above Target
Number of Hectares of Biological Significance and/or Natural Resources under Improved Natural Resource Management as a Result of U.S. Assistance
104,557,205 92,700,352 101,800,000 99,737,668 73,274,945 95,074,936 Above Target
Strategic Goal Four: Provide humanitarian assistance and support disaster mitigation Percentage of Refugees Admitted to the U.S. Against the Regional Ceilings Established by Presidential Determination
99.50% 98.00% 73.00% 80.00% 100.00% 99.99% On Target
Percentage of NGO or Other International Organization Projects that include Dedicated Activities to Prevent and/or Respond to Gender-Based Violence
28.30% 30.00% 38.00% 45.00% 35.00% 56.00% Above Target
Percentage of U.S.-Funded NGO or Other International Organization Projects that include Activities or Services Designed to Reduce Specific Risks or Harm to Vulnerable Populations
N/A N/A 37% 40% N/A 100% N/A§§
Percent of Planned Emergency Food Aid Beneficiaries Reached with U.S. Assistance
93% 93% 93% 93% 93% 90% Below Target
§§ At the beginning of FY 2013, USAID introduced new requirements for all humanitarian NGO programs to include protection mainstreaming. Because of this, no target was set.
Page 10 of 80

Performance Indicator FY 2009 Results
FY 2010 Results
FY 2011 Results
FY 2012 Results
FY 2013 Target
FY 2013 Results
FY 2013 Rating*
Percentage of Surveyed Refugee Camps in Protracted Situations where Global Acute Malnutrition (GAM) does not exceed 10 Percent
N/A N/A 98% 50% 73% 47% Below Target
Number of Internally Displaced and Host Population Beneficiaries Provided with Basic Inputs for Survival, Recovery or Restoration of Productive Capacity as a Result of U.S. Assistance
N/A N/A 59,007,997 48,989,676 45,000,000 61,315,940 Above Target
Percentage of Host Country and Regional Teams and/or Other Stakeholder Groups Implementing Risk-Reducing Practices/Actions to Improve Resilience to Natural Disasters as a Result of U.S. Assistance within the Previous 5 Years
N/A N/A 5% 17% 20% 17% Below Target
Number of People Trained in Disaster Preparedness as a Result of U.S. Assistance
10,004 18,030 12,396 26,768 18,857 28,647 Above Target
Cross-Cutting Indicators Number of People Reached by a U.S. Funded Intervention Providing GBV Services (e.g., Health, Legal, Psycho-Social Counseling, Shelters, Hotlines, Other)
N/A N/A 1,757,601 1,886,460 765,284 800,634 Above Target
Page 11 of 80

STRATEGIC GOAL ONE Counter threats to the United States and the international order, and advance civilian security
around the world. Program Area: Counterterrorism $ in thousands FY 2013 Actual TOTAL FOREIGN OPERATIONS BUDGET 33,062,892 Counter-Terrorism 296,013 Terrorism is the greatest challenge to U.S. national security. Combating it will continue to be the focus of development, diplomatic, and defense efforts as long as the proponents of violent extremist ideologies find safe havens and support in unstable and failing states. The U.S. Government aims to expand foreign partnerships and to build global capabilities to prevent terrorists from acquiring or using resources for terrorism. U.S. programming to combat terrorism is multifaceted and flexible to allow for the best response to the evolving threats. Consistent with our National Counterterrorism Strategy, our approach to address this challenge in the coming years will focus on Countering Violent Extremism and building stronger relationships with foreign partners bilaterally and multilaterally. Efforts will focus on strengthening the counterterrorism capacities of law enforcement and criminal justice officials, including the police, prosecutors, judges, and prison officials, within a rule of law framework and providing them with the technology to identify and interdict suspected terrorists attempting to transit air, land, or sea ports of entry. The U.S. Government also delivers technical assistance and training to improve the ability of host governments to investigate and interdict the flow of money to terrorist groups, and supports activities that de-radicalize youth and support moderate leaders. The United States is working to increase the capacity, skills, and abilities of host country governments, as well as strengthen their commitment to work with the U.S. Government to combat terrorism, while respecting human rights. One way the United States monitors the success of initiatives to increase capacity and commitment to counterterrorism efforts is by tracking the number of people trained to aid in them. Training allies to counter terrorism is a smart and efficient way to extend a protective net beyond the U.S. borders that ensures terrorism is thwarted before it reaches the United States, while at the same time strengthening U.S. partnerships. A critical mass of trained individuals in key countries is vital to this effort. Counterterrorism Training To truly defeat terror networks, there needs to be effective international partners in government and civil society who can extend counterterrorism efforts to all places where terrorists operate. This indicator is important because it shows the concrete contributions made by the Antiterrorism Assistance (ATA) training to global counterterrorism capacity building. Out-year targets are set by projecting the number of deliveries that will be offered in each partner nation in a given fiscal year based on the trajectory outlined in current Country Assistance Plans (CAPs) and based on the funding expected or estimated to be available to obligate in a particular partner nation during the fiscal year (FY) in question. For the purposes of setting out year targets, the total number of deliveries to be offered is then multiplied by the average number of participants trained per ATA course based on past records. For this indicator, the ATA program exceeded its FY 2013 target of training by 65.4 percent, including training an additional 836 foreign law enforcement officials in counterterrorism skills. However, this target was set based on the ATA program alone and not inclusive of Regional Strategic Initiative (RSI) funding, which also receives funding from the ATA account but does not always use the ATA program as its
Page 12 of 80

implementer. Counterterrorism program managers acknowledge that gender disaggregation data was not collected in 2012; however, baseline data was started in FY 2013. Based upon the first year of collection, 4.4 percent of participants were female.
STRATEGIC GOAL ONE Program Area: Counterterrorism Performance Indicator: Number of Students Trained in Anti-Terrorism Topics and Skills through the Anti-Terrorism Assistance (ATA) Program
FY 2009 FY 2010 FY 2011 FY 2012 FY 2013 FY 2013 FY 2013 Results Results Results Results Target Results Rating
4,700 10,591 8,504 9,869 7,921 12,109 Above Target
Data Source: To determine the results, we added up the actual number of students trained in each course delivered in each partner nation within that fiscal year. Data Quality: To determine the indicator, the number of participants trained, we examine data from the respective posts, ATA Training Management Division (TMD) records, Training Delivery Division (TDD) records, and After Action Reviews provided after each course to ATA's Training Curriculum Division. The number of students trained is reflected in the After Action Reviews and is uploaded into TDD and TMD records. This number is drawn from the class roster graduates of each course, which is created by the instructors or ATA support personnel at post. Program Area: Combating Weapons of Mass Destruction $ in thousands FY 2013 Actual TOTAL FOREIGN OPERATIONS BUDGET 33,062,892 Combating Weapons of Mass Destruction (WMD) 306,865 The proliferation of Weapons of Mass Destruction (WMD) to states of concern, non-state actors, and terrorists is an urgent threat to the security of the United States and the international community. To combat this threat, the U.S. Government works to prevent the spread of WMD - whether nuclear, biological, chemical, or radiological - and their delivery systems, as well as the acquisition or development of such weapons capabilities by states of concern and terrorists. Foreign assistance funding is vital to this effort. These programs are used to strengthen foreign government and international capabilities to deny access to WMD and related materials, expertise, and technologies; destroy WMD and WMD- related materials; prevent nuclear smuggling; strengthen strategic trade and border controls worldwide; and counter terrorist acquisition or use of materials of mass destruction. Export Control Systems Strong strategic trade and border control systems are at the forefront of U.S. efforts to prevent the proliferation of WMD. The Export Control and Related Border Security (EXBS) Program assists foreign governments with improving their legal and regulatory frameworks, licensing processes, and enforcement capabilities to stem illicit trade and trafficking in, and irresponsible transfers of, WMD-related components and advanced conventional weapons. In FY 2013, the EXBS program assisted over 50 partner countries to bolster their capacities to interdict unlawful transfers of strategic items as well as to recognize and reject transfer requests that would contribute to proliferation. Program-wide assessment data provides a basis to evaluate overall EXBS program effectiveness across all partner countries. Assessments are conducted using the Rating Assessment Tool (RAT), with methodology centered on 419 data points examining a given country's licensing, enforcement, industry outreach, and
Page 13 of 80

international cooperation and nonproliferation regime adherence structures. The EXBS program funds independent third parties to conduct baseline assessments and periodic assessment updates, with internal updates otherwise conducted annually. All country-specific RAT scores are averaged to calculate a program-wide score, using this score to track EXBS performance on a year-to-year basis. Using this metric since FY 2009, EXBS strives for a 4 percent annual increase to its program-wide score.
STRATEGIC GOAL ONE Program Area: Combating Weapons of Mass Destruction Performance Indicator: Aggregate Bilateral Country Rating Assessment Tool Score Demonstrating the Status of an Effective and Institutionalized Export Control System that Meets International Standards Across all Program Countries
FY 2009 FY 2010 FY 2011 FY 2012 FY 2013 FY 2013 FY 2013 Results Results Results Results Target Results Rating
4 4 4 4 4 4 On Target Data Source: Department of State's Bureau of International Security and Nonproliferation. EXBS annually assesses the status of strategic trade control systems in all countries where EXBS assistance is provided. Assessments are conducted using methodology originally developed by the University of Georgia's Center for International Trade and Security (UGA/CITS). EXBS funds UGA/CITS and others to conduct baseline assessments and periodic re-assessments while otherwise reassessing each partner country annually through internal progress reporting. Data is obtained through implementer reports of trainings and other activities, on-site advisor reporting, embassy reporting, and bilateral and multilateral consultations. Data Quality: Assessment methodology is centered on a 419-data point Rating Assessment Tool. This tool is applied to all EXBS partner countries annually to derive country-specific numeric scores. Scores are then averaged across all countries to provide an overall EXBS program score for the given fiscal year. The above indicator strives for a 4% annual increase to the overall EXBS program score. Biological Threat The biological weapon (BW) threat is of particular concern because biological agents are widespread and commonly used or needed for medical, agricultural, and other legitimate purposes; the expertise and equipment necessary for developing and disseminating BW is increasingly available; and the consequences of a bioterrorism attack could be devastating. A key objective of the President's National Strategy for Countering Biological Threats is mitigating the potential for misuse of the life sciences in a manner that does not stifle innovation or scientific advances. The State Department's Biosecurity Engagement Program (BEP) was launched in 2006 to reduce the likelihood that terrorists and proliferant states could access BW-applicable knowledge, expertise, and/or materials. BEP advances its mission by enhancing security at laboratories that house especially dangerous pathogens, such as anthrax; boosting BW detection capabilities in the public health, veterinary, and law enforcement sectors; and institutionalizing biorisk management best practices. BEP monitors program success by tracking the number of implemented activities aimed at improving laboratory biosecurity priority countries and regions. Activities in FY 2013 focused on enhancing biosecurity in high threat countries of South Asia, the Middle East, and North Africa, and improving physical security and biorisk management practices at priority laboratories in Yemen, Iraq, Afghanistan, Indonesia, and the states neighboring Syria. BEP sponsored scientists, technicians, and engineers from 35 countries throughout the Middle East, South and Southeast Asia, North Africa, and other regions to participate in 217 trainings, conferences, projects, and grants to improve select agent pathogen security, laboratory biorisk management best practices, and control of disease outbreaks from especially dangerous pathogens. The increase in the number of activities reported under this indicator is due to collaborative efforts between BEP and implementing partners to maximize the
Page 14 of 80

impact of BEP's financial support for biosecurity projects. As an example of BEP's activities in FY 2013, BEP established Bioresource Centers at Universities in Sana’a and Taiz in Yemen to promote responsible conduct in research and bioethics, reducing the risk that dual-use scientists are exploited.
STRATEGIC GOAL ONE Program Area: Combating Weapons of Mass Destruction Performance Indicator: Number of Activities Carried Out to Improve Pathogen Security, Laboratory Biosafety, and Biosecurity
FY 2009 FY 2010 FY 2011 FY 2012 FY 2013 FY 2013 FY 2013 Results Results Results Results Target Results Rating
157 165 175 226 197 217 Above Target
Data Source: The Department of State's Bureau of International Security and Nonproliferation. Reports of trainings and other activities, consultations with implementers, embassy reporting. Data Quality: Once a project is undertaken, data is obtained in a timely manner and thoroughly reviewed by expert consultants, GTR program managers, and the relevant Contracting Officer's Representative. Data must meet the five quality standards of validity, integrity, precision, reliability, and timeliness. Program Area: Counter-Narcotics $ in thousands FY 2013 Actual TOTAL FOREIGN OPERATIONS BUDGET 33,062,892 Counter-Narcotics 689,831 U.S. activities in this Program Area are designed to reduce the cultivation and production of drugs, combat international narcotics trafficking, and cut off the demand for illicit narcotics through prevention and treatment. The U.S. Government works with international, regional and bilateral partners to establish and implement international drug policies and improve partner capabilities in reducing supply and demand. It also combats narcotics-related crime such as corruption and money laundering. This effort is a long-term struggle against well-financed criminals who undermine democratic governments. Inevitably, this will be a permanent struggle, but an integrated approach is showing success and is a crucial complement to reducing demand at home. The long-term goal of International Narcotics Control and Law Enforcement appropriations is to reduce the flow of drugs to the United States, addressing instability in the Andean region and strengthening the ability of both source and transit countries to investigate and prosecute major drug trafficking organizations and their leaders and to block and seize their assets. Among other efforts, the U.S. Government accomplishes this through aerial eradication, forced and voluntary manual eradication, increasing capabilities for drug interdiction, reducing demand, strengthening rule of law, and supporting alternative livelihood efforts. Drug Crops Eradicated Eradication is a critical component of the U.S. Government's counternarcotics strategy in the Andean region but is not the only metric used in determining success. Eradication is measured by calendar year (CY) rather than fiscal year (October-September). The CY 2013 Target was revised from last year. The 2013 target for Colombia was 135,000 hectares, and for Peru it was 18,000 hectares. Bolivia did not have a target for CY 2013 because U.S. direct operational support ended in 2013. The overall 2013 target for Colombia and Peru combined was 153,000 hectares. Colombia eradicated a total of 69,171 hectares in CY 2013, including 47,051 aerially and 22,120 manually. Peru eradicated 23,785 hectares in CY 2013.
Page 15 of 80

Combined, the two countries eradicated a total of 92,956 hectares.
STRATEGIC GOAL ONE Program Area: Counter-Narcotics Performance Indicator: Hectares of Drug Crops Eradicated in U.S.-Assisted Areas
FY 2009 FY 2010 FY 2011 FY 2012 FY 2013 FY 2013 FY 2013 Results Results Results Results Target Results Rating
285,409 230,478 226,934 N/A 207,150 92,256 Below Target
Data Source: The indicator uses information reported by country programs on a calendar year basis. This data is from the most recent Foreign Assistance Performance Plan and Report for Colombia and Peru. Data Quality: Eradication data provided by embassies is the best data available to the U.S. government regarding U.S. government and host government coca eradication and INL assumes that this information has undergone a Data Quality Assessment (DQA) and is accurate, complete, and unbiased. Illicit Narcotics Seized It is essential to disrupt overseas sources of illicit narcotics and cut off the transit capabilities of transnational criminal organizations. Strengthening host government capabilities to conduct interdiction and drug crop eradication activities independent of U.S. Government support will ultimately build capable local police units and law enforcement institutions equipped to attack narcotics trafficking and dismember transnational criminal organizations. By strengthening the capacity of our host nation partners, trafficking lanes become more costly, risks become greater, and suppliers become unreliable. Colombian security forces reported seizures of approximately 118 metric tons (MT) of cocaine hydrochloride (HCL) and cocaine base (including 84.1 MT in national seizures and 33.6 MT of seizures made outside Colombia by international partners using Colombian intelligence); 274 MT of marijuana; 282 kilograms (kg) of heroin; and approximately 1.9 MT of liquid and 6.9 MT of solid precursor chemicals. In addition, Colombian authorities destroyed 168 HCL labs, one heroin lab, and two potassium permanganate labs. The Government of Peru (GOP) reported that by the end of 2013, approximately 11 MT of cocaine paste and 13.3 MT of HCL had been seized. The GOP also reported the seizure of 3.7 MT of marijuana. In addition, the Peruvian National Police Anti-Narcotics Directorate (DIRANDRO) destroyed 869 cocaine laboratories and seized 13.9 MT of coca leaf.
Page 16 of 80
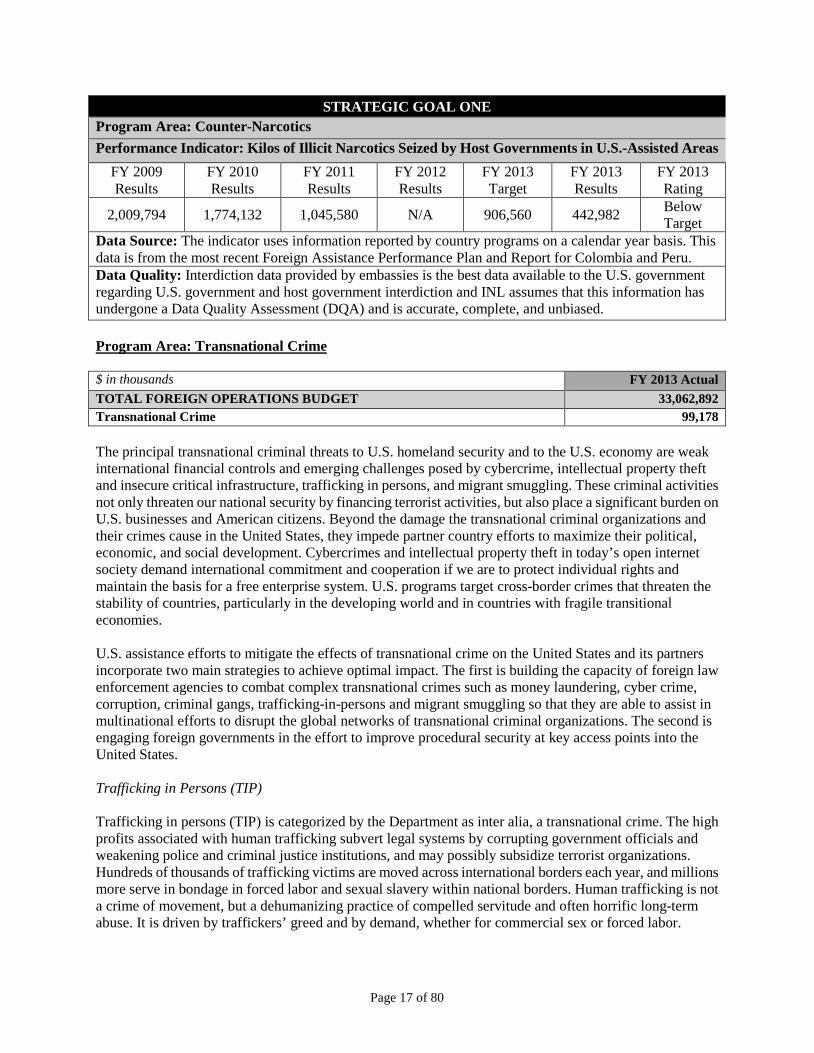
STRATEGIC GOAL ONE Program Area: Counter-Narcotics Performance Indicator: Kilos of Illicit Narcotics Seized by Host Governments in U.S.-Assisted Areas
FY 2009 FY 2010 FY 2011 FY 2012 FY 2013 FY 2013 FY 2013 Results Results Results Results Target Results Rating
2,009,794 1,774,132 1,045,580 N/A 906,560 442,982 Below Target
Data Source: The indicator uses information reported by country programs on a calendar year basis. This data is from the most recent Foreign Assistance Performance Plan and Report for Colombia and Peru. Data Quality: Interdiction data provided by embassies is the best data available to the U.S. government regarding U.S. government and host government interdiction and INL assumes that this information has undergone a Data Quality Assessment (DQA) and is accurate, complete, and unbiased. Program Area: Transnational Crime $ in thousands FY 2013 Actual TOTAL FOREIGN OPERATIONS BUDGET 33,062,892 Transnational Crime 99,178 The principal transnational criminal threats to U.S. homeland security and to the U.S. economy are weak international financial controls and emerging challenges posed by cybercrime, intellectual property theft and insecure critical infrastructure, trafficking in persons, and migrant smuggling. These criminal activities not only threaten our national security by financing terrorist activities, but also place a significant burden on U.S. businesses and American citizens. Beyond the damage the transnational criminal organizations and their crimes cause in the United States, they impede partner country efforts to maximize their political, economic, and social development. Cybercrimes and intellectual property theft in today’s open internet society demand international commitment and cooperation if we are to protect individual rights and maintain the basis for a free enterprise system. U.S. programs target cross-border crimes that threaten the stability of countries, particularly in the developing world and in countries with fragile transitional economies. U.S. assistance efforts to mitigate the effects of transnational crime on the United States and its partners incorporate two main strategies to achieve optimal impact. The first is building the capacity of foreign law enforcement agencies to combat complex transnational crimes such as money laundering, cyber crime, corruption, criminal gangs, trafficking-in-persons and migrant smuggling so that they are able to assist in multinational efforts to disrupt the global networks of transnational criminal organizations. The second is engaging foreign governments in the effort to improve procedural security at key access points into the United States. Trafficking in Persons (TIP) Trafficking in persons (TIP) is categorized by the Department as inter alia, a transnational crime. The high profits associated with human trafficking subvert legal systems by corrupting government officials and weakening police and criminal justice institutions, and may possibly subsidize terrorist organizations. Hundreds of thousands of trafficking victims are moved across international borders each year, and millions more serve in bondage in forced labor and sexual slavery within national borders. Human trafficking is not a crime of movement, but a dehumanizing practice of compelled servitude and often horrific long-term abuse. It is driven by traffickers’ greed and by demand, whether for commercial sex or forced labor.
Page 17 of 80
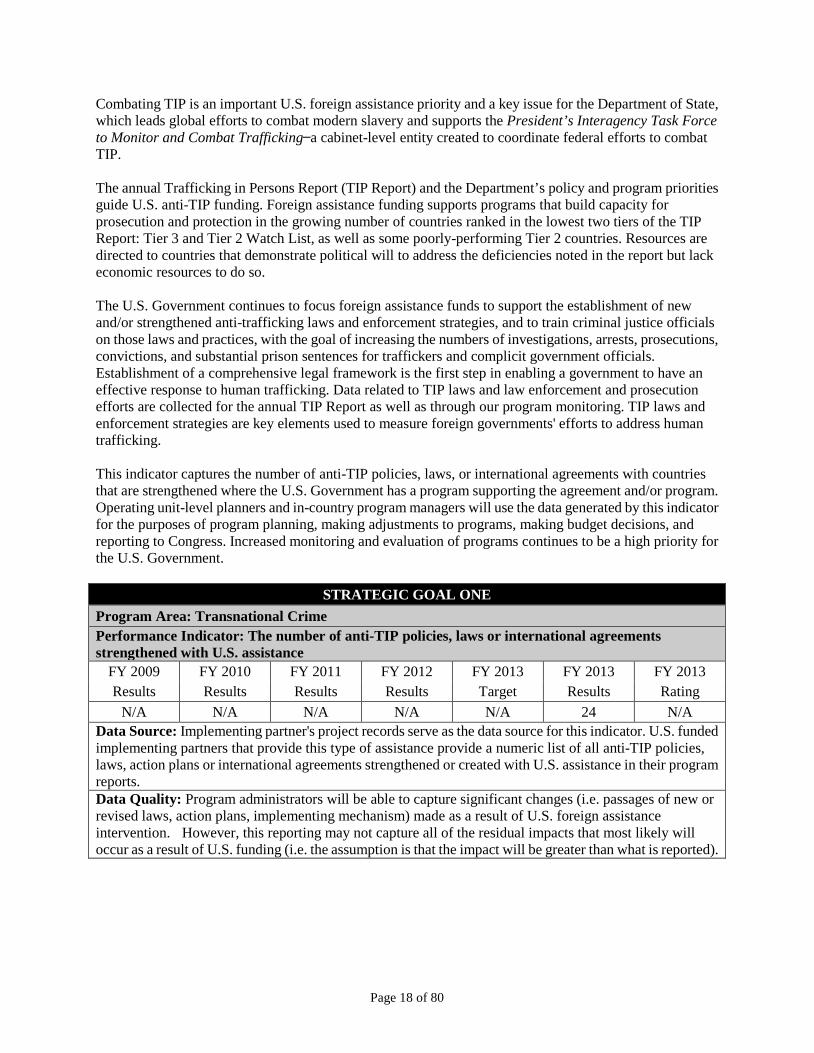
Combating TIP is an important U.S. foreign assistance priority and a key issue for the Department of State, which leads global efforts to combat modern slavery and supports the President’s Interagency Task Force to Monitor and Combat Trafficking ̶ a cabinet-level entity created to coordinate federal efforts to combat TIP. The annual Trafficking in Persons Report (TIP Report) and the Department’s policy and program priorities guide U.S. anti-TIP funding. Foreign assistance funding supports programs that build capacity for prosecution and protection in the growing number of countries ranked in the lowest two tiers of the TIP Report: Tier 3 and Tier 2 Watch List, as well as some poorly-performing Tier 2 countries. Resources are directed to countries that demonstrate political will to address the deficiencies noted in the report but lack economic resources to do so. The U.S. Government continues to focus foreign assistance funds to support the establishment of new and/or strengthened anti-trafficking laws and enforcement strategies, and to train criminal justice officials on those laws and practices, with the goal of increasing the numbers of investigations, arrests, prosecutions, convictions, and substantial prison sentences for traffickers and complicit government officials. Establishment of a comprehensive legal framework is the first step in enabling a government to have an effective response to human trafficking. Data related to TIP laws and law enforcement and prosecution efforts are collected for the annual TIP Report as well as through our program monitoring. TIP laws and enforcement strategies are key elements used to measure foreign governments' efforts to address human trafficking. This indicator captures the number of anti-TIP policies, laws, or international agreements with countries that are strengthened where the U.S. Government has a program supporting the agreement and/or program. Operating unit-level planners and in-country program managers will use the data generated by this indicator for the purposes of program planning, making adjustments to programs, making budget decisions, and reporting to Congress. Increased monitoring and evaluation of programs continues to be a high priority for the U.S. Government.
STRATEGIC GOAL ONE Program Area: Transnational Crime Performance Indicator: The number of anti-TIP policies, laws or international agreements strengthened with U.S. assistance
FY 2009 FY 2010 FY 2011 FY 2012 FY 2013 FY 2013 FY 2013 Results Results Results Results Target Results Rating
N/A N/A N/A N/A N/A 24 N/A Data Source: Implementing partner's project records serve as the data source for this indicator. U.S. funded implementing partners that provide this type of assistance provide a numeric list of all anti-TIP policies, laws, action plans or international agreements strengthened or created with U.S. assistance in their program reports. Data Quality: Program administrators will be able to capture significant changes (i.e. passages of new or revised laws, action plans, implementing mechanism) made as a result of U.S. foreign assistance intervention. However, this reporting may not capture all of the residual impacts that most likely will occur as a result of U.S. funding (i.e. the assumption is that the impact will be greater than what is reported).
Page 18 of 80

Program Area: Conflict Mitigation and Reconciliation $ in thousands FY 2013 Actual TOTAL FOREIGN OPERATIONS BUDGET 33,062,892 Conflict Mitigation and Reconciliation 346,184 Many of the causes of violence, extremism and instability – such as deteriorating economies, weak or illegitimate political institutions, and competition over natural resources – are central concerns of U.S. assistance programs. U.S. stakes in these countries are high. To meet U.S. foreign policy commitments for building peace and security, assistance resources are used to prevent and manage violent conflict at all levels, but are particularly focused at the local level. U.S. assistance programs are designed to address the unique needs of each country as it transitions from conflict to peace and to establish a foundation for longer-term development by promoting reconciliation, fostering democracy, and providing support for nascent government operations. In addition, assistance resources help ensure that U.S. assistance programs in other sectoral areas (economic growth, education, etc.) are sensitive to the conflict dynamics of the local country context, and do not exacerbate existing tensions and grievances among groups. These programs help to mitigate conflict in vulnerable communities around the world by improving attitudes toward peace, building healthy relationships and conflict mitigation skills through person-to-person contact among members of groups in conflict, and improving access to local institutions that play a role in addressing perceived grievances. New Groups or Initiatives Created to Resolve Conflict or the Drivers of Conflict The indicator below registers the creation of a new group or entity, as well as the launch of a new initiative or movement by an existing entity that is dedicated to resolving conflict or the drivers of the conflict. Groups include registered non-governmental organizations, clubs, associations, networks, or similar entities. Initiatives may be campaigns, programs, projects, or similar sets of activities sustained over a period of three months or more by the same types of groups/entities. Building peace or resolving conflict must be a stated purpose of the group or initiative as expressed in a grant proposal or documentation submitted to the U.S. Government, but peace-building need not be the publicly stated purpose. Groups/entities may not include the U.S. Government, Host Governments, political parties, or security forces. To be counted in this indicator, U.S. funding must have been a necessary enabling factor leading to the creation of the group or initiative. In FY 2013, a total of twelve countries and one Washington bureau reported data. The FY 2013 result was reported as 12,733, achieving 99.85% of the 12,752 target. One operating unit intended to drop this indicator for FY 2013, but its projected target was included in the Agency level, thus accounting for most of the very small difference between target and actual levels. In FY 2013, successful programming included U.S. support for national and local-level stabilization and transition efforts in Kenya. These efforts targeted recovery by mitigating political and social volatility and reducing vulnerability to violence, which included: Kenya's military incursion into Somalia; a rising secessionist movement on the Coast; the March 2013 Kenyan elections; and the potential for devastating economic impact on the entire East African region due to violence disrupting the transportation sector. U.S.-supported programming around the March 2013 elections increased dramatically as various methods were used to spread messages of peace and build the capacity of communities to rapidly identify and respond to potential sources of conflict. Results were achieved through dialogue meetings, local peace forums, performing arts, photo exhibitions, documentary films, public service announcements, and radio messages.
Page 19 of 80

STRATEGIC GOAL ONE Program Area: Conflict Mitigation and Reconciliation Performance Indicator: Number of New Groups or Initiatives Created through U.S. Funding with a Mission Related to Resolving the Conflict or the Drivers of the Conflict
FY 2009 FY 2010 FY 2011 FY 2012 FY 2013 FY 2013 FY 2013 Results Results Results Results Target Results Rating
N/A N/A 440 17,148 12,752 12,733 Below Target
Data Source: For FY 2013, countries reporting results included Azerbaijan, Cote d'Ivoire, Democratic Republic of the Congo, Guinea, Kenya, Libya, Nigeria, Peru, Rwanda, Sudan, Uganda, Zimbabwe, and USAID Democracy, Conflict, and Humanitarian Assistance (USAID). Data Quality: Data Quality: Performance data, verified using Data Quality Assessments (DQAs), must meet standards of validity, integrity, precision, reliability, and timeliness. Each OU must document the methodology used to conduct the DQAs. DQA and data source records are maintained in the Performance Management Plans; Missions certify via the Performance Plan and Report that a DQA has occurred within the last three years. (For details, refer to USAID's Automated Directive System [ADS] Chapter 203.3.11, http://www.usaid.gov/policy/ads/200/203.pdf).
Page 20 of 80

STRATEGIC GOAL THREE Expand and sustain the ranks of prosperous, stable and democratic states by promoting effective,
accountable, democratic governance; respect for human rights; sustainable, broad-based economic growth; and well-being.
Program Area: Rule of Law and Human Rights $ in thousands FY 2013 Actual TOTAL FOREIGN OPERATIONS BUDGET 33,062,892 Rule of Law and Human Rights 1,016,813 The United States supports programs that help countries build the necessary rule of law infrastructure, particularly in the justice sector, to uphold and protect their citizens’ basic human rights. The rule of law is a principle of governance under which all persons, institutions, and entities, public and private, including the state itself, are accountable to laws that are publicly promulgated, equally enforced, independently adjudicated, and consistent with international laws, norms, and standards. Activities in this Program Area also advance and protect individual rights as embodied in the Universal Declaration of Human Rights and international conventions to which states are signatories. This includes defending and promoting the human rights of marginalized populations such as women, youth, religious minorities, people with disabilities, indigenous groups, and lesbian, gay, bisexual, and transgender (LGBT) people. Priorities also include using innovative strategies to counter human trafficking and prevent atrocities. Case Management Improvement By helping build effective case management systems, assisted governments are able to increase the effectiveness, compliance, and accountability of justice systems. Improved case management leads to a more effective justice system by decreasing case backlog and case disposition time, reducing administrative burdens on judges, increasing transparency of judicial procedures, and improving compliance with procedural law. The U.S. Government exceeded its FY 2013 target for this indicator by 626 courts due to greater than anticipated interest from cooperating courts and expansion of the types of eligible courts in several countries. For example, Afghanistan ramped up material and technical assistance to encourage widespread usage of the Afghanistan Case Management System. Also, as part of its new justice programming, Columbia provided greater support to the judiciary through technical assistance to the newly-formed land restitution courts.
Page 21 of 80

STRATEGIC GOAL THREE Program Area: Rule of Law and Human Rights Performance Indicator: Number of U.S.-Assisted Courts with Improved Case Management Systems
FY 2009 FY 2010 FY 2011 FY 2012 FY 2013 FY 2013 FY 2013 Results Results Results Results Target Results Rating
337 573 742 702 708 1,334 Above Target
Data Source: FY 2013 Performance Reports as collected in the Foreign Assistance and Coordination System (FACTS). Data Quality: Performance data are verified using Data Quality Assessments (DQA) and must meet five data quality standards of validity, integrity, precision, reliability, and timeliness. The methodology used for conducting the DQAs must be well documented by each OU. (For details, refer to USAID's Automated Directive System [ADS] Chapter 203.3.11, http://www.usaid.gov/policy/ads/200/203.pdf). Human Rights Activities The U.S. Government promotes and defends human rights through a range of activities including: supporting Non-Governmental Organizations (NGOs) that advocate for and monitor human rights; training and supporting human rights defenders and other watchdog groups; providing legal assistance and medical and psycho-social care and treatment to victims of organized violence and torture; supporting atrocity prevention efforts; supporting counter-trafficking in persons efforts; promoting transitional justice initiatives; and promoting and protecting the rights of vulnerable groups including LGBT persons, indigenous peoples, people with disabilities, war victims, and displaced children and orphans. With the release of the new USAID Strategy on Democracy, Human Rights, and Governance (DRG) and creation of a DRG Center at USAID, “human rights” has been elevated as a co-equal pillar alongside democracy and governance, a new Human Rights Team has been created, and a Human Rights Grants Program (HRGP) was launched in order to assist Missions with the development of human rights programs. In FY 2013, $8.2 million was awarded to 22 missions through the HRGP to fund grassroots efforts to promote and protect human rights. In Jordan, activities focused on the reduction of early marriage, human trafficking, child labor, and sexual and gender-based violence (SGBV) through awareness-raising campaigns targeting both Syrian refugees and host communities currently impacted by the influx of Syrians into Jordan. In Uganda, the HRGP advanced transitional justice by documenting, reporting and taking steps to prosecute crimes committed against women and girls during the conflict in the north. A Kyrgyzstan project fostered increased protection of human rights through public awareness, government action, and strengthening the capacity of local human rights organizations to effectively monitor, advocate, and offer protection mechanisms to victims. Through core institutional strengthening grants, this program built the capacities of human rights defenders to engage in monitoring, advocacy, and protection measures more effectively and sustainably, with a particular focus on vulnerable populations in southern Kyrgyzstan. Programming in Nicaragua integrated human rights into ongoing HIV/AIDS activities, while building the capacity of LGBT civil society organizations (CSO) to better advocate for their constituents and claim their rights with an aim of reducing stigma, discrimination, and gender-based violence against LGBT individuals. The U.S. Government exceeded its FY 2013 target for the number of domestic NGOs engaged in monitoring or advocacy work on human rights by 465 NGOs due to the initiation of unanticipated activities, increasing demand for training, and sharp increases in the capacity of CSOs in Burma and other countries.
Page 22 of 80
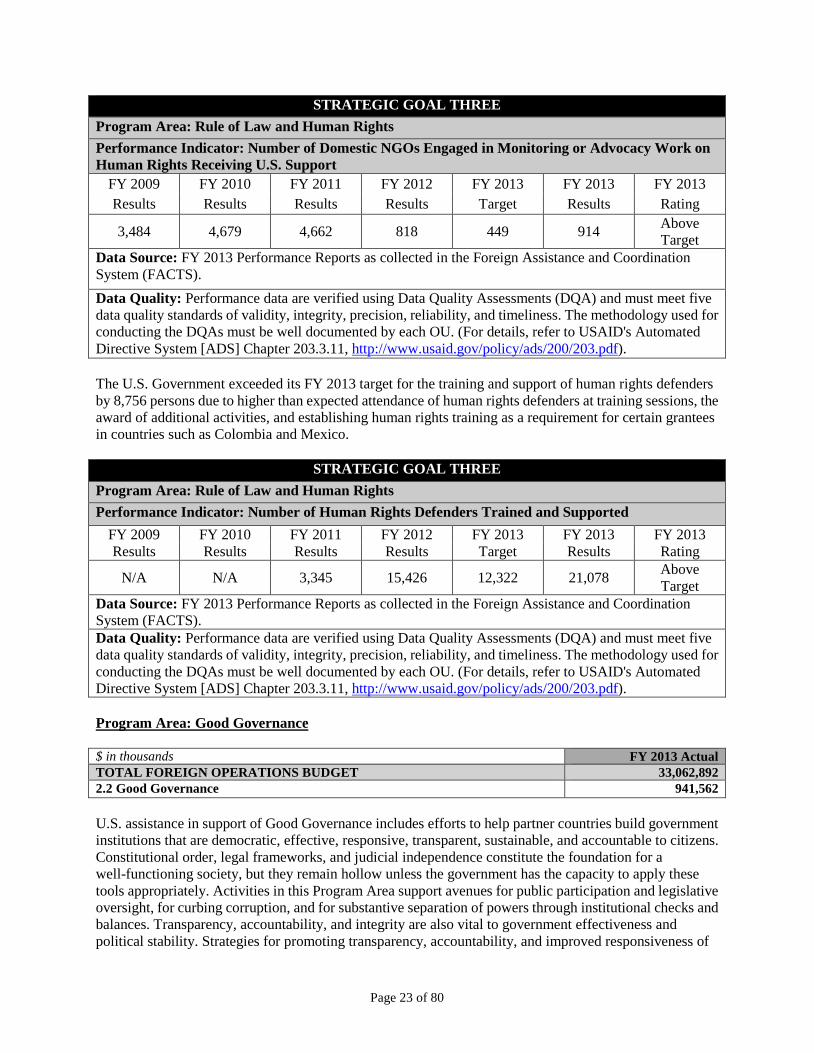
STRATEGIC GOAL THREE Program Area: Rule of Law and Human Rights Performance Indicator: Number of Domestic NGOs Engaged in Monitoring or Advocacy Work on Human Rights Receiving U.S. Support
FY 2009 FY 2010 FY 2011 FY 2012 FY 2013 FY 2013 FY 2013 Results Results Results Results Target Results Rating
3,484 4,679 4,662 818 449 914 Above Target
Data Source: FY 2013 Performance Reports as collected in the Foreign Assistance and Coordination System (FACTS). Data Quality: Performance data are verified using Data Quality Assessments (DQA) and must meet five data quality standards of validity, integrity, precision, reliability, and timeliness. The methodology used for conducting the DQAs must be well documented by each OU. (For details, refer to USAID's Automated Directive System [ADS] Chapter 203.3.11, http://www.usaid.gov/policy/ads/200/203.pdf). The U.S. Government exceeded its FY 2013 target for the training and support of human rights defenders by 8,756 persons due to higher than expected attendance of human rights defenders at training sessions, the award of additional activities, and establishing human rights training as a requirement for certain grantees in countries such as Colombia and Mexico.
STRATEGIC GOAL THREE Program Area: Rule of Law and Human Rights Performance Indicator: Number of Human Rights Defenders Trained and Supported
FY 2009 FY 2010 FY 2011 FY 2012 FY 2013 FY 2013 FY 2013 Results Results Results Results Target Results Rating
N/A N/A 3,345 15,426 12,322 21,078 Above Target
Data Source: FY 2013 Performance Reports as collected in the Foreign Assistance and Coordination System (FACTS). Data Quality: Performance data are verified using Data Quality Assessments (DQA) and must meet five data quality standards of validity, integrity, precision, reliability, and timeliness. The methodology used for conducting the DQAs must be well documented by each OU. (For details, refer to USAID's Automated Directive System [ADS] Chapter 203.3.11, http://www.usaid.gov/policy/ads/200/203.pdf). Program Area: Good Governance $ in thousands FY 2013 Actual TOTAL FOREIGN OPERATIONS BUDGET 33,062,892 2.2 Good Governance 941,562 U.S. assistance in support of Good Governance includes efforts to help partner countries build government institutions that are democratic, effective, responsive, transparent, sustainable, and accountable to citizens. Constitutional order, legal frameworks, and judicial independence constitute the foundation for a well-functioning society, but they remain hollow unless the government has the capacity to apply these tools appropriately. Activities in this Program Area support avenues for public participation and legislative oversight, for curbing corruption, and for substantive separation of powers through institutional checks and balances. Transparency, accountability, and integrity are also vital to government effectiveness and political stability. Strategies for promoting transparency, accountability, and improved responsiveness of
Page 23 of 80

governments include the support of global partnerships, such as the Open Government Partnership, institutional change management approaches, and innovative technology solutions. Executive Oversight A critical function of democratic legislatures is to monitor and conduct oversight of executive branch actions and performance. In FY 2013, legislatures in a number of countries took significant actions to address government corruption and mismanagement. A total of thirteen countries reported that legislatures receiving U.S. assistance took executive oversight actions in FY 2013. Countries reporting results included: Armenia, Georgia, Guinea, Haiti, Indonesia, Kenya, Kosovo, Rwanda, Niger, Somalia, Tunisia, Vietnam, and Zimbabwe. The U.S. Government significantly exceeded its FY 2013 target for this indicator by 243 as a result of factors such as heightened legislative scrutiny of the government in the lead-up to national elections in Zimbabwe, and increased oversight activities on the part of national legislatures in Haiti, Vietnam, Georgia, and other countries.
STRATEGIC GOAL THREE Program Area: Good Governance Performance Indicator: Number of Executive Oversight Actions Taken by Legislature Receiving U.S. Assistance
FY 2009 FY 2010 FY 2011 FY 2012 FY 2013 FY 2013 FY 2013 Results Results Results Results Target Results Rating
3,949 3,971 317 279 116 359 Above Target
Data Source: FY 2013 Performance Reports as collected in the Foreign Assistance and Coordination System (FACTS). Data Quality: Performance data are verified using Data Quality Assessments (DQA) and must meet five data quality standards of validity, integrity, precision, reliability, and timeliness. The methodology used for conducting the DQAs must be well documented by each OU. (For details, refer to USAID's Automated Directive System [ADS] Chapter 203.3.11, http://www.usaid.gov/policy/ads/200/203.pdf). Training for Executive Branch Personnel The executive branch is generally tasked with executing the many routine tasks of the state, including managing service delivery and enforcing the nation’s laws. The civil servants and public employees who work in the executive are therefore critical to the effective and responsive management of the state. Building the skill-base of executive branch staff can therefore positively impact the overall effectiveness of state performance. The U.S. Government exceeded its FY 2013 target for this indicator by 1,369 due, in part, to increased demand from government agencies in Georgia, Indonesia, Guatemala, and other countries. The U.S. Government responded by administering training in fields such as anti-corruption, public access to information law, and public relations technology.
Page 24 of 80

STRATEGIC GOAL THREE Program Area: Good Governance Performance Indicator: Number of Training Days Provided to Executive Branch Personnel with U.S. Assistance
FY 2009 FY 2010 FY 2011 FY 2012 FY 2013 FY 2013 FY 2013 Results Results Results Results Target Results Rating
N/A N/A 315 5,394 6,121 7,490 Above Target
Data Source: FY 2013 Performance Reports as collected in the Foreign Assistance and Coordination System (FACTS). Data Quality: Performance data are verified using Data Quality Assessments (DQA) and must meet five data quality standards of validity, integrity, precision, reliability, and timeliness. The methodology used for conducting the DQAs must be well documented by each OU. (For details, refer to USAID's Automated Directive System [ADS] Chapter 203.3.11, http://www.usaid.gov/policy/ads/200/203.pdf). Program Area: Political Competition and Consensus-Building $ in thousands FY 2013 Actual TOTAL FOREIGN OPERATIONS BUDGET 33,062,892 Political Competition and Consensus-Building 226,261 Political Competition and Consensus-Building programs encourage the development of transparent and inclusive electoral and political processes, and democratic, responsive, and effective political parties. The U.S. Government seeks to promote consensus-building among government officials, political parties, and civil society to advance a common democratic agenda, especially where fundamental issues about the democratization process have not yet been settled. Open, transparent and competitive political processes ensure that citizens have a voice in the regular and peaceful transfer of power between governments. Extensive, long-term assistance is frequently needed to build the necessary groundwork for a credible and just electoral process. U.S. programs support efforts to ensure more responsive representation and better governance over the long-term by working with candidates, political parties, elected officials, nongovernmental organizations, and citizens before, during, and in between elections. An open and competitive electoral system is also a good barometer of the general health of democratic institutions and values, since free and fair elections require a pluralistic and competitive political system, broad access to information, an active civil society, an impartial judicial system, and effective government institutions. U.S. programs are designed to provide assistance where there are opportunities to help ensure that elections are competitive and reflect the will of an informed citizenry and that political institutions are representative and responsive. U.S. assistance supports electoral-related activities in advance of significant elections in key transitional societies or in new and fragile democracies. Funded activities include efforts to improve electoral legislation, election administration, non-partisan political party development, political participation, and voter education and turnout. Priority is given to initiatives that emphasize outreach to women, youth, minorities, and other underrepresented groups. Due to the rapid transitions occurring in countries in the Middle East in the wake of the Arab Spring, as well as Burma and Mali, support for electoral and political processes far exceeded its target in FY 2013.
Page 25 of 80

Voter and Civic Education The provision of voter and civic education in developing democracies helps ensure that voters have the information they need to be effective participants in the democratic process, contributing to the development or maintenance of electoral democracy. The unit of measure is defined as any eligible voter that receives voter or civic education messages through print, broadcast, or new media, as well as via in-person contact. Voter and civic education also includes community-based trainings in underserved areas, public service announcements on electronic media, written materials, internet-based information and messages using the new media (in this usage primarily, but not exclusively social networking sites such as Facebook and Twitter). Content may include voter motivation, explanation of the voting process, the functions of the office(s) being contested, and descriptions of the significance of the elections in democratic governance. This past year saw numerous elections in critical U.S. foreign policy priority countries, such as Kenya, Georgia, Venezuela, Ukraine, Zimbabwe, Pakistan, Mali, as well as a constitutional referendum in Egypt and civic dialogue in Libya, for which the U.S. Government provided high levels of support and resources for voter and civic education. Political circumstances and unexpected opportunities to support voter and civic education in these and other countries contributed to results far exceeding the FY 2013 target for this indicator.
STRATEGIC GOAL THREE Program Area: Political Competition and Consensus-Building Performance Indicator: Number of Individuals Receiving Voter and Civic Education through U.S.-Assisted Programs FY 2009 FY 2010 FY 2011 FY 2012 FY 2013 FY 2013 FY 2013 Results Results Results Results Target Results Rating
N/A N/A 19,108,679 58,020,113 59,878,338 140,950,044 Above Target
Data Source: FY 2013 Performance Reports as collected in the Foreign Assistance and Coordination System (FACTS). Data Quality: Performance data are verified using Data Quality Assessments (DQA) and must meet five data quality standards of validity, integrity, precision, reliability, and timeliness. The methodology used for conducting the DQAs must be well documented by each OU. (For details, refer to USAID's Automated Directive System [ADS] Chapter 203.3.11, http://www.usaid.gov/policy/ads/200/203.pdf). Program Area: Civil Society $ in thousands FY 2013 Actual TOTAL FOREIGN OPERATIONS BUDGET 33,062,892 Civil Society 516,126 A fully participatory, democratic state must include an active and vibrant civil society, including an independent and open media, in which individuals can peacefully exercise their fundamental rights. U.S. assistance continued to support better legal environments for Civil Society Organizations (CSOs); improve their organizational capacity and financial viability; allow them to work more successfully in the arenas of advocacy and public service provision; and empower traditionally marginalized groups, such as women, ethnic and religious minorities, LGBT persons, disabled persons, and youth; and promote the free flow of information, including via the Internet.
Page 26 of 80

Advocacy Interventions Civil society participation in democratic policymaking improves the transparency and accountability of one's government and the legislative process. This measure captures more than one democracy and governance outcome ̶— it indicates that CSOs have the capacity to substantively participate in democratic policymaking and that legislators are open to public participation. The indicator below measures CSOs’ active participation in or engagement with the legislature, including: attending and contributing to committee meetings, sending policy briefs, sending comments on proposed legislation, and providing research. Civil society advocacy efforts, both with legislatures and legislative outreach and openness to civil society engagement, are also activities under this indicator. While the targets for the indicator were met in the majority of reporting countries, the overall result was affected by the later-than-expected initiation of a project in Afghanistan designed to strengthen political entities and civil society in general. Results were also affected by refocused activities in Kenya from advocacy to community engagement during the 2013 election period.
STRATEGIC GOAL THREE Program Area: Civil Society Performance Indicator: Number of Civil Society Organizations Receiving U.S. Assistance Engaged in Advocacy Interventions
FY 2009 FY 2010 FY 2011 FY 2012 FY 2013 FY 2013 FY 2013 Results Results Results Results Target Results Rating
1,772 2,629 4,362 11,247 23,937 13,570 Improved, but Target Not Met
Data Source: FY 2013 Performance Reports as collected in the Foreign Assistance and Coordination System (FACTS). Data Quality: Performance data, verified using data quality assessments (DQAs), must meet standards of validity, integrity, precision, reliability, and timeliness. Each OU must document the methodology used for conducting the DQAs. DQA and data source records are maintained in the Performance Management Plans; Missions certify via the Performance Plan and Report that a DQA has occurred within the last three years. (For details, refer to USAID's Automated Directive System [ADS] Chapter 203.3.11, http://www.usaid.gov/policy/ads/200/203.pdf). Although the U.S. Government did not meet its target for CSOs engaged in advocacy interventions, U.S. assistance to CSOs did make progress in other areas. For example, in FY 2013, the USAID Global Labor Program reached 301 CSOs that promote international labor standards, workers’ rights and gender equality in the workforce, mostly through democratic trade unions in Latin America, Asia, Africa, East and Central Europe. Many of these CSOs were federations consisting of numerous smaller trade unions, representing an engagement with thousands of local or national organizations and their millions of individual members. In FY 2013, achievements of the Global Labor Program included the following:
• In South Africa, unions successfully advocated for the ratification of a new International Labor Organization (ILO) Convention protecting domestic workers.
• In Liberia, a new labor law was passed by both legislative houses and is near ratification. Liberian unions also negotiated path breaking collective bargaining agreements with multinational mining firms, including transnational firms with headquarters in Japan, India and China.
• Activities in Central America succeeded in strengthening regional and international union
Page 27 of 80

partnerships in the apparel, agricultural and construction sectors, as well as an innovative street vendor network. Street vendor network unions have begun to develop legislative proposals to present to their national legislatures and, in Honduras, an apparel sector union successfully negotiated a 9.5 percent wage increase for 1,300 workers.
• In Cambodia, the program played a lead role in assisting unions and employers to resolve a high-profile labor dispute in the apparel sector, and the program continues to play a role in resolving and preventing industrial disputes in all major economic sectors.
• In Georgia, the program played a critical role in protecting and strengthening trade unions in 2013, assisting their effective work with the new Government of Georgia to reform the Labor Code.
• Finally, program support in Bangladesh proved critical in 2013 in the wake of the tragic Rana Plaza building collapse and widespread loss of life. As the world’s attention turned to the numerous worker rights problems in Bangladesh’s apparel sector, the program provided critical support to worker organizations and nascent trade unions, and continues to enable these organizations to bring forward the concerns of apparel workers with the Bangladeshi government, brands, and multi-stakeholder initiatives.
Media Freedom Free media (including print, broadcast, wireless and Internet media) play key communications and linking roles in all political systems by providing a voice to civil society, business, government, and all other actors at the local, national, and international levels. Ideally, a professional and independent media helps underpin democracy by disseminating accurate information, facilitating democratic discourse, and providing critical and independent checks on government authorities. Media sector programs generally involve focused support in the key directions of the legal-enabling environment for free or freer media, including: the professional training of journalists, editors, and production staff; building local training capacities of journalism schools and mid-career training centers; management training and media business development; and support for professional and industry associations in the media sector. In an era of rapid technological change, the U.S. Government has increasingly designed media programming that combines broadcast or print media with cutting-edge Information and Communications Technologies (ICT) and activities such as: internet, social and multi-media training for journalists; specialized training for bloggers and citizen reporters; development of databases to facilitate research, information and news story exchanges among media; support for multi-media newsrooms and platforms; media applications of cell phone technologies; and legal-regulatory support for expanding electronic media rights. Media assistance strategies vary widely, depending upon the specific program and country context. In closed societies, for example, the U.S.-supported Internet Security Coalition (ISC) project advances sustained technical assistance to civil society organizations, independent media, and individuals whose use of ICT for expression, journalism, communications and advocacy is important for their societies, but potentially risky. ISC bridges the gap between technical specialists in the developed world and developing-world rights defenders by forging the links within the ecosystem to become a loose network that shares information on best practices and assumes the role of organically providing technical assistance. In FY 2013, results for assistance to non-state news outlets fell below expected targets. The closure of USAID/Russia contributed substantially to the inability to achieve the target for this indicator. In addition, several missions, including Thailand and Central Asia, following consultation with local experts, determined that the best approach to achieving programmatic goals was to orient funding toward fewer, higher performing news outlets rather than attempting to maximize the number of organizations assisted.
Page 28 of 80

STRATEGIC GOAL THREE Program Area: Civil Society Performance Indicator: Number of Non-State News Outlets Assisted by U.S. Government
FY 2009 FY 2010 FY 2011 FY 2012 FY 2013 FY 2013 FY 2013 Results Results Results Results Target Results Rating 1,761 1,769 1,507 2,791 1,361 1,116 Below
Target Data Source: FY 2013 Performance Reports as collected in the Foreign Assistance and Coordination System (FACTS). Data Quality: Performance data, verified using data quality assessments (DQAs), must meet standards of validity, integrity, precision, reliability, and timeliness. Each OU must document the methodology used for conducting the DQAs. DQA and data source records are maintained in the Performance Management Plans; Missions certify via the Performance Plan and Report that a DQA has occurred within the last three years. (For details, refer to USAID's Automated Directive System [ADS] Chapter 203.3.11, http://www.usaid.gov/policy/ads/200/203.pdf). Program Area: HIV/AIDS $ in thousands FY 2013 Actual TOTAL FOREIGN OPERATIONS BUDGET 33,062,892 HIV/AIDS 5,773,022 The U.S. President's Emergency Plan for AIDS Relief (PEPFAR) is the U.S. Government’s initiative to help save the lives of those suffering from HIV/AIDS around the world. This historic commitment is the largest by any nation to combat a single disease internationally, and PEPFAR investments also help alleviate suffering from other diseases across the global health spectrum. PEPFAR is driven by a shared responsibility among donor and partner nations and others to make smart investments to save lives. PEPFAR is advancing this agenda in the context of stronger country ownership, with the long-term goal of transitioning host countries (inclusive of all stakeholders) so that they are able to plan, oversee, manage, deliver and finance a health program responsive to the needs of their people without development assistance.
FY 2013 marked PEPFAR’s 10 year anniversary of advancing high-quality programs that change the lives of individuals, families and communities. At a ceremony recognizing the joint efforts of the U.S. Government and host country governments to curb the epidemic for the past 10 years, Secretary of State John Kerry said that in FY 2013, “…thanks to PEPFAR the one millionth baby was born free of HIV. Furthermore, 13 countries have reached a programmatic tipping point, where more people are newly receiving treatment than are newly infected with HIV.” With the goal of achieving an AIDS-free generation, PEPFAR is continuing to expand access to counseling and testing as well as antiretroviral therapy (ART), prevent mother-to-child transmission of HIV, increase care and support services for HIV-affected individuals, scale up voluntary medical male circumcision, and strengthen health systems for sustainable and country-owned programs. Antiretroviral Therapy (ART) Expanding ART access is a critical part of the combination prevention interventions needed to achieve an AIDS-free generation. Increasing ART enrollment brings life-saving treatment to those who need it, improves their quality of life, restores families and communities, and advances national strategies to address the health and economic growth of their populations. Furthermore, those receiving ART are less likely to transmit the virus to others, making ART an intervention for both treatment and prevention.
Page 29 of 80
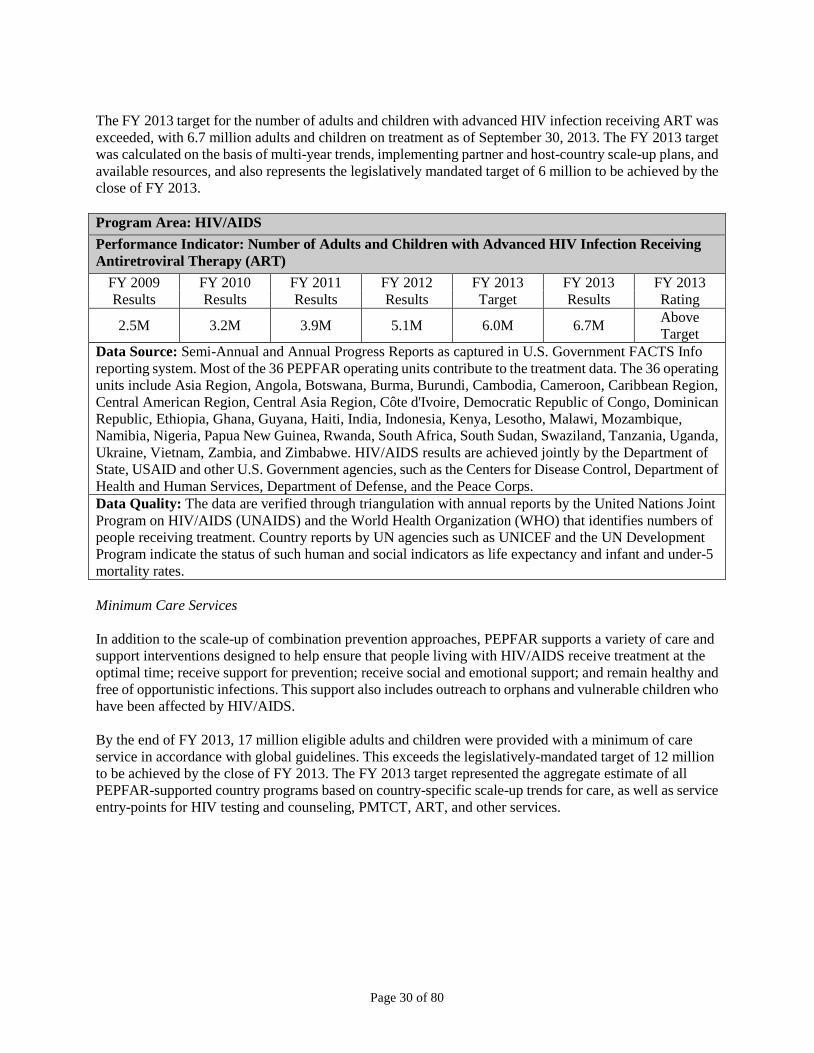
The FY 2013 target for the number of adults and children with advanced HIV infection receiving ART was exceeded, with 6.7 million adults and children on treatment as of September 30, 2013. The FY 2013 target was calculated on the basis of multi-year trends, implementing partner and host-country scale-up plans, and available resources, and also represents the legislatively mandated target of 6 million to be achieved by the close of FY 2013. Program Area: HIV/AIDS Performance Indicator: Number of Adults and Children with Advanced HIV Infection Receiving Antiretroviral Therapy (ART)
FY 2009 FY 2010 FY 2011 FY 2012 FY 2013 FY 2013 FY 2013 Results Results Results Results Target Results Rating 2.5M 3.2M 3.9M 5.1M 6.0M 6.7M Above
Target Data Source: Semi-Annual and Annual Progress Reports as captured in U.S. Government FACTS Info reporting system. Most of the 36 PEPFAR operating units contribute to the treatment data. The 36 operating units include Asia Region, Angola, Botswana, Burma, Burundi, Cambodia, Cameroon, Caribbean Region, Central American Region, Central Asia Region, Côte d'Ivoire, Democratic Republic of Congo, Dominican Republic, Ethiopia, Ghana, Guyana, Haiti, India, Indonesia, Kenya, Lesotho, Malawi, Mozambique, Namibia, Nigeria, Papua New Guinea, Rwanda, South Africa, South Sudan, Swaziland, Tanzania, Uganda, Ukraine, Vietnam, Zambia, and Zimbabwe. HIV/AIDS results are achieved jointly by the Department of State, USAID and other U.S. Government agencies, such as the Centers for Disease Control, Department of Health and Human Services, Department of Defense, and the Peace Corps. Data Quality: The data are verified through triangulation with annual reports by the United Nations Joint Program on HIV/AIDS (UNAIDS) and the World Health Organization (WHO) that identifies numbers of people receiving treatment. Country reports by UN agencies such as UNICEF and the UN Development Program indicate the status of such human and social indicators as life expectancy and infant and under-5 mortality rates. Minimum Care Services In addition to the scale-up of combination prevention approaches, PEPFAR supports a variety of care and support interventions designed to help ensure that people living with HIV/AIDS receive treatment at the optimal time; receive support for prevention; receive social and emotional support; and remain healthy and free of opportunistic infections. This support also includes outreach to orphans and vulnerable children who have been affected by HIV/AIDS. By the end of FY 2013, 17 million eligible adults and children were provided with a minimum of care service in accordance with global guidelines. This exceeds the legislatively-mandated target of 12 million to be achieved by the close of FY 2013. The FY 2013 target represented the aggregate estimate of all PEPFAR-supported country programs based on country-specific scale-up trends for care, as well as service entry-points for HIV testing and counseling, PMTCT, ART, and other services.
Page 30 of 80

STRATEGIC GOAL THREE Program Area: HIV/AIDS Performance Indicator: Number of Eligible Adults and Children Provided with a Minimum of One Care Service
FY 2009 FY 2010 FY 2011 FY 2012 FY 2013 FY 2013 FY 2013 Results Results Results Results Target Results Rating
11M 11.4M 12.9M 15.0M 16.5M 17.0M Above Target
Data Source: Semi-Annual and Annual Progress Reports are captured in the U.S. Government FACTS Info reporting system. Most of the 36 Operating units contribute to the care and support data. The 36 operating units include Asia Region, Angola, Botswana, Burma, Burundi, Cambodia, Cameroon, Caribbean Region, Central American Region, Central Asia Region, Côte d'Ivoire, Democratic Republic of Congo, Dominican Republic, Ethiopia, Ghana, Guyana, Haiti, India, Indonesia, Kenya, Lesotho, Malawi, Mozambique, Namibia, Nigeria, Papua New Guinea, Rwanda, South Africa, Sudan, Swaziland, Tanzania, Uganda, Ukraine, Vietnam, Zambia, and Zimbabwe. HIV/AIDS results are achieved jointly by the Department of State, USAID and other U.S. Government agencies, such as the Departments of Health and Human Services, Defense, and the Peace Corps. Data Quality: Data are verified through triangulation with population-based surveys of care and support for orphans and vulnerable children; program monitoring of provider-supported activities; targeted program evaluations; and management information systems that document data from patient care management, facility, community, and program management systems. Program Area: Tuberculosis $ in thousands FY 2013 Actual TOTAL FOREIGN OPERATIONS BUDGET 33,062,892 Tuberculosis 232,496 Twenty-two developing countries account for 80 percent of the world’s tuberculosis (TB) cases. According to the World Health Organization (WHO), in 2012, approximately 1.3 million individuals worldwide died from TB, including 320,000 people living with HIV/AIDS. The U.S. Government is focusing efforts in countries where drug-resistant TB is of particular concern and where our investments can be leveraged for highest impact. With a shift from 41 to 27 of U.S.-assisted TB countries from FY 2011 to FY 2013, the U.S. Government achieved significant progress in TB by providing global technical leadership and supporting the expansion of quality TB services in high-burden, strategically-important countries. The most recent WHO data shows that in these 27 countries, TB death and prevalence rates decreased 41 percent and 40 percent, respectively, compared to 1990 levels. In addition, 14 countries achieved treatment success rates of 85 percent or more, reaching the WHO-recommended threshold for disease control. In U.S.-supported countries, more than 1.34 million smear-positive TB cases were successfully treated and more than 45,000 multi-drug-resistant TB (MDR-TB) cases initiated treatment. Programmatic investments in TB focus on expanding access to high-quality diagnosis and treatment services and supporting implementation of National TB Program Strategies. Resources are used to support implementation of the internationally-recognized Stop TB Strategy supported by the U.S. Government and the WHO at all levels of the health system to intensify case finding and maintain high-quality diagnosis and treatment services. This is accomplished through technical assistance in the six key areas of the strategy: expansion of high-quality Directly Observed Therapy Shortcourse (DOTS) programs; interventions to address MDR-TB and TB/HIV co-infection; health systems strengthening;
Page 31 of 80

engaging all care providers, especially those who have not previously collaborated with National TB Programs; empowering people with TB and the communities that care for them; and promoting research. In particular, U.S. investments have supported the scale-up of MDR-TB diagnosis and treatment services, improved surveillance capacity, provided technical assistance for laboratory services to provide accurate and timely TB diagnosis, supported treatment support activities to ensure patients who start treatment are able to be cured and/or complete treatment, and improved infection control practices. The results achieved are expressed in terms of the contribution of U.S. resources to TB outcomes at national level, leveraged with funds from other donors, particularly the Global Fund to Fight AIDS, TB, and Malaria. Two key performance indicators for the U.S. Government are the treatment success rate (TSR) and the case notification rate (CNR). For the purposes of this report reporting focuses on contributions to the case notification rate and treatment success rate in 27 TB U.S.-supported countries. TB Treatment Success Rate The treatment success rate (TSR) is the percentage of new smear positive pulmonary TB cases in an annual treatment cohort that were cured and completed treatment under DOTS as reported to the national TB program. Since ‘cured’ is defined by the conversion of smear results from positive to negative and many people with TB may be unable to produce sputum after a course of treatment, treatment success among smear-positive patients is defined by adding together all patients who met the standard definition for cure and those who completed treatment but may not have met the precise definition of cure. Due to the lengthy time needed to complete treatment and assess cure/completion, this indicator “lags” by at least one year as programs need time to compile data for the entire annual cohort. In 1991, the World Health Assembly set a TSR target of 85 percent for each country based on the epidemiology of TB and the minimum percentage of smear-positive TB patients that need to be detected and successfully treated in order to cut transmission rates enough to move towards elimination. The TSR is an outcome measurement of program quality. National TB program capacity to manage TB is demonstrated by the ability to successfully treat at least 85 percent of each annual cohort and limit the number of patients who are lost to follow up, die while on treatment, or remain smear positive at the end of the regimen (treatment failure). Because TB is transmitted in the air when a person with active, infectious disease coughs or sneezes, effective treatment is critical to preventing the spread of TB. TB patients who are not successfully treated are at higher risk for developing MDR-TB (which is resistant to the two most effective anti-TB drugs) and transmitting MDR-TB to others in their households, communities, or workplaces. As more TB patients are successfully treated, there is less transmission of TB within a community, and it is less likely for a TB patient to develop and transmit MDR-TB. Thus, tracking progress toward meeting or exceeding the 85 percent TSR target is important for assessing the effectiveness of TB programs in U.S.-assisted countries. In FY 2013, the number of U.S. TB-assisted countries is 27 and the indicator remains on target at 87 percent. This group includes countries that have high HIV and MDR burdens.
Page 32 of 80
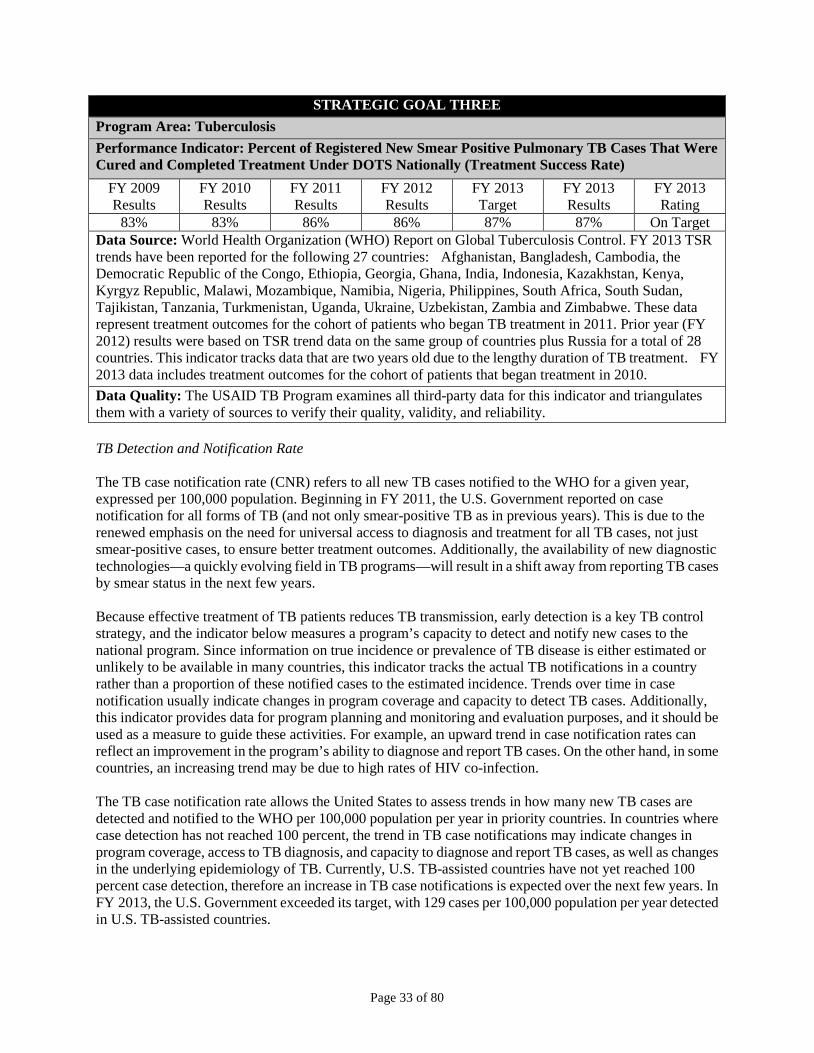
STRATEGIC GOAL THREE Program Area: Tuberculosis Performance Indicator: Percent of Registered New Smear Positive Pulmonary TB Cases That Were Cured and Completed Treatment Under DOTS Nationally (Treatment Success Rate)
FY 2009 FY 2010 FY 2011 FY 2012 FY 2013 FY 2013 FY 2013 Results Results Results Results Target Results Rating
83% 83% 86% 86% 87% 87% On Target Data Source: World Health Organization (WHO) Report on Global Tuberculosis Control. FY 2013 TSR trends have been reported for the following 27 countries: Afghanistan, Bangladesh, Cambodia, the Democratic Republic of the Congo, Ethiopia, Georgia, Ghana, India, Indonesia, Kazakhstan, Kenya, Kyrgyz Republic, Malawi, Mozambique, Namibia, Nigeria, Philippines, South Africa, South Sudan, Tajikistan, Tanzania, Turkmenistan, Uganda, Ukraine, Uzbekistan, Zambia and Zimbabwe. These data represent treatment outcomes for the cohort of patients who began TB treatment in 2011. Prior year (FY 2012) results were based on TSR trend data on the same group of countries plus Russia for a total of 28 countries. This indicator tracks data that are two years old due to the lengthy duration of TB treatment. FY 2013 data includes treatment outcomes for the cohort of patients that began treatment in 2010. Data Quality: The USAID TB Program examines all third-party data for this indicator and triangulates them with a variety of sources to verify their quality, validity, and reliability. TB Detection and Notification Rate The TB case notification rate (CNR) refers to all new TB cases notified to the WHO for a given year, expressed per 100,000 population. Beginning in FY 2011, the U.S. Government reported on case notification for all forms of TB (and not only smear-positive TB as in previous years). This is due to the renewed emphasis on the need for universal access to diagnosis and treatment for all TB cases, not just smear-positive cases, to ensure better treatment outcomes. Additionally, the availability of new diagnostic technologies—a quickly evolving field in TB programs—will result in a shift away from reporting TB cases by smear status in the next few years. Because effective treatment of TB patients reduces TB transmission, early detection is a key TB control strategy, and the indicator below measures a program’s capacity to detect and notify new cases to the national program. Since information on true incidence or prevalence of TB disease is either estimated or unlikely to be available in many countries, this indicator tracks the actual TB notifications in a country rather than a proportion of these notified cases to the estimated incidence. Trends over time in case notification usually indicate changes in program coverage and capacity to detect TB cases. Additionally, this indicator provides data for program planning and monitoring and evaluation purposes, and it should be used as a measure to guide these activities. For example, an upward trend in case notification rates can reflect an improvement in the program’s ability to diagnose and report TB cases. On the other hand, in some countries, an increasing trend may be due to high rates of HIV co-infection. The TB case notification rate allows the United States to assess trends in how many new TB cases are detected and notified to the WHO per 100,000 population per year in priority countries. In countries where case detection has not reached 100 percent, the trend in TB case notifications may indicate changes in program coverage, access to TB diagnosis, and capacity to diagnose and report TB cases, as well as changes in the underlying epidemiology of TB. Currently, U.S. TB-assisted countries have not yet reached 100 percent case detection, therefore an increase in TB case notifications is expected over the next few years. In FY 2013, the U.S. Government exceeded its target, with 129 cases per 100,000 population per year detected in U.S. TB-assisted countries.
Page 33 of 80

STRATEGIC GOAL THREE Program Area: Tuberculosis Performance Indicator: Case Notification Rate in New Sputum Smear Positive Pulmonary TB Cases per 100,000 Population Nationally
FY 2009 FY 2010 FY 2011 FY 2012 FY 2013 FY 2013 FY 2013
Results Results Results Results Target Results Rating
119/100,000 122/100,000 115/100,000 120/100,000 122/100,000 129/100,000 Above Target
Data Source: World Health Organization (WHO) Report on Global Tuberculosis Control. This calculation includes TB case notification for the following 27 priority countries: Afghanistan, Bangladesh, Cambodia, the Democratic Republic of the Congo, Ethiopia, Georgia, Ghana, India, Indonesia, Kazakhstan, Kenya, Kyrgyz Republic, Malawi, Mozambique, Namibia, Nigeria, Philippines, South Africa, South Sudan, Tajikistan, Tanzania, Turkmenistan, Uganda, Ukraine, Uzbekistan, Zambia and Zimbabwe. Data Quality: The USAID TB Program examines all third-party data for this indicator and triangulates them with a variety of sources to verify their quality, validity, and reliability. Program Area: Malaria $ in thousands FY 2013 Actual TOTAL FOREIGN OPERATIONS BUDGET 33,062,892 Malaria 656,382 In FY 2013, U.S. malaria projects continued to support the scale-up of insecticide-treated nets (ITNs), indoor residual spraying (IRS), appropriate malaria case management including parasitological diagnosis and treatment with artemisinin-based combination therapies (ACTs), and intermittent preventive treatment of malaria in pregnancy (IPTp). The President’s Malaria Initiative (PMI) now includes 19 focus countries in Africa and one regional program in the Greater Mekong sub-region. The U.S. Government also supports malaria control activities in three other countries in Africa (Burkina Faso, Burundi, and South Sudan), as well as a regional program in Latin America. Over the past decade, dramatic progress has been made in reducing the burden of malaria in sub-Saharan Africa. According to the World Health Organization, the estimated number of malaria deaths worldwide has fallen by over 50 percent from 2000 to 2012 in children under 5 years of age. The U.S. Government has played a major role in this effort and is the single largest donor to the Global Fund to Fight AIDS, Tuberculosis and Malaria (Global Fund), while also contributing substantial funding to the World Bank. Dramatic increases in the coverage of malaria control measures are being documented in nationwide household surveys as a result of the contributions of PMI, national governments, and other donors. During the past seven years, household ownership of at least one ITN increased from an average of 29 to 55 percent in all 19 PMI focus countries. At the same time, use of an ITN among children under five more than doubled from an average of 20 to 43 percent, and similar increases have been documented for use of ITNs by pregnant women (from an average of 17 to 43 percent). In all of the 15 original PMI focus countries (Angola, Benin, Ethiopia, Ghana, Kenya, Liberia, Madagascar, Malawi, Mali, Mozambique, Rwanda, Senegal, Tanzania, Uganda, and Zambia), declines in all-cause mortality rates among children under five have been observed — ranging from 16 percent (in Malawi) to 50 percent (in Rwanda). While a variety of factors may be influencing these declines, there is strong and growing evidence that malaria prevention and treatment efforts are playing a major role in these reductions. Impact evaluations in several PMI countries including Tanzania, Malawi, Senegal, Ethiopia and Rwanda have provided strong evidence that malaria
Page 34 of 80

interventions have had a positive effect on reducing mortality among children under five. Malaria impact evaluations in the 10 remaining PMI focus countries will be completed by the end of FY 2015. Protection against Malaria If used properly, ITNs are one of the best ways to prevent mosquitoes from biting individuals and infecting them with malaria, and as a result reduce malaria deaths. PMI programs advance the use of ITNs especially for pregnant women and children who are most vulnerable. IRS is also a proven malaria control measure that has been used in the past to gauge progress on protecting against malaria. However, in FY 2013, due to the emergence of insecticide resistance and the resulting need to rotate to a higher cost insecticide, PMI countries have either stopped or decreased IRS activities. In FY 2013, 45 million people were protected against malaria through the use of ITNs. Performance was below the planned FY 2013 target primarily due to the decrease in IRS activities. The secondary reason for the shortfall was delays in grant disbursements from the Global Fund. PMI coordinates its procurement and distribution of ITNs with other major donors including the Global Fund, the World Bank, and UNICEF. In FY 2012, the major restructuring of the Global Fund caused many delays in grant disbursements. These delays continued to directly impact the number of ITNs that PMI had agreed to help distribute in FY 2013.
STRATEGIC GOAL THREE Program Area: Malaria Performance Indicator: Number of People Protected against Malaria with a Prevention Measure (Insecticide Treated Nets or Indoor Residual Spraying)
FY 2009 FY 2010 FY 2011 FY 2012 FY 2013 FY 2013 FY 2013 Results Results Results Results Target Results Rating
30M 40M 58M 50M 60M 45M Below Target
Data Source: USAID program information. The 19 PMI focus countries are Angola, Benin, Democratic Republic of the Congo, Ethiopia, Ghana, Guinea, Kenya, Liberia, Madagascar, Malawi, Mali, Mozambique, Nigeria, Rwanda, Senegal, Tanzania, Uganda, Zambia, and Zimbabwe. FY 2008, FY 2009, and FY 2010 results reflect activities completed in all 15 PMI countries. FY 2011 results include the original 15 PMI countries as well as the addition of activities in two new PMI countries, Democratic Republic of the Congo and Nigeria. FY 2012 and FY 2013 results include activities in the original 15 PMI countries, and the addition of the Democratic Republic of the Congo, Nigeria, Guinea, and Zimbabwe. The estimated results for FY 2013 adjust for double-counting by reducing the overall reported numbers by five percent, which reflects an estimated percentage of the population in PMI countries benefiting from PMI-supported IRS and ITNs. FY 2014 and FY 2015 targets for this indicator are set by estimating the number of ITNs that will be procured and/or distributed by PMI in the following year based on Malaria Operational Plans for the 19 PMI focus countries. The FY 2014 and FY 2015 targets do not include an estimate of people protected from IRS. Due to emerging insecticide resistance, a number of PMI countries have either stopped spraying or have decreased spraying areas. Data Quality: Performance data, verified using data quality assessments (DQAs), must meet standards of validity, integrity, precision, reliability, and timeliness. Each operating unit must document the methodology for conducting DQAs.
Page 35 of 80

Program Area: Other Public Health Threats $ in thousands FY 2013 Actual TOTAL FOREIGN OPERATIONS BUDGET 33,062,892 Other Public Health Threats 107,838 More than one billion people suffer globally from the severe disfigurement, disability, and blindness caused by neglected tropical diseases (NTDs). These diseases disproportionately impact poor and rural populations that lack access to safe water, sanitation, and essential medicines. They cause sickness and disability, contribute to childhood malnutrition, compromise children’s mental and physical development, and can result in blindness and severe disfigurement. In addition, the impact of loss of productivity due to poor health is considerable. Seven of the most prevalent NTDs – lymphatic filariasis (LF) (elephantiasis), schistosomiasis (snail fever), trachoma (eye infection), onchocerciasis (river blindness), and three soil-transmitted helminthes (hookworm, roundworm, and whipworm) can be controlled by providing medications at regularly-timed intervals to all eligible individuals in an affected community during mass drug administration (MDA). The integrated MDA approach can provide treatment for several NTDs, thus utilizing a highly effective and cost efficient strategy. The objective of the U.S. NTD response is to contribute towards the achievement of the goal of global elimination of lymphatic filariasis and blinding trachoma by 2020. Additionally, the U.S. NTD program is working towards achieving a target of 60 percent of the population no longer requiring MDA for LF in 16 U.S.-supported countries, and 70 percent of the population no longer requiring district-level trachoma MDA in seven U.S.-supported countries by 2018. Neglected Tropical Disease Treatments Neglected tropical disease treatments are defined as the age- and height-appropriate dosage of an NTD drug administered to an eligible person in a defined geographic area. Each drug dose is counted as a unique treatment such that an individual may receive multiple treatments in the context of an integrated multi-disease MDA. MDA activities typically occur annually until specific criteria are reached for stopping MDA. The number of treatments needed before this point is achieved based on a recommended number of effective MDA rounds for the at-risk populations as determined by district-level mapping as well as obtaining a specified prevalence of infection below which transmission is likely to have been interrupted. The expected impact of the delivery of NTD treatments through U.S.-funded programs is a reduction in the number and percentage of individuals in the target population at risk for lymphatic filariasis and blinding trachoma. Based on the data, 226 million treatments were delivered through U.S.-funded programs in FY 2012. In FY 2013, 103,200,000 treatments were recorded to have been delivered as of November 8, 2013 to the following countries: Benin, Burkina Faso, Cameroon, Ethiopia, Ghana, Guinea, Haiti, Mozambique, Nepal, Niger, Nigeria, Senegal, Sierra Leone, Tanzania, Togo, and Uganda. Seven countries (Benin, Cameroon, Indonesia, Nigeria, Senegal, Tanzania, and Uganda) submitted partial or incomplete data due to the timing of the MDA. Complete results are expected in mid-FY 2014. Assuming coverage in countries with incomplete data is in line with partial data and historic coverage information, it is estimated that a total of 169,500,000 treatments were delivered in FY 2013. This projection would place actual performance above the target set for FY 2013.
Page 36 of 80

STRATEGIC GOAL THREE Program Area: Other Public Health Threats Performance Indicator: Number of Neglected Tropical Disease (NTD) Treatments Delivered through U.S.-funded Programs
FY 2009 FY 2010 FY 2011 FY 2012 FY 2013 FY 2013 FY 2013 Results Results Results Results Target Results Rating 130.6M 160.7M 186.7M 103.8M 150.0M 169.5M Above
Target Data Source: USAID project data and national Ministries of Health. Data for FY 2013 includes NTD treatments delivered for the following countries: Benin, Burkina Faso, Cameroon, Ethiopia, Ghana, Guinea, Haiti, Mozambique, Nepal, Niger, Nigeria, Senegal, Sierra Leone, Tanzania, Togo, and Uganda. Additional data from other countries was estimated based on reports and historical performance. Verified numbers will be available in FY14. Data Quality: USAID prime contractors and sub-contractors obtain information from Ministries of Health. After data has been submitted by country programs, USAID and partners undergo an intensive process to review data validity, reliability timeliness, and integrity. This process involves reviewing previous submissions, comparing results across time, triangulating information across multiple sources, and following up with MOH and sub-contractors as needed. Program Area: Maternal and Child Health $ in thousands FY 2013 Actual TOTAL FOREIGN OPERATIONS BUDGET 33,062,892 Maternal and Child Health 917,719 In 2010, an estimated 287,000 women died during and following pregnancy and childbirth from largely preventable complications, and millions more women suffer debilitating pregnancy-related injuries, disabilities, and infections. Nearly 6.6 million children under five years of age died in 2012, many from easily treatable or vaccine-preventable conditions. Of these, approximately 3 million died in the first 28 days of life. In FY 2013, the U.S. Government played a catalytic role in advancing global progress toward the generational goal of ending preventable child and maternal deaths by 2035. In support of sharpened, focused country-led plans to address the key drivers of child and maternal mortality USAID provided global and country-level leadership, supported innovation and research, and provided technical support to countries. USAID worked with UNICEF, WHO, other donors and host country governments to support A Promise Renewed launch efforts in seven countries in FY 2013: Bangladesh, the Democratic Republic of Congo, India, Liberia, Nigeria, Senegal, Zambia and two regional events in Africa and Latin America. These launches have been instrumental in reinvigorating country-level efforts and are critical to garnering political support for setting evidence-based priorities to scale up key life-saving interventions. Under A Promise Renewed, USAID worked in partnership with WHO, UNICEF, and leading academic institutions to launch the Global Action Plan on Pneumonia and Diarrhea, in order to coordinate and integrate efforts around pneumonia and diarrhea, the two leading causes of child deaths. USAID efforts to reduce preventable maternal deaths focus on the major causes of death--including postpartum hemorrhage and pre-eclampsia/eclampsia--as well as strengthening health systems, promoting respectful care, and changing family and communities' behavior to improve access and use of services. In maternal health, USAID also provided technical leadership within the UN Commission on Life-Saving Commodities for Women and Children to improve the quality, availability, accessibility, and use of 13 key MNCH commodities and ensure that they reach all women and children who need them. USAID leads the Saving Mothers, Giving Life (SMGL) U.S. interagency and private sector partnership in FY 2013. SMGL is yielding noteworthy
Page 37 of 80

results in reducing maternal mortality in Zambia and Uganda, and lessons learned from this district-focused model will inform USAID and the United States’ strategies to reduce maternal mortality. USAID also continues to provide support to GAVI to strengthen country immunization systems and introduce new, life-saving vaccines for children. In support of global polio eradication efforts, USAID provided critical leadership in the response to the polio outbreak in the Horn of Africa, where USAID-supported surveillance systems providing early warnings of the outbreak. Skilled Birth Attendants The United States is working in selected countries to end preventable maternal deaths by bringing integrated, comprehensive programs to address women’s health needs from conception to 42 days following delivery. USAID programs take into account and address cultural and financial factors that limit utilization of life-saving care. In FY 2013, USAID resources focused on high-impact maternal interventions with support for essential health system and human resource improvements. Having a skilled attendant at birth is a critical component of efforts to reduce maternal mortality. Most non-abortion-related maternal deaths happen during labor and delivery or within the first few days following delivery.
Global coverage in the use of skilled birth attendants across 24 USAID-assisted countries increased from 50.3 percent in FY 2012 to 51.3 percent in FY 2013. Previous reporting included 28 countries (current set in addition to Benin, Cambodia, Guatemala, and Philippines). As USAID focuses its MCH efforts on the set of 24 countries that account for 73 percent of child deaths worldwide, current and future reporting will use this set of 24 countries. To help support continued increases in skilled birth attendant coverage, USAID will continue to work in close collaboration with host country governments to help train, deploy, and motivate skilled birth attendants, in addition to strengthening existing systems for quality management and quality improvement and reducing barriers to use of services. The target was not met as a result of the change in number of countries tracked for this indicator between FY 2013 target setting and FY 2013 results reporting.
STRATEGIC GOAL THREE Program Area: Maternal and Child Health Performance Indicator: Percent of Births Attended by a Skilled Doctor, Nurse or Midwife
FY 2009 FY 2010 FY 2011 FY 2012 FY 2013 FY 2013 FY 2013 Results Results Results Results Target Results Rating
47.80% 48.90% 50.00% 51.10% 52.20% 51.30% Improved, but Target Not Met
Data Source: FY 2013 results, and out-year targets for FY 2014 and FY 2015 have been projected based on Demographic Health Survey and Census Bureau data for the following 24 USAID MCH priority countries: Afghanistan, Bangladesh, Democratic Republic of the Congo, Ethiopia, Ghana, Haiti, India, Indonesia, Kenya, Liberia, Madagascar, Malawi, Mali, Mozambique, Nepal, Nigeria, Pakistan, Rwanda, Senegal, South Sudan, Tanzania, Uganda, Yemen, and Zambia. Previous reporting included 28 countries (current set in addition to Benin, Cambodia, Guatemala, and Philippines). Data from the current set of 24 countries indicates an increase in skilled birth attendant coverage from 50.3 percent in FY 2012 to 51.3 percent in FY 2013. Data Quality: The USAID Knowledge Management Services (KMS) Project examines all third-party data for this indicator and triangulates them with a variety of sources to verify their quality, validity, and reliability.
Page 38 of 80

Diphtheria/Pertussis/Tetanus (DPT3) Vaccinations USAID is continuing to expand coverage and access to vaccines which that have the greatest potential impact on child survival. Coverage of child immunization through routine systems, rather than special campaigns, is designed to sustainably improve overall population immunization status. USAID also provides technical assistance to ensure the new vaccines available through GAVI financing are introduced into country immunization programs in a high-quality manner that supports overall systems for routine immunization. Adequate Diphtheria/Pertussis/Tetanus (DPT3) coverage contributes to reduced child morbidity and mortality by protecting children from contracting these diseases and is a widely accepted indicator of the overall strength of routine immunization and health systems. The DPT3 vaccine coverage refers to the percentage of children age 12 to 23 months who received the third dose of DPT (Diphtheria, Pertussis, Tetanus)-containing vaccine by 12 months of age. In the 24 MCH priority countries, the percent of children receiving DPT3 by their first birthday increased from 59.6 percent in FY 2012 to 60.4 percent in FY 2013. Previous reporting and target setting used a set of 28 countries. As USAID focuses its MCH efforts on the set of 24 countries that account for 73 percent of child deaths worldwide, current and future reporting will use this set of 24 countries. As a result in the change in number of countries tracked for this indicator between FY 2013 target setting and FY 2013 results reporting, the indicator is marked as 'below target'. Nevertheless a 0.8 percent increase represents good progress particularly as USAID focuses on the countries with the greatest need. FY 2013 results for this indicator are derived from an analysis of data from USAID MCH priority countries with two or more data points using a DHS, Multi-Cluster Indicator Survey, or other acceptable data sources at the time of the update.
STRATEGIC GOAL THREE Program Area: Maternal and Child Health Performance Indicator: Percent of Children who Receive DPT3 Vaccine by 12 Months of Age
FY 2009 FY 2010 FY 2011 FY 2012 FY 2013 FY 2013 FY 2013 Results Results Results Results Target Results Rating
58.90% 59.00% 59.90% 60.80% 61.60% 60.40% Below Target
Data Source: FY 2013 results, and out-year targets for FY 2014 and FY 2015 have been projected based on Demographic Health Survey and Census Bureau data for the following 24 USAID MCH priority countries: Afghanistan, Bangladesh, Democratic Republic of the Congo, Ethiopia, Ghana, Haiti, India, Indonesia, Kenya, Liberia, Madagascar, Malawi, Mali, Mozambique, Nepal, Nigeria, Pakistan, Rwanda, Senegal, South Sudan, Tanzania, Uganda, Yemen, and Zambia. Previous reporting included 28 countries (current set in addition to Benin, Cambodia, Guatemala, and Philippines). Data from the current set of 24 countries indicates an increase in DPT3 coverage from 59.6 percent in FY 2012 to 60.4 percent in FY 2013. Data Quality: The USAID Knowledge Management Services (KMS) Project examines all third-party data for this indicator and triangulates them with a variety of sources to verify their quality, validity, and reliability.
Page 39 of 80

Program Area: Family Planning and Reproductive Health $ in thousands FY 2013 Actual TOTAL FOREIGN OPERATIONS BUDGET 33,062,892 Family Planning and Reproductive Health 615,073 Recent estimates indicate that 222 million women in developing countries have an unmet need for family planning, which translates annually into 54 million unintended pregnancies, 26 million abortions, 1.1 million newborn deaths, and 79,000 maternal deaths. Continuing high fertility also places rapidly expanding demands on other social sector and political systems, economic growth, and the environment. In response, USAID advances and supports family planning and reproductive health (FP/RH) programs worldwide through field-driven program design and implementation, comprehensive technical support, timely and authoritative research, global leadership, and high-impact partnerships designed to expand access to high-quality, voluntary family planning and reproductive health information and services, in order to reduce unintended pregnancy and promote healthy reproductive behaviors. Family planning is an efficient and cost-effective response to the serious public health issues of child and maternal mortality. USAID’s family planning program contributes directly to the two health priorities of the Obama Administration—ending preventable child and maternal deaths and an AIDS-free generation-- and to FP2020, the global effort led by the U.K.’s Department for International Development, the Bill and Melinda Gates Foundation, in partnership with UNFPA, to enable 120 million more women to access and use modern contraception by 2020. USAID works with governments to achieve supportive policies to enable more women access to family planning services and encourage country governments to take ownership of development. For example, USAID trained parliamentarians and government ministries in Africa to monitor government accountability and advocate for increased government financial resources and implementation of family planning policy commitments. These efforts led to increased budgets for health and family planning in Ethiopia, Malawi, and Uganda. USAID uses a variety of indicators to assess program progress and contributions towards planned health outcomes, including monitoring trends in modern method contraceptive prevalence and age at first birth across USAID assisted countries. The baselines for the modern method contraceptive prevalence rate (MCPR) and first births to women under 18 were re-calibrated to FY 2012 to better reflect program priorities. All countries with a FY 2012 funding level for FP/RH of at least $2 million, plus Egypt (which receives a lower amount), and that have at least two survey data points for the relevant indicator are included. USAID’s FP/RH graduation strategy establishes a MCPR of 50 percent as a trigger for development of a graduation plan. Egypt, Bangladesh, and Zimbabwe currently have MCPR levels that exceed this threshold, but are not currently under consideration for graduation for various reasons (see country list and additional notes in Data Source in indicator table). These changes affect the FY 2012 actual results and FY 2013 targets reported previously. Expected rates of progress remain unchanged--one percentage point increase per annum in MCPR and 0.7 percentage point decline in first births to women under 18. Because of the change in included countries, FY 2013 and targets and actual MCPR and first birth averages cannot be compared to the data reported for prior years. Contraceptive Use and Birth Spacing Increased contraceptive use leads to decreases in unintended pregnancies and abortion rates and slows population growth over time. MCPR measures the percentage of in-union women of reproductive age (15-49 years) using, or whose partner is using, a modern method of contraception at the time of the survey. Annual country estimates of MCPR are derived through moving averages using all available data points
Page 40 of 80

from Demographic and Reproductive Health Surveys (DHS/RHS) as well as FY 2013 population data. A one percent increase in MCPR was achieved across USAID-assisted FP/RH countries between 2012 and 2013. Experience suggests that a country with a strong family planning program can expect to achieve and sustain a 1-2 percentage point annual change in MCPR.
STRATEGIC GOAL THREE Program Area: Family Planning and Reproductive Health Performance Indicator: MCPR: Modern Method Contraceptive Prevalence Rate
FY 2009 FY 2010 FY 2011 FY 2012 FY 2013 FY 2013 FY 2013 Results Results Results Results Target Results Rating
27.30% 28.40% 29.80% 30.90% 31.90% 31.90% On Target
Data Source: FY 2013 results and FY 2014 and FY 2015 targets have been projected using Demographic and Reproductive Health Survey data for the following USAID-assisted countries: Afghanistan, Angola, Bangladesh, Benin, Burundi, Cambodia, Democratic Republic of Congo, Egypt, Ethiopia, Ghana, Guatemala, Guinea, Haiti, India (UP), Jordan, Kenya, , Liberia, Madagascar, Malawi, Mali, Mozambique, Nepal, Nigeria, Pakistan, Philippines, Rwanda, Senegal, Tanzania, Uganda, Yemen, Zambia and Zimbabwe. FY 2013 results and FY 2014 and FY 2015 targets are based on: 1) the number of countries receiving >= $2 million in FP/RH in FY 2012 and with two or more Reproductive Health Survey (RHS), MICS survey or DHS data points available at the time of reporting (see assumptions above). Bolivia is excluded because USAID was directed by the Government of Bolivia to leave the country. Egypt is included because of expectations of FY 2014 funding, even though funding levels in FY12 did not meet the inclusion criterion. Burundi is a new addition to the list of included countries. South Sudan, which meets the funding criterion, is excluded because it does not yet have two survey data points. Data Quality: The USAID Office of Population and Reproductive Health examines all third-party data for this indicator and triangulates them with a variety of sources to verify their quality, validity, and reliability. First Birth under 18 Delaying the age of first birth helps slow population growth by shortening the reproductive span. In addition, early childbearing has multiple detrimental health and non-health consequences. Women who give birth before the age of 18 may be at higher risk of obstetric fistula, anemia and maternal morbidity and mortality. Their children are also more likely to experience serious health consequences. Furthermore, early childbearing is associated with lower levels of education, higher rates of poverty, and higher incidences of domestic violence and sexual abuse. This indicator measures the proportion of women who had a first birth before the age of 18 among women aged 18-24 at the time of the survey. The average percentage of women aged 18-24 who had a first birth before the age of 18 is equal to the sum of the estimated annual percentage of women aged 18-24 who had a first birth before the age of 18 across all target countries divided by the number of target countries. Annual country estimates of early childbearing are derived through moving averages using all available data points from DHS/RHS surveys. Estimates for years beyond the last available data point are derived through linear extrapolation based on the last two available data points. A decrease among this affected population represents an improvement. Thus, the planned target for this indicator was met in FY 2013. The actual value for this indicator in 2013 (22.5) was slightly improved from the target of 23 percent.
Page 41 of 80

STRATEGIC GOAL THREE Program Area: Family Planning and Reproductive Health Performance Indicator: First Birth under 18
FY 2009 FY 2010 FY 2011 FY 2012 FY 2013 FY 2013 FY 2013 Results Results Results Results Target Results Rating
23.90% 24.40% 24.00% 23.30% 23% 22.50% Above Target
Data Source: FY 2013 results and FY 2014 and FY 2015 targets have been projected using Demographic and Reproductive Health Survey data for the following USAID-assisted countries: Afghanistan, Angola, Bangladesh, Benin, Burundi, Cambodia, DRC, Egypt, Ethiopia, Ghana, Guatemala, Guinea, Haiti, India (UP), Jordan, Kenya, Liberia, Madagascar, Malawi, Mali, Mozambique, Nepal, Nigeria, Pakistan, Philippines, Rwanda, Senegal, Tanzania, Uganda, Yemen, Zambia and Zimbabwe. Inclusion criteria are: 1) the number of countries receiving >= $2 million in FP/RH in FY 2012 and with two or more Reproductive Health Survey (RHS), MICS survey or DHS data points available at the time of reporting (see assumptions above). Bolivia is excluded because USAID was directed by the Government of Bolivia to leave the country; Egypt is included because of expectations of FY2014 funding, even though funding levels in FY12 did not meet the inclusion criterion. Burundi is a new addition to the list of included countries. South Sudan, which meets the funding criterion, is excluded because it does not yet have two survey data points. Data Quality: The USAID Knowledge Management Services (KMS) Project examines all third-party data for this indicator and triangulates them with a variety of sources to verify their quality, validity, and reliability. Program Element: Water Supply and Sanitation $ in thousands FY 2013 Actual TOTAL FOREIGN OPERATIONS BUDGET 33,062,892 Water Supply and Sanitation 230,663 The U.S. Government, through the Senator Paul Simon Water for the Poor Act of 2005, is committed to using its foreign assistance resources to help achieve a water-secure world where people and countries have reliable and sustainable access to an acceptable quantity and quality of water to meet human, livelihood, production, and ecosystem needs. USAID supports increased access to reliable and sustainable water supply and sanitation through funding for small- and large-scale infrastructure development and through institutional and capacity development, strengthening of community-based systems, facilitation of private supply of products and services, improved management and governance, and mobilization of sector financing. The Millennium Development Goal (MDG) target is to reduce the proportion of people without access to an improved water supply by half by 2015 relative to the FY 1990 baseline, and globally this MDG was met in 2010, according to the 2012 WHO/UNICEF Joint Monitoring Programme for Water Supply and Sanitation (JMP) update. Nevertheless, there are still 768 million people without access to an improved water source, with greater levels of access shown to be in urban areas among higher socioeconomic populations. Sanitation has even less coverage, with over 2.5 billion people lacking access to basic sanitation. USAID’s recently launched Water and Development Strategy sets the overall goal of saving lives and advancing development through improvements in water supply, sanitation, and hygiene (WASH) programs, and through sound management and use of water for food security. To achieve this goal the Strategy sets two strategic objectives (SOs). SO1 is to improve health outcomes through the provision of sustainable WASH. USAID has set a target of reaching a minimum of 10 million persons with sustainable access to improved water supply and six million persons with sustainable access to improved sanitation
Page 42 of 80

over the period of 2013 - 2018. The Strategy has added emphasis to sustainability, safe water, and sanitation. Access to an Improved Water Source Improved drinking water sources, according to the WHO/UNICEF Joint Monitoring Programme (JMP) for Water Supply and Sanitation, are ones that by nature of their construction or through active intervention are protected from outside contamination, and in particular, from contamination with fecal matter. These sources include: piped water into a dwelling, plot, or yard; public tap/standpipe; tube well or borehole; a protected dug well; a protected spring; or rainwater collection. All other sources are considered to be “unimproved.” Unimproved drinking water sources, according to the JMP, are: an unprotected dug well; unprotected spring; cart with small tank/drum; tanker truck; surface water (river, dam, lake, pond, stream, canal, irrigation channel); and bottled water. Per the WHO/UNICEF JMP definition for the percent of households using an improved water source, acceptable country-level data sources include the Demographic and Health Survey (DHS), WHO/UNICEF Multi-Cluster Indicator Survey, or any high-quality national level data collected by the host government or other donors. A representative set of USAID-assisted countries (Bangladesh, Benin, Bolivia, Cambodia, DRC, Ethiopia, Ghana, Haiti, India, Indonesia, Kenya, Liberia, Madagascar, Mali, Mozambique, Nepal, Nigeria, Rwanda, Senegal, South Sudan, Uganda, and Zambia) were considered in this analysis. USAID will provide continued technical support on WSSH-related programs, with Development Assistance, Economic Support Fund, and Global Health Programs funding also contributing to these country-level outcomes. The indicator is reported on for target areas only and often does not accurately represent the population because it is based on households. The indicator will be changed to Percent of Population Using an Improved Water Source, and will be reported on using national level data (DHS, WHO/UNICEF, or other surveys as reported to the JMP).
STRATEGIC GOAL THREE Program Element: Water Supply and Sanitation Performance Indicator: Percent of Households Using an Improved Drinking Water Source
FY 2009 FY 2010 FY 2011 FY 2012 FY 2013 FY 2013 FY 2013 Results Results Results Results Target Results Rating
N/A N/A N/A 37.50% 38.48% 38.39% On Target
Data Source: Data Source: DHS, WHO/UNICEF MICS or other survey results, as reported to the JMP. This data presentation is based on the following list of countries with a minimum of two data points for comparison: Bangladesh, Benin, Bolivia, Cambodia, Democratic Republic of Congo, Ethiopia, Ghana, Haiti, India, Indonesia, Kenya, Liberia, Madagascar, Mali, Mozambique, Nepal, Nigeria, Rwanda, Senegal, South Sudan, Uganda, and Zambia. In line with WHO/UNICEF JMP trends for these countries, a 0.89 percent average rate of change was used to extrapolate out-year targets for the percent of households using an improved water source. Data Quality: Data Quality: Acceptable country-level data sources include the Demographic and Health Survey (DHS), WHO/UNICEF Multi-Cluster Indicator Survey, or any high-quality national level data collected by the host government or other donors. Data is collected by the JMP.
Page 43 of 80

Access to Improved Sanitation Improved sanitation is defined as a facility that hygienically separates human excreta from human contact, and facilities shared between two or more households are not considered improved under this definition. Use of an improved sanitation facility by households is strongly linked to decreases in the incidence of diarrheal disease among household members, especially among children under age five. Diarrhea remains the second leading cause of child deaths worldwide. Per the WHO/UNICEF JMP definition for the percent of households using an improved sanitation facility, acceptable country-level data sources include the Demographic and Health Survey (DHS), WHO/UNICEF Multi-Cluster Indicator Survey, or any high-quality national level data collected by the host government or other donors. USAID-assisted countries (Bangladesh, Benin, Bolivia, Cambodia, DRC, Ethiopia, Ghana, Haiti, India, Indonesia, Kenya, Liberia, Madagascar, Mali, Mozambique, Nepal, Nigeria, Rwanda, Senegal, South Sudan, Uganda, and Zambia) were considered in this analysis. USAID will provide continued technical support on WSSH-related programs, with Development Assistance, Economic Support Fund, and Global Health Programs funding also contributing to these country-level outcomes. The indicator is reported on for target areas only and often does not accurately represent the population because it is based on households. The indicator will be changed to Percent of Population Using an Improved Sanitation Facility, and will be reported on using national level data (DHS, WHO/UNICEF, or other surveys as reported to the JMP).
STRATEGIC GOAL THREE Program Element: Water Supply and Sanitation Performance Indicator: Percent of Households Using an Improved Sanitation Facility
FY 2009 FY 2010 FY 2011 FY 2012 FY 2013 FY 2013 FY 2013 Results Results Results Results Target Results Rating
N/A N/A N/A 12.60% 14.46% 13.44% Below Target
Data Source: DHS, WHO/UNICEF MICS or other survey results, as reported to the JMP. This data presentation is based on the following list of countries with a minimum of two data points for comparison: Bangladesh, Benin, Bolivia, Cambodia, Democratic Republic of Congo, Ethiopia, Ghana, Haiti, India, Indonesia, Kenya, Liberia, Madagascar, Mali, Mozambique, Nepal, Nigeria, Rwanda, Senegal, South Sudan, Uganda, and Zambia. In line with WHO/UNICEF JMP trends for these countries, a 0.84 percent average rate of change was used to extrapolate out-year targets for the percent of households using an improved water source. Data Quality: Acceptable country-level data sources include the Demographic and Health Survey (DHS), WHO/UNICEF Multi-Cluster Indicator Survey, or any high-quality national level data collected by the host government or other donors. Data is collected by the JMP. Program Area: Nutrition $ in thousands FY 2013 Actual TOTAL FOREIGN OPERATIONS BUDGET 33,062,892 Nutrition 217,210 Maternal and child under-nutrition negatively affects all aspects of an individual’s health and development and further limits societies’ economic and social development. In 2011, under-nutrition, including fetal
Page 44 of 80

growth restriction, suboptimum breastfeeding, stunting, wasting, and vitamin A and zinc deficiencies, contributed to 3.1 million (45 percent) child deaths worldwide. The damage caused by under-nutrition to cognitive, social, and motor development during pregnancy and early childhood is irreversible. It leads to lower levels of educational attainment, reduced productivity later in life, lower lifetime earnings, and slowed economic growth of nations. As a result, under-nutrition can decrease a country’s economic advancement by up to 8 percent, which further amplifies the conditions that lead to under-nutrition. However, this cycle is preventable. Improving nutrition can reduce child and maternal mortality and morbidity as well as chronic diseases later in life. It can also lift families out of poverty and contribute to long-term economic growth. U.S. investments in nutrition through agriculture, health, and humanitarian assistance programs can forge long-term links and realize mutual benefits for health and economic productivity. Nutrition is a key component of the Feed the Future (FTF) Initiative and the Global Health Initiative (GHI), as well as the Food for Peace programs. USAID aims to prevent and treat under-nutrition through a comprehensive package of maternal and child nutrition interventions focusing on the first 1,000 days--from pregnancy to age two. Programs support country-led efforts that make affordable, quality foods available, promote breastfeeding and improved feeding practices, and provide micronutrient supplementation and community-based management of acute malnutrition. Since rising incomes do not necessarily translate into a reduction in under-nutrition, USAID supports specific efforts geared towards better child nutrition outcomes, including broader nutrition education that target the whole family, including mothers, fathers, grandmothers and other caregivers. Maternal Anemia Prevalence Anemia is strongly associated with maternal mortality and contributes to adverse birth outcomes including premature birth and low birth weight. Globally, almost a fifth of all pregnant women suffer from iron deficiency anemia, the most common type of anemia in developing countries. The primary cause of anemia is poor diet, which is often exacerbated by infectious diseases, particularly malaria and intestinal parasites. As part of a comprehensive nutrition strategy, USAID’s programs aim to improve the nutritional status of women and children through targeted investments in the highest burden countries. The programs work across sectors to improve the nutritional status of women and children. A decrease among this affected population represents an improvement. Thus, the FY 2013 prevalence of anemia among women of reproductive age performance was above target, with a 2.4 percent reduction across 15 GHI and FTF-assisted countries where data was available between FY 2012 and FY 2013. Annual results for this indicator are calculated using population weighted rolling averages for assisted countries.
Page 45 of 80

STRATEGIC GOAL THREE Program Area: Nutrition Performance Indicator: Prevalence of Anemia among Women of Reproductive Age
FY 2009 FY 2010 FY 2011 FY 2012 FY 2013 FY 2013 FY 2013 Results Results Results Results Target Results Rating
46.00% N/A 41.40% 40.90% 40.40% 38.50% Above Target
Data Source: Demographic and Health Surveys and Reproductive Health Surveys. Census Bureau data used for population weights for the following USAID Nutrition Program and FTF priority countries: Bangladesh, Cambodia, Democratic Republic of Congo, Ethiopia, Ghana, Guatemala, Haiti, Liberia, Malawi, Mali, Mozambique, Nepal, Rwanda, Senegal, Tajikistan, Tanzania, Uganda, and Zambia. DRC and Tajikistan were newly added to analyses this year due to expanding nutrition work in those countries. Also, Kenya data were excluded from these analyses as they came from one Micronutrient Initiative survey and the data are considered unreliable.
Data Quality: The USAID Knowledge Management Services (KMS) Project examines all third-party data for this indicator and triangulates them with a variety of sources to verify their quality, validity, and reliability. Underweight Children One indicator of progress for meeting the first Millennium Development Goal (MDG)—to eradicate extreme poverty and hunger—is to reduce the prevalence of underweight children under five years old. In 2011, over 100 million children worldwide (16 percent) were underweight, a 36 percent decrease from 1990. However, this decline is threatened by the fluctuations in food prices and recurrent drought in areas such as the Sahel and Horn of Africa. FY 2013 results for the prevalence of underweight children under the age of five years old across GHI and FTF-assisted countries were estimated using data collected through the Demographic and Health Survey. Population-weighted rolling averages for GHI and FTF-assisted countries are calculated annually based on the availability of new survey data points. A decrease among this affected population represents an improvement. In FY 2013, USAID achieved a 21.7 percent prevalence of underweight children under five years of age across the 19 GHI and FTF countries for which data were available. The Democratic Republic of Congo (DRC) and Tajikistan were newly included in analyses for FY 2013 due to expanding nutrition work in these countries. DRC’s large population and prevalence of underweight children increases the overall average for the GHI and FTF priority countries; nevertheless this indicator showed progress in FY 2013 compared to FY 2012. Even a small change in this outcome indicator represents a meaningful change in country health and nutrition programs.
Page 46 of 80

STRATEGIC GOAL THREE Program Area: Nutrition Performance Indicator: Prevalence of Underweight Children under Five Years of Age
FY 2009 FY 2010 FY 2011 FY 2012 FY 2013 FY 2013 FY 2013 Results Results Results Results Target Results Rating
N/A N/A 22.90% 22% 21.30% 21.70% Improved, but Target Not Met
Data Source: Demographic Health Surveys and Reproductive Health Surveys and Census Bureau (for population weights) for the following USAID Nutrition Program and FTF priority countries: Bangladesh, Cambodia, Democratic Republic of Congo, Ethiopia, Ghana, Guatemala, Haiti, Kenya, Liberia, Malawi, Mali, Mozambique, Nepal, Rwanda, Senegal, Tajikistan, Tanzania, Uganda, and Zambia. Population-weighted rolling averages were used for reporting. DRC and Tajikistan were newly added to analyses this year due to expanding nutrition work in those countries. Data Quality: The USAID Knowledge Management Services (KMS) Project examines all third-party data for this indicator and triangulates them with a variety of sources to verify their quality, validity, and reliability. Program Element: Basic Education $ in thousands FY 2013 Actual TOTAL FOREIGN OPERATIONS BUDGET 33,062,892 3.2.1 Basic Education 786,727 The United States promotes equitable, accountable, and sustainable formal and non-formal education systems. Investment in basic education focuses on improving early childhood education, primary education, and secondary education, delivered in formal or non-formal settings. It includes literacy, numeracy, and other basic skills programs for youth and adults. The USAID Education Strategy 2011-2015 is focused on three main goals: 1) improved reading skills for 100 million children in primary grades by 2015; 2) improved ability of tertiary and workforce development programs to generate workforce skills relevant to a country's development goals; and 3) increased equitable access to education in crisis and conflict environments for 15 million learners by 2015. Primary Enrollment Rate In the Basic Education sector, the United States assesses its performance based on the primary net enrollment rate (NER) for a sample of countries receiving basic education funds. NER is a measure of access to schooling among the official primary school-age group. It is expressed as a percentage of the total primary school-age population. A high NER denotes a high degree of participation of the official school-age population. Although finding accurate global education indicators is difficult, NER is generally seen as the most reliable measure and so was chosen as an overall indicator of education outcome and impact. Although USAID is certainly not solely responsible for supporting increases in enrollment rates, there is plausible attribution for this performance indicator. USAID targets and results are based on a sub-sample of ten countries across regions: Ethiopia, Ghana, Guatemala, Honduras, Mali, Pakistan, Senegal, Tanzania, Yemen, and Zambia. U.S. foreign assistance supports an increase in NER through a variety of activities designed to improve the
Page 47 of 80
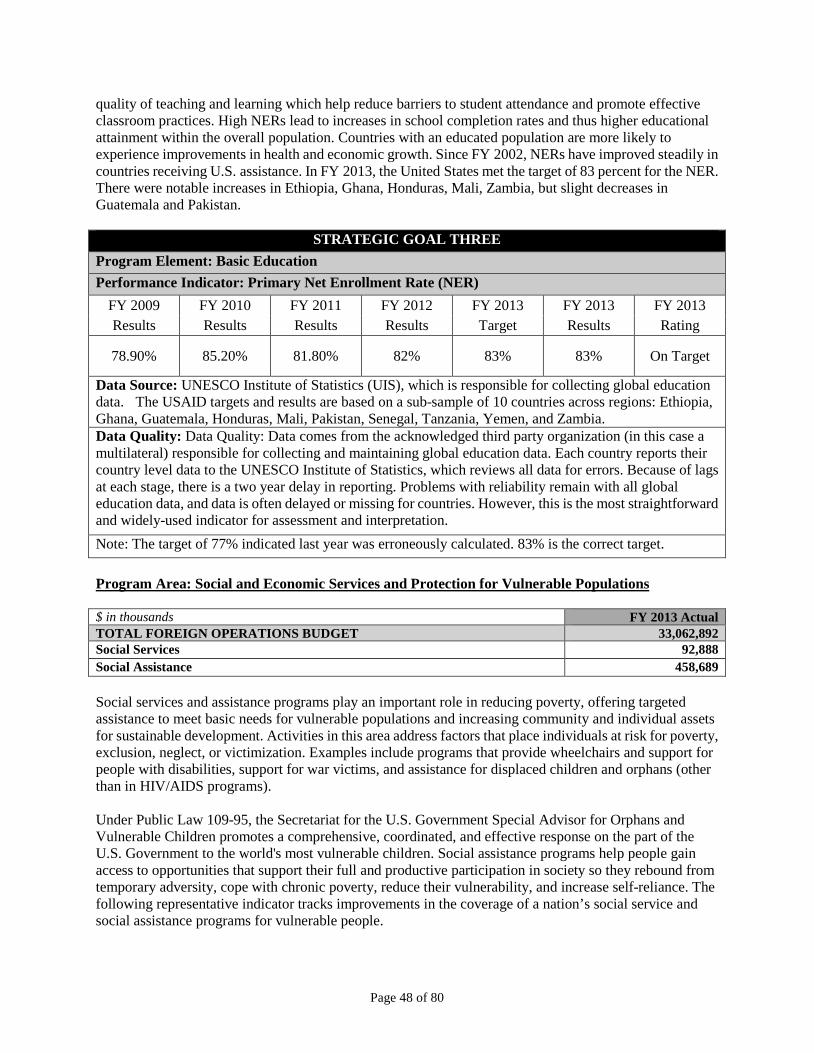
quality of teaching and learning which help reduce barriers to student attendance and promote effective classroom practices. High NERs lead to increases in school completion rates and thus higher educational attainment within the overall population. Countries with an educated population are more likely to experience improvements in health and economic growth. Since FY 2002, NERs have improved steadily in countries receiving U.S. assistance. In FY 2013, the United States met the target of 83 percent for the NER. There were notable increases in Ethiopia, Ghana, Honduras, Mali, Zambia, but slight decreases in Guatemala and Pakistan.
STRATEGIC GOAL THREE Program Element: Basic Education Performance Indicator: Primary Net Enrollment Rate (NER)
FY 2009 FY 2010 FY 2011 FY 2012 FY 2013 FY 2013 FY 2013 Results Results Results Results Target Results Rating
78.90% 85.20% 81.80% 82% 83% 83% On Target
Data Source: UNESCO Institute of Statistics (UIS), which is responsible for collecting global education data. The USAID targets and results are based on a sub-sample of 10 countries across regions: Ethiopia, Ghana, Guatemala, Honduras, Mali, Pakistan, Senegal, Tanzania, Yemen, and Zambia. Data Quality: Data Quality: Data comes from the acknowledged third party organization (in this case a multilateral) responsible for collecting and maintaining global education data. Each country reports their country level data to the UNESCO Institute of Statistics, which reviews all data for errors. Because of lags at each stage, there is a two year delay in reporting. Problems with reliability remain with all global education data, and data is often delayed or missing for countries. However, this is the most straightforward and widely-used indicator for assessment and interpretation. Note: The target of 77% indicated last year was erroneously calculated. 83% is the correct target. Program Area: Social and Economic Services and Protection for Vulnerable Populations $ in thousands FY 2013 Actual TOTAL FOREIGN OPERATIONS BUDGET 33,062,892 Social Services 92,888 Social Assistance 458,689 Social services and assistance programs play an important role in reducing poverty, offering targeted assistance to meet basic needs for vulnerable populations and increasing community and individual assets for sustainable development. Activities in this area address factors that place individuals at risk for poverty, exclusion, neglect, or victimization. Examples include programs that provide wheelchairs and support for people with disabilities, support for war victims, and assistance for displaced children and orphans (other than in HIV/AIDS programs). Under Public Law 109-95, the Secretariat for the U.S. Government Special Advisor for Orphans and Vulnerable Children promotes a comprehensive, coordinated, and effective response on the part of the U.S. Government to the world's most vulnerable children. Social assistance programs help people gain access to opportunities that support their full and productive participation in society so they rebound from temporary adversity, cope with chronic poverty, reduce their vulnerability, and increase self-reliance. The following representative indicator tracks improvements in the coverage of a nation’s social service and social assistance programs for vulnerable people.
Page 48 of 80

Social Services and Assistance Beneficiaries The U.S. Government provides social services through a number of specific funds, including Special Programs Addressing the Needs of Survivors (SPANS), which consist of five congressionally-directed programs designed to reduce the risks and reinforce the capacities of communities, local NGOs, and governments to provide services and protection for vulnerable groups (e.g. vulnerable children, victims of war and torture, and people with disabilities). In FY 2013, results for this indicator exceeded planned targets, providing direct assistance and training to 2,488,888 children and adults. The higher than expected number of beneficiaries reached with U.S. assistance was due to an expansion of services to vulnerable populations in Armenia, Afghanistan, and Zimbabwe—where the needs for services for women were underestimated—and other reporting countries.
STRATEGIC GOAL THREE Program Area: Social and Economic Services and Protection for Vulnerable Populations Performance Indicator: Number of People Benefitting from U.S.-Supported Social Assistance Programming
FY 2009 FY 2010 FY 2011 FY 2012 FY 2013 FY 2013 FY 2013 Results Results Results Results Target Results Rating
3,485,079 4,148,088 3,064,461 3,343,284 2,167,794 2,488,888 Above Target
Data Source: FY 2013 Performance Reports as collected in the Foreign Assistance and Coordination System (FACTS). Data Quality: Performance data, verified using Data Quality Assessments (DQAs), must meet standards of validity, integrity, precision, reliability, and timeliness. Each OU must document the methodology used to conduct the DQAs. DQA and data source records are maintained in the Performance Management Plans; Missions certify via the Performance Plan and Report that a DQA has occurred within the last three years. (For details, refer to USAID's Automated Directive System [ADS] Chapter 203.3.11, http://www.usaid.gov/policy/ads/200/203.pdf). Program Area: Macroeconomic Foundation for Growth $ in thousands FY 2013 Actual TOTAL FOREIGN OPERATIONS BUDGET 33,062,892 Macroeconomic Foundation for Growth 456,703 A solid macroeconomic foundation for broad-based growth consists of sound fiscal and monetary policies, capable institutions, and governments’ abilities to use these tools to manage the economy. U.S. assistance works to strengthen these foundations by establishing a stable and predictable macroeconomic environment that encourages the private sector to make productivity-enhancing investments. Countries with open, competitive economies tend to experience more rapid growth without sacrificing goals relating to poverty reduction or income distribution. Those with greater debt burdens are often forced to prioritize budget expenditures, resulting in spending cuts that damage programs important to the public good such as education, health, and infrastructure maintenance. These programs benefit the most marginalized and poorest citizens. The U.S. Government provides technical assistance and training to support the design and implementation of key macroeconomic reforms in money and banking policy, fiscal policy, trade and exchange rate policy, and national income accounting, measurement, and analysis.
Page 49 of 80

Fiscal Deficit Progress To maintain a macroeconomic environment that fosters growth, countries must have sound fiscal policies that balance stability and societal needs. The fiscal deficit to gross domestic product (GDP) ratio is one of the most accepted measures to assess a nation’s debt burden and fiscal policy. It is defined by general government net lending over borrowing expressed as a percentage of GDP, and it is calculated as revenue minus total expenditure (averaged over three years to reduce fluctuations). Countries with modest fiscal deficits provide greater reassurance to private investors and do not crowd out private borrowers from domestic banking and capital markets. Countries with high fiscal deficits and large debt burdens are often forced to prioritize budget expenditures, resulting in spending cuts that damage programs important to the public good such as education, health, and infrastructure maintenance. These programs benefit the poorest and most marginalized citizens. Fiscal deficit data is collected for 15 countries where there is significant current or historic concern about fiscal performance, and where U.S. assistance leverages or implements projects in the Macroeconomic Foundation for Growth Program Area funded in FY 2007- FY 2011 (to allow for a lag in observable impact) to help keep prices stable and to correct or avoid fiscal imbalance. For example, U.S. programs provide technical assistance to raise “domestic resource mobilization” from tax and customs collections. Results are expressed as the percent of these countries that have managed to keep their average government cash deficit no larger than 3.0 percent of GDP for the previous three calendar years. Therefore, the result reported for FY 2012 of 26.7 percent is the percent of the 15 countries that kept their fiscal deficit in check from 2009-2011. CY 2012 data are not yet available for FY 2013 results. This result shows a sharp decline in the number of countries with ‘low deficits’ due to the impact of the global financial crisis of 2008 and prolonged recession in Western Europe and the United States -- which have slowed economic growth and reduced tax revenues in many other countries. The recession also increased fiscal deficits where government spending increased temporarily to replace private spending. The impact of the crisis in 2008 and 2009 continued to impact results for CY 2011. Preliminary information suggests that the unfavorable trend for this indicator has continued in CY 2012, requiring us to set modest expectations for the FY 2013targets. Nonetheless, USAID programs continue efforts to help client countries raise needed revenue and focus expenditures. Progress has been made in some USAID partner countries (Armenia, El Salvador, Georgia, Ghana, Philippines); while political will has been lacking in several key countries (such as in Egypt and critically so in Pakistan) to deal forcefully with major imbalances.
Page 50 of 80

STRATEGIC GOAL THREE Program Area: Macroeconomic Foundation for Growth Performance Indicator: Three-Year Average in the Fiscal Deficit as a Percent of Gross Domestic Product (GDP)
FY 2009 FY 2010 FY 2011 FY 2012 FY 2013 FY 2013 FY 2013 Results Results Results Results Target Results Rating
66.7% 60.0% 46.7% 26.7% 50% N/A* Data Not Available
Data Source: World Bank's World Development Indicators: Government cash surplus/deficit as a percent of GDP. The 15 countries monitored for this indicator are: Armenia, Egypt, El Salvador, Georgia, Ghana, India, Indonesia, Jamaica, Jordan, Kazakhstan, Kyrgyzstan, Lebanon, Mongolia, Philippines, and Serbia. Data Quality: World Development Indicators are part of the World Bank's annual compilation of data about development. There is usually a one-year time delay in data reported such that data reported for FY 2013 reflects achievements in the 2012 CY. *CY 2012 data are not yet available to calculate FY 2013 results. Before publication, the data undergo a rigorous review and validation process by World Bank technical staff and country-level committees of statistical agencies. Prior year data is updated in light of new information and, in this case, a change in the countries monitored due to an updated period of funding (FY 2007-2011) for this program area. The USAID Economic Analysis and Data Service Project examine the data after public release and notify the World Bank if erroneous data are published. This is a more accurate calculation than the average that was used in prior years. Updated numbers reflect the new calculation method. Inflation Rate A low and steady rate of inflation is favored by most economists. Therefore, results are deemed satisfactory for countries receiving USAID assistance in this program area if they registered an inflation rate of 5 percent or lower or, if at higher rates, they have registered a rate of inflation lower than in the previous year, indicating progress toward that target. By this standard, the proportion of the 26 USAID-assisted countries with satisfactory inflation performance increased from less than half in CY 2011 to about 65 percent for the calendar year 2012, which is the result indicated under FY 2013 results. Donor concerns about inflation in less developed countries (LDCs) peaked in CY 2008, when, in the wake of a global crop shortfall, food prices shot up. In that year, all of the 26 USAID-assisted countries registered inflation rates higher than 5 percent and only one country (Guyana) had been able to reduce its rate of inflation from the previous year. Efforts by most of these countries to bring domestic inflation back under control and a rebound of global food production beginning in 2009 led to improved performance (as reported for FY 2010). However, progress in controlling inflation was not as fast as expected, as the number of these countries keeping inflation in check still amounted to only about half of the total during 2010-11. The U.S. Government will continue to provide technical assistance in fiscal and monetary management, with the aim of helping a majority of assisted countries maintain macroeconomic stability.
Page 51 of 80

STRATEGIC GOAL THREE Program Area: Macroeconomic Foundation for Growth Performance Indicator: Inflation Rate, Consumer Prices, Annual
FY 2009 FY 2010 FY 2011 FY 2012 FY 2013 FY 2013 FY 2013 Results Results Results Results Target Results Rating 4.20% 88.50% 53.80% 42.30% 55.00% 65.40% Above
Target Data Source: Data Source: World Bank's World Development Indicators: Inflation, consumer prices (annual %). This indicator is monitored for 26 countries that received USAID assistance in the Macroeconomic Foundation for Growth Program Area funded in FY 2007 - 2011 and which regularly report this information. Data Quality: Data Quality: World Development Indicators are part of the World Bank's annual compilation of data on development. Before publication, the data undergo a rigorous review and validation process by World Bank technical staff and country-level committees of statistical agencies. The USAID Economic Analysis and Data Service Project examines the data after public release and notifies IMF or World Bank if erroneous data are published. A few recent year omissions due to late reporting are filled in with estimates from the CIA World Factbook. Calculation is the percent of USAID assisted countries with inflation rates at or below 5 percent or making progress toward that benchmark. (NOTE: Previous year results have been revised due to an updated period of funding which changed a few countries being monitored and to revisions from the source of data for those years but this is not reflected here. Tax Administration and Compliance Improved tax administration and compliance is linked to economic growth. When governments have more internally generated funds, they can invest in infrastructure, public services and social services that promote economic activity and productivity. A good tax system generates more income that a poorly designed or administered one. This indicator tracks the percent increase in tax collections that may result from U.S. programs to facilitate tax reform and reduce non-compliance with tax laws. Improved tax administration is most effective when it includes more complete audit and investigation coverage, better, modern customs enforcement and increased efficiency in tax submission and collection procedures. FY 2013 targets were set based on past results achieved in countries such as Georgia and El Salvador where it was possible to make a strong attribution of revenue results to elements of the USAID project assistance. Results for FY 2013 against the global Tax Compliance indicator provided in field reports are limited. While USAID/West Bank Gaza estimated that 15 percent of the improved tax revenue by the Palestinian Authority could be attributed to US technical assistance, training, and information-database activities, other field operating units felt unable to estimate accurately the revenue impact of their project activities. To illustrate, the Bosnia Tax and Fiscal Project assisted development of an electronic database for collection of social contributions that reduces possibilities for unregistered labor and evasion of those payroll tax payments, with a result that payroll tax collections increased during the reporting period, in spite of a recorded workforce contraction.
Page 52 of 80

STRATEGIC GOAL THREE Program Area: Macroeconomic Foundation for Growth Performance Indicator: Tax Administration and Compliance Improved (% Increase in Tax Collections) as a Result of U.S. Assistance
FY 2009 FY 2010 FY 2011 FY 2012 FY 2013 FY 2013 FY 2013 Results Results Results Results Target Results Rating
N/A N/A N/A 72% 25% 15%* Data Not Available
Data Source: FY 2013 Performance Plans and Reports as captured in the U.S. Government Foreign Assistance Coordination and Tracking System and FACTS database. *FY2013 report is from West Bank/Gaza only, so reporting is incomplete and an assessment of the FY2013 Rating cannot be made at this time. Data Quality: Data Quality: Performance data, verified using Data Quality Assessments (DQAs), must meet standards of validity, integrity, precision, reliability, and timeliness. Each OU must document the methodology used to conduct the DQAs. DQA and data source records are maintained in the Performance Management Plans; Missions certify via the Performance Plan and Report that a DQA has occurred within the last three years. (For details, refer to USAID's Automated Directive System [ADS] Chapter 203.3.5, http://www.usaid.gov/policy/ads/200/203.pdf). Program Area: Trade and Investment $ in thousands FY 2013 Actual TOTAL FOREIGN OPERATIONS BUDGET 33,062,892 Trade and Investment 164,057 U.S. investments in trade and investment are critical to achieving our economic growth development objectives. Developing countries’ increased capacity to trade and attract investment leads to greater economic opportunity for all citizens, improved living standards, and economies that are more resilient to recession and shocks. The U.S. Government assists countries to engage in the rules-based trading system by providing capacity building assistance to implement trade agreement commitments and to work with businesses to take advantage of trade opportunities. These efforts increase the economic outlooks not just for host countries, but also for the United States by creating new markets for U.S. goods and services. Export/Import of Goods Greater engagement in international trade can increase a country’s per capita income, often dramatically. Developing countries that successfully integrated into the global economy enjoyed per capita income increases, while countries that limited their participation in the global economy in the 1990s experienced economic decline. Research confirms that countries can boost the ability of their companies to compete more effectively in trade if they promote efficient import/export procedures that reduce the cost of doing business. Reducing the time it takes to import and export goods improves the price competitiveness of traded goods on average one percentage point for each day saved and as much as four percentage points per day. Efficient movement of inputs and timely delivery of exports to clients are key determinants of private sector competitiveness, productivity, and wage growth. The data in the table below represent the aggregate average time to comply with import and export procedures (in days) for 13 countries receiving U.S. foreign assistance with a specific trade facilitation focus. The FY 2013 target of 69 days was met. Because the average refers to results for 13 countries,
Page 53 of 80
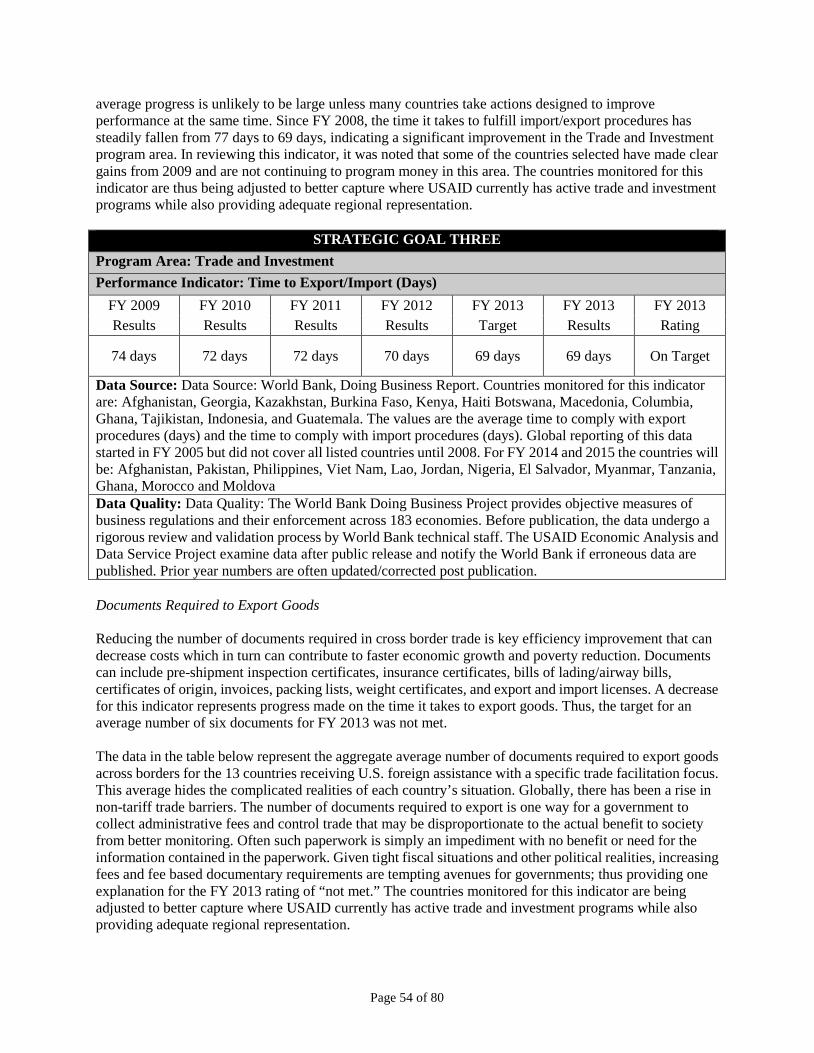
average progress is unlikely to be large unless many countries take actions designed to improve performance at the same time. Since FY 2008, the time it takes to fulfill import/export procedures has steadily fallen from 77 days to 69 days, indicating a significant improvement in the Trade and Investment program area. In reviewing this indicator, it was noted that some of the countries selected have made clear gains from 2009 and are not continuing to program money in this area. The countries monitored for this indicator are thus being adjusted to better capture where USAID currently has active trade and investment programs while also providing adequate regional representation.
STRATEGIC GOAL THREE Program Area: Trade and Investment Performance Indicator: Time to Export/Import (Days)
FY 2009 FY 2010 FY 2011 FY 2012 FY 2013 FY 2013 FY 2013 Results Results Results Results Target Results Rating
74 days 72 days 72 days 70 days 69 days 69 days On Target
Data Source: Data Source: World Bank, Doing Business Report. Countries monitored for this indicator are: Afghanistan, Georgia, Kazakhstan, Burkina Faso, Kenya, Haiti Botswana, Macedonia, Columbia, Ghana, Tajikistan, Indonesia, and Guatemala. The values are the average time to comply with export procedures (days) and the time to comply with import procedures (days). Global reporting of this data started in FY 2005 but did not cover all listed countries until 2008. For FY 2014 and 2015 the countries will be: Afghanistan, Pakistan, Philippines, Viet Nam, Lao, Jordan, Nigeria, El Salvador, Myanmar, Tanzania, Ghana, Morocco and Moldova Data Quality: Data Quality: The World Bank Doing Business Project provides objective measures of business regulations and their enforcement across 183 economies. Before publication, the data undergo a rigorous review and validation process by World Bank technical staff. The USAID Economic Analysis and Data Service Project examine data after public release and notify the World Bank if erroneous data are published. Prior year numbers are often updated/corrected post publication. Documents Required to Export Goods Reducing the number of documents required in cross border trade is key efficiency improvement that can decrease costs which in turn can contribute to faster economic growth and poverty reduction. Documents can include pre-shipment inspection certificates, insurance certificates, bills of lading/airway bills, certificates of origin, invoices, packing lists, weight certificates, and export and import licenses. A decrease for this indicator represents progress made on the time it takes to export goods. Thus, the target for an average number of six documents for FY 2013 was not met. The data in the table below represent the aggregate average number of documents required to export goods across borders for the 13 countries receiving U.S. foreign assistance with a specific trade facilitation focus. This average hides the complicated realities of each country’s situation. Globally, there has been a rise in non-tariff trade barriers. The number of documents required to export is one way for a government to collect administrative fees and control trade that may be disproportionate to the actual benefit to society from better monitoring. Often such paperwork is simply an impediment with no benefit or need for the information contained in the paperwork. Given tight fiscal situations and other political realities, increasing fees and fee based documentary requirements are tempting avenues for governments; thus providing one explanation for the FY 2013 rating of “not met.” The countries monitored for this indicator are being adjusted to better capture where USAID currently has active trade and investment programs while also providing adequate regional representation.
Page 54 of 80

STRATEGIC GOAL THREE Program Area: Trade and Investment Performance Indicator: Number of Documents Required to Export Goods Across Borders Decreased
FY 2009 FY 2010 FY 2011 FY 2012 FY 2013 FY 2013 FY 2013 Results Results Results Results Target Results Rating
8 docs 8 docs 7 docs 7 docs 6 docs 7 docs Below Target
Data Source: World Bank, Doing Business Report. The number of documents needed to export goods across borders is reported by country under the Trading Across Borders topic. Countries monitored for this indicator are: Afghanistan, Georgia, Kazakhstan, Burkina Faso, Kenya, Haiti, Botswana, Macedonia, Columbia, Ghana, Tajikistan, Indonesia, and Guatemala. For FY 2014 and 2015 the countries will be: Afghanistan, Pakistan, Philippines, Viet Nam, Lao, Jordan, Nigeria, El Salvador, Myanmar, Tanzania, Ghana, Morocco and Moldova. Data Quality: The World Bank Doing Business Project provides objective measures of business regulations and their enforcement across 183 economies. Before publication, the data undergo a rigorous review and validation process by World Bank technical staff. The USAID Economic Analysis and Data Service Project examine data after public release and notify the World Bank if erroneous data are published. Program Area: Financial Sector $ in thousands FY 2013 Actual TOTAL FOREIGN OPERATIONS BUDGET 33,062,892 Financial Sector 104,403 A sound financial system is critical to economic development. It mobilizes capital for productive private sector investment while providing the resources needed to fund essential government services such as education and health care. The United States is committed to improving financial sector governance, accounting, and transparency, and to combating corruption and financial crimes. U.S. assistance also seeks to improve the quality of financial services and their availability to entrepreneurs, enterprises, and consumers. Private Sector Credit Availability Credit for the private sector is one of the keys to economic growth. Comparative analysis of poverty, private credit, and GDP growth rates over 20 years shows that countries with higher levels of private credit experienced more rapid reductions in poverty levels than countries with comparable growth rates but lower levels of private credit. Private credit increases the amount of money available to consumers and small businesses, which in turn increases the level of economic activity, generating more job opportunities and higher incomes. As consumers and businesses use private credit more regularly, the level of private credit as a percent of GDP increases, spurring overall economic growth in a manner that has a greater impact on alleviating poverty. Data to illustrate the progress of U.S.-assisted countries in increasing levels of credit to the private sector is taken from the World Bank’s World Development Indicator database. Results from each Calendar Year (CY) are reported for the following fiscal year. The record indicates that the substantial progress achieved in CY 2007 (reported for FY 2008) slowed during the next four years due to the global economic recession. However, the number of assisted countries providing domestic credit to the private sector equal to or greater than 60 percent of GDP remained high. These countries reached 73.7 percent in both CY 2011 and CY
Page 55 of 80
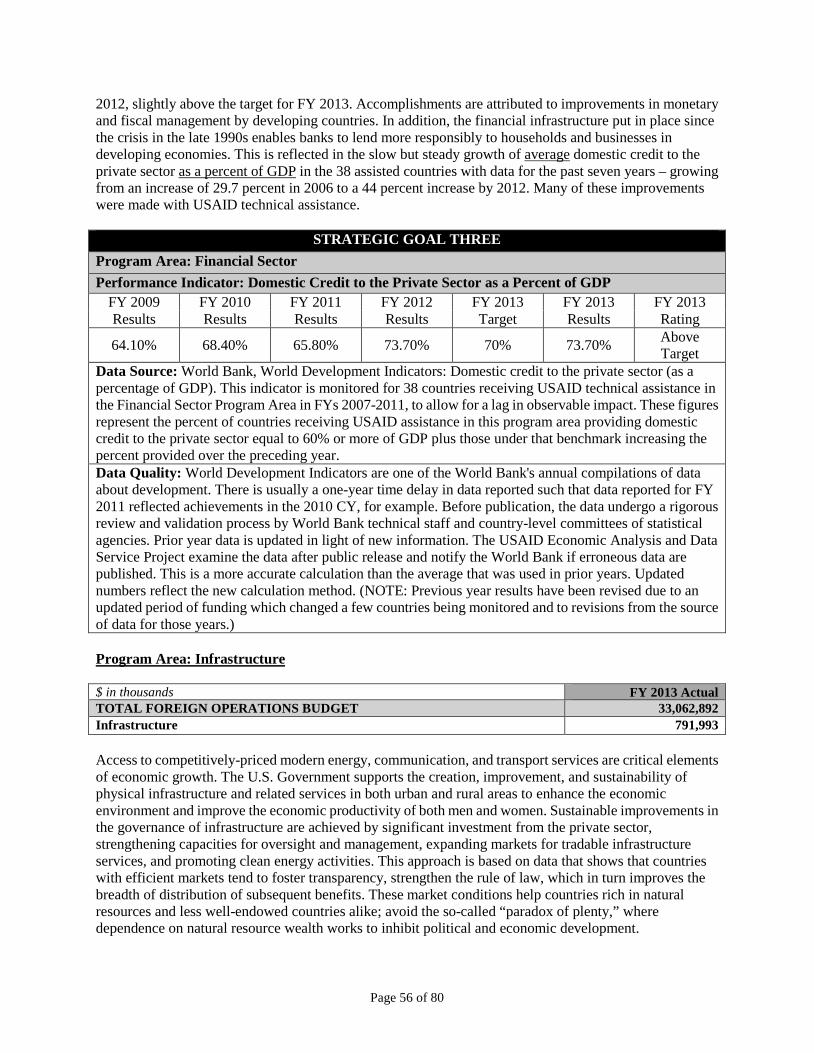
2012, slightly above the target for FY 2013. Accomplishments are attributed to improvements in monetary and fiscal management by developing countries. In addition, the financial infrastructure put in place since the crisis in the late 1990s enables banks to lend more responsibly to households and businesses in developing economies. This is reflected in the slow but steady growth of average domestic credit to the private sector as a percent of GDP in the 38 assisted countries with data for the past seven years – growing from an increase of 29.7 percent in 2006 to a 44 percent increase by 2012. Many of these improvements were made with USAID technical assistance.
STRATEGIC GOAL THREE Program Area: Financial Sector Performance Indicator: Domestic Credit to the Private Sector as a Percent of GDP
FY 2009 FY 2010 FY 2011 FY 2012 FY 2013 FY 2013 FY 2013 Results Results Results Results Target Results Rating 64.10% 68.40% 65.80% 73.70% 70% 73.70% Above
Target Data Source: World Bank, World Development Indicators: Domestic credit to the private sector (as a percentage of GDP). This indicator is monitored for 38 countries receiving USAID technical assistance in the Financial Sector Program Area in FYs 2007-2011, to allow for a lag in observable impact. These figures represent the percent of countries receiving USAID assistance in this program area providing domestic credit to the private sector equal to 60% or more of GDP plus those under that benchmark increasing the percent provided over the preceding year. Data Quality: World Development Indicators are one of the World Bank's annual compilations of data about development. There is usually a one-year time delay in data reported such that data reported for FY 2011 reflected achievements in the 2010 CY, for example. Before publication, the data undergo a rigorous review and validation process by World Bank technical staff and country-level committees of statistical agencies. Prior year data is updated in light of new information. The USAID Economic Analysis and Data Service Project examine the data after public release and notify the World Bank if erroneous data are published. This is a more accurate calculation than the average that was used in prior years. Updated numbers reflect the new calculation method. (NOTE: Previous year results have been revised due to an updated period of funding which changed a few countries being monitored and to revisions from the source of data for those years.) Program Area: Infrastructure $ in thousands FY 2013 Actual TOTAL FOREIGN OPERATIONS BUDGET 33,062,892 Infrastructure 791,993 Access to competitively-priced modern energy, communication, and transport services are critical elements of economic growth. The U.S. Government supports the creation, improvement, and sustainability of physical infrastructure and related services in both urban and rural areas to enhance the economic environment and improve the economic productivity of both men and women. Sustainable improvements in the governance of infrastructure are achieved by significant investment from the private sector, strengthening capacities for oversight and management, expanding markets for tradable infrastructure services, and promoting clean energy activities. This approach is based on data that shows that countries with efficient markets tend to foster transparency, strengthen the rule of law, which in turn improves the breadth of distribution of subsequent benefits. These market conditions help countries rich in natural resources and less well-endowed countries alike; avoid the so-called “paradox of plenty,” where dependence on natural resource wealth works to inhibit political and economic development.
Page 56 of 80

The U.S. Government supports a comprehensive approach to infrastructure development by helping to establish viable institutions, sound legal and regulatory environments, market-based financial flows, and cutting-edge technologies, and prioritizing ongoing operations maintenance. For example, USAID is helping to accelerate expanded access to broadband internet connectivity and communications technology to underserved populations in Africa. USAID is also providing assistance to expand access to energy services in selected countries like Afghanistan, in part by making direct financial investment in energy infrastructure to support reconstruction and rehabilitation of critical facilities. Direct investment in energy, even when more limited, are combined with sector reforms to safeguard sustainability. Within the transportation sector, the U.S. Government contributes to road construction for reconstruction in post-conflict and post-disaster situations and to enhance rural agriculture based economic development. Access to Energy and Infrastructure Better infrastructure promotes more rapid and sustained economic growth, as people and products can move and work more efficiently. This indicator tracks the number of people who benefit from improved infrastructure services due to U.S. assistance, either use an infrastructure service (such as transport) or receipt of an infrastructure product (such as information and communications technology, water, sanitation, or electricity). The FY 2013 result of 11,607,794 beneficiaries receiving improved infrastructure services due to U.S. assistance was well above the target of 765,227, partly because the Pakistan mission set the target too low. The Pakistan mission also accounts for the majority of the results for this indicator, with infrastructure programs focused on construction of key roads, water, energy and irrigation projects in the Federally Administered Tribal Areas, as well as reconstruction of public infrastructure in Khyber Pakhtunkhwa, formerly known as the North West Frontier Province, that was destroyed by conflict and the 2010 floods.
STRATEGIC GOAL THREE Program Area: Infrastructure Performance Indicator: Number of Beneficiaries Receiving Improved Infrastructure Services Due to U.S. Assistance
FY 2009 FY 2010 FY 2011 FY 2012 FY 2013 FY 2013 FY 2013 Results Results Results Results Target Results Rating
N/A N/A 5,820,641 225,725 765,227 11,607,794 Above Target
Data Source: FY 2013 Performance Plans and Reports from Georgia, Haiti, Pakistan, and Uganda as captured in the U.S. Government Foreign Assistance Coordination and Tracking System. Operating Unit contractors and grantees identify infrastructure supported with USAID funding and estimate using reasonable methods the number of beneficiaries of this infrastructure. Data Quality: Performance data, verified using Data Quality Assessments (DQAs), must meet standards of validity, integrity, precision, reliability, and timeliness. Each OU must document the methodology used to conduct the DQAs. DQA and data source records are maintained in the Performance Management Plans; Missions certify via the Performance Plan and Report that a DQA has occurred within the last three years. (For details, refer to USAID's Automated Directive System [ADS] Chapter 203.3.5, http://www.usaid.gov/policy/ads/200/203.pdf). The FY 2013 result of 694,000 beneficiaries receiving improved transport services due to U.S. assistance was well above the target of 162,481. The Afghanistan mission accounts for the majority of the results for this indicator; commercial trucks hauling fuel and goods along the Gardez-Khost road project increased the expected number of beneficiaries beyond just the drivers using the road.
Page 57 of 80

STRATEGIC GOAL THREE Program Area: Infrastructure Performance Indicator: Number of Beneficiaries Receiving Improved Transport Services Due to U.S. Assistance
FY 2009 FY 2010 FY 2011 FY 2012 FY 2013 FY 2013 FY 2013 Results Results Results Results Target Results Rating
2,341,526 2,863,566 3,227,825 2,041,800 162,481 694,000 Above Target
Data Source: FY 2013 Performance Plans and Reports for Afghanistan, Haiti, Madagascar, and South Sudan as reported in the Foreign Assistance Coordination and Tracking System. Data Quality: Performance data, verified using Data Quality Assessments (DQAs), must meet standards of validity, integrity, precision, reliability, and timeliness. Each Operating Unit must document the methodology used to conduct the DQAs. DQA and data source records are maintained in the Performance Management Plans; Missions certify via the Performance Plan and Report that a DQA has occurred within the last three years. (For details, refer to USAID's Automated Directive System [ADS] Chapter 203.3.5, http://www.usaid.gov/policy/ads/200/203.pdf). Limitations of this indicator include consistently estimating the number of beneficiaries of transport services across different countries and programs. Program Area: Agriculture $ in thousands FY 2013 Actual TOTAL FOREIGN OPERATIONS BUDGET 33,062,892 Agriculture 1,151,141 About 840 million people – or one-eighth of the world’s population – suffer from chronic hunger. While this is a reduction from previous estimates, it is still alarming. There is renewed attention by donors to address extreme poverty – the root cause of hunger and economic fragility. The U.S. Government is renewing its commitment to agriculture and economic growth and focusing on harnessing the power of the private sector and research to transform agricultural development. Agriculture is a key driver to foster economic growth, reduce poverty and global hunger, and improve health. By the World Bank’s estimates, interventions that target agriculture are twice as effective in reducing poverty as investments in other sectors like manufacturing or mining. U.S. investments in agriculture, including support provided through the Feed the Future initiative and commitment to the New Alliance for Food Security and Nutrition, focus on creating a foundation for sustainable economic growth by helping countries accelerate inclusive agriculture sector growth. To become competitive in today’s global marketplace, and to contribute to increased dietary diversity and improved nutrition, farmers need to integrate into the production chain—from farm to the grocery’s shelf. To bring about this integration, U.S. agricultural activities promote the adoption of productivity enhancing innovation and technologies, promoting efficient farming practices, improvement in product and quality control standards, and access to market information and infrastructure. Value of Incremental Sales In addition to working with rural households, farmers and farm groups, U.S. agricultural assistance focused on expanding access to markets by reducing trade barriers within and between countries. U.S. investments increased the value of incremental sales from approximately $927.8K in FY 2010, $86.8 million in FY 2011, $262.9 million in FY 2012, and $409.4 million in FY 2013. FY 2013 results represent a 70.6
Page 58 of 80

percent achievement of the target and a $146.6 million increase over FY 2012. This is a result of expanding our work with the number of small-holder direct beneficiaries of targeted commodities to increase adoption and transfer of new technologies, build linkages between agribusiness enterprises and financial institutions for the provision of credit and other financial services, forge public and private partnerships to mobilize additional resources, and develop markets.
STRATEGIC GOAL THREE Program Area: Agriculture Performance Indicator: Value of Incremental Sales (Collected at Farm-Level) Attributed to FTF Implementation FY 2009 FY 2010 FY 2011 FY 2012 FY 2013 FY 2013 FY 2013 Results Results Results Results Target Results Rating
N/A 927,778 86,789,146 262,876,569 289,123,509 409,449,828 Above Target
Data Source: FY 2013 Performance Reports for Bangladesh, Burundi, Cambodia, Ethiopia, Georgia, Ghana, Honduras, Indonesia, Kenya, Liberia, Malawi, Mali, Mozambique, Nepal, Nigeria, Rwanda, Senegal, Tajikistan, Tanzania, Uganda, Zambia, Zimbabwe, and the USAID Bureau For Food Security (BFS) as reported in the Foreign Assistance Coordination and Tracking System. Data Quality: Performance data, verified using Data Quality Assessments (DQAs), must meet standards of validity, integrity, precision, reliability, and timeliness. Each Operating Unit must document the methodology used to conduct the DQAs. DQA and data source records are maintained in the Performance Management Plans; Missions certify via the Performance Plan and Report that a DQA has occurred within the last three years. (For details, refer to USAID's Automated Directive System [ADS] Chapter 203.3.11, http://www.usaid.gov/sites/default/files/documents/1870/203.pdf). Agricultural Technology Applied and affordable agricultural technology and innovation are key to increasing productivity. Working with rural households, the United States promotes technological change and its adoption by different actors in the agricultural supply chain, which is critical to increasing smallholders’ agricultural production for commercial and home-based efforts, agricultural productivity at regional and national levels, and increasing access to nutritious foods. In FY 2013, over 6 million farmers, ranchers, and other agricultural producers applied new technologies or management practices, which is below our 8.5 million target. This target was not met largely due to a change in methodology between FY 2012 and FY 2013 in how one major grantee set targets and reported results (yielding a reduction of almost 2.3 million). Despite not meeting the overall target, several Feed the Future countries exceeded their FY 2013 targets: Bangladesh achieved an 82.8 percent increase due to scale up of fertilizer deep placement and high yielding and stress tolerant rice seed varieties; Cambodia achieved an 87.7 percent increase from rice and rice field fisheries program beneficiaries that adopted new technologies; Honduras achieved a 66.2 percent increase by accelerating the introduction of practices and technologies in coffee and horticulture that increased yields and cash flow; and, Tanzania promoted a core-set of good agricultural practices that are easily replicable, low-cost, and have a high impact on productivity, achieving close to an 84 percent increase over their target.
Page 59 of 80
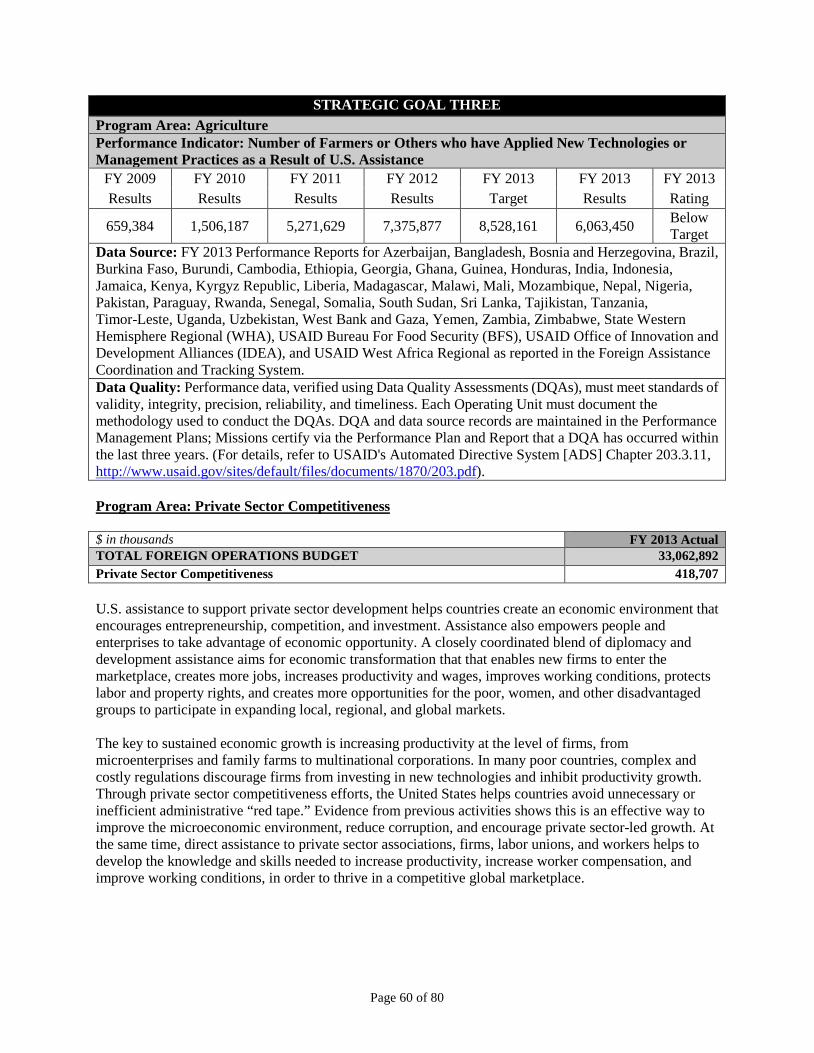
STRATEGIC GOAL THREE Program Area: Agriculture Performance Indicator: Number of Farmers or Others who have Applied New Technologies or Management Practices as a Result of U.S. Assistance
FY 2009 FY 2010 FY 2011 FY 2012 FY 2013 FY 2013 FY 2013 Results Results Results Results Target Results Rating
659,384 1,506,187 5,271,629 7,375,877 8,528,161 6,063,450 Below Target
Data Source: FY 2013 Performance Reports for Azerbaijan, Bangladesh, Bosnia and Herzegovina, Brazil, Burkina Faso, Burundi, Cambodia, Ethiopia, Georgia, Ghana, Guinea, Honduras, India, Indonesia, Jamaica, Kenya, Kyrgyz Republic, Liberia, Madagascar, Malawi, Mali, Mozambique, Nepal, Nigeria, Pakistan, Paraguay, Rwanda, Senegal, Somalia, South Sudan, Sri Lanka, Tajikistan, Tanzania, Timor-Leste, Uganda, Uzbekistan, West Bank and Gaza, Yemen, Zambia, Zimbabwe, State Western Hemisphere Regional (WHA), USAID Bureau For Food Security (BFS), USAID Office of Innovation and Development Alliances (IDEA), and USAID West Africa Regional as reported in the Foreign Assistance Coordination and Tracking System. Data Quality: Performance data, verified using Data Quality Assessments (DQAs), must meet standards of validity, integrity, precision, reliability, and timeliness. Each Operating Unit must document the methodology used to conduct the DQAs. DQA and data source records are maintained in the Performance Management Plans; Missions certify via the Performance Plan and Report that a DQA has occurred within the last three years. (For details, refer to USAID's Automated Directive System [ADS] Chapter 203.3.11, http://www.usaid.gov/sites/default/files/documents/1870/203.pdf). Program Area: Private Sector Competitiveness $ in thousands FY 2013 Actual TOTAL FOREIGN OPERATIONS BUDGET 33,062,892 Private Sector Competitiveness 418,707 U.S. assistance to support private sector development helps countries create an economic environment that encourages entrepreneurship, competition, and investment. Assistance also empowers people and enterprises to take advantage of economic opportunity. A closely coordinated blend of diplomacy and development assistance aims for economic transformation that that enables new firms to enter the marketplace, creates more jobs, increases productivity and wages, improves working conditions, protects labor and property rights, and creates more opportunities for the poor, women, and other disadvantaged groups to participate in expanding local, regional, and global markets. The key to sustained economic growth is increasing productivity at the level of firms, from microenterprises and family farms to multinational corporations. In many poor countries, complex and costly regulations discourage firms from investing in new technologies and inhibit productivity growth. Through private sector competitiveness efforts, the United States helps countries avoid unnecessary or inefficient administrative “red tape.” Evidence from previous activities shows this is an effective way to improve the microeconomic environment, reduce corruption, and encourage private sector-led growth. At the same time, direct assistance to private sector associations, firms, labor unions, and workers helps to develop the knowledge and skills needed to increase productivity, increase worker compensation, and improve working conditions, in order to thrive in a competitive global marketplace.
Page 60 of 80

Global Competitiveness Index A primary focus of U.S foreign assistance is removing unnecessary regulations that discourage investment in new technologies to enhance productivity. This in turn will improve the microeconomic environment, reduce corruption, and encourage private sector-led growth. The United States also provides direct assistance to empower men, women, and enterprises to take advantage of new economic opportunities. The Global Competitiveness Index (GCI) of the World Economic Forum (WEF) monitors 12 determinants of competitiveness: institutions, infrastructure, macroeconomic stability, health and primary education, higher education and training, goods market efficiency, labor market efficiency, financial market sophistication, technological readiness, market size, business sophistication, and innovation. Higher scores (on a scale of 1.0 to 7.0) reflect improvements in the business environment conducive to trade and investment, and indicate that countries have implemented policies that will lead to greater economic growth and poverty reduction. There are 64 countries currently in the index that received USAID assistance in the Private Sector Competitiveness Program Area in FYs 2007 to 2011 (allowing for a lag in observable impact). The indicator is reported as the percentage of those countries that either reached an index score of 4.5 or greater and/or received a higher score than the previous year. The United States, for example, ranked as number 5 in the GCI 2013-2014 index with a score of 5.48, while Thailand ranked as number 37 with an index score of 4.54. Only four of the 64 countries in the index receiving USAID assistance in this program area have so far reached this benchmark (Azerbaijan, China, Indonesia, and Panama). However, the percentage that was either above this benchmark and/or received improved scores over the preceding year increased from 42.1 in the 2009/10 index to 76.2 in the 2011/12 index (despite the global recession). However, the scores fell back to 53.1 in the 2012/13 index before improving to 59.4 in 2013/14. There were two basic reasons for the initial decline: 1) the instability and uncertainty related to the Arab Spring in the Middle East and North Africa (MENA) countries; and 2) in Sub-Saharan Africa, the ongoing impact of the global financial crisis affected the resources available for public investments infrastructure, health, and education (which are outside the focus of USAID’s competitiveness projects). On a more positive note, there are signs of improvement as the index scores increased to 59.4 in 2013/14 and the number of USAID-assisted countries that have reached a lower benchmark of 4.0 increased steadily from 19 in the 2008/09 index to 28 in 2013/14. USAID technical assistance projects in this area have generally met a welcome response among recipient governments that are keen to attract more private investment.
Page 61 of 80

STRATEGIC GOAL THREE Program Area: Private Sector Competitiveness Performance Indicator: Global Competitiveness Index
FY 2009 FY 2010 FY 2011 FY 2012 FY 2013 FY 2013 FY 2013 Results Results Results Results Target Results Rating
42.10% 72.10% 76.20% 53.10% 70% 59.40% Improved, but
Target Not Met
Data Source: Global Competitive Index (GCI) is a yearly report published by the World Economic Forum (WEF). Fewer countries were included in earlier reports. This is a product of data available from the GCI. Its reports, beginning in 2008-09, contain data for 57 to 64 of the 76 countries that received USAID assistance in this Program Area in FYs 2007-2011. Though there was a small difference in the number of countries included in the index each year, USAID believes the difference is not great enough to discredit year-to-year comparisons. Data Quality: GCI data represent the best available estimates at the time the GCI report is prepared. They are validated in collaboration with leading academics and a global network of partner institutes. (NOTE: Previous year results have been revised due to an updated period of funding which changed a few countries being monitored and to revisions from the source of data for those years.) Program Area: Environment $ in thousands FY 2013 Actual TOTAL FOREIGN OPERATIONS BUDGET 33,062,892 Environment 855,552 Environmental issues such as global climate change, protection of natural resources and ecosystem services, and transboundary pollution will continue to play increasingly critical roles in U.S. diplomatic and development agendas. The United States remains committed to promoting partnerships for economic development that reduce greenhouse gas emissions, improve air quality, and create other benefits by using and developing markets to improve energy efficiency, enhance biodiversity conservation, and expand low-carbon energy sources. Beginning in FY 2010, significant new resources were committed to help the most vulnerable countries and communities in developing countries address the impact of climate change. Activities in this Program Area are central to the President’s Global Climate Change (GCC) Initiative. Greenhouse Gas Emissions Greenhouse gas emissions reduced or sequestered as measured in carbon dioxide equivalent (CO2e) is an internationally recognized measure of climate change mitigation. The measure enables comparison of impacts from policies and activities that reduce, avoid, or store greenhouse gases (carbon dioxide, methane, nitrous oxide and industrial gases) in the energy, industry, transport, land use and land use change (agriculture, forestry, and natural resource conservation) sectors. Results can be aggregated to demonstrate program-wide impact on reducing net greenhouse gas emissions that lead to climate change. This aggregation facilitates assessment of the impact of U.S.-supported climate change activities in more than 40 developing countries across multiple sectors. CO2e emissions reduced or sequestered as a result of U.S. assistance exceeded the target by 3.5 percent (4.5 million metric tons) in FY 2013, although the total of 134 million metric tons represents a decrease of approximately 19 percent (31 million metric tons) from FY 2012. The decrease is primarily due to a 15 percent decrease in emission reductions reported by the Central Africa Regional Mission, which accounts for nearly 80 percent of the FY 2012 result, and is driven by a reduction in (indirect) sustainable landscapes
Page 62 of 80

resources managed by the mission and an increase of biodiversity resources managed by the Fish and Wildlife Service, which does not report on the State/USAID climate change mitigation indicator. Efforts in FY 2013 have resulted in another 13 EC-LEDS country agreements, which will also expand the basis for future emissions reductions. However, the Department of State and USAID are conscious of the need to standardize and rationalize reporting and the planning of targets. This is being addressed through support to the missions to increase use of a GHG emissions calculator for the Sustainable Landscapes pillar, new protocols for estimating GHG emissions reductions for Clean Energy and Energy Efficiency Reporting (CLEER), and training for USAID staff and implementers in GCC performance monitoring and reporting.
STRATEGIC GOAL THREE Program Area: Environment Performance Indicator: Quantity of Greenhouse Gas (GHG) Emissions, Measured in Metric Tons of CO2e, Reduced or Sequestered as a Result of U.S. Assistance
FY 2009 FY 2010 FY 2011 FY 2012 FY 2013 FY 2013 FY 2013 Results Results Results Results Target Results Rating
120,000,000 120,000,000 200,000,000 165,057,815 129,757,454 134,270,462 Above Target
Data Source: FY 2013 Performance Plans and Reports (PPR) results as of January 16, 2014 from Armenia, Bangladesh, Bolivia, Bosnia and Herzegovina, Brazil, Cambodia, China, Colombia, Ecuador, Georgia, Guatemala, Haiti, Honduras, India, Indonesia, Kenya, Liberia, Macedonia, Nepal, Nigeria, Peru, Philippines, Ukraine, Vietnam, State Oceans and International Environment and Scientific Affairs (OES), State Western Hemisphere Regional (WHA), USAID Bureau of Economic Growth, Education & Environment (E3), USAID Africa Regional, USAID Central Africa Regional, USAID Regional Development Mission-Asia (RDMA), USAID West Africa Regional, USAID South Asia Regional, and USAID South America Regional, as reported in the Foreign Assistance Coordination and Tracking System. Data is collected through Foreign Assistance PPRs as reported in the Foreign Assistance Coordination and Tracking System. All USAID and State Department operating units implementing field-based Sustainable Landscapes (SL) or Clean Energy (CE) programs are required to report against this indicator. USAID/E3/GCC introduced web-based calculators for SL and CE programs in FY 2012 and FY 2013, respectively. This has improved the accuracy, completeness, and comparability of the estimated value of this indicator. The GCC team in Washington will continue to provide technical support to the field in order to ensure the timeliness and accuracy of annual reporting. Data Quality: Performance data, verified using Data Quality Assessments (DQAs), must meet standards of validity, integrity, precision, reliability, and timeliness. Each OU must document the methodology used to conduct the DQAs. DQA and data source records are maintained in the Performance Management Plans; Missions certify via the Performance Plan and Report that a DQA has occurred within the last three years. (For details, refer to USAID's Automated Directive System [ADS] Chapter 203.3.5, http://www.usaid.gov/policy/ads/200/203.pdf). Missions are strongly encouraged to use the Agriculture, Forestry and Land Use (AFOLU) GHG emissions calculator to increase the quality and comparability of emissions reduced results reported under the Sustainable Landscapes pillar of the GCC strategy. Likewise, Missions are strongly encouraged to use the Clean Energy Emission Reduction (CLEER) GHG emissions calculator to increase the quality of data reported under the Clean Energy pillar of the GCC strategy. Washington-based technical officers provide quality control, reviewing reported data year-to-year and comparing results across operating units. Hectares under Improved Management The U.S. Government uses a spatial indicator, “Number of Hectares of Biological Significance and/or Natural Resources under Improved Natural Resource Management (NRM),” to measure the impact of many site-based NRM and biodiversity conservation interventions. Worldwide impoverishment of
Page 63 of 80
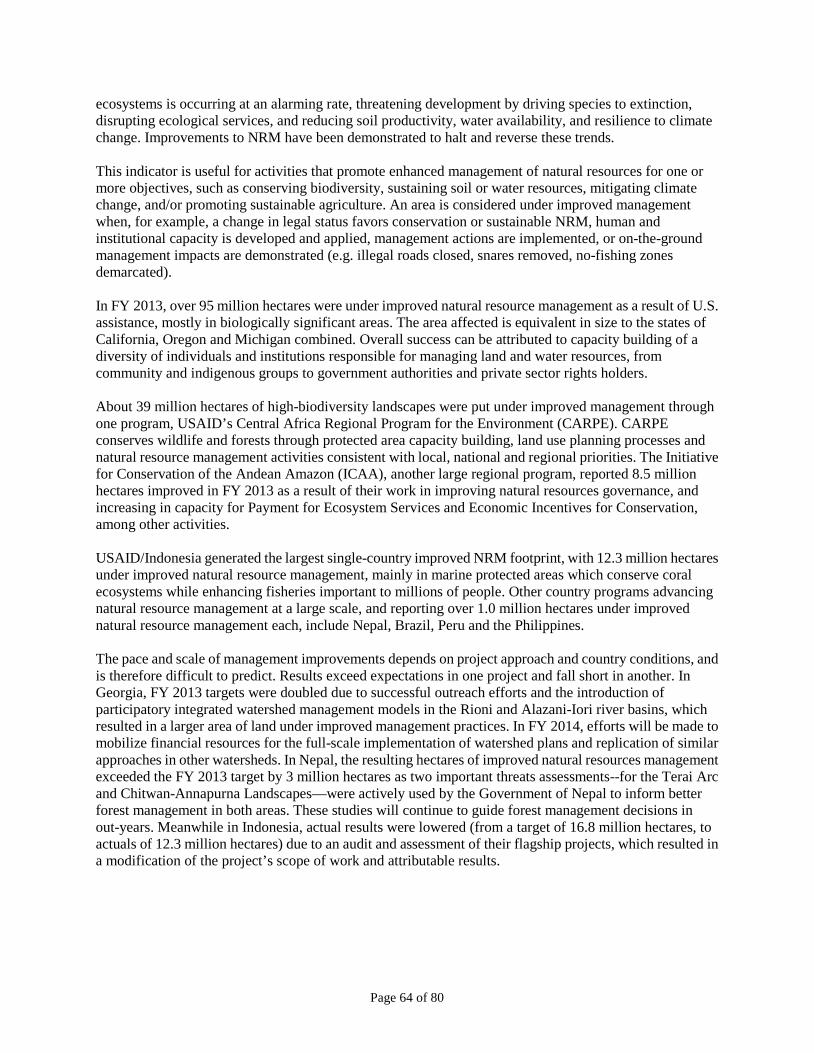
ecosystems is occurring at an alarming rate, threatening development by driving species to extinction, disrupting ecological services, and reducing soil productivity, water availability, and resilience to climate change. Improvements to NRM have been demonstrated to halt and reverse these trends. This indicator is useful for activities that promote enhanced management of natural resources for one or more objectives, such as conserving biodiversity, sustaining soil or water resources, mitigating climate change, and/or promoting sustainable agriculture. An area is considered under improved management when, for example, a change in legal status favors conservation or sustainable NRM, human and institutional capacity is developed and applied, management actions are implemented, or on-the-ground management impacts are demonstrated (e.g. illegal roads closed, snares removed, no-fishing zones demarcated). In FY 2013, over 95 million hectares were under improved natural resource management as a result of U.S. assistance, mostly in biologically significant areas. The area affected is equivalent in size to the states of California, Oregon and Michigan combined. Overall success can be attributed to capacity building of a diversity of individuals and institutions responsible for managing land and water resources, from community and indigenous groups to government authorities and private sector rights holders. About 39 million hectares of high-biodiversity landscapes were put under improved management through one program, USAID’s Central Africa Regional Program for the Environment (CARPE). CARPE conserves wildlife and forests through protected area capacity building, land use planning processes and natural resource management activities consistent with local, national and regional priorities. The Initiative for Conservation of the Andean Amazon (ICAA), another large regional program, reported 8.5 million hectares improved in FY 2013 as a result of their work in improving natural resources governance, and increasing in capacity for Payment for Ecosystem Services and Economic Incentives for Conservation, among other activities. USAID/Indonesia generated the largest single-country improved NRM footprint, with 12.3 million hectares under improved natural resource management, mainly in marine protected areas which conserve coral ecosystems while enhancing fisheries important to millions of people. Other country programs advancing natural resource management at a large scale, and reporting over 1.0 million hectares under improved natural resource management each, include Nepal, Brazil, Peru and the Philippines. The pace and scale of management improvements depends on project approach and country conditions, and is therefore difficult to predict. Results exceed expectations in one project and fall short in another. In Georgia, FY 2013 targets were doubled due to successful outreach efforts and the introduction of participatory integrated watershed management models in the Rioni and Alazani-Iori river basins, which resulted in a larger area of land under improved management practices. In FY 2014, efforts will be made to mobilize financial resources for the full-scale implementation of watershed plans and replication of similar approaches in other watersheds. In Nepal, the resulting hectares of improved natural resources management exceeded the FY 2013 target by 3 million hectares as two important threats assessments--for the Terai Arc and Chitwan-Annapurna Landscapes—were actively used by the Government of Nepal to inform better forest management in both areas. These studies will continue to guide forest management decisions in out-years. Meanwhile in Indonesia, actual results were lowered (from a target of 16.8 million hectares, to actuals of 12.3 million hectares) due to an audit and assessment of their flagship projects, which resulted in a modification of the project’s scope of work and attributable results.
Page 64 of 80

STRATEGIC GOAL THREE Program Area: Environment Performance Indicator: Number of Hectares of Biological Significance and/or Natural Resources under Improved Natural Resource Management as a Result of U.S. Assistance
FY 2009 FY 2010 FY 2011 FY 2012 FY 2013 FY 2013 FY 2013 Results Results Results Results Target Results Rating
104,557,205 92,700,352 101,800,000 99,737,668 92,003,802 95,074,936 Above Target
Data Source: FY 2013 Performance Reports from Bangladesh, Bolivia, Brazil, Cambodia, China, Colombia, Ecuador, Ethiopia, Georgia, Guatemala, Guinea, Haiti, Honduras, Indonesia, Kenya, Liberia, Malawi, Mozambique, Namibia, Nepal, Nicaragua, Paraguay, Peru, Philippines, Rwanda, Sierra Leone, South Sudan, Tanzania, Uganda, USAID Central Africa Regional, USAID Regional Development Mission for Asia, USAID South America Regional, USAID Southern Africa Regional, USAID West Africa Regional, USAID Bureau for Economic Growth, Education and Environment, State Bureau for Oceans and International Environment and Scientific Affairs, and State Western Hemisphere Regional Bureau, as reported in the Foreign Assistance Coordination and Tracking System. Data Quality: Performance data, verified using Data Quality Assessments (DQAs), must meet standards of validity, integrity, precision, reliability, and timeliness. Each OU must document the methodology used to conduct the DQAs. DQA and data source records are maintained in the Performance Management Plans; Missions certify via the Performance Plan and Report that a DQA has occurred within the last three years. (For details, refer to USAID's Automated Directive System [ADS] Chapter 203.3.5.
Page 65 of 80

STRATEGIC GOAL FOUR Provide humanitarian assistance and support disaster mitigation.
Program Area: Protection, Assistance and Solutions $ in thousands FY 2013 Actual TOTAL FOREIGN OPERATIONS BUDGET 33,062,892 Protection, Assistance and Solutions 5,181,329 The purpose of U.S. assistance in this Program Area is to provide protection, life-sustaining assistance, and durable solutions for refugees, internally displaced persons (IDPs), stateless persons, and other victims of conflict and disasters. U.S. policy and programs advance the goal of providing humanitarian assistance by protecting vulnerable populations from physical harm, persecution, exploitation, abuse, malnutrition and disease, family separation, gender-based violence, forcible recruitment, and other threats, while ensuring that their full rights as individuals are safe-guarded. The Department of State leads U.S. Government responses to political and security crises and conflicts. As part of this response, the Department responds primarily to humanitarian crises resulting from conflict and persecution and emphasizes a multilateral approach, providing the majority of funding via contributions to international organizations through the Migration and Refugee Assistance and Emergency Refugee and Migration Assistance accounts. USAID’s Office of U.S. Foreign Disaster Assistance (OFDA) provides most of its assistance bilaterally through non-governmental organizations and international organizations through the International Disaster Assistance (IDA) account and leads U.S. responses to humanitarian crises resulting from natural or industrial disasters. A large percentage of IDA funding supports response to complex humanitarian crises. USAID is also the primary source of U.S. food aid, targeting: humanitarian food aid, from the Food for Peace Title II or IDA accounts, targets the most food insecure beneficiaries including refugees, internally displaced persons, and those coping with conflict and natural disasters. Given the fluidity and unpredictability of population movements in any given crisis, the Department and USAID coordinate closely in the provision of humanitarian assistance. Activities include: distributing food and other relief supplies to affected populations; providing health and nutrition services, including feeding centers; responding to water, sanitation, and hygiene needs; providing shelter materials; implementing programs to protect children and to prevent and respond to gender-based violence; and providing economic recovery and agricultural inputs, where appropriate. Beyond Washington, Department and USAID staff members monitor programs and coordinate with other donors and implementing partners in 30 countries around the world, the U.N. Missions in New York, Geneva, and Rome, and five U.S. Department of Defense Combatant Commands. In some humanitarian emergencies, USAID dispatches Disaster Assistance Response Teams to affected countries to conduct on-the-ground assessments, provide technical assistance, oversee provision of commodities and services, and coordinate with donors and the international community. In protracted situations where displaced populations require support for many years, U.S. humanitarian assistance is designed to support livelihoods and other efforts that foster self-reliance. The U.S. Government also assists in finding durable solutions for refugees, stateless persons, and IDPs, including support for the voluntary return of refugees and IDPs to their homes, integration among local host communities, or refugee resettlement to the United States. The Department and USAID continue to invest in establishing and using internationally-accepted program management standards and in training their staff to conduct assessments and program monitoring and evaluation of programs are performed professionally and reliably.
Page 66 of 80

Refugee Admissions to the United States Refugees admitted to the United States achieve protection and a durable solution, beginning new lives in communities across the country. The following indicator measures the overall effectiveness of the U.S. refugee admissions program by tracking the number of refugees arriving in the United States against regional ceilings established by Presidential Determination in consultation with Congress. In FY 2013, the U.S. Government resettled more refugees than all other countries combined. Refugee admissions to the United States in FY 2013 totaled 69,930 refugees, which represents 99 percent of the regional ceilings established by Presidential Determination. That number is closer to the ceiling– 70,000 in 2013 – than in any year since 1980. Reaching this threshold is a demonstration of the Administration’s efforts to create a refugee admissions program which meets the important security screening standards required by the American people and the growing humanitarian need. The top five nationalities resettled to the United States in 2013 were Iraqi, Burmese, Bhutanese, Somali, and Cuban. By admitting over 19,000 Iraqis in FY 2013, the U.S. Government has now admitted more than 93,000 Iraqi refugees since 2007. Through use of transit centers hosted by the governments of Romania and Slovakia, the U.S. Government has been able to resettle Iraqi refugees trapped by the war in Syria as well as at-risk Afghan women who were formerly in Iran. Large scale resettlement of Burmese in Thailand and Malaysia and Bhutanese in Nepal continued, with 16,299 and 9,134 arrivals, respectively, in FY 2013. Rounding out the top five nationalities were Somalis with 7,608 arrivals, and Cubans with 4,205 arrivals. Arrivals from Africa in FY 2013, including Somalis, Congolese, Sudanese, Eritreans, and more than 20 other nationalities, increased dramatically over FY 2012 to account for nearly 16,000 arrivals, or 23 percent of the total. Beyond third-country resettlement, in FY 2013 the U.S. Government achieved significant results in supporting other durable solutions as well. Since May 2012, the Department of State has supported an Office of the UN High Commissioner for Refugees (UNHCR) repatriation project from the Republic of Congo that has contributed to more than 105,000 refugees voluntarily returning to communities in Equateur Province in northwestern Democratic Republic of the Congo (DRC). In FY 2013, the Department supported voluntary returns of some 47,000 refugees to the DRC from the Republic of Congo. The Department also provided funding to NGOs working in areas of return—approximately $3 million—for projects focusing on peace building, livelihoods, and water and sanitation. Cyclical insecurity and humanitarian crises in the DRC have resulted in over 2.7 million IDPs. The Department supported programs in the country to meet the basic needs of returning refugees and IDPs, including programs to prevent and respond to gender-based violence. For example, the Department support enabled the International Committee of the Red Cross (ICRC) to provide emergency relief and medical care and to renovate water systems in North Kivu Province to improve the health and sanitation of conflict-affected communities. In Iraq, with the world’s second-largest IDP population, Department funding focused on supporting conditions for both IDP returns and local integration – particularly in Diyala and Baghdad Governorates – and assisting vulnerable IDPs in squatter settlements with short-term humanitarian assistance and longer-term housing solutions. Department of State engagement was closely coordinated with USAID’s planned phase-down of programming in Iraq through support of protection, livelihoods, gender-based violence, reconciliation, and shelter programs to IDPs and returnees and encouraged greater Iraqi government commitment of resources for its displaced citizens. In Syria, the Department has supported the International Organization for Migration’s (IOM) work with partners and authorities in Syria and neighboring countries to assist migrants fleeing the conflict. As of July 2013, IOM assisted more than 3,618 Third Country Nationals (TCNs) to return safely to their country of origin.
Page 67 of 80

Department of State humanitarian assistance and advocacy contributed to efforts in FY 2013 to promote the identification and registration of stateless persons, amend citizenship laws, and improve the implementation of existing laws. According to UNHCR, approximately 94,600 people acquired a nationality or had it confirmed during calendar year 2012. UNHCR provided technical advice on the drafting of nationality legislation for South Sudan and contributed to constitutional and law reform processes in a number of countries such as Kenya, Latvia, Nepal, and Tajikistan.
STRATEGIC GOAL FOUR Program Area: Protection, Assistance and Solutions Performance Indicator: Percentage of Refugees Admitted to the U.S. Against the Regional Ceilings Established by Presidential Determination
FY 2009 FY 2010 FY 2011 FY 2012 FY 2013 FY 2013 FY 2013 Results Results Results Results Target Results Rating
99.50% 98.00% 73.00% 80.00% 100.00% 99.99% On Target
Data Source: Department of State, Bureau of Population, Refugees and Migration (PRM). Data Quality: PRM has developed and deployed a standardized computer refugee resettlement case management system. This system, known as the Worldwide Refugee Admissions Processing System (WRAPS), is a highly structured, centralized database that produces real-time data on the number of refugees admitted to the U.S. The data are valid, as they rely on direct, official reporting of refugee admissions numbers. The data cannot be manipulated, as they are stored in a password-protected database operated by a PRM contractor. Gender-Based Violence (GBV) Prevention and Response Activities Combating gender-based violence (GBV) remains a U.S. priority. Available evidence suggests that the stress and disruption of daily life during complex humanitarian emergencies may lead to a rise in GBV. Efforts to prevent and combat GBV are integrated into multi-sectoral programs in order to maximize their effectiveness and increase protection generally. Combating GBV increases protection for women, children, and others at risk during complex humanitarian emergencies by preventing or responding to incidents of rape, domestic violence, forced marriage, sexual exploitation and abuse, and other forms of GBV. To support these efforts, community awareness, psychosocial counseling, health services and legal aid for survivors are mainstreamed into humanitarian programs. Since 2000, the Department of State has taken a leading role in raising and addressing the special protection needs of women and children in all humanitarian responses, both by incorporating a gender lens into overall program activities and by providing more than $89 million in targeted GBV programming. In addition to contributions provided to the work of its four primary international organization (IO) partners, the Office of the UN High Commissioner for Refugees (UNHCR), the International Committee of the Red Cross (ICRC), the UN Relief and Works Agency for Palestine Refugees in the Near East (UNRWA), and the International Organization for Migration (IOM) , 56 percent of Department-funded non-governmental organization (NGO) and other IO activities included activities related to GBV protection and response. Recognizing a need to prioritize GBV prevention and response starting with the earliest phases of an emergency, State and USAID launched the new “Safe from the Start” initiative in September 2013, with initial contributions to UNHCR and ICRC to build core capacity and fund innovative programs that address and respond to GBV. The initial commitment included $10 million in new funding; the initiative has the potential to continue with additional funding in subsequent years. This joint State-USAID global GBV initiative will help address gaps in GBV prevention and response at the onset of an emergency. This will include supporting the hiring of new GBV-focused staff that can act as surge capacity, to help ensure that
Page 68 of 80

the protection needs of women and children are incorporated into response plans as crises unfold, and funding innovative programs to address GBV for new and protracted crises. Other targeted programs include research on best practices and innovative, field-based methods to better address the protection needs of vulnerable populations, as well as direct services. In FY 2013, the Department also worked with other IOs and NGO partners to identify emerging gender-related issues and to provide programmatic support related to the protection of lesbian, gay, bisexual, and transgender (LGBT) refugees. In one Department -funded program that worked with women, girls and men in combating GBV in Eastern Equatoria State, implementing partners worked with community members and set up Asset Building Groups to support economic independence for women; aired radio programs that featured key messages on gender issues, and trained service providers such as social workers, health clinic staff, and police officers to ensure comprehensive prevention and care services for those impacted by GBV. The Department of State provided ongoing support for a three-year project to protect refugees, returnees, internally displaced persons and other disaster survivors, particularly women and children, from exploitation and abuse (SEA) by agency staff through improved accountability including through conducting investigations. The initiative also includes a new focus on engaging men to prevent SEA. All Department personnel with monitoring responsibilities are required to take Protection from Abuse and Sexual Exploitation in Humanitarian Assistance training.
STRATEGIC GOAL FOUR Program Area: Protection, Assistance and Solutions Performance Indicator: Percentage of NGO or Other International Organization Projects that include Dedicated Activities to Prevent and/or Respond to Gender-Based Violence
FY 2009 FY 2010 FY 2011 FY 2012 FY 2013 FY 2013 FY 2013 Results Results Results Results Target Results Rating
28.3% 30% 38% 45% 35% 56% Above Target
Data Source: Department of State, Bureau of Population, Refugees and Migration (PRM). Internal award document tracking system and from implementing partner reports (verbal or written). Data Quality: A weakness of this indicator is its inability to assess the quality and impact of GBV program activities. Data for the indicator are reviewed by the Bureau's gender, monitoring and budget officers. USAID supports implementing partners to integrate the response to and prevention of gender-based violence into their humanitarian operations. The risks for GBV increase for women and girls in the aftermath of disasters, making prevention and response to GBV a vital component of USAID’s humanitarian assistance. In FY 2013, USAID launched a joint initiative with State/PRM called “Safe from the Start” to improve GBV prevention and response from the onset of emergencies. Under the Safe from the Start initiative, USAID is working with the Department to advance evidence-based dedicated programs for GBV prevention and response, improve protection mainstreaming in all humanitarian assistance programs, and enhance capacity and accountability within the international humanitarian system to address GBV. Safe from the Start is a continuation of USAID’s work on GBV in previous years. Since the beginning of FY 2013, USAID has required all programs to incorporate protection mainstreaming into all sector interventions. This has resulted in USAID’s partners designing assistance activities in ways that reduce risks, as well as addresses the effects of harm, exploitation, and abuse, including GBV. In FY 2013, USAID funded 25 programs designed to prevent and/or respond to GBV in nine countries affected by natural disasters or conflict. USAID also supported eight global programs to increase capacity for GBV prevention and response and advance program innovations and learning for addressing GBV in emergencies.
Page 69 of 80

USAID continued to make progress in implementing commitments under the U.S. National Action Plan (NAP) for Women, Peace, and Security in FY 2013. In October 2012, USAID released revised Guidelines for Proposals that specify sectoral and other requirements for unsolicited proposals from non-governmental organizations—organizations that receive the majority of USAID’s funding. The revised Guidelines contain new requirements for all USAID-funded programs, which fulfill commitments in the NAP. The revision includes the following new requirements:
• Gender analysis and promotion of gender equality required in all sectoral interventions; • Mainstreaming protection to reduce risks for harm, exploitation, and abuse (including GBV)
required in all sectoral interventions; • All programs must demonstrate adoption of a Code of Conduct to Prevent Sexual Exploitation and
Abuse prior to receiving funding. Programs must also provide a description of how the recipient organization implements the Code of Conduct in the targeted country.
In addition to these requirements, the Guidelines also contain updated programmatic guidance for protection sector programs designed to prevent or respond to GBV. As part of the introduction of the revised Guidelines, USAID conducted eight training workshops in five locations for 196 humanitarian partner staff members on the new guidance and requirements. One day of the three-day training was delivered by a USAID protection advisor and focused solely on the new protection-related requirements outlined above.
USAID also continued to implement staff training requirements mandated in the NAP, including the Inter-Agency Standing Committee (IASC) gender e-learning course and the humanitarian protection training. In FY 2013, 24 additional USAID staff completed the required gender training, bringing the total number of staff trained to 121. In addition, USAID held three iterations of the USAID Humanitarian Protection training course during FY 2013, with 47 USAID staff participants plus four staff members from other USAID and Department offices. Vulnerable Populations There is growing acknowledgement within the international community that material assistance alone often cannot ensure the well-being of at-risk communities. To meet this challenge, USAID has placed greater emphasis on protection across all levels of relief planning and implementation. In disaster situations, USAID response efforts help ensure that vulnerable populations, such as women, children, and ethnic and religious minorities receive humanitarian assistance equitably. Because conflicts and natural disasters often separate families and disrupt normal care-giving for children, USAID programs ensure that adequate protection measures are in place for children, such as the reunification of separated and unaccompanied children with their families. USAID has also taken steps to safeguard and restart children’s education in order to help communities cope with and recover from disasters. Children spend a large part of their daily lives in school, and USAID provides funding to ensure that schools are prepared in the event of a disaster to keep children as safe as possible. Throughout its disaster assistance programs, USAID ensures the protection of vulnerable children from risks of exploitation, abuse, and other violations. USAID recognizes that persons with disabilities may experience obstacles in accessing humanitarian assistance and require specialized assistance in disaster and conflict situations. Therefore, starting in FY 2013, USAID introduced new requirements for all humanitarian assistance programs to take steps to ensure that persons with disabilities and older people are able to access assistance and services. USAID also supports programs aimed at addressing the unique needs of persons with disabilities in disaster settings. USAID also supports initiatives that raise awareness about the numbers and needs of internally displaced
Page 70 of 80
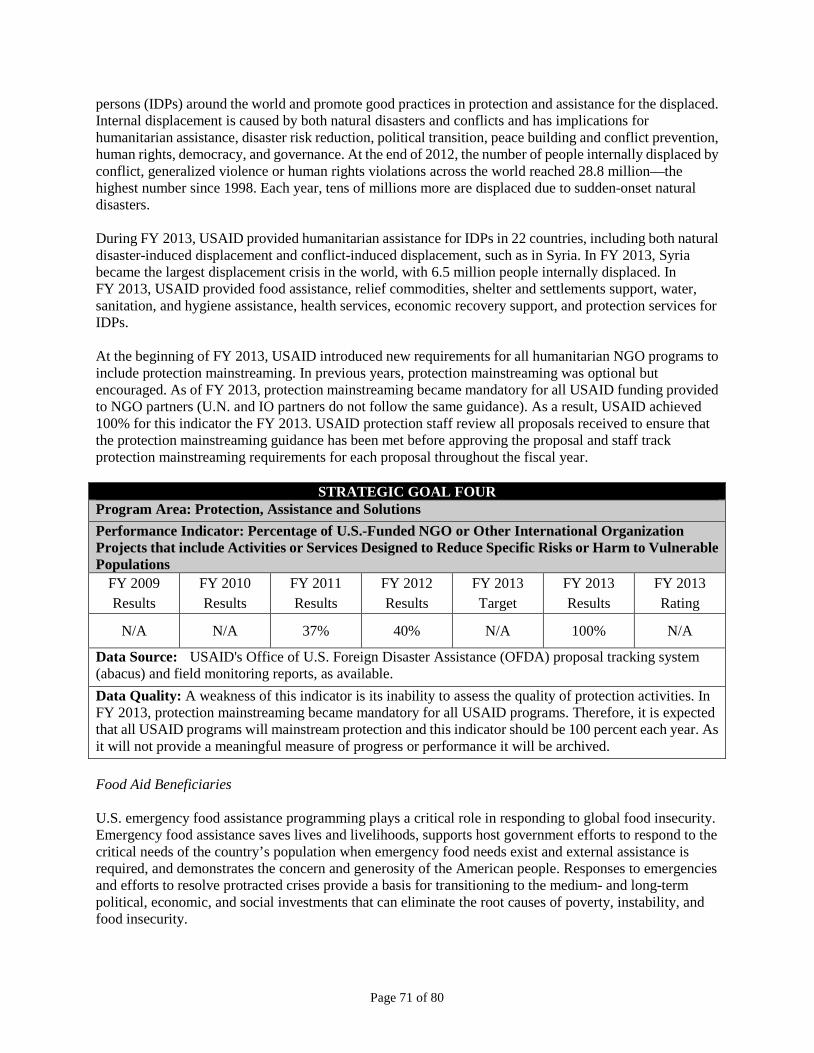
persons (IDPs) around the world and promote good practices in protection and assistance for the displaced. Internal displacement is caused by both natural disasters and conflicts and has implications for humanitarian assistance, disaster risk reduction, political transition, peace building and conflict prevention, human rights, democracy, and governance. At the end of 2012, the number of people internally displaced by conflict, generalized violence or human rights violations across the world reached 28.8 million—the highest number since 1998. Each year, tens of millions more are displaced due to sudden-onset natural disasters. During FY 2013, USAID provided humanitarian assistance for IDPs in 22 countries, including both natural disaster-induced displacement and conflict-induced displacement, such as in Syria. In FY 2013, Syria became the largest displacement crisis in the world, with 6.5 million people internally displaced. In FY 2013, USAID provided food assistance, relief commodities, shelter and settlements support, water, sanitation, and hygiene assistance, health services, economic recovery support, and protection services for IDPs. At the beginning of FY 2013, USAID introduced new requirements for all humanitarian NGO programs to include protection mainstreaming. In previous years, protection mainstreaming was optional but encouraged. As of FY 2013, protection mainstreaming became mandatory for all USAID funding provided to NGO partners (U.N. and IO partners do not follow the same guidance). As a result, USAID achieved 100% for this indicator the FY 2013. USAID protection staff review all proposals received to ensure that the protection mainstreaming guidance has been met before approving the proposal and staff track protection mainstreaming requirements for each proposal throughout the fiscal year.
STRATEGIC GOAL FOUR Program Area: Protection, Assistance and Solutions Performance Indicator: Percentage of U.S.-Funded NGO or Other International Organization Projects that include Activities or Services Designed to Reduce Specific Risks or Harm to Vulnerable Populations
FY 2009 FY 2010 FY 2011 FY 2012 FY 2013 FY 2013 FY 2013 Results Results Results Results Target Results Rating
N/A N/A 37% 40% N/A 100% N/A Data Source: USAID's Office of U.S. Foreign Disaster Assistance (OFDA) proposal tracking system (abacus) and field monitoring reports, as available. Data Quality: A weakness of this indicator is its inability to assess the quality of protection activities. In FY 2013, protection mainstreaming became mandatory for all USAID programs. Therefore, it is expected that all USAID programs will mainstream protection and this indicator should be 100 percent each year. As it will not provide a meaningful measure of progress or performance it will be archived. Food Aid Beneficiaries U.S. emergency food assistance programming plays a critical role in responding to global food insecurity. Emergency food assistance saves lives and livelihoods, supports host government efforts to respond to the critical needs of the country’s population when emergency food needs exist and external assistance is required, and demonstrates the concern and generosity of the American people. Responses to emergencies and efforts to resolve protracted crises provide a basis for transitioning to the medium- and long-term political, economic, and social investments that can eliminate the root causes of poverty, instability, and food insecurity.
Page 71 of 80

In FY 2013, USAID provided more than $981 million in food assistance in response to emergencies. This assistance benefitted nearly 21.6 million people in 25 countries, including 16 countries in Africa, 7 in Asia and the Near East, and 2 in Latin America and the Caribbean. Emergency food assistance programs receive funding from the Food for Peace Act Title II and the Foreign Assistance Act’s (FAA) International Disaster Assistance (IDA) account and Overseas Contingency Operation (IDA/OCO) resources. These programs are implemented by non-governmental organizations (NGOs) and public international organizations (PIOs). Through the Emergency Food Security Program (EFSP), USAID uses IDA and IDA/OCO resources for local and regional purchase of food, food vouchers, and cash transfer programs that facilitate access to food. In FY 2013, EFSP provided over $577 million in grants to a variety of NGOs and United Nations (U.N.) agencies, such as the U.N. World Food Program (WFP), in 22 countries, including Burma, Kenya, Somalia, Syria, Niger, Pakistan, and Yemen. The U.S. Government is the largest donor to WFP. In FY 2013, USAID contributed more than $749 million in Title II and EFSP funding to WFP in response to global appeals for Emergency Operations (EMOPs) and humanitarian assistance programs in 23 countries in Africa, Latin America and the Caribbean, and Asia and the Near East. In collaboration with UNICEF, USAID increased the in-kind procurement and donation of ready-to-use therapeutic foods (RUTF) for the treatment of severe acute malnutrition in children. In FY 2013, USAID provided over $22 million in Title II resources to UNICEF for the programming of RUTF in response to emergency nutrition needs in Afghanistan, Angola, Burundi, Pakistan, Somalia, South Sudan, and Yemen. The emergency food aid indicator demonstrates the effectiveness of USAID programs by measuring the percentage of beneficiaries reached versus planned levels. USAID continues to improve the ability to identify food needs in emergencies and how best to deliver food assistance. Through activities carried out in FY 2013, USAID emergency food assistance reached 90 percent of planned beneficiaries. Due to improved harvests, certain regions saw lower than expected food insecurity and beneficiary caseloads. Consequently, FFP provided less assistance than originally planned and the FY 2013 result fell just below the target of 93 percent of planned beneficiaries reached.
STRATEGIC GOAL FOUR Program Area: Protection, Assistance and Solutions Performance Indicator: Percent of Planned Emergency Food Aid Beneficiaries Reached with U.S. Assistance
FY 2009 FY 2010 FY 2011 FY 2012 FY 2013 FY 2013 FY 2013 Results Results Results Results Target Results Rating
93% 93% 93% 93% 93% 90% Below Target
Data Source: USAID's Office of Food for Peace (FFP) Summary Request and Beneficiary Tracking Table. Data Quality: Data quality assessments (DQAs) are not required for emergency programs. Global Acute Malnutrition (GAM) Rate The nutritional status of children under five is a key indicator for assessing the severity of a humanitarian emergency and the adequacy of any humanitarian response. The under-five Global Acute Malnutrition (GAM) rate is used to measure the nutritional status of vulnerable children and is influenced by food security, availability of health services, water/sanitation/hygiene (WASH) and other factors. As an internationally-accepted indicator, GAM measures the extent to which the United States and its partners are meeting the assistance needs of populations of concern such as refugees and internally displaced persons
Page 72 of 80
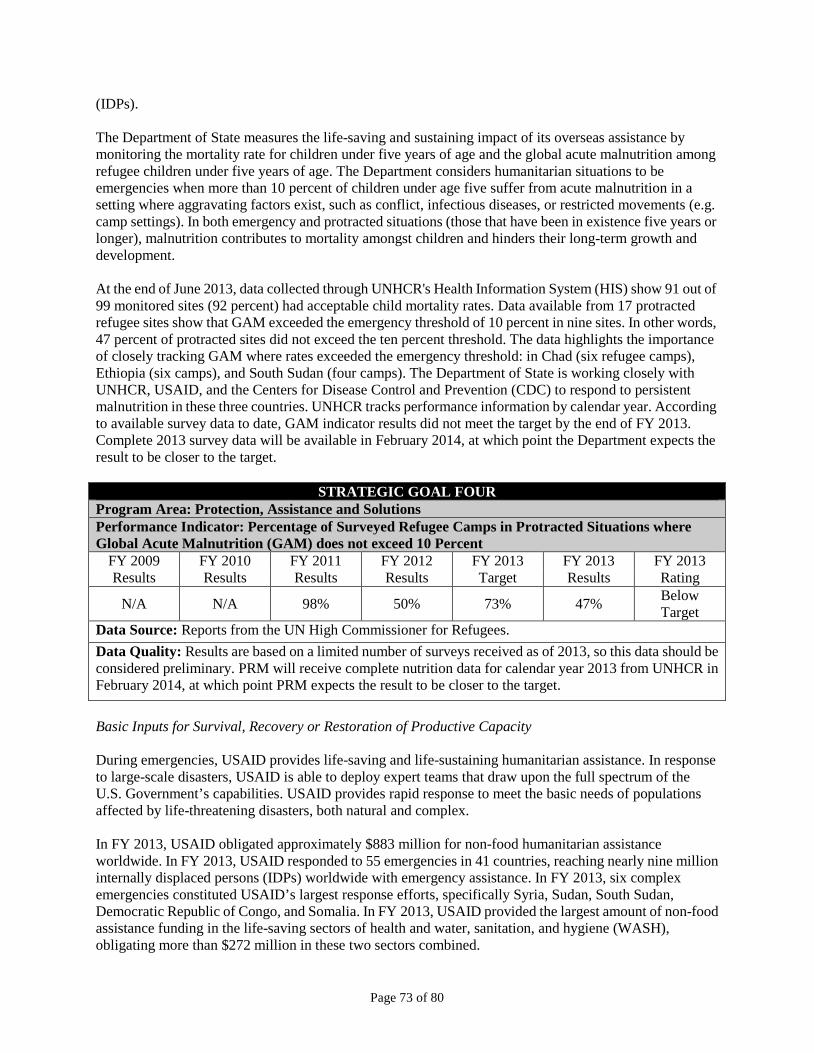
(IDPs). The Department of State measures the life-saving and sustaining impact of its overseas assistance by monitoring the mortality rate for children under five years of age and the global acute malnutrition among refugee children under five years of age. The Department considers humanitarian situations to be emergencies when more than 10 percent of children under age five suffer from acute malnutrition in a setting where aggravating factors exist, such as conflict, infectious diseases, or restricted movements (e.g. camp settings). In both emergency and protracted situations (those that have been in existence five years or longer), malnutrition contributes to mortality amongst children and hinders their long-term growth and development. At the end of June 2013, data collected through UNHCR's Health Information System (HIS) show 91 out of 99 monitored sites (92 percent) had acceptable child mortality rates. Data available from 17 protracted refugee sites show that GAM exceeded the emergency threshold of 10 percent in nine sites. In other words, 47 percent of protracted sites did not exceed the ten percent threshold. The data highlights the importance of closely tracking GAM where rates exceeded the emergency threshold: in Chad (six refugee camps), Ethiopia (six camps), and South Sudan (four camps). The Department of State is working closely with UNHCR, USAID, and the Centers for Disease Control and Prevention (CDC) to respond to persistent malnutrition in these three countries. UNHCR tracks performance information by calendar year. According to available survey data to date, GAM indicator results did not meet the target by the end of FY 2013. Complete 2013 survey data will be available in February 2014, at which point the Department expects the result to be closer to the target.
STRATEGIC GOAL FOUR Program Area: Protection, Assistance and Solutions Performance Indicator: Percentage of Surveyed Refugee Camps in Protracted Situations where Global Acute Malnutrition (GAM) does not exceed 10 Percent
FY 2009 FY 2010 FY 2011 FY 2012 FY 2013 FY 2013 FY 2013 Results Results Results Results Target Results Rating
N/A N/A 98% 50% 73% 47% Below Target
Data Source: Reports from the UN High Commissioner for Refugees. Data Quality: Results are based on a limited number of surveys received as of 2013, so this data should be considered preliminary. PRM will receive complete nutrition data for calendar year 2013 from UNHCR in February 2014, at which point PRM expects the result to be closer to the target. Basic Inputs for Survival, Recovery or Restoration of Productive Capacity During emergencies, USAID provides life-saving and life-sustaining humanitarian assistance. In response to large-scale disasters, USAID is able to deploy expert teams that draw upon the full spectrum of the U.S. Government’s capabilities. USAID provides rapid response to meet the basic needs of populations affected by life-threatening disasters, both natural and complex. In FY 2013, USAID obligated approximately $883 million for non-food humanitarian assistance worldwide. In FY 2013, USAID responded to 55 emergencies in 41 countries, reaching nearly nine million internally displaced persons (IDPs) worldwide with emergency assistance. In FY 2013, six complex emergencies constituted USAID’s largest response efforts, specifically Syria, Sudan, South Sudan, Democratic Republic of Congo, and Somalia. In FY 2013, USAID provided the largest amount of non-food assistance funding in the life-saving sectors of health and water, sanitation, and hygiene (WASH), obligating more than $272 million in these two sectors combined.
Page 73 of 80

In addition to health and WASH services, major components of USAID’s humanitarian assistance activities include shelter and settlements, nutrition, protection, economic recovery, and agriculture and food security programming, as well as emergency food assistance. In FY 2013, USAID deployed two Disaster Assistance Response Teams (DARTs) to coordinate on-the-ground U.S. humanitarian assistance. The first DART deployed to address the ongoing crisis in Syria from operational bases in Jordan and Turkey. The Syria DART stood up on January 11, 2013, and continued to remain operational through the end of the fiscal year. In response to a severe drought, USAID deployed a DART on June 28, 2013, to the Republic of the Marshall Islands (RMI) and demobilized the response team on July 18, 2013. Both DART teams were supported by a DC-based Response Management Team that coordinated U.S. efforts to respond to these crises. U.S. emergency food assistance programming plays a critical role in responding to global food insecurity. Emergency food assistance saves lives and livelihoods, supports host government efforts to respond to the critical needs of the country’s population when emergency food needs exist and external assistance is required, and demonstrates the concern and generosity of the American people. Responses to emergencies and efforts to resolve protracted crises provide a basis for transitioning to the medium- and long-term political, economic, and social investments that can eliminate the root causes of poverty, instability, and food insecurity. In FY 2013, USAID provided more than $981 million in food assistance in response to emergencies. This assistance benefitted nearly 21.6 million people in 25 countries, including 16 countries in Africa, seven in Asia and the Near East, and two in Latin America and the Caribbean. In FY 2013, U.S. assistance reached over 61 million internally displaced and host population beneficiaries with vital inputs for survival and recovery, exceeding the target for FY 2013; it should be noted that out-year targets for this indicator are difficult to set, because humanitarian assistance is needs-based and it is challenging to predict the range and magnitude of needs for assistance in advance of emergencies.
STRATEGIC GOAL FOUR Program Area: Protection, Assistance and Solutions Performance Indicator: Number of Internally Displaced and Host Population Beneficiaries Provided with Basic Inputs for Survival, Recovery or Restoration of Productive Capacity as a Result of U.S. Assistance FY 2009 FY 2010 FY 2011 FY 2012 FY 2013 FY 2013 FY 2013 Results Results Results Results Target Results Rating
N/A N/A 59,007,997 48,989,676 45,000,000 61,315,940 Above Target
Data Source: Internal awards tracking systems (Abacus) and other sources, including implementing partner reports, and verbal or written reports from regional teams. Data included from USAID/OFDA, USAID/FFP, and USAID/Burma. Data Quality: A weakness of this indicator is its inability to reflect appropriate identification and targeting of eligible beneficiaries or the quality of humanitarian assistance activities. Note: this indicator more accurately conveys units of service provided, rather than people provided with assistance because different USAID partners may be serving the same disaster-affected person with different life-saving services. Further, it is very difficult to set out-year targets for this type of indicator because USAID's humanitarian assistance is needs-based and it is difficult to predict needs in advance.
Page 74 of 80

Program Area: Disaster Readiness $ in thousands FY 2013 Actual TOTAL FOREIGN OPERATIONS BUDGET 33,062,892 Disaster Readiness 169,820 U.S. assistance builds resilience and reinforces the capacity of disaster-affected countries, American responders, and the international community to reduce risks and prepare for rapid, coordinated response. Programs also focus on increasing resilience among households and communities and by improving their ability to cope with and recover from the effects of a disaster. Although principles of disaster readiness and risk reduction are often incorporated into disaster response programs, assistance in the Disaster Readiness program area focuses primarily on risk reduction, readiness, resilience, and capacity building. Disaster Risk-Reducing Trainings USAID supports disaster risk reduction (DRR) stand-alone and integrated programming at the regional, national, and community level. USAID is focusing on improving early warning and translating early warning into action to reduce the impact of disasters and enhance resilience. In FY 2013, USAID trained 28,647 people in disaster risk reduction principles and techniques. FY 2013 showed a significant increase in number of people trained in disaster preparedness as a result of U.S. assistance. Part of this increase can be accounted for due to an improvement in the USAID project tracking systems that now require recipients of grants to upload their targets for training against this indicator online, which enables improved tabulation of all training activities conducted during the fiscal year. USAID also continued to support several large projects that specialize in disaster preparedness training in Asia and Latin America, these programs demonstrated robust results in this fiscal year. As a result of the newly improved tracking system, it is estimated that higher figures for disaster preparedness training can be captured and reported on in the future. As a result, the training targets have been set higher than in years past. In addition, U.S. Missions in Ethiopia, Haiti, India, Indonesia, Madagascar, the Marshall Islands, Micronesia, and other regional missions reported additional results in training people in DRR during the fiscal year.
STRATEGIC GOAL FOUR Program Area: Disaster Readiness Performance Indicator: Number of People Trained in Disaster Preparedness as a Result of U.S. Assistance
FY 2009 FY 2010 FY 2011 FY 2012 FY 2013 FY 2013 FY 2013 Results Results Results Results Target Results Rating 10,004 18,030 12,396 26,768 18,857 28,647 Above
Target Data Source: Internal award tracking system (abacus), and implementing partner quarterly reports from USAID/OFDA partners. Also includes data submitted by U.S. Missions in Ethiopia, Haiti, India, Indonesia, Madagascar, Marshall Islands, Micronesia, and other regional missions. Data Quality: The rigor, length and quality of the training varies among countries. Without established criteria to standardize "training" this indicator may be subject to some over-reporting. USAID also encourages partners to report on knowledge retention from these trainings in additional indicators not reported here to understand the outcomes of the training in addition to the number of attendees.
Page 75 of 80

Disaster Risk-Reducing Practices/Actions In FY 2013, USAID prioritized funding programs that reduce risks to water-related disasters—particularly river flooding in several important river basins in Africa and South and Southeast Asia—and flash flooding affecting more than 45 countries. USAID also prioritized funding for disaster risk reduction (DRR) programs that improved local communities’ ability to utilize early warning information and prepare for water-related disasters. In addition, USAID supported water, sanitation, and hygiene interventions in disaster response and recovery activities that incorporated DRR principles and design, even during emergency response. In FY 2013, USAID supported the Zambezi River Flood Early Warning and Mitigation program, which is developing an end-to-end Flood Forecasting and Early Warning System (FFEWS). This mitigation project is jointly implemented by the World Meteorological Organization, the National Oceanic and Atmospheric Administration (NOAA), and the U.S. Geological Survey (USGS). Focusing on basin-wide cooperation and an integrated approach to flood early warning, the Zambezi River Flood Early Warning and Mitigation program addresses the technical, institutional, and capacity-building issues related to developing flood preparedness and early warning systems. The integrated strategy and USAID partnerships with other organizations will help link technology to communities, encouraging the development of a framework for a sustainable, integrated flood early warning and management in the Zambezi basin. Building on existing resources and infrastructure, the flood warning system will monitor the Zambezi River system, provide information to decision-makers and affected populations, and help relevant authorities work at the community and local level to reduce the impact of floods, as well as assist with daily water resource management in the basin. Based on USAID’s technical leadership to establish an acceptable strategy within the basin, other donors are establishing further plans that will be used by the countries and the region to improve warning and decision-making to reduce flood losses. In South Asia, USAID continued to strengthen the capacity of regional and national hydrometeorological institutions in flood and river forecasting to enable flood-prone countries to reduce impacts of recurrent floods and improve water resource management in Ganges-Brahmaputra-Meghna River Basin. USAID has partnered with NOAA, the National Aeronautics and Space Administration, USGS, and a regional organization in Nepal to implement this risk reduction work on an important watershed. In FY 2013, USAID and the World Wildlife Fund continued to develop a Good Practices manual to reduce flood risk and improve flood management programming utilizing a natural resource management framework. The Good Practices manual is geared toward assisting communities, local governments, and DRR practitioners to understand natural flood management, implementation of natural resource-based mitigation measures at a local level, policy issues, and solutions to common pitfalls or conflicts associated with such interventions. USAID aims to fill a gap in need for guidance on best practices in flood mitigation, which do not emphasize structural solutions. USAID’s experience has demonstrated the structural flood mitigation efforts can often increase flood problems and produce environmental damage, largely due to lack of capacity to properly maintain the structures and the false confidence given to communities who believe these structures will protect them. Reported results for the indicator tracking implementation of DRR practices/actions by host country and regional teams as a result of U.S. assistance fell just short of the FY 2013 target of 20 percent due to imprecision in aggregating data across multiple offices reporting on these activities.
Page 76 of 80

STRATEGIC GOAL FOUR Program Area: Disaster Readiness Performance Indicator: Percentage of Host Country and Regional Teams and/or Other Stakeholder Groups Implementing Risk-Reducing Practices/Actions to Improve Resilience to Natural Disasters as a Result of U.S. Assistance within the Previous 5 Years
FY 2009 FY 2010 FY 2011 FY 2012 FY 2013 FY 2013 FY 2013 Results Results Results Results Target Results Rating
N/A N/A 5.00% 17% 20% 17% Below Target
Data Source: Internal award tracking system (abacus), third-party reporting, IO reporting, NGO reports, individual contacts, etc. Data Quality: This indicator reflects stakeholder groups as self-defined by OFDA's NGO implementing partners and can constitute communities, committees, schools, etc. OFDA-funded U.N., IO, or other interagency efforts under this indicator are not yet tracked in the reporting system. Therefore, it is likely this indicator is under-reported. Aggregating data across a five-year timeframe incurs challenges related to updating tracking systems and aggregating data that was collected differently from year to year.
Page 77 of 80

CROSS-CUTTING ACTIVITIES Gender U.S. efforts to promote gender equality and women’s empowerment cut across many sectors. The United States seeks to: reduce gender disparities in economic, social, political, and cultural access to resources, wealth, opportunities and services; reduce gender-based violence and mitigate its harmful effects on individuals; and increase the capability of women and girls to realize their rights, determine their life outcomes, and influence decision-making in households, communities, and societies. In addition to reducing gaps, U.S. activities seek to promote women’s and men’s leadership and participation. The U.S. Government supports gender integration of gender equality and female empowerment in economic growth, agriculture and food security, education, conflict mitigation and resolution, civil society and the media, and climate change. For example, the U.S. Government supports a range of activities that strengthen and promote women’s participation and leadership in peace building, civil society, and political processes in order to address and mitigate challenges impacting women’s ability to participate meaningfully in important decisions and processes that affect them, their families, and their communities and nations; these activities include efforts to mobilize men as allies in support of gender equality, women's participation and in combating gender-based violence. U.S. efforts also work to ensure that women’s issues are fully integrated in the formulation and conduct of U.S. foreign policy. Funds include efforts to promote stability, peace, and development by empowering women politically, socially, and economically around the world. In March 2012, the Department issued Policy Guidance on Promoting Gender Equality to achieve our National Security and Foreign Policy Objectives and the USAID Administrator released USAID’s Gender Equality and Female Empowerment Policy. In addition, the United States released two strategies, one to strengthen conflict resolution and peace processes through the inclusion of women, and another to address gender-based violence around the world. Complementary in scope, these policies/strategies require that gender equality be incorporated into our policy development, strategic and budget planning, implementation of projects and activities, management and training, and monitoring and evaluation of results. GBV Services Gender-based violence (GBV) impacts both development and humanitarian assistance objectives and cuts across most technical sectors (e.g., health, education, democracy and governance, economic growth, and disaster response). This indicator captures the services supported by United States that are being delivered to male and female victims of abuse within and across countries. Gender-based violence is an umbrella term for any harmful act that is perpetrated against a person’s will, and that is based on socially ascribed (gender) differences between males and females. Examples of U.S.-supported services include legal, health, psycho-social, economic, shelters and hotlines. This indicator enables USAID Washington offices and field missions to gain a basic but essential understanding of the reach and scale of programs to address various types of services that are provided to male and female victims of abuse and assess whether interventions are adequately addressing identified needs within the country. The FY 2013 target for this indicator is 765,654 and the result is 800,634. Fifty percent of the 22 OUs reporting against this indicator exceeded their 2013 targets: Armenia, Bangladesh, Bosnia and Herzegovina, Burma, Ghana, Guatemala, Kenya, Mexico, Moldova, Rwanda, and Tanzania. Rwanda’s FY 2013 target, for example, was 162, 195 and its actual results were 166,551. In Rwanda, USAID scaled up to having five fully-equipped and functional One Stop Centers (OSCs) in FY 2013 that responded to the needs of GBV victims. Increased public health education, gender integration training for
Page 78 of 80

health care providers and community referral of GBV cases to OSCs increased the number of victims accessing OSCs. Guatemala’s FY 2013 target was 20,164 while its FY 2013 result was 21,920. The Guatemala mission was able to exceed its target because USAID’s service providers hired additional psychologists and social workers serving victims of GBV. The Democratic Republic of Congo, Pakistan, Sri Lanka, Vietnam and the Bureau for Democracy, Conflict and Humanitarian Assistance (USAID) fell short of their FY13 targets. The explanations that OUs provided for their deviations were varied and included the following: (a) this was a new indicator and without prior baselines, the targets were illustrative, (b) some targets were based on estimates of projected need for emergency response and the actual need was smaller, and (c) program start-up was slower than expected or focused initially on areas other than service provision.
CROSS-CUTTING INDICATOR Program Area: Gender Performance Indicator: Number of People Reached by a U.S. Funded Intervention Providing GBV Services (e.g., Health, Legal, Psycho-Social Counseling, Shelters, Hotlines, Other)
FY 2009 FY 2010 FY 2011 FY 2012 FY 2013 FY 2013 FY 2013 Results Results Results Results Target Results Rating
N/A N/A 1,757,601 1,886,460 765,284 800,634 Above Target
Data Source: FY2013 Performance Reports from Armenia, Bangladesh, Benin, Bolivia, Bosnia and Herzegovina, Burma, Democratic Republic of the Congo, Ethiopia, Ghana, Guatemala, Haiti, Kenya, Mexico, Moldova, Pakistan, Papua New Guinea, Rwanda, Sri Lanka, Tanzania, Vietnam, S/GWI (Ambassador at Large for Global Women's Issues), USAID Bureau for Democracy, Conflict and Humanitarian Assistance (USAID). Data is collected and reported by implementing partners with programs in any sector (health, humanitarian, education, etc.) that are designed to raise awareness about or prevent gender-based violence. Data Quality: Performance data, verified using Data Quality Assessments (DQAs), must meet standards of validity, integrity, precision, reliability, and timeliness. Each OU must document the methodology used to conduct the DQAs. DQA and data source records are maintained in the Performance Management Plans; Missions certify via the Performance Plan and Report that a DQA has occurred within the last three years. (For details, refer to USAID's Automated Directive System [ADS] Chapter 203.3.5, http://www.usaid.gov/policy/ads/200/203.pdf). Limitations of this indicator data include that it cannot provide information about the quality of services and it doesn't lend itself well to cross program or country comparisons.
Page 79 of 80


