Foreign, Private Domestic, And Government Banks: New Evidence from Emerging Markets Atif Mian ∗ July 2003 Abstract How does organizational design shape the behavior of banks? Using a panel data of over 1,600 banks in 100 emerging economies, we identify the strengths and weaknesses of the three dominant organizational designs in emerging markets. Private domestic banks have an advantage in lending to “soft information” firms which allows them to lend more, and at higher rates without substantially higher default rates. On the other hand, foreign banks have the advantage of access to “external liquidity” from their parent banks which lowers their deposit cost. The external support however comes at the cost of foreign banks being limited (presumably by the parent banks) to only lend to “hard information” firms. Whereas foreign and private domestic banks have their own comparative advantages and disadvantages, we find that government banks perform uniformly poorly, and only survive due to strong government support. JEL Classification: G21, G32, H11, D80 ∗ Graduate School of Business, University of Chicago. 1101 East 58th Street, Chicago, IL 60637. Ph: 773- 834-8266. Fax: 773-702-0458. Email: [email protected]. Prashant Bharadwaj provided excellent research assistance for this study. I thank Ayesha Aftab, Asim Ijaz Khwaja, Owen Lamont, Sendhil Mullainathan, Abhijit Banerjee and participants at MIT, University of Chicago (GSB), and NEUDC conference for helpful advice and suggestions. All errors are my own. 1
Transcript
Foreign, Private Domestic, And Government Banks:
New Evidence from Emerging Markets
Atif Mian∗
July 2003
Abstract
How does organizational design shape the behavior of banks? Using a panel data ofover 1,600 banks in 100 emerging economies, we identify the strengths and weaknesses ofthe three dominant organizational designs in emerging markets. Private domestic bankshave an advantage in lending to “soft information” firms which allows them to lend more,and at higher rates without substantially higher default rates. On the other hand, foreignbanks have the advantage of access to “external liquidity” from their parent banks whichlowers their deposit cost. The external support however comes at the cost of foreign banksbeing limited (presumably by the parent banks) to only lend to “hard information” firms.Whereas foreign and private domestic banks have their own comparative advantages anddisadvantages, we find that government banks perform uniformly poorly, and only survivedue to strong government support.
JEL Classification: G21, G32, H11, D80
∗Graduate School of Business, University of Chicago. 1101 East 58th Street, Chicago, IL 60637. Ph: 773-834-8266. Fax: 773-702-0458. Email: [email protected]. Prashant Bharadwaj provided excellent researchassistance for this study. I thank Ayesha Aftab, Asim Ijaz Khwaja, Owen Lamont, Sendhil Mullainathan,Abhijit Banerjee and participants at MIT, University of Chicago (GSB), and NEUDC conference for helpfuladvice and suggestions. All errors are my own.
1
Banks as financial intermediaries are considered an important element for growth in emerg-
ing economies by most1. Yet less is known about the strengths and weaknesses of different
types of bank organization and design. The three dominant types of banks in emerging markets
are government, private domestic, and foreign. This paper presents new evidence on differences
between these three types of banks across a hundred emerging economies and more than 1,600
banks over a period of eight years.
The differences are important to document and analyze because the three types of banks
differ in important ways in the structure of their incentives, organization, and regulation. For
example, while government banks have poor cash-flows incentives and suffer from the moral
hazard problem of being both the owner and the regulator, private domestic banks have higher
cash-flows incentives, and greater distance between the regulator and the ownership. Foreign
banks on the other hand while being relatively similar to private domestic banks in terms of
incentives and regulation, differ in their organizational structure. They tend to have a more
hierarchical structure, with the top management often sitting in a distant home country.
Consequently the empirical results of this paper shed helpful light on questions regard-
ing banking structure. For instance, is strong external supervision necessary or can market-
discipline coupled with private incentives be relied upon for good banking? Should governments
get involved in banking in order to fix the “failures” that might plague weak financial mar-
kets? Or do the political economy and inefficiency costs of government intervention out-weigh
any “social” benefits? Should foreign entry of banks be encouraged in order to import the
“culture”, technology, resources and human capital that might otherwise be lacking in a weak
economy? Or does the very organizational design of foreign banks limit their ability to lend
to clients most in need of intermediation?
Since this paper is the first broad-based bank level study (to our knowledge) of its kind, the
facts established here help anchor the debate on these questions. We deliberately focus only
on emerging economies because questions concerning the role of government, and the failure of
the private banking system are more pronounced in these economies. Moreover, the definition
1See for example Levine and Zervos (1998) and Rajan and Zingales (1998) for a link between finance andgrowth.
2
of a “foreign” bank is very different from an emerging country perspective, compared to a
developed economy.
The paper begins by building a new data set containing ownership information on over
1,600 banks in a 100 emerging economies across the world. This allows us to classify banks
into the three categories mentioned above. This data is then merged with financial data to
create a bank-level panel covering a total of eight years from 1992 to 1999. Using country fixed
effects, we document systematic cross-sectional differences between the three types of banks.
The fixed effects procedure allows us to side step the main pitfalls of cross-country empirical
work by completely controlling for country level effects such as differences in institutional,
legal, political, and economic environments. Finally, we exploit the time series variation of
the data to measure the sensitivity and exposure of individual banks to various macro shocks
hitting the economy.
Our analysis reveals that all three types of banks - foreign, private domestic, and govern-
ment - are well represented throughout the world with significant market shares. Whereas
private domestic and foreign banks have similar size and age distribution across the developing
world, government banks tend to be both bigger and much older than their private counter-
parts. This reflects the age-old resilience of the view that setting up large government banks
in developing countries with weak financial markets is necessary to jump start the economy.
The cross-sectional comparison shows that private domestic banks behave differently from
their foreign counterparts. In particular, private domestic banks appear to be more “aggres-
sive” in their lending than foreign banks. They hold significantly less liquid assets than foreign
banks, and correspondingly hold more assets in the form of loans. Moreover, of the loans that
each type of bank gives out, private domestic banks earn 2.6% higher return than foreign banks.
Surprisingly, despite a more aggressive lending policy, there is no difference in the measured
default rate of private domestic and foreign banks. Independent risk ratings of loan portfolios
by credit rating agencies also confirm this result. The higher return on loans despite similar
default rates implies that private domestic banks are more profitable than foreign banks on
the loan side. However, the picture reverses on the deposit and banking services side. Private
3
domestic banks have higher interest expense on deposits, and lower revenue from the sale of
banking services. Consequently there is no significant difference in the average profitability of
private domestic and foreign banks in emerging economies.
At first glance, the contrasting results on the loan and deposit side are puzzling. If private
domestic banks indeed have higher return on loans and same default rates, why do they pay
a premium over foreign banks on deposits? The answer is given by risk ratings that measure
the access of banks to external sources of help such as government or shareholders in times
of trouble. While both foreign and private domestic banks have similar low probabilities of
being helped by the government in times of trouble, foreign banks are significantly more likely
of being bailed out by their shareholders. For example, if the local subsidiary in a developing
country of a foreign bank runs into trouble, it may get an injection of new capital from its
shareholders (parent bank) to bail it out. This access to liquidity, and “deeper pockets” lead
to a lower deposit cost for foreign banks.
The next question then is why do private domestic banks lend more aggressively and at
higher rates compared to foreign banks? In other words, why can foreign banks not compete
away the profitable loans away from private domestic banks, particularly when they have
greater access to outside resources and expertise? We borrow an idea from organization theory
and suggest that the answer lies in understanding the segmentation of the loan market by
the two types of banks. This theory suggests that foreign banks are comparatively less likely
to lend to “soft information” firms, and more likely to lend to “hard information” firms.
“Soft information” refers to information that cannot be easily publicly verified by a third
party. Examples of soft information may include a loan officer’s subjective evaluation about
a small firm’s future outlook. “Hard information” on the other hand refers to credible and
publicly verifiable information, such as a foreign firm’s authentically audited balance sheets,
or government guarantees2.
This idea is developed in a recent paper by Stein(2002) who argues that organizations
with more hierarchical structures are more likely to rely on “hard information” as opposed
2See Petersen (2002) for an in-depth discussion of soft and hard information in financial transactions.
4
to organizations with flatter structures. The reason is that flatter organizations have better
control and information on their managers, and thus can afford to give them more discretion.
This discretion allows the managers to use soft information such as subjective evaluations,
which managers in hierarchical organizations are not allowed to use. Since foreign banks are
part of large multi-national chains with headquarters often in a far away developed country,
they will endogenously choose to concentrate on “hard information” firms so that they do
not have to give away too much discretion to their local managers in the developing country3.
Private domestic banks on the other hand can afford to rely more on “soft information” because
of their flatter organizational structure.
Since we do not observe the portfolio composition of individual banks, we cannot test the
above hypothesis directly. However, we test it indirectly by measuring the relative sensitivity
(correlation) of banks to different types of macro shocks. These correlations capture two
effects: the response of the bank to the shock, and the exposure of the bank to the shock.
Consistent with the hypothesis above, there is an interesting separation in the type of shocks
that private domestic and foreign banks are sensitive to. In particular, private domestic banks
respond more to macro shocks affecting the local (private) corporate sector, whereas foreign
banks respond more to macro shocks affecting the foreign corporate and government sectors.
Similarly on the deposit side, foreign banks are more sensitive to changes in the aggregate
foreign currency deposits, whereas private domestic banks are more sensitive to changes in
the aggregate domestic currency deposits. These results on the relative sensitivities of private
domestic and foreign banks suggest a segmentation of the loan and deposit market along soft
and hard information criteria as discussed above.
With respect to government banks, we find that government banks perform significantly
worse than both private domestic and foreign banks in terms of overall profitability. In fact,
the average government bank makes a loss in developing countries. This occurs despite the
fact that government banks enjoy low deposit costs similar to those of foreign banks. Data
on credit ratings shows that the low deposit costs for government banks is due to the strong
3Coval and Moskowitz (2001) show in the context of money-managers, that geographical proximity of theheadquarters helps in information acquisition.
5
external support they receive from the government in times of trouble. Government banks are
also significantly under-capitalized relative to private domestic and foreign banks, and have
considerably higher loan default rates compared to private banks. The result on default rates
is further verified by the independent credit ratings data. Different credit rating agencies con-
sistently rate government bank loan portfolios as the worst performing of all banks. Similarly,
time series analysis reveals that government banks have the lowest sensitivity to almost all
types of macro shocks, suggesting that government banks do not respond quickly to economic
fluctuations in the economy.
Our results are consistent with the view that poor incentives, political interference, and
moral hazard from soft-budget constraints lead government banks to make poor lending deci-
sions without any corresponding cost on the deposit side. One may argue that our results can
also be consistent with a more benign interpretation of government banks where these banks
give out loss-making loans to subsidize “social projects” such as agriculture, education etc.
However, there is direct evidence that lending by government banks is based on “political”
rather than “social” objectives. Using a sub-set of the data used in this paper on 22 countries,
Dinc (2002) shows that loan forgiveness and restructuring of old loans, and issuance of new
loans increases more for government banks relative to private banks during election years.
There is a vast theoretical literature on how organizational design impacts the provision of
incentives, nature of tasks, and informational flows within a firm4. Our focus in this paper is
to test, within the context of banking, how organizational differences between foreign, private
domestic, and government banks lead to differences in the nature and success of banking. There
has been some empirical work that looks at the effect of differences in organizational structure
on banking. Berger et al (2002) focus on small and large banks in the U.S., and conclude that
small banks are more efficient in collecting and utilizing soft information. Liberti (2003) in a
study of a large bank in Argentina finds that decentralizing authority leads to greater effort
and use of soft information by the managers. The results of this paper can also be viewed
4Alchian and Demsetz (1972), Williamson (1985), Aghion and Tirole (1997), Baker, Gibbons, and Murphy(1995), Holmstrom and Roberts (1998), Rajan and Zingales (2001), and Stein (2002) are only some of thewell-known papers in this field.
6
as supporting the results of these papers: flatter (decentralized) organizational structures
facilitate the use of soft information.
A few papers have looked at some of the bank-types analyzed in this paper. Sapienza
(2003) studies government banks in Italy, and Goldberg, Dages, and Kinney (2000) compare
private domestic and foreign banks in Mexico and Argentina. However, no single study has
focused on the systematic differences between all the three dominant bank-types in emerging
markets5. The contribution of this paper lies in analyzing these organizational differences at
the bank level across a comprehensive list of emerging markets, which allows our results to be
generalizable.
The rest of the paper is organized as follows. Section I describes the data, and Section II
presents the empirical results. Section III presents our explanation for the results, and Section
IV discusses some alternative explanations and why the results do not favor them. Section V
concludes.
I Data
A. Description
Our data set has 1,637 banks from a hundred emerging economies spanning a period of 1992
through 1999. The three different sources used to put this data set together are described
below:
(1) IBCA BankScope Data Set:
The IBCA BankScope data set contains annual financial information for more than 11,000
banks across the world. The version of the data set that we have spanned the period 1992-
1999. We selected all commercial banks in the data set for the 100 developing countries listed
in Table 1 of the appendix. The choice of countries was based on the World Bank classification
5La Porta et al [2000] use aggregate country-level data to argue that the patterns of growth in countrieswith dominant government sector banks suggest that the beneficial role often ascribed to government banks ismissing. Claessens et al [1998] show that the entry of foreign banks is associated with lower profitability andover-head expenses for private domestic banks.
7
of countries into developed and developing economies. There were 1,725 commercial banks6
in the data set for the 100 countries. Of these we were able to assign an ownership category to
1,637 banks, which comprises our final data set. The remaining 88 banks were thus dropped
as we could not assign them an ownership category. The BankScope data set is maintained for
commercial reasons. The company that maintains the data set sells this information to other
banks and consulting firms. For this reason, they are less likely to include the very small banks
in their data set. However, the data set does include most major banks in a given country.
There is also another selection bias for foreign banks. BankScope can only keep information
on a bank in a country if that bank publishes independent annual reports for its operations
in that country. If the regulatory authority of the country does not require foreign banks to
incorporate as a separate corporate entity, then that foreign bank may not publish separate
annual reports. For example, although there is a Citibank in Pakistan, since it is not incor-
porated as a separate entity, BankScope does not have information on it. On the other hand,
Citibank Argentina is included in the data set. This selection effect however is unlikely to have
a serious (if any) effect on our results, as we explain in the empirical section.
We included all observations between 1992 and 1999 for the selected banks, to form a panel
data set. Generally the coverage of BankScope keeps increasing over the years as new banks
are continuously being added. This means that the panel is not balanced as some banks are
missing for some years. We will analyze the entry and exit of banks from the data set in detail
in the empirical section. In all, there are a total of 8,411 bank-year observations.
The data set contains annual financial information, including balance sheet and income
statement information. Since different countries follow slightly different definitions for account-
ing variables, variable definitions have to be made consistent across countries. The consistency
of variable definitions comes at the expense of losing disaggregated information. For example,
some countries may classify their loans into 1 , 2, and 3+ year durations, while others may
only report the aggregate loan amount. Therefore, to create a consistent definition for loans
across the two countries, we have to create a single “total loan” category which simply sums
6We excluded all non-commercial banks, such as investment, not-for-profit and development banks.
8
different maturity loans into one. We also checked for the integrity of the data by making sure
that sub-categories summed correctly into the aggregated categories. More than 99% of the
data satisfied this check. Any observation that failed the integrity test was thrown out.
(2) IFS Macro Data
We obtained banking and financial data for the countries in our sample from the IMF IFS
data set. We took a sub set of the data set that spanned our banking data. The IFS data
set is available at quarterly intervals. This was quite helpful as it allowed us to match the
macro data perfectly with the accounting year followed by an individual bank. Not all banks
in the data set end their fiscal year at the same time. Some end the fiscal year in December,
while others in June or September etc. The quarterly data allowed us to avoid any mismatch
in the timing of banking and macro data. The exact variables used from the IFS data set are
described in more detail later on.
(3) Author compiled Ownership Classification Data
A contribution of this paper in terms of data collection is the creation of this ownership
classification data set. We do not know of any other data set that contains the ownership
classification of banks at such a large scale at the bank-level. A lot of effort and time was put
in the construction of this data set.
Starting from the banks in the BankScope data set, we collected ownership information on
the banks in order to divide them into three categories: (i) government, (ii) private domestic,
and (iii) foreign. A bank was assigned a category, if a controlling percentage (>50% usually)
of the shares was held by shareholders of the given category. Information on share-holding
pattern, including share holders names, was sometimes available from the BankScope data
set itself. When this information was absent, we looked up the Thompson Financial banking
directory that also contains ownership information for banks around the world. Even with
shareholder information, sometimes it was not clear whether the shareholders were domestic,
foreign, or government. We talked to country experts, and sometimes the banks themselves to
clarify such issues. When ownership information was not available for a given bank, alternative
sources were also scanned. These included WPA, a consulting company in Cambridge that
9
helped us classify many banks in Africa. We also talked to different country banking experts,
or the banks themselves to classify any remaining banks into the three categories.
B. Summary Statistics
Table I in the appendix shows the distribution of banks by ownership classification across the
100 countries in our sample. The table shows a large variation in the number of banks in
each country. It varies from only 1 bank in Albania to 155 in Brazil. A breakdown of banks
by ownership type in Table I shows that there are 859 private domestic, 528 foreign, and 250
government owned banks in our sample. The amount of assets under each ownership type
suggest that all three types of banks are major players in the banking sector in developing
economies. Although foreign banks have the lowest share at 19%, this is likely to be an
underestimate due to the non-reporting of financial information in countries where foreign
banks are not separately incorporated. We will return to this possible selection issue in the
robustness section.
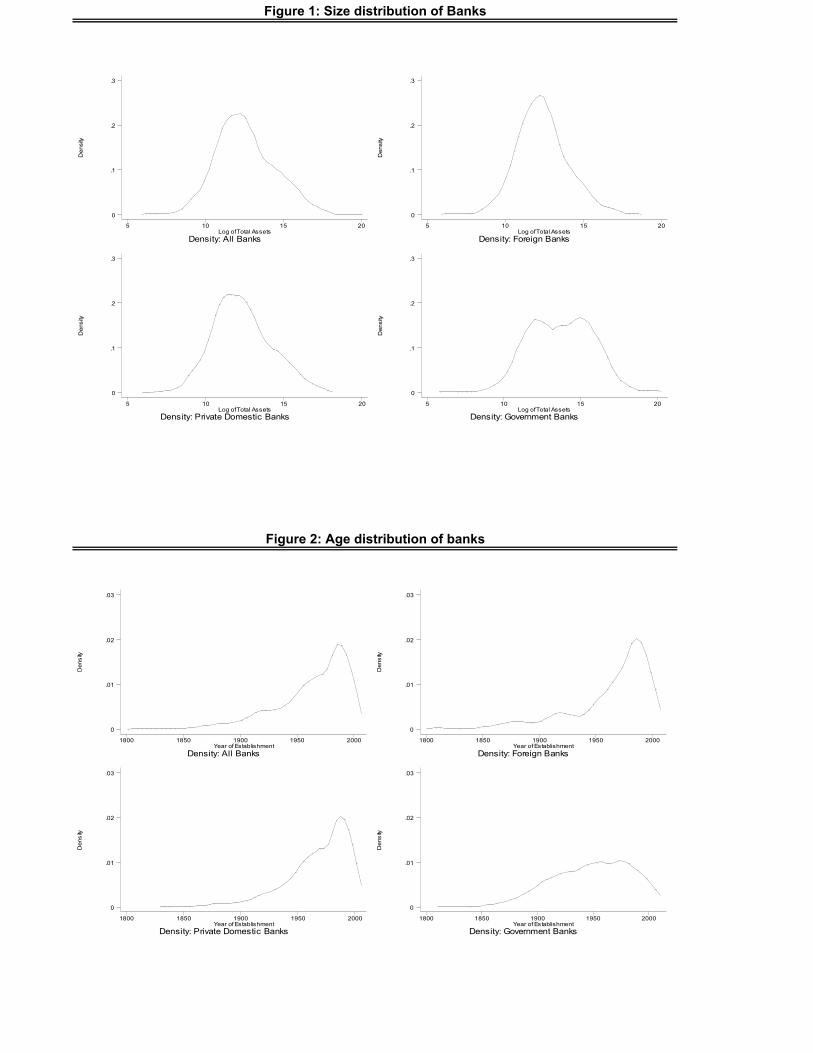
Figure 1 shows the asset distribution of banks by ownership type. Foreign and domestic
banks have very similar distribution of assets across the data set. However, government banks
tend to be much larger than either foreign or private domestic. This does not come as a surprise
since governments often set up a few big banks as opposed to many small ones for organizational
simplicity. Similarly, Figure 2 shows the age distribution across ownership types. Once again
foreign and private domestic banks have very similar age distributions. However, government
banks differ considerably in their age composition. Typically they tend to be established a lot
earlier than either foreign or private domestic banks.
Table II presents the summary statistics for the main asset, liability, and income variables
used in the paper. The data was averaged out for each bank over time. Not all banks report
information at the same level of disaggregation. This is why the number of observations for
some variables, such as the ratio of interest income to total income, is less than 1,6377. A
few points are useful to be kept in mind from the table. On the assets side, loans comprise
7as such there could be a selection effect for these variables. But the dropout rate is very low.
10
about half of the value, with cash and securities comprising another 40% of the assets. A
breakdown of the income components suggests that banks in developing countries on average
earn positive profits measured by net income before taxes. The biggest component of income is
interest income from earning assets (81%), followed by Commission and Fee income (17%). The
Commission and Fee income includes service fees charged to deposit holders and other clients
of the bank. Since service fees generally reflect high-end business, the fraction of Commission
and Fee income in the overall income suggests the market orientation of a particular bank.
On the expense side, the biggest two expenditures are interest expense (54%), and operating
expenses (37%) which include administrative charges, rent, and wages to employees. About
7% of the expenditure is used to provide for bad or doubtful loans.
II Empirical Results
A. Cross-sectional Analysis: Asset, Capital, and Income Structure
We start with documenting the basic cross-sectional differences between the three types of
banks. To perform this analysis, we first collapse the panel data into a cross-sectional data
by taking the average of each variable (in 1997 US dollars) across the years for a given bank.
The cross-sectional facts will then be useful in understanding the roles and limitations of each
type of bank in developing countries. Table III reports the cross-sectional differences across a
number of bank characteristics. All regressions in the table include country fixed effects. As
such the regressions measure the average difference across government, foreign and domestic
banks within the same country. This is important as it controls for any differences between
banks that might be a result of selective placement of banks into countries with certain polit-
ical and macro characteristics. For example, foreign banks may be more likely to operate in
bigger economies, and economies with more stable political and regulatory environments. Al-
ternatively, government banks may be more likely in countries with more centralized economies
and systems of administration. Such country level economic and political factors can in turn
have an effect on bank variables such as profitability, and risk exposure. However, inclusion
11
of country fixed effects controls for all such country specific macro, political and regulatory
factors.
Column (1) shows that private domestic banks are roughly the same size as foreign banks
in a given country, but government banks are much bigger (about 3 times). This is consistent
with the density plots shown in Figure 2. It should be stressed here that the size comparison is
only an in-sample statement. As we have discussed above, very small banks are less likely to be
reported on the BankScope data set. It is also likely that such small banks are mostly domestic.
The reason is that potential foreign banks most likely face higher fixed costs than potential
domestic banks in setting up an operation. The higher fixed cost could be driven by factors such
as managing workers from a distance, or unfamiliarity with the business environment. Given
such fixed costs, only those foreign banks will enter the banking market, that can sustain a
minimum scale of operations. Since the BankScope data set excludes the smallest banks, which
are mostly likely to be domestic banks, the true average asset size of domestic banks is likely to
be smaller than column (1). However, to the extent that small banks tend to be different from
larger banks independent of their ownership, we would like to compare domestic and foreign
banks within the same size range. It is for this reason that we feel that the selection criteria
of size used by BankScope is unlikely to be a major concern.
Columns (2) through (5) compare the asset and capital structure of banks. The assets
of each bank are broken into three categories: cash plus investment securities, loans, and
other/fixed assets. We only look at the major components of assets which are Net Loans and
cash plus securities. Cash and investment securities can be classified as “liquid assets” since
securities most often mean treasury bills held by the bank. Cash and investment securities
are classified as liquid since they can be readily exchanged for their face value in the market.
Columns (2) and (3) show that private domestic banks have significantly lower fraction of
liquid assets in their portfolio. Their Net loan ratio is 1.9% more than foreign banks, which
implies that domestic banks hold less liquid assets than foreign banks. The result shows that
foreign banks like to be more conservative than their domestic counterparts. Column (5) shows
that on average domestic private and government banks have lower capitalization ratios (1.5%
12
and 5.7%) than foreign banks. This again hints at the susceptibility of private domestic and
government banks to take on greater risk than foreign banks. However, whereas the difference
with government banks is statistically significant, the difference with private domestic banks
is only marginally significant.
Conceptually the level of risk in a bank’s portfolio is one of the most important determinant
of a bank’s health. Governments establish sophisticated regulatory institutions to continuously
audit and monitor the level of risk taken by banks. Banks are subject to numerous prudential
regulations that are aimed at limiting the extent of risky behavior that can lead to bank
failures in future. Unfortunately, given the importance of risk, it is an equally difficult metric
to measure. Since risk refers to expected volatility in future returns, measuring the level of
risk at a given point in time can be an arduous task. This is particularly the case under weak
disclosure laws that are common in the banking sector. While acknowledging such practical
limitations in the measurement of risk, we compute a historical measure of risk across bank
types by taking the ratio of loan provisioning during the sample period to net loans. To the
extent that measurement problems are similar across bank-types within a given country, our
measure of risk (with country fixed effects) should be an unbiased measure.
If a bank has a riskier portfolio, then it should on average have higher loan loss provisions
than other banks in the country. The presence of country fixed effects implies that all banks
in a country are subject to similar accounting and reporting standards. As such whether the
regime is lax or strict, if a bank takes on more risk it should on average be accumulating more
reserves. However, exceptions are still possible. For example, a riskier bank may deliberately
try to cheat the regulatory authority, whereas a conservative bank may want to maintain the
appropriate level of reserves. In such a case, even a riskier bank can show the same or even
lower level of loan loss provisioning than a less risky bank. In other words, our measure of
differences in risk may be an underestimate of the true differences. Column (6) compares the
ratio of loan loss provisions over the sample period to net loans. Government banks have
significantly higher provisioning for bad loans, suggesting a higher level of default rate on its
loans. There are no significant differences between foreign and private domestic banks.
13
Columns (7) to (12) in Table III compare the income structure between banks. We are
interested in answering two related questions here. First, do banks differ in overall profitability?
Second, do they differ in their sources of income and expenses? The following accounting
identity is useful in answering these questions:
Net Return ≡ II + CFI +OTHI − IE −OPE − LLP −OTHE (1)
where II is interest income, CFI is commission and fee income, OTHI is other income,
IE is interest expense, OPE is operating expenses such as wages and rent, LLP is loan
loss provisions, and OTHE is other expenditure. Net Return and its components are all
normalized by total assets of the bank. The net return refers to pre-tax return. Column
(7) shows that private domestic banks earn slightly lower pre-tax profits than foreign bank.
However, the difference is not significant. Government banks however systematically perform
worse than both private domestic and foreign banks. Their pre-tax return on earnings is
1.6% and 1.2% less than foreign and private domestic banks respectively. The differences are
significant at the 1% level. These are large differences, given the fact that the mean pre-
tax return on assets is 1.46% (Table II). In fact the results imply that government banks on
average earn negative returns. Columns (8) and (9) show that interest income is a much more
important part of domestic banks’ income than foreign banks. Interest income to total assets
ratio is 2.2% higher for private domestic banks, and 1.1% for government banks. As we saw
earlier, part of the reason for this increase is that domestic banks hold higher fraction of assets
in the form of high-earning loans than foreign banks. However, column (9) shows that not
only do domestic private and government banks hold more loans, but they also earn a higher
return on them than foreign banks. The return on earning assets (interest income to earning
assets ratio) is 2.6% higher for domestic banks and 1.2% higher for government banks. All
these differences are significant even at the 1% level. Similarly, (10) and (11) look at the
interest expense side. Private domestic banks hold more deposits, but they also pay out higher
interest rate on deposits than foreign banks. The return on deposits is 1.7% higher for private
domestic banks. Moreover this higher cost of funds pretty much takes away any gains made
14
out of higher interest income for domestic banks. The cost of deposits for government banks
is not statistically different from foreign banks. Column (12) shows that domestic banks earn
significantly lower revenue through commission and fees. These commission and fees are often
tied into the high-end business, such as wire transfers. The result suggests that foreign banks
have a higher-end clientele than domestic banks. Finally, column (13) reaffirms the results
from Figure 2 with country fixed effects: private domestic banks do not differ significantly
from foreign banks in terms of their age in the country of operation, but government banks are
older by more than 17 years on average. All regressions in Table III reported heteroskedasticity
consistent robust standard errors.
The results of Table III can be summarized as follows. Private domestic banks although
being the same size and age as foreign banks, tend to be more aggressive in their lending.
They lend out more, and lend at higher interest rates. Private domestic banks have to pay
a risk-premium over foreign banks in order to attract deposits. Foreign banks earn more
through service fees, reflecting their high-end clientele. However, private domestic banks are
still as profitable as foreign banks overall. The table also shows that government banks are
consistently the largest and oldest banks in a country. Although government banks have the
riskiest loan portfolios in terms of loan losses, they still enjoy low cost of deposits, probably
reflecting the implicit or explicit government guarantees that they enjoy. Finally, government
banks perform a lot worse than either private domestic or foreign banks in terms of overall
profitability.
The cross-sectional results raise a few important questions. First, if private domestic banks
earn higher return on their loans without excessive default rates, what prevents foreign banks
from lending to the same high return, and low risk clients? Second, if private domestic banks
have such high return and low risk loans, why do they pay a premium over foreign banks on
their deposits? Third, accounting numbers may be systematically biased in favor of worse
quality banks. Is there independent non-accounting evidence to confirm our main results? We
address all these question in the next half of this section.
15
B. Time Series Analysis: Bank Sensitivity to Macro Shocks
The fact that private domestic banks have higher return loans but relatively low default rates,
hints at the possibility that loan market is segmented between private domestic and foreign
banks. For example, there may be a profitable part of the loan market which the private
domestic banks lend to, but foreign banks choose not to (or cannot) lend to. One potential
reason for the segmentation of loan market can be derived from a recent paper by Stein (2002).
A detailed discussion of the idea is given in the next section, but in brief since private domestic
banks are less hierarchical than foreign banks, they should (according to the theory) focus more
on “soft information” sectors than foreign banks. Foreign banks in turn focus more on “hard
information” sectors. Hard information is any credible and publicly verifiable information,
whereas soft information refers to subjective information which cannot be verified publicly.
To test this theory, we divide macro shocks hitting an economy into two different cate-
gories: (i) shocks that predominantly affect “hard information” firms, and (ii) shocks that
predominantly affect “soft information” firms. We then measure and compare bank elasticities
with respect to these shocks. The elasticities help in understanding the exposure and response
of individual banks to different types of shocks. Formally the test can be written in the form
of the following equation:
Log(Yjct) = α+ γj + β1(Bj ∗ Log(XS
ct)) + β2(Bj ∗ Log(XH
ct )) + εjct (2)
where subscripts j, c, and t refer to bank j in country c and year t respectively. Y is a
bank-level variable such as total net loans, γj are bank fixed effects, Bj is a vector of bank type
dummies, and XS and XH represent soft and hard information shocks hitting the economy
respectively. To account for any non-stationarity in the time series variables, we first difference
the variables and run regression (2) in first-differenced form8:
∆Log(Yjct) = β1(Bj∗∆Log(X
Sct)) + β
2(Bj∗∆Log(X
Hct )) +∆εjct (3)
8We get qualitatively similar results in levels as well.
16
(3) is the formal regression we run. We run (3) on four different pairs of hard and soft
information macro shocks. The first pair (column (1) in Table IV) consists of shocks to aggre-
gate exports, and shocks to aggregate transfer income going abroad. Transfer income going
abroad consists of profits repatriated by multi-national firms operating in a developing country.
These firms are often part of a large corporate entity operating the world over. Lending to
such multi-national firms with wide national and international experience is based on “hard
information” provided by these firms. We therefore view shocks to the aggregate transfer in-
come going abroad, as information reflecting shocks to the “hard information” multi-national
firms. Shocks to the export sector on the other hand reflect shocks to local firms that sell
their produce abroad. These firms by comparison to the multi-national firms are likely to be
more local, and more “soft” in their information content. We therefore view shocks hitting the
export sector as shocks hitting comparatively softer information firms than the multi-national
firms. Column (1) of Table IV shows that private domestic banks are indeed more sensitive
to export shocks than foreign banks, but less sensitive to transfer income shocks than foreign
banks. Private domestic banks are 23% more sensitive than foreign banks to soft information
shocks, but 11% less sensitive than foreign banks to hard information shocks. We find govern-
ment banks to be the least responsive to all types of shocks. This is consistent with the theory
that government banks are large inefficient entities that fail to respond to most aggregate
fluctuations in the economy. Column (2) repeats the exercise of column (1), but this time we
capture shocks to the “soft sector” (local and smaller firms) by changes in the log of aggregate
domestic private credit, and shocks to the “hard sector” is captured by changes in the log of
aggregate foreign assets in the country. Once again we find that private domestic banks are
17.8% more sensitive than foreign banks to soft information shocks, but are 1.2% less sensitive
than foreign banks to hard information shocks. Although 1.2% itself is not significant, the
right value to look at is 17.8-(1.2)=19%, which is significant at the 1% level. This once again
suggests that private domestic banks are much more exposed to the local private firms, than
foreign firms. As before, government banks are the least responsive to both types of shocks.
If lending to local private firms requires soft information, then lending to local governments
17
does not require any such soft information. The reason is that any loans to the government are
backed by (explicit or implicit) sovereign guarantees which can be credibly communicated to a
third party. Hence lending to government and its agencies will fall under “hard information”
lending. In fact lending to the government is probably one of the hardest types of lending.
Taking advantage of this distinction, column (3) computes differential sensitivities to shocks to
private and government credit in the country. The results are once again consistent with the
soft-information theory. Lending by private domestic banks is 25.7% more sensitive to private
credit shocks, but 5.6% less sensitive to shocks to government credit. Government banks may
be holding a greater fraction of the stock of government loans, but they do not respond as
sharply as foreign and private domestic banks to changes in this stock.
Columns (4) instead of looking at sensitivity of bank-lending to macro credit shocks, looks at
the sensitivity of bank-deposits to macro deposit shocks. The soft information theory predicted
nothing about the deposit side directly. However, lending and deposit taking by commercial
banks is often intimately connected. The reason is that banks are more likely to set up deposit
taking bank branches where they do more lending (and vice versa). For this reason focusing on
the deposit mix of banks can give us important clues regarding the markets the banks operate
in. We focus on the distinction between domestic deposits and foreign deposits. The reason is
that if foreign banks really cater to the high-end of the market as the soft-information theory
would predict, then they are more likely to focus exclusively on big cities, compared to private
domestic banks. If foreign banks mostly do business with hard-information firms, they will
be disproportionately present in large cities compared to domestic banks. Domestic banks
on the other hand will also serve the smaller towns and cities that foreign banks leave out.
As such foreign banks will be less sensitive to overall movements in domestic deposits, and
more sensitive to overall movements in foreign deposits which are primarily located in large
urban centres. This is exactly what we find in column (4). The elasticity of bank deposits
with respect to aggregate domestic time deposits is 16.1% higher for domestic banks, however
the same elasticity with respect to foreign deposits is 5% lower than foreign banks. These
results once again confirm that the markets of domestic and foreign banks are segmented
18
along the hard-soft information lines. It is interesting to note that the only macro shock to
which government banks are more sensitive is the shock to domestic deposit base. Government
banks are 12.3% more sensitive to domestic currency deposit shocks, and are 8% less sensitive
to foreign currency deposit shocks. This reflects the pervasive policy among governments to
set up banks in remote or economically distressed areas where private banking services often
fail to reach.
C. Risk Ratings
So far we have used accounting data to measure bank performance and risk. We now use risk
evaluations compiled by various credit rating agencies. There are a couple of advantages of
such risk ratings compared to accounting data. First unlike accounting data, risk ratings also
take into account qualitative factors such as the quality of a bank’s auditors, and expected
news about a bank. As such risk ratings can be seen as a robustness check on the results using
accounting information. Second, in addition to historical quantitative information published
in accounting data, rating agencies also take into account institutional information that may
impact the risk of a bank. For example, if a bank has poor loan portfolio according to the
accounting data, but the bank has strong external support from the government in case of
default, then a credit rating agency can report that separately when measuring overall deposit
risk of the bank. Accounting numbers alone do not provide such information.
The downside of using the ratings data is that not all banks in our data set are rated by a
rating agency. Second different rating agencies select different banks to rate, determined mostly
by the geographical focus of a credit-rating agency. Since there is no consistent definition
of ratings across different rating agencies, we analyze the risk ratings given by each rating
agency separately. The rating agencies rate different aspects of a bank’s overall risk which are
categorized below.
(i)“Intrinsic” risk:
This captures the likelihood that internal revenues of a bank will not be enough to cover
its liabilities. Three credit-rating agencies, Fitch IBCA, Capital Intelligence, and Moody’s
19
measure this type of risk. Fitch IBCA defines intrinsic risk as the likelihood of default “if
the banks were entirely independent and could not rely on support from state authorities
or its owners”. Capital Intelligence defines this in identical terms as “the probability that
an institution will require external assistance from third parties to overcome adversities”.
Similarly, Moody’s defines this as “the likelihood that a bank will require assistance from third
parties such as its owners, its industry group, or official institutions”. In other words, intrinsic
risk measures risk due to the internal operations of the bank to the exclusion of any external
support.
We compare risk ratings across banks, by first translating each rating into a number.
The best ranking (such as AAA) is given a 1, and then each subsequent category is assigned
a number by adding a 1 to the previous category number. Higher numbers thus represent
worse risk. The credit rating number that we get is then divided by the standard deviation
of the credit rating so that the coefficients can be read in units of standard deviation. We
then compare these normalized credit ratings across banks as before. Since the number of
observations drops significantly with the ratings data, we can no longer use country fixed
effects. However, we still control for country effects by putting in a control for country risk
ratings. These ratings are compiled by EIU to measure the risk of the countries financial
system as a whole. With the bank credit rating as the dependent variable, we then run OLS
regressions on country risk ratings, a constant, and dummy variables for government and
private domestic banks. As before foreign banks are the omitted category. Table V, Panel A
compares the internal risk ratings across banks. The results of all rating agencies show the
same pattern. Government banks have the worst intrinsic risk, with a risk rating that is 0.44
to 0.92 standard deviations above the risk rating of foreign or private domestic banks. On
the other hand there is no significant difference in the credit ratings of foreign and private
domestic banks. Since the intrinsic risk ratings mainly capture the default risk of loans, the
results of Panel A also confirm the earlier results on default risk as measured by the loan loss
provisioning ratio (Column (6), Table III).
20
(ii)“External” Support:
The internal risk measure measured the likelihood that a bank will have to seek external
help in order to survive. Our second “external support” risk measure measures the likelihood
of receiving external support conditional on requiring external help. It is a binary variable that
captures whether a bank will receive help from outside sources such as the government and
owners in times of trouble. This measure can itself be divided in two parts. Fitch IBCA and
Capital Intelligence measure whether the state will support the bank in case of need. Whereas
Fitch IBCA also measures separately whether the owners and shareholders will support the
bank in times of need. Panel B compares how these two types of support vary across bank
type by regressing the external support (0/1) variable on bank-types and country risk ratings
as before. The results on government support from both Fitch IBCA and Capital Intelligence
show that government banks are 27% to 31% more likely to receive state support compared to
foreign banks, whereas private domestic banks do not receive the same preferential treatment.
The last column of Panel B shows that foreign banks are about 43% more likely than both
government and private domestic banks to receive help from their owners and shareholders in
case the bank runs into liquidity problems.
The results of Panel B give important insight into the governance structure of the three
bank-types that accounting numbers could not have. The management of both government
and foreign banks have external support in case they run into trouble. This can potentially lead
to a moral hazard problem where the management does not take adequate steps to minimize
risk because they know they will be bailed out in times of trouble. However, if the external
sources providing the support establish enough control mechanisms, such moral hazard can be
limited. Given that foreign banks have good quality loans and good internal ratings, they are
likely to have strong internal control mechanisms. One example of such control mechanisms
is limiting the bank management to only lend to publicly verifiable “hard information” firms.
We have already seen evidence in favor of such a possibility for foreign banks in the preceding
section. For the government banks on the other hand, it appears that there is no such control
mechanism in place, leading to moral hazard problems with the bank management. The soft
21
budget constraints make bank management lax about their risk exposure, leading to high
default rates and low internal risk ratings as noted earlier. Since private domestic banks do
not have an external source of support, they do not seem to suffer from this particular type of
moral hazard problem. This again is reflected in their high internal ratings, and lower default
rates.
(iii)“Overall” Risk:
Finally some rating agencies (Moody’s and S&P) report an overall measure of risk that
includes intrinsic risk, but also takes into account any external support the bank may receive
in case of liquidity or solvency problems. Panel C shows that once we look at the overall
risk, (i.e. taking into account the intrinsic risk, as well as the external support mechanisms),
there are no significant differences in the overall long-term deposit risk for the three types of
banks. Whereas its understandable that government banks would be rated as highly as foreign
banks after taking the external state support into account, its puzzling to find private domestic
banks also having the same overall risk rating as foreign banks. Table III showed that private
domestic banks have higher interest expense on deposits, and Table III and V showed that
they have similar quality loan portfolios as foreign banks. Then given the extra external help
for foreign banks, the overall rating of private domestic banks would have been expected to be
lower. That this is not the case is slightly puzzling.
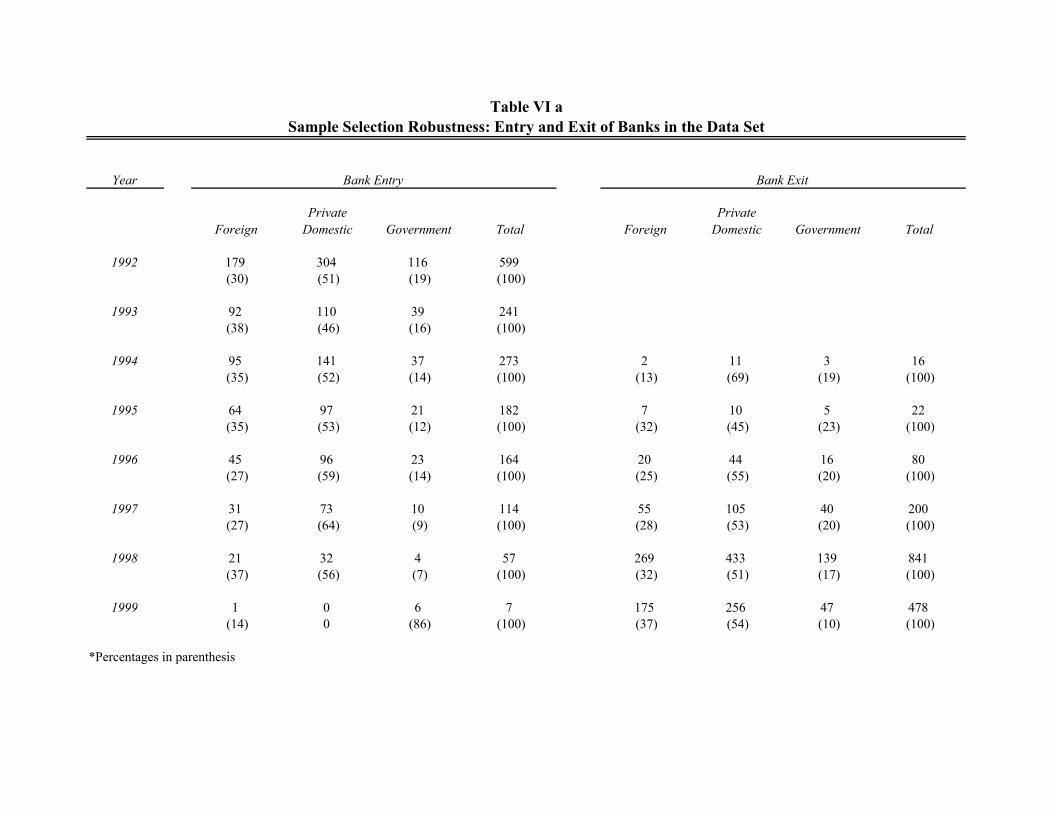
D. Robustness: Sample Selection
We alluded earlier to a possible sample selection problem as our panel is not balanced. Banks
enter and exit the data at different times during the sample period. The entry of banks is
mostly related to the fact that BankScope keeps on expanding its coverage of banks around
the world. The expanding coverage of banks in the data set should not by itself be a problem,
unless the expanding coverage is biased towards one particular ownership category. Table
VIa shows that the relative numbers of domestic and foreign banks entering over the years
remained approximately the same (50:30). The fraction of new entrants that are government
banks decreases slightly, which is to be expected as government often set up a few big banks and
22
bigger banks are likely to be included early on. Similarly, banks exit the data set at different
years. We do not know the exact reason for disappearance of banks. However, BankScope
officials say that the main reason is simply delay in compilation and entry of information from
these banks. Of course if a bank goes out of business or is merged with another bank, that
will also show up like an exit of the bank from our data set. As before, the main question of
interest is whether the exit of banks is correlated with ownership type. Table VIa shows that
this is not a major concern.
Finally we test how the entry and exit of banks is correlated with certain bank character-
istics such as size and age. Columns (1) and (3) in Table VIb show that, as expected, new
banks being entered into the data set are younger by about 4.6 years each additional year, and
significantly smaller (difference in logs of 0.21). However, as columns (2) and (4) show, there
is no differential economically significant effect of age or size by ownership category9. Entry
of foreign and private domestic banks does not differ significantly in terms of their age or size.
When we look at exit of banks from the data, we find that there are no significant correlations
with age (columns (5) and (6)). There is a difference with size, as bigger banks are likely to
exit later from the data set (column (7)). However, as column (8) shows, this correlation of size
with year of exit also does not vary by ownership type in an economically significant manner.
Since none of the variables correlated with sample selection differ by ownership type, sample
selection issues are unlikely to bias any of the coefficients reported in the paper.
III Interpreting the Differences
The previous section outlined the basic cross-sectional and time series differences between
foreign, private domestic, and government banks. In this section we first discuss the main
organizational and structural differences between the three types of banks, and then propose
an explanation based on those differences to account for the empirical observations in the
previous section. We will postpone the discussion of alternative potential explanations to the
9Even when the interaction with government banks is significant, the coefficients, 0.0083 and 0.0006, areeconomically insignificant compared to the “omitted” coefficients of -4.3 and -0.19 respectively.
23
next section.
A. Structural and Organizational Differences Between Foreign, Private Do-
mestic, and Government Banks
The main structural and organizational differences between the three types of banks are based
on the identity of who owns the cash-flow and control rights of the banks. Private Domestic
banks are privately owned and managed by domestic shareholders. This means that both cash
flow rights and control rights rest with the domestic shareholders of the bank. Foreign banks
are also privately owned and managed, but differ in a couple of critical ways with private
domestic banks. First, the cash-flow and control rights rest with foreign rather than domestic
shareholders. Second, unlike their local counterparts, foreign banks are typically part of a
larger chain of multi-national banks spread in different parts of the world. This separates
foreign banks from private domestic banks in terms of their hierarchical organizational design.
The longer distance between shareholders (typically residing in the west), and bank managers
(residing in emerging economies) for foreign banks implies that foreign banks have more layers
of bureaucracy between top management and local bank managers. Government banks on the
other hand are neither privately owned nor managed. The cash-flow rights (ownership) rest
with the tax-payers, and the control rights with government employees (bureaucrats) hired to
run the bank.
The differences in the structural design mentioned above can lead to important real dif-
ferences in the performance of banks. First, an obvious implication of private ownership is
that incentives to maximize profits are high for foreign and private domestic banks, while
being close to zero for government banks. For government banks such profit maximizing ob-
jectives are often replaced by other types of objectives such as political, “social” or corruption
maximization.
Second within private banks, the hierarchical structure of foreign banks may give them a
comparative disadvantage versus private domestic banks in utilizing “soft information”. As
we have already pointed out, foreign banks due to their multi-national nature have a larger
24
hierarchical structure than private domestic banks. Greater distance between ownership and
management in the case of foreign banks implies that management is controlled from a dis-
tance through a system of well-documented hierarchy. Rules concerning do’s and don’ts are
well-defined so that employees can be monitored and incentivized even at an arm’s length re-
lationship. Domestic banks on the other hand are more flexible in their organizational design.
Since they are managed and controlled locally, they can afford a more decentralized system of
governance where an individual manager is given more control and discretion. The basic theory
concerning this idea is well laid out by Stein (2002) in a recent paper. As the paper argues,
the fundamental constraint that a centralized and hierarchical structure like that of foreign
banks imposes is that they have to rely on “hard information” in making lending decisions. In
the context of banking, hard information includes a credible track record such as past sales,
revenue, exports etc. Domestic banks on the other hand have flatter organizational structures.
This (keeping everything else constant) allows top management and ownership to give a lot
more power in the hands of the local bank managers allowing them to use “soft information”
in making lending decisions as well.
“Soft information” is information that cannot be verified by anyone other than the person
who produces it. For example, a bank manager through repeated interviews with a young
firm manager might be convinced that the manager is a smart, honest and hard working
entrepreneur with a high probability of success. The ability to use such “soft information”
by domestic banks implies that private domestic banks are more likely to successfully lend to
“soft information” firms.
Should government banks be better at using soft information as well? The answer is likely
to be no. First, with a lack of incentives it is not clear whether government banks would use
any information at all. Second, even under the efficient government hypothesis, government
banks could also be organizationally-constrained to rely on hard information. The reason is
that formal checks and balances in a government organization can only work when punishments
and rewards are based on credible or hard information.
The third implication of differences in the ownership structure of the three banks may be
25
the strength of bank supervision. The strength of supervision of a bank depends both on the
capacity of the regulatory authority to monitor the bank, and also on the internal incentives
of a bank to be conservative. It is important to mention here that since the capacity of the
regulatory authority is fixed in a given country, our methodology of using country fixed effects
controls for any differences in the supervision of banks across countries. However, systematic
differences in the supervision of different bank types can still exist in the same country either
because of certain biases of the domestic regulatory authority, or because of differences in
self-supervision by banks. For example, within private banks, foreign banks may be more
tightly supervised than private domestic banks in an emerging economy because in addition
to the domestic regulatory authority, foreign banks are also subject to their “home” country
regulatory authority. Since the home regulatory authority resides in a developed country, it
could be more effective in enforcing prudential regulations. Foreign banks could therefore have
stricter monitoring than private domestic banks. Even if domestic and foreign banks faced the
same level of regulation, foreign banks may endogenously adopt more conservative banking
policies than domestic banks. The reason is that foreign banks because of their world-wide
reputation at stake, could face a larger cost of default in an emerging economy, compared to
domestic banks. For example, foreign banks often have a large network of branches outside
the emerging economy under question. If the bank takes too much risk through imprudent
banking in the developing country, leading to a bank failure or default, it can have large
negative consequences through reputation on its operations worldwide. Hence, anticipating
such higher cost of risky behavior, foreign banks may end up devising internal monitoring
mechanisms to curb their level of risk. Another reason for a more prudent behavior by foreign
banks can be understood in the context of the agency problem of bank owners trying to monitor
the level of risk taken by their managers. Suppose both foreign and domestic banks have the
same preference for adopting prudent behavior. However, they must incentivise their bank
managers for moral hazard reasons. For example, the bank manager might collude with a firm
to “loot” the bank. Foreign banks might be able to provide better incentives to managers
through promises of promotion to better “global” positions that domestic banks cannot offer
26
due to their limited scope in operations10. However, whether foreign banks are more strictly
supervised than private domestic banks in practice remains an empirical question. The reason
is that oversight from the domestic regulatory authority, coupled with endogenous reasons
for the private bank to maintain its reputation and hence access to future cash-flows may be
sufficient to guarantee equally tight supervision for private domestic banks.
Government banks on the other hand are likely to be the least tightly regulated. Govern-
ment banks have no incentives to self-regulate themselves in the absence of cash-flow rights.
Moreover, the hands of the domestic regulatory authority are heavily tied up when it comes
to dealing with government banks. For example, whereas a regulatory authority can credibly
threaten a private bank with the suspension of license, such threats are immaterial when it
comes to government banks.
B. Explanation based on Incentives and Information
The empirical results established in section II can now be understood in the light of the
structural differences between government, private domestic, and foreign banks mentioned
above. We begin by explaining the results on government banks.
The results showed that government banks are bigger, older, under-capitalized, and less
profitable relative to private banks in emerging markets. Moreover government banks have a
bigger proportion of bad loans, lower deposit cost, and are the least sensitive to macro-economic
shocks. This evidence sheds important light on the history, and behavior of government banks.
It shows that large banks have been set up and sustained by governments all over the world
for a long time. The fact that government banks have survived despite very low profitability
suggests continuos subsidies and “bail outs” by the governments to sustain these banks. The
results on government banks can thus be understood in the light of such government support,
10There is actually one argument that can go in the opposite direction of foreign banks taking on higher risks.The argument is that since foreign banks can diversify themselves better internationally, they will have a highercapacity of taking on more risk than domestic banks in a single emerging economy. However, this argument onlyapplies to the “good” type of risk, i.e. risk that leads to higher overall returns. The type of risk that regulationis most concerned with is the “bad” type of risk, such as looting or inefficiently low level of monitoring by thebank, which is the type of risk under question in this paper. In the empirical strategy that follows, we willexplicitly isolate the bad type of risk to focus on the regulatory aspect of banking.
27
coupled with the absence of private incentives as explained in the section before. The presence
of government subsidies allows government banks to operate without passing on any risk of
default to their depositors. Consequently government banks enjoy low deposit costs as seen
in our data. Moreover, the absence of private incentives, coupled with government subsidies
creates a serious moral hazard problem. Government bank managers have low incentives, or
“fear” to operate the bank efficiently, leading to high rates of default, and lending that does
not respond effectively to different types of economic shocks hitting the economy. In fact the
absence of cash-flow incentives, and hard budget constraints may even make the bank managers
corrupt or politically motivated in their lending decisions. There is direct evidence of this in
a paper by Dinc(2002) who, using a subset of the data used in this paper, shows that lending
by government banks is highly correlated to political or election cycles in these countries.
We next come to differences between private domestic and foreign banks. The two types
of banks have the same size and age on average, but differ in the allocation of their assets.
Private domestic banks tend to be more “aggressive” in their portfolio. They allocate a lower
proportion of their assets in liquid assets such as cash and government securities, and more in
loans. Moreover, the loans that private domestic banks give out earn a higher rate of return
without being significantly riskier than foreign banks. Foreign banks do make more money
from selling services than private domestic banks, and also enjoy a lower cost of deposits than
private domestic banks. However, despite these advantages, foreign banks have the same overall
profitability as private domestic banks. Finally, private domestic banks are a lot more sensitive
to “soft information” macro shocks compared to foreign banks that are more sensitive to “hard
information” shocks. In other words, whereas the overall size, age, and profitability of private
domestic and foreign banks looks very similar, the composition of assets and profitability is
very different across the two types of banks.
The differences in the composition of assets and profits of local and foreign banks, coupled
with differences in the relative sensitivities to soft and hard information shocks suggests that
the two types of banks cater to comparatively different market segments. The “aggressive”
lending by private domestic banks suggests that these banks have a higher willingness to expose
28
themselves to risk. However, private domestic banks still monitor their loans hard enough that
their overall default rates are only marginally (and statistically insignificantly) higher than
foreign banks. These empirical facts about the relative behavior of foreign and local banks can
be understood in light of the structural differences mentioned in the preceding section. First,
our results show the importance of private (cash-flow) incentives, coupled with hard budget
constraints. Since both private domestic and foreign banks have incentives to maximize profits,
and do not have access to government subsidies like government banks11, they are much more
successful than government banks in controlling their loan default rates.
Despite the similarity in lower default rates for private domestic and foreign banks, the
reason for the lower default rates can be very different for private domestic and foreign banks.
As pointed out in the discussion on structural differences, the management of foreign banks in
developing countries have access to “deeper pockets” of their parent bank. This can potentially
lead to problems similar to government banks where managers have access to the deeper pockets
of the government to bail them out. However, the difference is that keeping this potential
problem in mind, foreign banks are tightly controlled by their headquarters through a system
of close monitoring. Private domestic banks on the other hand do not have access to such deep
pockets. But private domestic banks are able to monitor themselves through market-discipline
from the deposit market. If private domestic banks start taking excessive risk, then in the
absence of significant deposit insurance, they will either lose future access to deposit markets
altogether, or their cost of deposits will increase. This threat of losing future cash-flows from
the banking business can force private domestic banks to monitor their risk closely.
IV Alternative Hypotheses
In the preceding section, we gave one particular explanation for the observed empirical facts.
We now discuss some alternative hypotheses, and why they do not do as good a job in explaining
the empirical observations.
11Here it is important to note that in most developing countries, explicit deposit insurance is either completelyabsent, or is only present to a small degree (see e.g. Barth et al (2001)).
29
A. Absolute Advantage for Foreign Banks
This simple theory states that foreign banks are uniformly better than private domestic banks
in all dimensions because of their experience, knowledge, and scope. However, this theory fails
to explain the very (persistent) existence of private domestic banks in developing countries.
There must be some comparative advantage, such as the soft-information advantage, for the
private domestic banks to survive in the face of competition.
B. International Diversification Advantage for Foreign Banks
A second potential theory that the descriptive statistics reject is the “risk diversification”
theory. This theory suggests that since foreign banks are better able to diversify international
risk due to their presence in a number of regions and countries, they should be better positioned
to take on riskier positions in a given country. However, the descriptive statistics fail to support
this theory as we find no evidence that foreign banks take on more risk than their domestic
counterparts.
C. Institutional Obstacles for Foreign Banks
Some emerging markets may limit the size and scope of foreign banks through legal and regula-
tory measures. For example, foreign banks may be limited in the number of branches they can
operate, or the share of market they can hold. Whereas this may be true in some countries, it
cannot explain why foreign banks fail to lend to high return firms, or why they mostly focus
on hard information clients.
D. Social Theory for Government Banks
The results for government banks showed that government banks are strongly protected by
the government, have high default rates, make losses on average, and are the least sensitive
to different types of shocks hitting the economy. We argued that these facts are reflective
of the poor incentives, moral hazard, and politicization of government banks. An alternative
explanation could be that the facts actually reflect the “social objectives” of the government.
30
For example, suppose that market failures in emerging economies, such as missing markets
or learning externalities, force the government to subsidize certain sectors such as education,
agriculture, and infant industries. In such a world, government banks will be subsidized by
the government, and will have high default rates and losses. They might even be insensitive to
macro shocks if government is providing insurance to those adversely affected by the shocks.
Whereas the social theory is a possibility, there is direct evidence that government lending
decisions are based on political rather than social criterion. A recent paper by Dinc (2002)
who uses a subset of our data on 22 countries, shows that loan forgiveness and restructuring of
old loans, and issuance of new loans increases more for government banks relative to private
banks during election years.
E. Related Lending By Private Domestic Banks
A concern with private domestic banks in emerging markets is that they may indulge in “related
lending”, defined as lending to family or close associates at loose terms and conditions12. The
fear is that such lending will lead to weaknesses in the banking system, and ultimately bank
failures. Whereas we have no direct way of checking the extent of related lending in the data,
since private domestic banks have low defaults according to accounting and ratings data it
suggests that related lending is not too serious an issue. It is important to keep in mind that
we may be missing the very small banks in emerging markets. The smallest banks may be
more likely to engage in related lending and other shady banking practices. However, even
if that is true, it is good news in the sense that it shows that banks engaging in blatant bad
practices, fail to attract large deposits and grow beyond a point.
V Concluding Remarks
The questions regarding optimal banking structure posed in the introduction can now be better
understood in the light of our results. There is no uniformly dominant organizational structure.
Each has its own strengths and weaknesses.
12See for example, La Porta et al (2002) on related lending in Mexico.
31
Foreign banks can bring a lot of advantages, the most important of which is perhaps their
ability to tap into external liquidity of their parent banks. This lowers the cost (risk) of deposits
and improves banking stability in emerging markets. However, the same advantage may turn
into a disadvantage on the lending side. The parent bank providing liquidity insurance, and
also having its capital at risk wants to guarantee prudent banking in the emerging market.
The layers of hierarchy and long distance communication necessitated by the natural distances
involved implies that the top management in the parent bank cannot give much discretion to
the local foreign bank. One of the ways to prevent discretion, as outlined in the theory of
organization literature, is to make the foreign banks only rely on “hard information”. This
however reduces the value of foreign banks for the economy as a whole, since one of the main
functions of banks is to utilize “soft information” which anonymous markets on their own
would not be able to13.
Private domestic banks do not have the advantage of foreign banks in terms of access
to external liquidity. This raises the concern, particularly in emerging markets with weak
regulation and legislation, that private domestic banks would be prone to “looting” leading
to banking crises and failures (see e.g. Akerlof and Romer (1993)). The hope however is
that market discipline in the form of the threat to loose deposit holders, and hence access to
future cashflows, if the bank misbehaves would be sufficient to tame the urge to “loot”. The
results of our paper show that there is hope for the market discipline mechanism to work.
Private domestic banks maintain strong market shares without excessive default rates like the
government banks. The view that it is the market discipline at work is further strengthened
from the ratings data which shows that private domestic banks, unlike government and foreign
banks, do not have any external support either from the government or from their shareholders.
Moreover, the fact that private domestic banks have a flatter hierarchical structure than foreign
banks, allows them to also lend based on “soft information”. The use of soft information
by private domestic banks shows their importance in forming relationship specific lending
alliances. Such alliances are essential for small and startup firms (see Berger and Udell (1995),
13For a role of banks as intermediaries acquiring information, see Diamond (1984) and (1991).
32
Petersen and Rajan (1994)), particularly in emerging markets with low levels of financial
development.
Government banks in contrast to the private banks get heavy support from their govern-
ments. This gives them access to low cost deposits despite having the worst performing loan
portfolio in the banking sector. However, even with the subsidized deposits, government banks
make losses on average. The results suggest that government involvement in the banking sec-
tor should be minimized much further than its current dominant position in many developing
countries. The benevolent “social” view of government banks is often not observed in practice,
and instead the effects of weak incentives, and political corruption seem to dominate. There
may still be legitimate grounds for government intervention in specific areas such as providing
subsidized loans for education and technology adoption. However, such grounds should be
viewed as exceptions rather than the rule.
33
References
[1] Aghion, Phillipe, and Jean Tirole, 1997, “Formal and real authority in organizations”,
Journal of Political Economy 105, 1-29
[2] Akerlof, G. and Romer, P. 1993. “Looting: The economic underworld of Bankruptcy for
profit”. Brookings Papers on Economic Activity, #2.
[3] Alchian, Armen and Harold Demsetz. 1972. “Production, Information Costs and Economic
Organization”, American Economic Review, Vol.62, 777-795.
** significant at 1%. * significant at 5%. ~ significant at 10%.
Table VRisk Ratings
Panel B: "External" Support (0/1)
Foreign Banks are the omitted category. All regressions include a constant, and also control for country risk rating. The intrinsic and overall risk ratings are numerical risk ratings divided by the standard deviation of the ratings. So coefficients can be read in units of standard deviation. Heteroskedasticity Robust Standard Errors reported.