International Co-operative Programme on Assessment and Monitoring of Air Pollution Effects on Forests (ICP Forests) Further development and implementation of an EU-level Forest Monitorng System (FutMon) Forest Condition in Europe 2011 Technical Report of ICP Forests and FutMon Work Report of the: Johann Heinrich von Thünen-Institute Institute for World Forestry
Transcript
International Co-operative Programme on
Assessment and Monitoring of Air Pollution
Effects on Forests (ICP Forests)
Further development and implementation of
an EU-level Forest Monitorng System
(FutMon)
Forest Condition
in Europe
2011 Technical Report of ICP Forests and FutMon
Work Report of the:
Johann Heinrich von Thünen-Institute
Institute for World Forestry
Johann Heinrich von Thünen-Institute
Federal Research Institute for Rural Areas, Forestry and Fisheries
4.3 DATA ........................................................................................................................................... 88
5.3 DATA ........................................................................................................................................... 98
Forests provide a wealth of benefits to the society but are at the same time subject to
numerous natural and anthropogenic impacts. For this reason several processes of
international environmental and forest politics were established and the monitoring of forest
condition is considered as indispensable by the countries of Europe. Forest condition in
Europe has been monitored since 1986 by the International Co-operative Programme on the
Assessment and Monitoring of Air Pollution Effects on Forests (ICP Forests) in the
framework of the Convention on Long-range Transboundary Air Pollution (CLRTAP) under
the United Nations Economic Commission for Europe (UNECE). The number of countries
participating in ICP Forests has meanwhile grown to 41 including Canada and the United
States of America, rendering ICP Forests one of the largest biomonitoring networks of the
world. ICP Forests has been chaired by Germany from the beginning on. The Institute for
World Forestry of the Johann Heinrich von Thünen-Institute (vTI) hosts the Programme
Coordinating Centre (PCC) of ICP Forests.
Aimed mainly at the assessment of effects of air pollution on forests, ICP Forests
provides scientific information to CLRTAP as a basis of legally binding protocols on air
pollution abatement policies. For this purpose ICP Forests developed a harmonised
monitoring approach comprising a large-scale forest monitoring (Level I) as well as a forest
ecosystem forest monitoring (Level II) approach laid down in the ICP Forests Manual. The
participating countries have obliged themselves to submit their monitoring data to PCC for
validation, storage, and analysis. The monitoring, the data management and the reporting of
results used to be conducted in close cooperation with the European Commission (EC). EC
co-financed the work of PCC and of the Expert Panels of ICP Forests as well as the
monitoring by the EU-Member States until 2006.
While ICP Forests - in line with its obligations under CLRTAP - focuses on air
pollution effects, it delivers information also to other processes of international environmental
politics. This holds true in particular for the provision of information on several indicators for
sustainable forest management laid down by Forest Europe (FE). The monitoring system
offers itself for being further developed towards assessments of forest information related to
carbon budgets, climate change, and biodiversity. This is accomplished by means of the
project “Further Development and Implementation of an EU-level Forest Monitoring System”
(FutMon). FutMon is carried out from January 2009 to June 2011 by a consortium of 38
partners in 23 EU-Member States, is also coordinated by the Institute for World Forestry of
vTI, and is co-financed by EC under its Regulation “LIFE+”. FutMon revises the monitoring
system in close cooperation with ICP Forests. It establishes links between large-scale forest
monitoring and National Forest Inventories (NFIs). It increases the efficiency of forest
ecosystem monitoring by reducing the number of plots for the benefit of a higher monitoring
intensity per plot. This is reached by means of a higher number of surveys per plot and newly
developed monitoring parameters adopted by ICP Forests for inclusion into its Manual.
Moreover, data quality assurance and the database system are greatly improved.
Given the current cooperation between ICP Forests and FutMon, the present Technical
Report is published as a joint report of both of them.
Forest Condition in Europe 2011
19
2. Quality Assurance and Quality Control within the monitoring
system
Marco Ferretti1, Nils König
2, Oliver Granke
3, Nathalie Cools
4, John Derome(†)
5, Kirsti Derome
5, Alfred Fürst
6,
Friedhelm Hosenfeld7, Aldo Marchetto
8, Volker Mues
3
2.1 The overall quality assurance perspective
The need for a comprehensive Quality Assurance (QA) programme in ecological
monitoring has been reported several times (e.g. Crumbling, 2002; Ferretti, in press; Ferretti,
2009). Since 2007 a concept for a new QA perspective has been developed and implemented
within the ICP Forests (Ferretti et al., 2009). This concept includes four main pillars: (i) the
revision and harmonization of the Standard Operative Procedures (SOPs, i. e. the Manual);
(ii) a new set of Data Quality Requirements (DQRs), explicitly incorporated in the SOPs; (iii)
an extended series of training sessions and (iv) inter-comparison rounds. The SOPs have been
revised in 2009 and 2010 with the support of the Life+ FutMon project, and this process has
resulted in the comprehensive revision of the ICP Forests Manual (ICP-Forests 2010). One of
the main aims of this revision process was to identify DQRs for a series of key monitoring
variables covering all the investigations carried out within the ICP Forests. For such variables,
DQRs have been identified in terms of Measurement Quality Objectives (MQOs) and Data
Quality Limits (DQLs). MQO is the expected level of precision/accuracy for individual
observations; DQL is the minimum acceptable frequency of observation that should be within
the MQOs.
This comprehensive QA approach resulted in a much higher share of variables for
which data quality requirements have been specified (Fig. 2-1). ICP Forests measurements
cover approximately 260 different variables. Prior to the FutMon project and the manual
revision, the share of variables covered by DQRs was 33%. Afterwards, the coverage was
extended to 66% of the variables. In practical terms, it means that it is now possible to
document and report on data quality for 2/3 of the variables measured within the ICP Forests.
It is worth noting that – besides laboratory measurements that were traditionally given more
attention with respect to data quality (see below) – field measurements like tree condition,
ground vegetation, litterfall, ozone injury, tree growth and phenology are now covered by
explicit DQRs.
1 TerraData environmetrics, Via L. Bardelloni, 58025 Monterotondo M.mo, Italy
2 Northwestern German Forest Research Station, Graetzelstrasse 2, D-37073 Goettingen, Germany
3 Johann Heinrich von Thünen-Institute (vTI), Federal Research Institute for Rural Areas, Forestry and Fisheries,
Institute for World Forestry, Leuschnerstraße 91, D-21031 Hamburg, Germany 4 Research Institute for Nature and Forest, Gaverstraat 4, B-9500 Geraardsbergen, Belgium
5 Finnish Forest Research Institute, Rovaniemi Research Unit, Box 16, FI-96301 Rovaniemi, Finland,
6 Federal Research and Training Centre for Forests, Natural Hazards and Landscape, Seckendorff Gudent Weg 8,
A-1131 Vienna, Austria 7 DigSyLand – Institute for Digital System Analysis & Landscape Diagnosis, Zum Dorfteich 6, D-24975 Husby,
Germany 8 National Research Council, Insitute for Ecosystem Study, Largo Tonolli 50, I-28922, Verbania, Italy
Forest Condition in Europe 2011
20
0%
20%
40%
60%
80%
100%
Tre
e c
onditio
n
(22)
Gro
und v
egeta
tion
(16)
Litte
rfall
(33)
Ozone inju
ry (
6)
Mete
oro
logy (
13)
Tre
e g
row
th (
16)
Tre
e p
henolo
gy
(13)
Soil
(83)
Folia
r (2
9)
Depositio
n (
26)
Am
bie
nt
air (
8)
Tota
l (2
65)
Vari
ab
les w
ith
DQ
R
Survey (number of assessed variables)
Figure 2-1: Frequency (%) of variables with (black) and without (white) DQRs before (top) and after
(bottom) the development of the new QA approach and the revision of the ICP Forests Manual carried
out within the FutMon project.
However, a sound data quality concept must go beyond the metrological quality of the
data (i.e. the quality of measurements, which is of course important – see below) and should
address all the steps before and after the measurements (Crumbling, 2002). While the steps
after the measurements are being considered by the database managers, quality issues related
to sampling in the field need to be tackled in the near future. This will be a further, major step
ahead in promoting the overall data quality within the ICP Forests.
2.2 Quality improvement in the laboratories
The Working Group on Quality Assurance and Quality Control in Laboratories was
installed within the ICP Forests in the year 2004 in order to improve the comparability and
evaluability of the analytical data of the ICP Forests program and later also of the FutMon
project. The aims of this group are
Forest Condition in Europe 2011
21
the evaluation of analytical methods used in terms of their comparability and
acceptability and the elimination of unqualified methods
the amendment of the ICP Forests Manuals with information on methods for sample
pretreatment and analysis
the development and introduction of new methods for quality control in the
laboratories
the organization of practical help for laboratories with analytical problems and
the organization of ring tests to control the development of quality in the laboratories.
After several years of work the analytical parts of the ICP Forests manual have been
totally revised and unqualified methods have been eliminated. A review of possible checks
and other helps for quality assurance and control in laboratories has been compiled and
published. Two meetings of the heads of the laboratories have been organized to exchange
analytical knowledge and discuss analytical problems and possible solutions. A helping
program for laboratories with problematic ring test results has been organized with bilateral
visits of the laboratories and active help. In the meantime 10 laboratories have made use of
this possibility with great success. The use of reference methods, different quality checks like
control charts or ion balance calculations and the participation in ring tests has become
mandatory within the ICP Forests program and the FutMon project. Nowadays, each
laboratory involved in the program has to send filled quality forms with information on
methods used, on quantification limits, use of control charts and ring test results when
submitting analytical data to the ICP Forests database.
The most important step to improve quality assurance and control was the introduction
of regular ring tests for water, soil and plant samples. It is worth noting that, before the
installation of the Working Group, such ringtests had been conducted only on an irregular
basis. In the meantime 6 soil, 4 water and 12 foliar ring tests have been organized within the
ICP Forests program and the FutMon project. The results of these ring tests show the
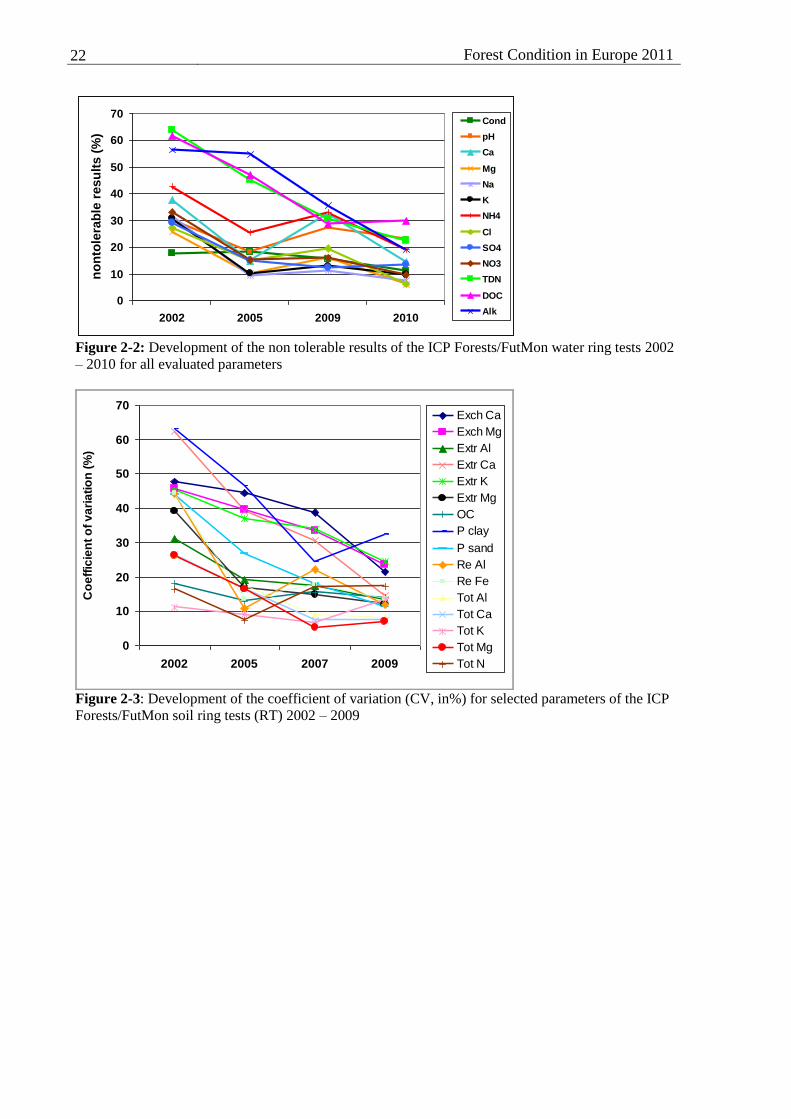
development of data quality in the laboratories. In water ringtests, the percentage of results
outside the tolerable limits has been reduced from 20-60% to 5-30% over 8 years (Fig. 2-2). A
similar improvement can be seen for the results of the last 4 soil ring tests (Fig. 2-3): the
coefficient of variation (CV in %) for the results of all participants has been reduced from 15-
65% to 10-35% over 7 years. For the foliar ring tests (Fig. 2-4) only 3-10% of the results were
beyond the tolerable limits already in 2005. This excellent level has been maintained in the
following five tests.
Ring test results suggest a lower comparability and quality of the soil analysis data as
compared to water and plant analysis data. One reason may be that soil analyses are regularly
carried out in much longer intervals; another reason is that the soil matrix is much more
complex to analyse. In contrast to water and foliar analysis, element analyses do not concern
total analyses but fractions, which are much more difficult to measure accurately. And the soil
analyses mostly are of two steps (e.g. digestion or extraction and measurement) which in turn
double possible mistakes. But it is obvious that as well the quality of water analyses can still
be improved. Therefore regularly ring tests are still important for the improvement of the
quality of analyses in the ICP Forests programme.
Forest Condition in Europe 2011
22
0
10
20
30
40
50
60
70
2002 2005 2009 2010
no
nto
lera
ble
res
ult
s (
%)
Cond
pH
Ca
Mg
Na
K
NH4
Cl
SO4
NO3
TDN
DOC
Alk
Figure 2-2: Development of the non tolerable results of the ICP Forests/FutMon water ring tests 2002
– 2010 for all evaluated parameters
0
10
20
30
40
50
60
70
2002 2005 2007 2009
Co
eff
icie
nt
of
va
ria
tio
n (
%)
Exch Ca
Exch Mg
Extr Al
Extr Ca
Extr K
Extr Mg
OC
P clay
P sand
Re Al
Re Fe
Tot Al
Tot Ca
Tot K
Tot Mg
Tot N
Figure 2-3: Development of the coefficient of variation (CV, in%) for selected parameters of the ICP
Forests/FutMon soil ring tests (RT) 2002 – 2009
Forest Condition in Europe 2011
23
0
5
10
15
20
25
2001 2002 2003 2004 2005 2006 2007 2008 2009 2010
no
n t
ole
rab
le r
esu
lts
(%
).S
P
Ca
Mg
K
N
Figure 2-4: Development of the non tolerable results of the ICP Forests/FutMon foliar ring tests 2001
- 2010 for the mandatory parameters (foliage samples)
2.3 Quality control in the data base
Co-financed by the FutMon project, a new web-based system for data submission,
storage, dissemination and evaluation was set up in the years 2009 and 2010. Central data
management is an essential tool to control and document data quality. Only by means of
comprehensive validations and consistency checks improved data quality can be achieved and
fully documented: this facilitates extensive and effective data evaluations for project partners
and third parties. A wide range of validation rules help to control data compliance and
conformity using online and real-time checks. In addition, the newly designed system offers
an administration area including functions to monitor data submission processes, to inspect
and compare the managed data using tables, digital maps as well as diagrams.
In the database, three modules support data analysis and checks after import. These are
compliance, consistency and uniformity checks which are subsequently applied (Fig. 2-5)
(Durrant Houston and Hiederer, 2009).
Figure 2-5: Subsequent application of data checks
Forest Condition in Europe 2011
24
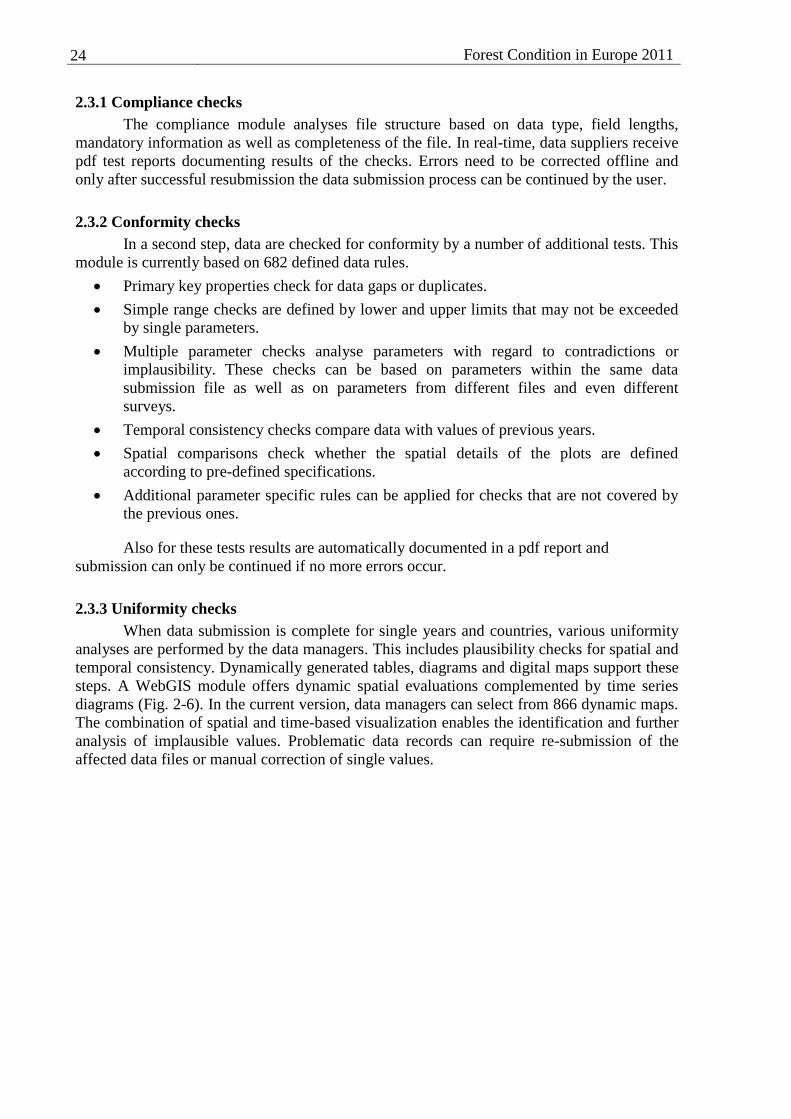
2.3.1 Compliance checks
The compliance module analyses file structure based on data type, field lengths,
mandatory information as well as completeness of the file. In real-time, data suppliers receive
pdf test reports documenting results of the checks. Errors need to be corrected offline and
only after successful resubmission the data submission process can be continued by the user.
2.3.2 Conformity checks
In a second step, data are checked for conformity by a number of additional tests. This
module is currently based on 682 defined data rules.
Primary key properties check for data gaps or duplicates.
Simple range checks are defined by lower and upper limits that may not be exceeded
by single parameters.
Multiple parameter checks analyse parameters with regard to contradictions or
implausibility. These checks can be based on parameters within the same data
submission file as well as on parameters from different files and even different
surveys.
Temporal consistency checks compare data with values of previous years.
Spatial comparisons check whether the spatial details of the plots are defined
according to pre-defined specifications.
Additional parameter specific rules can be applied for checks that are not covered by
the previous ones.
Also for these tests results are automatically documented in a pdf report and
submission can only be continued if no more errors occur.
2.3.3 Uniformity checks
When data submission is complete for single years and countries, various uniformity
analyses are performed by the data managers. This includes plausibility checks for spatial and
temporal consistency. Dynamically generated tables, diagrams and digital maps support these
steps. A WebGIS module offers dynamic spatial evaluations complemented by time series
diagrams (Fig. 2-6). In the current version, data managers can select from 866 dynamic maps.
The combination of spatial and time-based visualization enables the identification and further
analysis of implausible values. Problematic data records can require re-submission of the
affected data files or manual correction of single values.
Forest Condition in Europe 2011
25
Figure 2-6: WebGIS module
2.3.4 Experience with improved data base system
Within the monitoring programme the acceptance by the users was very high so that
data acquisition and data quality could be improved. Immediate feedback from compliance
and conformity checks has proven essential in order to fix data errors promptly and to
increase the motivation of data suppliers. Time necessary for data transmission has been
considerably reduced. With the new system, legacy data from previous monitoring years were
checked as well and numerous inconsistencies in existing legacy data were detected and
corrected.
2.4 References
Cools, N. and De Vos, B. 2010. 6th
FSCC Interlaboratory Comparison 2009. Rapporten van
het Instituut voor Natuur- en Bosonderzoek 2010 (INBO.R.2010.4). Instituut voor
Natuur- en Bosonderzoek, Brussel.
Crumbling D. In search of representativeness: evolving the environmental data quality model.
Quality Assurance 2002; 9: 179-190.
Durrant Houston T., Hiederer R., 2009. Applying Quality Assurance Procedures to
Environmental Monitoring Data: a case study. J. Environ. Monitor., 11, 774-781.
Ferretti M. (in press). Quality Assurance: a vital need for Ecological Monitoring. CAB
Reviews: Perspectives in Agriculture, Veterinary Science, Nutrition and Natural
Resources.
Ferretti M. Quality Assurance in ecological monitoring—towards a unifying perspective.
Journal of Environmental Monitoring 2009; 11: 726 – 729
Ferretti M, König N, Rautio P, Sase H. Quality Assurance in international forest monitoring
programmes: activity, problems and perspectives from East Asia and Europe Annals
of Forest Sciences 2009; 66: 403-415
Fürst A., 2010: 12th Needle/Leaf Interlaboratory Comparison Test 2009/2010. Further
Deveropment and Implementation of an EU-Level Forest Monitoring System -
Futmon. Technical
Forest Condition in Europe 2011
26
ICP Forests. Manual on methods and criteria for harmonized sampling, assessment,
monitoring and analysis of the effects of air pollution on forests. UNECE ICP Forests
Programme Co-ordinating Centre, Hamburg; 2010.
Report LIFE-QA-RFoliar10 in Cooperation with the International Cooperative Programme on
Assessment and Monitoring of Air Pollution Effects on Forests (ICP Forests). ISBN
978-3-901347-89-4, BFW, Vienna: 30 pp.
Marchetto, A., R. Mosello, G. Tartari, J. Derome, K. Derome, N. König, N. Clarke & A.
Kowalska. 2009: Atmospheric deposition and soil solution, Working Ring Test 2009.
Laboratory ring test for deposition and soil solution sample analyses for the
laboratories participating in the EU/Life+ FutMon Project. Report CNR-ISE, 04-09: