Ce travail a bénéficié d'une aide de l'Agence Nationale de la Recherche dans le cadre du programme SYSTERRA, portant la référence ANR-08-STRA-13 Forest Conservation & Payment for Environmental Services: Perceptions and Practices in the Buffer Zone of La Amistad Biosphere Reserve, Costa Rica Pascale Schuit (Wageningen University) Jean-Francois Le Coq (CIRAD / UMR ART-Dev) Fernando Saenz-Segura (UNA / CINPE) Document de travail n° 2011-08 Avec le soutien de :
Transcript
Ce travail a bénéficié d'une aide de l'Agence Nationale de la Recherche dans le cadre du programme SYSTERRA, portant la référence ANR-08-STRA-13
Forest Conservation & Payment for Environmental Services: Perceptions and Practices in the Buffer Zone of La Amistad Biosphere Reserve, Costa Rica Pascale Schuit (Wageningen University) Jean-Francois Le Coq (CIRAD / UMR ART-Dev) Fernando Saenz-Segura (UNA / CINPE) Document de travail n° 2011-08
Avec le soutien de :
2
Forest Conservation & Payment for Environmental Services: Perceptions and Practices in the Buffer Zone
Pascale Schuit (Wageningen University) Jean‐Francois Le Coq (CIRAD / UMR ART‐Dev)
Fernando Saenz‐Segura (UNA / CINPE)
Working Paper SERENA 2011/ 08
July 2011
of La Amistad Biosphere Reserve, Costa Rica
3
Table of Content Table of Content ......................................................................................................................... 3 Introduction ................................................................................................................................ 4 1 –PES between conservation and poverty alleviation .............................................................. 5 1.1. PES in Costa Rica .......................................................................................................... 5 1.2. Conservation and poverty ........................................................................................... 6 1.3. PES, poverty and conservation motivation ................................................................. 7
2 ‐ Methodology and data collection ......................................................................................... 8 2.1. La Amistad biosphere reserve ......................................................................................... 8 2.2. Sampling and data ........................................................................................................... 9
3 – Household perception on ES and participation to PES program ......................................... 9 3.1. Household perception of ES notion in the Buffer Zone of LABR ..................................... 9 3.2 Household participation to PSA program in the Buffer Zone of LABR ........................... 10 3.3 Efficiency of PES ......................................................................................................... 12
4 – Households perception and relationships with the “la Amistad” international park ........ 12 4.1 Household perception of the advantages of park proximity ......................................... 12 4.2 Household perception on nature conservation ............................................................. 13 4.3 Household perception on disadvantage of park proximity ........................................... 14 4.4. Final consideration ........................................................................................................ 16
5‐ Households rational of forest conservation practices ......................................................... 17 5.1 Factors influencing conservation practice decision choice of household ..................... 17 5.2 Relation between types of income and forest conservation practice ........................... 20
Conclusion ................................................................................................................................ 22 References ................................................................................................................................ 25 Appendix I: Study Design and method ..................................................................................... 28 Appendix II: Original answers in Spanish: “Que entiende Ud por un servicio ambiental?” .... 30
4
Introduction Tensions between agricultural and rural development on one side and conservation on the other side are a current issue of sustainable development. To foster conservation, Payment for Environmental services (PES) is considered as an innovative mechanism. The development of the PES mechanism has raised many debates in the literature regarding its effectiveness, efficiency and impacts on the poor (Wunder et al., 2008). Costa Rica is considered as a pioneer country in implementing a national program of PES, called programa de Pago por Servicios Ambientales (PSA) since 1997. This PES has been well studied leading to contradictory results in term of efficiency, effectiveness, and impacts on the poor (Le Coq et al. 2001; Daniels et al; 2010; LeGrand et al., 2009). Wunder (2008) stated that in general poor service providers have access to PES and generally become better of from participation. Thatcher et al., (1997) investigating participation in reforestation programs in Costa Rica, found that participating households had larger farm sizes, faced on‐farm labour constraints, are more depended on off‐farm income sources, are more dedicated to land‐extensive agricultural activities, and had more extensive contact with local extension officers. Zbinden and Lee (2005) conducted a similar study; their econometric analysis shows that farm size, human capital and household economic factors, and information variables significantly influence participation in PSA program alternatives. Moreover, they conclude that large farmers and forest owners are disproportionately represented among program participants. Authors argue also that beyond the established contractual obligations, PESP effects can also be assessed looking at its capacity to make social norms and values regarding forest conservation evolve. Hartshorn et al. (2005) argue that PES contracts may contribute to environmental protection indirectly by making the social norms and preferences of the participants more conservation‐oriented, thanks in particular to the institutionalization of the recognition of ES value. This perception change of forest ecosystems has been noticed by several studies (Locatelli et al, 2008; Miranda et al, 2003; Ortiz et al, 2003) but none of them have used a test group constituted of non‐participants to the PESP in order to isolate the effects of the PESP. According to Ortiz et al. (2003), 95% of the beneficiaries of the interviewed think that the program (PESP‐Protection) has taught the people to value the forest and 93% think that thanks to PESP, landowners are more concerned than before the program about the maintenance of forest, water, fauna and flora. The PESP does not explicitly provide conservation education materials to participants, but some intermediary organizations in the framework of the PESP have played a key role in spreading environmental information and education. Sanchez‐Azofeifa et al., (2007) and Pfaff et al. (2008) stated that PSA had only a very small impact on 1997‐2000 deforestation rates. They suggested that reduction in deforestation can be attributed to prior conservation policies. On the other side, Robalino et al. (2011) stated that PES between 200‐2005 had a significant effect in reducing deforestation. Nevertheless, authors stated that there is room for improvement in the efficiency of PSA (Robalino, 2011; Pagiola, 2007). Our study contributes to this body of literature by addressing perceptions and explicative factors of forest conservation practices of inhabitants in a peculiar zone of Costa Rica, the buffer zone of La Amistad National park in Brunca region of Costa Rica, characterized by a low development index.
5
In the first part, we present the current system of PSA in Costa Rica and main results from studies. In the second part, we present our methodology. In the third section, we analyze the perception of households on environmental services and their participation to the PSA program. In the fourth section, we analyze the perception of the household regarding the park. In the fifth section, we explore the decision rational of the households regarding forest conservation practices. 1 –PES between conservation and poverty alleviation Costa Rica has developed policies to maintain its national resources. Costa Rica has been very proactive in conserving its natural resources by establishing national parks and other conservation areas (Steinberg, 2002) . To complement its policy and compensate forest landowner for their effort to conserve forest, the PESP has been implemented since 1997 (Pagiola, 2002 and 2008). One of the objectives of the PES was to consolidate the conservation practices inside protected areas, buffer zones and private holdings, and thus, to consolidate a national conservation policy. Moreover, even if it is not a genuine objective of PESP, its socio‐economic impact is one of the main justification to its legitimacy. 1.1. PES in Costa Rica According to Russo and Candela (2006), an environmental service can be defined as: “a set of benefits generated for society by the existence and dynamic development of natural resource or eco‐systems (Russo and Candela, 2006:3)”. Four main types of environmental services are defined in the Costa Rican Forestry Law 7575 (Pagiola, 2007):
Forestry Law 7575 was a main step forward in conservation since it not only recognizes environmental services provided by forest ecosystems, but it also provides the legal and regulatory basis to contract with landowners for the environmental services provided by their land. The law established a governance structure and an institution in charge of raising fund and managing the PSA, the Fonafifo (Fondo Nacional de Financiamiento Forestal). The law also establishes a financing mechanism for this through earmarked oil tax. Thus, by providing a financial compensation to landowner that engage in reforestation or forest protection, the law created an incentive to preserve environmental services generated by forest and forest plantation ecosystems. Funding sources are a tax on fossil fuels, revenues from hydroelectric companies that benefit from watershed services, loans and grants from international cooperation organizations, and private funding from private enterprise captured by Fonafifo due to environmental corporative responsibility. Costa Rican PES program support various types of activities: reforestation, conservation, sustainable management, agro‐forestry system, natural regeneration (Daniels, 2010, Pagiola, 2008). Nevertheless, the main support has been given to conservation modality that represents 80 % of the contracted area and 70% of the funds (Le Coq et al., 2011).
6
Since 2003, Fonafifo have the whole responsibility of the implementation of the PESP and a national priority system was put in place following the Gruas I evaluation report (Le Coq et al, 2011; Robalino et al, 2011). This priority system set 5 criteria : 1) areas inside biological corridors; 2) projects which have expired contract from prior years, 3) forest areas that function as watershed protection, 4) private areas inside protected areas, 5) within this criteria, priority is given to those districts with a social development index below 40% (Robalino et al., 2011). This institutional change and priorization mechanism enabled to improve PES efficiency on deforestation (Robalino et al., 2011). 1.2. Conservation and poverty The relation between biodiversity conservation and poverty alleviation is contested (Redford and Sanderson, 2003). Bennett’s (2010) annotated bibliography concludes that studies have shown that protected areas can have a number of positive social, physical, environmental, and economic benefits for neighbouring communities (Koziell, 2001; Murphey & Roe, 2004; Naughton‐Treves et al., 2005; Leisher et al., 2007; Coad et al., 2008; Cohen et al., 2008 in Benett, 2010). Yet, studies have also shown that protected areas can have a negative impact on local communities such as, restricted access to natural resources, changes in land tenure, conflicts with wildlife, cultural decline and, social impacts from tourism (Vaughan and Katjiua, 2003; Murphey et al., 2004; Coad et al., 2008 in Bennett, 2010) While the park creates potential economic benefits, conventional wisdom says that taking away resources, such as farmland and forests, aggravates poverty. This might lead to a vicious circle since the poor are less likely to invest in environmental conservation (Holden et al., 1998). Reardon and Vosti (1995:1504) state that: “In the short term, reducing poverty will not necessarily protect the environment, nor will protecting the environment necessarily alleviate poverty”.
A recent study, by Andam et al. (2010) showed that the opposite is true for Costa Rica and Thailand. Here, protected areas reduced poverty.
The eradication of poverty and conservation of biodiversity are two distinct objectives, driven by different moral agenda’s. Yet, there is considerable overlap in practice (Adams et al., 2004). Wunder (2001) suggest that there are few “win–win” options between forest conservation and poverty alleviation.
Nature conservation, for example in the form of national parks, or otherwise, via forest reserves, wildlife corridors, etc., has been going on for a long time in Costa Rica. Today almost one fourth of Costa Rica’s total territory is protected area. The created national parks provide a large number of environments services such as fresh air and water to the inhabitants of Costa Rica. It also created a positive, green, and clean image for Costa Rica. As the official tourism slogan states: “Costa Rica: no artificial ingredients”. This attracts large numbers of (eco‐) tourists. However, often these parks or certain aspects of these parks are conflicting with other types of economic use of the natural resources involved such as land, water, forest, plants and animals.
7
1.3. PES, poverty and conservation motivation
Wunder (2008) stress that even PES is a conservation oriented instrument, they could have side objectives, including poverty reduction. Thus many scholars have tried to identify effects of PES on poverty reduction. Grieg‐Gran et al. (2005) stated that markets for ecosystem services can affect the poor in the following ways: 1) As buyers/users of ecosystem services; 2) As employees of operations producing ecosystem services; 3) As users of natural resources affected by a market initiative; or 4) Through more indirect effects e.g. the impacts of changing land use on food prices, rural wages or the multiplier effects of local purchases. Authors had discussed both access and participation of the poor, and direct and indirect effects on the poor. Both questions are controversial (Le Coq et al; 2011). Regarding PES access and participation, studies showed limited access to poor people in the PES scheme in Costa Rica (Zbinden, 2005), whereas studies of PESH‐Mexico show an important participation of marginalized population centers (Munoz‐Pina et al, 2005). The main problems that limit small farmers to access PES are currently the lack of information, lack of land title, and administrative capacity to comply with requisites (Pagiola et al, 2005). Regarding, direct and indirect effects on the poor, Locatelli et al (2008), in Costa Rica, showed that the impact of PES reforestation on the poorest landowners (small farmers and working class landowners) was notably positive in most dimensions (cultural, institutional), except income, and that this impact was generally higher for small landowners than for upper class landowners. Moreover, the strongest positive impacts were for landowners applying to the PES through a local NGO.
Comparing Label and PES mechanism, Le Coq et al (2011) highlights limits of both mechanisms in terms of effects on poverty alleviation. As the poor are characterized by limited endowments and access to key factors on which PES payment is calculated, the level of payment is limited. Received payments by small holders in PES schemes are limited due to restricted land tenure. In both mechanisms, intermediary organizations (forestry or producers organizations, NGO, cooperatives or associations) are key actors in facilitating small farmers’ access to the mechanisms. Moreover, institutional frameworks, such as land tenure policy (especially for PES program), is crucial. Better targeting is most commonly proposed to specifically improve both access and impact to the poor, especially for PES mechanism (Locatelli et al 2008). Nevertheless a trade‐off should be found between poverty and conservation objectives (Kosoy et al 2007). Finally, literature review revealed limited studies that made integral evaluations of the effects on poor farmers including indirect effects (labor, etc.) and comprehensive effects (including all types of capital that affect livelihood conditions of the local population).
2 - Methodology and data collection To analyze the relationship between conservation areas, PES and poverty alleviation, we conducted a study at household level in the buffer zone of the La Amistad Biosphere Reserve (LABR) – (figure 1). Figure 1 : La Amistad Biosphere Reserve (LABR) and localization of the studies communities
2.1. La Amistad Biosphere Reserve La Amistad Biosphere Reserve (LABR) is a bi‐national park situated in Costa Rica and Panama (figure 1). In Costa Rica LABR accounts for 32% of total national park area, 15% of all wild life refuge and 4% of Costa Rica’s total territory. In 1982, UNESCO declared the area an International Biosphere Reserve. The goal of a biosphere reserve is to achieve a sustainable balance between conserving biological diversity, economic development and maintaining cultural values. In 1983, just one year later, UNESCO recognized Amistad as a World Heritage Site. A World Heritage Site is of “outstanding value to humanity”. This is certainly true for LABR; the park has an impressive flora and fauna. Moreover, the park is unique, because of its biodiversity, significant altitude changes, climatic variation, and its location on the land bridge between South and North America. Nine of Costa Rica’s 12 life zones exist in LABR.
8
9
The Talamanca Mountains contain the largest remaining natural forest in Central America and levels of endemism are high. LABR contains 10,000 vascular and 4,000 non vascular plant species, 400 species of birds, 215 species of mammals, 263 species of amphibians, reptiles, and 115 species of fish. In addition, endangered species such as the great green macaw, osprey, and the harpy eagle live in LABR (Clark, Dixon et al. 2006).
La Amistad Biosphere Reserve consists out of several protected areas of which La Amistad National Park is the largest (SINAC 2009). In the buffer zone of the park we selected 6 communities along the eastern frontier of the La Amistad National Park (figure 1).
2.2. Sampling and data In each community, we developed the following protocol. First, a focus groups meeting was organized with the support of local organization to identify the main evolution of the communities and its mains characteristics. Secondly, direct interviews to households were carried out. Without the availability of a previous list of households, we selected the households using snowballing methods. The survey questionnaire consists in qualitative and quantitative information. Especially, we were asking about the perception of the households on the parks (limits and advantages), on Environmental issue and environmental services. We also asked then socio economic information such as family structure, activities, land and assets, and incomes. A total of 107 households in 6 communities of the western part of the PILA were interviewed from January to April 2010. The survey sample covers in total 476 Persons and 171 parcels and plots.
During field work, all data was entered on the spot into Excel spread sheets and later converted into SPSS 17.0, with which the data analysis has been made.
Preliminary results of the analysis have been presented in a workshop in Heredia in June 2010. We returned to the villages of Biolley, Santa Rosa, Santa María and Agua Caliente to present preliminary findings and to discuss their relevance and validity for the communities In July 2010 (for more detail see annex 1).
3 – Household perception on ES and participation to PES program In this first part, we analyze the perception of interviewed households on their perception on ES and their participation to PES program. 3.1. Household perception of ES notion in the Buffer Zone of LABR De Camino et al. (2000) concludes in a World Bank Report that payment for environmental services is not well understood by Costa Rican citizens, members of government, or bilateral or multilateral organizations. Nevertheless, this statement was done few years after the implementation of PSA program (1997). We tend to capture the actual perceptions of the ES notion by households in rural area of the LABR.
10
We asked respondents “what does an environmental service is in your opinion”. Indeed, 36,4% of our respondents could not give an answer to this question. The concept of an ES and possible compensation for the provision of ES is unknown by almost 1/3 of our sample. 13,1% referred in their answer to services such as water, oxygen, scenic beauty that are provided by nature to the human population. 35,5% of the respondents referred in their answer to a service that humans can provide to nature. Key words in the answers where protect, conserve, and to take care of nature. 7,5 % of the respondents mentioned that it is a financial compensation for the provision environmental services. 8,4% contested something else (see Appendix 1 for a full list of the answers). Thus, for the majority of our sample an ES is the service provided by humans to nature, such as, protect nature, or conserve biodiversity. Whereas there is a large and diverse understanding and interpretation of the notion, 30% of our sample does mention one or more ES stated in the Forestry law 7575 of 1996. Most mentioned ES is related to carbon sequestration (mentioning for example trees, oxygen, reforestation, forest). Water or biodiversity conservation was less mentioned, and scenic beauty was only mentioned once. These results show that PES is not well understood by the inhabitants of the buffer zone of LABR. This is likely to reduce their participation in PSA program. Another illustration of the unawareness of compensation for environmental services is the fact that community preserve water sources, by either planting trees or reforesting in the area. PINDECO, a multinational enterprise involved in pineapple cultivation in the area, benefits of this clean and constant water flow but does not compensate local communities for the provision of these services. During the Focus group discussion, it became clear that there was little knowledge about the possibilities to ask PINDECO for compensation. 3.2 Household participation to PSA program in the Buffer Zone of LABR In Costa Rica, requests to participate in the program far surpassed available funding availability. For that purpose, a priorization system has been introduced since 2003 to better target payment toward area of major ES provision (biodiversity gaps, biologic corridors) and low human development index. According to this priority system, buffer zone of LABR can be considered as a priority zone for PSA payment. Nevertheless, from the 107 respondents interviewed 15 respondents in our sample have tried to receive PSA. Two respondents actually receive payment for environmental services. According to Fonafifo officers, this ratio is not deviant from the average ratio applications compared to accepted applications. When asked what the effects of these payments are for your household one of the respondents indicated that besides personal satisfaction, the money is like a gift whereas the other respondent indicated that the money is a great help in making a living. In addition, of the 39 people who have forest in conservation 43,6% is not aware the PSA Program. The unawareness of PSA is likely to explain partly the low participation in PSA. Regarding participation to PES, Wunder (2008) identified four factors that influence participation in PES: eligibility, desire, ability, competiveness. We discuss hereafter these four factors
11
Eligibility. Normally only landholders can participate in a PES program. This rule is implemented to guarantee the continuous delivery of an ES. The landless that tend to be among the “poorest of the poor” are thus excluded. Costa Rica abandoned a previous formal land title requirement for PES (Pagiola 2007). Enrolment without formal title is thus theoretically possible, as long as landholders have locally recognized tenure and a proven ability to exclude potential intruders. In the village of Capri situated in indigenous reserve, no one has a land title. All land is in the hands of the indigenous people making it impossible for campesinos to participate in PSA. Moreover, some of the respondents who applied for PSA program and did not achieved it, indicated that the lack of a formal title over their land was the reason that their application was rejected. Desire. Another factor that influences participation is desire and motivation. Farmers calculate benefits, costs and risks (Wunder, 2008). According to our studies, non‐participants indicated that transaction costs are high, there is a lot of paperwork from the authorities this in combination with low payments per hectare make it that for them it is not worth the effort. This qualitatively confirm the importance of transactions costs that the landowners have to bear to access PSA program. Ability. To participate farmers must present a sustainable forest management plan prepared by a licensed forester (forestry regent). This plan includes proposed land use and has to include information and land tenure, topography, soils, climate, drainage, actual land use, carrying capacity with respect to land use, plans for preventing forest fires, illegal hunting and illegal harvesting and monitoring schemes (Pagiola 2007). Net payments are lower than the actual payment. Landowners must pay the licensed forester these fees take about 15% of payments. In addition, they have costs for their management plans such as building firebreaks or place fences to prohibit cattle from entering. Wunder (2008) refers to this as ability. Farmers might be willing to enroll, but lack the ability to enroll. Households may lack human capital such as skills, labor and technical assistance, or financial capital in the form of access to credit. To illustrate, in our sample 33% of the household heads has not finished primary school and 51% of the households has an income below the national poverty line (households that earn less than 57 762 colones per capita, per month. Competitiveness. The opportunity cost of changing land use play a role in participating in PES (Wunder 2008). The data shows that most people interviewed are farmers who work small plots intensively and cultivate mainly subsistence crops in order to secure food security. For these farmers the opportunity costs for changing land use are probably high, since it implies a decrease in food security. However, for those who own land close to the park, opportunity costs are low. Land close to the park is in general not that suited for agriculture for several reasons. First, the location near to the park causes inconvenience of animals, which eat or destroy crops. Second, land located near to the park is mountain land unsuitable for livestock and certain crops. Law prohibits cattle on steep land to prevent soil erosion and since this land is generally situated at a 1‐2 hour walk, the transaction costs to bring agricultural products from this land to the market are high. Therefore, only high return crops are profitable on this land. Here the question of PSA efficiency arises. Should we compensate for conservation of land, which will be compensated anyway, even without payment?
12
3.3 Efficiency of PES Authors also question the sufficiency of the PSA program. Pagiola (2007) identifies three forms inefficiency of the PSA program:
(1) Offering payments that are insufficient to induce adoption of socially desirable land use.
(2) Inducing the adoption of socially undesirable land uses, that supply environmental services, but at a cost higher than the value of services.
(3) Paying for adoption of practices that would have been adopted anyway. This reduces payments available to induce socially‐efficient land use changes elsewhere
A substantial majority of our sample has indicated to have forest in conservation either primary forest or reforested land. PES would thus lead to payment for adoption of a practice that is adopted anyway. The prime focus of PES is protecting the environment and not improving the livelihoods of the rural poor. However, PES has welfare implications (Wunder, 2008). Although PES is not designed to be a poverty reduction program in Costa Rica Fonafifo has sought to maximize their poverty impact by adding particularly disadvantaged districts to the priority areas for the PSA program. Our 2009 income data shows that 51% of the households, of which income data is available, lived in poverty or extreme poverty. If those who are poor with land in conservation received PSA, this would likely help them alleviate poverty. 4 – Households perception and relationships with the “la Amistad” international park In this part we analyze and discuss the perception and relationship of the interviewed households with the La Amistad International Park 4.1 Household perception of the advantages of park proximity Respondents were also asked to mention advantages and disadvantages of the park. Only 8,4% of our respondents said that they perceived no advantages of the park, and 81,3% said that their where no disadvantages. Households could mention, as many advantages and disadvantages as they would like and we did not asked to assign them in order of importance. The top three most frequent mentioned advantages where: water 64,5%, oxygen 28,0%, and a (potential) for tourism 27,1%. Hence, the overall discourse is not only that it is not the park that is impeding income sources; the park itself is seen as a potential source of income. However, if we compare this discourse with the reality than only 5,6 % of the households in our sample have received income from tourism in 2009 (Crafts, lodging, guiding). All answers to the question what are the advantages of the park were analyzed and categorized in 4 asset categories: human capital, natural capital, financial capital, and social capital. A fifth catagories was created to sum the advantage of the park in term of contribution to conservation issue by itself. Households where given a one if they at least
13
had answered one of the answered belonging to a category. Table 1 below shows the categories and the answers. Table 1: Advantage of the park Natural capital
78,5%
Financial Capital
31,8%
Human Capital
14,0%
Social Capital
13,1%
Contribution to
conservation
23,3%
Water Fresh Air Flora Fauna
Flora & Fauna Climate
Soil Protection Beauty
Barrier against the wind
Land fertility Reproduction of
fauna Stability of Environment
(Potential) tourism Economic Benefits PSA
Source of employment
Source of education (for
future generations)
Health Recreation Celebrations
Meat
Generating support from organizations
Aggregated value for the
community Publicity Greater
involvement of municipality
Conservation Soil
protection Reforestation Reduction in slash and burn
agriculture Reduction of
hunting Reduction of deforestation
Source: household survey, 2010 In terms of assets, 78,5% of the households see the park as natural capital. They enjoy fresh air, water and the beauty of the park. This high number indicates that people value and appreciated services provided by nature greatly. They are aware of the direct positive side effects of nature conservation. 31,8% of the households sees the park as an asset which can (potentially) generate income through employment opportunities or payment for environmental services. Fewer respondents viewed the park as human capital or social capital. The analysis of the answer also shows that 23,3% of the respondents gave answers that can be categorized as conservation contribution of the park itself, such as a reduction in hunting and deforestation. 4.2 Household perception on nature conservation We also asked respondents about their opinion about nature conservation in general. They were asked to value three statements (Table 2)
14
Table 2. Statements of perception about nature conservation
Statements of perception about nature conservation N=97
Totally disagree
Disagree Neutral Agree Totally Agree
The park is a threat to my productive activities
70% 19% 1% 9% 1%
Nature conservation brings new opportunities
6% 4% 6% 48% 36%
We need to do more for the environment
3% 6% 1% 35% 55%
Source : household survey, 2009 Again, the majority is in favor of conservation and thinks nature conservation is not a threat to their productive activities in contrast; the majority thinks conservation brings new opportunities. With regard to the last statement, almost 90% feels that we need to do more for the environment. However, some respondents added that they felt that rural inhabitants have done enough and have done what lies within their power. They mention that urban citizens should take their responsibility too. However both urban and rural citizens, owning a vehicle or using public transportation, indirectly contribute with conservation of protected areas. This is because the PESP financing system entitles a tax applied to every liter of fuel sold across the country. Most of the time without knowing this, most Costa Rican citizens (and actually every fuel consumer) indirectly contribute with the financial base of PSA. On the other hand, efforts of rural inhabitants to separate garbage and recycle (plastic, paper, glass) are not rewarded. In none of the villages a garbage truck enters. The only option left for families is thus to either burn or burry garbage. Such initiatives and efforts is not yet acknowledged by local municipalities. 4.3 Household perception on disadvantage of park proximity Shelhas and Pfeffer (2005) analyzed the forest values of the population around La Amistad Biosphere Reserve. They show that there are strong forest and environmental values in the area. They identified four main points of conflicts and resistance to the park In our own research, we asked respondents about the disadvantages of the park. The majority (81,3%), mentioned that they do not perceive any disadvantages of the park. However, we should note that within informal conversation rural inhabitants where more likely to mention disadvantages. Alternatively, they mentioned a disadvantage and then classified this as not being problematic too them:
“Predators living in the park have harmed or even killed my chickens, but I do not see this as a disadvantage, those animals have to eat too”.
It is not clear; if people do not mention disadvantages because they feel like they have to give socially, correct answers or that it really does not matter to them. Yet, we have encountered the same points of resistance to the park as Shelhas and Pfeffer (2005).
15
Trees should be able to cut for subsistence needs. There is a strong discourse that you should not waste trees. However, cutting trees for basic needs such as planting crops and building a house should be acceptable (Shelhas and Pfeffer 2005). We found that the above opinion is closely related to another point of conflict identified by Shelhas and Pfeffer (2005) that is, property rights, and the law that prohibits tree cutting without permission on private land. Although people accept conservation in the park, they find it difficult to accept that they can not cut a tree on their private property (Shelhas and Pfeffer 2005). Especially, in the view that they need this tree in meeting basic needs. When one wants to cut a tree, permission is needed from the MINAE. During the participatory group meetings held in each of the villages, we encountered that in some villages the MINAET (Ministerio de Ambiente y Energia) officials were described as “reasonable” and “easy to deal with”, providing permissions when needed and in other villages as “unreasonable” and “difficult to deal with”, not even willing to provide a permission to poor community members who really needed the timber to repair their house. The exact causes of these different perceptions can be due to many factors. Yet, the most organized village with the strongest local development organization, a villages described as a “model village for development in the zone”, had the least struggle in dealing with MINAET. Obtaining permission seems to be easier for those organized than for individual households. Tacotal or charrales is young brushy second growth. According to law when there are more than 70 trees per hectare, more than 15 cm in diameter it is not tacatol, but forest. Whereas it is allowed to clear tacotal, it is prohibited to clear forest (Shelhas and Pfeffer 2005). Shelhas and Pfeffer (2005) found considerable conflict between community members and forest authorities over what is tacotal and what is forest. In particular, in the frijol tapado system. In this system, land is selected than paths are slashed trough the vegetation to create access for planting after that beans are planted and the system is left untouched until the harvest (Melendez, 2004). We also found conflict over tacotal in relation to land use systems. With few financial assets to buy for example fertilizers, a cheap and convenient way to increase soil fertility is leaving land untouched over several years so that it can recover. However, if there are fast growing trees tacotal becomes forest and cannot be clear. This leaves the farmer with fertile land that cannot be used for agriculture. In addition, Shelhas and Pfeffer (2005) describe and analyze a common complaint of rural residents that we have also encountered: “The rich and outsiders can cut trees but we not”. For rural residents it is difficult to cut trees for basic needs. Yet, they see logging trucks constantly driving in and out of the area while they only cut a tree when they truly need it. Second, they feel that the big companies have the money, time, and knowledge to get permissions easily while the process for the small farmer is complicated and difficult. Shelhas and Pfeffer (2005) describe that this fit in a general model about how things work in Costa Rica:
“They fit this in a general model about how things work in Costa Rica, where the poor campesino cannot even do what little he needs to do to meet his basic needs, while rich know how to make things work for them and can do whatever they want (Shelhas and Pfeffer 2005:394)
This discourse was very strong amongst those we have interviewed. They felt abandoned by the state that in their opinion strongly is in favor the rich.
16
In addition to the above‐mentioned four points, crop raiding animals and animals that harm livestock where mentioned as problematic. People feared that this problem might become worse in the future since the park might lead to an overpopulation of predators such as jaguars and puma’s. Since hunting is prohibited, it was difficult to analyze hunting behavior in the zone. Respondents indicated that hunting for pleasure and meat decreased over the past 30 years. They now realize that hunting has negative effects on the environment. However, within informal communications respondents indicated that if jaguars or puma’s harm or kill too many animals this animal is hunted down (with or without MINAET permission). Hunting as a sport is practiced more by “outsiders” from the city. Communities such as Santa Maria have agreements with MINAET; they monitor the area to see whether hunters have arrived. When they suspect hunters, they can call MINAET and they will investigate the case. At community level we can state that in all villages the community shares common norms and vision for environmental sustainability. These are all strong norms such as not burning land for agricultural purposes, no hunting and the importance of trees was recognized. Many respondents indicated that trees near rivers are important to keep water sources flowing. This environmental consciousness is strengthened or even fuelled by the presence of local development organizations, which all pay great attention to environmental sustainability. Whereas above we saw that almost 90% of the respondents indicated that we need to do more for the environment the majority of the respondents was very satisfied with the current performance of the local development organization with regard to conservation. Table 3 shows the average grade about the performance of the local development organization on activities related to conservation. The village of Capri was excluded because that organization was starting and had no current conservation activities. Table 3 : Average grade on local developments organization performance with regard to nature conservation activities Member No Member Biolley 8,75 8,33 Altamira 8,29 8,50 Capri N/A N/A Santa Maria 8,00 7,69 Santa Rosa 8,80 9,50 Aguas Calientes 8,33 8,00 Source : household survey 2009 The grades given are high; this might be due to social pressure. However, there is a small difference between the average grade of those who are a member of the organization and those who aren’t. The impact on nature and livelihoods of the activities performed by each organization differs, whereas some are engaged in ecotourism, others are reforesting or picking up garbage from the street. The environmental discourse that the local development organization creates by being actively engaged in nature conservation activities stimulates the general awareness about the importance of conservation. Villages are small, so one sees their neighbors planting trees or picking up garbage which encourages them to do so. 4.4. Final consideration
17
Andam et al (2010) estimated the impact of protected area systems on poverty in Costa Rica and Thailand. Initially they found that communities near protected areas are indeed substantially poorer than national averages. However, when appropriate control variables where used results show that these differences cannot be attributed to protected areas. These results are consistent with our findings that households living near LABR do not perceive the park as their biggest threat to generating income. When respondents were asked an open question “what are the main problems related to earning income for your household?” Households could mention, as many problems, difficulties etc as they would like and we did not asked to assign them in order of importance 60% of the households answered a lack of employment possibilities, 27% answered imperfect markets1, 20% a lack of financial resources and 16% mentioned distance2 as a problem. These where the most frequent mentioned problems. None of the respondents indicated the park or park restrictions as problematic in earning income. 5- Households rational of forest conservation practices We have seen that only two respondents in our sample received PSA. However, of the 107 households interviewed, 39 households have either primary forest in conservation or have reforested at least a part of their farm. Hence, even without compensation people conserve forest. Many scholars have shown that different socio economic factors contribute to participation in reforestation (Dolisca et al., 2006). Therefore, in developing efficient conservation policy it is important to understand which factors influence conservation decisions. It must be noted that people in the buffer zone of La Amistad Biosphere Reserve conserve in a context in which deforestation is almost impossible. Under article 34 of the forestry law 7575 it is prohibited to cut down trees in protected areas. The article 27 of the same forestry law states that only three trees per hectare per year may be cut down on agricultural land where there is no forest. This poses strong restrictions on tree cutting. 5.1 Factors influencing conservation practice decision choice of household To test some factors that may influence the choice of having forest in conservation or not, we developed an binary choice econometric model, defining the dependent variable, as:
‐ Yi = 1 if household i has forest in conservation ‐ Yi = 0 if household i does not has forest in conservation
Due to the small sample size primary forest and reforestation are aggregated to one category: forest conservation. Several factors are associated with the decision to participate in reforestation incentive programs (Thatcher et al., 1997). It is hypothesized that total farm size is positively related to forestry (Chambers et al., 1989 in Thatcher et al., 1997). In addition, large landowners in Costa Rica are disproportionally represented in payment for environmental services (Sánchez‐Azofeifa et al., 2007). Zhang and Pearse (1996) in Dolisca et al., 2006) found that secure tenure forms provide more benefits to their holders are more
1 Varying from distance to the market, instability of the market, low producer prices, non-existence of markets) 2 No public transport, remoteness of the zone
18
likely to stimulate reforestation. Although Costa Rica abandoned a previous formal land title requirement for PES. Enrolment in PES without a title is possible, but difficult (Pagiola, 2007). We hypothesize that legally possessing land has a positive effect on forest. First, a title increases the changes in future PES participation a financially lucrative way of forest conservation. Second, the process of obtaining legal title may indicate a level of experience in dealing with legal and government bureaucracies that may impart a willingness to participate in government programs (Thatcher et al., 1997). A study in Bangladesh, observed that, in situations where agriculture is the main source of income, farmers are discouraged from planting trees on their homesteads (Salam et al., 2000 in Dolisca et al., 2006).In addition, households with off‐farm income are more likely to invest in activities that are labor extensive. Therefore, we expect that a positive relation between non‐ farm labor and forest conservation (Thatcher et al., 1997). Education has been reported to influence farmers’ participation in forest management and conservation (Glendinning et al., 2001; Owubah et al., 2001 in Dolisca et al., 2006). Moreover, we hypothesize that non‐poor farmers are more likely to engage in forest conservation. Forest conservation has to compete with other land‐uses such as agriculture and cattle. The majority of our sample does not receive any compensation for conservation; the above‐mentioned land‐uses have higher incomes returns by land unit. Local organizations in our study area had a strong environmental discourse we therefore expect that membership of a local organization positively influence the choice to conserve forest. Due to the very low participation in payment for environmental services (N=2) it was not possible to include this variable in the analysis. Table 1.4 summarizes the variables hypothesized to influence farmer’s forest conservation decisions. Table 1.4 Variables definitions included in the binary regression equation model Variable Definition Measurement Expected
outcome Farmsize Farm size in ha. Ha. + Education (human capital)
Household head has primary education or less
1: yes, 0 otherwise +
Title (natural capital)
Farmer possesses legal land title to at least part of farm system
1: yes, 0 otherwise +
Offfarmlabour (financial capital)
Percent of household income earned fromoff‐farm sources
Percentage of household income earned from off farm sources
+
Mlocalorganization (social capital)
1: yes, 0 otherwise +
Non‐poor households (financial capital)
1: If non‐poor, 0 otherwise +
Source : authors
19
The threshold of the prediction that the event takes place was set at 0,05. In other words, if the probability of the event is greater than or equal to 0,5 we shall predict that the event will take place. Table 1.5 shows that our model is valid. Table 1.5 Omnibus Test of Model Coefficients
Source: authors The Chi‐square of 27,25 (6) with a p‐value of 0,000<0,01 tells us that the model with variables predicts better than the model with only a constant. By including the variables in our regression the percentage correct prediction increased from 62,3 % to 76,6%. Table 6: Variables in the equation
a. Variable(s) entered on step 1: Farmsize, Education, Title, Offfarm, Mlocalorganizacion, nopobreza.
Source: authors
Having a land title, membership of a local organization and economic welfare status resulted insignificant in our analysis. Farm size, education, and off‐farm resulted significant at a respectively 0,01 and 0,05 level of significance. We can now use this model to predict the odds that a respondent will decide to participate in forest conservation.
Stata automatically calculates the odds ratio predicted by the model as is shown in Table 1.5,
column Exp(B)
20
Table 1.7 Odds, probabilities and odds ratio for significant variables in the analysis.
Variable
Low
education
High
education
Farm
size
Share
off‐farm
Sign of coefficient (‐) (+) (‐)
Odds 0,293 1,59 1,65 0,13
Probability 22%4 61% 62% 9%
Odds ratio 0,185 1,03 0,08
The 1,03 odds ratio for farm size variable indicates that the odds of participating in forest conservation increases with 1,03 with a one point increase in total farm size. This is consistent with findings in earlier literature. The effect of education is smaller and, in the opposite direction. The model predicts that the odds of participating in forest conservation are 0,18 times lower for respondents with low education compared to respondents with high education. This is consistent with finding in earlier literature. The odds share of off‐farm labor is even smaller with 0,08. The odds of participating in forest conservation are 0,08 times lower with an one point increase in the share of off farm labor. This is inconsistent with finding in earlier literature that suggests that those receiving more income from off‐farm labor are more likely to participate in PSA. Although, being poor or not did not resulted significant in our analysis the majority of the 39 respondents with forest in conservation are non‐poor (N=14), with respectively 12 poor participants and 8 extremely poor participants6. 5.2 Relation between types of income and forest conservation practice An interesting question is whether there is a relation between a certain types of income earning activities and forest conservation. Table 8 below shows the income from different activities in 10.000 colones per year separated for those engaged in forest conservation and those who are not engaged in forest conservation.
3 Interpretation odds: If our respondent has primary education or less (educ =1) than e 0,466+-
1,714(1)=0,29. That is, a respondent with primary education is 0,29 as likely to participate in forest conservation as he or she is likely to not to participate. 4 Interpretation probabilities: 0,29/1,29= 0,22. That is our model predicts that 22% of the respondents with primary education or less will participate in forest conservation. 5 Interpretation odds ratio: 0,29/1,59=0,18. That is people with low education are 0,18 less likely to participate in conservation than people with high education. 6 Of 5 respondents with forest in conservation complete income data is unknown.
Coffee 19 55,9% 8 500 126 134 75Off farm work 9 26,5% 14 210 64 59 59Nonfarmwork 9 26,5% 9 1200 289 445 48Livestock 10 29,4% 12 800 235 232 187Agriculture 13 38,2% 1 350 66 95 35Transfers 23 67,6% 13 178 45 42 30Niche 15 44,1% 5 300 86 95 50Remittances 14 41,2% 11 1320 283 385 175Source : household survey, 2009 NB: Coffee: the amount of income received by the household from producing coffee; Off farm: work performed in the non‐agricultural sector such as owning a business, transport, construction work etc.; Non‐Farm= refers to day labor; Livestock: includes the sale of cattle and pigs; Agriculture: includes the whole range of agricultural products; Transfers: include pensions, scholarships, support by family members etc.; Niche: includes activities coming from the niche market tourism such as honey production, tilapia production, etc…; Remittances: are the amounts of remittances that a household receives N is the total number of households who receive income from the activities described above. The percentage engaged is the number of those who receive income from that source divided by the total number of respondents of respectively no forest in conservation and forest in conservation. To avoid inconvenience in interpretation, the table above shows only the descriptive statistics of all households from which income data was available7. With the Pearson Chi‐Square test, we tested whether there is a relationship between forest conservation and receiving income from a particular activity/source. Agriculture resulted significant at a 5% significance level (Chi‐square of 4,5) and coffee (Chi‐square of 3,4) resulted significant at a 10% significant level. The table above shows that the percentage of respondents who earn income from coffee and agriculture is higher than amongst those with forest in conservation. One explanation might be that coffee and agriculture is quite 7 In the case of no forest in conservation of 6 households income was unknown and of the respondents with forest in conservation, in 4 cases data was unavailable.
22
labor intensive. If farmers own large plots, they might devote a part to forest because of a labor and or capital constraints. Moreover, not all land is suited for agriculture or livestock. Respondents indicated that land located near to the park was not suited for agriculture. First, this land is steep making it impossible to for example to have pasture. Second, this land is in general located at a 1‐2 hour walk this implies that there is a lot of time involved in cultivating in these areas so only high profit easy to transport crops can be cultivated in these areas. Third, crop‐raiding animals destroy or lower the harvest. Normally forest competes with for example pasture which shows returns from US$8 to US$125 in Costa Rica depending on location, land type, and ranching practices (Arroyo Mora et al. 2005 in Sánchez‐Azofeifa, Pfaff et al 2007). However if land is unsuitable for agriculture or pasture the opportunity costs of forest conservation are low. A Wilcoxon‐Mann‐Whitney test was performed to test whether it exists or not significant differences in the income means of the different income sources and forest conservation participation. For none of the variables there was a significant difference between those who participate in forest conservation and those who not participate. However, the table above shows a clear difference in the mean and median for livestock; those with forest in conservation in general receive more income from livestock. Also there is a clear difference in the median and mean for remittances, those with forest in conservation receive more income from remittances. Data on savings from self‐sufficiency was collected to address food production for own consumption. The Mann‐Whitney test resulted significant at a 10% level, those with forest in conservation had significantly higher levels of auto consumption than those without forest in conservation. There is no statistical significant relationship between forest conservation and location (village). Table 9 below shows the distribution of forest conservation amongst villages. Table 9 : Forest Conservation per Village
Villages Biolley Altamira Capri Santa Rosa de Brunca
Santa Maria de Buenos
Aires
Aguas Calientes
Total
N No forest in conservation
6 12 13 18 6 13 68
N Forest in conservation
10 6 6 7 5 5 39
Ntotal 16 18 19 25 11 18 107
Source : Household survey, 2009 Conclusion Only two participants in our sample receive PSA, while 39 households have forest in conservation. This is a good indicator that the choice for forest conservation does is not only based on an economic incentive, or directly derived from PSA compensation. The
23
econometric analysis showed that factors such as farm size, education, and off‐farm labor influence participation forest conservation. It is important to pay attention to this fact. Since, in Costa Rica, requests to participate in the PSA program far surpasses available financing. It is thus not possible to finance all request. So, besides financial compensation, other incentives or reasons to participate in conservation should thus be stimulated. Briefly we addressed the efficiency and the purpose of PES. We conclude from this that if the prime focus of PSA is conservation then one should ask the question if farmers who are already engaged in conservation should be compensated for this. PSA should then be targeted at land that would be used for other purposes (agriculture, cattle etc.) without compensation. If poverty reduction is an important aspect of PSA, then the answer to this question might be different. There seems to be no straightforward relationship between income sources and forest conservation. Those receiving income from agriculture and coffee production are more likely to have forest. However, our data is insufficient to determine what might be the reason for this. The majority with forest in conservation are non‐poor (N=14), with respectively 12 poor participants and 8 extremely poor participants8. With no straightforward and statistically significant relationship between poverty and forest conservation, it is not clear what the impact of conservation is on poverty and vice‐versa. One would assume that those who are non‐poor do not have the need to produce for self‐sufficiency and thus have more land available for forest. It might be that the poor own too little land to devote a part to (re)forestation because they need all the land to insure basic food security. For those poor engaged in conservation, they might be forced because they lack the labor or capital to make their land productive in another way. We also addressed the relationship between poverty (alleviation) and conservation we conclude that in the perception of the rural inhabitants there economic welfare status has little to do with the presence of the La Amistad Biosphere Reserve. Certainly, park restrictions do not make livelihoods easier for inhabitants. Having little access to timber or the increase in crop raiding animals causes inconvenience but is not perceived as the major problem. Respondents indicate that a lack of employment opportunities, imperfect markets and little access to financial capital impedes them in generating income. Those factors are more likely to be caused by the remoteness of the area than the presence of the park. There is thus, no evidence that it is nature conservation causing the high number of inhabitants living in poverty. With respect to environmental sustainability we can conclude that households are environmental friendly minded. They appreciate benefits of the park such as clean air and water. Moreover, they do not perceive the park as a threat to their productive activities. Still, to truly answer this research questions more research on Payment for environment services and it’s poverty reduction potential is needed. . Acknowledgement The authors are grateful to the official of the administration of the LABR, MINAET, as well as the households of the of the 6 communities that enable to developed this research.
8 Of 5 respondents with forest in conservation complete income data is unknown.
24
25
References Adams, W.M., Aveling, R., Brockington, D., Dickson, B., Elliot, J., Hutton, J., Roe, D., Vira, B., and Wolmer, W. (2004) “Biodiversity Conservation and the Eradication of Poverty”, Science, Vol. 306(5699):1146‐1149 Andam, K.S., Ferraro, P.J., Sims, K.R.E., Healey, A., and Holland, M. (2010) “Protected Areas Reduced Poverty in Costa Rica and Thailand”, PNAS, Vol. 107, No. 22:9996‐10001 Bennett, N. (2010) “Sustainable Livelihoods from Theory to Conservation Practice: An Extended Annotated Bibliography for Prospective Application of Livelihoods Thinking in Protected Area Community Research”, Protected Area and Poverty Reduction Alliance Working Paper No. 1. Victoria, Canada: MPARG (UVic); PAPR (VIU) Clark, T. W., L. Dixon, et al. (2006) "Innovation and Appraisal of Sustainability Efforts in La Amistad, Bocas del Toro, Panama and Talamanca, Costa Rica Regions." Journal of Sustainable Forestry, Vol. 22, No. 1: 1 ‐ 14 Daniels A, Bastad K, Esposito V, Moulaert A, Rodriguez C, 2010, “Understanding the impacts of Costa Rica's PES: Are we asking the right questions?” Ecological Economics 69 (11) 2116‐2126 Dolisca, F., Carter, D. R., Mc Daniels, J.M., Shannon, D.A., and Jolly, C.M. (2006). "Factors influencing farmers’ participation in forestry management programs: A case study from Haiti." Forest Ecology and Management, Vol. 236:324–331. Grieg‐gran M., Porras I, Wunder S. (2005) How Can Market Mechanisms for Forest Environmental Services Help the Poor? Preliminary Lessons from Latin Americ World Development Vol. 33, No. 9, pp. 1511–1527,
Hartshorn G, Ferraro P, Spergel B, Sills E, 2005, “Evaluation of the World Bank – GEF Ecomercados Project in Costa Rica” Report of ‘Blue Ribbon Evaluation Panel’. Holden, S.T. Shiferaw, B., Wik, M., (2001) “Poverty, market imperfections and time preference: of relevance for environmental policy?” Environment and Development Economics Vol.3:105‐130 Kosoy, N., Martinez‐Tuna, M., Muradian, R., Martinez‐Alier, J., 2007. Payments for environmental services in watersheds: Insights from a comparative study of three cases in Central America. Ecological Economics. 61 (2–3), 446–455. Le Coq J.F., Soto G., Gonzales C. 2011. PES and Ecolabel: a comparative analysis of their limits and opportunities to Foster environmental services, in Rapidel et al., Ecosystem services from agriculture and agroforestry. Measurement and Payment, Earthscan. London, pp 236‐264 ;
26
Le Coq, Froger G., Legrand T, Pesche D, Saenz F (2011). Continuity and inflexions of the program of Payment for Environemental Services in Costa Rica : A learning process and stakeholders’ balance of power perspective. Working paper Serena. Legrand T., Froger G., Le Coq J.F., 2010, « The efficiency of the Costa Rican Payment for Environmental Services Program under Discussion », 12th BIOECON Conference “From the Wealth of Nations to the Wealth of Nature: Rethinking Economic Growth”, Venise, 27‐28 september 2010, 25 p. Papier qui sera soumis à la revue Environment and Planning. Locatelli B, Rojas V, Salinas Z, 2008, “Impacts of payments for environmental services on local development in northern Costa Rica: a fuzzy multi‐criteria analysis” Forest Policy and Economics 10 (5) 275‐285 Miranda M, Porras I, Moreno L, 2003, “The social impacts of payments for environmental services in Costa Rica: a quantitative field survey and analysis of the Virilla watershed” Markets for Environmental Services Paper No.1. IIED, London Muñoz‐Piña, C., Guevara, A., Torres, J.M., Braña, J., 2005. Paying for the Hydrological Services of Mexico’s Forests. Instituto Nacional de Ecologia, Mexico, p. 36. Ortiz E, Borge C, Sage L, 2003, “Impacto del programa de pago de servicios ambientales en Costa Rica como medio de reducción de la pobreza en medios rurales”. San José, CR, Unidad Regional de Asistencia Técnica (RUTA). 62 p. (Serie de Publicaciones RUTA. Documento de Trabajo, no. 8). Pagiola S, 2002, “Paying for water services in Central America: learning from Costa Rica”. in Selling Forest Environmental Services: Market‐based Mechanisms for Conservation Eds S Pagiola, J Bishop, N Landell‐Mills (Earthscan, London) pp 37 – 61 Pagiola S, 2008, Payments for environmental services in Costa Rica Ecological Economics 65 (4) 712‐724 Pagiola, S., Arcenas, A., Platais, G., 2005. Can Payments for Environmental Services Help Reduce Poverty? An Exploration of the Issues and the Evidence to Date from Latin America. World Development Vol. 33, pp. 237‐253. Pfaff, A., Robalino, J.A., and Sanchez‐Azofeifa, G.A. (2008) Payment for Environmental Srvices: Empirical analyis for Costa Rica, Working Paper Series SAN08‐05, Terry Sanford institute of public policy, DUKE Reardon, T. and Vosti, S.A. (1995) “Links between rural poverty and the environment in developing countries: Asset categories and investment poverty” World Development, Vol. 23, No. 9:1495‐1506 Robalino, J., Pfaff A., Villalobos, L. (2011) Assessing impacts of institutional design of Payments for Environmental Services. The Costa Rican experience. in Rapidel et al., Ecosystem services from agriculture and agroforestry. Measurement and Payment, Earthscan. London, pp 305‐318
27
Russo, R.O and Candela, G. (2006) Payment for Environmental Services in Costa Rica”Evaluating impact and Possibilities, Tierra Tropical, Vol.2, No. 1:1‐13 Sanchez‐Azofeifa, P.G., Pfaff, A., Robalino, A.J., and Boomhower, J.P. (2007) Costa Rica’s Payment for Environmental Services Program: Intention, Implementation, and Impact Conservation Biology Vol. 21, No. 5: 1165–1173 SINAC (2009) Plan de Manejo Parque Internacional La Amistad Steinberg, P. F. (2001). Environmental Leadership in Developing Countries. Transnational Relations and Biodiversity Policy in Costa Rica and Bolivia Londres, Massachussetts Institute of Technology Thatcher, T., Lee, D. and Schelhas, J.W. (1997) Farmer participation in reforestation incentive programs in Costa Rica, Agroforestry systems, Vol. 35:269‐289 Wunder, S. (2001) Poverty Alleviation and Tropical Forests—What Scope for Synergies? World Development, Vol. 29, No.11:1817‐1833 Wunder, S. (2006) Are Direct Payments for Environmental Srvices Spelling Doom for Sustainable Forest Management in the tropics? Ecology and Society, Vol. 11, No.2: Wunder, S. (2008) Payments for environmental srvces and the poor: concepts and preliminary evidence, Environment and Development Economics, Vol 13:279‐297 Zbinden, S. and Lee, D.R. (2005) Paying for environmental Services: An Analysis Of Participation in Costa Rica’s PSA Program World Development, Vol. 33, No. 2: 255‐272
28
Appendix I: Study Design and method In November 2009, we held a focus group discussion in the villages of Biolley, Tres Colinas, Santa Rosa, and Santa Maria. The aim of the focus group was threefold. First, breaking the ice, and introducing ourselves. Second, we aimed at exploring the existing range of opinions and views on nature conservation and to identify current agricultural and non‐agricultural activities in the area. Third, the focus group discussion helped us to identify not only which villages where suited for our semi‐structured interviews but also, which topics are important to incorporate in the questionnaire. The focus group was organized through the local development organizations. Although the whole village was invited, the participation villagers belonging to the local development organization was higher. In addition, the presence of community leaders could have impeded participants in expressing their views and opinions. Moreover, in a focus group there is social pressure to give socially correct answers, which may not reflect actual opinions and practices. To deepen the analysis at household level, we held in January‐February 2010, 107 structured interviews with both closed and open questions. We interviewed household heads and if these were not available their wife’s. The structured questionnaire provided us with detailed information on the issues of interest, and allowed us to search for structural relationships between concepts (environmental services, capitals, livelihood strategy). The villages were selected non‐randomly with MINAET based on several criteria including distance to the park, representation of a communal organization, migration, land use, and accessibility. The remainder of the sampling process was done in a non‐randomized manner namely, the snowball method. In the area it was extreme difficult and costly to locate respondents. Therefore, we used snowball sampling. This non‐probability method is perfectly suited trying to reach populations that are inaccessible or hard to find. Respondents where located relying on referrals from initial subjects to generate additional subjects. The initial subjects were found during the community meetings. In each village, at least one participatory community meeting was held preferably before starting interviewing in the village. This lowered our search costs both in terms of time, and money but came at the expense of introducing bias. Snowballing reduces the likelihood that the sample will represent a good cross section from the population. The meetings where organized via the local organizations, leading to a low participation of villagers who are not a member of the local development organization. To achieve a balance in our survey between respondents that belong to the local organization and respondents that do not belong to the local organization we used exponential non‐discriminative snowball sampling (Hart, Boeije et al. 2005; Castillo 2009). For several reasons (access9, language,…), our research includes only non‐indigenous peoples. Nevertheless this choice is assume since the percentage of indigenous in the area and the selected village is reduced. In addition, the impacts of conservation can be just as serious for non‐indigenous people (Brockington et al., 2005). In the village of Capri that is situated on indigenous territory this idea is confirmed. Campesinos living on indigenous territory are constraint by conservation policies biased towards the livelihoods of indigenous‐people. For example, the indigenous community owns all land and it is legally impossible for an individual to obtain a title over a plot of land. Another example, if they want to start a new activity such as tourism they need permission from the indigenous
9 During our research, the MINAET informed us that the local indigenous group situated in Capri did not give permission to interview indigenous people.
29
board. In July 2010 we returned to the villages of Biolley, Santa Rosa and Aguas Calientes to present preliminary findings and to discuss them. The different research method allowed us to use methodological triangulation. The validity of the findings from the focus groups could be checked with the findings from our structured questionnaire and vice‐versa. References Brockington, D., Igoe, J., and Schidt‐Soltau, K. (2005). "Conservation, Human Rights, and Poverty Reduction." Conservation Biology, Vol.20, No. 1:250‐252. Hart ‘t, H., Boeije, H., and Hox. J. (2005) Onderzoeksmethoden, 7thedition., Amsterdam, Boom Onderwijs
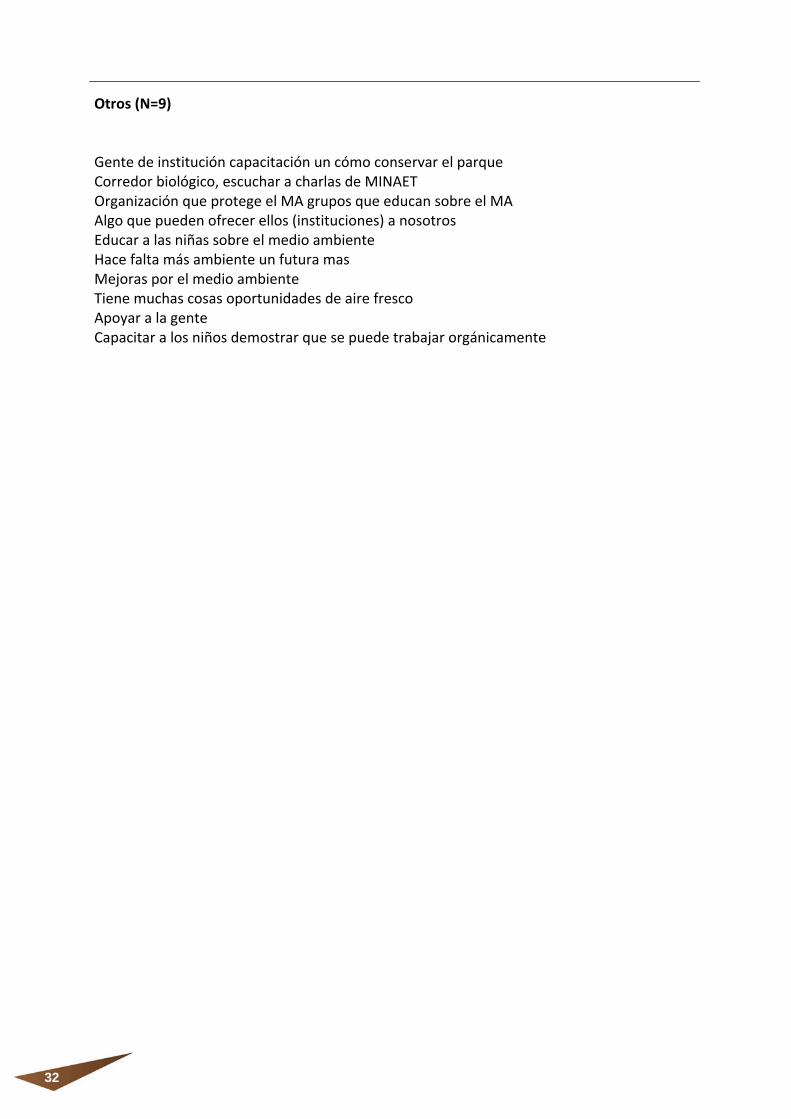
Appendix II: Original answers in Spanish: “Que entiende Ud por un servicio ambiental?”
30
Bienes que genere el bosque y nos benefician Generación de oxigeno y especies Todos los beneficios Producción del agua o oxígeno, diversidad Polinización, oxigena, aves, agua El aire más puro, mas agua, cuencas Lo que la naturaleza da a uno Disfrutar el ambiente por las cosas bonitas y diferentes Beneficios que recibe uno del parque como agua, aire, flora La fauna, la flora El aire, el agua Animales, aire puro, ambiente sano El medio ambiente que nos beneficia a nosotros como la atracción turística hace la belleza del parque N= 13
Protección Protección de los recursos naturales Proteger el ambiente Algo que conlleve a proteger los recursos naturales Protegemos la naturaleza, sembrar árboles, no cortar árboles, No tirar basura, Cuidar arboles Protección de agua, flora, fauna, no contaminar Proteger el medio ambiente Proteger sembrando arboles Proteger la naturaleza Conservación
31
Conservación La conservación del aire, naturaleza, el clima, arboles, reforestar Conserve el agua en las montanas Mantener conservación y producción de madera y orgánico Conservar, tratar de cuidar, sembrar arboles, no destruir Conservación agua, aire, sembrar arboles Conservar, mas ayuda para sembrar arboles Conservar el medio ambiente las personas que trabajan y ayudan
Cuidar Cuidar los animales y el bosque Sembrar arboles, cuidar el ambiente Cuidar el ambiente Cuidar los arboles, no quemar, no matar animales cuando no va a comer Cuidar el agua Maneras para cuidar el medio ambiente Cuidar los arboles
En general (N=38) Servicio al medio ambiente Lo que las personas pueden brindar al ambiente Todas las personas que cuidan Reciclaje, manejo de basura y desechos, reforestar Servicio del parque por turistas Salud con respecto de lo ambiental, colaboración con el medio ambiente Lo que la naturaleza da a uno Algo conlleva el equilibrio del medio ambiente Algo que no contamina Sembrar, reforestar no es el pago es la acción Todo que se refiere a actividades ambientales sembrar árboles, no casar Beneficios por el ambiente Reforestación, cuido de los ríos, montañas Sembrar plantas, conciencia populación Calles más limpia, recoger basura, no tirar basura Involvement of payment (N=8) FONAFIFO dinero para conservación Tener bosque en las pagan Algo una puede explotar/vender protegiendo el medio ambiente Pagan por conservar (Los países ricos pagan a los que tienen bosque por conservar) Conservar y pagar Pago de incentivo para conservar Hay muchas pagar por bosque, reforestar Personas que tiene tierra en PSA
32
Otros (N=9) Gente de institución capacitación un cómo conservar el parque Corredor biológico, escuchar a charlas de MINAET Organización que protege el MA grupos que educan sobre el MA Algo que pueden ofrecer ellos (instituciones) a nosotros Educar a las niñas sobre el medio ambiente Hace falta más ambiente un futura mas Mejoras por el medio ambiente Tiene muchas cosas oportunidades de aire fresco Apoyar a la gente Capacitar a los niños demostrar que se puede trabajar orgánicamente
33
Le programme SERENA traite des enjeux liés à l’émergence de la notion de « service environnemental » dans le domaine des politiques publiques concernant le milieu rural. Cette notion prend en compte non seulement la fonction productive des écosystèmes à travers l’agriculture, traditionnellement appréhendée par les politiques agricoles, mais aussi d’autres fonctions : régulation, culturelles…
L’objectif du programme SERENA est d’identifier les principes, les mécanismes et les instruments qui facilitent la prise en compte de la notion de service environnemental dans les nouveaux dispositifs d’action publique en milieu rural. Il s’agira de mieux comprendre les recompositions des politiques publiques et d’être en mesure d’élaborer des recommandations pratiques pour en améliorer la mise en œuvre.
Le programme SERENA, d’une durée de 4 ans (2009-2012), repose sur une analyse comparative internationale (France, Costa-Rica et Madagascar) et mobilise environ 40 scientifiques, essentiellement de sciences sociales, issus d’organismes de recherche français (IRD, CIRAD, CEMAGREF, CNRS, ENGREF, Université de Montpellier 3, Université de Versailles St Quentin en Yvelines, ENITAC, INRA…).
Les produits du programme SERENA (publications, guides opérationnels, CD Rom, site internet) seront déclinés pour deux publics principaux : la communauté scientifique et la communauté des acteurs impliqués dans les politiques environnementales et rurales (décideurs, experts, responsables d’organisations de la société civile et du secteur privé…).
The SERENA programme deals with issues linked to the emergence of the concept of environmental service in rural public policies. In this context, ecosystems managed by agriculture are not only analysed from a traditional productive function perspective but also for their regulatory, cultural functions, and thus for the services linked to the maintenance of habitats, biodiversity and landscape.
The overall objective of the SERENA programme is to identify the principles, mechanisms and instruments that enable for an incorporation of the environmental service concept in public action for rural areas. Findings help to adjust public policies and to give practical recommendations for service provision and management.
The SERENA programme runs for a period of four years (2009-2012), to carry out an international comparative analysis (France, Costa Rica and Madagascar). The scientific research team consists of about 40 scientists mainly from social sciences, and from various French research institutes (IRD, CIRAD, CNRS, ENGREF, CEMAGREF, University of Montpellier 3, University of Versailles Saint Quentin en Yvelines, ENITAC, INRA…).
The outcomes of the SERENA programme are publications, handbooks, CD ROMs and web pages targeting two user groups: the scientific community as well as stakeholders and decision-makers involved in environmental and rural policies formulation and implementation