Contents lists available at ScienceDirect Forest Ecology and Management journal homepage: www.elsevier.com/locate/foreco Elk responses to trail-based recreation on public forests Michael J. Wisdom a, ⁎ , Haiganoush K. Preisler b , Leslie M. Naylor c,1 , Robert G. Anthony d,2 , Bruce K. Johnson e , Mary M. Rowland a a USDA Forest Service, Pacific Northwest Research Station, 1401 Gekeler Lane, La Grande, OR 97850, USA b USDA Forest Service, Pacific Southwest Research Station, 800 Buchanan Street West Annex, Albany, CA 94710, USA c Department of Fisheries and Wildlife, Oregon State University, Corvallis, OR 97331, USA d Oregon Cooperative Fish & Wildlife Research Unit, Department of Fisheries & Wildlife, Oregon State University, Corvallis, OR 97331, USA e Oregon Department of Fish and Wildlife, 1401 Gekeler Lane, La Grande, OR 97850, USA ARTICLE INFO Keywords: All-terrain vehicles ATV riding Elk Forest roads Hiking Horseback riding Mountain biking Motorized traffic Off-highway vehicles Public forests Recreation Recreation trails Road avoidance Roads ABSTRACT Trail-based recreation is a popular use of public forests in the United States, and four types are common: all- terrain vehicle (ATV) riding, mountain biking, hiking, and horseback riding. Effects on wildlife, however, are controversial and often a topic of land use debates. Accordingly, we studied trail-based recreation effects on elk (Cervus canadensis), a wide-ranging North American ungulate highly sought for hunting and viewing on public forests, but that is sensitive to human activities, particularly to motorized traffic on forest roads. We hypothe- sized that elk would respond to trail-based recreation similarly to their avoidance of roads open to motorized traffic on public forests. We evaluated elk responses using a manipulative landscape experiment in a 1453-ha enclosure on public forest in northeast Oregon. A given type of recreation was randomly selected and im- plemented twice daily along 32 km of designated recreation trails over a five-day period, followed by a nine-day control period of no human activity. Paired treatment and control replicates were repeated three times per year for each recreation type during spring-fall, 2003–2004. During treatments, locations of elk and recreationists were simultaneously collected with telemetry units. Elk locations also were collected during control periods. Elk avoided the trails during recreation treatments, shifting distribution farther out of view and to areas farthest from trails. Elk shifted distribution back toward trails during control periods of no human activity. Elk avoided recreationists in real time, with mean minimum separation distances from humans that varied from 558 to 879 m among the four treatments, 2–4 times farther than elk distances from trails during recreation. Separation dis- tances maintained by elk from recreationists also were 3–5 times farther than mean distances at which elk could be viewed from trails. Distances between elk and recreationists were highest during ATV riding, lowest and similar during hiking and horseback riding, and intermediate during mountain biking. Our results support the hypothesis that elk avoid trail-based recreation similarly to their avoidance of roads open to motorized traffic on public forests. Forest managers can use results to help optimize trade-offs between competing objectives for trail- based recreation and wildlife species like elk that are sensitive to human activities on public forests. 1. Introduction Trail-based recreation is common on public forests in the United States, and four types are especially popular: all-terrain vehicle (ATV) riding, mountain biking, hiking, and horseback riding (Cordell, 2012). ATV riding, in particular, has increased rapidly. The number of off- highway vehicle (OHV) riders reached 36 million in the early 2000s (Cordell, 2012), and is projected to increase ∼30–60% (to 62–75 million participants) by 2060 (Bowker et al., 2012). Increasing ATV use has prompted concerns about effects on wildlife (Proescholdt, 2007; Tarr et al., 2010; Webb and Wilshire, 2012), which include distribution shifts of populations away from trails; increased flight responses, movement rates and energetic costs; reduced foraging times; and re- duced carrying capacity from cumulative effects (Havlick, 2002; Brillinger et al., 2004, 2011; Wisdom et al., 2004a; Preisler et al., 2006, 2013; Naylor et al., 2009; Ciuti et al., 2012). https://doi.org/10.1016/j.foreco.2018.01.032 Received 29 November 2017; Received in revised form 19 January 2018; Accepted 19 January 2018 ⁎ Corresponding author. 1 Current address: Confederated Tribes of the Umatilla Indian Reservation, Department of Natural Resources, Agricultural Service Center, Room 2, 10507 North McAlister Road, Island City, OR 97850, USA. 2 Deceased. E-mail addresses: [email protected](M.J. Wisdom), [email protected](H.K. Preisler), [email protected](L.M. Naylor), [email protected](B.K. Johnson), [email protected](M.M. Rowland). Forest Ecology and Management 411 (2018) 223–233 0378-1127/ Published by Elsevier B.V. T
Transcript
Contents lists available at ScienceDirect
Forest Ecology and Management
journal homepage: www.elsevier.com/locate/foreco
Elk responses to trail-based recreation on public forests
Michael J. Wisdoma,⁎, Haiganoush K. Preislerb, Leslie M. Naylorc,1, Robert G. Anthonyd,2,Bruce K. Johnsone, Mary M. Rowlanda
aUSDA Forest Service, Pacific Northwest Research Station, 1401 Gekeler Lane, La Grande, OR 97850, USAbUSDA Forest Service, Pacific Southwest Research Station, 800 Buchanan Street West Annex, Albany, CA 94710, USAc Department of Fisheries and Wildlife, Oregon State University, Corvallis, OR 97331, USAdOregon Cooperative Fish & Wildlife Research Unit, Department of Fisheries & Wildlife, Oregon State University, Corvallis, OR 97331, USAeOregon Department of Fish and Wildlife, 1401 Gekeler Lane, La Grande, OR 97850, USA
Trail-based recreation is a popular use of public forests in the United States, and four types are common: all-terrain vehicle (ATV) riding, mountain biking, hiking, and horseback riding. Effects on wildlife, however, arecontroversial and often a topic of land use debates. Accordingly, we studied trail-based recreation effects on elk(Cervus canadensis), a wide-ranging North American ungulate highly sought for hunting and viewing on publicforests, but that is sensitive to human activities, particularly to motorized traffic on forest roads. We hypothe-sized that elk would respond to trail-based recreation similarly to their avoidance of roads open to motorizedtraffic on public forests. We evaluated elk responses using a manipulative landscape experiment in a 1453-haenclosure on public forest in northeast Oregon. A given type of recreation was randomly selected and im-plemented twice daily along 32 km of designated recreation trails over a five-day period, followed by a nine-daycontrol period of no human activity. Paired treatment and control replicates were repeated three times per yearfor each recreation type during spring-fall, 2003–2004. During treatments, locations of elk and recreationistswere simultaneously collected with telemetry units. Elk locations also were collected during control periods. Elkavoided the trails during recreation treatments, shifting distribution farther out of view and to areas farthestfrom trails. Elk shifted distribution back toward trails during control periods of no human activity. Elk avoidedrecreationists in real time, with mean minimum separation distances from humans that varied from 558 to 879mamong the four treatments, 2–4 times farther than elk distances from trails during recreation. Separation dis-tances maintained by elk from recreationists also were 3–5 times farther than mean distances at which elk couldbe viewed from trails. Distances between elk and recreationists were highest during ATV riding, lowest andsimilar during hiking and horseback riding, and intermediate during mountain biking. Our results support thehypothesis that elk avoid trail-based recreation similarly to their avoidance of roads open to motorized traffic onpublic forests. Forest managers can use results to help optimize trade-offs between competing objectives for trail-based recreation and wildlife species like elk that are sensitive to human activities on public forests.
1. Introduction
Trail-based recreation is common on public forests in the UnitedStates, and four types are especially popular: all-terrain vehicle (ATV)riding, mountain biking, hiking, and horseback riding (Cordell, 2012).ATV riding, in particular, has increased rapidly. The number of off-highway vehicle (OHV) riders reached 36 million in the early 2000s(Cordell, 2012), and is projected to increase ∼30–60% (to 62–75
million participants) by 2060 (Bowker et al., 2012). Increasing ATV usehas prompted concerns about effects on wildlife (Proescholdt, 2007;Tarr et al., 2010; Webb and Wilshire, 2012), which include distributionshifts of populations away from trails; increased flight responses,movement rates and energetic costs; reduced foraging times; and re-duced carrying capacity from cumulative effects (Havlick, 2002;Brillinger et al., 2004, 2011; Wisdom et al., 2004a; Preisler et al., 2006,2013; Naylor et al., 2009; Ciuti et al., 2012).
https://doi.org/10.1016/j.foreco.2018.01.032Received 29 November 2017; Received in revised form 19 January 2018; Accepted 19 January 2018
⁎ Corresponding author.
1 Current address: Confederated Tribes of the Umatilla Indian Reservation, Department of Natural Resources, Agricultural Service Center, Room 2, 10507 North McAlister Road, IslandCity, OR 97850, USA.
Mountain biking, hiking, and horseback riding also are popular usesof public lands in the United States (Cordell, 2012), and all three ac-tivities are among those projected to increase most in per capita par-ticipation by 2060 (Bowker et al., 2012). Mountain biking, in parti-cular, is growing rapidly, with an increase in users of 22% from 2006 to2015 (The Outdoor Foundation, 2016). In 2006, cycling (road andmountain biking) was the fourth-most popular recreational activity inthe United States, behind fishing, camping, and running (Cordell,2012); mountain biking had> 820 million user days in 2008 (Cordell,2012).
In contrast to ATV riding, non-motorized forms of trail-based re-creation often are considered benign by recreationists (Taylor andKnight, 2003a; Larson et al., 2016), but current knowledge indicatesotherwise (Green and Higginbottom, 2000; Leung and Marion, 2000;Newsome and Moore, 2008; Naylor et al., 2009; Ciuti et al., 2012;Larson et al., 2016; Hennings and Soll, 2017). Effects on wildlife aresimilar to those of ATV riding (e.g., population displacement away fromtrails, Larson et al., 2016), but ATVs likely have more pronounced ne-gative effects because of high levels of speed and noise and thus affectmore area per unit time (Lovich and Bainbridge, 1999; Wisdom et al.,2004a; Proescholdt, 2007; Naylor et al., 2009; Ciuti et al., 2012;Preisler et al., 2013). Motorized uses like ATV riding thus are morelikely to have a greater impact than non-motorized recreation on wide-ranging mammals whose large home ranges put them in more frequentcontact with the larger ranges and spatial influence of motorized riders(Wisdom et al., 2004a; Ciuti et al., 2012; Beyer et al., 2013).
Concerns about ATV use and the more general effects of motorizedtraffic on wildlife and other natural resources prompted the USDAForest Service to revise its policy regarding motorized travel manage-ment on National Forests in 2005. A new regulation that year requiredthat all roads, trails, and areas open to motorized use be formally de-signated to better manage vehicle traffic and prevent resource damage(USDA Forest Service, 2004; Federal Register, 2005; Adams andMcCool, 2009). This change in policy acknowledged a variety of ne-gative effects from unmanaged motorized uses, especially OHVs, whosenumbers had been increasing steadily on National Forests (Cordell,2005; Federal Register, 2005). Similar changes in policy have occurredon state-managed forests in response to negative effects of OHVs (Asahet al., 2012a, 2012b).
Despite the changes in public forest policy that occurred over adecade ago, current knowledge of both motorized and non-motorizedrecreation is not well-developed regarding the extent and intensity ofeffects at most spatial and temporal scales meaningful to wildlife po-pulations (Gutzwiller et al., 2017). Wisdom et al. (2004a), Preisler et al.(2006, 2013), and Naylor et al. (2009) addressed some of theseknowledge voids with their ungulate research in northeast Oregon,United States, and Ciuti et al. (2012) conducted a similar study in Al-berta, Canada. Replication elsewhere and for many wildlife species,however, is lacking. Knowledge voids have likely contributed to on-going public debate about recreational uses on public forests, particu-larly ATV riding (Asah et al., 2012a, 2012b). Public comments on Na-tional Forest travel management plans have been diverse and con-tentious (Yankoviak, 2005; Thompson, 2007), reflecting strong societalviews in the face of limited knowledge and perceptions of overly re-strictive federal policies (Adams and McCool, 2009).
In response to these issues, we studied effects of trail-based re-creation on elk (Cervus canadensis), a wide-ranging North Americanungulate highly sought for hunting and viewing on public forests, butthat is sensitive to human activities, particularly to motorized traffic onforest roads (e.g., Lyon, 1983; Cole et al., 1997, 2004; Rowland et al.,2000, 2004; Frair et al., 2008; Montgomery et al., 2012, 2013;Prokopenko et al., 2016). We hypothesized that populations of elkwould avoid trail-based recreation similarly to their avoidance of roadsopen to motorized traffic on public forests during non-hunting periodsof late spring through early fall. We further hypothesized that avoid-ance would occur at distances that allow elk to stay out of view of
recreationists, and that avoidance would be strongest in response tomotorized recreation (ATV riding).
We tested our hypotheses by evaluating behavioral responses of elkto trail-based recreation using a manipulative landscape experiment ina 1453-ha enclosure on public forest in northeast Oregon. We had 2objectives: (1) to document the degree of elk avoidance of trails duringeach recreation activity, compared to control periods of no activity; and(2) to evaluate direct, real-time responses of elk to recreationists duringeach type of recreation. We estimated distances between elk and thetrails during recreation activities, and in real time between elk andrecreationists based on simultaneous collection of telemetry locations ofanimals and humans. We provided context for interpreting results byestimating the distances at which elk could be viewed from the trails,per our hypothesis that avoidance occurs at distances that allow elk tohide from view. We also characterized differences in spatial distribu-tions of elk during each type of recreation treatment versus pairedcontrol periods when no humans were present.
Research was conducted with approval and guidance by the StarkeyInstitutional Animal Care and Use Committee (IACUC 92-F-0004), asrequired by the United States Animal Welfare Act of 1985. We followedprotocols established by the IACUC for conducting ungulate research atthe Starkey Experimental Forest and Range (Wisdom et al., 1993).
2. Materials and methods
2.1. Study area
Research was conducted from April-October 2003–2004 at theUSDA Forest Service Starkey Experimental Forest and Range (Starkey),35 km southwest of La Grande in northeast Oregon, USA (Fig. 1A). In1987, approximately 10,125 ha of elk summer range within Starkeywere enclosed with a 2.4 m (8-foot) elk-proof fence for long-term un-gulate research (Rowland et al., 1997; Wisdom, 2005). Our study wasconducted in the 1453-ha Northeast Study Area (Fig. 1A), which isseparated from Starkey’s other study areas by elk-proof fence (Wisdomet al., 2005). The Northeast Study Area is further subdivided by elk-proof fence into 2 pastures, East (842 ha) and West (610 ha) (Stewartet al., 2005). Approximately 98 elk occupied the East Pasture (69 adultfemales, 16 calves, and 13 adult males) and 25 occupied the WestPasture (18 adult females, 2 calves, and 5 adult males). Elk were lasthunted in the study area in 1996 as part of a rifle hunt of males toevaluate their responses to motorized versus non-motorized huntingaccess (Wisdom et al., 2004b). Our research did not include huntingand focused on the non-hunting periods of late spring through early fall.
Approximately 70% of the area was forested, arranged in a mosaicof patches interspersed with thin-soiled grasslands. Forested areas werecomposed of dry or mixed conifer types common to the interior westernUnited States (Wisdom et al., 2005). Dominant tree species includedPonderosa pine (Pinus ponderosa), Douglas-fir (Pseudotsuga menziesii),grand fir (Abies grandis), and western larch (Larix occidentalis). Ap-proximately 50% of the forest types underwent commercial timberharvest from 1992 to 1994 that included clearcutting, seed tree, andshelterwood prescriptions applied as small (1–22 ha) harvest units in-terspersed with untreated stands (Wisdom et al., 2004b). Regenerationcuts established a mosaic of open and closed forest structural condi-tions, interspersed with the less common open grasslands (Wisdom,2004b). Rowland et al.,(1997), Stewart et al. (2005), Wisdom (2005),and Naylor et al. (2009) provide details about the study area and pastresearch.
2.2. Data collection
2.2.1. Recreation treatments and locations of recreationistsWe implemented ATV riding, mountain biking, hiking, and horse-
back riding as four separate types of recreation treatments to which elkresponses were evaluated during spring-fall, 2003–2004. A given
M.J. Wisdom et al. Forest Ecology and Management 411 (2018) 223–233
224
treatment type was implemented over a five-day period, followed bynine days of control, during which no human activity occurred in thestudy area. Each pair of treatment and control replicates was appliedthree times/year for each of the four types of recreation (12 totaltreatment–control periods annually, 24 for the two years), with theorder of treatment type randomly assigned. During each five-dayperiod, the assigned treatment was implemented along 32 km of re-creation trails that followed old road beds and trails typically used byrecreationists on public forests (Fig. 1A) (Wisdom et al. 2004a). Aninitial two-week control period was implemented each year beforetreatments began.
Treatments were implemented by recreationists who traveled thetrails once each morning (0800–1159 h local time) and afternoon(1200–1600 h local time) while carrying global positioning system(GPS) units to record their locations. Coverage of the 32 km of trails ona given morning or afternoon required one group of ATV riders ormountain bikers, two groups of hikers, and three groups of horsebackriders because of differences in recreation speeds (Wisdom, un-published data; see Section 4). Each of the two groups of hikers tra-versed one-half of the trails, and each of the three groups of horsebackriders rode one-third. This design resulted in the same spatial coverageof recreationists on trails, and exposure of elk to recreationists, eachmorning and afternoon, but with different rates of speed (Naylor, 2006;see Section 4).
Each treatment followed a “tangential” experimental approach inwhich recreationists did not directly target or pursue elk, but remainedalong the pre-determined trails (Taylor and Knight, 2003b). Recrea-tionists followed explicit instructions regarding these methods of im-plementing the treatments. See Naylor et al. (2009) for additional de-tails about design and implementation of the treatments.
GPS units (Trimble 3C, Trimble, Inc.) worn by recreationists col-lected human locations continuously (every second). Mean spatial errorof GPS locations was< 10m, based on distances measured in ArcGIS
(ArcGIS 9.2, Environmental Systems Research Institute, Inc., Redlands,CA) between the plotted locations of recreationists and the geo-refer-enced location of the recreation trails (Wisdom, unpublished data).
2.2.2. Telemetry locations of elkWe used long-range aid to navigation (LORAN-C) and GPS telemetry
(Johnson et al., 1998; Hansen and Riggs, 2008) to evaluate responses of35 telemetered adult female elk to the four types of recreation. Tele-metry locations were collected throughout each five-day treatment andpaired nine-day control.
Telemetry collars were programmed to obtain one location/tele-metered elk every 10 and 30min under the LORAN-C and GPS systems,respectively, during recreation treatments. The higher relocationschedule of LORAN-C collars was designed to analyze the real-timeresponses of telemetered elk to the telemetered recreationists. Similardata were collected in 2002 and published earlier (Wisdom et al.,2004a), but with different response variables than considered here. Allcollars were programmed at 30-min relocation schedules during controlperiods. Limited battery life of GPS collars and sampling restrictions onthe total number of LORAN-C locations that could be collected amongall collars at Starkey study areas (Johnson et al., 1998) dictated the 30-min relocation schedule during control periods.
Spatial error of the elk telemetry locations was< 50m and<20mfor LORAN-C and GPS telemetry, respectively (Johnson et al., 1998;Hansen and Riggs, 2008). Fix success, defined as the percentage ofprogrammed locations successfully obtained from collars, exceeded98% for GPS data, indicating no need for bias correction (Frair et al.,2004; Nielson et al., 2009). Fix success for LORAN-C data averaged 65%and was largely associated with unbiased sources of random variation(Johnson et al., 1998). LORAN-C fix success varied slightly by location,however, and was corrected with a spatially-explicit algorithm devel-oped for the study area (Johnson et al., 1998, 2000).
Fig. 1. Location of the 1453-ha Northeast Study Area, Starkey Experimental Forest and Range, northeast Oregon, USA, with 32 km of recreation trails on which four recreation treatmentswere evaluated during 2003–2004 (A). Viewing distances were estimated in eight cardinal directions at sampling points every 0.2 km along trails (upper right, B), and 50-m distanceintervals from the trails were mapped to estimate the percentage of study area in relation to viewing distances and elk locations (B).
M.J. Wisdom et al. Forest Ecology and Management 411 (2018) 223–233
225
2.2.3. Viewing distancesAt the conclusion of the study, we measured the distances at which
we estimated an elk could be viewed from the recreation trails (Fig. 1B).Viewing distances provided context for interpreting the distances thatelk maintained from the recreation trails and from recreationists duringtreatments, and for evaluating support for our hypothesis that elkwould stay hidden from view of recreationists.
We sampled viewing distances approximately every 0.2 km alongthe trails, for a total of 231 sampling points. At each sampling point, weused a GPS unit (Trimble Unit TSCe, Trimble, Inc.) to spatially referencethe point and used a laser rangefinder (Bushnell™ Yardage Pro 1000) tomeasure the distance at which we estimated an elk could be viewed.Because elk could be viewed at any possible angle from the trails, wemeasured distances in the eight cardinal compass directions, with 0degrees set as straight ahead on the trail at a given sampling point(Fig. 1B).
Viewing distances can be interrupted by topography or vegetation,such that elk can be viewed at closer and farther distances but not inbetween. Consequently, for each of the eight angles, we measured thedistance at which an elk could be viewed to the first point of visualobstruction, referred to as the “near” distance. We also measured thesubsequent distance at which an elk could be viewed, beyond the firstpoint of visual obstruction, referred to as the “far” distance. The fardistance thus represented the distance at which elk could be viewedwithout consideration of the near distance obstruction. For a givenviewing angle in which there were no obstructed areas between nearand far distances, the near and far distances were identical and re-corded as the same for both distances. By contrast, near and far dis-tances could be substantially different where dense vegetation or to-pography obstructed views close to the trails, but open areas could beviewed farther from the trails. Rangefinder estimation errors generallywere< 5% of the true distance (Wisdom, unpublished data), similar topublished estimates of these technologies as tested in forest environ-ments (Sicking, 1998).
2.3. Data analysis
2.3.1. Viewing distances from trailsWe calculated the mean and 95% confidence interval (CI) of the
near and the far viewing distances to which elk could be viewed fromthe recreation trails, considering all distances measured at the samplingpoints. We used each sampling point as a sample unit and the eightdistance measurements/sampling point as subsamples. We averaged thevalues of the eight near viewing distances measured at each samplingpoint, and did the same for the eight far viewing distances, to estimatethe mean values and 95% CIs.
We also calculated the percentage of near and far viewing distancesby 50-m distance intervals away from the recreation trails (Fig. 1B), andthe percentage of the study area within these distance categories. Wedid the same for the percentage of the study area from trails within themaximum viewing distance, estimated to be 300m. Analyses providedinsight about the percentage of the study area in which elk could beviewed from the recreation trails.
2.3.2. Avoidance of trailsWe used analysis of variance (ANOVA) with random elk effects (i.e.,
each telemetered elk as a sample unit) to evaluate differences in meandistances (± 95% CIs) of elk from the nearest trail among the fourrecreation treatments and paired controls, and further summarizedthese distances in parallel boxplots with median notches (Chamberset al., 1983; Benjamini, 1988). Mean distances and boxplots of elk fromthe nearest trail were summarized for each telemetered elk/day/treat-ment type and control, pooled across like replicates, using observationsthat were averaged for each morning (0800–1159 h local time) andeach afternoon (1200–1600 h local time). This analysis evaluatedaverage responses to treatments across seasons and years, but
accounting for diurnal effects (Wisdom et al., 2004a; Naylor et al.,2009). Prior analyses (Wisdom et al., 2004a; Wisdom, unpublisheddata) also indicated that elk in a given pasture responded to recreationtreatments in both pastures, given the adjacency of trails and longdistances of elk responses. Calculation of distances thus consideredtrails in both pastures. Results were further related to the mean nearand far viewing distances (± 95% CIs) from trails.
We analyzed the spatial distribution of elk in relation to trails in twoadditional ways. First, we calculated the percentage of elk locations by50-m distance intervals from the nearest trail during each treatmenttype and control, and percentage of near and far viewing distances bythe 50-m intervals. Locations were pooled across animals. And second,we estimated and mapped kernel densities of elk locations during eachtreatment type and control. Kernel densities (Venables and Ripple,1997) were based on the pooled locations among telemetered elk as anestimate of the stationary distribution of the population (Preisler et al.,2013) during each treatment type and control. We used a randomsubsample of locations from the recreation treatments equal to thenumber of locations during the corresponding control periods to esti-mate kernel densities and produce comparable maps.
Analyses of elk distances and distributions in relation to trailsdocumented the degree of trail avoidance and whether the elk popu-lation shifted beyond viewing distances during the recreation treat-ments, and shifted back toward trails during control periods. If elk werefarther from trails than they could be viewed during recreation, thiswould support our hypothesis that avoidance was related to elk stayinghidden from view. Moreover, a shift in elk distributions closer to thetrails during control periods, with more locations in view during theseperiods of no human activity, would further support this hypothesis as apotential cause-effect process.
2.3.3. Avoidance of recreationistsWe analyzed the minimum separation distances that elk maintained
from recreationists as a measure of how tolerant elk were to theproximity of humans. We first matched the locations of recreationists intime with the LORAN-C telemetry locations of elk (Preisler et al., 2006).LORAN-C elk locations were used because of the higher relocationfrequency (every 10min) compared to the GPS telemetry locations(every 30min), thus providing a larger set of close matches in time.Each LORAN-C elk location was matched with the location of thenearest group of recreationists closest in time to the elk location, con-sidering all locations of recreationists within a five-minute timewindow before each elk location. Time-matched locations of elk andrecreationists were measured as the shortest Euclidean distance be-tween each (ArcGIS 9.2, Environmental Systems Research Institute,Inc., Redlands, CA).
To calculate the mean and 95% CI for the minimum separationdistance/treatment type, we identified the distance of each LORAN-Celk to the nearest group of recreationists during each morning and eachafternoon for each of the five days of a treatment replicate. This pro-vided two observations of minimum distance/elk/day/treatment re-plicate, spanning the three seasons and two years. Minimum separationdistances/elk for each morning and afternoon were used as subsamples,and a mean minimum distance of these values calculated for each an-imal among replicates of each treatment type. We then calculated themean minimum distance and 95% CI among all LORAN-C telemeteredelk (n=19) across like replicates in the same manner as done forcalculating mean distances from trails. We further analyzed the dis-tribution of minimum separation distances of elk with boxplots andmedian notches by treatment type.
We considered minimum separation distance to be the most directindicator of the spatial tolerance of elk to recreationists, particularlytheir tolerance to remain in view. Elk often seek edges close to cover orin cover, presumably for hiding from humans or predators, even duringnon-hunting periods of spring-fall (Witmer et al., 1985; Johnson et al.,2000; Coe et al., 2011; Harju et al., 2011; Buchanan et al., 2014).
M.J. Wisdom et al. Forest Ecology and Management 411 (2018) 223–233
226
Evaluation of separation distances in relation to viewing distancesconsidered elk use of visual obstructions of cover and topography tohide from view as part of avoidance responses.
3. Results
3.1. Viewing distances from trails and area available for elk use
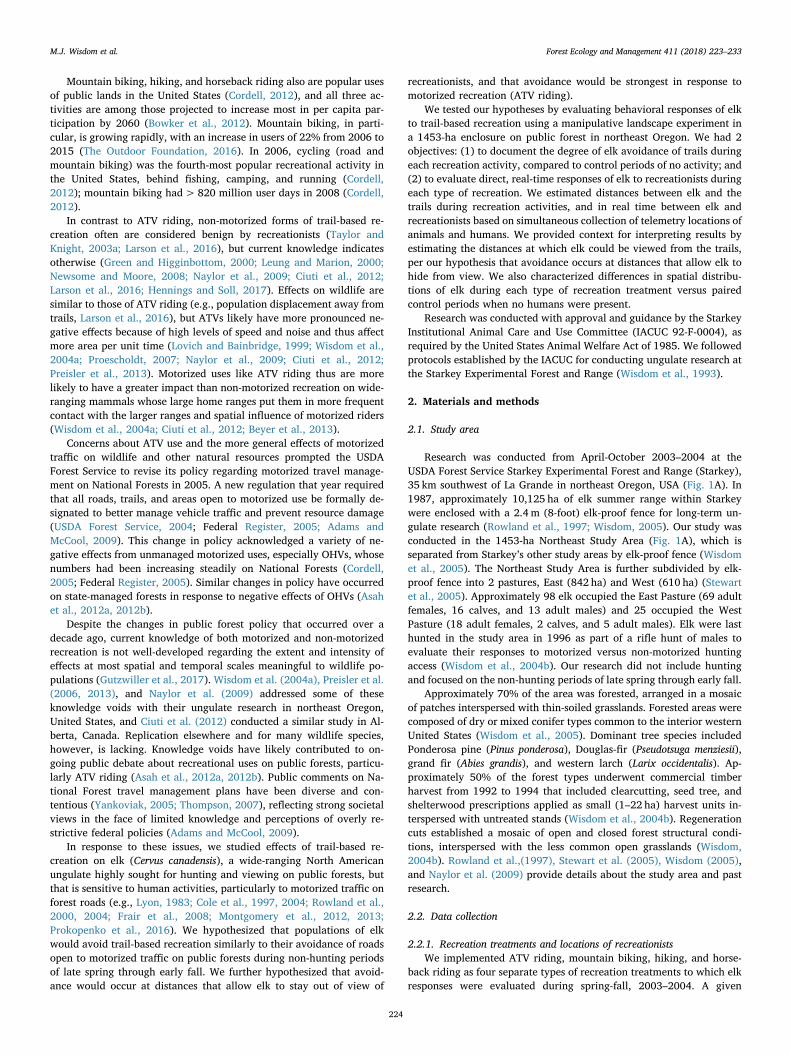
Mean near and far distances to which elk could be viewed from therecreation trails were 172m and 222m, respectively (Fig. 2A; Table 1).Over 50% of the study area was within the mean near viewing distanceof 172m, and> 70% was within the mean far viewing distance of222m, based on study area percentage by distance intervals from trails(Fig. 2A). Just 15% of the study area exceeded the maximum viewingdistance of 300m that was estimated for near and far viewing distancesat 18% and 43% of the sampling points, respectively (Fig. 2A). Thepercentage of the study area available for elk use by 50-m distanceintervals from trails (Fig. 1B, 2A) directly followed the patterns of studyarea percentage by viewing distance (Fig. 2A).
3.2. Elk avoidance of trails
We found significant differences in elk avoidance of trails among thefour recreation treatments and paired controls (ANOVA, P < .01).Mean distances of elk from the recreation trails ranged from 239 to310m during the four recreation activities (Fig. 3; Table 1). Mean andmedian distances were significantly farther (non-overlapping 95% CIsand median notches) during ATV riding, mountain biking, and horse-back riding than distances of these same telemetered elk during thepaired control periods (Fig. 3; Table 1), indicating that elk moved awayfrom the trails during recreation and back toward trails when no hu-mans were present. During hiking, mean and median distances of elkfrom trails were similar to those during horseback riding, but elkmovement back toward trails during the hiking control period was lessdistinct (Fig. 3), and CIs for the hiking treatment and control periodsslightly overlapped (5-m overlap, Table 1).
Shifts of elk away from and back toward trails in the presence versusabsence of recreationists were evident in the boxplot distributions(Fig. 3). Shifts also were evident spatially in the kernel densities of elklocations of paired treatment and control periods, shown in Fig. 4 forATV and horseback riding. Similar spatial differences in kernel densitiesbetween treatment and control periods were found during mountain
Fig. 2. Percentage of near and far viewing distance values by 50-m distance intervals from the recreation trails (A) in relation to the percentage of the study area and percentage of elklocations by intervals (B), Northeast Study Area, Starkey Experimental Forest and Range, northeast Oregon, USA. Elk locations were from 35 telemetered elk monitored during all-terrainvehicle riding, mountain biking, hiking, and horseback riding, 2003–2004 combined.
Table 1Mean (± 95% CI) near and far distances at which elk could be viewed from recreation trails, and mean distances (± 95% CIs) that elk maintained from nearest trail during all-terrainvehicle riding (ATV), mountain biking (BIKE), hiking (HIKE), and horseback riding (HORSE) treatments (T) and control periods (C), 2003–2004, Northeast Study Area, StarkeyExperimental Forest and Range, northeast Oregon, USA.
Mean viewing distance (m) (N=231) Mean distance (m) of elk from nearest trail (N= 35)
M.J. Wisdom et al. Forest Ecology and Management 411 (2018) 223–233
227
biking. Shifts away from and back toward trails during the hikingtreatment versus control periods were more subtle, as reflected in thesmall overlap of CIs of mean values (Table 1) and overlapping mediannotches (Fig. 3).
Mean and median distances of elk from the recreation trails werefarther during ATV riding than during the three non-motorized types ofrecreation (non-overlapping CIs and notches); these distances were notdifferent between mountain biking, hiking, and horseback riding(overlapping CIs and notches, Fig. 3; Table 1). Boxplot distributions,however, indicated an overall trend of strongest avoidance during ATVriding, followed by mountain biking, hiking, and horseback riding(Fig. 3). These trends were supported by the rank order of both meanand median values among the four treatments (Fig. 3; Table 1).
Variability in mean distances among individual elk, however, washighest (least precise) during ATV riding. Lower precision of elk re-sponse to ATV riding was evident in the longer boxplot below themedian, and high number of individual mean distances farther belowthe median, compared to other types of recreation (Fig. 3), suggestingthat ATV riding elicited either a hiding (stationary) or a flight (active)response (see Section 4). Higher precision was associated with elk re-sponses to horseback riding and hiking, and during all control periodsexcept hiking.
Mean distances of elk from the trails also were farther (non-over-lapping CIs) during all four recreation activities than the mean near andfar viewing distances (Table 1). The large majority of elk locations werewell beyond the mean near and far viewing distances from trails, and44% of all elk locations during the recreation treatments were beyondthe maximum viewing distance of 300m (Fig. 2B). This pattern wasstronger during ATV riding and mountain biking, when 52% and 50%of all elk locations occurred> 300m from the trails. The pattern wasweaker during hiking and horseback riding, when 37% and 25% of elklocations were beyond the maximum viewing distance (Fig. 2B).
Almost one-half (44%) of elk locations occurred on just 15% of thestudy area farthest from trails and out of view (Fig. 2B). The largemajority (85%) of the study area was within the maximum viewingdistance of 300m from the recreation trails, but only 56% of elk loca-tions occurred in these distance intervals (Fig. 2B). These patterns wereevident in the kernel densities of treatment versus control periods(Fig. 4).
3.3. Elk avoidance of recreationists
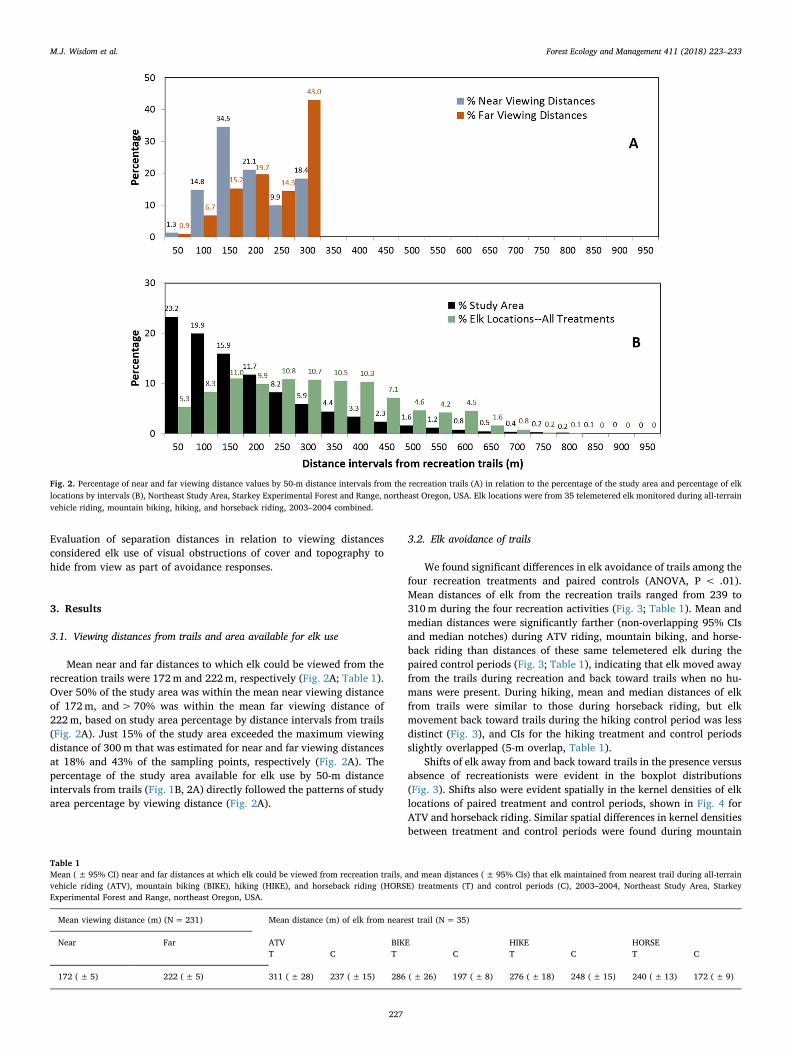
Mean minimum separation distances that elk maintained from re-creationists were highest during ATV riding (879m,±68m), lowestand similar during hiking (547m,± 44m) and horseback riding(558m,±45m), and intermediate during mountain biking(662m,±53m). Boxplot distributions and median notches followedthis same pattern (Fig. 5): median distances were highest during ATVriding, followed by mountain biking, both of which had non-over-lapping notches with each other and with the overlapping notches ofhiking and horseback riding. The taller height of the boxplot above themedian during ATV riding compared to other types of recreation(Fig. 5) further illustrated the stronger but less precise elk response tomotorized recreation.
Separation distances from recreationists were significantly fartherthan elk distances from trails (non-overlapping CIs with those inTable 1), illustrating the difference in real-time responses of elk to re-creationists (five-minute time windows each morning and afternoon)versus the more static responses to trails (8-h time window each day).Specifically, mean minimum distances of elk from recreationists(558–879m) were 2–4 times farther than mean distances from trails(239–310m, Table 1) during the same recreation periods. Differences inelk distances from recreationists also were more distinct and consistent(more precise) between the four treatments than those for distancesfrom trails (boxplot variability across treatments in Fig. 3 versus 5),suggesting that the direct responses of elk to recreationists was morepredictable than their indirect responses to trails.
Minimum separation distances also were 3–5 times farther than themean near and far distances of 172 and 222m at which elk could beviewed from the trails (non-overlapping CIs with those in Table 1), and2–3 times farther than the maximum viewing distance of 300m. Over75% of the minimum distances between elk and recreationists exceededthe maximum viewing distance of 300m (see boxplot portions above300m, Fig. 5), indicating a strong tendency of elk to be hidden fromview of recreationists. This percentage of elk distances from recrea-tionists beyond 300m, estimated for a 5-min time window (Fig. 5), washigher than the estimate of 44% of elk locations beyond 300m based onthe more generic 8-h time window (Fig. 2B). The long “tails” of elkdistances extremely far from recreationists (e.g., 1500–4000m dis-tances, per dotted lines in uppermost part of each boxplot, Fig. 5) wereevident during all four recreation activities, indicating avoidance
Fig. 3. Parallel boxplots showing the variabilityamong elk (variability within each box) andamong treatments (variability between boxes) inmean distances of telemetered elk (n= 35) fromthe nearest recreation trail during four types ofrecreation (all-terrain vehicle riding [ATV],mountain biking [Bike], hiking [Hike], horsebackriding [Horse]) and corresponding control (C)periods, 2003–2004, Northeast Study Area,Starkey Experimental Forest and Range, northeastOregon, USA. Non-overlapping notches provide‘strong evidence’ that the two medians differ(Chambers et al. 1983, p. 62; Benjamini, 1988).Silver dots show mean distances of individual elk.The two horizontal grey lines indicate the meannear (172m) and mean far (222m) viewing dis-tances from trails.
M.J. Wisdom et al. Forest Ecology and Management 411 (2018) 223–233
228
responses at distances as far as possible from recreationists.
4. Discussion
4.1. Elk avoidance of recreation trails and recreationists
Our results showed strong avoidance by elk to the recreation trailsduring each of the four types of recreation. Almost one-half of all elktelemetry locations during the recreation activities occurred on just15% of the study area farthest from trails. Elk avoidance of recreationtrails was strongest during ATV riding. Elk avoidance of trails duringmountain biking, hiking and horseback riding was statistically similarbut the distribution of elk locations during these three types of re-creation indicated that elk shifted farther from trails during mountainbiking.
Elk avoidance of trails was calculated as the mean distance of tel-emetered elk to trails, using data pooled for each animal across treat-ment and control replicates of each recreation type. Estimates thusrepresented the “average” distribution of elk in relation to trails duringeach recreation treatment, and did not account for finer temporal
responses, such as potential population shifts away from and back to-ward trails as recreationists passed by a given area. By contrast, theminimum separation distances that elk maintained from recreationistsin real time documented the direct effect of human movement on thespecies’ behavior at five-minute time windows during each recreationtreatment. Results showed that elk were quite sensitive to human pre-sence, shifting distributions away from recreationists and farther out ofview as the activities moved along the trails. The minimum daily dis-tances maintained by elk from recreationists were notably large(averaging 558–879m among treatments), indicating a strong spatialintolerance of elk to recreationists and well beyond areas visible fromtrails. Direct responses of elk to recreationists were stronger and moreprecise across treatments than their indirect responses to trails.
The pattern of long-distance avoidance by elk to recreationists wassupported by real-time documentation of elk fleeing from approachingrecreationists that was documented in earlier publications from datacollected in our study area (Preisler et al., 2006, 2013). Flight responsesof elk to the recreation activities in our study area showed substantiallyhigher probabilities of flight than expected at distances of 500–1000m(Wisdom et al., 2004a). Minimum separation distances in our study
Fig. 4. Locations of 35 elk during ATV riding (ATV, A) and horseback riding (Horse, C) versus corresponding control periods (B and D), superimposed on estimates of the spatialprobability distribution of elk locations, estimated as kernel densities, 2003–2004, Northeast Study Area, Starkey Experimental Forest and Range, northeast Oregon, USA. Probability ofuse is scaled from 0 to 1, with higher use shown by warmer colors (yellow, then green) and lower use by cooler colors (light blue, then dark blue). Red lines are the recreation trails andpink lines fences. (For interpretation of the references to color in this figure legend, the reader is referred to the web version of this article.)
M.J. Wisdom et al. Forest Ecology and Management 411 (2018) 223–233
229
followed a similar pattern to these flight responses, with the lattermodeled with 2002 elk telemetry data not used in our analysis (Wisdomet al., 2004a).
Separation distances maintained by elk from recreationists appearto represent a cause-effect process that we cannot attribute to otherfactors. We controlled for human access with our design of randomlyselecting and implementing one type of recreation activity for a givenfive-day period, followed by a paired nine-day control period of nohuman activity. We further controlled for effects of season and year byreplicating this design during spring, summer, and fall, and acrossyears. Other factors influencing elk movements may have involved thetwo main predators of elk in our study area, cougars (Puma concolor)and black bears (Ursus americanus); however, these predators wereconstant background factors operating during both treatment andcontrol periods (Wisdom et al., 2005). We know of no other factorsbeyond the recreation activities that would help explain our results.
4.2. Sensory cues used by elk to avoid recreationists
Long separation distances maintained by elk from recreationists begthe question: what types of sensory cues are elk using to react to hu-mans? Large mammals and many other vertebrates have keen senses ofsmell, hearing, and sight that have evolved to detect predators (Hunterand Skinner, 1998; Lima and Dill, 1990; Bennett et al., 2009; Wikenroset al., 2015). Elk moved largely out of view during the recreation ac-tivities, suggesting visibility was a strong factor in avoidance of trails.However, viewing distances were based on human capacity to see elk,not vice versa. Moreover, ungulates such as elk can easily hear andsmell humans at the distances that elk maintained from recreationists(see citations above), suggesting that any combination of sensory cuescould have been used.
In addition, visual detection of humans can be impaired by ob-structions of vegetation and topography, and auditory and olfactorycues to human presence are affected by wind speed and direction.Olfactory cues also were likely different for each recreation activity:ATVs emit a distinct gasoline odor and horses provide an additionalolfactory cue beyond that of humans.
Each recreation activity also was associated with a different level ofnoise, which clearly affects wildlife (Barber et al., 2009). ATV riding isthe loudest of the four recreation activities, with levels as high as110 dB (Lovich and Bainbridge, 1999), and thus has high noise impacton wildlife (Bowles, 1995, Lovich and Bainbridge, 1999). It is unclearwhether any of the other three recreation activities were louder thanthe others. We are not aware of any comparative research on noiseassociated with non-motorized forms of trail-based recreation.
Differences in speed of the recreation activities may also haveprovided additional cues for elk detection of recreationists. The speedof ATVs was> 2 times faster than mountain bikes, and>4–5 timesfaster than hikers and horseback riders, respectively, during our study(Wisdom, unpublished data). Our treatment design ensured equal spa-tial coverage of the trail system by all four recreation treatments, butATVs covered the trails at a faster rate each morning and afternoon. Thehigher speed of ATVs, combined with their substantially higher noise,may help explain the stronger avoidance response of elk to ATVs. Thehigher speed of ATVs might also have limited the reaction time of elk,as shown by some elk maintaining closer distances to trails and possiblyhiding during this activity (see Wisdom et al. (2004a) for a relateddiscussion of elk hiding versus flight responses to ATV riding). Giventhe wide variety of visual, auditory, and olfactory stimuli, differentcombinations of sensory cues were likely used by elk under varyingconditions to detect and respond to recreationists.
4.3. Support for hypotheses on viewing, ATV effects, and forest roads
We identified three hypotheses for our analyses: (1) that elkavoidance would occur at distances that allow animals to stay out ofview of recreationists; (2) that avoidance would be strongest in re-sponse to motorized recreation (ATV riding); and (3) that elk wouldrespond to trail-based recreation similarly to their avoidance of roadsopen to motorized traffic on public forests. We found support for allthree hypotheses. Elk avoided trails and recreationists at distanceslargely beyond human view (hypothesis 1). This result agrees with paststudies showing elk use of areas obstructed from view (e.g.,Montgomery et al., 2012), sometimes referred to as “hiding cover” forelk (Thomas et al., 1979; Canfield et al., 1986; Lyon, 1987). Elk also useareas of steeper slopes, complex topography, or areas closer to cover-forage edges, presumably as a means of remaining hidden from humansor predators (e.g., Witmer et al., 1985; Thomas et al., 1988; Johnsonet al., 2000; Coe et al., 2011; Harju et al., 2011; Buchanan et al., 2014).
Extensive timber harvest occurred on 35% of our study area duringthe 1990s, which uniformly increased openness of the landscape due tothe even distribution of harvested vs. unharvested stand mosaics(Wisdom et al., 2004b). Viewing distances in our study increased inresponse to the extensive timber harvest and may have increased thedistances that elk maintained from recreationists. The influence of sil-viculture and forest topography on viewing, and the subsequent re-creation effects on wildlife sensitive to human presence, agrees withLyon’s (1987) modeling of forest structure and topography to char-acterize hiding cover for elk.
Elk avoidance of ATVs also was stronger than to the three types ofnon-motorized recreation (hypothesis 2). Ciuti et al. (2012) found si-milar results in a comparative study of ATV riding, mountain biking,hiking, and horseback riding in Alberta, Canada. Other authors haveinferred that ATV riding has a stronger effect on wildlife than non-motorized recreation because of higher noise and faster speeds, whichinfluences more area per unit time (Lovich and Bainbridge, 1999;Wisdom et al., 2004a; Proescholdt, 2007; Ciuti et al., 2012; Preisler
Fig. 5. Parallel boxplots showing the variability among elk (variability within each box)and among treatments (variability between boxes) in minimum separation distances ofLORAN-C telemetered elk (n= 19) from recreationists during all-terrain vehicle riding(ATV), mountain biking (Bike), hiking (Hike), and horseback riding Horse, 2003–2004,Northeast Study Area, Starkey Experimental Forest and Range, northeast Oregon, USA.Minimum distances were evaluated per elk/day, with two values per day (morning andafternoon) per elk. Horizontal red line shows the maximum viewing distance of 300m.(For interpretation of the references to color in this figure legend, the reader is referred tothe web version of this article.)
M.J. Wisdom et al. Forest Ecology and Management 411 (2018) 223–233
230
et al., 2013). However, Larson et al.’s (2016) meta-analysis of recrea-tion effects on wildlife suggested that non-motorized recreation hadstronger effects than motorized (but differences were not statisticallysignificant). Additional research is needed to address inconsistenciesamong studies and to investigate effects of trail-based recreation onfitness of different wildlife species and taxa.
Avoidance responses by elk to the recreation activities also weresimilar to those documented in relation to forest roads open to mo-torized traffic (hypothesis 3). Our review of the literature revealeddisplacement of elk from forest roads open to motorized traffic thatoften exceeded 0.5–1.5 km. Avoidance responses by elk distance toopen roads, or to open road density, have been documented con-sistently and overwhelmingly by>30 studies conducted during thepast 5 decades in forested areas of western North America. Examplesfrom each decade are Perry and Overly (1977), Lyon (1983), Cole et al.(1997), Rowland et al. (2000), and Prokopenko et al. (2016).
Distance responses by elk to recreationists during our study mir-rored the general avoidance distances of 0.5–1.5 km or farther thatwere documented in many roads studies during non-hunting seasons.Elk sometimes move much longer distances (e.g., > 25 km) from publicto private lands during hunting seasons when public forests are highlyroaded and lack adequate security for elk to hide from hunters (Proffittet al., 2013). We did not evaluate the effects of hunting, nor could weevaluate the potential for such longer-distance landscape responses byelk because of the study area enclosure.
Similarities between elk responses to trail-based recreation andforest roads also depend on the specific response variables evaluatedand the spatial and temporal scales at which responses are measured.Different studies evaluated elk avoidance over different time periods(seasonal or multiple seasons in a year or multiple years) and spatialextents. Results will vary by sample size and the degree of “averaging”of avoidance effects by time of day, seasons, and years. This variationwas obvious in our results. Analysis of elk distances to trails representedan average response over the eight-hour period of all days among allreplicates of each treatment type. These avoidance distances weresubstantially less than the minimum separation distances maintained byelk from recreationists, as measured in five-minute time windows overthe same eight-hour days and replicates. Minimum separation distancesof elk from recreationists are a more direct measure of elk responses; weconsider these results comparable to contemporary finer-scale distanceresponses of elk to open roads (e.g., Buchanan et al., 2014; Morris et al.,2016; Prokopenko et al., 2016; Ranglack et al., 2017).
4.4. Bias in visual observations of elk
Elk are widely distributed and occupy summer ranges on nearlyevery National Forest in the western United States (O’Gara and Dundas,2002). Consequently, the species has been a topic of public commentsas part of travel management planning on National Forests. Motorizedrecreationists often have commented that elk populations do not avoidOHVs because elk are observed while riding. We heard this commentnumerous times during meetings we held with recreation stakeholdersabout our research. Of direct relevance to these public comments wasthe research by Naylor (2006), who summarized the distances at whichelk were directly observed by recreationists during implementation ofthe recreation treatments in our study area. Elk were observed by re-creationists at mean distances of 116–161m among the four types oftreatments (Naylor, 2006). These distances are shorter than or similarto the average near viewing distance of 172m at which elk could beviewed without visual obstruction.
Telemetered elk, representing a random sample of female elk in ourstudy area, maintained minimum separation distances that were 4–8times farther from recreationists than the distances estimated by visualobservation. Thus, a large percentage of telemetered elk were presentbeyond the distances at which visual observations were possible, andelk consistently maintained these longer distances during each type of
recreation.Recreationists in our study were able to observe a small portion of
the elk population in view of trails, but unable to see the large majorityof the elk population that remained hidden from view during recreationactivities. Visual observations of elk during recreation thus could notdetect the strong avoidance by elk that occurred out of view. Thispattern explains the differences between motorized recreationists’comments about elk as part of travel management planning and theresponses that we documented with telemetered elk in our study.
Stankowich (2008) summarized results from>50 studies that re-ported results of flight distance of wild ungulate species in response tohuman activities. The majority of reported studies were based on visualobservations, but no mention was given in Stankowich (2008) about thepotential for bias with the use of visual observations in environmentswhere viewing was substantially limited, or for ungulate species whoseresponse to human presence is to remain out of view. Automated andremotely-sensed technologies are now available that document avariety of animal behaviors and responses to human activities withoutdependence on human observations (e.g., Cooke et al., 2004; Coulombeet al., 2006; Shepard et al., 2008; Naylor et al., 2009; Suraci et al.,2017).
4.5. Implications
Avoidance by elk to recreation trails and recreationists represents aform of “habitat compression,” similar to that described for effects offorest roads open to traffic (Wisdom et al., 2000, Rowland et al., 2004,Buchanan et al., 2014, Prokopenko et al., 2016). Habitat compression inresponse to human activities is a form of habitat loss for species like elk(Rowland et al., 2004, Frair et al., 2008, Buchanan et al., 2014), con-sidering the potentially large areas not used or used less in the presenceof humans, and that otherwise might be selected by a species in theabsence of humans. Habitat compression can ultimately lead to large-scale population shifts by elk from public forests to private lands, thuseliminating hunting and viewing opportunities on public lands (Proffittet al., 2013).
To address these types of effects, forest managers could use ourresults to evaluate trade-offs between competing objectives for trail-based recreation and wildlife species like elk that are sensitive tohuman activities on public forests. Although public forests are governedby laws and policies of multiple use, not all areas can be simultaneouslyco-managed for recreation and recreation-sensitive wildlife. Differentland allocations can accommodate such competing uses, but often ondifferent landscapes with clear objectives about which resources arefeatured. Optimizing land allocations through spatial analyses of trade-offs between competing forest uses (Wang et al., 2004), with the in-clusion of human ecology mapping (McLain et al., 2013a, 2013b) andstakeholder engagement (Asah et al., 2012a, 2012b) is a forest planningapproach that holds promise in helping address recreation and wildlifeconflicts. We suggest that such an approach be considered in co-managing trail-based recreation and sensitive wildlife like elk on publicforests.
Author contributions
BJ, LN, RA, and MW conceived, designed, and implemented theresearch; BJ, HP, LN, MR, and MW analyzed the data and wrote andedited the manuscript.
Acknowledgments
Funding was provided by the Oregon Department of Parks andRecreation, Oregon Department of Fish and Wildlife, and USDA ForestService Pacific Northwest Region and Pacific Northwest ResearchStation. Additional support was provided by the USDA Forest ServicePacific Southwest Research Station. Jennifer Hafer and Bridgett Naylor
M.J. Wisdom et al. Forest Ecology and Management 411 (2018) 223–233
231
helped prepare figures and summarize results. The authors wish tothank>50 individuals, particularly Kristen Munday, who im-plemented the recreation activities for this study.
Appendix A. Supplementary material
Supplementary data associated with this article can be found, in theonline version, at http://dx.doi.org/10.1016/j.foreco.2018.01.032.
References
Adams, J.C., McCool, S.F., 2009. Finite recreation opportunities: the Forest Service, theBureau of Land Management, and off-road vehicle management. Nat. Res. J. 49,45–116.
Asah, S.T., Bengston, D.N., Wendt, K., DeVaney, L., 2012a. Prognostic framing of stake-holders’ subjectivities: a case of all-terrain vehicle management on state public lands.Environ. Manage. 49, 192–206.
Asah, S.T., Bengston, D.N., Wendt, K., Nelson, K.C., 2012b. Diagnostic reframing of in-tractable environmental problems: case of a contested multiparty public land-useconflict. Environ. Manage. 108, 108–119.
Barber, J.R., Crooks, K.R., Fristrup, K.M., 2009. The costs of chronic noise exposure forterrestrial organisms. Trends Ecol. Evol. 25, 180–189.
Benjamini, Y., 1988. Opening the box of a boxplot. Am. Statist. 42, 257–262.Bennett, V.J., Beard, M., Zollner, P.A., Fernández-Juricic, E., Westphal, L., LeBlanc, C.L.,
2009. Understanding wildlife responses to human disturbance through simulationmodeling: a management tool. Ecol. Complex. 6, 113–134.
Beyer, H.L., Ung, R., Murray, D.L., Fortin, M.J., 2013. Functional responses, seasonalvariation and thresholds in behavioural responses of moose to road density. J. Appl.Ecol. 50, 286–294.
Bowker, J.M., Askew, A.E., Cordell, H.K., Betz, C.J., Zarnoch, S.J., Seymour, L., 2012.Outdoor recreation participation in the United States – projections to 2060. U.S.Forest Service Gen. Tech. Rep. SRS-GTR-160, Asheville, NC, USA.
Bowles, E., 1995. Responses of wildlife to noise. In: Knight, L., Gutzwiller, J. (Eds.),Wildlife and Recreationists. Island Press, Washington DC, USA, pp. 108–156.
Brillinger, D.R., Preisler, H.K., Ager, A.A., Wisdom, M.J., 2004. Stochastic differentialequations in the analysis of wildlife motion. 2004 Proceedings, American StatisticalAssociation, Section on Statistics and the Environment, Alexandria, VA, USA:American Statistical Association< https://www.stat.berkeley.edu/users/brill/Papers/jsm2004j.pdf > .
Brillinger, D.R., Preisler, H.K., Wisdom, M.J., 2011. Modelling particles moving in apotential field with pairwise interactions and an application. Brazil. J. Prob. and Stat.25, 421–436.
Buchanan, C.B., Beck, J.L., Bills, T.E., Miller, S.N., 2014. Seasonal resource selection anddistributional response by elk to development of a natural gas field. Rangeland Ecol.Manage. 67, 369–379.
Canfield, J.E., Lyon, L.J., Hillis, J.M., 1986. The influence of viewing angle on elk hidingcover in young timber stands. U.S. Forest Service Research Paper INT-371,Intermountain Forest and Range Experiment Station, Ogden, UT, USA.
Chambers, J.M., Cleveland, W.S., Kleiner, B., Tukey, P.A., 1983. Graphical Methods forData Analysis. Wadsworth International Group, Belmont, CA, USA.
Ciuti, S., Northrup, J.M., Muhly, T.B., Simi, S., Musiani, M., Pitt, J.A., 2012. Effects ofhumans on behaviour of wildlife exceed those of natural predators in a landscape offear. PLoS ONE 7, e50611. http://dx.doi.org/10.1371/journal.pone.0050611.
Coe, P.K., Johnson, B.K., Wisdom, M.J., Cook, J.G., Vavra, M., Nielson, R.M., 2011.Validation of elk resource selection models with spatially independent data. J. Wildl.Manage. 75, 159–170.
Cole, E.K., Pope, M.D., Anthony, R.G., 1997. Effects of road management on movementand survival of Roosevelt elk. J. Wildl. Manage. 61, 1115–1126.
Cole, E.K., Pope, M.D., Anthony, R.G., 2004. Influence of road management on diurnalhabitat use of Roosevelt elk. Northwest Sci. 78, 313–321.
Cooke, S.J., Hinch, S.G., Wikelski, M., Andrews, R.D., Kuchel, L.J., Wolcott, T.G., Butler,P.J., 2004. Biotelemetry: a mechanistic approach to ecology. Trends Ecol. Evol. 19,334–343.
Cordell, K., Betz, J., Green, G., Owens, M., 2005. Off-highway vehicle recreation in theUnited States, regions and states: A national report from the National Survey onRecreation and the Environment (NSRE). USDA Forest Service Southern ResearchStation, Athens, GA, USA.
Cordell, H.K., 2012. Outdoor recreation trends and futures: a technical document sup-porting the Forest Service 2010 RPA Assessment. U.S. Forest Service Gen. Tech. Rep.SRS-GTR-150, Asheville, NC, USA.
Coulombe, M.L., Massé, A., Côté, S.D., 2006. Quantification and accuracy of activity datameasured with VHF and GPS telemetry. Wildl. Soc. Bull. 34, 81–92.
Federal Register, 2005. Part IV. Department of Agriculture, Forest Service. 36 CFR Parts212, 251, and 295. Travel management; designated routes and areas for motor ve-hicle use; Final Rule, vol. 70. Federal Register, Washington, DC, USA0, pp.68264–68291.
Hansen, M.C., Riggs, R.A., 2008. Accuracy, precision, and observation rates of globalpositioning system telemetry collars. J. Wildl. Manage. 72, 518–526.
Harju, S.M., Dzialak, M.R., Osborn, R.G., Hayden-Wing, L.D., Winstead, J.B., 2011.Conservation planning using resource selection models: altered selection in the pre-sence of human activity changes spatial prediction of resource use. Animal Cons. 14,502–511.
Havlick, D., 2002. No Place Distant: Roads and Motorized Recreation on America's PublicLands. Island Press, Washington D, C., USA.
Hennings, L., Soll, J., 2017. Hiking, mountain biking and equestrian use in natural areas:A recreation ecology literature review. Portland Metro Parks and Nature, 600 NEGrand Avenue, Portland, OR, USA.
Hunter, L.T.B., Skinner, J.D., 1998. Vigilance behaviour in African ungulates: the role ofpredation pressure. Behaviour 135, 195–211.
Johnson, B.K., Ager, A.A., Findholt, S.L., Wisdom, M.J., Marx, D., Kern, J., Bryant, L.D.,1998. Mitigating spatial differences in observation rate of automated telemetry sys-tems. J. Wildl. Manage. 62, 958–967.
Johnson, B.K., Kern, J.W., Wisdom, M.J., Findholt, S.L., Kie, J.G., 2000. Resource selec-tion and spatial separation of mule deer and elk in spring. J. Wildl. Manage. 64,685–697.
Larson, C.L., Reed, S.E., Merenlender, A.M., Crooks, K.R., 2016. Effects of recreation onanimals revealed as widespread through a global systematic review. PLoS ONE 11(12), e0167259. http://dx.doi.org/10.1371/journal.pone.0167259.
Leung, Y.F., Marion, J.L., 2000. Recreation impacts and management in wilderness: astate-of-knowledge review, in: Cole, N.D., McCool, S.F., Borrie, W.T. O’Loughlin, J.(Comps.), Wilderness science in a time of change conference, Volume 5: Wildernessecosystems, threats, and management; U.S. Forest Service Rocky Mountain ResearchStation RMRS-P-15-VOL-5, Ogden, UT, USA, pp 23–48.
Lima, S.L., Dill, L.M., 1990. Behavioral decisions made under the risk of predation: areview and prospectus. Can. J. Zool. 68, 619–640.
Lovich, J.E., Bainbridge, D., 1999. Anthropogenic degradation of the southern Californiadesert ecosystem and prospects for natural recovery and restoration. Environ.Manage. 24, 309–326.
Lyon, L.J., 1983. Road density models describing habitat effectiveness for elk. J. Forestry81, 592–613.
Lyon, L.J., 1987. HIDE2: Evaluation of elk hiding cover using a personal computer. U.S.Forest Service, Intermountain Research Station, INT-365, Odgen, UT, USA.
McLain, R., Cerveny, L., Besser, D., Banis, D., Biedenweg, K., Todd, A., Kimball-Brown, C.,Rohdy, S., 2013a. Mapping human-environment connections on the OlympicPeninsula: an atlas of landscape values. Occas. Pap. Geogr. 7.
McLain, R., Poe, M., Biedenweg, K., Cerveny, K.L., Besser, D., Blahna, D., 2013b. Makingsense of human ecology mapping: an overview of approaches to integrating socio-spatial data into environmental planning. Hum. Ecol. 41, 651.
Montgomery, R.A., Roloff, G.J., Millspaugh, J.J., 2012. The importance of visibility whenevaluating animal response to roads. Wildl. Biol. 18, 393–405.
Montgomery, R.A., Roloff, G.J., Millspaugh, J.J., 2013. Variation in elk response to roadsby season, sex, and road type. J. Wildl. Manage. 77, 313–325.
Morris, L.R., Proffitt, K.M., Asher, V., Blackburn, J.K., 2016. Elk resource selection andimplications for anthrax management in Montana. J. Wildl. Manage. 80, 235–244.
Naylor, M., 2006. Behavioral Responses of Rocky Mountain Elk (Cervus elaphus) toRecreational Disturbance. Oregon State University, Corvallis, Oregon, USA M.S.Thesis.
Naylor, L.M., Wisdom, M.J., Anthony, R.G., 2009. Behavioral responses of NorthAmerican elk to recreational activity. J. Wildl. Manage. 37, 328–338.
Newsome, D., Smith, A., Moore, S.A., 2008. Horse riding in protected areas: a criticalreview and implications for research and management. Curr. Iss. Tourism 11,144–166.
Nielson, R.M., Manly, B.F.J., McDonald, L.L., Sawyer, H., McDonald, T.L., 2009.Estimating habitat selection when GPS fix success is less than 100%. Ecol. 90,2956–2962.
O’Gara, B.W., Dundas, R.G., 2002. Distribution: past and present. In: Toweill, D.E.,Thomas, J.W. (Eds.), North American Elk: Ecology and Management. SmithsonianInstitution Press, Washington, D.C., USA, pp. 67–119.
Perry, C., Overly, R., 1977. Impact of roads on big game distribution in portions of theBlue Mountains of Washington, 1972–1973. Washington Game Department TechnicalBulletin, Olympia, WA, USA.
Preisler, H.K., Ager, A.A., Wisdom, M.J., 2006. Statistical methods for analyzing re-sponses of wildlife to human disturbance. J. Appl. Ecol. 43, 164–172.
Proescholdt, K., 2007. Collision Course? Off-Road Vehicle Impacts on Hunting andFishing. Izaak Walton League of America, Gaithersburg, MD, USA<http://www.iwla.org/docs/default-source/Outdoor-America-articles/off-track-by-kevin-proescholdt.pdf?sfvrsn=2> (accessed 17.08.03).
Prokopenko, C.M., Boyce, M.S., Avgar, T., 2016. Characterizing wildlife behavioural re-sponses to roads using integrated step selection analysis. J. Appl. Ecol. 54, 470–479.
Proffitt, K.M., Gude, J.A., Hamlin, K.L., Messer, M.A., 2013. Effects of hunter access andhabitat security on elk habitat selection in landscapes with a public and private landmatrix. J. Wildl. Manage. 77, 514–524.
Ranglack, D.H., Proffitt, K.M., Canfield, J.M., Gude, J.A., Rotella, J., Garrott, R.A., 2017.Security areas for elk during archery and rifle hunting seasons. J. Wildl. Manage. 81,778–791.
M.J. Wisdom et al. Forest Ecology and Management 411 (2018) 223–233
Rowland, M.M., Bryant, L., Johnson, B., Noyes, J., Wisdom, M.J., Thomas, J.W., 1997.The Starkey Project: History, Facility and Data Collection Methods for UngulateResearch. U.S. Forest Service Gen. Tech. Rep. PNW-GTR-396, Portland, OR, USA.
Rowland, M.M., Wisdom, M.J., Johnson, B.K., Kie, J.G., 2000. Elk distribution andmodeling in relation to roads. J. Wildl. Manage. 64, 672–684.
Rowland, M.M., Wisdom, M.J., Johnson, B.K., Penninger, M.A., 2004. Effects of roads onelk: implications for management in forested ecosystems. Trans. N. Amer. Wildl. Nat.Res. Conf. 69, 491–508.
Shepard, E.L.C., Wilson, R.P., Quintana, F., Laich, A.G., Liebsch, N., Albareda, D.A.,Halsey, L.G., Gleiss, A., Morgan, D.T., Myers, A.E., Newman, C., Macdonald, D.W.,2008. Identification of animal movement patterns using tri-axial accelerometry.Endang. Species Res. 10, 47–60.
Sicking, L. P. 1998. Rangefinder comparison. USDA Forest Service TechnologyDevelopment Center Bulletin 9824 1307-SDTDC, San Dimas Technology andDevelopment Center, San Dimas CA, USA<https://www.fs.fed.us/eng/pubs/html/98241307/98241307.html> (accessed 10 November 2017).
Stankowich, T., 2008. Ungulate flight responses to human disturbances: a review andmeta-analysis. Biol. Cons. 141, 2159–2173.
Stewart, K.M., Bowyer, R.T., Dick, B.L., Johnson, B.K., Kie, J.G., 2005. Density-dependenteffects on physical condition and reproduction in North American elk: an experi-mental test. Oecologia 143, 85–93.
Suraci, J.P., Clinchy, M., Mugerwa, B., Delsey, M., Macdonald, D.W., Smith, J.A.,Wilmers, C.C., Zanette, L.Y., 2017. A new automated behavioural response system tointegrate playback experiments into camera trap studies. Meth. Ecol. Evol. 8,957–964.
Tarr, N.M., Simons, T.R., Pollock, K.H., 2010. An experimental assessment of vehicledisturbance effects on migratory shorebirds. J. Wildl. Manage. 74, 1176–1183.
Taylor, A.R., Knight, R.L., 2003a. Wildlife responses to recreation and associated visitorperceptions. Ecol. Appl. 13, 951–963.
Taylor, A.R., Knight, R.L., 2003b. Behavioral responses of wildlife to human activity:terminology and methods. Wildl. Soc. Bull. 31, 1263–1271.
Thomas, J. W., Black Jr., H., Scherzinger, R.J., Pedersen, R.J., 1979. Deer and elk. In:Thomas, J.W. (Ed.), Wildlife habitats in the managed forests, the Blue Mountains ofOregon and Washington. U.S. Department of Agriculture Handbook 553, U.S.Government Printing Office, Washington, D.C., USA, pp 104–125.
Thomas, J.W., Leckenby, D.A., Henjum, M., Pedersen, R.J., Bryant, L.D., 1988. Habitat-effetiveness index for elk on Blue Mountain winter ranges. U.S. Forest Service PacificNorthwest Research Station Gen. Tech. Rep. PNW-GTR-218, Portland, OR, USA.
The Outdoor Foundation, 2016. Outdoor Recreation Participation. The OutdoorFoundation, Washington, DC, USA.
Thompson, A., 2007. Management perceptions of off-highway vehicle use on National
Forest System lands in Appalachia. West Virginia University, Morgantown WV M.S.Thesis.
USDA Forest Service, 2004. Managing the National Forest System: Great Issues and GreatDivisions. U.S. Department of Agriculture, Forest Service report, January 21, 2004,on file, Pacific Northwest Research Station, La Grande, OR, USA.
Venables, W.N., Ripley, B.D., 1997. Modern Applied Statistics with S-PLUS, SecondEdition with 1999 Updates. Springer, New York.
Wang, X., Yu, S., Huang, G.H., 2004. Land allocation based on integrated GIS-optimiza-tion modeling at a watershed level. Landsc. Urban Plan. 66, 61–74.
Webb, R.H., Wilshire, H.G., 2012. Environmental Effects of Off-Road Vehicles: Impactsand Management in Arid Regions. Springer Science and Business Media, New York,New York.
Wikenros, C., Dries, D.P.J., Kuijper, P.J., Behnke, R., Schmidt, K., 2015. Behaviouralresponses of ungulates to indirect cues of an ambush predator. Behaviour 152,1019–1040.
Wisdom M.J., Cook, J.G., Rowland, M.M., Noyes, J.H., 1993. Protocols for care andhandling of deer and elk at the Starkey Experimental Forest and Range. U.S. ForestService Gen. Tech. Rep. PNW-GTR-311, Portland, Oregon, USA.
Wisdom, M.J., Holthausen, R.S., Wales, B.C., Hargis, C.D., Saab, V.A., Lee, D.C., Hann, W.J., Rich, T.D., Rowland, M.M., Murphy, W.J., Eames, M.A., 2000. Source habitats forterrestrial vertebrates of focus in the Interior Columbia Basin: broad-scale trends andmanagement implications. U.S. Forest Service Pacific Northwest Research StationGen. Tech. Rep. PNW-GTR-485, Portland, OR. USA.
Wisdom, M.J., Ager, A.A., Preisler, H.K., Cimon, N.J., Johnson, B.K., 2004a. Effects of off-road recreation on mule deer and elk. Trans. N. Amer. Wildl. Nat. Res. Conf. 69,531–550.
Wisdom, M.J. (Ed.), 2005. The Starkey Project: A Synthesis of Long-Term Studies of Elkand Mule Deer. Alliance Communications Group Allen Press, Lawrence, KS, USA.
Witmer, G.W., Wisdom, M.J., Harshman, E.P., Anderson, R.J., Carey, C., Kuttel, M.P.,Luman, I.D., Rochelle, J.A., Scharpf, R.W., Smithey, D.A., 1985. Deer and elk. In:Brown, E.R. (Ed.), Management of Wildlife and Fish Habitats in Forests of WesternOregon and Washington, part 1-chapter narratives. USDA Forest Service PublicationR6-F&WL-192-1985. U.S. Government Printing Office, Washington, DC, USA, pp41–55.
Yankoviak, M., 2005. Off-Road Vehicle Policy on USDA National Forests: Evaluating UserConflicts and Travel Management. University of Montana, Missoula, MT, USA M.S.Thesis.
M.J. Wisdom et al. Forest Ecology and Management 411 (2018) 223–233