Forest Fire Modeling and Early Detection using Wireless Sensor Networks MOHAMED HEFEEDA Simon Fraser University, Canada Forest fires cost millions of dollars in damages and claim many human lives every year. Apart from preventive measures, early detection and suppression of fires is the only way to minimize the damages and casualties. We present the design and evaluation of a wireless sensor network for early detection of forest fires. We first present the key aspects in modeling forest fires. We do this by analyzing the Fire Weather Index (FWI) System, and show how its different components can be used in designing efficient fire detection systems. The FWI System is one of the most comprehensive forest fire danger rating systems in North America, and it is backed by several decades of forestry research. The analysis of the FWI System could be of interest in its own right to researchers working in the sensor network area and to sensor manufacturers who can optimize the communication and sensing modules of their products to better fit forest fire detection systems. Then, we model the forest fire detection problem as a coverage problem in wireless sensor networks, and we present a distributed algorithm to solve it. In addition, we show how our algorithm can achieve various coverage degrees at different subareas of the forest, which can be used to provide unequal monitoring quality of forest zones. Unequal monitoring is important to protect residential and industrial neighborhoods close to forests. Finally, we present a simple data aggregation scheme based on the FWI System. This data aggregation scheme significantly prolongs the network lifetime, because it only delivers the data that is of interest to the application. We validate several aspects of our design using simulation. Categories and Subject Descriptors: H.4.0 [Information Systems]: Information Systems Applications—Gen- eral; C.3 [Computer Systems Organization]: Special-Purpose and Application-Based Systems General Terms: Design, Algorithms Additional Key Words and Phrases: Forest Fire Modeling, Forest Fire Detection Systems, Wireless Sensor Networks, Coverage Protocols 1. INTRODUCTION Forest fires, also known as wild fires, are uncontrolled fires occurring in wild areas and cause significant damage to natural and human resources. Forest fires eradicate forests, burn the infrastructure, and may result in high human death toll near urban areas. Com- mon causes of forest fires include lightning, human carelessness, and exposure of fuel to extreme heat and aridity. It is known that in some cases fires are part of the forest ecosys- tem and they are important to the life cycle of indigenous habitats. However, in most cases, the damage caused by fires to public safety and natural resources is intolerable and early detection and suppression of fires deem crucial. For example, in August 2003, a forest fire was started by a lightning strike in the Okanagan Mountain Park in the Province of British Columbia, Canada. The fire was spread by the strong wind and within a few days it turned into a firestorm. The fire forced the evacuation of 45,000 residents and burned 239 homes. Most of the trees in the Okanagan Mountain Park were burned, and the park was closed. Although 60 fire departments, 1,400 armed forces troops and 1,000 fire fighters took part in the fire fighting operation, they were largely unsuccessful in stopping the disaster. The official reports estimate the burned area as 25,912 hectares and the total cost as $33.8 mil- ACM Journal Name, Vol. V, No. N, Month 20YY, Pages 1–0??.
Transcript
Forest Fire Modeling and Early Detection usingWireless Sensor Networks
MOHAMED HEFEEDASimon Fraser University, Canada
Forest fires cost millions of dollars in damages and claim many human lives every year. Apartfrom preventive measures, early detection and suppression of fires is the only way to minimize
the damages and casualties. We present the design and evaluation of a wireless sensor networkfor early detection of forest fires. We first present the key aspects in modeling forest fires. We dothis by analyzing the Fire Weather Index (FWI) System, and show how its different components
can be used in designing efficient fire detection systems. The FWI System is one of the mostcomprehensive forest fire danger rating systems in North America, and it is backed by severaldecades of forestry research. The analysis of the FWI System could be of interest in its ownright to researchers working in the sensor network area and to sensor manufacturers who can
optimize the communication and sensing modules of their products to better fit forest fire detectionsystems. Then, we model the forest fire detection problem as a coverage problem in wirelesssensor networks, and we present a distributed algorithm to solve it. In addition, we show how
our algorithm can achieve various coverage degrees at different subareas of the forest, which canbe used to provide unequal monitoring quality of forest zones. Unequal monitoring is importantto protect residential and industrial neighborhoods close to forests. Finally, we present a simpledata aggregation scheme based on the FWI System. This data aggregation scheme significantly
prolongs the network lifetime, because it only delivers the data that is of interest to the application.We validate several aspects of our design using simulation.
Categories and Subject Descriptors: H.4.0 [Information Systems]: Information Systems Applications—Gen-eral; C.3 [Computer Systems Organization]: Special-Purpose and Application-Based Systems
General Terms: Design, Algorithms
Additional Key Words and Phrases: Forest Fire Modeling, Forest Fire Detection Systems, WirelessSensor Networks, Coverage Protocols
1. INTRODUCTION
Forest fires, also known as wild fires, are uncontrolled fires occurring in wild areas andcause significant damage to natural and human resources. Forest fires eradicate forests,burn the infrastructure, and may result in high human death toll near urban areas. Com-mon causes of forest fires include lightning, human carelessness, and exposure of fuel toextreme heat and aridity. It is known that in some cases fires are part of the forest ecosys-tem and they are important to the life cycle of indigenous habitats. However, in most cases,the damage caused by fires to public safety and natural resources is intolerable and earlydetection and suppression of fires deem crucial. For example, in August 2003, a forest firewas started by a lightning strike in the Okanagan Mountain Park in the Province of BritishColumbia, Canada. The fire was spread by the strong wind and within a few days it turnedinto a firestorm. The fire forced the evacuation of 45,000 residents and burned 239 homes.Most of the trees in the Okanagan Mountain Park were burned, and the park was closed.Although 60 fire departments, 1,400 armed forces troops and 1,000 fire fighters took partin the fire fighting operation, they were largely unsuccessful in stopping the disaster. Theofficial reports estimate the burned area as 25,912 hectaresand the total cost as $33.8 mil-
Table I. Forest fires in the Province of British Columbia, Canada since 1995.Year Number of Fires Number of Hectares Burned Total Cost (millions)2006 2,590 131,086 $156.02005 976 34,588 $47.22004 2394 220,516 $164.62003 2473 265,050 $371.92002 1783 8,539 $37.52001 1266 9,677 $53.82000 1539 17,673 $52.71999 1208 11,581 $21.11998 2665 76,574 $153.91997 1175 2,960 $19.01996 1358 20,669 $37.11995 1474 48,080 $38.5
lion [B.C. Ministry of Forests and Range ]. In the province ofBritish Columbia alone,there have been 2,590 forest fires during 2006 [B.C. Ministryof Forests and Range WebPage ]. These burned 131,086 hectares and costed about $156 million. Table I summa-rizes the extent and cost of wild fires in BC in previous years.The situation of forest firesis even worse if we look at the national level. Over the past ten years, on average, therehave been 4,387 and 52,943 forest fires in Canada and the United States, respectively, peryear [Canadian Forest Service (CFS) Web Page ]. Preventing asmall fraction of these fireswould account to significant savings in natural and human resources.
Apart from preventive measures, early detection and suppression of fires is the only wayto minimize the damage and casualties. Systems for early detection of forest fires haveevolved over the past decades based on advances in related technologies. We summarizethis evolution in the following, motivating the need and potential of wireless sensor net-works for this critical application.
1.1 Evolution of Forest Fire Detection Systems
Traditionally, forest fires have been detected using fire lookout towers located at highpoints. A fire lookout tower houses a person whose duty is to look for fires using spe-cial devices such as Osborne fire finder [Fleming and Robertson 2003]. Osborne fire finderis comprised of a topographic map printed on a disk with graduated rim. A pointer aimedat the fire determines the location and the direction of the fire. Once the fire location isdetermined, the fire lookout alerts fire fighting crew. Fire lookout towers are still in use inmany countries around the world including USA, Australia, and Canada [B.C. Fire Look-out Towers ].
Unreliability of human observations in addition to the difficult life conditions for firelookout personnel have led to the development of automatic video surveillance systems[Fire Watch Web Page ; Breejen et al. 1998; Khrt et al. 2001]. Most systems use Charge-Coupled Device (CCD) cameras and Infrared (IR) detectors installed on top of towers.CCD cameras use image sensors which contain an array of lightsensitive capacitors orphotodiodes. In case of fire or smoke activity, the system alerts local fire departments,residents, and industries. Current automatic video surveillance systems used in Germany,Canada, and Russia are capable of scanning a circular range of 10 km in less than8 min-utes [Fire Watch Web Page ]. The accuracy of these systems is largely affected by weatherconditions such as clouds, light reflection, and smoke from industrial activities. Automatic
ACM Journal Name, Vol. V, No. N, Month 20YY.
Forest Fire Modeling and Early Detection using Wireless Sensor Networks · 3
video surveillance systems cannot be applied to large forest fields easily and cost effec-tively, thus for large forest areas either aeroplanes or Unmanned Aerial Vehicles (UAV)are used to monitor forests. Aeroplanes fly over forests and the pilot alerts the base stationin case of fire or smoke activity. UAVs, on the other hand, carry both video and infraredcameras and transmit the collected data to a base station on the ground that could be up to50 km away. UAVs can stay atop for several hours and are commanded by programmingor joystick controls [Aerovision Web Page ].
More advanced forest fire detection systems are based on satellite imagery. AdvancedVery High Resolution Radiometer (AVHRR) [AVHRR Web Page ] was launched by Na-tional Oceanic and Atmospheric Administration (NOAA) in 1998 to monitor clouds andthermal emission of the Earth. Moderate Resolution ImagingSpectroradiometer (MODIS)[MODIS Web Page ] was launched by NASA in 1999 on board of the Aqua satellite tocapture cloud dynamics and surface radiation from the Earth. Current satellite-based for-est fire detection systems use data from these instruments for forest fire surveillance. Theinstruments provide a complete image of the Earth every 1 to 2days. The minimum de-tectable fire size is 0.1 hectare, and the fire location accuracy is 1 km [L et al. 2000; Lohiet al. 1999]. The accuracy and reliability of satellite-based systems are largely impactedby weather conditions. Clouds and rain absorb parts of the frequency spectrum and reducespectral resolution of satellite imagery which consequently affects the detection accuracy.Although satellite-based systems can monitor a large area,relatively low resolution ofsatellite imagery means a fire can be detected only after it has grown large. More impor-tantly, the long scan period—which can be as long as2 days—indicates that such systemscannot provide timely detection.
To summarize, the most critical issue in a forest fire detection system is immediate re-sponse in order to minimize the scale of the disaster. This requires constant surveillanceof the forest area. Current medium and large-scale fire surveillance systems do not accom-plish timely detection due to low resolution and long periodof scan. Therefore, there isa need for a scalable solution that can provide real time fire detection with high accuracy.We believe that wireless sensor networks (WSN) can potentially provide such solution.
Recent advances in WSN support our belief that they make a promising framework forbuilding near real-time forest fire detection systems. Currently sensing modules can sensea variety of phenomena including temperature, relative humidity, and smoke [CrossbowInc. Web Page ] which are all helpful for fire detection systems. Sensor nodes can operatefor months on a pair of AA batteries to provide constant monitoring during the fire season.Moreover, recent protocols make sensor nodes capable of organizing themselves into a self-configuring network, thus removing the overhead of manual setup. Large-scale wirelesssensor networks can be easily deployed using aeroplanes at alow cost compared to thedamages and loss of properties caused by forest fires.
1.2 Contributions and Paper Organization
In this paper, we present the design and evaluation of a wireless sensor network for earlydetection of forest fires. Our design is based on solid forestry research conducted by theCanadian Forest Service [Canadian Forest Service (CFS) WebPage ] over several decades.In particular our contributions can be summarized as follows:
—We present the key aspects in modeling forest fires. We describe the Fire Weather IndexSystem [Canadian Forest Service (CFS) Web Page ; de Groot 1998], and show how
ACM Journal Name, Vol. V, No. N, Month 20YY.
4 · MOHAMED HEFEEDA
its different components can be used in designing efficient fire detection systems. Thiscould be of interest to researchers working in this area and to sensor manufacturerswho can optimize the communication and sensing modules of sensors to fit forest firedetection systems.
—We model the forest fire detection problem as ak-coverage problem (k ≥ 1) in wirelesssensor networks, and present a distributed algorithm to solve this problem.
—We present a simple data aggregation scheme based on the FWI System, which signifi-cantly prolongs the network lifetime.
—We show how ourk-coverage algorithm can be extended to address several issues rel-evant to forest fire detection systems, such as providing different coverage degrees atdifferent subareas of the forest. This is important because, for example, the parts ofthe forest that are near residential areas need to be monitored with higher accuracy thanothers.
The rest of the paper is organized as follows. In Sec. 2, we summarize the related work.Sec. 3 describes the FWI System which is the basis of our design. The details of our designare presented in Sec. 4. In Sec. 5, we evaluate various aspects of the proposed system, andwe conclude the paper in Sec. 6.
2. RELATED WORK
Sensor networks have several appealing characteristics for environmental monitoring ap-plications such as habitat monitoring [Mainwaring et al. 2002; Akyildiz et al. 2002], andforest fire detection systems [Son et al. 2006; Yu et al. 2005;Doolin and Sitar 2005;Chaczko and Ahmad 2005].
For example, in [Mainwaring et al. 2002], the authors apply wireless sensor networks tohabitat monitoring. A set of system requirements are developed and a system architectureis proposed to address these requirements. Different issues such as deployment, data col-lection, and communication protocols are discussed and design guidelines are provided.The system is comprised of patches of sensor nodes reportingtheir readings to a base sta-tion through gateway nodes. The base station is connected tothe Internet and exposes thecollected data to a set of web-based applications. They present experimental results from ahabitat monitoring system consisting of 32 nodes deployed on a small island off the coastof Maine. The sensors were placed in burrows to collect temperature data which are usedto detect the presence of nesting birds.
The authors of [Doolin and Sitar 2005] show the feasibility of wireless sensor networksfor forest fire monitoring. Experimental results are reported from two controlled fires inSan Francisco, California. The system is composed of 10 GPS-enabled MICA motes[Crossbow Inc. Web Page ] collecting temperature, humidity, and barometric pressuredata. The data is communicated to a base station which records it in a database and pro-vides services for different applications. The experiments show that most of the motes inthe burned area were capable of reporting the passage of the flame before being burned.In contrast to this system which reports raw weather data, our design processes weatherconditions based on the Fire Weather Index System [CanadianForest Fire Danger RatingSystem (CFFDRS) Web Page ] and reports more useful, summarized, fire indexes.
In [Hartung et al. 2006], the authors address the problem of fire behavior study ratherthan fire detection. They present FireWxNet, a portable fire sensor network to measure the
ACM Journal Name, Vol. V, No. N, Month 20YY.
Forest Fire Modeling and Early Detection using Wireless Sensor Networks · 5
Initial Spread Build Up
Temperature Relative Humidity Wind Rain Wind
Fuel MoistureCodes
Fire WeatherObservations
Fire BehaviorIndexes
(FFMC)
Index (BUI)Index (ISI)
Fire WeatherIndex (FWI)
Code (DMC)Duff Moisture Drought Code
(DC)Fine FuelMoisture Code
RainRelative HumidityTemperature
TemperatureRain
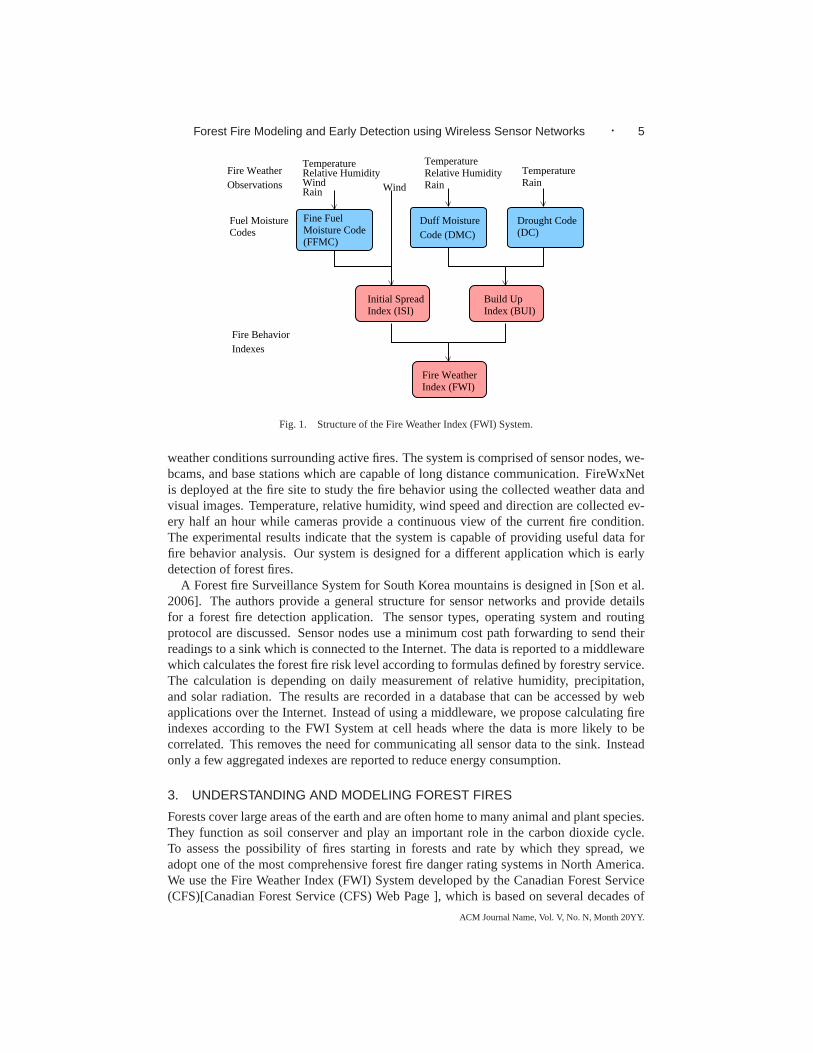
Fig. 1. Structure of the Fire Weather Index (FWI) System.
weather conditions surrounding active fires. The system is comprised of sensor nodes, we-bcams, and base stations which are capable of long distance communication. FireWxNetis deployed at the fire site to study the fire behavior using thecollected weather data andvisual images. Temperature, relative humidity, wind speedand direction are collected ev-ery half an hour while cameras provide a continuous view of the current fire condition.The experimental results indicate that the system is capable of providing useful data forfire behavior analysis. Our system is designed for a different application which is earlydetection of forest fires.
A Forest fire Surveillance System for South Korea mountains is designed in [Son et al.2006]. The authors provide a general structure for sensor networks and provide detailsfor a forest fire detection application. The sensor types, operating system and routingprotocol are discussed. Sensor nodes use a minimum cost pathforwarding to send theirreadings to a sink which is connected to the Internet. The data is reported to a middlewarewhich calculates the forest fire risk level according to formulas defined by forestry service.The calculation is depending on daily measurement of relative humidity, precipitation,and solar radiation. The results are recorded in a database that can be accessed by webapplications over the Internet. Instead of using a middleware, we propose calculating fireindexes according to the FWI System at cell heads where the data is more likely to becorrelated. This removes the need for communicating all sensor data to the sink. Insteadonly a few aggregated indexes are reported to reduce energy consumption.
3. UNDERSTANDING AND MODELING FOREST FIRES
Forests cover large areas of the earth and are often home to many animal and plant species.They function as soil conserver and play an important role inthe carbon dioxide cycle.To assess the possibility of fires starting in forests and rate by which they spread, weadopt one of the most comprehensive forest fire danger ratingsystems in North America.We use the Fire Weather Index (FWI) System developed by the Canadian Forest Service(CFS)[Canadian Forest Service (CFS) Web Page ], which is based on several decades of
ACM Journal Name, Vol. V, No. N, Month 20YY.
6 · MOHAMED HEFEEDA
05
10
15
20
Mineral soil
Lower
Middle
UpperDuff layer
Org
anic
laye
r de
pth
(cm
)
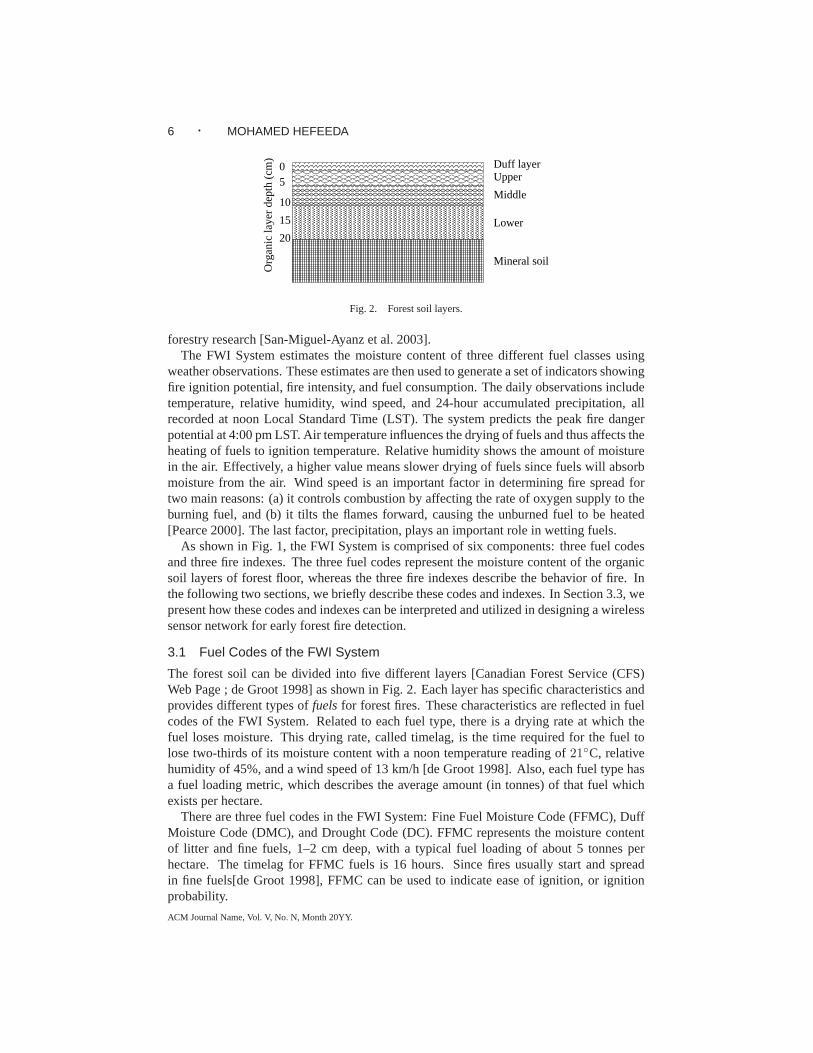
Fig. 2. Forest soil layers.
forestry research [San-Miguel-Ayanz et al. 2003].The FWI System estimates the moisture content of three different fuel classes using
weather observations. These estimates are then used to generate a set of indicators showingfire ignition potential, fire intensity, and fuel consumption. The daily observations includetemperature, relative humidity, wind speed, and 24-hour accumulated precipitation, allrecorded at noon Local Standard Time (LST). The system predicts the peak fire dangerpotential at 4:00 pm LST. Air temperature influences the drying of fuels and thus affects theheating of fuels to ignition temperature. Relative humidity shows the amount of moisturein the air. Effectively, a higher value means slower drying of fuels since fuels will absorbmoisture from the air. Wind speed is an important factor in determining fire spread fortwo main reasons: (a) it controls combustion by affecting the rate of oxygen supply to theburning fuel, and (b) it tilts the flames forward, causing theunburned fuel to be heated[Pearce 2000]. The last factor, precipitation, plays an important role in wetting fuels.
As shown in Fig. 1, the FWI System is comprised of six components: three fuel codesand three fire indexes. The three fuel codes represent the moisture content of the organicsoil layers of forest floor, whereas the three fire indexes describe the behavior of fire. Inthe following two sections, we briefly describe these codes and indexes. In Section 3.3, wepresent how these codes and indexes can be interpreted and utilized in designing a wirelesssensor network for early forest fire detection.
3.1 Fuel Codes of the FWI System
The forest soil can be divided into five different layers [Canadian Forest Service (CFS)Web Page ; de Groot 1998] as shown in Fig. 2. Each layer has specific characteristics andprovides different types offuelsfor forest fires. These characteristics are reflected in fuelcodes of the FWI System. Related to each fuel type, there is a drying rate at which thefuel loses moisture. This drying rate, called timelag, is the time required for the fuel tolose two-thirds of its moisture content with a noon temperature reading of21◦C, relativehumidity of 45%, and a wind speed of 13 km/h [de Groot 1998]. Also, each fuel type hasa fuel loading metric, which describes the average amount (in tonnes) of that fuel whichexists per hectare.
There are three fuel codes in the FWI System: Fine Fuel Moisture Code (FFMC), DuffMoisture Code (DMC), and Drought Code (DC). FFMC representsthe moisture contentof litter and fine fuels, 1–2 cm deep, with a typical fuel loading of about 5 tonnes perhectare. The timelag for FFMC fuels is 16 hours. Since fires usually start and spreadin fine fuels[de Groot 1998], FFMC can be used to indicate easeof ignition, or ignitionprobability.
ACM Journal Name, Vol. V, No. N, Month 20YY.
Forest Fire Modeling and Early Detection using Wireless Sensor Networks · 7
Table II. Ignition Potential versus the FFMC value.Ignition Potential FFMC Value Range
Low 0–76Moderate 77–84
High 85–88Very High 89–91Extreme 92+
The Duff Moisture Code (DMC) represents the moisture content of loosely compacted,decomposing organic matter, 5–10 cm deep, with a fuel loading of about 50 tonnes perhectare. DMC is affected by precipitation, temperature andrelative humidity. Becausethese fuels are below the forest floor surface, wind speed does not affect the fuel mois-ture content. DMC fuels have a slower drying rate than FFMC fuels, with a timelag of12 days. Although the DMC has an open-ended scale, the highest probable value is about150[de Groot 1998]. The DMC determines the probability of fire ignition due to lightningand also shows the rate of fuel consumption in moderate depthlayers. The last fuel mois-ture code, the Drought Code (DC), is an indicator of the moisture content of the deep layerof compacted organic matter, 10–20 cm deep, with a fuel loading of about 440 tonnes perhectare. Temperature and precipitation affect the DC, but wind speed and relative humid-ity do not have any effect on it due to the depth of this fuel layer. DC fuels have a veryslow drying rate, with a timelag of 52 days. The DC is indicative of long-term moistureconditions, determines fire’s resistance to extinguishing, and indicates fuel consumption indeep layers. The DC scale is also open-ended, although the maximum probable value isabout 800[de Groot 1998].
3.2 Fire Indexes of the FWI System
Fire indexes of the FWI System describe the spread and intensity of fires. There are threefire indexes: Initial Spread Index (ISI), Buildup Index (BUI), and Fire Weather Index(FWI). As indicated by Fig. 1, ISI and BUI are intermediate indexes and are used tocompute the FWI index. The ISI index indicates the rate of fire spread immediately afterignition. It combines the FFMC and wind speed to predict the expected rate of fire spread.Generally, a 13 km/h increase in wind speed will double the ISI value. The BUI index is aweighted combination of the DMC and DC codes, and it indicates the total amount of fuelavailable for combustion. The DMC code has the most influenceon the BUI value. Forexample, a DMC value of zero always results in a BUI value of zero regardless of whatthe DC value is. DC has its strongest influence on the BUI at high DMC values, and thegreatest effect that the DC can have is to make the BUI value equal to twice the DMCvalue.
The Fire Weather Index (FWI) is calculated from the ISI and BUIto provide an estimateof the intensity of a spreading fire. In effect, FWI indicates fire intensity by combiningthe rate of fire spread with the amount of fuel being consumed.Fire intensity is definedas the energy output measured in kilowatts per meter of flame length at the head of a fire.The head of a fire is the portion of a fire edge showing the greatest rate of spread and fireintensity. The FWI index is useful for determining fire suppression requirements as well asbeing used for general public information about fire danger conditions. Although FWI isnot directly calculated from weather data, it depends on those factors through ISI and BUI.
ACM Journal Name, Vol. V, No. N, Month 20YY.
8 · MOHAMED HEFEEDA
65 70 75 80 850
20
40
60
80
100
Fine Fuel Moisture Code (FFMC)
Pro
bability
ofIg
nit
ion
(%)
(a) Probability of ignition as a function of the FFMCcode
0 10 20 30 400
1000
2000
3000
4000
5000
6000
7000
8000
Fire Weather Index (FWI)
Fir
eIn
tensi
ty(k
W/m
)
(b) Fire intensity as a function of the FWI index
Fig. 3. Using two main components of the Fire Weather Index System in designing awireless sensor network to detect and combat forest fires.
3.3 Interpreting and Using the FWI System
There are two goals of the proposed wireless sensor network for forest fires: (i) provideearly warning of a potential forest fire, and (ii) estimate the scale and intensity of thefire if it materializes. Both goals are needed to decide on required measures to combat aforest fire. To achieve these goals, we design our sensor network based on the two maincomponents of the FWI System: (i) the Fine Fuel Moisture Code (FFMC), and (ii) theFire Weather Index (FWI). The FFMC code is used to achieve the first goal and the FWIindex is used to achieve the second. In the following, we justify the choice of these twocomponents by collecting and analyzing data from several forestry research publications.
The FFMC indicates the relative ease of ignition and flammability of fine fuels due toexposure to extreme heat. To show this, we interpolate data from [de Groot 1998] to plotthe probability of ignition as a function of FFMC. The results are shown in Fig. 3(a). TheFFMC scale ranges from 0–101 and is the only component of the FWI System withoutan open-ended scale. Generally, fires begin to ignite at FFMCvalues around 70, and themaximum probable value that will ever be achieved is 96 [de Groot 1998]. Based on dataavailable from the web site of The Sustainable Resource Development Ministry of theProvince of Alberta, Canada, we classify in Table II the potential of fire ignition versus theFFMC ranges. Low values of FFMC are not likely to be fires and can be simply ignored,while larger values indicate more alarming situations.
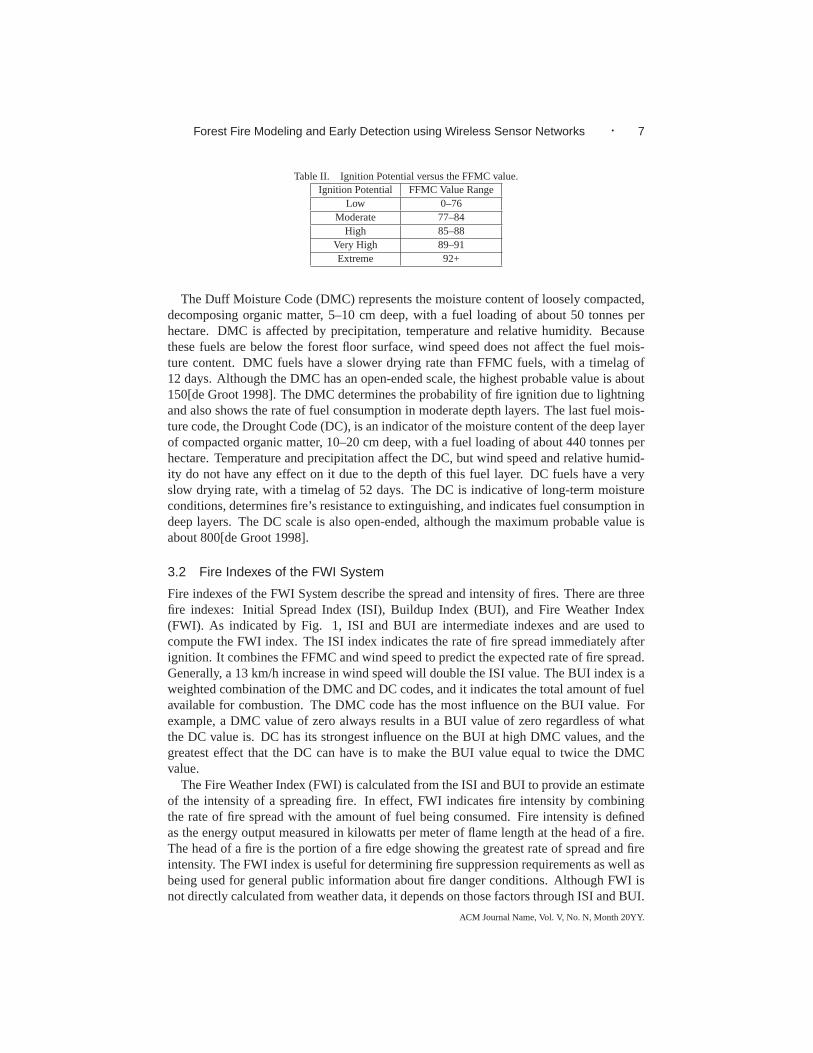
The FWI index estimates the fire intensity by combining the rate of fire spread (from theInitial Spread Index, ISI) with the amount of fuel being consumed (from the Buildup Index,BUI). A high value of the FWI index indicates that in case of fireignition, the fire would bedifficult to control. This intuition is backed up by several studies. For example, in 1974, theAlberta Forest Service performed a short term study of experimental burning in the Jackpine forests in north eastern Alberta. Snapshots of the resulting fires and the computedFWI indexes are shown in Fig. 4 for three fires with different FWIvalues [Alexander and
ACM Journal Name, Vol. V, No. N, Month 20YY.
Forest Fire Modeling and Early Detection using Wireless Sensor Networks · 9
(a) Moderate surface fire (FWI = 14)(b) Very intense surface fire (FWI =24)
(c) Developing active fire (FWI =34)
Fig. 4. Experimental validation of the FWI index. Pictures shown from experiments con-ducted by the Alberta Forest Service, and are reproduced with permission.
Table III. Potential Fire Danger versus the FWI value.FWI Class Value Range Type of Fire Potential Danger
Low 0–5 Creeping surface fire Fire will be self extinguishingModerate 5–10 Low vigor surface fire Easily suppressed with hand tools
High 10–20 Moderately vigorous surface fire Power pumps and hoses are neededVery High 20–30 Very intense surface fire Difficult to controlExtreme 30+ Developing active fire Immediate and strong action is critical
Groot 1988], we obtained a permission to reproduce these images. Another study [de Groot1998] relates the fire intensity with the FWI index. We plot this relationship in Fig. 3(b)by interpolating data from [de Groot 1998]. In Table III, we provide a classification of firedanger as a function of the FWI index based on the data available from [Canadian ForestService (CFS) Web Page ].
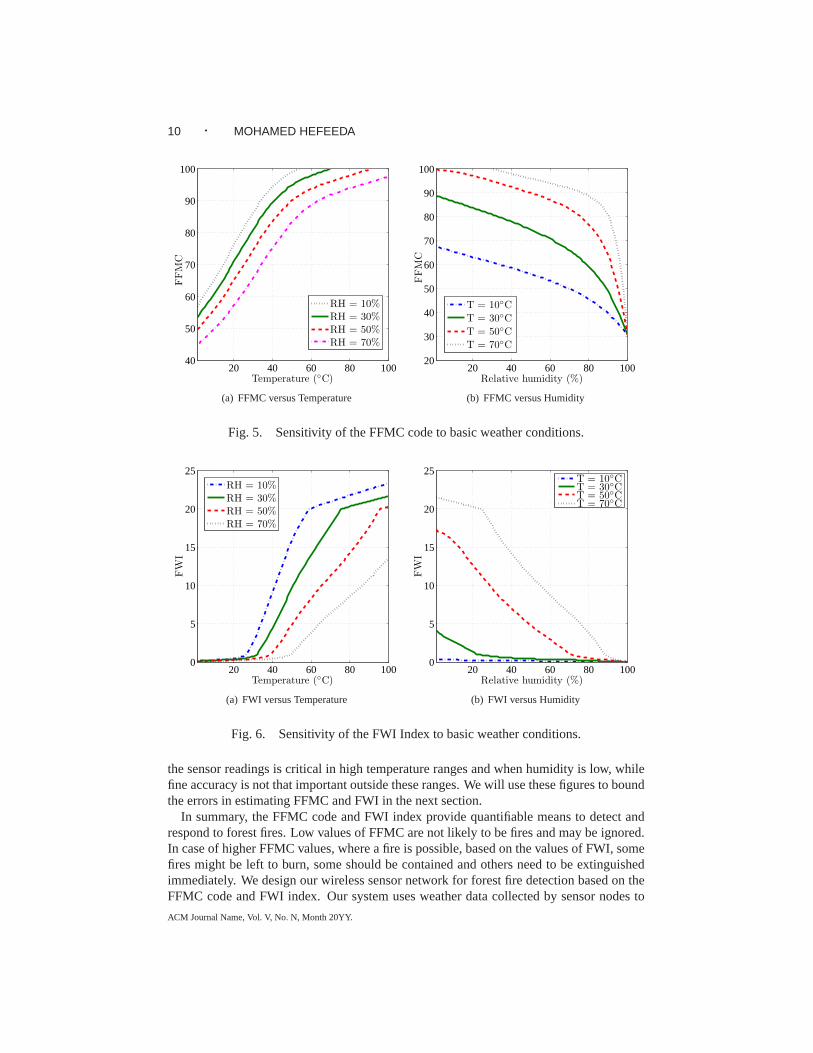
Both the FFMC code and the FWI index are computed from four basic weather condi-tions: temperature, relative humidity, precipitation, and wind speed. These weather condi-tions can be measured by sensors deployed in the forest. The accuracy and the distributionof the sensors impact the accuracy of the FFMC code and the FWI index. Therefore, weneed to quantify the impact of these weather conditions on FFMC and FWI. Using thisquantification, we can design our wireless sensor network toproduce the desired accuracyin FFMC and FWI. In addition, this quantification could help other researchers and sensormanufacturers to customize or develop new products that aremore suitable for the forestfire detection application. To do this quantification, we contacted the Canadian Forest Ser-vice to obtain the closed-form equations that describe the dependence of FFMC and FWIon the weather conditions. We were given access to these equations as well as a programthat computes them [Wagner and Pickett 1985], we post an electronic copy of this reportat [Network Systems Lab Web Page ] for interested researchers in this area. We studiedthe sensitivity of FFMC and FWI to air temperature and relative humidity. Sample of ourresults are shown in Fig. 5 and Fig. 6. The sensitivity of FFMCto temperature and relativehumidity is shown in Fig. 5 for fixed wind speed at5 km/h and precipitation level of5mm. Fig. 6 shows the sensitivity of FWI to temperature and relative humidity under simi-lar conditions. An interesting observation for sensor manufacturers is that the accuracy of
ACM Journal Name, Vol. V, No. N, Month 20YY.
10 · MOHAMED HEFEEDA
20 40 60 80 10040
50
60
70
80
90
100
Temperature (◦C)
FF
MC
RH = 10%RH = 30%RH = 50%RH = 70%
(a) FFMC versus Temperature
20 40 60 80 10020
30
40
50
60
70
80
90
100
Relative humidity (%)
FF
MC
T = 10◦C
T = 30◦C
T = 50◦C
T = 70◦C
(b) FFMC versus Humidity
Fig. 5. Sensitivity of the FFMC code to basic weather conditions.
20 40 60 80 1000
5
10
15
20
25
Temperature (◦C)
FW
I
RH = 10%RH = 30%RH = 50%RH = 70%
(a) FWI versus Temperature
20 40 60 80 1000
5
10
15
20
25
Relative humidity (%)
FW
I
T = 10◦CT = 30◦CT = 50◦CT = 70◦C
(b) FWI versus Humidity
Fig. 6. Sensitivity of the FWI Index to basic weather conditions.
the sensor readings is critical in high temperature ranges and when humidity is low, whilefine accuracy is not that important outside these ranges. We will use these figures to boundthe errors in estimating FFMC and FWI in the next section.
In summary, the FFMC code and FWI index provide quantifiable means to detect andrespond to forest fires. Low values of FFMC are not likely to befires and may be ignored.In case of higher FFMC values, where a fire is possible, based on the values of FWI, somefires might be left to burn, some should be contained and others need to be extinguishedimmediately. We design our wireless sensor network for forest fire detection based on theFFMC code and FWI index. Our system uses weather data collected by sensor nodes to
ACM Journal Name, Vol. V, No. N, Month 20YY.
Forest Fire Modeling and Early Detection using Wireless Sensor Networks · 11
Cluster Head
Idle Sensor
Active Sensor
Internet
Fire Department
Local ResidentsLocal Industry
Data ProcessingCenterHot Spot
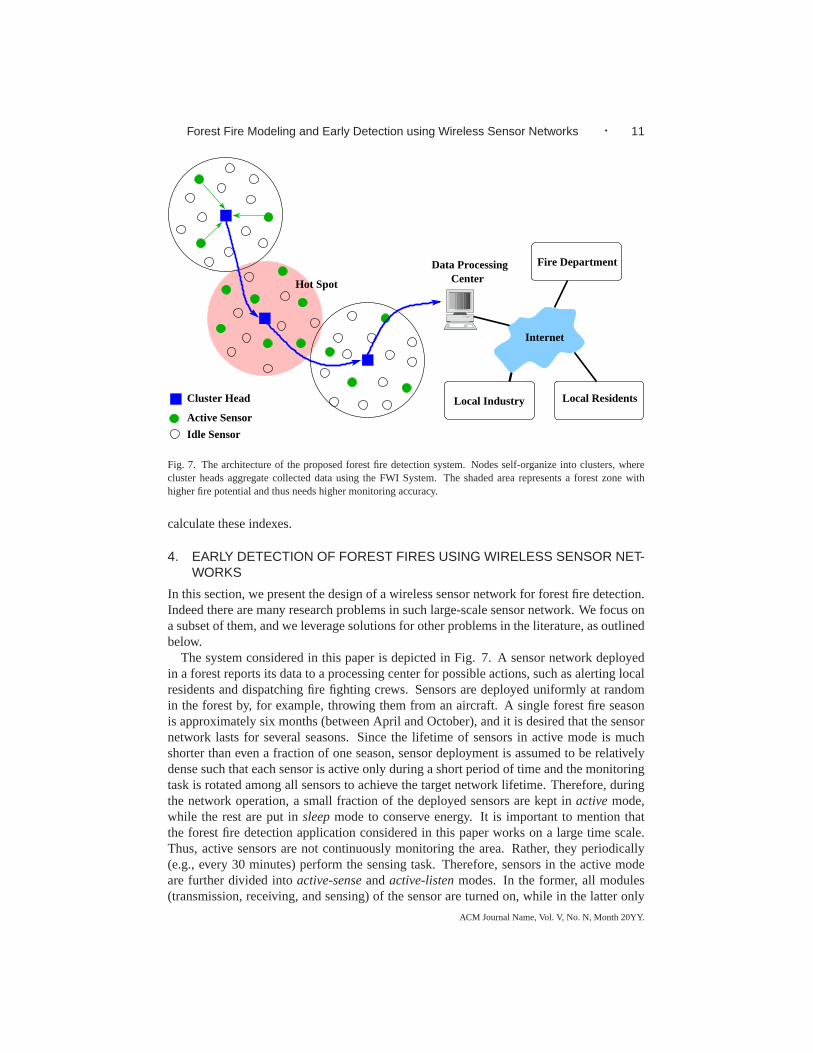
Fig. 7. The architecture of the proposed forest fire detection system. Nodes self-organize into clusters, wherecluster heads aggregate collected data using the FWI System. The shaded area represents a forest zone withhigher fire potential and thus needs higher monitoring accuracy.
calculate these indexes.
4. EARLY DETECTION OF FOREST FIRES USING WIRELESS SENSOR NET-WORKS
In this section, we present the design of a wireless sensor network for forest fire detection.Indeed there are many research problems in such large-scalesensor network. We focus ona subset of them, and we leverage solutions for other problems in the literature, as outlinedbelow.
The system considered in this paper is depicted in Fig. 7. A sensor network deployedin a forest reports its data to a processing center for possible actions, such as alerting localresidents and dispatching fire fighting crews. Sensors are deployed uniformly at randomin the forest by, for example, throwing them from an aircraft. A single forest fire seasonis approximately six months (between April and October), and it is desired that the sensornetwork lasts for several seasons. Since the lifetime of sensors in active mode is muchshorter than even a fraction of one season, sensor deployment is assumed to be relativelydense such that each sensor is active only during a short period of time and the monitoringtask is rotated among all sensors to achieve the target network lifetime. Therefore, duringthe network operation, a small fraction of the deployed sensors are kept inactivemode,while the rest are put insleepmode to conserve energy. It is important to mention thatthe forest fire detection application considered in this paper works on a large time scale.Thus, active sensors are not continuously monitoring the area. Rather, they periodically(e.g., every 30 minutes) perform the sensing task. Therefore, sensors in the active modeare further divided intoactive-senseandactive-listenmodes. In the former, all modules(transmission, receiving, and sensing) of the sensor are turned on, while in the latter only
ACM Journal Name, Vol. V, No. N, Month 20YY.
12 · MOHAMED HEFEEDA
the receiving module is on.Sensors are assumed to self-organize into clusters using a distributed protocol. After
the termination of the clustering protocol, sensors know their cluster heads and the wholenetwork is connected. Any of the protocols described in the recent survey in [Youniset al. 2006] can be employed. Our proposed system does not restrict the cluster size, andit allows single- and multi-hop intra-cluster communications. The sensor clustering anddata routing problems are outside the scope of this paper. Weconsider four problems inthis paper. First, modeling the forest fire detection application as a coverage problem inwireless sensor networks, which we describe in Sec. 4.1. Second, designing a distributedcoverage protocol, presented in Sec. 4.2. Third, developing a data aggregation schemethat is suitable for the forest fire detection application, presented in Sec. 4.3. The finalproblem is achieving unequal fire protection in different zones in the forest, e.g., forestzones near industrial plants and residential areas, or forest zones with drier conditions andhigher temperatures (denoted by hot spots). This is illustrated in Fig. 7 by activating moresensors in the shaded hot spot area. We make the case for this unequal protection usingreal data and present a method to achieve it in Sec. 4.4.
4.1 Modeling Forest Fire Detection as a Coverage Problem
We discussed in the previous section the relevance and importance of the FWI System,especially its FFMC and FWI components. We design our wireless sensor network forforest fire detection based on the FWI System. As shown in Fig. 7, the deployed sen-sors are grouped into clusters, and each cluster elects a cluster head. Each cluster headperiodically computes the FFMC and FWI for its cluster by sampling weather conditionsfrom active sensors inside the cluster. This information isthen forwarded—through multihop routing—to a processing center for possible actions. Recall that FFMC and FWI arecomputed from basic weather conditions such as temperatureand humidity (see Fig. 1).
To be useful in detecting fires and assessing their intensity, FFMC and FWI need to beestimated within specific error bounds. For example, if the error in the estimated FWI ishigh (e.g.5 units), the fire would be misclassified as indicated by Table III. To achieve thedesired accuracy in FFMC and FWI, basic weather conditions should, in turn, be measuredaccurately. The accuracy level of measuring basic weather conditions is determined fromthe curves relating FWI and FFMC to weather conditions, such as Figs. 5 and 6. Forinstance, the worst-case slope of the FWI-Temperature curvein Fig. 6(a) at RH =10% isabout 0.62. Thus, an error up to 1 unit in FWI requires measuring the temperature with1.6 degree accuracy. Knowing the needed accuracy in measuring weather conditions, thesensor network should be designed to collect data with that accuracy. We illustrate thisdesign using temperature as an example, the same can be done for other metrics.
Consider measuring the temperature in an arbitrary cluster. Sensors in the cluster shouldbe activated in a way that the samples reported by them represent the temperature in thewhole cluster. This means that the cluster area should be covered by the sensing ranges ofactive sensors. This is called 1-coverage, or coverage withdegree 1, because each pointin the area is supposed to be within the sensing range of at least one sensor. In densesensor networks and when sensors are deployed uniformly at random in the area—whichis the case for forest fire detection systems as described above—area coverage can beapproximated by sensor location coverage [Yang et al. 2006]. That is, we need to activatea subset of sensors to ensure that the locations of all sensors are 1-covered.
In real forest environments, sensor readings may not be accurate due to several factors,
ACM Journal Name, Vol. V, No. N, Month 20YY.
Forest Fire Modeling and Early Detection using Wireless Sensor Networks · 13
including: (i) different environment conditions (e.g., some sensors happen to be in theshade of trees, while others are not), (ii) inaccurate calibration of sensors, (iii) aging ofsensors, and (iv) unequal battery levels in sensors. In addition, to cover large forests,sensing ranges of deployed sensors will have to be large (in order of hundreds of meters),which may introduce more errors in the sensor readings. Therefore, multiple (k) samplesmay be needed to estimate the temperature at a location with the target accuracy. That is,each location needs to be sensed byk different sensors. This is calledk-coverage, wherek ≥ 1. The actual value ofk depends on the expected error in the sensor readings and thetolerable error in the FFMC and FWI indexes. One way to estimate k is described in thefollowing.
We define a random variableT as the reading of a sensor inside the cluster. It is reason-able to assume thatT follows a normal distribution because of the many factors contribut-ing to it, which all are naturally stochastic. We denote the mean and standard deviationof T as µT and σT , respectively. The estimated meanµ̂T , also known as the samplemean, is given by:̂µT = 1
k
∑k
i=1ti, wheretis are the individual sensor readings, andk
is the number of samples. As the number of samples increases,the sample mean becomescloser to the actual mean. The error between the sample mean and the population mean,
δT = |µT − µ̂T |, is calculated as follows [Taylor 1997]:δT = zα
2
σT√k
, wherez is the
standard normal distribution,α is the length of the confidence interval,σT is the popula-tion standard deviation, andk is the sample size.zα
2can be obtained from tables of the
standard normal distribution. Rearranging the formula, weget:
k =
⌈(zα
2
σT
δT
)2⌉. (1)
Thus, given a confidence value of100(1 − α)% and standard deviation ofσT , we candetermine the sample size required to estimate the population meanµT within δT errormargin. σT can be calculated from the specifications of the sensing board. The errorin sensor measurements is usually interpreted as2σT . To illustrate, suppose we want tomeasure the temperature with a maximum error of1◦C and with a confidence value of95%. Assume that sensors have temperature sensing boards with an error up to2◦C, i.e.,σT = 1. Therefore, we need a coverage degreek = (1.96 × 1/1)2 = 4. In the evaluationsection, we study and validate the relationship between thecoverage degreek and the errorin FFMC and FWI. We also study the tradeoff between the error inthe sensor readingsσT
and the required coverage degreek to meet given target errors in FFMC and FWI.To summarize, in this section we have established a mapping between the forest fire
detection system and thek-coverage problem (k ≥ 1) in sensor networks. We showed howk can be estimated based on the error in sensor readings and themaximum tolerable errorsin estimating the FFMC code and FWI index. The tolerable errors in FFMC and FWI canbe estimated from Figs. 5, 6 and Tables II, III, based on the application requirements. Aftercomputingk, we need to activate a subset of sensors to ensurek-coverage, and keep othersensors in sleep mode to conserve energy. In Sec. 4.2, we present a distributed protocol toachieve this.
4.2 Distributed K-Coverage Algorithm
To achievek-coverage (k ≥ 1) in different clusters of the monitored forest, we need adistributed, energy-efficient, algorithm. As mentioned above, area coverage can be ap-
ACM Journal Name, Vol. V, No. N, Month 20YY.
14 · MOHAMED HEFEEDA
proximated by ensuring that all node locations are covered.Thus, thek-coverage problembecomes selecting a minimum subset of nodes to cover all nodes. Selecting the minimumsubset for activation is desired because it reduces total energy consumption and thus pro-longs the network lifetime. Computing the minimum subset, however, is NP-hard [Yanget al. 2006]. In [Hefeeda and Bagheri 2007], we designed a logarithmic factor approxima-tion algorithm to solve thek-coverage problem. Our previous work focused on the theo-retical analysis of the algorithm without paying much attention to the specific application.In the current work, we customize this algorithm to the forest fire detection application,and we consider several issues that were not addressed before. We first summarize the keyideas of ourk-coverage algorithm.
We model thek-coverage problem as a set system for which an optimal hitting set cor-responds to an optimal solution for coverage. At a high level, our algorithm begins withselecting a set of points referred to asǫ-net. Initially the number of points in theǫ-net is1.All points are assigned weights that are initially equal to1. A point is added to theǫ-netwith a probability proportional to its weight. If a pointq is selected to be inǫ-net,k nodesinside a disk of radiusrs centered atq are randomly selected to be part of the solution fork-coverage.rs is the sensing range of a node. The algorithm then verifies if activating theselected set of sensor locations sufficiently covers all points. If so, it terminates. Other-wise, the weight of a point that is not sufficiently covered isdoubled and a newǫ-net withthe same size is selected. After a specific number of iterations, if no solution was found,the size of theǫ-net is doubled to allow a larger solution. It is proved in theextended ver-sion of [Hefeeda and Bagheri 2007] that this algorithm terminates and achieves a solutionof size within a logarithmic factor of the optimal.
The above algorithm is centralized, but it can easily be implemented in a distributedmanner. This is because it only maintains two global variables,ǫ-net size and aggregateweight of all points, and both variables can be estimated with local information. Thedistributed algorithm, called DRKC, estimates theǫ-net size as follows. All nodes keeptrack of the desiredǫ-net size using the local variablenetSize, which is initially set to1. Since theǫ-net size is simply doubled in every iteration, nodes can getan accurateestimate of the desired size of theǫ-net for the current iteration. Knowing the desiredǫ-net size enables nodes to independently contribute to the current ǫ-net in a way when allcontributions are added up, the desired globalǫ-net is produced. A node decides (locally)to be part of theǫ-net with a probabilityp = (weight/totalWeight) × netSize. If anode is chosen, it will activatek other nodes to be part of thek-coverage solution bybroadcasting an ACTIVATE message. The ACTIVATE message contains a probabilityPa
which is calculated as(k − curCoverage)/(neighborSize − curCoverage), wherek isthe requested coverage degree, andcurCoverage is the current degree of coverage at thenode. When a node receives an ACTIVATE message, it becomes active with probabilityPa. Pa is so chosen to make the expected number of newly activated nodes equal tok − curCoverage which is needed by the sender of the ACTIVATE message.
A node uses the variabletotalWeight to estimate the aggregate weight of all nodes.totalWeight is initialized to the number of nodes in the networkn. In the centralizedalgorithm, the weight of only one under-covered node is doubled. To emulate this in thedistributed algorithm, an under-covered node doubles its weight with probability1/nu,wherenu is the number of under-covered nodes in the network.nu is approximated locallyas(n−netSize). Thus, the expected number of nodes that double their weights is equal to
ACM Journal Name, Vol. V, No. N, Month 20YY.
Forest Fire Modeling and Early Detection using Wireless Sensor Networks · 15
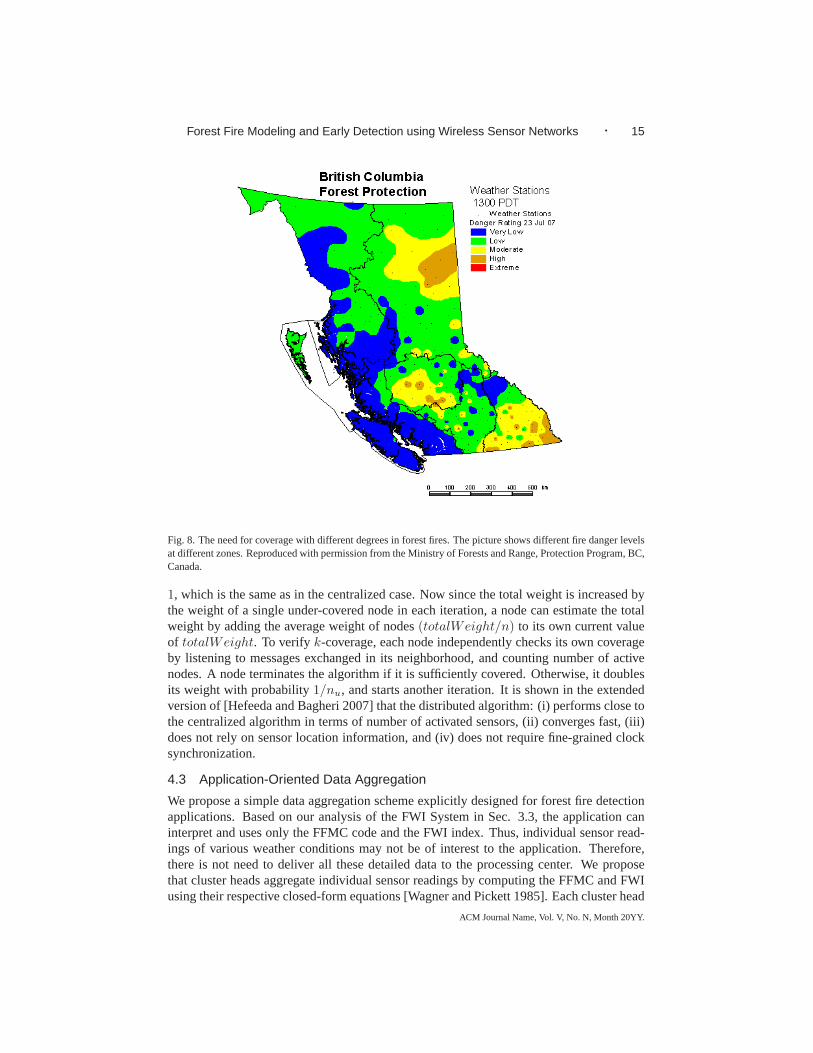
Fig. 8. The need for coverage with different degrees in forest fires. The picture shows different fire danger levelsat different zones. Reproduced with permission from the Ministry of Forests and Range, Protection Program, BC,Canada.
1, which is the same as in the centralized case. Now since the total weight is increased bythe weight of a single under-covered node in each iteration,a node can estimate the totalweight by adding the average weight of nodes(totalWeight/n) to its own current valueof totalWeight. To verify k-coverage, each node independently checks its own coverageby listening to messages exchanged in its neighborhood, andcounting number of activenodes. A node terminates the algorithm if it is sufficiently covered. Otherwise, it doublesits weight with probability1/nu, and starts another iteration. It is shown in the extendedversion of [Hefeeda and Bagheri 2007] that the distributed algorithm: (i) performs close tothe centralized algorithm in terms of number of activated sensors, (ii) converges fast, (iii)does not rely on sensor location information, and (iv) does not require fine-grained clocksynchronization.
4.3 Application-Oriented Data Aggregation
We propose a simple data aggregation scheme explicitly designed for forest fire detectionapplications. Based on our analysis of the FWI System in Sec. 3.3, the application caninterpret and uses only the FFMC code and the FWI index. Thus, individual sensor read-ings of various weather conditions may not be of interest to the application. Therefore,there is not need to deliver all these detailed data to the processing center. We proposethat cluster heads aggregate individual sensor readings bycomputing the FFMC and FWIusing their respective closed-form equations [Wagner and Pickett 1985]. Each cluster head
ACM Journal Name, Vol. V, No. N, Month 20YY.
16 · MOHAMED HEFEEDA
periodically collects weather conditions from sensors in its cluster and computes FFMCand FWI.
Cluster heads carry out significant load, because they compute FFMC and FWI fromcomplicated equations and participate in data forwarding across clusters. Hence, unlessthe role of the cluster head is rotated, heads run out of energy and die earlier than othernodes. This may cause coverage holes in some areas, or it could partition the networkand disrupt data forwarding. To balance the load across all nodes, we propose to scalethe probability of a node activating itselfPa upon receiving an ACTIVATE message by itslevel of remaining energy. Thus, a node that has been a cluster head before will have asmaller probability of becoming cluster head again. Our simulation results (Sec. 5) showthat this simple extension balances the load across all nodes and significantly prolongs thenetwork lifetime.
4.4 Unequal Monitoring of Forest Zones
Unequal monitoring of different forest zones is important in forest fire detection systems,because some areas may have higher fire potential than others. For example, dry areas athigher elevations are more susceptible to fires than lower and more humid areas. Moreover,it is usually important to monitor parts of the forest near residential and industrial zoneswith higher reliability and accuracy. To confirm the above intuition, we collected real dataon the fire danger rating produced by the Protection Program of the Ministry of Forests andRange, in the Province of British Columbia, Canada. Sample of the data is shown in Fig.8 for 23 July 2007. The figure shows several hot spots with ‘High’ danger rating withinlarger areas with ‘Moderate’ rating. The number, size, and locations of the hot spots aredynamic, because they depend on weather conditions. Maps such as the one shown in Fig.8 are produced daily.
To support unequal monitoring of forest zones, we propose tocover the forest withdifferent degrees of coverage at different zones. Intuitively, in hot spots, the FFMC andFWI are expected to be in the high ranges of their scales, and small errors in these rangescould lead to mis-classifying a fire and/or taking the wrong re-actions. For example, the‘Very High’ range of FFMC in Table II is 89–91 (only two units), while the ‘Low’ rangeis 0–76. As discussed in Sec. 4.1, higher accuracy in computing FFMC and FWI requirecollecting weather conditions more accurately, which can be achieved by controlling thecoverage degreek.
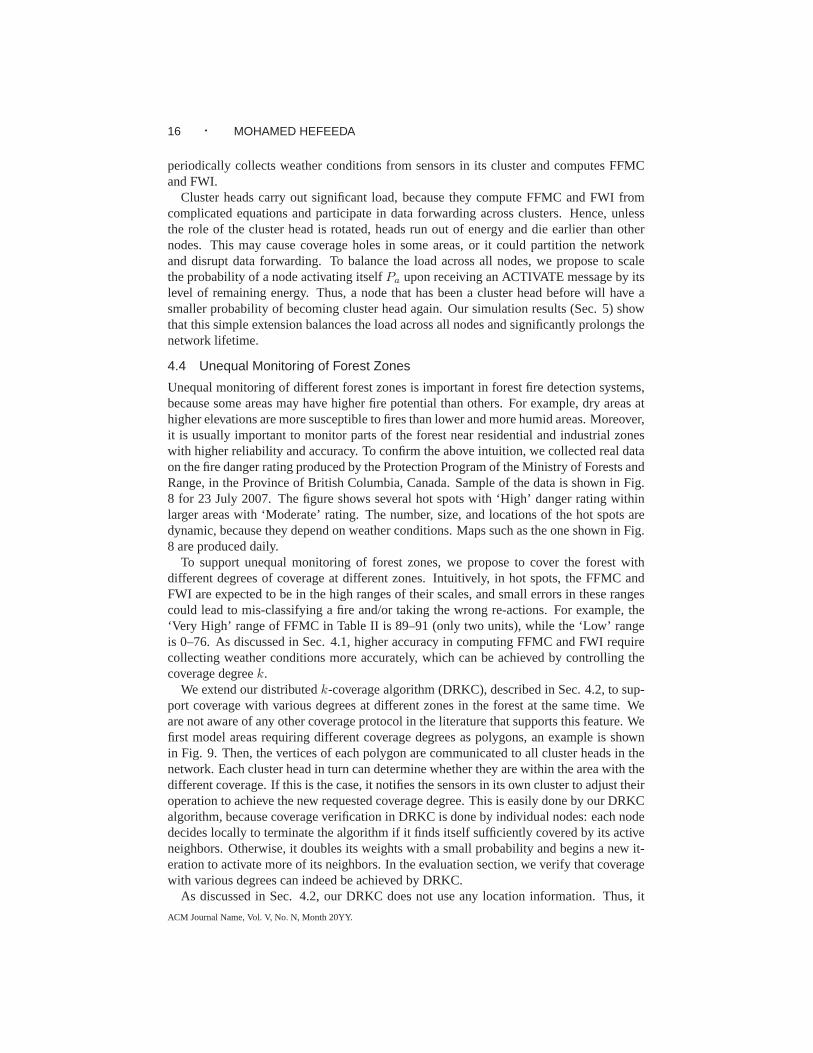
We extend our distributedk-coverage algorithm (DRKC), described in Sec. 4.2, to sup-port coverage with various degrees at different zones in theforest at the same time. Weare not aware of any other coverage protocol in the literature that supports this feature. Wefirst model areas requiring different coverage degrees as polygons, an example is shownin Fig. 9. Then, the vertices of each polygon are communicated to all cluster heads in thenetwork. Each cluster head in turn can determine whether they are within the area with thedifferent coverage. If this is the case, it notifies the sensors in its own cluster to adjust theiroperation to achieve the new requested coverage degree. This is easily done by our DRKCalgorithm, because coverage verification in DRKC is done by individual nodes: each nodedecides locally to terminate the algorithm if it finds itselfsufficiently covered by its activeneighbors. Otherwise, it doubles its weights with a small probability and begins a new it-eration to activate more of its neighbors. In the evaluationsection, we verify that coveragewith various degrees can indeed be achieved by DRKC.
As discussed in Sec. 4.2, our DRKC does not use any location information. Thus, it
ACM Journal Name, Vol. V, No. N, Month 20YY.
Forest Fire Modeling and Early Detection using Wireless Sensor Networks · 17
Regular covergae, k = 1
k = 4
k = 8
Fig. 9. Modeling forest zones that require different degrees of coverage as polygons.
saves the overhead of localization protocols, or the cost ofequipping sensors with GPS,which is a significant saving considering the scale of the forest fire detection system. How-ever, cluster heads need to determine whether or not they areinside some hot spots. Thiscan be achieved by associating sensor IDs to their approximate locations during the de-ployment process. For example, during deployment, sensorswith specific ID ranges canbe thrown by the aircraft in target geographical locations.This mapping is maintained bythe data processing center to dynamically configure the sensor network. It is important toemphasize that the approximate locations do not impact the operation of our DRKC proto-col, they are only used to delineate hot spots. Hot spots are usually measured in kilometers,and thus approximate locations are suitable for specifyingthem.
5. EVALUATION
In this section, we evaluate various aspects of the proposedwireless sensor network forforest fire detection. We start by assessing the accuracy in estimating the FFMC and FWIfire indexes as a function of the coverage degreek. We also analyze the tradeoff betweenthe error in sensor readings and the required coverage degree. Then, we evaluate ourk-coverage algorithm and verifies that it can provide unequal monitoring of the forest zones,and balances the load across all sensors and hence prolongs the network lifetime.
5.1 Accuracy of FFMC and FWI
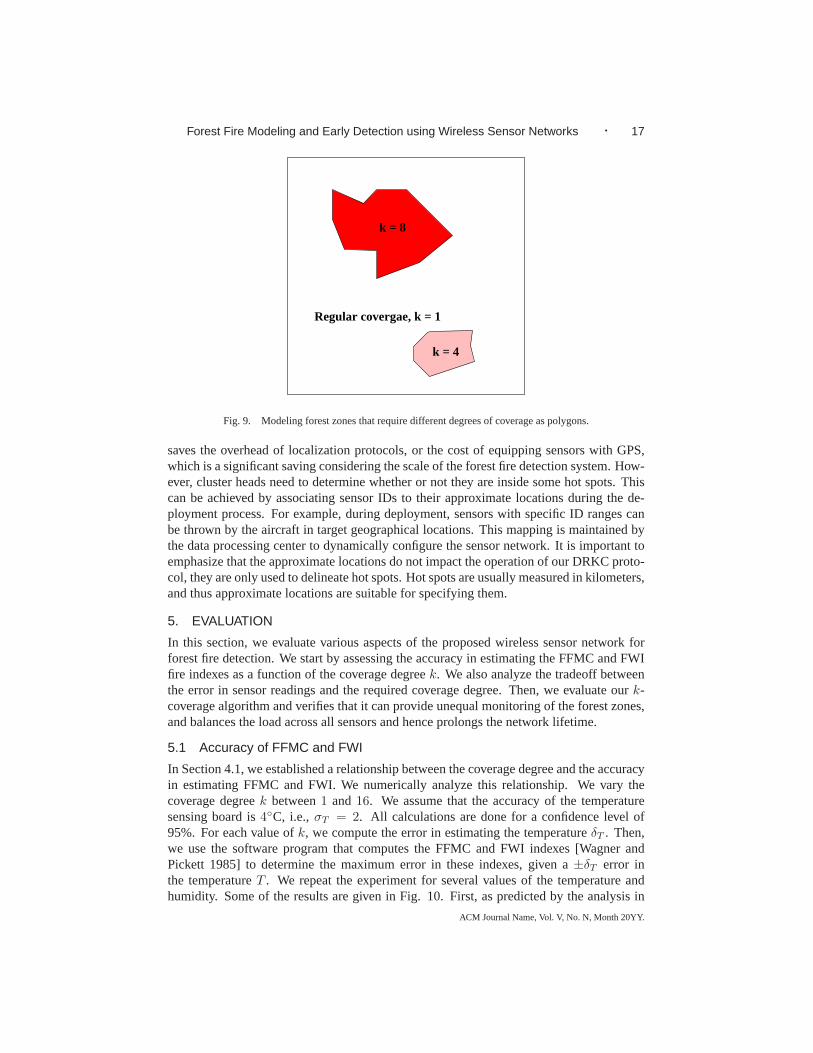
In Section 4.1, we established a relationship between the coverage degree and the accuracyin estimating FFMC and FWI. We numerically analyze this relationship. We vary thecoverage degreek between1 and16. We assume that the accuracy of the temperaturesensing board is4◦C, i.e.,σT = 2. All calculations are done for a confidence level of95%. For each value ofk, we compute the error in estimating the temperatureδT . Then,we use the software program that computes the FFMC and FWI indexes [Wagner andPickett 1985] to determine the maximum error in these indexes, given a±δT error inthe temperatureT . We repeat the experiment for several values of the temperature andhumidity. Some of the results are given in Fig. 10. First, as predicted by the analysis in
ACM Journal Name, Vol. V, No. N, Month 20YY.
18 · MOHAMED HEFEEDA
2 4 6 8 10 12 14 160
2
4
6
8
10
12
14
16
18
20
Coverage degree k
Err
or
inF
FM
C
T = 10◦C
T = 30◦C
T = 50◦C
(a)
2 4 6 8 10 12 14 160
0.1
0.2
0.3
0.4
0.5
0.6
0.7
Coverage degree k
Err
or
inF
WI
RH = 10%
RH = 30%
RH = 50%
(b)
Fig. 10. Error in calculating: (a) FFMC Code, (b) FWI Index forvarious coverage degreesand in different weather conditions.
0 2 4 6 8 100
10
20
30
40
50
60
70
Error in sensor reading (◦C)
Req
uir
edco
ver
age
deg
ree
k
0.75 max FWI error
1.00 max FWI error
1.50 max FWI error
(a)
0 1 2 3 4 50
2
4
6
8
10
12
14
16
Error in sensor reading (◦C)
Req
uir
edco
ver
age
deg
ree
k
0.75 max FWI error
1.00 max FWI error
1.50 max FWI error
(b)
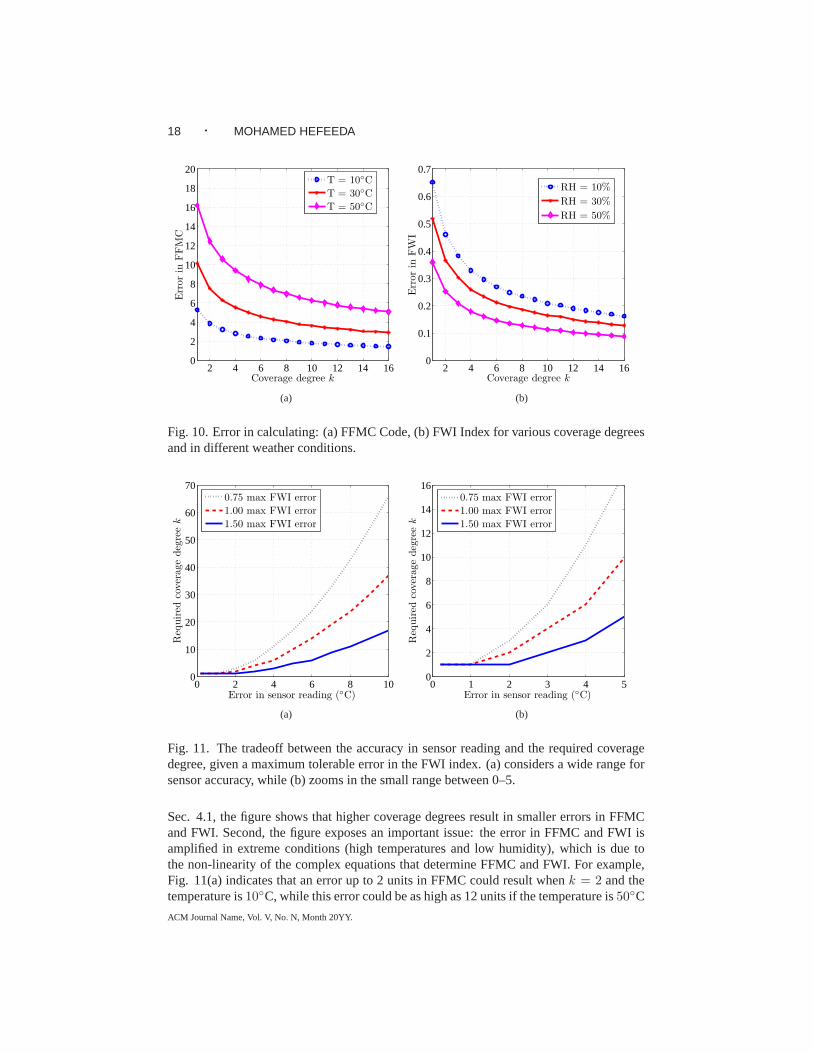
Fig. 11. The tradeoff between the accuracy in sensor readingand the required coveragedegree, given a maximum tolerable error in the FWI index. (a) considers a wide range forsensor accuracy, while (b) zooms in the small range between 0–5.
Sec. 4.1, the figure shows that higher coverage degrees result in smaller errors in FFMCand FWI. Second, the figure exposes an important issue: the error in FFMC and FWI isamplified in extreme conditions (high temperatures and low humidity), which is due tothe non-linearity of the complex equations that determine FFMC and FWI. For example,Fig. 11(a) indicates that an error up to 2 units in FFMC could result whenk = 2 and thetemperature is10◦C, while this error could be as high as 12 units if the temperature is50◦C
ACM Journal Name, Vol. V, No. N, Month 20YY.
Forest Fire Modeling and Early Detection using Wireless Sensor Networks · 19
with the samek value. This means that in extreme conditions, which are the most importantfor the forest fire detection system, even small errors in sensing the temperatures could leadto significant errors in FFMC and FWI, which may lead the sensornetwork operators totake incorrect actions. This also highlights the importance of unequal monitoring of forestzones: host spots of the forest need to be covered with higherdegrees to provide accurateassessment of the potential and intensity of fires. Furthermore, the results in Fig. 10 canbe used todynamicallyconfigure the sensor network such that higher coverage degreesare enforced as the weather conditions get more severe. Dynamic configuration of thesensor network (or parts of it) is easily achieved by ourk-coverage algorithm because ofits distributed nature, this is demonstrated in the next subsection.
In the previous experiment, the error in sensor reading is fixed. In our next experiment,we analyze the tradeoff between the accuracy of the sensing boards and the required cov-erage degree such that a given maximum error in FFMC and FWI is not exceeded. Sinceforest fire detection is an important application for sensornetworks, sensor manufacturersmay customize or even create new products explicitly for this application. In this case, un-derstanding the needed accuracy of the sensing module couldresult in significant savingsespecially for mass production of sensors.
We consider a wide range of accuracy for sensing boards; the results presented here arefor temperature sensors, but the analysis can be carried outfor other weather conditionsas well. As mentioned in Sec. 4.1, the error in sensor readingis specified as2σT . Wevary the error in sensor reading from0.25◦C to 10◦C, which captures the the range ofaccuracy achieved by very accurate and expensive sensors torough and cheap sensors. Foreach value of the error reading, we compute the required coverage degreek to meet thegiven error in FWI and FFMC using their equations. We repeat for a few target errors inFWI and FFMC. We plot the results for the FWI index in Fig. 11; Fig. 11(a) shows theresults for the full error range, while Fig. 11(b) zooms in the small error range between0–5 for illustration. The figure clearly exposes the tradeoff: for larger errors in sensorreadings (i.e., cheaper sensors), higher coverage degreesare required to meet the targeterror in FWI and FFMC. For example, for a maximum error in FWI of 1.0 unit, a coveragedegree of 1 is needed when sensors that have temperature error readings up to1◦C aredeployed, whereas a coverage degree of 8 would tolerate temperature error readings up to4.5◦C while achieving the same accuracy in FWI. Higher coverage degrees require keepingmore sensors active, which means that they will be depleted from energy faster. Therefore,to achieve a target network lifetime, more sensors will needto be deployed for highercoverage degrees. However, with mass production of less-accurate sensors, increasing thedegree of coverage could result in more cost-effective sensor networks that achieve thesame function.
5.2 Evaluation of the k-coverage Algorithm
We have implemented a packet-level simulator for our distributedk-coverage algorithm inC++. Simulators like NS-2 did not scale to the number of nodes(in order of thousands)needed to evaluate our algorithm. We fix an area of size1km×1km and vary the coveragedegreek between1 and8. We deploy up to 12,000 sensors uniformly at random with thesame density over the entire area. The large number of sensors is needed to support cov-erage with high degrees. We assume that the sensing range of nodes is100m; using othersensing ranges does not impact the operation of our algorithm, because it only changes thefraction of active sensors. We employ the energy model in [Yeet al. 2003] and [Zhang and
ACM Journal Name, Vol. V, No. N, Month 20YY.
20 · MOHAMED HEFEEDA
1 2 3 4 50
20
40
60
80
100
Observed coverage degree
Per
centa
geof
1-co
ver
edpoi
nts
(%)
(a) Requestedk = 1
4 5 6 7 8 9 10 11 12 13 140
20
40
60
80
100
Observed coverage degree
Per
centa
geof
4-co
ver
edpoi
nts
(%)
(b) Requestedk = 4
8 9 10 11 12 13 14 15 16 17 18 19 200
20
40
60
80
100
Observed coverage degree
Per
centa
geof
8-co
ver
edpoi
nts
(%)
(c) Requestedk = 8
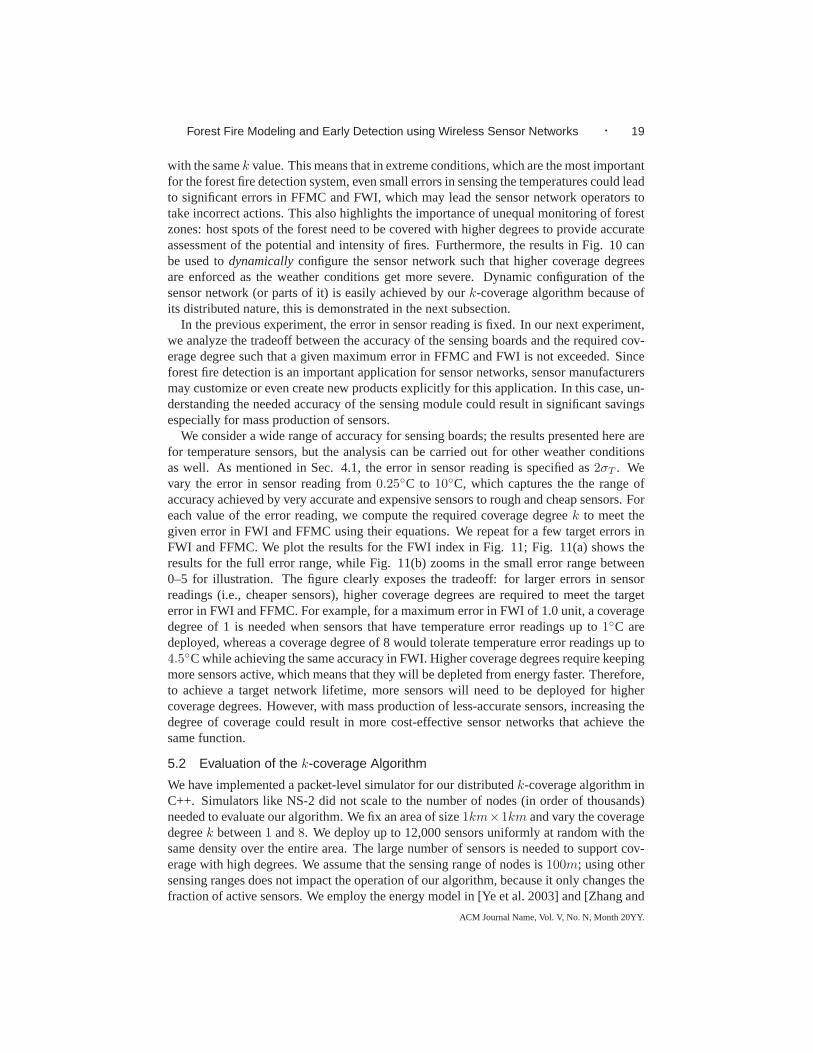
Fig. 12. Coverage with different degrees achieved by our algorithm.
Hou 2005], which is based on the Berkeley Mote hardware specifications. In this model,the node power consumption in transmission, reception, idle and sleep modes are60, 12,12, and0.03 mW, respectively. The results are summarized in the following.
Unequal Monitoring using Different Coverage Degrees.In this experiment, we validatethat our distributedk-coverage algorithm can maintain coverage with various degrees toachieve unequal monitoring of different zones in the forest. We assume there are two hotspots inside the forest that need higher coverage degrees than other areas, as shown in Fig.9. The two spots are modeled as two polygons. The requested coverage degree in one spotis 8 and in the other is4. Nodes outside the hot spots are requested to have a coveragedegree of1. We run our algorithm and notify nodes inside the hot spots ofthe differentcoverage degrees. We let the algorithm converge, and we check the coverage degree ofevery single point in the area. We plot the achieved coveragedistribution in each area inFig. 12. The results indicate that in each of the hot spots, our algorithm indeed achieves therequested coverage degree while it provides1-coverage in the rest of the area. Fig. 12 alsoshows that our algorithm does not over cover areas, because the fraction of nodes havinghigher-than-requested coverage degrees decreases fast. This is important to save energyand prolong network lifetime.
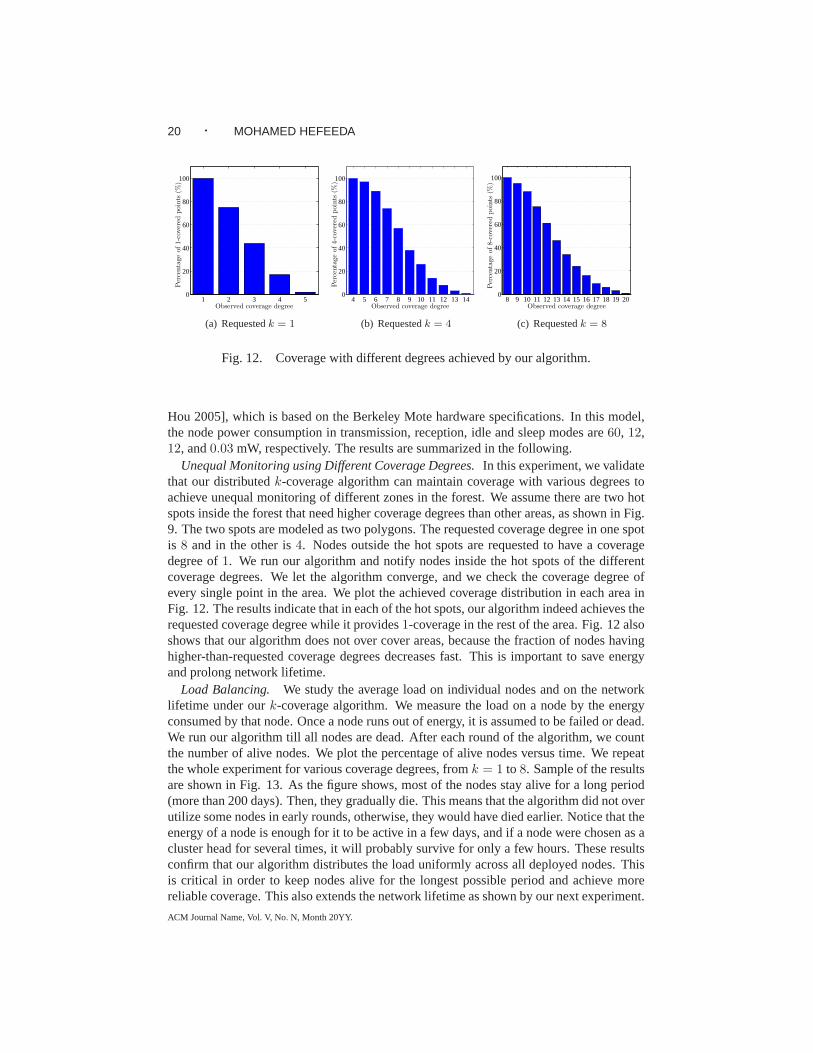
Load Balancing. We study the average load on individual nodes and on the networklifetime under ourk-coverage algorithm. We measure the load on a node by the energyconsumed by that node. Once a node runs out of energy, it is assumed to be failed or dead.We run our algorithm till all nodes are dead. After each roundof the algorithm, we countthe number of alive nodes. We plot the percentage of alive nodes versus time. We repeatthe whole experiment for various coverage degrees, fromk = 1 to 8. Sample of the resultsare shown in Fig. 13. As the figure shows, most of the nodes stayalive for a long period(more than 200 days). Then, they gradually die. This means that the algorithm did not overutilize some nodes in early rounds, otherwise, they would have died earlier. Notice that theenergy of a node is enough for it to be active in a few days, and if a node were chosen as acluster head for several times, it will probably survive foronly a few hours. These resultsconfirm that our algorithm distributes the load uniformly across all deployed nodes. Thisis critical in order to keep nodes alive for the longest possible period and achieve morereliable coverage. This also extends the network lifetime as shown by our next experiment.
ACM Journal Name, Vol. V, No. N, Month 20YY.
Forest Fire Modeling and Early Detection using Wireless Sensor Networks · 21
0 100 200 300 4000
20
40
60
80
100
Time (days)
Per
centa
ge
ofalive
senso
rs(%
)
(a) k = 1
0 100 200 300 4000
20
40
60
80
100
Time (days)
Per
centa
ge
ofalive
senso
rs(%
)
(b) k = 8
Fig. 13. Ourk-coverage algorithm balances load across all nodes, since most of them stayalive for long periods.
0 100 200 300 4000
20
40
60
80
100
Time (days)
Per
centa
geof
cover
edpoi
nts
(%)
(a) k = 1
0 100 200 300 4000
20
40
60
80
100
Time (days)
Per
centa
geof
cover
edpoi
nts
(%)
(b) k = 8
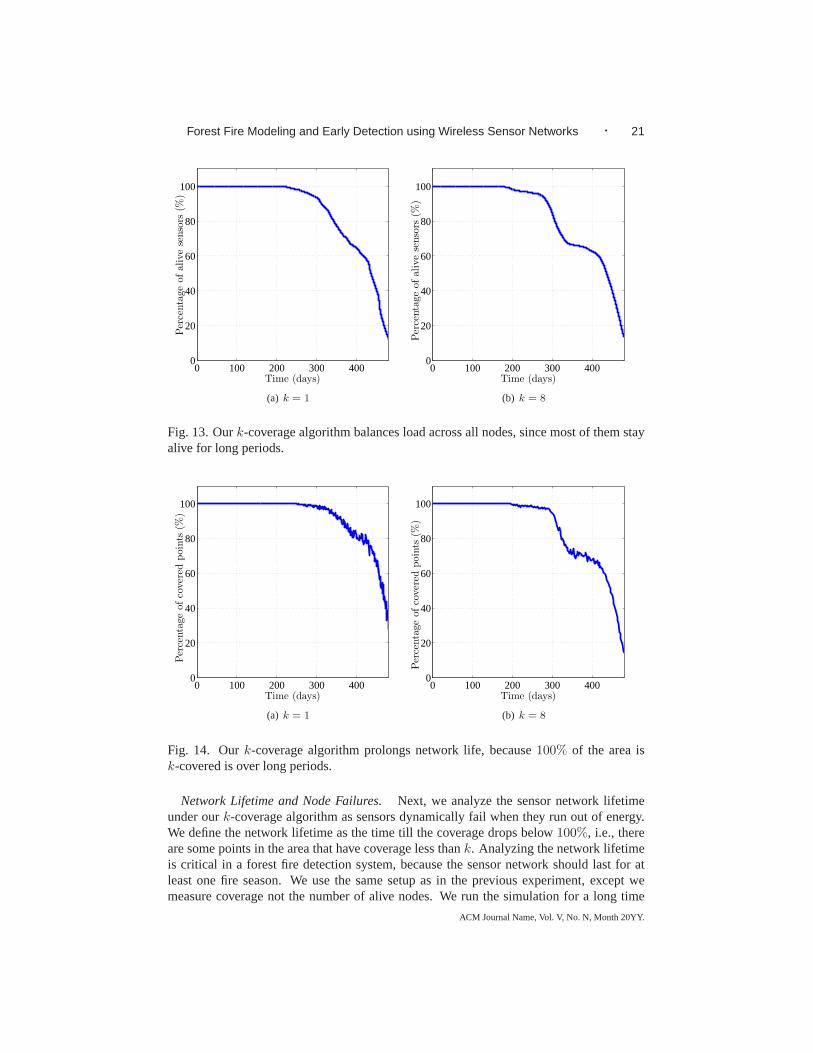
Fig. 14. Ourk-coverage algorithm prolongs network life, because100% of the area isk-covered is over long periods.
Network Lifetime and Node Failures.Next, we analyze the sensor network lifetimeunder ourk-coverage algorithm as sensors dynamically fail when they run out of energy.We define the network lifetime as the time till the coverage drops below100%, i.e., thereare some points in the area that have coverage less thank. Analyzing the network lifetimeis critical in a forest fire detection system, because the sensor network should last for atleast one fire season. We use the same setup as in the previous experiment, except wemeasure coverage not the number of alive nodes. We run the simulation for a long time
ACM Journal Name, Vol. V, No. N, Month 20YY.
22 · MOHAMED HEFEEDA
and periodically check the coverage degree for every singlepoint in the area. A point isconsidered covered if its coverage degree is at leastk. We varyk between1 and8 andplot some of the results in Fig. 14. The figure shows that100% coverage of the areais maintained through a long period of time, more than 200 days. This is because ouralgorithm uniformly distributes load on nodes.
Fig. 14 also shows that coverage decreases at a slower rate than the number of alivenodes in Fig. 13. For example, in Fig. 13(a), the number of alive nodes starts to dropbelow 100% around day 200, while100% coverage is maintained till almost day 300 asshown in Fig. 14(a). This demonstrates the robustness of ouralgorithm against nodefailures. In addition, the results in Fig. 14 imply that alive nodes are not grouped incertain subareas, rather, they are uniformly distributed in the whole area. Therefore, ourk-coverage algorithm prolongs the network lifetime becauseit uniformly balances the loadacross all nodes and it keeps alive nodes distributed throughout the whole area.
6. CONCLUSIONS
We presented the design of a wireless sensor network for early detection of forest fires.Our design is based on the Fire Weather Index (FWI) System, which is backed by decadesof forestry research. The FWI System is comprised of six components: three fuel codesand three fire indexes. The three fuel codes represent the moisture content of the organicsoil layers of forest floor, whereas the three fire indexes describe the behavior of fire. Byanalyzing data collected from forestry research, we showedhow the FWI System can beused to meet the two goals of a wireless sensor network designed for forest fires: (i) provideearly warning of a potential forest fire, and (ii) estimate the scale and intensity of the fireif it materializes. To achieve these goals, we designed our sensor network based on twomain components of the FWI System: the Fine Fuel Moisture Code(FFMC), and the FireWeather Index (FWI). The FFMC code is used to achieve the first goal and the FWI indexis used to achieve the second.
We modeled the forest fire detection problem as ak-coverage problem, withk ≥ 1. Wecomputed the required coverage degrees to achieve a given accuracy level in estimating dif-ferent components of the FWI System. We then described the application of our distributedk-coverage algorithm to solve thek-coverage problem. Our algorithm is simple to imple-ment and does not require any specific node deployment schemes. Therefore, nodes can beuniformly deployed by, for example, throwing them from an aircraft. This significantly fa-cilitates node deployment in real life. We showed through simulations that our algorithm:(i) balances load across all deployed nodes, and therefore maintains reliable coverage andsignificantly prolongs the network lifetime; and (ii) can provide various coverage degreesat different areas of the forest, and thus can achieve higherdetection accuracy in importantareas such as near residential or industrial neighborhoods.
Acknowledgment
This work is partially supported by the Natural Sciences andEngineering Research Council(NSERC) of Canada under Discovery Grant #313083 and RTI Grant #344619. MajidBagheri contributed to the initial work of this paper. We would like to thank Eric Meyerwith the Protection Program of the Ministry of Forests and Range, BC, Canada for allowingus to reporduce some of the images presented in this paper.
ACM Journal Name, Vol. V, No. N, Month 20YY.
Forest Fire Modeling and Early Detection using Wireless Sensor Networks · 23
REFERENCES
AEROVISION WEB PAGE. http://www.aerovision-uav.com.AKYILDIZ , I., WEILIAN , S., SANKARASUBRAMANIAM , Y., AND CAYIRCI , E. 2002. A survey on sensor
networks.IEEE Communications Magazine 40,8 (August), 102–114.ALEXANDER, M. AND GROOT, W. D. 1988. Fire behavior in Jack Pine stands as related to the Canadian
Forest Fire Weather Index System. Tech. rep., Canadian Forest Service, Northern Forestry Centre, Edmonton,Alberta.
AVHRR WEB PAGE. http://noaasis.noaa.gov/noaasis/ml/avhrr.html.B.C. FIRE LOOKOUT TOWERS. http://www.firelookout.com/bc.html.B.C. MINISTRY OF FORESTS ANDRANGE. Fire Review Summary for Okanagan Mountain Fire (K50628).B.C. MINISTRY OF FORESTS ANDRANGE WEB PAGE. http://www.for.gov.bc.ca.BREEJEN, E., BREUERS, M., CREMER, F., KEMP, R., ROOS, M., SCHUTTE, K., AND VRIES, J. 1998. Au-
tonomous forest fire detection. InProc. of Third International Conference on Forest Fire Research and Four-teenth Conference on Fire and Forest Meteorology. Luso, Portugal, 2003–2012.
CANADIAN FOREST FIRE DANGER RATING SYSTEM (CFFDRS) WEB PAGE.http://www.nofc.forestry.ca/fire.
CANADIAN FORESTSERVICE (CFS) WEB PAGE. http://www.nrcan.gc.ca/cfs.CHACZKO, Z. AND AHMAD , F. 2005. Wireless sensor network based system for fire endangered areas. In
Proc. of the Third International Conference on InformationTechnology and Applications (ICITA’05). Sydney,Australia.
CROSSBOWINC. WEB PAGE. http://www.xbow.com/.DE GROOT, W. J. 1998. Interpreting the Canadian Forest Fire Weather Index (FWI) System. InProc. of the
Fourth Central Region Fire Weather Committee Scientific andTechnical Seminar. Edmonton, Canada.DOOLIN, D. M. AND SITAR , N. 2005. Wireless sensors for wildfire monitoring. InProc. of SPIE Symposium
on Smart Structures and Materials. San Diego, CA, 477–484.FIRE WATCH WEB PAGE. http://www.fire-watch.de/.FLEMING , J.AND ROBERTSON, R. G. 2003. Fire Management Tech Tips: The Osborne Fire Finder. Tech. Rep.
0351 1311-SDTDC, USDA Forest Service. October.HARTUNG, C., HAN , R., SEIELSTAD, C., AND HOLBROOK, S. 2006. FireWxNet: A multi-tiered portable
wireless system for monitoring weather conditions in wildland fire environments. InProc. of InternationalConference on Mobile systems, Applications and Services (MobiSys’06). Uppsala, Sweden, 28–41.
HEFEEDA, M. AND BAGHERI, M. 2007. Randomized k-coverage algorithms for dense sensor networks. InProc. of IEEE INFOCOM 2007 Minisymposium. Anchorage, AK, 2376–2380.
KHRT, E., KNOLLENBERG, J., AND MERTENS, V. 2001. An automatic early warning system for forest fires.Annals of Burns and Fire Disasters 14,3.
L, Z., NADON, S.,AND CIHLAR , J. 2000. Satellite-based detection of Canadian boreal forest fires: developmentand application of the algorithm.International journal of remote sensing 21, 3057–3069.
LOHI, A., IKOLA , T., RAUSTE, Y., V., AND KELHA. 1999. Forest fire detection with satellites for fire control.In Proc. of IUFRO Conference on Remote Sensing and Forest Monitoring. Rogow, Poland.
MAINWARING , A., CULLER, D., POLASTRE, J., SZEWCZYK, R., AND ANDERSON, J. 2002. Wireless sensornetworks for habitat monitoring. InProc. of the First International Workshop on Wireless Sensor Networksand Applications (WSNA’02). Atlanta, Georgia, 88–97.
MODIS WEB PAGE. http://modis.gsfc.nasa.gov.NETWORK SYSTEMS LAB WEB PAGE. http://nsl.cs.sfu.ca/projects/wsn/.PEARCE, G. 2000. The science of fire behaviour and fire danger rating.Tech. rep., New Zealand Forest Research
Institute Ltd.SAN-M IGUEL-AYANZ , J., CARLSON, J., ALEXANDER, M., TOLHURST, K., MORGAN, G., AND SNEEUW-
JAGT, R. 2003. Chapter 2: Current methods to assess fire danger potential. InWildland Fire Danger Estimationand Mapping - The Role of Remote Sensing Data. World Scientific Publishing Co. Pte. Ltd.
SON, B., HER, Y., AND K IM , J. 2006. A design and implementation of forest-fires surveillance system based onwireless sensor networks for South Korea mountains.International Journal of Computer Science and NetworkSecurity (IJCSNS) 6,9, 124–130.
TAYLOR , J. R. 1997.Introduction to Error Analysis, second ed. University Science Books.
ACM Journal Name, Vol. V, No. N, Month 20YY.
24 · MOHAMED HEFEEDA
WAGNER, C. V. AND PICKETT, T. 1985. Equations and FORTRAN program for the Canadian Forest FireWeather Index System. Tech. Rep. 33, Canadian Forest Service, Ottawa, Ontario.
YANG, S., DAI , F., CARDEI, M., AND WU, J. 2006. On connected multiple point coverage in wireless sensornetworks.International Journal of Wireless Information Networks 13, 4 (May), 289–301.
YE, F., ZHONG, G., LU, S., AND ZHANG, L. 2003. PEAS: A robust energy conserving protocol for long-lived sensor networks. InProc. of the 23rd International Conference on Distributed Computing Systems(ICDCS’03). Providence, RI, 28–37.
YOUNIS, O., KRUNZ, M., AND RAMASUBRAMANIAN , S. 2006. Node clustering in wireless sensor networks:Recent developments and deployment challenges.IEEE Network 20,3, 20–25.
YU, L., WANG, N., AND MENG, X. 2005. Real-time forest fire detection with wireless sensor networks. InProc.of International Conference On Wireless Communications, Networking and Mobile Computing (WiMob’05).Montreal, Canada, 1214–1217.
ZHANG, H. AND HOU, J. 2005. Maintaining sensing coverage and connectivity inlarge sensor networks.AdHoc and Sensor Wireless Networks: An International Journal1, 1-2 (January), 89–123.


![Forest Fire Modeling and Early Detection using Wireless ...mhefeeda/Papers/tr2007_08.pdf · [MODIS Web Page ] was launched by NASA in 1999 on board of the Aqua satellite to capture](https://static.documents.pub/doc/80x56/5e81adf9c2b0b5463a026113/forest-fire-modeling-and-early-detection-using-wireless-mhefeedapaperstr200708pdf.jpg)
