23
Forest Governance for Multiple Benefits Ashwini Chhatre University of Illinois at Urbana-Champaign
| Date post: | 16-Apr-2017 |
| Category: |
Science |
| Upload: | forest-trees-sentinel-landscapes |
| View: | 143 times |
| Download: | 2 times |
Forest Governance for Multiple Benefits
Ashwini Chhatre University of Illinois at Urbana-Champaign
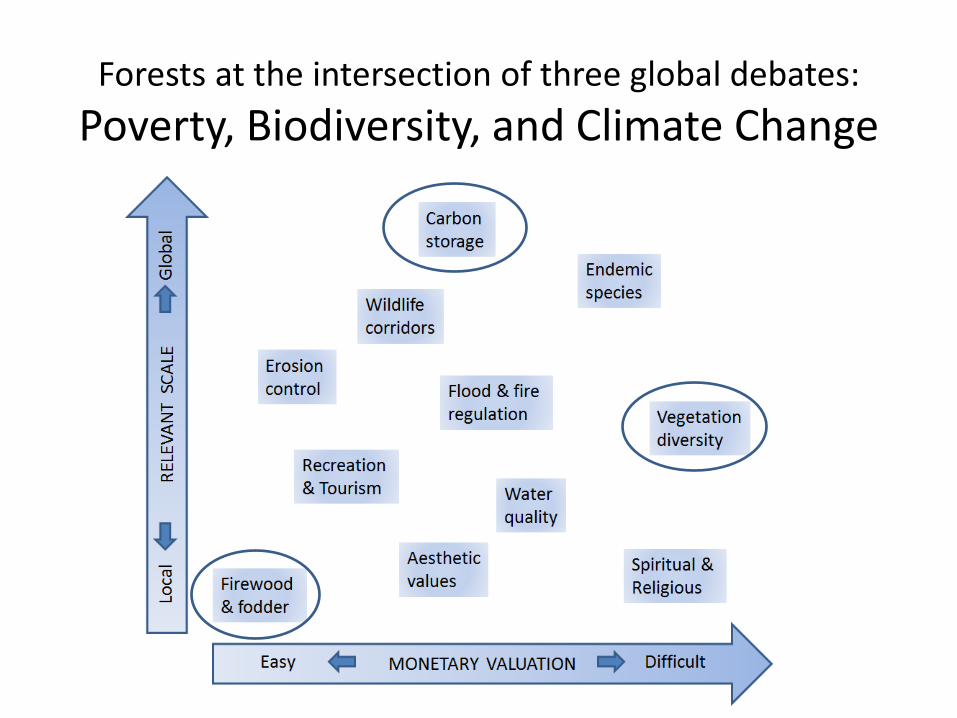
Forests at the intersection of three global debates: Poverty, Biodiversity, and Climate Change

Tree Species Richness, Woody Biomass, and Forest-Based Livelihoods
114 forests in 11 countries
Latin America – Mexico, Bolivia, Guatemala (22 cases)
Sub-Saharan Africa – Kenya, Tanzania, Uganda, Madagascar (32 cases)
South Asia – Bhutan, Nepal, India (60 cases)
-20
24
-20
24
Latin America Sub-Saharan Africa
South Asia Total
Tree Diversity Woody Biomass Local Livelihoods
Graphs by Region
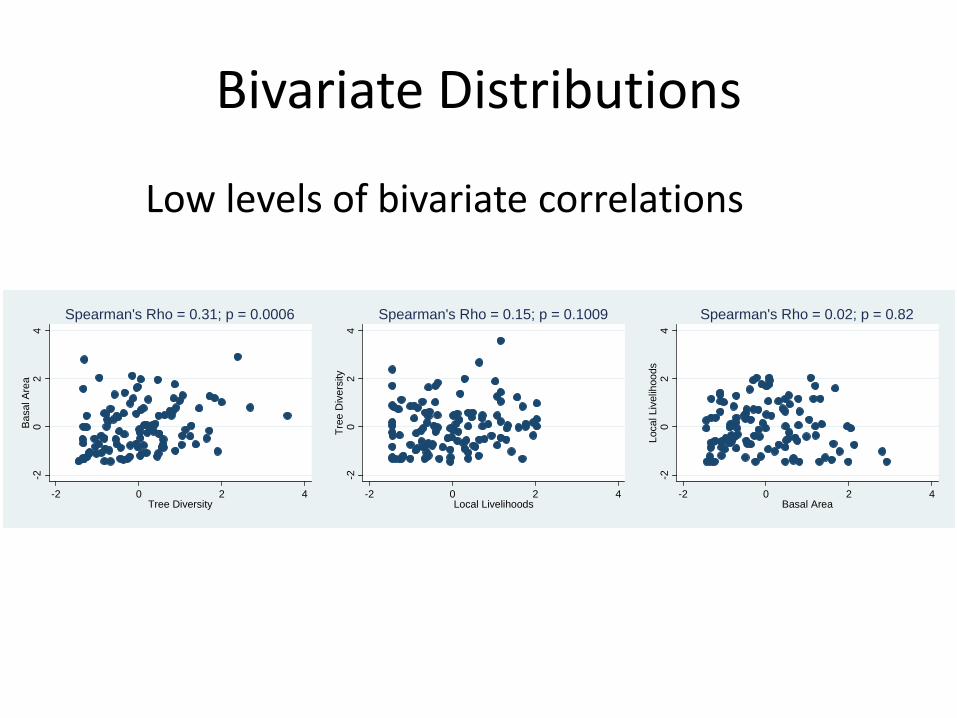
Bivariate Distributions
Low levels of bivariate correlations
-20
24
Bas
al A
rea
-2 0 2 4Tree Diversity
Spearman's Rho = 0.31; p = 0.0006
-20
24
Tree
Div
ersi
ty
-2 0 2 4Local Livelihoods
Spearman's Rho = 0.15; p = 0.1009
-20
24
Loca
l Liv
elih
oods
-2 0 2 4Basal Area
Spearman's Rho = 0.02; p = 0.82
010
2030
40D
issi
mila
rity
Mea
sure
(L2;
Euc
lidia
n)
G1n=11
G2n=3
G3n=4
G4n=6
G5n=7
G6n=8
G7n=5
G8n=6
G9n=10
G10n=10
G11n=1
G12n=4
G13n=14
G14n=7
G15n=18
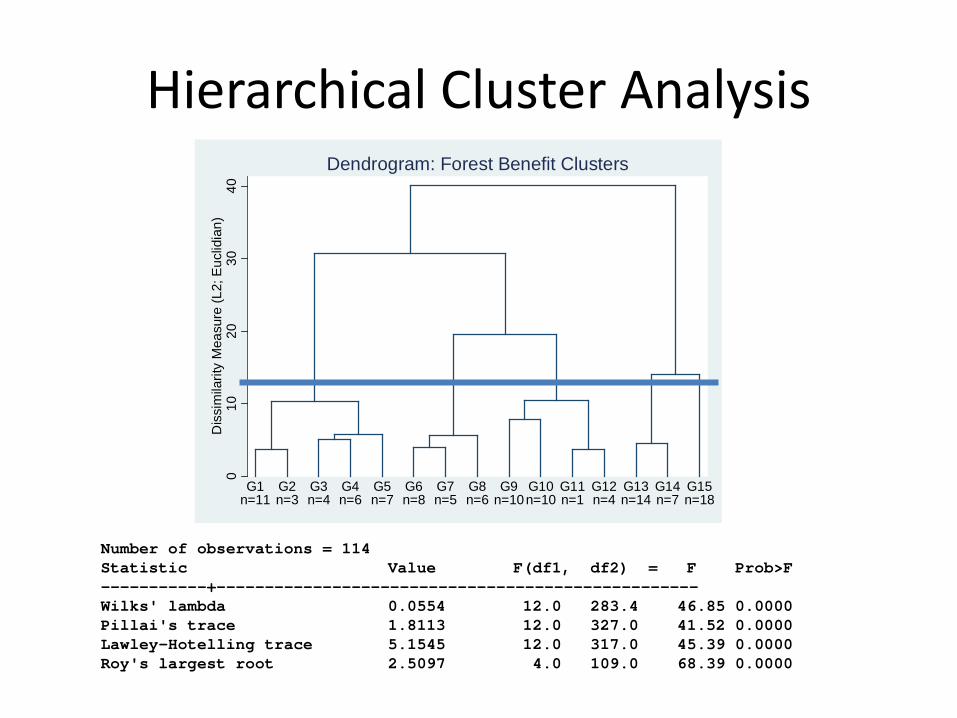
Dendrogram: Forest Benefit Clusters
Number of observations = 114 Statistic Value F(df1, df2) = F Prob>F -----------+-------------------------------------------------- Wilks' lambda 0.0554 12.0 283.4 46.85 0.0000 Pillai's trace 1.8113 12.0 327.0 41.52 0.0000 Lawley-Hotelling trace 5.1545 12.0 317.0 45.39 0.0000 Roy's largest root 2.5097 4.0 109.0 68.39 0.0000
Hierarchical Cluster Analysis
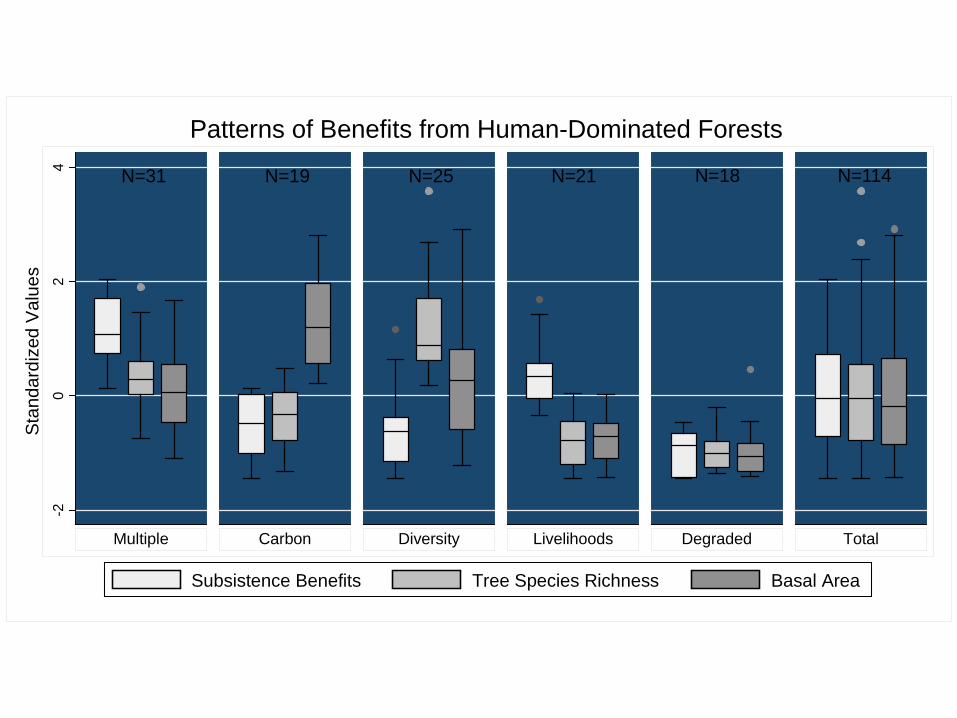
-20
24
Multiple Carbon Diversity Livelihoods Degraded Total
Subsistence Benefits Tree Species Richness Basal Area
Stan
dard
ized
Val
ues
Patterns of Benefits from Human-Dominated Forests
N=31 N=19 N=25 N=21 N=18 N=114
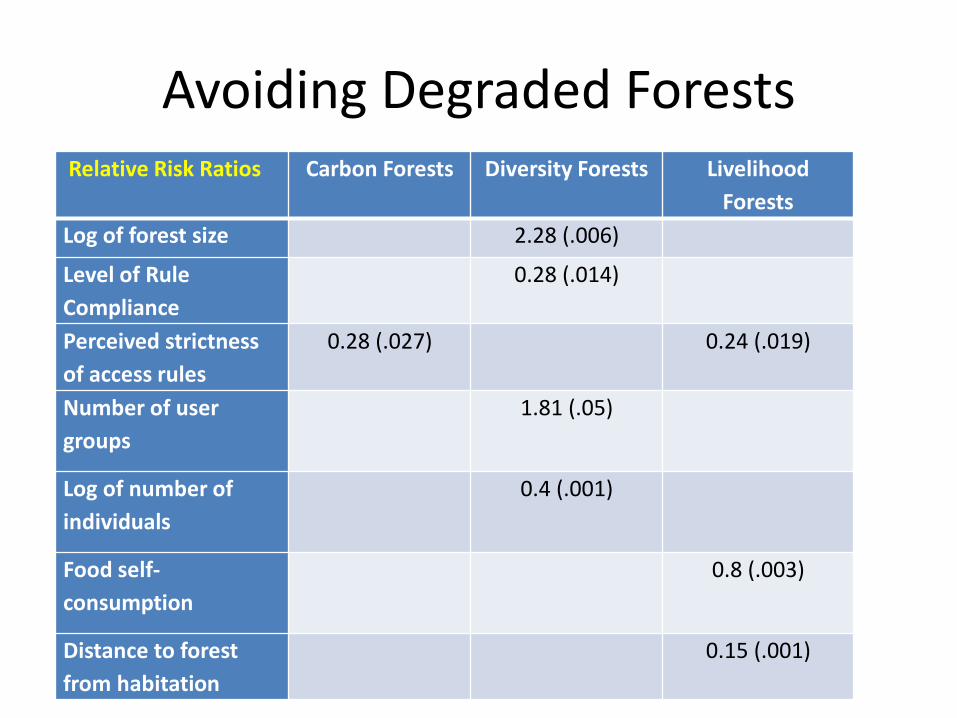
Avoiding Degraded Forests Relative Risk Ratios Carbon Forests Diversity Forests Livelihood
Forests Log of forest size 2.28 (.006)
Level of Rule Compliance
0.28 (.014)
Perceived strictness of access rules
0.28 (.027) 0.24 (.019)
Number of user groups
1.81 (.05)
Log of number of individuals
0.4 (.001)
Food self-consumption
0.8 (.003)
Distance to forest from habitation
0.15 (.001)
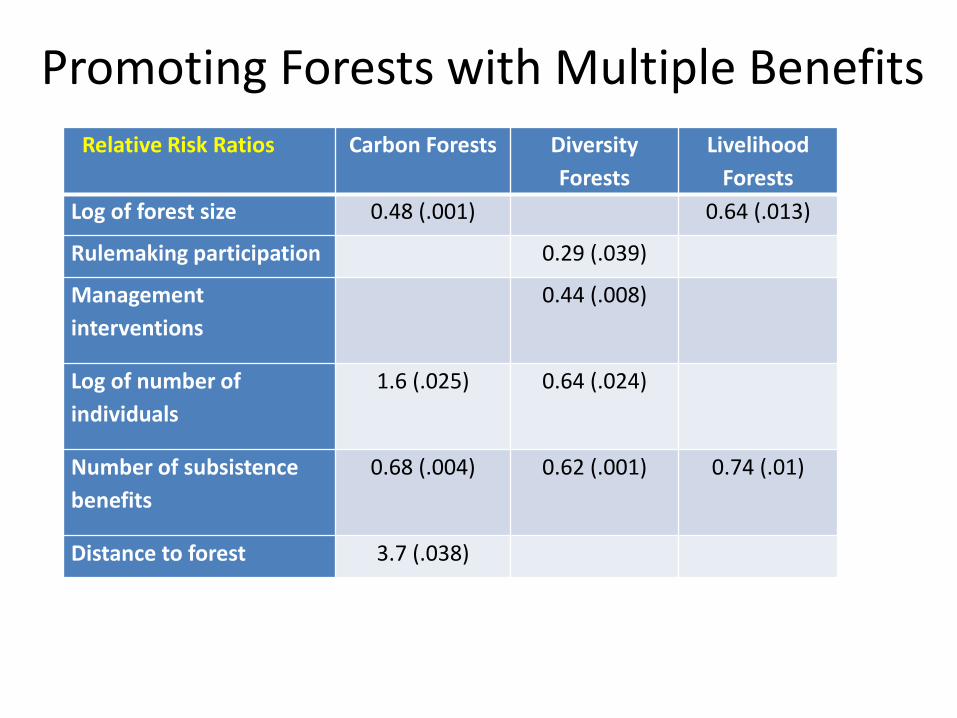
Promoting Forests with Multiple Benefits Relative Risk Ratios
Carbon Forests Diversity Forests
Livelihood Forests
Log of forest size 0.48 (.001) 0.64 (.013)
Rulemaking participation 0.29 (.039)
Management interventions
0.44 (.008)
Log of number of individuals
1.6 (.025) 0.64 (.024)
Number of subsistence benefits
0.68 (.004) 0.62 (.001) 0.74 (.01)
Distance to forest 3.7 (.038)
Future Directions
Multiple benefits produced simultaneously Patterns: Clusters of benefits in multiple dimensions Drivers: Process behind the patterns of clustering Designing interventions intelligently
Thank you for your attention!
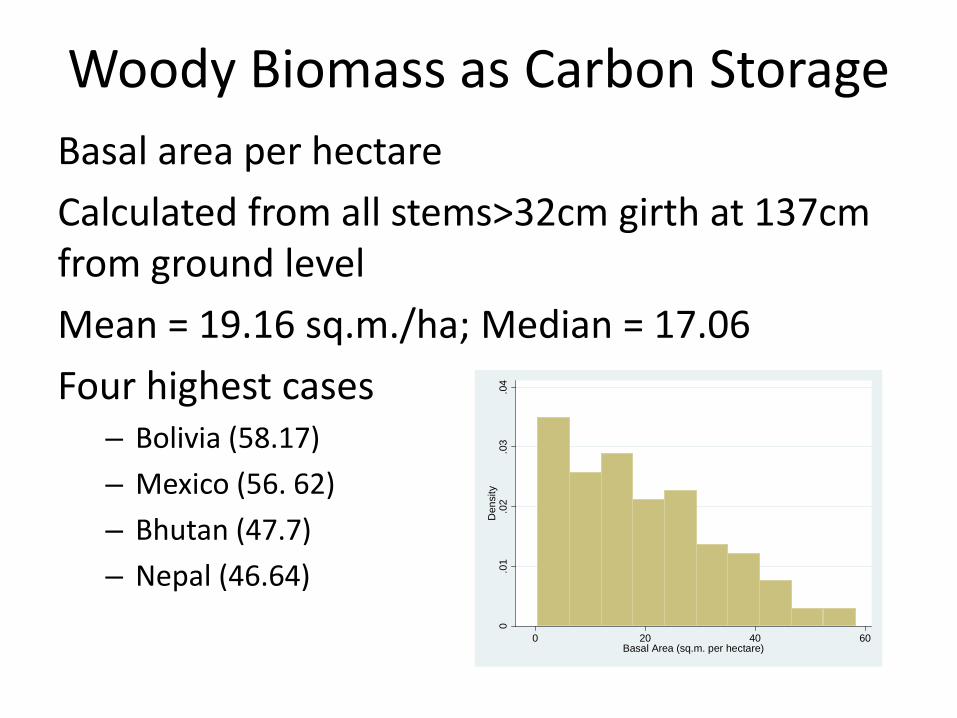
Woody Biomass as Carbon Storage Basal area per hectare Calculated from all stems>32cm girth at 137cm from ground level Mean = 19.16 sq.m./ha; Median = 17.06 Four highest cases
– Bolivia (58.17) – Mexico (56. 62) – Bhutan (47.7) – Nepal (46.64)
0.0
1.0
2.0
3.0
4D
ensi
ty
0 20 40 60Basal Area (sq.m. per hectare)
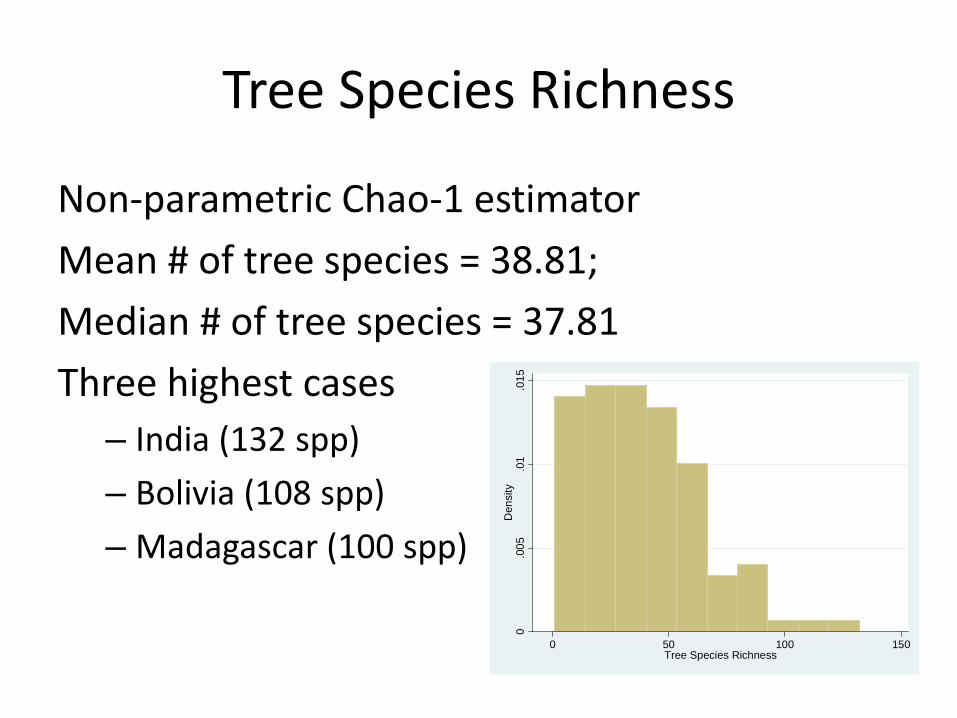
Tree Species Richness
Non-parametric Chao-1 estimator Mean # of tree species = 38.81; Median # of tree species = 37.81 Three highest cases
– India (132 spp) – Bolivia (108 spp) – Madagascar (100 spp)
0.0
05.0
1.0
15D
ensi
ty
0 50 100 150Tree Species Richness
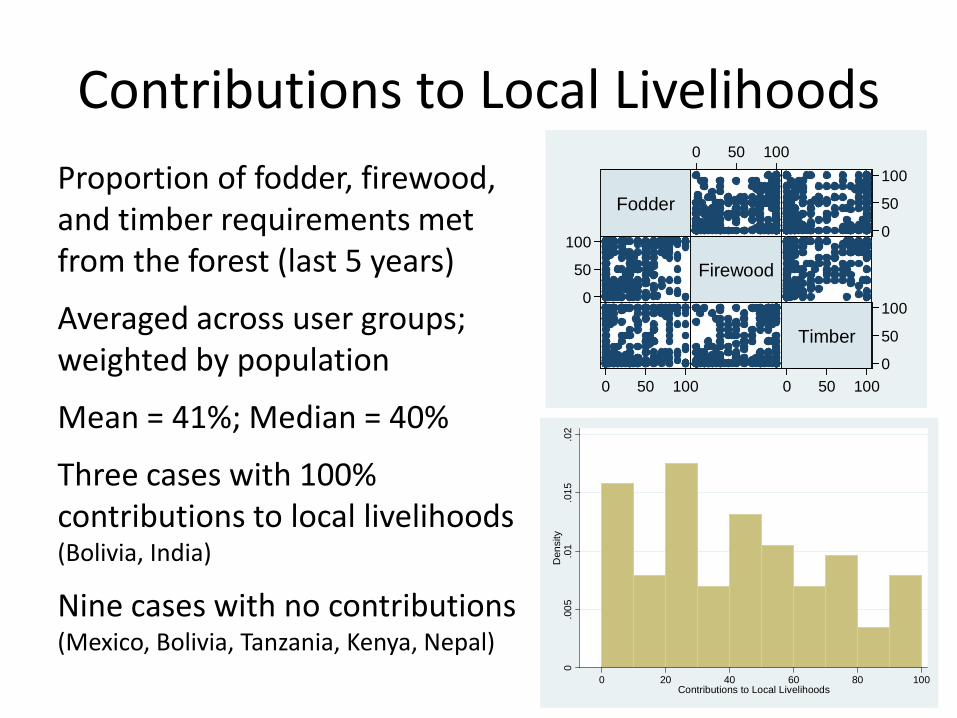
Contributions to Local Livelihoods Proportion of fodder, firewood, and timber requirements met from the forest (last 5 years)
Averaged across user groups; weighted by population
Mean = 41%; Median = 40%
Three cases with 100% contributions to local livelihoods (Bolivia, India)
Nine cases with no contributions (Mexico, Bolivia, Tanzania, Kenya, Nepal)
0.0
05.0
1.0
15.0
2D
ensi
ty
0 20 40 60 80 100Contributions to Local Livelihoods
Fodder
Firewood
Timber
0
50
100
0 50 100
0
50
100
0 50 100
0
50
100
0 50 100

Association with Known Drivers
-.11-.07-.07
-.01.26
-.02
.07.13.15
.06
.06.09
-.12.08
.16
.2.23
.43
.12.11
-.09
.02
.02-.23
.25-.11-.08
.41-.04
.13
-.15.22
.28
-.120
-.41
-.02.19
.11
.21-.21
-.06
-.11-.07-.06
.05.01
.06
-.4 -.2 0 .2 .4 -.4 -.2 0 .2 .4 -.4 -.2 0 .2 .4 -.4 -.2 0 .2 .4
Collective Action Frequency Commercial Value Distance to Admin Center Distance to Market
Food Self-consumption Forest Patch Size Grazing Intensity Level of Compliance
Management Interventions No. of Benefits No. of User Groups No. of Users
Rulemaking Participation State Ownership Strictness of Rules Years of Settlement
Tree Diversity Woody Biomass Local Livelihoods
Graphs by Factors Associated with Forest Outcomes
Spearman's Rank Correlation
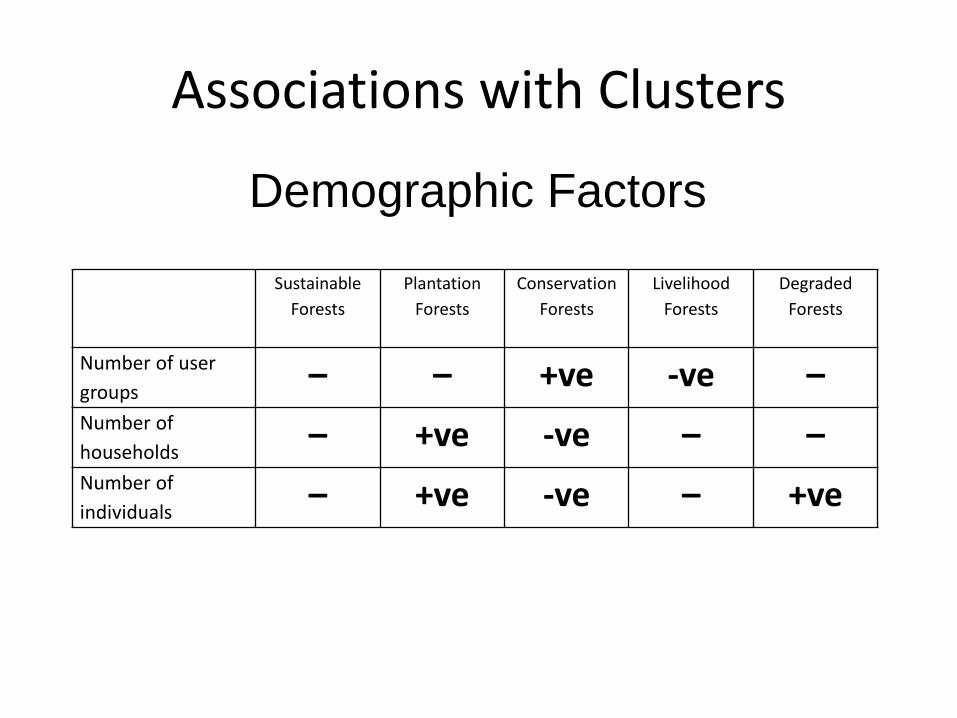
Associations with Clusters
Demographic Factors
Sustainable Forests
Plantation Forests
Conservation Forests
Livelihood Forests
Degraded Forests
Number of user groups – – +ve -ve – Number of households – +ve -ve – – Number of individuals – +ve -ve – +ve
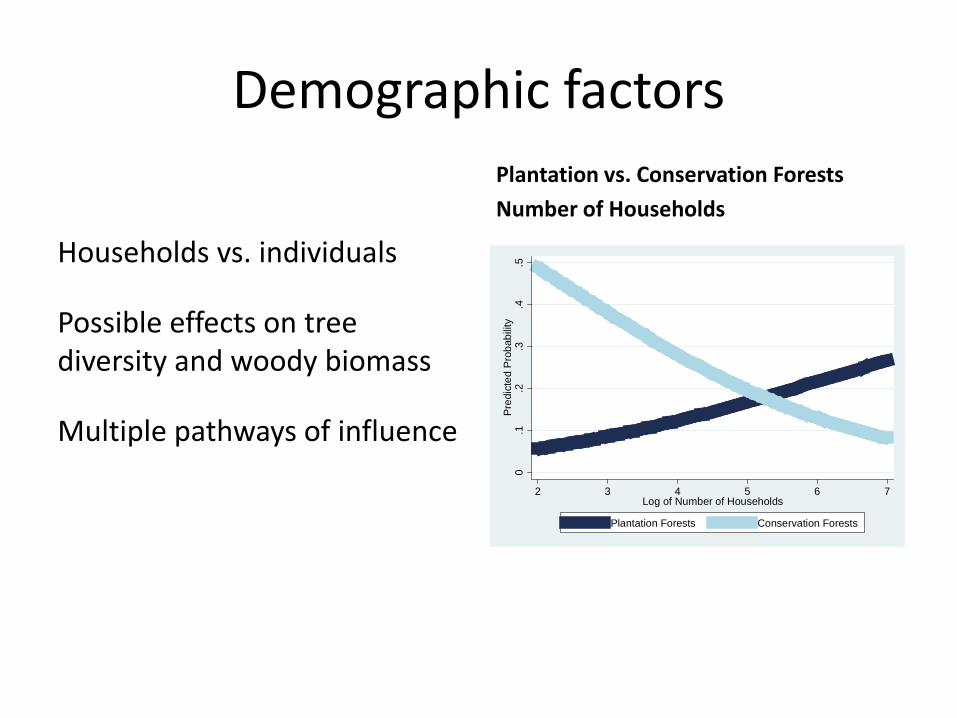
Demographic factors
Households vs. individuals
Possible effects on tree diversity and woody biomass
Multiple pathways of influence
Plantation vs. Conservation Forests Number of Households
0.1
.2.3
.4.5
Pre
dict
ed P
roba
bilit
y2 3 4 5 6 7
Log of Number of Households
Plantation Forests Conservation Forests
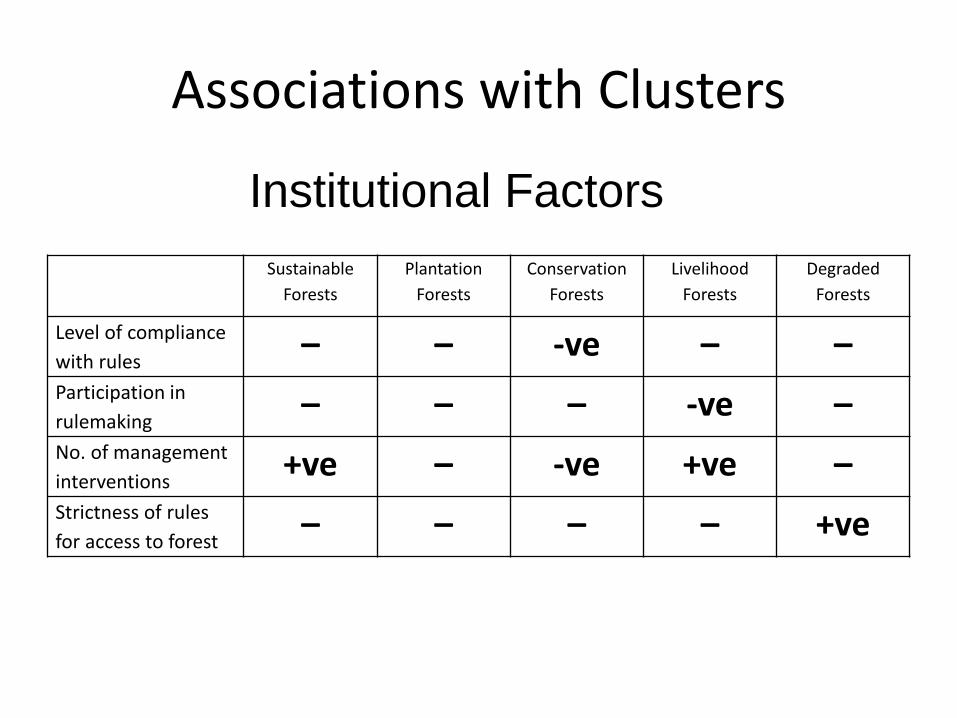
Sustainable Forests
Plantation Forests
Conservation Forests
Livelihood Forests
Degraded Forests
Level of compliance with rules – – -ve – – Participation in rulemaking – – – -ve – No. of management interventions +ve – -ve +ve – Strictness of rules for access to forest – – – – +ve
Associations with Clusters
Institutional Factors
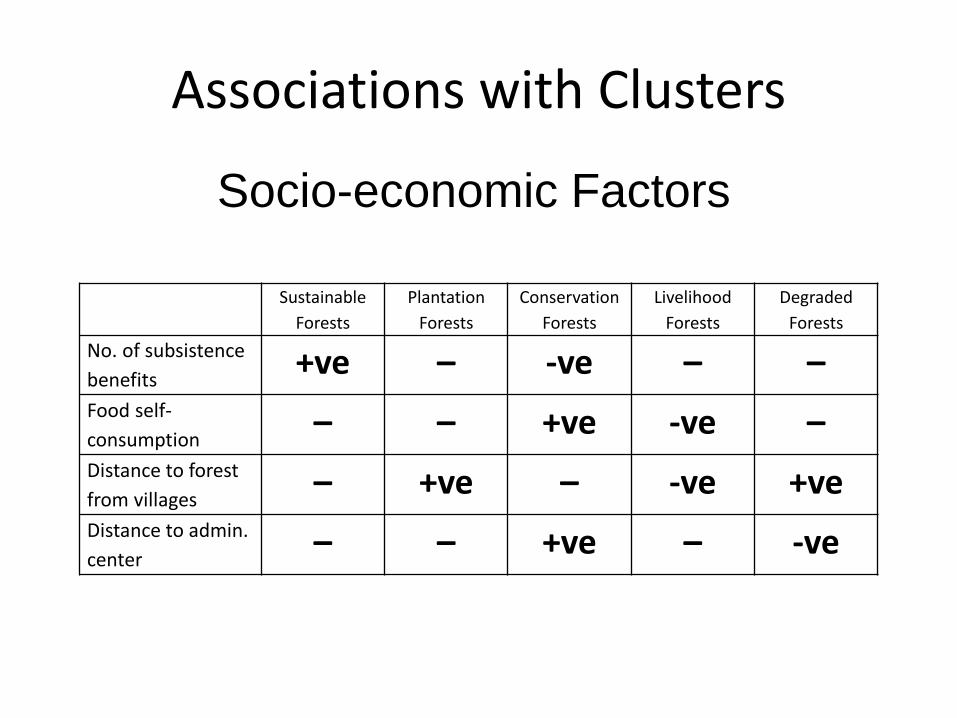
Associations with Clusters
Socio-economic Factors
Sustainable Forests
Plantation Forests
Conservation Forests
Livelihood Forests
Degraded Forests
No. of subsistence benefits +ve – -ve – – Food self-consumption – – +ve -ve – Distance to forest from villages – +ve – -ve +ve Distance to admin. center – – +ve – -ve
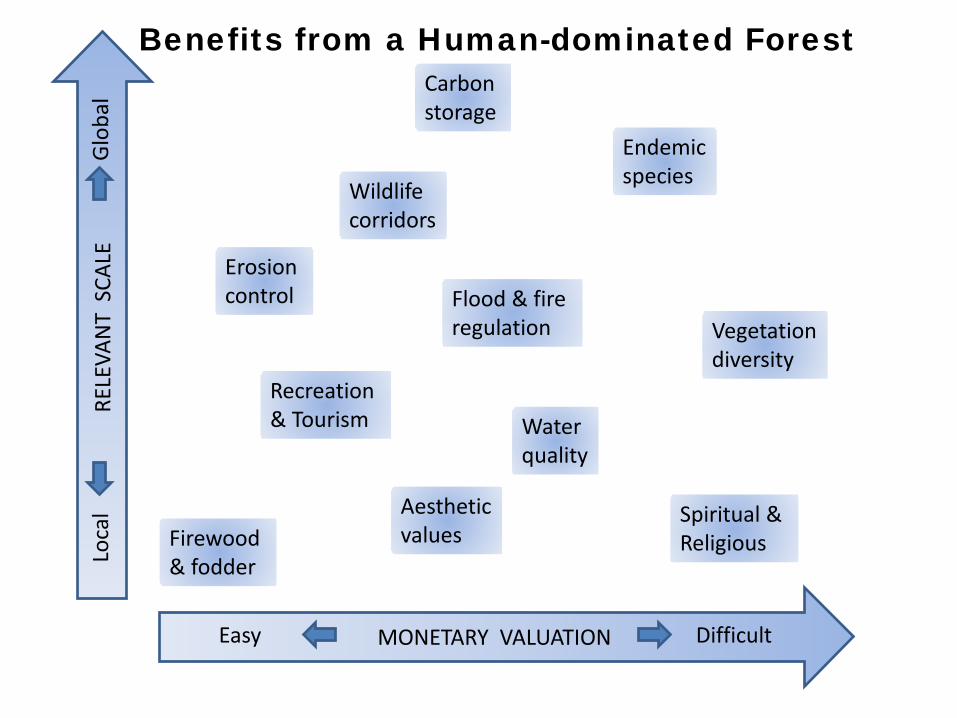
MONETARY VALUATION
RELE
VAN
T S
CALE
G
loba
l Lo
cal
Easy Difficult
Firewood & fodder
Vegetation diversity
Carbon storage
Spiritual & Religious
Water quality
Endemic species
Recreation & Tourism
Flood & fire regulation
Erosion control
Wildlife corridors
Aesthetic values
Benefits from a Human-dominated Forest
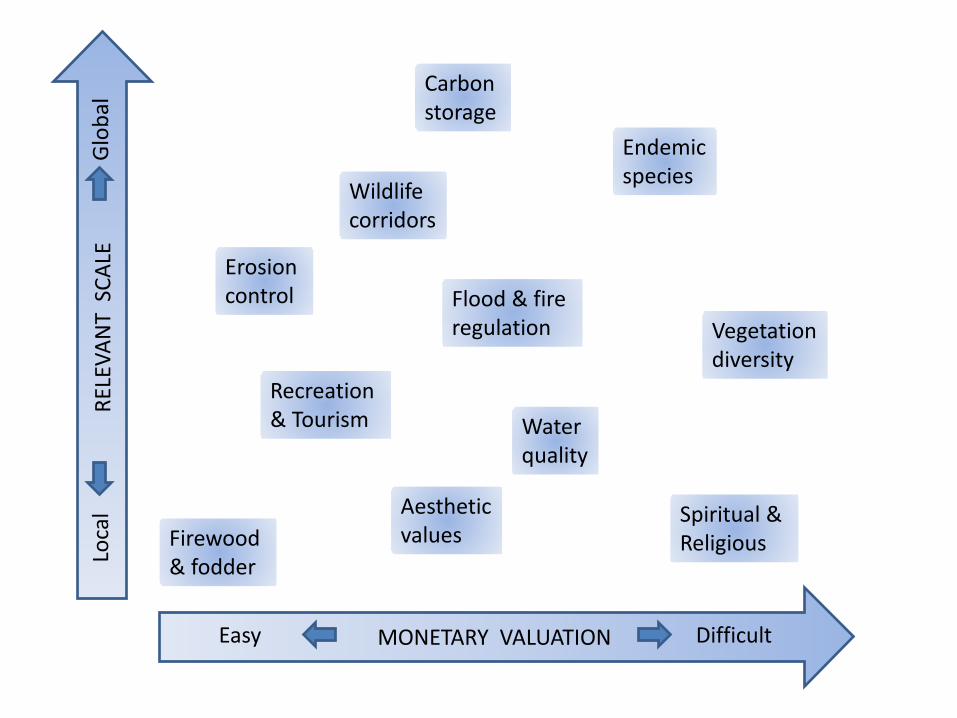
MONETARY VALUATION
RELE
VAN
T S
CALE
G
loba
l Lo
cal
Easy Difficult
Firewood & fodder
Vegetation diversity
Carbon storage
Spiritual & Religious
Water quality
Endemic species
Recreation & Tourism
Flood & fire regulation
Erosion control
Wildlife corridors
Aesthetic values
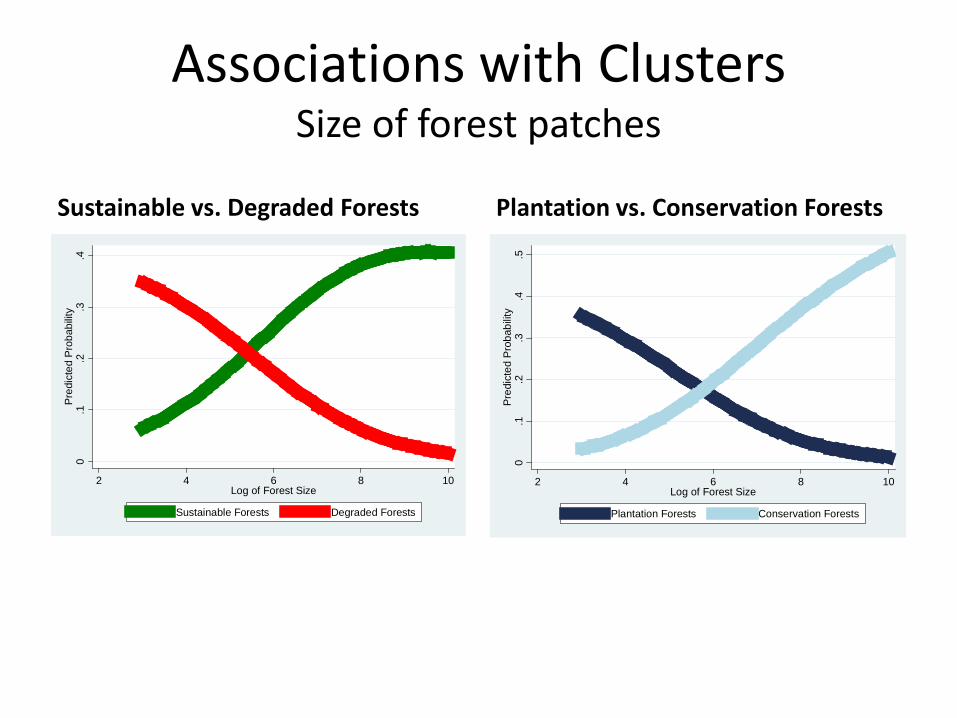
Associations with Clusters Size of forest patches
Sustainable vs. Degraded Forests Plantation vs. Conservation Forests
0.1
.2.3
.4P
redi
cted
Pro
babi
lity
2 4 6 8 10Log of Forest Size
Sustainable Forests Degraded Forests0
.1.2
.3.4
.5P
redi
cted
Pro
babi
lity
2 4 6 8 10Log of Forest Size
Plantation Forests Conservation Forests
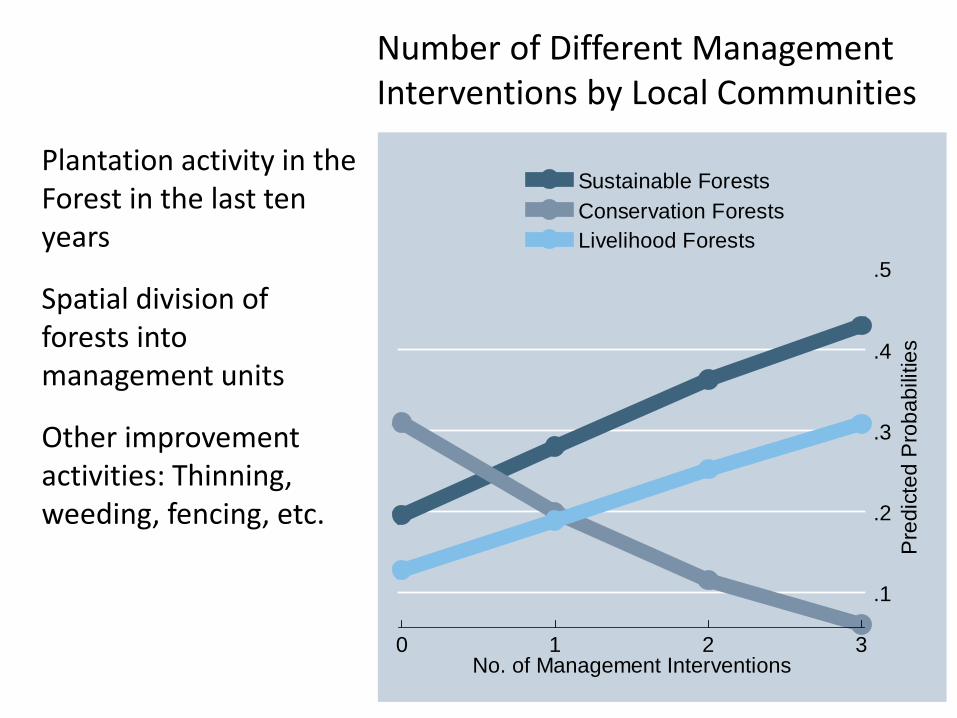
Plantation activity in the Forest in the last ten years
Spatial division of forests into management units
Other improvement activities: Thinning, weeding, fencing, etc.
Number of Different Management Interventions by Local Communities
.1
.2
.3
.4
.5
Pre
dict
ed P
roba
bilit
ies
0 1 2 3No. of Management Interventions
Sustainable ForestsConservation ForestsLivelihood Forests
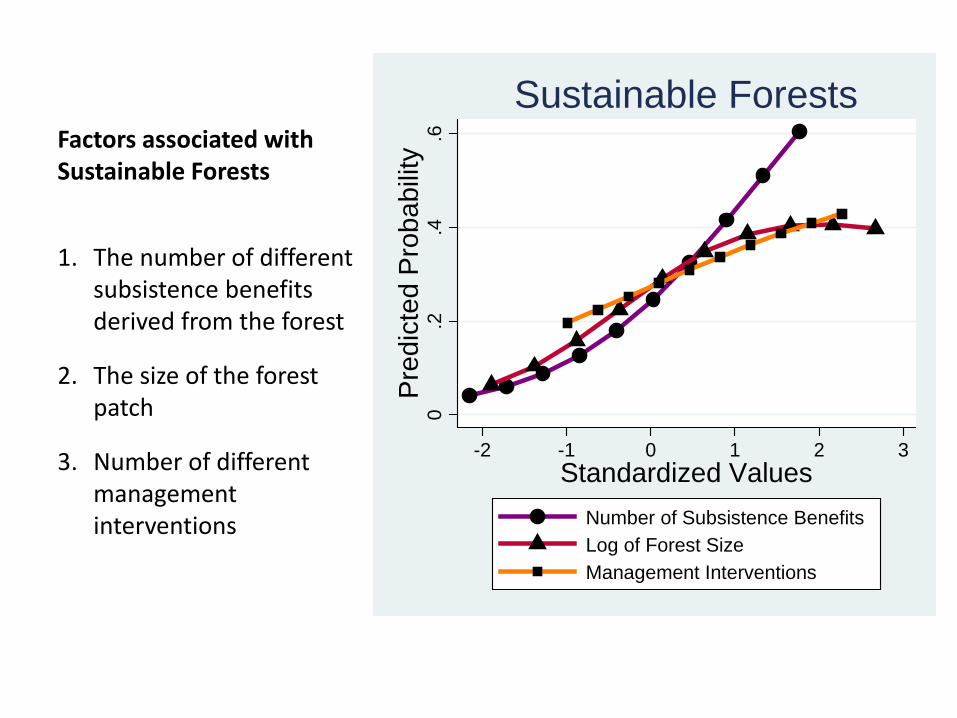
Factors associated with Sustainable Forests
1. The number of different subsistence benefits derived from the forest
2. The size of the forest patch
3. Number of different management interventions
0.2
.4.6
Pre
dict
ed P
roba
bilit
y-2 -1 0 1 2 3
Standardized ValuesNumber of Subsistence BenefitsLog of Forest SizeManagement Interventions
Sustainable Forests


