This chapter is an overview of forest management and silviculture practices, and lessons learned, on the Marcell Experimental Forest (MEF). The forests there are a mosaic of natural regeneration and conifer plantations. Verry (1969) described forest-plant communities in detail for the study watersheds (S1 through S6) on the MEF. The remaining area is described in standard USDA Forest Service classification of cover types.
Interest in forest management was a driving factor for early studies on the MEF: long-term aspen regrowth on the calibrated watersheds, conversion of
CONTENTS
Introduction ......................................................................................................... 371History of Forest Management Prior to Establishment of the MEF ............ 372Red Pine Plantations on the MEF ..................................................................... 372Thinning the MEF Red Pine Plantations ......................................................... 373Wetland Strip-Cut Harvest to Promote Black Spruce Regeneration ........... 374Forest Harvest and Aspen Suppression with Cattle Grazing to Convert Upland Aspen to Softwoods.............................................................................. 376Development of Allometric Relationships ...................................................... 378North American Long-Term Soil Productivity Study Site ............................380Demonstration of Cut-to-Length Technology ................................................. 382Growth and Yield of Aspen Regeneration after Clearcutting Watershed S4 ........................................................................................................383Aspen Self-Thinning Tested ...............................................................................384New Directions in Forest Management ........................................................... 391Biomass and Nutrient Additions to Soils from Thinnings, Logging Slash, and Fertilizer ............................................................................................ 395References ............................................................................................................. 398
372 Peatland Biogeochemistry and Watershed Hydrology
aspen to conifers, and the effect of harvest techniques on forest soil proper-ties and forest productivity. Grigal and Brooks (1997) reviewed how forest management can affect undrained peatlands in North America. This chapter further explores the links of traditional forest management to current inter-est in forest habitat typing and intensive management whereby carbon can be sequestered in soils by leaving thinnings and tops or removed as biofuels.
History of Forest Management Prior to Establishment of the MEF
The forests of northern Minnesota were logged during the late 1800s and early 1900s, especially for white pine. Forests in the MEF were cut between 1865 and 1897 by either the Lorene Day family, Mike McAlpine, and Kirkpatrick, or the Itasca Lumber Company. Perhaps all three were involved as reentry into previous cutovers to remove overlooked pockets of timber was common (Hawkinson and Jewett 2003). Forest fires fueled by logging slash often dev-astated whatever reproduction remained. Much of the area in and around the MEF burned in widespread fires of 1917. By the late 1920s, much of these cutovers were “too poor to support agriculture and too grim to attract tour-ists” (Sommer 2008).
On October 29, 1929, the stock market crash forced many older school children to forgo their education and work at odd jobs to help support their family. This dire situation led in part to the creation of the Civilian Conservation Corps (CCC) on April 5, 1933, whereby young men aged 18–25 years old could enroll in CCC camps across the United States. There, they worked on land and water conservation projects for $1 per day, room, board, and healthcare. Nearly, 150 camps were located in Minnesota alone (Sommer 2008).
Red Pine Plantations on the MEF
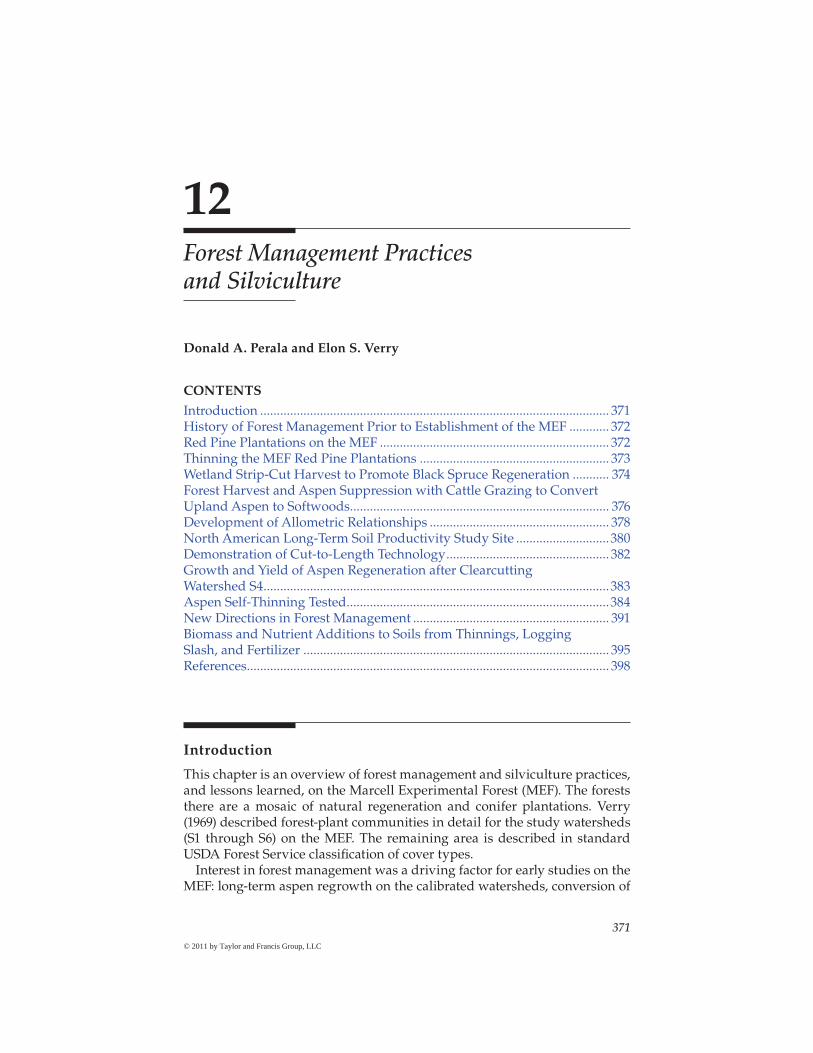
The CCC crews planted red pine to form several adjacent stands compris-ing about 52 ha within the South Unit of the MEF (Figure 12.1). These crews almost certainly were stationed at Day Lake (Camp F-34), about 13 km south-west of the MEF. Company 1724 served there from 1934 until 1941 when the camp closed.
By 1958, 2 years before the MEF was established, these CCC plantations were 17–24 years old; some were overly dense and in need of thinning. Concurrently, thinning schedules to maximize yields for given product objectives were being developed by Buckman (1962). The first application of these schedules on the MEF occurred in the summer of 1958 (Roger Bay, emeritus, USDA Forest Service, 2009, personal communication) near Bog Lake. At that time, logging machines were not well matched for use in such dense young stands, and markets for small-diameter products were limited. However, advances within the timber industry and in mechanized harvesters propelled the intensive management of red pine to the elevated state we see today. Red pine is now commonly thinned at intervals of about 10 years (Figure 12.2) as recommended by Buckman (1962) and Buckman et al. (2006).
Meters1,000 1,005 2,0000 500250
FIGURE 12.1Red and jack pine stands (105 ha) on the South Unit of the MEF.
374 Peatland Biogeochemistry and Watershed Hydrology
Wetland Strip-Cut Harvest to Promote Black Spruce Regeneration
Guidelines for regenerating black spruce (Picea mariana (Mill.) B.S.P.) are well established for extensive peatlands (Johnston 1977), but application on small, isolated, lake-filled peatlands had not been documented. Verry and Elling (1978) studied natural seeding in two stands on an 8.1 ha, nonbrushy black spruce bog (S1) on the MEF beginning in 1968 (Table 12.1).
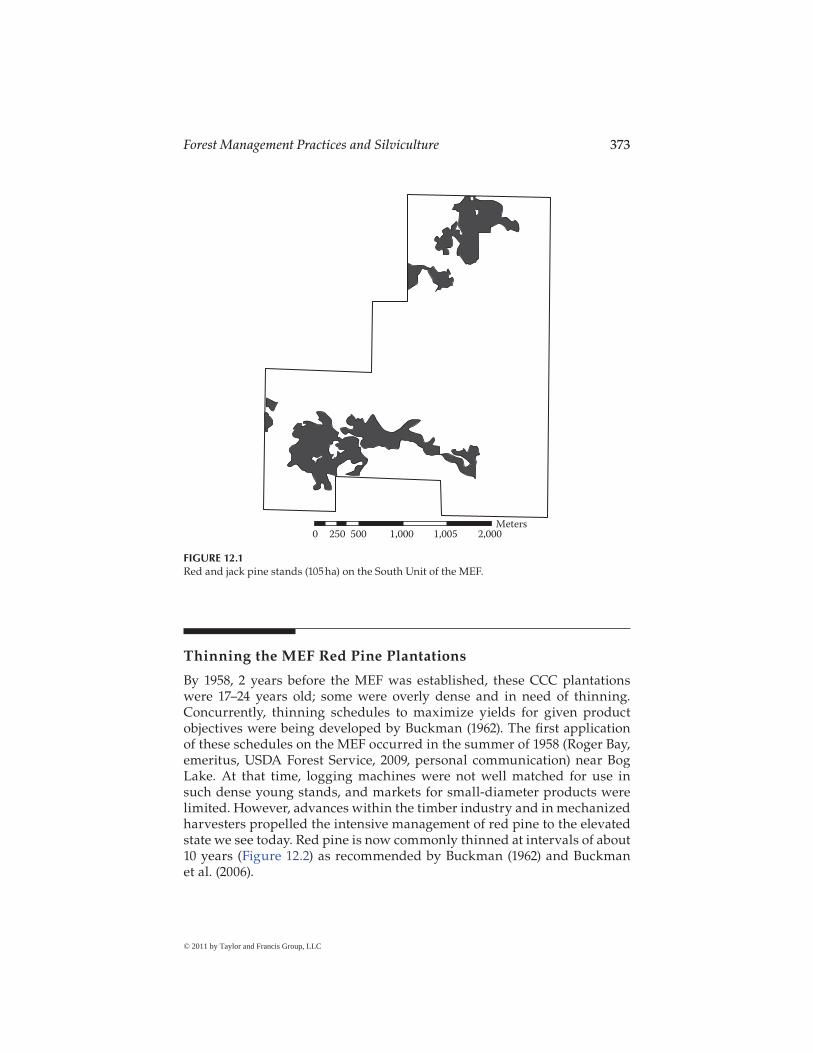
In January and February 1969, these stands were partially clearcut in 30.5 m-wide strips (east-west oriented), leaving 45.7 m-wide uncut strips (Figure 12.3). Almost all slash was piled in windrows. Thus, microenviron-mental gradients across these strips could be studied in relation to disper-sal of spruce seed, seedling establishment, and general vegetation recovery following harvest.
FIGURE 12.2Thinned (three times) CCC red pine plantation on the South Unit. Established circa 1935.
TABLE 12.1
Black Spruce Stand Characteristics on the S1 Peatland Prior (1968) to Strip Cutting
Stand Characteristic Older Stand Younger Stand
Age in 1968 73 62SI at 50 years (m) 3.7 2.7Basal area (m2 ha−1) 8.26 6.43Volume (m3 ha−1) 439 313
In the summer of 1971, Brown (1973) surveyed vegetation on the S1 strip cuts in the same study area. He found that ericaceous shrubs decreased in coverage but increased in frequency after clearcutting, while sedge increased five times in dry weight production in clearcuts compared to sedges beneath the uncut canopies.
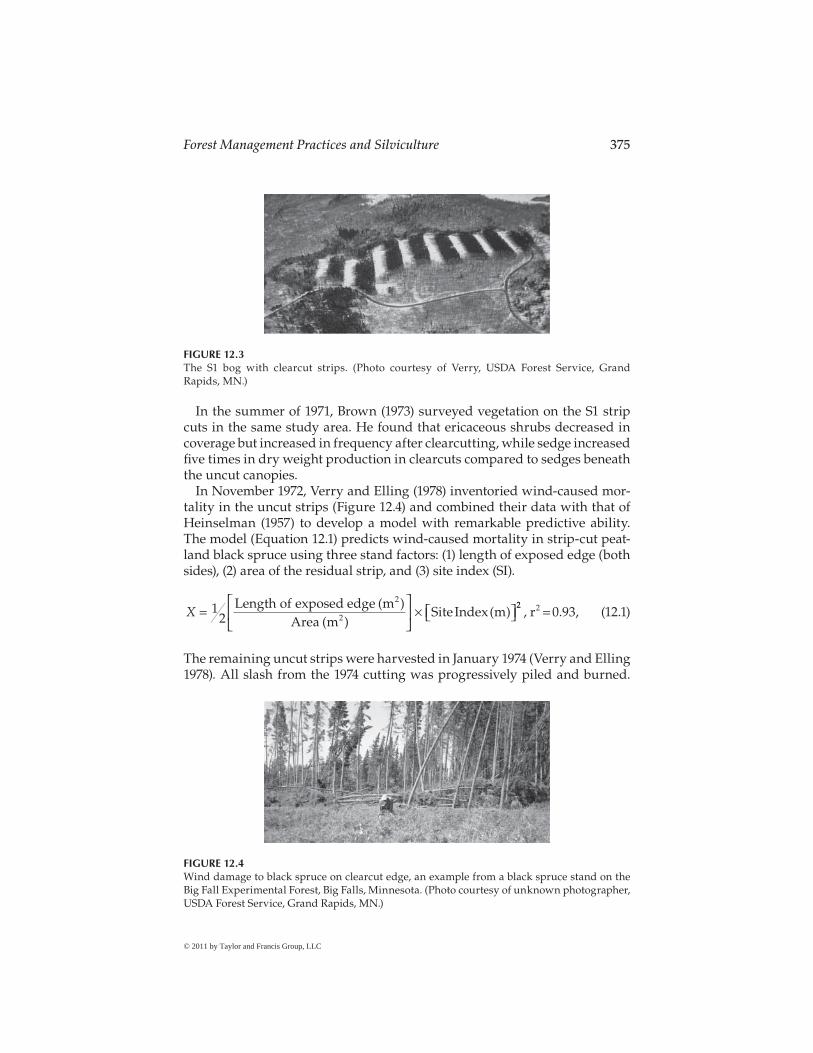
In November 1972, Verry and Elling (1978) inventoried wind-caused mor-tality in the uncut strips (Figure 12.4) and combined their data with that of Heinselman (1957) to develop a model with remarkable predictive ability. The model (Equation 12.1) predicts wind-caused mortality in strip-cut peat-land black spruce using three stand factors: (1) length of exposed edge (both sides), (2) area of the residual strip, and (3) site index (SI).
X =⎡
⎣⎢
⎤
⎦⎥ × ⎡⎣ ⎤⎦1
2
2
2
Length of exposed edge mArea m
Site Index m( )
( )( )
22, r 0.93,2 = (12.1)
The remaining uncut strips were harvested in January 1974 (Verry and Elling 1978). All slash from the 1974 cutting was progressively piled and burned.
FIGURE 12.4Wind damage to black spruce on clearcut edge, an example from a black spruce stand on the Big Fall Experimental Forest, Big Falls, Minnesota. (Photo courtesy of unknown photographer, USDA Forest Service, Grand Rapids, MN.)
FIGURE 12.3The S1 bog with clearcut strips. (Photo courtesy of Verry, USDA Forest Service, Grand Rapids, MN.)
376 Peatland Biogeochemistry and Watershed Hydrology
In November 1975 (seven growing seasons after harvesting), spruce repro-duction was sampled in the first 30.5 m-wide clearcut strips (they had been sampled in August 1971, after three growing seasons). In November 1976 (three growing seasons after harvest), reproduction in the 45.7 m-wide strips was sampled. Natural seeding in the first strip cuts was adequate (4400 ha−1; 80% milacre stocking) but inadequate (1600 ha−1 with 40% stocking) in the 45.7 m-wide strips when few mature trees with seed remained. Progressive strip cuts every other year were recommended.
Forest Harvest and Aspen Suppression with Cattle Grazing to Convert Upland Aspen to Softwoods
In the western United States, cattle and sheep commonly graze aspen for-ests. If grazing is monitored judicially, there is little harm to ecosystems, but excessive grazing can be harmful, particularly within regenerating aspen stands (Debyle 1985). In the early twentieth century in northern Minnesota, homesteading farmers commonly grazed the forestlands. This practice waned gradually in favor of clearing forestland for pasture.
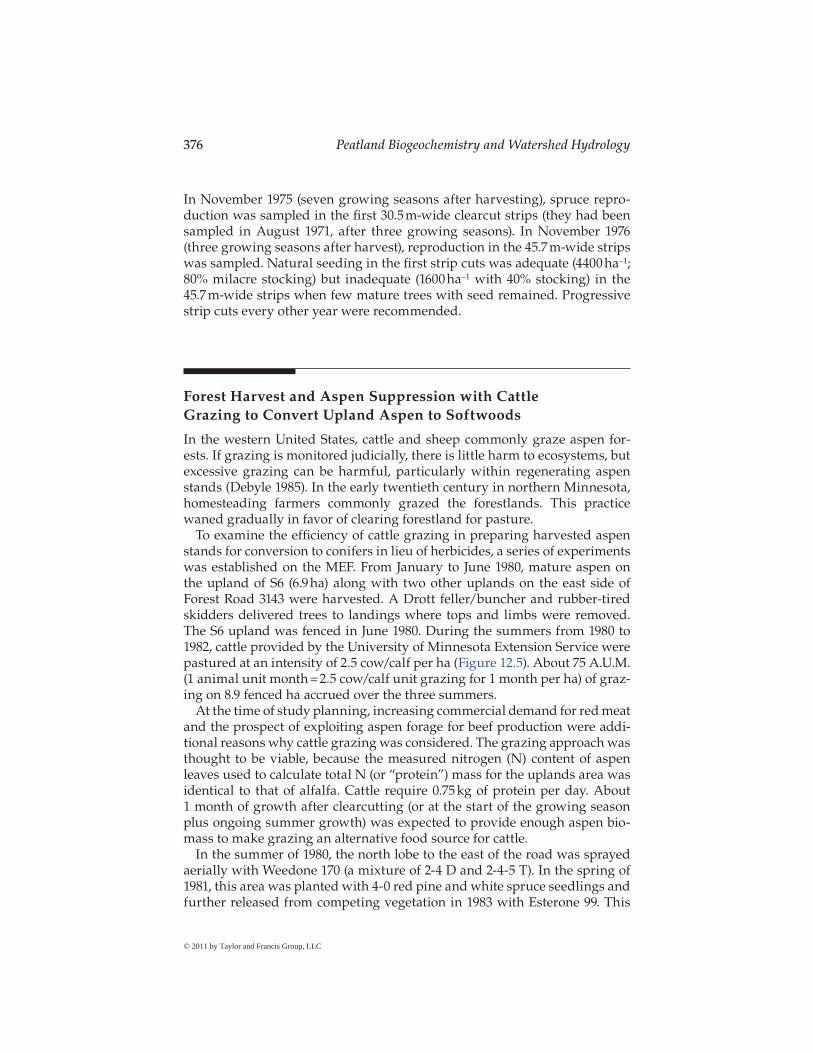
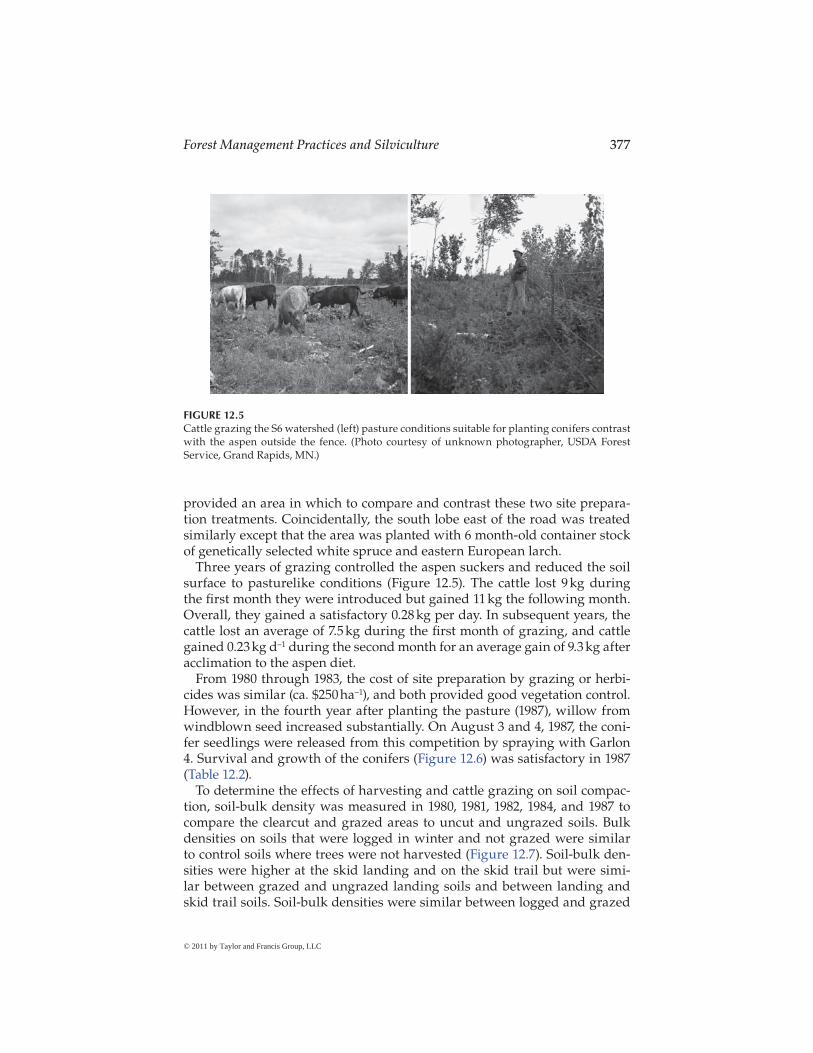
To examine the efficiency of cattle grazing in preparing harvested aspen stands for conversion to conifers in lieu of herbicides, a series of experiments was established on the MEF. From January to June 1980, mature aspen on the upland of S6 (6.9 ha) along with two other uplands on the east side of Forest Road 3143 were harvested. A Drott feller/buncher and rubber-tired skidders delivered trees to landings where tops and limbs were removed. The S6 upland was fenced in June 1980. During the summers from 1980 to 1982, cattle provided by the University of Minnesota Extension Service were pastured at an intensity of 2.5 cow/calf per ha (Figure 12.5). About 75 A.U.M. (1 animal unit month = 2.5 cow/calf unit grazing for 1 month per ha) of graz-ing on 8.9 fenced ha accrued over the three summers.
At the time of study planning, increasing commercial demand for red meat and the prospect of exploiting aspen forage for beef production were addi-tional reasons why cattle grazing was considered. The grazing approach was thought to be viable, because the measured nitrogen (N) content of aspen leaves used to calculate total N (or “protein”) mass for the uplands area was identical to that of alfalfa. Cattle require 0.75 kg of protein per day. About 1 month of growth after clearcutting (or at the start of the growing season plus ongoing summer growth) was expected to provide enough aspen bio-mass to make grazing an alternative food source for cattle.
In the summer of 1980, the north lobe to the east of the road was sprayed aerially with Weedone 170 (a mixture of 2-4 D and 2-4-5 T). In the spring of 1981, this area was planted with 4-0 red pine and white spruce seedlings and further released from competing vegetation in 1983 with Esterone 99. This
provided an area in which to compare and contrast these two site prepara-tion treatments. Coincidentally, the south lobe east of the road was treated similarly except that the area was planted with 6 month-old container stock of genetically selected white spruce and eastern European larch.
Three years of grazing controlled the aspen suckers and reduced the soil surface to pasturelike conditions (Figure 12.5). The cattle lost 9 kg during the first month they were introduced but gained 11 kg the following month. Overall, they gained a satisfactory 0.28 kg per day. In subsequent years, the cattle lost an average of 7.5 kg during the first month of grazing, and cattle gained 0.23 kg d−1 during the second month for an average gain of 9.3 kg after acclimation to the aspen diet.
From 1980 through 1983, the cost of site preparation by grazing or herbi-cides was similar (ca. $250 ha−1), and both provided good vegetation control. However, in the fourth year after planting the pasture (1987), willow from windblown seed increased substantially. On August 3 and 4, 1987, the coni-fer seedlings were released from this competition by spraying with Garlon 4. Survival and growth of the conifers (Figure 12.6) was satisfactory in 1987 (Table 12.2).
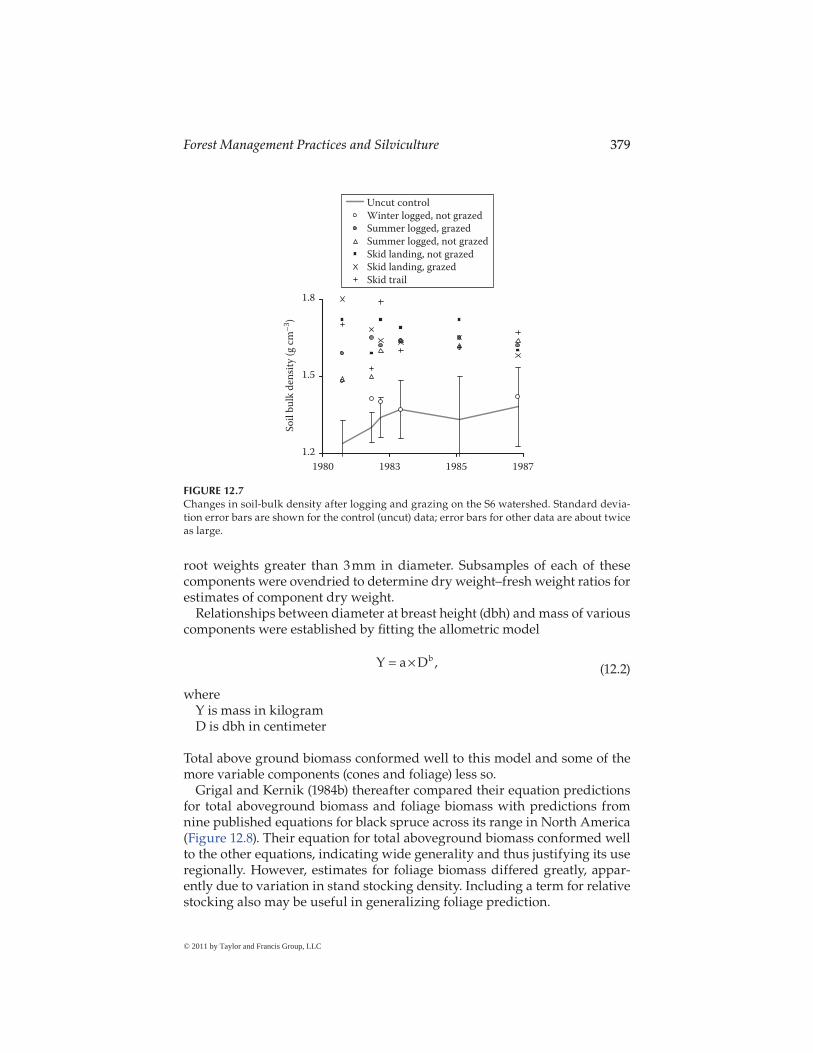
To determine the effects of harvesting and cattle grazing on soil compac-tion, soil-bulk density was measured in 1980, 1981, 1982, 1984, and 1987 to compare the clearcut and grazed areas to uncut and ungrazed soils. Bulk densities on soils that were logged in winter and not grazed were similar to control soils where trees were not harvested (Figure 12.7). Soil-bulk den-sities were higher at the skid landing and on the skid trail but were simi-lar between grazed and ungrazed landing soils and between landing and skid trail soils. Soil-bulk densities were similar between logged and grazed
FIGURE 12.5Cattle grazing the S6 watershed (left) pasture conditions suitable for planting conifers contrast with the aspen outside the fence. (Photo courtesy of unknown photographer, USDA Forest Service, Grand Rapids, MN.)
378 Peatland Biogeochemistry and Watershed Hydrology
areas and logged but not grazed areas. Error bars (±1 standard deviation) are shown for the uncut control area (Figure 12.7). The error bars for the other areas are as large or larger (up to 270%), indicating that the overall effects of harvesting and cattle grazing on soil-bulk density were heterogeneous and generally minimal.
Development of Allometric Relationships
In December 1981, Grigal and Kernik (1984a) felled a sample of 24 black spruce trees representing the range of diameters in perched bog sites on the MEF. Using usual subsampling techniques, the trees were further sepa-rated into bole bark, bole wood, cones, foliage, and live and dead branches. Nine trees were sampled in the summer of 1981 to determine stump and
TABLE 12.2
Survival and Growth of the Conifers on and Adjacent to the S6 Watershed
Treatment Species Age (Year) Height (cm) Survival (%)
Grazed Red pine 7 48 55White spruce 7 48 81
Herbicide Red pine 10 56 88White spruce 10 104 78
Genetic trial; herbicide Super white spruce 6 145 85European larch 6 203 68
FIGURE 12.6European larch and “super” white spruce in the herbicided conversion area. (Photo courtesy of unknown photographer, USDA Forest Service, Grand Rapids, MN.)
root weights greater than 3 mm in diameter. Subsamples of each of these components were ovendried to determine dry weight–fresh weight ratios for estimates of component dry weight.
Relationships between diameter at breast height (dbh) and mass of various components were established by fitting the allometric model
Y a Db= × , (12.2)
whereY is mass in kilogramD is dbh in centimeter
Total above ground biomass conformed well to this model and some of the more variable components (cones and foliage) less so.
Grigal and Kernik (1984b) thereafter compared their equation predictions for total aboveground biomass and foliage biomass with predictions from nine published equations for black spruce across its range in North America (Figure 12.8). Their equation for total aboveground biomass conformed well to the other equations, indicating wide generality and thus justifying its use regionally. However, estimates for foliage biomass differed greatly, appar-ently due to variation in stand stocking density. Including a term for relative stocking also may be useful in generalizing foliage prediction.
1.2
1.5
1.8
1980 1983 1985 1987
So
il b
ulk
den
sity
(g
cm–
3)
Uncut control
Winter logged, not grazedSummer logged, grazed
Summer logged, not grazed
Skid landing, not grazedSkid landing, grazed
Skid trail
FIGURE 12.7Changes in soil-bulk density after logging and grazing on the S6 watershed. Standard devia-tion error bars are shown for the control (uncut) data; error bars for other data are about twice as large.
380 Peatland Biogeochemistry and Watershed Hydrology
North American Long-Term Soil Productivity Study Site
Modern logging machinery is heavy and can compact forest soils. Removal or displacement of soil organic matter by machine operation is also com-mon. This could result in increased soil-bulk density with less pore space for root aeration and water absorption. Slower tree growth and increased water runoff follow.
Soil scientists had been studying this problem sporadically until the late 1980s when a coordinated effort was undertaken. In 1989, the Forest Service initiated the North American Long Term Productivity (LTSP) study to pro-vide “…a network of installations… across a broad range of forest ecosys-tems throughout the United States and Canada” (USDA Forest Service 2001).
In 1990, an LTSP study site was established on the MEF by David H. Alban (Alban et al. 1994). This site is one of four established by Alban in the Lake States; all are part an LTSP study to better understand how soils are affected by forest harvesting. Indeed, the MEF served as a pilot site for establishing a common protocol in designing LTSP experiments across North America.
1000
1000
1
100
10
1 10 100 1
10
10
1.0
100
100
Mas
s (k
g)
DBH (cm) DBH (cm)
Total above ground biomassFoliage
biomass
1
2
5,6
8
3
7
4
78
4
10
3
10
9
5
6
(b)(a)
FIGURE 12.8Comparison of 10 equations for total aboveground biomass (a) or foliage (b) equations. (From Grigal, D.F. and Kernik, L.K., Can. J. For. Res., 14(3), 468, 1984a; Grigal, D.F. and Kernik, L.K., Biomass estimation for black spruce (Picea mariana (Mill.) B.S.P.) trees, Research note 290, University of Minnesota Department of Forestry, St. Paul, MN, 1984b.)
The MEF study was installed in a well-stocked, 70 year-old quaking and bigtooth aspen stand with a SI of 20.7 m at age 50. Aspen accounted for 88% of the aboveground biomass versus 1% for shrubs and herbs; the soil is Cutaway loamy sand. Eight 30 by 40 m treatment plots were established. In February 1991, six plots were total tree harvested (TTH) with a feller–buncher weigh-ing 13,000 kg. In April 1991, the forest floor was hand-raked to simulate forest floor removal (FFR) from three of the plots (Figure 12.9). In May, four of these plots were compacted (CPT) by four or five passes of an 8100 kg rubber-tired pneumatic roller pulled by a D-6 Caterpillar tractor (Figure 12.9). Of the har-vested plots, two were compacted (TTH + CPT), two were compacted with the forest floor removed (TTH + CPT + FFR), one had only the forest floor removed (TTH + FFR), and one had neither treatment (TTH).
Alban et al. (1994) reported that 2 year-old aspen coppice regeneration was the most vigorous with TTH alone. Total biomass, including shrubs and herbs, showed the same trend. Number of species in the ground flora increased considerably 2 years after TTH, especially after TTH + CPT + FFR. The rate of rainfall infiltration was greatly reduced by TTH + CPT after 2 years.
Stone and Elioff (1998) reported that TTH + CPT significantly increased bulk density and strength of the surface 30 cm of soil and that neither has recovered 5 years after treatment. Total vegetation biomass on TTH plots was more than two times greater than for any other treatment.
Page-Dumrose et al. (2006) reported how soil-bulk density and strength change as indicators of soil compaction 1 and 5 years after timber harvest-ing and other site treatment on 12 LTSP sites, including MEF. Severe soil- compaction treatments produced nearly root-limiting bulk densities for all soil textures studied and were noticeable to a depth of 30 cm. After 5 years, bulk density recovered in coarse soils down to 10 cm but less so from 10 to 30 cm. Fine-textured soils recovered little.
FIGURE 12.9Forest-floor litter layer raked off the LTSP plots by hand (left); compacting the soil using a “wobble wheel.” (Photo courtesy of unknown photographer, USDA Forest Service, Grand Rapids, MN.)
382 Peatland Biogeochemistry and Watershed Hydrology
Powers et al. (2005) summarized the impacts of organic-matter removal and soil compaction over the first 10 years for the 26 oldest installations in the North American network of LTSP sites, including the MEF. Total removal of surface organic matter led to declines in concentrations of soil carbon to a depth of 20 cm and less nutrient availability, due primarily to the loss of the forest floor. Stored soil carbon seemed unchanged but is confounded by changed soil-bulk density and decomposition of roots left by harvest-ing. Biomass harvesting did not influence forest growth. Effects of soil com-paction depended on initial bulk density. Soils with densities greater than 1.4 Mg m−3 resisted compaction. Density recovery was slow, particularly in frigid temperature regimes. Forest productivity declined on compacted clay soils, increased on compacted sands, and generally was unaffected where an understory was absent.
After 15 years, soil strength and soil-bulk density still were considerably greater in compacted plots at the MEF, and plots with compaction or with the forest floor removed averaged 31% less total biomass (unpublished data). This result indicates that recovery to pretreatment condition will not occur in the near future.
Demonstration of Cut-to-Length Technology
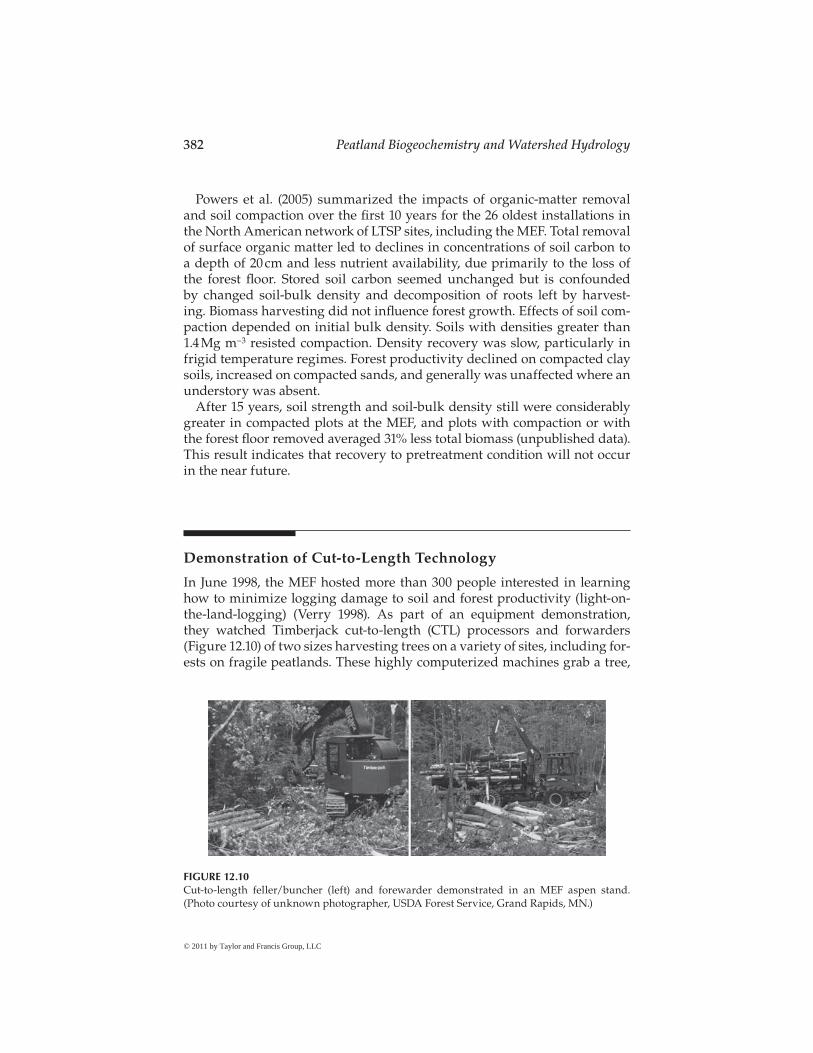
In June 1998, the MEF hosted more than 300 people interested in learning how to minimize logging damage to soil and forest productivity (light-on-the-land-logging) (Verry 1998). As part of an equipment demonstration, they watched Timberjack cut-to-length (CTL) processors and forwarders (Figure 12.10) of two sizes harvesting trees on a variety of sites, including for-ests on fragile peatlands. These highly computerized machines grab a tree,
FIGURE 12.10Cut-to-length feller/buncher (left) and forewarder demonstrated in an MEF aspen stand. (Photo courtesy of unknown photographer, USDA Forest Service, Grand Rapids, MN.)
sever it at the stump, and automatically shear off the branches and cut the bole into optimum programmed lengths for transport by a forwarder. One of the questions about these machines was whether they would leave the soils with optimum pore space to maintain forest productivity. Soils, water table, and stand condition were evaluated before and after logging aspen, jack pine, and black spruce for five stand conditions, and under several sil-vicultural systems. The demonstration was mostly successful in leaving the harvested sites in good condition. The single failure was an increase of 10%–20% in organic soil-bulk density and organic soil rutting caused by a loaded forwarder on peat soil; even a half load caused the forwarder to rut deeply on the third pass. As a result, CTL harvesting on undrained and/or unfrozen organic soils is not recommended. On the upland sites, machine travel on slash seemed to protect mineral soils better than travel with no slash. This can be accomplished by logging from the back to the front of the sale.
Growth and Yield of Aspen Regeneration after Clearcutting Watershed S4
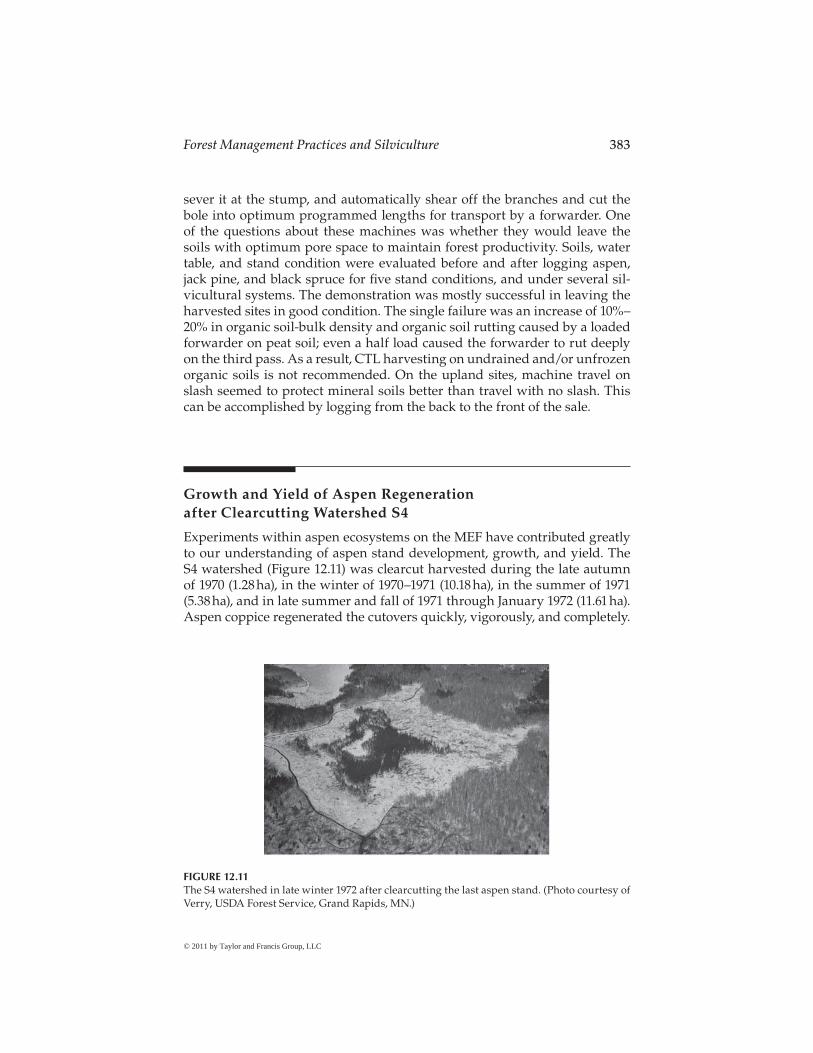
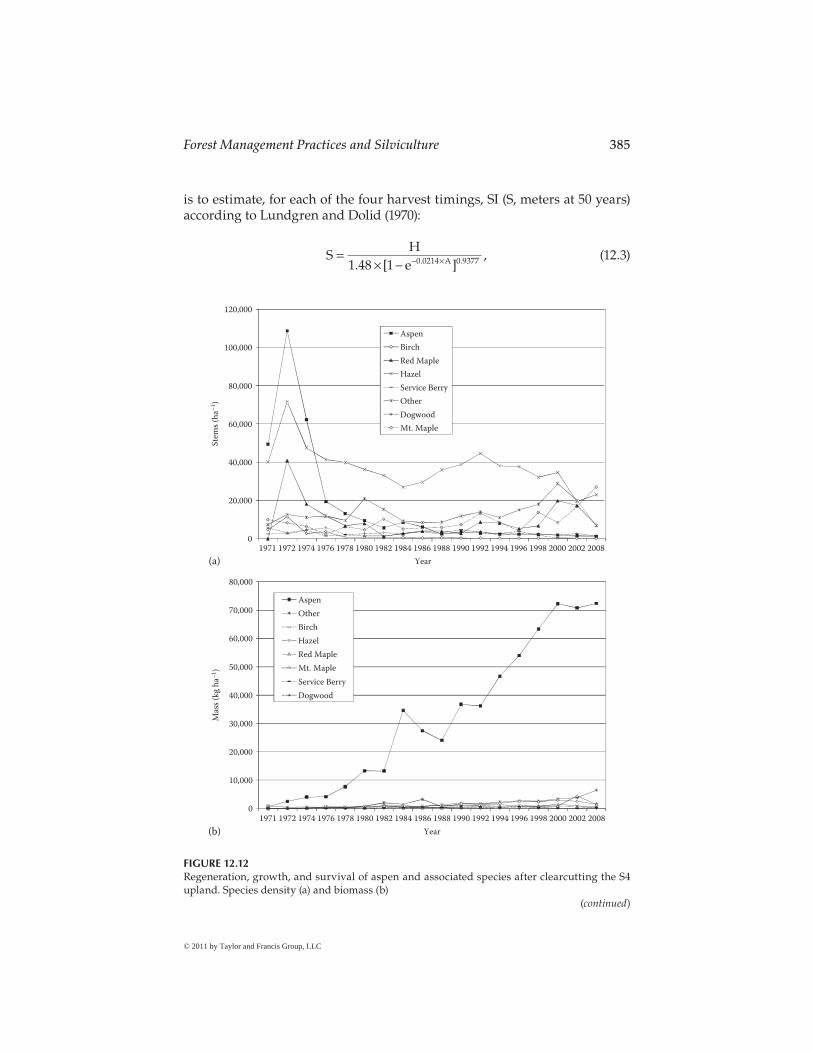
Experiments within aspen ecosystems on the MEF have contributed greatly to our understanding of aspen stand development, growth, and yield. The S4 watershed (Figure 12.11) was clearcut harvested during the late autumn of 1970 (1.28 ha), in the winter of 1970–1971 (10.18 ha), in the summer of 1971 (5.38 ha), and in late summer and fall of 1971 through January 1972 (11.61 ha). Aspen coppice regenerated the cutovers quickly, vigorously, and completely.
FIGURE 12.11The S4 watershed in late winter 1972 after clearcutting the last aspen stand. (Photo courtesy of Verry, USDA Forest Service, Grand Rapids, MN.)
384 Peatland Biogeochemistry and Watershed Hydrology
A hailstorm in the summer of 1973 caused great damage and mortality that, in turn, initiated new coppice that was mostly ephemeral.
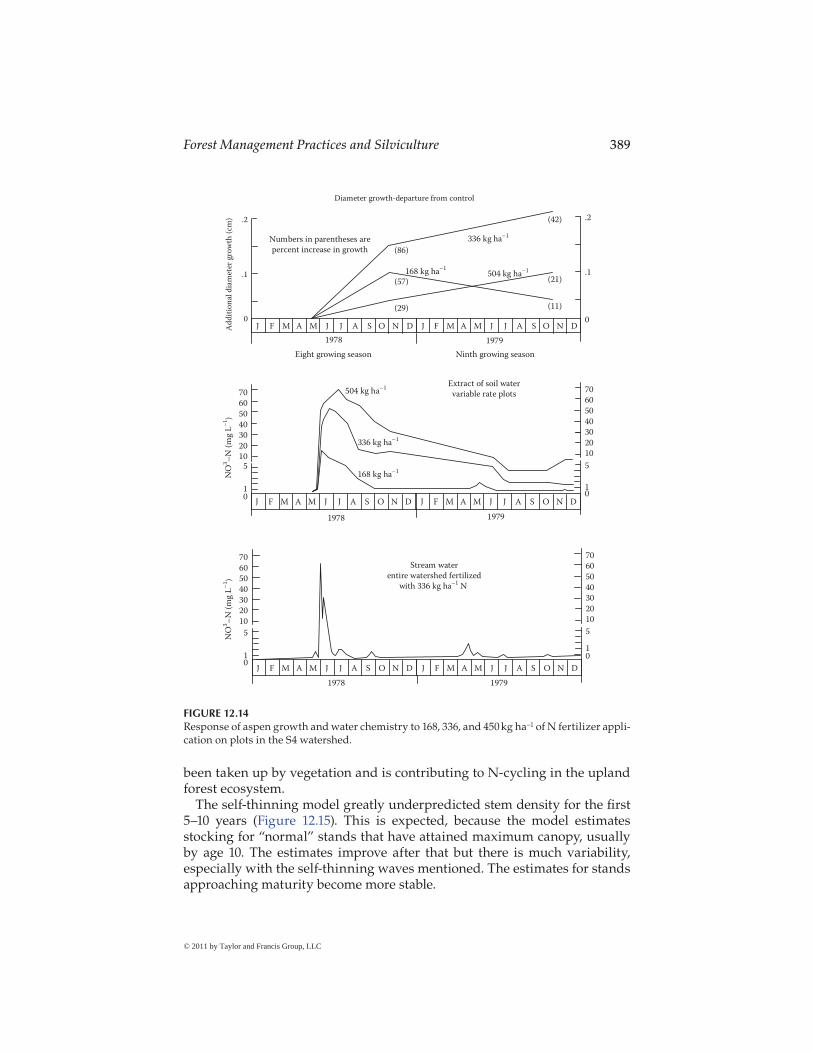
The entire upland, except for 0.6 ha reserved for fertilizer rate trials, was fertilized by air in 1978 at 336 kg ha−1 of N supplied as ammonium–nitrate. By age 38, SI had increased as much as 2.4 m from that of the original stand (22.6 m). Increased SI was hypothesized to be a response to the N fertiliza-tion and the decay of large amounts of broadcast-scattered logging slash. Diameters and heights of regenerated trees and shrubs were measured every 2 years through 2002 and in 2008. From these, biomass and merchantable timber could be calculated using equations from Perala and Alban (1993) and Wenger (1984).
The development of these regenerating stands over 38 years is demon-strated in Figure 12.13a and b. The near total dominance of aspen in biomass per hectare is well illustrated in Figure 12.12a. At age 38, only the “other” cat-egory approached 8% of the aspen biomass. Figure 12.12b shows that aspen sucker densities offer overwhelming competition to other regeneration for the first 3 or 4 years. Hazel then surpassed aspen in numbers, but, by then, aspen dominants were 3.7 m tall, and their canopies captured most of incom-ing solar energy. By age 38, aspen stem densities were a small fraction of the total.
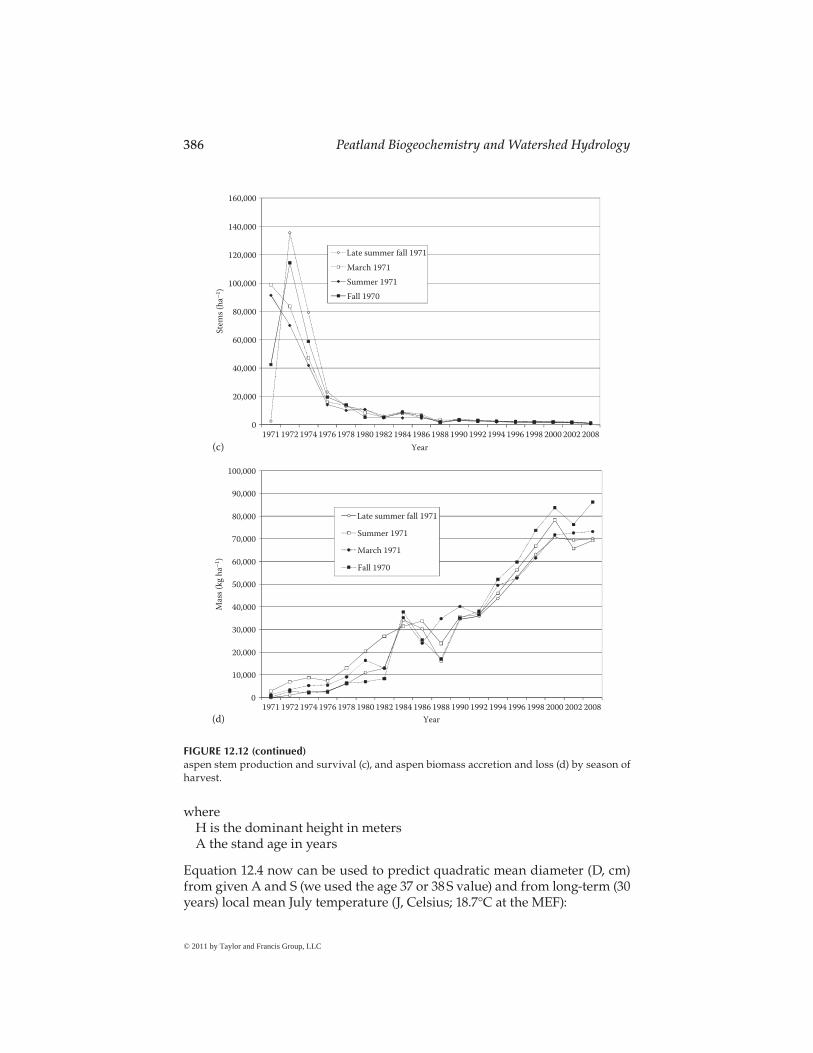
Figure 12.13c and d show aspen development by season of harvest. In late fall (1970) and late winter (March 1971), logging produced the most 1 year-old coppice stems, whereas logging during summer to fall produced the most 2 year-old stems. Late fall and winter logging is followed by a full summer to initiate and grow coppice regeneration. However, summer or fall logging disturbs the litter layer and competing ground vegetation to allow more soil warming and thus more abundant suckering. A snowpack may limit such disturbance, delaying and slowing the production of coppice. There may be little practical advantage with harvest season. Figure 12.13c shows stocking differences among time of harvest are confounded in several years.
Figure 12.13d shows that logging in late fall or winter produced the most aspen biomass for the first 10–12 years. After that time, the development of aspen biomass is even more confounded by harvest season than stem num-bers, indicating that aspen can be logged in any season on soils that are well drained or frozen to minimize compaction. Figure 12.13d further shows two waves of accelerated self-thinning at age 14 (1985) and 30 (2001). This common phenomenon was little appreciated until pointed out by Graham et al. (1963).
Aspen Self-Thinning Tested
This allows an opportunity to independently test the predictive usefulness of aspen growth and self-thinning models (Perala et al. 1996). The first task
386 Peatland Biogeochemistry and Watershed Hydrology
whereH is the dominant height in metersA the stand age in years
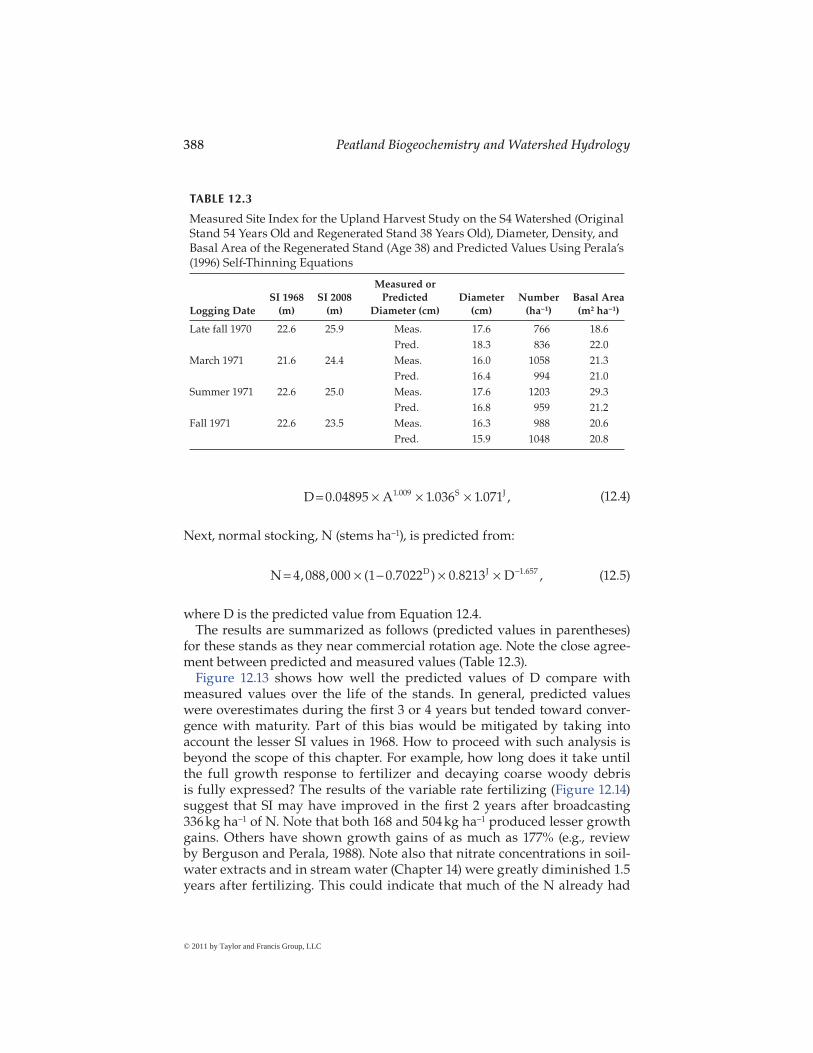
Equation 12.4 now can be used to predict quadratic mean diameter (D, cm) from given A and S (we used the age 37 or 38 S value) and from long-term (30 years) local mean July temperature (J, Celsius; 18.7°C at the MEF):
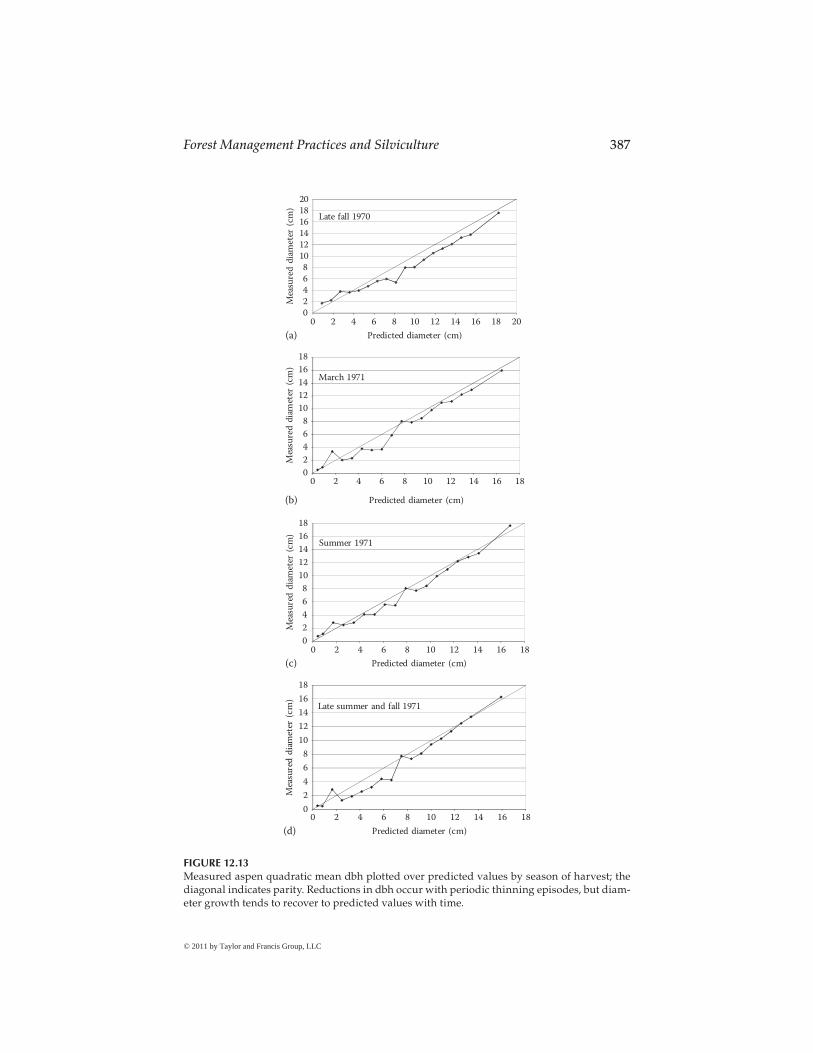
FIGURE 12.13Measured aspen quadratic mean dbh plotted over predicted values by season of harvest; the diagonal indicates parity. Reductions in dbh occur with periodic thinning episodes, but diam-eter growth tends to recover to predicted values with time.
where D is the predicted value from Equation 12.4.The results are summarized as follows (predicted values in parentheses)
for these stands as they near commercial rotation age. Note the close agree-ment between predicted and measured values (Table 12.3).
Figure 12.13 shows how well the predicted values of D compare with measured values over the life of the stands. In general, predicted values were overestimates during the first 3 or 4 years but tended toward conver-gence with maturity. Part of this bias would be mitigated by taking into account the lesser SI values in 1968. How to proceed with such analysis is beyond the scope of this chapter. For example, how long does it take until the full growth response to fertilizer and decaying coarse woody debris is fully expressed? The results of the variable rate fertilizing (Figure 12.14) suggest that SI may have improved in the first 2 years after broadcasting 336 kg ha−1 of N. Note that both 168 and 504 kg ha−1 produced lesser growth gains. Others have shown growth gains of as much as 177% (e.g., review by Berguson and Perala, 1988). Note also that nitrate concentrations in soil-water extracts and in stream water (Chapter 14) were greatly diminished 1.5 years after fertilizing. This could indicate that much of the N already had
TABLE 12.3
Measured Site Index for the Upland Harvest Study on the S4 Watershed (Original Stand 54 Years Old and Regenerated Stand 38 Years Old), Diameter, Density, and Basal Area of the Regenerated Stand (Age 38) and Predicted Values Using Perala’s (1996) Self-Thinning Equations
Logging DateSI 1968
(m)SI 2008
(m)
Measured or Predicted
Diameter (cm)Diameter
(cm)Number
(ha−1)Basal Area (m2 ha−1)
Late fall 1970 22.6 25.9 Meas. 17.6 766 18.6Pred. 18.3 836 22.0
been taken up by vegetation and is contributing to N-cycling in the upland forest ecosystem.
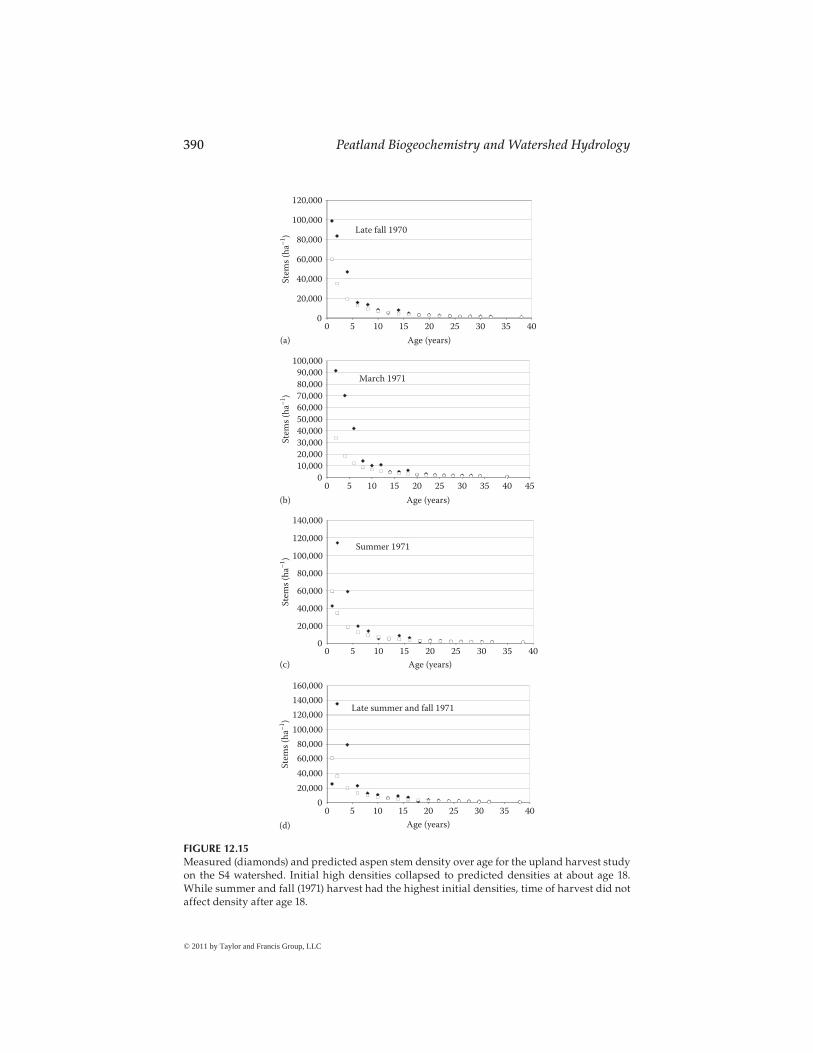
The self-thinning model greatly underpredicted stem density for the first 5–10 years (Figure 12.15). This is expected, because the model estimates stocking for “normal” stands that have attained maximum canopy, usually by age 10. The estimates improve after that but there is much variability, especially with the self-thinning waves mentioned. The estimates for stands approaching maturity become more stable.
Ad
dit
ion
al d
iam
eter
gro
wth
(cm
)
1978
J F M A M J J A S O N D F M A M J J A S O N DJ
J F M A M J J A S O N D F M A M J J A S O N DJ
J F M A M J J A S O N D F M A M J J A S O N DJ
1979
Eight growing season Ninth growing season
.2
.1
0
.2
.1
0
Diameter growth-departure from control
Numbers in parentheses are
percent increase in growth
336 kg ha–1
168 kg ha–1504 kg ha–1
(86)
(11)
(21)
(42)
(29)
(57)
1978 1979
70
60
50
40
30
20
10
70
60
50
40
30
20
10
70
60
50
40
30
20
10
70
60
50
40
30
20
105
10
5
10
Extract of soil water
variable rate plots
168 kg ha–1
504 kg ha–1
336 kg ha–1
NO
3–
N (
mg
L–
1).
NO
3–
N (
mg
L–
1).
Stream water
entire watershed fertilized
with 336 kg ha–1 N
19791978
5
10
5
10
FIGURE 12.14Response of aspen growth and water chemistry to 168, 336, and 450 kg ha−1 of N fertilizer appli-cation on plots in the S4 watershed.
390 Peatland Biogeochemistry and Watershed Hydrology
0
20,000
40,000
60,000
80,000
100,000
120,000
Ste
ms
(ha–
1)
Age (years)
Late fall 1970
0
10,000
20,000
30,000
40,000
50,000
60,000
70,000
80,000
90,000
100,000
0
(a)
(c)
(b)
(d)
5 10 15 20 25 30 35 40
0 5 10 15 20 25 30 35 40 45
Ste
ms
(ha–
1)
Age (years)
March 1971
0
20,000
40,000
60,000
80,000
100,000
120,000
140,000
Ste
ms
(ha–
1)
Age (years)
Summer 1971
0
20,000
40,000
60,000
80,000
100,000
120,000
140,000
160,000
0 5 10 15 20 25 30 35 40
0 5 10 15 20 25 30 35 40
Ste
ms
(ha–
1)
Age (years)
Late summer and fall 1971
FIGURE 12.15Measured (diamonds) and predicted aspen stem density over age for the upland harvest study on the S4 watershed. Initial high densities collapsed to predicted densities at about age 18. While summer and fall (1971) harvest had the highest initial densities, time of harvest did not affect density after age 18.
Aimo K. Cajander was Prime Minister of Finland during the Winter War from November 1939 to March 1940. Thirteen years earlier, as a professor of forestry at the University of Helsinki, Cajander (1926) theorized that forest productivity is best predicted by understory vegetation. The combination of forestry professor and high political office also occurred in the United States. In 1890, Gifford Pinchot, a professor of forestry, founded both the Yale University School of Forestry and the Society of American Foresters. Gifford’s role as one of American’s first professional foresters was foreshad-owed by his father James, whose land speculation and lumbering business brought great family wealth but also regret for the damage his business had done to the land. James subsequently made conservation a priority and placed his capable son at Yale by endowing the School of Forestry at the University. Grey Towers, the family estate at Milford, PA, became a “nursery” for the American forestry movement. Pinchot became the first Chief of the Forest Service in 1905 and espoused a national vision of American forestry by recruiting professionally trained foresters throughout the nation. Pinchot promoted the efficient use and renewal of the nation’s forests resources for the greatest good.
In recent decades, the Forest Service presented a continental vision of land classification for both land and water ecological units. The aquatic classification is based on large river basins and nested watersheds within basins (Maxwell et al. 1995). The terrestrial classification is based on geol-ogy, climate, soil taxa, and potential vegetation (Keys et al. 1995). At its low-est level, the National Hierarchical Framework of Ecological Units defines the Ecological Land Type Phase (ELTP) as a combination of landform (slope position, slope, aspect, etc.) and soil type. In many cases, an ELTP and a habitat type based on total vegetation structure are the same. In other cases, one ELTP may contain more than one habitat type. The merger of land form and soil-type classification with vegetation habitat-type classification has come to maturity in the Lake States some 75 years after Cajander (1926, 1949) used habitat type and landform (esker, coastal, mire, etc.) to classify forests in Finland.
Bakuzis (1959) and Bakuzis and Kurmis (1978) arrayed forest types (trees, shrubs, and herbaceous associations) in Minnesota on a four factor grid of synecological coordinates (moisture, nutrients, light, and heat): factors of landform, soils, and climate. Combinations of these factors on a scale of 1 to 5 predicted the plant association requirements for optimal growth and survival. Grigal and Arneman (1970) quantified relationships among veg-etation and soil classification units in northeastern Minnesota. Habitat typ-ing (potential tree and herbaceous vegetation) was first developed in the Upper Peninsula of Michigan by Coffman et al. (1980). Subsequently, Kotar (1986) and Kotar et al. (1988) published habitat types for several counties in
392 Peatland Biogeochemistry and Watershed Hydrology
Michigan and Wisconsin. A rush of publications on habitat-type publica-tions followed.
Almendinger and Hanson (1998) listed 18 native community types (habitat types) for the Northern Lake Plains subsection and the Chippewa National Forests in Itasca and Cass Counties in Minnesota. Kotar et al. (1999) found that habitat types explained much of the variation in forest productivity on Forest Service forest-inventory plots in Wisconsin. In the same year, the Boise-Cascade Corp. (International Fall, MN) published hab-itat types as an ecosystem diversity matrix for forest land in Koochiching County in northern Minnesota and Ontario, Canada (Kernohan et al. 1999). In 2000, the Blandin Paper Co. (Grand Rapids, Minnesota) and Boise Cascade cosponsored the publication of “A Field Guide to Forest Habitat Type Classification for North Central Minnesota” (Kotar and Burger 2000). Bakuzis’ moisture and nutrient synecologic coordinates were correlated with 10 dominant and codominant habitat types, and Cajander’s concept of using forest understory to predict forest productivity was expanded to predict the successional pathways of forest trees despite natural or logging disturbances (Kotar 1986). Forest management tools had mixed the amal-gam of potential tree and existing herbaceous vegetation, soil moisture, nutrient status, and soil-mapping units to hardened steel, founded on the belief and field expression that optimum forest productivity is based on the natural plant associations adapted to the landforms, soils, and climate of the region.
As Pinchot envisioned, the efficient use and renewal of our forest resources should provide the greatest good for the greatest number of people in the long run. The greatest good is provided when the optimal growth of all tree species on a habitat type is achieved at the least expense of time and money. Forest management broadened from single-species site management supply-ing a single mill, to the concept of forest-community vision (a community-based approach to forest management reflected in a variety of products and of forest-land uses). In a forest-community vision, all trees adapted to a site reach optimum growth, and a mix of trees is supplied to a mix of mills using one or several species.
Knowledge of habitat types enlarges the palette of forest management choices for both early- and late-succession canopy covers. Cheryl Adams with the Blandin Paper Company, a division of UPM Kymmene, in Grand Rapids, Minnesota, has invested over a decade in learning new management approaches to supply a mixture of aspen, spruce, and balsam fir to their mill and other species to other mills while optimizing forest productivity on all their forest land. Three habitat types and management options are briefly reviewed to illustrate how the concept of efficient use with the least expen-diture for the greatest productivity is applied in north central Minnesota. The ATiCa habitat type (Acer saccharum-Tilia Americana/Cauliphyllum thalic-troides or sugar maple-basswood/blue cohosh) is found on mesic, nutrient-rich sites: hilly to steep slopes of stagnation moraines with well-drained silt
loams over sandy loams or sandy loam caps over clay loam till. The naming convention lists the two dominant trees at the late-succession stage and the dominant herbaceous plant at any succession stage. Identifying the domi-nant herbaceous plant at any stage avoids site typing by the current canopy cover. This also avoids limiting management choices associated only with a canopy-cover type.
The ATiCa-habitat type is managed for northern hardwoods (sugar maple and basswood with inclusions of red maple and ironwood) in the late-suc-cession stage. Where there are mature aspen in the early succession stage, this type can be managed for aspen with a combination of clearcutting, pre-commercial, and commercial thinning with a final harvest at age 40. Only sites with an aspen SI of 21.3 m at age 50 or higher are suitable for this man-agement option. Precommercial thinning at age 7 or 8 allows the efficient use of brush saws and avoids the introduction of hypoxylon canker found increasingly in sucker stands after age 10 as self-thinning damage opens tree wounds. Thinning around dominant suckers in a 2.1 m circle (1.1 m radius) leaves 2000–2225 trees ha−1 with the intervening suckers laid on the ground. Commercial thinning at age 25 yields clear wood when half of the trees are removed. Final harvest maximizes the production of clear wood at age 40. One person with a power brush saw can thin 0.8 ha per day. Typically, six-person crews are used. Commercial thinning yields product useable wood but costs about $40 ha−1.
The AbFnAu habitat type (Abies-Fraxinus nigra/Asarum canadense or the balsam fir-black ash/wild ginger) is found on wet mesic to mesic, medium-nutrient sites: slightly rolling lake plains, till plains, and outwash plains that are somewhat poorly to poorly drained. This is mixed-wood type and is common in northern Minnesota and wide areas in central and western Canada. Balsam fir and black ash along with red maple are the late-succes-sion cover type, but white spruce is a potential cover type in this habitat, as is white pine. As with many Lake State forest stands, mature aspen may be the current dominant species. Where aspen is age 55 or older, one prescription for mixed-wood management is to clearcut the aspen and plant white spruce in the same year as the clearcut. On the basis of a decade of planting trials, planting white spruce at 740–990 ha−1 is recommended. White pine may sub-stitute for 15% of the spruce where dense slash piles provide a planting site that is less susceptible to deer browsing. The site is examined at age 3 and if total trees (aspen suckers and white spruce or white pine) exceed 5000 ha−1, the aspen is thinned at age 4 with a brush saw downing a 1.1 m swath around each conifer and leaving a total tree count of 2000–2225 trees ha−1. At age 45, aspen basal area is thinned to 15 m2 ha−1. Heavier aspen thinning may encourage competition from hazel and heavy balsam fir regeneration that is subject to dieback. White spruce is planted again after aspen thinning if needed. The aspen overstory is removed at age 50. The stand is subsequently regenerated by commercial thinning. Balsam fir, white spruce, white pine, patch-derived aspen, and black ash are removed periodically. However,
394 Peatland Biogeochemistry and Watershed Hydrology
barring wide spread fire and wind throw, the site retains a mature forest with a mixed wood canopy.
The AbPiV habitat type (Abies-Picea glauca/Vaccinium angustifolium or the balsam fir-white spruce/blueberry) is found on dry to mesic, nutrient-poor sites: rolling, sandy, well drained. Any mixture of balsam fir, white spruce, aspen, paper birch, and jack/ red/white pine is common. Light scarification favors aspen and balsam fir reproduction while heavy scarification favors pine. On National Forests, managers tend to favor pine species and remove balsam fir.
These examples illustrate how habitat type drives management choices based on landowner objectives. In many harvests, CTL equipment retains slash on site. This practice has been recommended as the most effective using harvester finesse and many-wheeled forwarders. Stands with large trees require the power of conventional shearers and cable skidders, but the return of slash broadcast on the site has been recommended. In aspen clearcuts and all harvests, cutting progresses from the back to the front of the sale (main access road) to minimize soil disturbance as soils in cleared or thinned areas become wet after initial entry. Protecting the soil structure ensures the continuity of habitat-type structure and potential productivity. The destruction of soil structure by compaction and rutting reduces the pro-ductivity of crop trees by 10%–35% (Stone and Elioff 1988). Major compac-tion on skid trails can nearly be eliminated with the use of slash mats prior to skidding.
In the following section, we discuss the use of long-term data on aspen growth and yield from the MEF, how much biomass is returned to the soil for various aspen-thinning scenarios, and how many nutrients are returned along with the thinning slash. The development of mixed-wood and aspen-thinning scenarios adds more tools to allow a wide mix of harvest species while maintaining a mature forest canopy. Additional innovations in forest management are also possible using habitat types as a guide.
Forest-management choices are watershed-management choices. Main-taining mature forest canopies near streams (riparian areas) ensures pro-tection of streambanks from equipment crushing and erosion and provides continued stream amenities of shade and long-term inputs of large wood. All-season forest roads with stream-wide culverts or bridges ensure passage of fish during critical spawning runs and light-on-the-land access for many forest uses.
Watersheds with too much open land or young forest land (<16 years old) produce runoff at accelerated rates without erosion of the land surface, but these accelerated runoff rates are high enough to extend gullies and to erode and reshape stream channels when open and young forest land accumulates to 60% of watersheds 0.4–4 ha in size. The accelerated stream channel flow is caused by soil compaction that reduces infiltration and by the melting of snowpacks in open areas or young forest stands. Differences in snowmelt in young forests are related to adolescent crown height. Even aspen thinning
directed at a 40 year rotation can produce a forest canopy with high crowns (wide crowns on the upper third of the tree bole) in 10 years compared to self-thinning in aspen that typically produces a high-crown forest in 16 years or more and retains high stem counts. Watershed experiments at the MEF can measure the effect of new forest-management scenarios on total water yield and, more importantly, for dynamically stable streams, the rate of channel forming flows at the bankfull stage that occur with a frequency of about every 1.5 years. Evaluations of thinning and mixed-wood impacts on total water yield, peak flows, and channel-forming flows are prime candidates for watershed research.
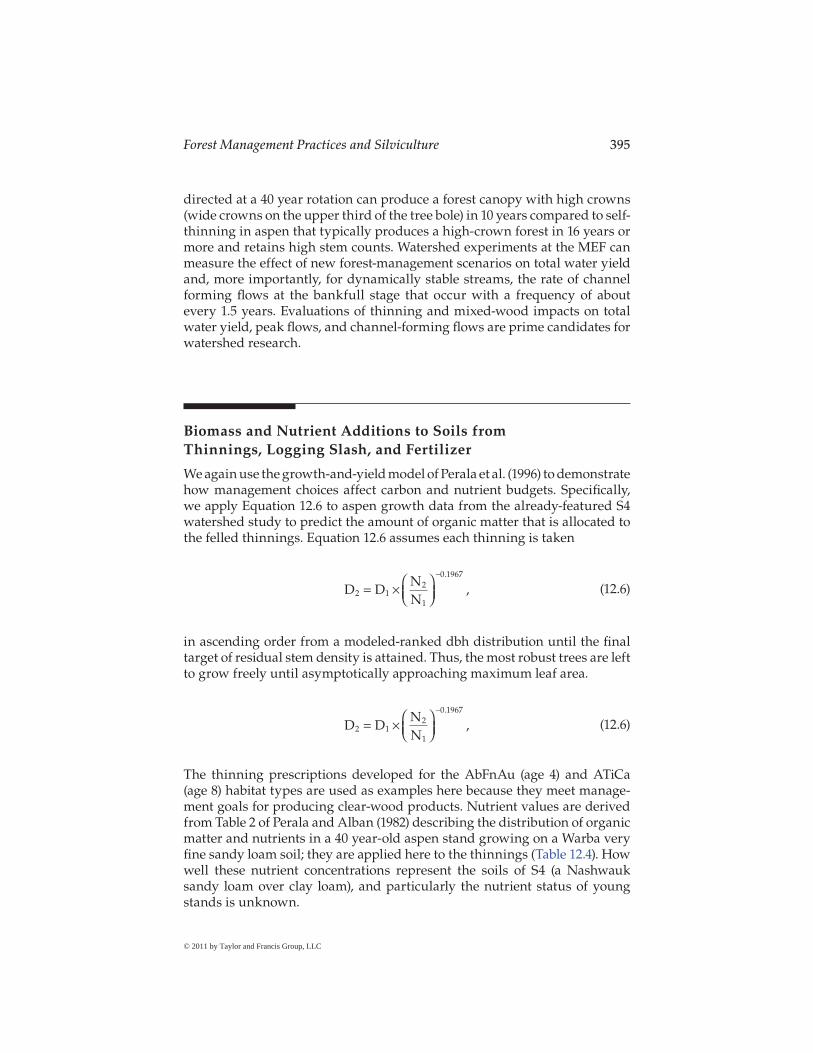
Biomass and Nutrient Additions to Soils from Thinnings, Logging Slash, and Fertilizer
We again use the growth-and-yield model of Perala et al. (1996) to demonstrate how management choices affect carbon and nutrient budgets. Specifically, we apply Equation 12.6 to aspen growth data from the already-featured S4 watershed study to predict the amount of organic matter that is allocated to the felled thinnings. Equation 12.6 assumes each thinning is taken
D D
NN2 1
2
1
0.1967
= ⎛⎝⎜
⎞⎠⎟
−
× , (12.6)
in ascending order from a modeled-ranked dbh distribution until the final target of residual stem density is attained. Thus, the most robust trees are left to grow freely until asymptotically approaching maximum leaf area.
D D
NN2 1
2
1
0.1967
= ⎛⎝⎜
⎞⎠⎟
−
× , (12.6)
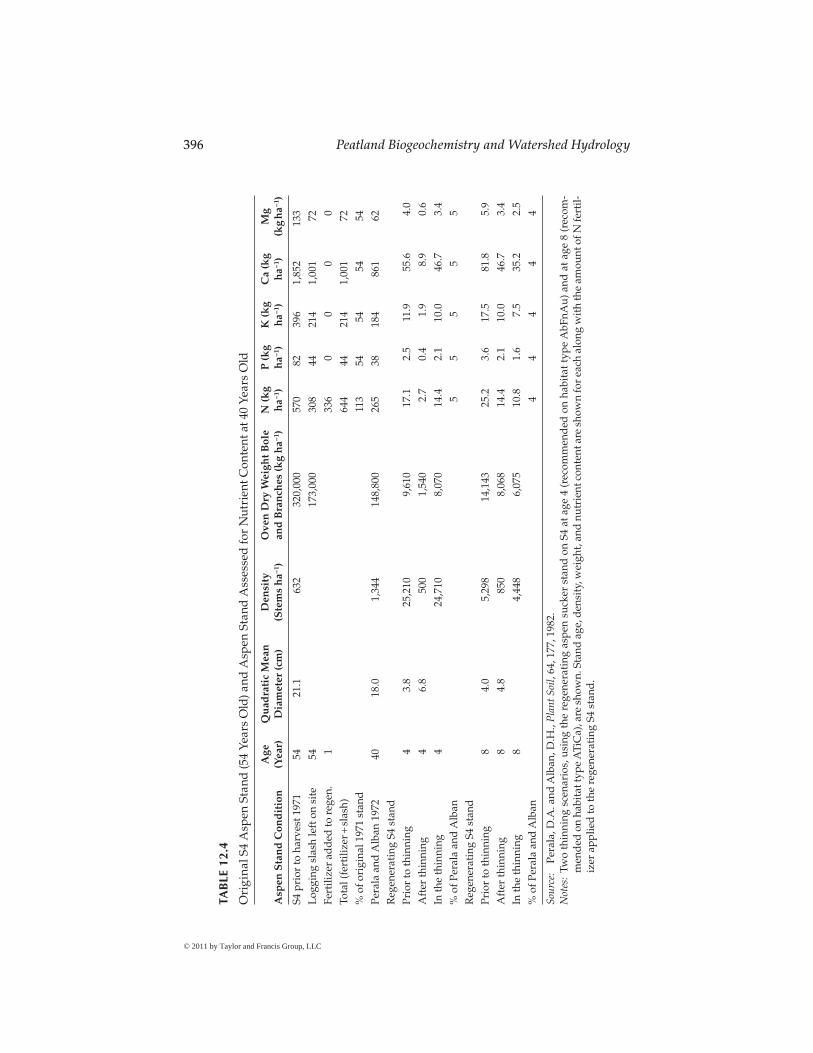
The thinning prescriptions developed for the AbFnAu (age 4) and ATiCa (age 8) habitat types are used as examples here because they meet manage-ment goals for producing clear-wood products. Nutrient values are derived from Table 2 of Perala and Alban (1982) describing the distribution of organic matter and nutrients in a 40 year-old aspen stand growing on a Warba very fine sandy loam soil; they are applied here to the thinnings (Table 12.4). How well these nutrient concentrations represent the soils of S4 (a Nashwauk sandy loam over clay loam), and particularly the nutrient status of young stands is unknown.
The age 4 scenario would contribute 8070 kg ha−1 of organic matter in thin-nings to the soil, and the age 8 scenario would contribute 6075 kg ha−1 if only the crop trees remain (Table 12.4). This is counterintuitive, but the 4 year-old stand had nearly five times greater stem density while mean stand dbh is nearly equal to the 8 year old stand. This demonstrates the weakness of Equation 12.6 to predict D values in stands younger than age 10, because they have not yet attained maximum leaf area. If the thinnings are confined to the 0.9–1.1 m radius circles as specified, these estimates must be reduced by 45% or 25%, respectively.
Nutrients in 4 and 8 year-old thinnings amount to only 4%–5% of the 40 year-old Perala and Alban stand. Whether this is a significant return to the nutrient cycle is beyond the scope of this chapter. The early aspen thin-ning accelerates the growth of residual trees and produces clear wood with significantly less disease impact (C. Adams, 2009, personal communication).
Table 12.4 also estimates nutrient amounts in the original S4 stand (origin about 1917) harvested in 1971, the amount of logging slash left on site, and the amount of N added in fertilizer at age 1. It is important to recognize that the regenerating aspen stand on S4 (at age 38) had increased in SI by 11% (Table 12.3). A higher SI stand will also support greater basal areas, and so the actual increase in wood production may be 15%–20%. Logging slash remaining from the 1971 harvest returned 54% of the organic matter and N, phosphorus (P), potassium (K), calcium (Ca), and magnesium (Mg) found in the mature stand. The application of ammonium-nitrate fertilizer to the age 1 aspen stand added 59% of the N in the original stand (113% total addition; Table 12.4).
Guidelines for harvesting biomass in Minnesota (MFRC 2007) suggest that conventional harvesting leaves about 40% of the original aboveground bole and branch wood and that one-third of this should remain if the remainder is harvested as biomass. The 1971 conventional harvesting on the S4 water-shed left 54% of the original stand on the ground (173,000 kg ha−1, Table 12.4). Removing two-thirds (115,333 kg ha−1) of the biomass would also remove 205, 29, 142, 667, and 48 kg ha−1 of N, P, K, Ca, and Mg, respectively. The regenerat-ing aspen stand on S4 received 308 kg ha−1 of slash N and 336 kg ha−1 of N as ammonium–nitrate fertilizer. Presumably, these substantial additions of N to the regenerating stand both caused the 11% increase in SI after 38 years. The MFRC guidelines suggest that nutrient additions from the decay of organic matter over 50 years can balance nutrient losses if bole wood and two-thirds of the logging slash are removed. However, this single-item evaluation does not incorporate 50 years of soil nutrient leaching nor account for possible changes in SI during the subsequent rotation. The long-term estimates of bio-mass and nutrients at S4 show that large returns of organic matter and nutri-ents to the soil after harvest can significantly increase SI; it may be that large removals of logging slash in biomass also can reduce SI. Long-term research is needed to incorporate all nutrient-cycling pathways (e.g., leaching, litter fall return, mineral weathering, and changes in SI from depauperate organic matter return or soil compaction).
398 Peatland Biogeochemistry and Watershed Hydrology
References
Alban, D.H., G.E. Host, J.D. Elioff, and D.A. Shadis. 1994. Soil and vegetation response to soil compaction and forest floor removal after aspen harvesting. Research paper NC-315. St. Paul, MN: USDA Forest Service.
Almendinger, J. and D. Hansen. 1988. Ecological Land Classification Handbook for the Northern Minnesota Drift & Lake Plains and the Chippewa National Forest. Minneapolis, MN: Minnesota Department of Natural Resources.
Bakuzis, E.V. 1959. Synecological coordinates in forest classification and in reproduc-tion. PhD thesis. Ann Arbor, MI: University of Minnesota. Microfilm and Xerox Publ. Univ. Microfilms.
Bakuzis, E.V. and V. Kurmis. 1978. Provisional list of synecological coordinates and selected ecographs of forest and other plant species in Minnesota. Staff Series Paper No. 5. St. Paul, MN: Department of Forest Resources, University of Minnesota.
Berguson, W.E. and D.A. Perala. 1988. Aspen fertilization and thinning research results and future potential. In: Minnesota’s Timber Supply: Perspectives and Analysis, eds., A.R. Ek and H.M. Hoganson. Grand Rapids, MN: University of Minnesota College of Natural Resources and Agricultural Experiment Station, pp. 176–183.
Brown, J.M. 1973. Effect on overstory removal on production of shrubs and sedge in a northern Minnesota bog. Journal of the Minnesota Academy of Science 38(2–3):96–97.
Buckman, R.E. 1962. Growth and yield of red pine in Minnesota. Tech. Bull. 1272. St. Paul, MN: USDA Forest Service.
Buckman, R.E., B.B. Bishaw, T.J. Hanson, and F. Benford. 2006. Growth and yield of red pine in the Lake States. General technical report NC-271. St. Paul, MN: USDA Forest Service.
Cajander, A.K. 1926. The theory of forest types. Acta Forestalia Fennica 29(3):1–108.Cajander, A.K. 1949. Forest types and their significance. Acta Forestalia Fennica 56:1–71.Coffman, M.S., E. Alyank, and J. Ferris. 1980. Field Guide to Habitat Type Classification
System for Upper Peninsula of Michigan. Houghton, MI: School of Forestry and Wood Products. Michigan Technological University.
Debyle, N.V. 1985. Animal impacts. In: Aspen: Ecology and Management in the Western United States. General Technical Report RM 119. Fort Collins, CO: Rocky Mountain Forest and Range Experiment Station, USDA Forest Service.
Graham, S.A., R.P. Harrison Jr., and C.E. Westell Jr. 1963. Aspens: Phoenix Trees of the Great Lakes Region. Ann Arbor, MI: University of Michigan Press.
Grigal, D.F. and H.F. Arneman. 1970. Quantitative relationships among vegetation and soil classifications from northeastern Minnesota. Canadian Journal of Botany 48(3):555–566.
Grigal, D.F. and K.N. Brooks. 1997. Forest management impacts on undrained peat-lands in North America. In: Northern Forested Wetlands: Ecology and Management, ed. C.C. Trettin, M.F. Jurgensen, D.F. Grigal, M.R. Gale, and J.K. Jeglum. Boca Raton, FL: CRC/Lewis Publishers, pp. 379–396.
Grigal, D.F. and L.K. Kernik. 1984a. Generality of black spruce biomass estimation equations. Canadian Journal of Forest Research 14(3):468–470.
Grigal, D.F. and L.K. Kernik. 1984b. Biomass estimation for black spruce (Picea mari-ana (Mill.) B.S.P.) trees. Research note 290. St. Paul, MN: University of Minnesota Department of Forestry.
Hawkinson, S. and W. Jewett. 2003. Timber Connections: The Joyce Lumber Story. Grand Rapids, MN: Bluewaters Press.
Heinselman, M.L. 1957. Wind-caused mortality in Minnesota black spruce in relation to cutting methods and stand conditions. In: Proceedings of Society of American Foresters, pp. 74–77.
Johnston, W.F. 1977. Manager’s handbook for black spruce in the north central states. General Technical Report GRT-NC-264. St. Paul, MN: USDA Forest Service, North Central Forest Experiment Station.
Kernohan, B.J., J. Kotar, K. Dunning, and J.B. Hauler. 1999. Ecosystem diversity matrix for the northern Minnesota and Ontario peatlands landscapes. Unpublished technical manual on file at Boise Cascade Corp. International Falls, MN.
Keys, J.E. Jr., C.A. Carpenter, S. Hooks, F. Koenig, W.H. McNab, W.W. Russell, and M.L. Smith. 1995. Ecological units of the eastern United States: First approxima-tion. USDA Forest Service.
Kotar, J.E. 1986. Soil-habitat type relationships in Michigan and Wisconsin. Journal of Soil and Water Conservation 41(5):348–350.
Kotar, J. and T.L. Burger. 2000. Field guide to forest habitat type classification for north central Minnesota: Northern Minnesota and Ontario peatlands section and eastern portion of the northern Minnesota Drift and Lake Plain section. Madison, WI: Terra Silva Consultants.
Kotar, J., A. Kovach, and C.T. Locey. 1988. Field Guide to Forest Habitat Types of Northern Wisconsin. Madison, WI: Department of Forestry, University of Wisconsin and Wisconsin DNR.
Kotar, J., J. Kovach, and G. Brand. 1999. Analysis of the 1996 Wisconsin forest statistics by habitat type. General Technical Report NC-207. St. Paul, MN: USDA Forest Service, North Central Research Station.
Lundgren, A.L. and W.A. Dolid. 1970. Biological growth functions describe published site index curves for Lake States timber species. Research paper NC-36. St. Paul, MN: USDA Forest Service.
Maxwell, J.R., C.J. Edwards, M.E. Jensen, S.J. Paustian, H. Parrott, and D.M. Hill. 1995. A hierarchical framework of aquatic ecological units in North America (nearctic zone). General technical report NC-176. St. Paul, MN: USDA Forest Service, North Central Forest Experiment Station.
Minnesota Forest Resource Council. 2007. Biomass harvesting guidelines on forest management sites. St. Paul, MN: Minnesota Forest Resource Council.
Page-Dumroese, D.S., M.F. Jurgensen, A.E. Tiarks, F. Ponder, F.G. Sanchez, R.L. Fleming, M. Kranabetter, R.F. Powers, D.M. Stone, J.D. Elioff, and D.A. Scott. 2006. Soil physical property changes at the North American Long-Term Soil Productivity study sites: 1 and 5 years after compaction. Canadian Journal of Forest Research 36(3):551–564.
Perala, D.A. and D.H. Alban. 1982. Biomass, nutrient distribution and litterfall in Populus, Pinus, and Picea stands on two different soils in Minnesota. Plant and Soil 64:177–192.
Perala, D.A. and D.H. Alban. 1993. Allometric biomass estimators for aspen-domi-nated ecosystems in the upper Great Lakes. Research Paper NC-314. St. Paul, MN: USDA Forest Service, North Central Forest Experiment Station.
Perala, D.A., G.E. Host, J.K. Jordan, and C.J. Ceiszewski. 1996. A multiproduct growth and yield model for the circumboreal aspens. Northern Journal of Applied Forestry 13(4):164–170.
400 Peatland Biogeochemistry and Watershed Hydrology
Powers, R.F., S.D. Andrew, F.G. Sanchez, R.A. Voldseth, D.S. Page-Dumroese, J.D. Elioff, and D.M. Stone. 2005. The North American long-term soil productiv-ity experiment: Findings from the first decade of research. Forest Ecology and Management 220(1–3):31–50.
Sommer, B.W. 2008. Hard Work and a Good Deal: The Civilian Conservation Corps in Minnesota. St. Paul, MN: Minnesota Historical Society Press.
Stone, D.L. and J.D. Elioff. 1998. Soil properties and aspen development five years after compaction and forest floor removal. Canadian Journal of Soil Science 78:51–58.
U.S. Department of Agriculture, Forest Service. 2001. Long-term soil productivity research: A program in sustaining forest ecosystems. Pamphlet FS-714, 8 pp. Available online at http://www.fs.fed.us/reseach/fgdc/pdf/soilprod.pdf
Verry, E.S. 1969. 1968 vegetation survey of the Marcell Experimental Watersheds. Report GR-W2–61. Grand Rapids, MN: USDA Forest Service.
Verry, E.S. 1998. Cut-to-length timber demonstration draws over 300. NC News. St. Paul, MN: USDA Forest Service.
Verry, E.S. and A.E. Elling. 1978. Two years necessary for successful natural seeding in nonbrushy black spruce bogs. Research Note NC-229. St. Paul, MN: USDA Forest Service.
Wenger, K.E. 1984. Forestry Handbook. 2nd edn. New York: John Wiley & Sons.