80
A PLATFORM FOR STAKEHOLDERS IN AFRICAN FORESTRY AFRICAN FOREST FORUM WORKING PAPER SERIES FOREST PLANTATIONS AND WOODLOTS IN TANZANIA VOLUME 1 ISSUE 16, 2011

A P L A T F O R M F O R S T A K E H O L D E R S I N A F R I C A N F O R E S T R Y
A F R I C A N F O R E S T F O R U M W O R K I N G P A P E R S E R I E S
FOREST PLANTATIONS AND WOODLOTS IN TANZANIA
V O L U M E 1 I S S U E 1 6 , 2 0 1 1

1
Copyright © African Forest Forum 2011 All rights reserved African Forest Forum P.O. Box 30030 00100 Nairobi GPO KENYA Tel: 254 20 7623900 Fax: +254 20 30677-00100 www.afforum.org Disclaimer The designations employed and the presentation of material in this publication do not imply the expression of any opinion whatsoever on the part of the African Forest Forum concerning the legal status of any country, territory, city or area or its authorities, or concerning the delimitation of its frontiers or boundaries regarding its economic system or degree of development. Excerpts may be reproduced without authorization, on condition that the source is indicated. Views expressed in this publication do not necessarily reflect those of the African Forest Forum.

2
FOREST PLANTATIONS AND WOODLOTS IN
TANZANIA
by
Prof. Yonika M. Ngaga
December 2011

3
TABLE OF CONTENTS
LIST OF TABLES 5
LIST OF FIGURES 6
ACRONYMS AND ABBREVIATIONS 7
ACRONYMS AND ABBREVIATIONS 7
PREFACE 9
Acknowledgements 9
Executive Summary 10
1. INTRODUCTION 12
2. FOREST PLANTATIONS SITUATION 15 2.1 Historical background 15 2.2 Location, areas and species composition 16 2.2.1 Total area 16 2.2.2 Location 17 2.2.3 Climate 17 2.2.4 Temperature 17 2.2.5 Soils 17 2.2.6 Accessibility 17 2.2.7 Species composition by area 18 2.2.8 Age class distribution 20 2.3 Plantation management 23 2.3.1 Establishment 23 2.3.2 Weeding 26 2.3.3 Pruning 27 2.3.4 Thinning 28 2.3.5 Forest health 29 2.3.6 Maintaining long term site productivity 30 2.3.7 Growth, yield and rotation age 31 2.4 Forest plantation expansion 31 2.4.1 New areas available for forest plantation expansion 31 2.4.2 Stakeholder views on establishment, expansion and improved management of forest
plantations 32 2.4.3 Constraints and opportunities for plantation expansion 33
3. OUT-GROWER SCHEMES AND OTHER WOODLOTS 35 3.1 Extent and impacts of out-grower schemes/other woodlots 35 3.2 Factors shaping growth of out-grower schemes and other woodlots 36
4. FOREST AND TREE TENURE 37 4.1 Current forest/tree tenure systems 37 4.2 Impacts of forest/tree tenure on poverty alleviation and SFM 38 4.3 Suggestions for improvement of tenure system 39
5. FINANCIAL AND HUMAN RESOURCES FOR PLANTATIONS AND OUTGROWERS/WOODLOTS 40
5.1 Current financing mechanisms 40 5.2 Potential financing mechanisms 41 5.3 Human resources 42 5.4 Other resources 43

4
6. INCENTIVES FOR PLANTATION ESTABLISHMENT BY PUBLIC/PRIVATE SECTOR AND OUTGROWERS 44
6.1 The rationale behind incentives 44 6.1.1 The concept of incentives 44 6.1.2 Why incentives in forest plantation establishment 44 6.2 Current incentives: impacts and effectiveness 44 6.3 Suggestions for improvement of incentives 45
7. SUPPLY AND DEMAND OF FOREST PRODUCTS 45 7.1 Suppy scenarios and projections 45 7.1.1 Government plantations supply 45 7.1.2 Private company plantations supply 49 7.1.3 Non-industrial private plantations supply 50 7.1.4 Natural forests supply 50 7.1.5 Total supply forecast until 2030 53 7.2 Demand scenarios and projections 53 7.2.1 Demand forecasting scenario up to 2030 55 7.3 Consumer prices 56 7.3 Forest products trade 57
8. FOREST ROYALTIES AND OTHER REVENUES 58 8.1 Forest royalties and licences in Tanzania 58 8.1.1 Structure and amount of forest royalties and licences 58 8.1.2 Suggestions for improvement of forest charges and licences 59 8.2 Forest concessions 60 8.2.1 Procedures for concession arrangements in plantation forests 60 8.3 Administration of forestry revenue system 61 8.3.1 The process of setting forest royalties and taxes 61 8.3.2 The overall revenue collection process 61 8.3.4 Monitoring system and collection of revenue 61 8.3.5 Process of monitoring revenue collection 62 8.3.6 Total forest revenue collection 64 8.3.7 Effectiveness of FBD in revenue collection 64 8.3.8 Suggestions for improvement of revenue collection systems 66
9. PROCESSING OF PRODUCE 66 9.1 Ownership and types of industries 66 9.1.1 Sawmilling 66 9.1.2 Pole treatment plants 67 9.1.3 Wood based panels industries 68 9.1.4 Pulp and paper mill 68 9.2 Raw material supply and quality 69 9.3 Constraints facing the sub-sector 69 9.4 Potential for future investment 69
10. SOCIO-ECONOMIC AND ENVIRONMENTAL CONTRIBUTIONS OF FORESTS 70 10.1 Current and potential income generation 70 10.2 Current and Potential employment 70 10.3 Plantations in forest conservation 70
11. CONCLUSIONS AND WAY FORWARD 71 11.1 Conclusions 71 11.2 Recommendations/way forward 72
REFERENCES 73

5
LIST OF TABLES Table 1. Forestry and other area information for Tanzania, 1990 – 2010.. ................................. 12
Table 2. Establishment, area (ha), location, climate, soils and accessibility of plantation forests in Tanzania. .......................................................................................................... 18
Table 3. Commercial plantation areas (ha) by species and management objectives.. .................. 19
Table 4. Age class distribution of trees in government plantations. ........................................... 20
Table 5. Seed sources for planting in some public and private sector forest plantations.. ............. 23
Table 6. Initial spacing used in public sector industrial forest plantations in Tanzania.. ................ 25
Table 7. Initial spacing used in private sector industrial forest plantations in Tanzania. ............... 25
Table 8. Weeding techniques used in some forest plantations. ................................................. 26
Table 9. Current pruning schedules for Pinus patula and Cupressus lusitanica (spacing 3 x 3 m), Tanzania. .............................................................................................. 27
Table 10. Current pruning schedule for teak at KVTC (spacing 3x3 m). ..................................... 28
Table 11. Thinning regimes for different tree species in industrial forest plantations, Tanzania. .... 28
Table 12. Thinning schedule for teak at Kilombero Valley. ....................................................... 29
Table 13. Thinning schedule for Pinus patula at Idete, Kitete, Mapanda, Taweta and Uchindile. .... 29
Table 14. Land available/set aside for plantation expansion in Tanzania. ................................... 31
Table 15. Perception on risks for private sector investment in industrial forest plantation. ........... 34
Table 16. Forest types and their management in Tanzania....................................................... 38
Table 17. Forest ownership structure (tenure). ...................................................................... 38
Table 18. Employment trend by FBD, 2000 – 2010. ................................................................ 42
Table 19. Professional human resource in government forest plantations................................... 43
Table 20. Distribution of government forest plantations.. ........................................................ 46
Table 21. Information on selected industrial plantations. ......................................................... 50
Table 22. Natural forest area and harvesting potential in selected regions. ................................ 52
Table 23. Natural forest area and harvesting potential in selected districts. ............................... 52
Table 24. Supply forecast until 2030. All figures in 1000 m³. ................................................... 53
Table 25. Forecast demand scenarios. Source: Field data. ....................................................... 56
Table 26. Prices of local timber and wood products in 2010 in Tanzania. ................................... 57
Table 27: Royalty rates and fees for some major forest produce in 2007/2008, Tsh. ................... 58
Table 28. Description of types of forms used in collection forests produces revenue. ................... 63
Table 29. Annual total revenue collection trend for 6 years period (2003/04–2009/10), Million Tsh. (million USD). ................................................................................................. 64
Table 30. Performance of FBD in revenue collection (actual vs estimates). ................................ 65
Table 31. Production capacity for transmission poles in Tanzania.. ............................................ 67

6
LIST OF FIGURES Figure 1. Distribution of government forest plantations in Tanzania. ......................................... 15
Figure 2. Overall age class distribution of government plantations. ........................................... 23
Figure 3. Annual allowable cut, Sao Hill forest plantation. ........................................................ 46
Figure 4. Wood consumption from Sao Hill forest plantations, 2010. ......................................... 47
Figure 5. Age class distribution of Sao Hill pine forest pPlantation, 2010. .................................. 47
Figure 6. Current harvesting and projected AAC from North Kilimanjaro forest plantations. ......... 48
Figure 7. Current harvesting and projected AAC from West Kilimanjaro forest plantations.. ......... 48
Figure 8. Current harvesting and projected AAC from Longuza teak plantation. .......................... 49
Figure 9. Roundwood consumption by subsectors in Tanzania, 2010. ........................................ 54
Figure 10. Utility poles demand by TANESCO in Tanzania, 2009-2011. ...................................... 55
Figure 11. Softwood sawntimber exports, 2005-2010. ............................................................ 57
Figure 12. Example of a micro-mill (“Ding dong”) at SHFP. ...................................................... 67
Figure 13. Poles treated at Sao Hill industries ready for markets. ............................................. 68

7
ACRONYMS AND ABBREVIATIONS
AAC Annual Allowable Cut CBFM Community Based Forest Management BOT Bank of Tanzania CBNRM Community-Based Natural Resource Management CBO Civil Society Organization CBU Carbon Finance Unit CDM Clean Development Mechanism CFR Catchment Forest Reserve CIFOR Centre for International Forest Research CONCERN Concern Worldwide DBH Diameter at Breast Height DCFM District Catchment Forest Manager DFO District Forest Officer DFoB Director of Forestry and Beekeeping DPs Development Partners EMA Environmental Management Act EIA Environmental Impact Assessment ERVs Exchequer Receipt Voucher EU European Union FAO Food and Agriculture Organization FBD Forestry and Beekeeping Division GBS General Budget Support GDP Gross Domestic Product HQ Headquarter HIMA Hifadhi Mazingira IRA Institute for Resource Assessment JFM Joint Forest Management JI Joint Implementation KVTC Kilombero Teak Valley Company LGA Local Government Authority LKS Lesser Known Species LMDA Logging and Miscellaneous Development Account MAI Mean Annual Increment MDA Ministries, Departments and Agencies MFA Ministry for Foreign Affairs of Finland MIS Management Information System MNRT Ministry of Natural Resources and Tourism MoFEA Ministry of Finance and Economic Affairs MPM Mufindi Paper Mills MFA Ministry of Foreign Affairs NAFORMA National Forestry Resources Monitoring and Assessment NBS National Bureau of Statistics NGO Non-Governmental Organization NIPF Non Industrial Private Forests NTFP Non Timber Forest Product NOFIA Northern Forest Industries Association NPV Net Present Value NWFP Non Wood Forest Product OECD Organization for Economic Cooperation Development

8
PES Payment for Environmental Services PFM Participatory Forest Management PM Plantation Manager RCCO Revenue Collectors Cash Office REDD Reduced Emission from Deforestation and Forest Degradation SAFIA Southern Highlands Forest Industries Association SFM Sustainable Forest Management SHFP SaoHill Forest Plantation SHIVIMITA Shirikisho la Viwanda vya Misitu Tanzania SMEs Small and Medium Enterprises SUA Sokoine University of Agriculture SWAp Sector Wide Approach TANESCO Tanzania Electricity Supply Company TAFORI Tanzania Forest Research Institute TANWAT Tanganyika Wattle Company TASONABI Tanzania Specialist Organisation on Natural Resources and
Biodoversity Conservation TCPF Forest Carbon Partnership Facility TFCMP Tanzania Forest Conservation and Management Project TFCG Tanzania Forest Conservation Group TIC Tanzania Investment Centre TNRF Tanzania Natural Resources Forum ToR Terms of Reference TP Transit Pass TRA Tanzania Revenue Authority Tsh Tanzania Shilling TTSA Tanzania Tree Seed Agency URT United Republic of Tanzania USD United State Dollar WB World Bank WWF World Wide Fund for Nature

9
PREFACE Forest resource in Tanzania is disappearing fast and the quality of forest left standing is gradually decreasing. Pressure on natural forests is growing mainly because of expansion for agriculture, encroachmment, uncontrolled wildfires and illegal harvesting. On the other hand, the public plantation forest area has remained more or less the same for the past 40 years while demand for wood raw material is growing fast. In the last few years, Tanzania has witnessed fast growth in the building and construction sector demanding a lot of wood material. Private plantation forests are also gradually growing as well as Non Industrial Private Forests (individual woodlots, farm trees and outgrower schemes). Still, there are challenges to create an enabling and more favourable environment for the private sector development. Most government plantations started and developed with support from donors and when their support ceased, performance of these plantations started to deteriorate. To date, most public plantations are in a poor state and in the past few years planting was very slow and, as a result, they are characterised by uneven age distribution. Given the economic growth and population trend, and increased number of wood processing industries, it is becoming increasingly difficult to secure enough wood raw material and this has created uncertainty for long term investments. This situation is not encouraging large scale investments and use of modern technology, and therefore Tanzania is not very attractive to invest in value added production to penetrate niche markets and increase exports and profits. Therefore, in order to provide enough wood raw material now and in the future, and stimulate growth of the forest sector, it is important to take stock of the current public forest plantations, development in outgrower schemes and woodlots and forest and tree tenure. Current financial and human resources, and incentives required are important inputs to any stratergy. It is also important to understand how the current royalty and revenues works in order to identify weaknesses. An important input to any strategy is knowledge on demand and supply scenario projections and processing capacity. For sustained economic and social development, Sustainable Forest Management (SFM) is a must. This study therefore provides an important input to the SFM strategy of Tanzania Forest Services (TFS) which was gazetted in 2010 to be established as a semi-autonomous government Executive Agency to take over most of the operational roles and functions of the Forestry and Beekeeping Division (FBD).
Acknowledgements This study would not have been completed without support and funding from the African Forest Forum (AFF), Nairobi. Forestry and Beekeeping Division staff, Plantation Managers and District Forest Officers provided useful information requested on various issues and were willing to share ideas on many aspects of the study. Their contributions were critical for the success of this study. All institutions and persons involved in the whole process are gratefully acknowledged for making important contributions to this document.

10
Executive Summary This is a study on the current status of forest plantations and natural forests in Tanzania conducted from September 2010 to June 2011. The main focus is on analysing the local supply and market demand of forest products from these forests, taking into consideration raw material supply, primary and secondary processing industry, trading and final end users. Timber demand and supply projections for the next 20 years are done for the domestic market. Other aspects studied include evaluations of the current revenue collection system and performance, income and employment situation, incentives that could promote rapid forest plantation establishment, options for improved establishment, expansion and management of public and private forest plantations, and evaluation of the current processing capacity of industrial round wood. The study started by collecting and collating available information on the forests, and on primary and secondary processing industries in Tanzania. Tables and guidelines developed together during workshop in September 2010 in Nairobi were used in data collection. In addition to the tables, a semi-structured questionnaire was used to collect additional data during field visits. FOREST PLANTATIONS SITUATION The total gross area of forest plantations in Tanzania is estimated to be about 250 000 ha. Out of this, government owns about 85 000 ha, privately owned plantations are estimated to be 40 000 ha, out-grower schemes and woodlots occupy between 80 000 and 140 000 ha in total. The most important industrial plantation species are pines (Pinus patula, P. elliottii and P. caribaea), cypress, eucalyptus and teak. Pines are the dominant species in most of the government and private plantations with about 78% of the total area planted and the remaining 22% is shared among hardwoods and other softwood species. The age structure is considerably skewed towards young age (27.4%) and older (28.1%) classes. Generally, the health of forest stands is good in most of the plantations. Most of the major diseases and insect attacks which affected plantations in early years of introduction in Tanzania have been addressed. However, fire seems to be a major problem in Tanzania’s forest plantations. Currently, the forest sector in Tanzania is financed by both the government and Development Partners (DPs) through different mechanisms. Also the private sector is financing their forestry activities through own sources, loans and grants. The development of the forest sector in Tanzania has been dominated by dependence on donor financing, and sectoral self-financing mechanisms have remained undeveloped. Financial mechanisms in place do not effectively promote long-term investment by private actors. Potential financing mechanisms include provision of bank soft loans, private sector investments and carbon finance. Over 2000 staff are employed by the central and local governments in forest management. Currently the number of professional and technical staff is not adequate to carry out forestry activities at satisfactory level. Payments for Environmental Services (PES) are considered as one of the potential economic incentive for those that manage ecosystems to improve the flow of environmental services that they provide. SUPPLY AND DEMAND OF FOREST PRODUCTS Government plantations (85 000 ha) is the major supply of wood raw material and Sao Hill Forest Plantation (SHFP) alone is currently supplying over 85% of raw material consumed by industries. Given the age structure and current harvesting levels, it is predicted that after year 2017 there will be severe deficits for some ten years to come. Only after 20 years from today the harvesting can come back to current levels. Individual private plantations/woodlots, also known as non-industrial private forests (NIPF), are currently supplying an estimated 200 000 - 250 000 m3 of roundwood. Supply forecast of roundwood from plantations until year 2030 is estimated at 2.2 million m3. At the moment (2010), government plantations supply over 70% of raw material requirement, whereas by year 2020 the same plantations will be supplying only about 40% and private forests will provide the balance. Forecasts of demand for wood from plantations in the base scenario indicate that demand will surpass supply by about 400 000 m3 by year 2030. However, if the

11
economy grows at the same pace as now, and also the population and urbanisation continue to grow, the forecast is that demand for wood from plantations will exceed supply by about 2 200 000 m3 by year 2030. This represents a deficit in the rate of establishing new plantations of about 7 000 – 8 000 ha/year. However, if demand and supply from natural forests are taken into consideration, demand will surpass supply by about 39 million m3 by year 2030. There is no reliable information on the actual supply of timber from natural forests in Tanzania. However, the annual harvestable volume in the existing production forests is estimated at 87.7 million m3. It is estimated that average industrial (commercial) roundwood extraction from the natural forest in Tanzania would be some 150 000 m3 annually. Tanzania has been exporting traditional products such as logs, sawntimber, floor boards, planks, sandalwood and poles until in the last few years when non-traditional products have been introduced. The leading export of forest products is sawn timber (rough sawn) and in 2010 Kenya absorbed some 67% of all exports. Overall assessment of revenue collection by Forest and Beekeeping Division (FBD) show a trend that revenue collection has increased from TAS 4.55 billion in 2003/04 to TAS 46.60 billion in 2009/10, the highest recorded collection so far. Most of the revenue collected comes from royalties which contributed over 92% of the total revenue collection. The annual value of goods and services generated from forestry is estimated at USD 2.2 billion which is equivalent to 20% of Gross Domestic Product (GDP) based on 2006 prices. The forest sector provides about 3 million person-years of employment. The forest based industry in Tanzania is largely dominated by sawmilling, woodworks/furniture marts and joinery. Other industries include paper, wood based and poles treatment plants. There are an estimated 512 sawmills, out of which 70% are micro-mills (“dingdongs”), 25% small and only 5% medium size mills. The capacity for production of treated transmission poles in Tanzania is about 350 000 poles annually. Mufindi Paper Mills (MPM) produces some 40 000 tons of kraft paper annually and is expected to expand its production to 100 000 tons/year. In conclusion, while the public forest plantation area has remained the same, private forest plantations are increasing fast. Efforts to promote private forest plantations should continue to meet the growing demand for wood materials. The current forest tenure which leaves most of the forest under public land contributes to the high rate of deforestation and degradation. To make the forest sector grow fast and improve its contribution to the national economy, interventions in the primary production, processing and marketing chain is necessary. This will increase the price of final products and profit to processor who can then invest in modern technology, lower production costs and produce value added products and profits will trickle down to primary producer. Given the expected severe shortage of sawlogs in the near future, there is need to improve private and public forest plantations in terms of forest management especially fire management, growing stock, use of improved seeds and germplasm. There is a need to adjust the harvestable volume to reach sustainable levels while providing time for the industries to adjust to the situation. There is an urgent need to enforce existing regulations and guidelines regarding harvesting of forests. Currently, there are many micro-mills with low recovery operating in public plantations this calls for involving private companies to invest in better technology both in machinery and training. Research is needed to bring out good and satisfactory information on technical knowledge of lesser known species,

12
1. INTRODUCTION Background Tanzania is a well-endowed country from a natural resources point of view; with its area of more than 945 000 km2 of which about 334 000 km2 was estimated to be forests and woodlands in 2010 (Table 1), representing 39.9% of the total land area (FAO, 2009). About 6% of the area consists of permanent crops, 40% of permanent pastures and 7% is inland waters. There are a number of rivers and lakes, mostly fed from the catchment forests of Tanzania. Tanzania has several distinct climatic zones which provide a wide range of opportunities. Table 1. Forestry and other area information for Tanzania, 1990 – 2010. Source: FBD, 2010. Category Areas in km²
1990 1995 2000 2005 2010
Forest 414 949 394 783 374 616 354 450 334 284
Other wooded land 181 834 165 424 149 014 132 604 116 193
Other land 289 017 325 593 362 170 398 746 435 323
Inland water bodies 61 500
Total area 947 300
Note: Forests are areas with canopy cover of over 10% and other wooded area 5-10% of canopy cover The main forest types are the extensive miombo woodlands in lowland areas across the central and southern parts of the country, the Acacia woodlands in the northern regions, the coastal forest/woodland mosaic in the east, mangrove forests along the Indian Ocean shoreline, and closed canopy forests on the ancient mountains of the Eastern Arc in the east (Akida and Blomley, 2006). Of these various forest types, 14.3 million ha are found within gazetted Forest Reserves, 2.5 million ha are proposed as Forest Reserves, and about 2 million ha are in Game Reserves or National Parks (URT, 2001; Akida and Blomley, 2006). The total area of forest plantations is estimated to be between 190 000 and 250 000 ha, made up of 85 000 ha of state managed industrial plantations, about 40 000 ha of private companies industrial plantations, and 80 000 to 140 000 ha of village and farm plantations. According to the census of 2002, the population size is now estimated at around 40.7 million and the population growth is around 2.9% per year (URT, 2010). The urbanisation rate is high; the World Bank has estimated the urban population to be around 32% (against the official 11.5%). Tanzania experiences at present an economic growth of 6.0% and a Gross Domestic Product (GDP)/capita of around USD 577 (URT, 2010), which is among the lowest in the world. The main economic sectors include agriculture, forests and hunting (24.6% of GDP), service sector including trade, transport, communication, hotel and restaurants (43.6% of GDP), and the manufacturing sector (22.0% of GDP) (URT, 2010). The forest sector has an important role to play in Tanzania’s economy. Although in absolute terms its contribution to total GDP is still low, its relative share of the GDP has increased considerably during the past 10 years, from 2.6 to 3.4%, i.e. about 35%. The performance of Tanzania’s economy has been impacted by global financial crises and a long dry spell in 2008, which saw many sectors performing relatively lower than the previous year. For example, the real GDP grew by 6.0% in 2009 compared to 7.4% in 2008. Inflationary pressure has also intensified since 2008 pushing the inflation rate to a double-digit annual average of 10.3% in 2008 and 12.2% in 2009. The government has taken various measures to address the adverse effects of the global financial crisis and there are signs that the economy is performing well today (BoT, 2010). Forest loss is estimated at over 400 000 ha per year, based on the net loss of 4.4 million ha over the past 11 years (Table 1). However, forest loss in 2003 was estimated at 91 200 ha per annum of which 60% is a result of deforestation and forest degradation. The causes of deforestation in Tanzania, according to FAO (2009), include charcoal production, forest fires, clearing for agriculture

13
and illegal logging. Charcoal production is the main cause for deforestation. To produce 1 ton of charcoal, an estimated 3.4 m3 of wood is used (Indufor, 2011). An estimated 90 % of Tanzania’s energy needs are met through the use of wood fuels. Charcoal is the single largest source of household energy in urban areas, as it is considered cheap and easy to transport, distribute and store. Between 2001 and 2007, the proportion of households in Dar es Salaam using charcoal climbed from 47% to 71%. Approximately half of Tanzania’s annual consumption of charcoal, amounting to approximately 500 000 tons, takes place in Dar es Salaam. The amount of charcoal consumed is expected to further rise in the coming years. Signs indicate that consumption levels will be increasing in both absolute and relative terms in the near and medium term future due to three main factors: (a) rapid population growth; (b) continued urbanisation; and (c) relative price increases of fossil fuel-based alternative energy sources. Other sources of energy are limited,1
and the share of bioenergy and overall energy consumption is expected to remain high.
Charcoal is generally harvested from dry (or miombo) woodlands within an area that extends up to 200 km from urban energy markets. Although some wood for charcoal is harvested (legally) from forest reserves under license from the government, the bulk is harvested in unreserved forest areas on village land, or on farmland being cleared for agriculture. In such situations, little attention is given to considerations of sustainable harvesting or longer-term forest management objectives. Continued unregulated tree removal results in deforestation and forest degradation. This, in turn, has negative impacts on the protection of water catchments and watersheds, affecting energy and water supplies alike. Objectives of the study The objectives of this assignment as specified in the Terms of Reference (ToR) are as follows: To undertake a study of the current public and private forest plantations situations, specifically
with respect to the distribution and location of these plantations, species planted and sources of seedlings and seeds, age distribution of tree species, their management and quality of stands and other features;
To undertake market surveys to determine supply scenarios and demand projections for
2015,2020, 2025, and 2030, of plantation wood volumes and trends (by tree species, private and public sources), including prices of local and imported timber and wood products and sources of such products;
To evaluate the current revenue collection systems, revenues collected annually during the last
5-10 years, licensing/concession procedures, forest/tree tenure, management arrangements and pricing mechanisms for roundwood and industrial forest products;
To provide income and employment data during the last 5-10 years and estimate the potential
for income generation and employment creation for 2015, 2020, 2025, and 2030; To evaluate and propose incentives that could favour rapid forest plantation establishment by
public and private sectors, and outgrowers’ schemes by individual farmers. In this case consideration should also be given to:
o Availability of appropriate land; o Availability of quality germplasm; o Financing for plantation forestry; o Private sector readiness in plantation forestry; o Policy and environmental issues, including land and forest and tree tenure issues,
biodiversity considerations, and legislation and governance issues; and o Potential for additional revenues from carbon trade.
To provide options for establishment, expansion and improved management of public and
private forest plantations, including ways to overcome existing and potential constraints; and,
1 Only 14% of the population has access to electricity. Approximately 65% of this is hydropower, which is becoming unreliable following shortage of rainfall and deterioration of water catchment areas. The Liquid Petroleum Gas (LPG), which is imported, is currently used by about 5% of the population (MFA 2011).

14
To evaluate the processing of industrial round wood from the plantations in the individual
countries, ownership, and its current and potential capacity, wood raw material supply (sources, types and adequacy), product lines and quality of produce, potential for future investment in the sub-sector, constraints facing the sub-sector, future of the processing industry, growth and constraints, among other key considerations.
Scope and coverage This is a study on the current status of forest plantations, woodlots and natural forests in Tanzania. The main focus is to analyse local supply and market demand of forest products from these forests, taking into consideration raw material supply, primary and secondary processing industry, trading and final end users. The current situation of government owned industrial plantations in terms of area, species composition, plantation management, financial and human resources are provided in detail. Also, the current status of commercial private industrial plantations is provided. In addition, the study provides highlights on forest royalties and revenue collection trend, socio-economic and environmental contributions from both natural and plantation forests. Due to the limited resources of the study only the most important product groups are included in the study. These products include logs, pulpwood, sawn timber, utility poles, wood based panels, papers and several value added wood products. Also wood residues are included, their availability and potential use. Timber demand and supply projections for the next 20 years are done for the domestic market. Approach to the study This study was meant to generate information on public and private plantations, woodlots and natural forests in Tanzania and on the market situation of major industrial forest products both in the domestic and international markets. In this context, therefore, the study started by collecting and collating available information on the forests, and on primary and secondary processing industries in Tanzania, in order to build an overall picture, get an understanding of available data/information and what is missing, identify areas of concentration and stakeholders for consultations, including areas for field visits. Tables and guidelines developed during a workshop in September 2010 in Nairobi were used in data collection. In addition to the tables, a semi-structured questionnaire was used to collect additional data from a sample of wood processors including sawmills, pole treatment plants, forest industry owners, traders, wood-based panels (chipboard, hardboard and plywood), and paper and paperboards. Traders visited include those trading in the domestic market as well as exporters and importers. Structure of the report This report is organized into eleven chapters, thus: Chapter 1 provides the introduction, the objectives, scope and coverage of the study and study approach. Chapter 2 provides an assessment of the current situation of forest plantations. This chapter consists of historical background of forest plantations, area and species composition and plantation management. Chapter 3 is on out-growers’ schemes and other woodlots especially on their extent and impacts, and factors shaping their growth. Chapter 4 is on forest and tree tenure. Financial and human resources for plantations and out-growers/woodlots are presented in Chapter 5, while Chapter 6 discusses incentives for plantation establishment by public/private and out-growers. Supply and demand of forest products are presented in Chapter 7. Chapter 8 is on forest royalties and other revenues. This chapter looks into the fees, licensing procedure, concessions, suggestions for improvement and revenue collections. Chapter 9 discusses socio-economic and environmental contributions of forests. Processing of produce in terms of ownership and type of industries, raw material supply, constraints and future potential are discussed in Chapter 10. Conclusions and recommendations are provided in Chapter 11.

15
2. FOREST PLANTATIONS SITUATION 2.1 Historical background Plantation forestry in Tanzania started during German rule in the early 1900s. When the British took over Tanzania (then Tanganyika) from the Germans at the end of World War I, these had already established about 80 ha of plantations (Mtuy, 1996). The British continued afforestation/ reforestation programmes, and when a plantation census was carried out in 1943, it was shown that the central colonial administration had established 2 230 ha while local governments had established 1 453 ha. The purpose of the British government was to replace trees cut during the German rule and to replant areas cleared by cultivators. During that time, i.e. before and up to the second World War, the main indigenous tree species planted were Cedar (Juniperus procera), Podo (Podocarpus gracilior), E.A. Camphor (Ocotea usambarensis), Mvule (Milicia excelsa), Cordia (Cordia abyssinica) and various mangroves, while exotic species included teak (Tectona grandis), Cassia and Eucalyptus spp. (Mtuy, 1996). Also, it was at this time that pilot plantings with various exotic species started at Olmotonyi, Rongai, Mbeya, Mufindi and Shume. After World War II, in the late 1940s, proper afforestation and reforestation plans were drawn up which resulted in the establishment of the present softwood and hardwood plantations (Mtuy, 1996). It was also realised that the rate of growth of indigenous trees was slow and it was therefore decided that fast growing exotic tree species be planted instead to complement production from natural forests. Later in the 1950s, the potential to supply plantation grown wood in deficit areas and for export was noted and plantations were therefore distributed all over the county as seen today (Figure 1). Since then, the planted area increased over time. The year of establishment of each plantation is indicated in Table 2.
Figure 1. Distribution of government forest plantations in Tanzania.

16
The objectives of establishing forest plantations are many and almost the same in most of the plantations in Tanzania. For example, in Meru, North Kilimanjaro, Shume, Kiwira, Buhindi and Rubya the objectives were to ensure sustainable supply of forest products and services to the forest based industries and communities as a whole. Mtibwa and Longuza forest plantations aimed at producing fine hardwood material on a sustained yield, both for export and local consumption, while Ukaguru forest plantation was started in order to create softwood utility timber resources for the Central and Eastern regions of the country. Establishement of Rubare forest plantations aimed at supplying fuel wood and building material, such as poles. The West Kilimanjaro forest plantation aimed at increasing the watershed protective capacity and reduce the erosion problem on the slopes of Mount Kilimanjaro. Matogoro Forest Reserve was established with the initial purpose of protecting the headwaters of eight perennial rivers and several small perennial streams and also to prevent soil erosion. For the Sao Hill forest plantation scheme, the main objective was to provide raw material to wood industries (pulp wood anmd timber), protecting water catchment areas and preventing soil erosion, improving local climate, and acting as a buffer between local people and the natural forest. Most of the funds for establishment of forest plantations came from government sources and development partners and institutions such as the World Bank. The Ministry of Natural Resources and Tourism (MNRT) finances the plantation forests in terms of staff salaries and benefits, establishment and operation costs. Some of the funds comes from Logging and Miscellaneous Development Account (LMDA) generated by the forest plantation from thinning and clear felling, and Retention Funds from the Forestry and Beekeeping Division (FBD). Revenue obtained from LMDA is used for silvicultural activities, road maintenance, maintenance of vehicles and plants, and forest protection. Other plantations such as the Meru forest plantation tries to create other sources of revenues such as camping sites and eco-tourism while the Rubya plantation includes fees from commercial business centers and fishing camps. 2.2 Location, areas and species composition 2.2.1 Total area The total gross area of forest plantations in Tanzania is estimated to be around 250 000 ha (Chamshama and Nshubemuki, 2010). The major part of the industrial forest plantations (83 000 ha) are owned and managed by the government through FBD of the MNRT. In addition to the state plantations, the private sector (such as the Tanganyika Wattle Company in Njombe District, Green Resources Ltd. and Mufindi Paper Mills in Mufindi district, Kilombero Valley Teak Company in Kilombero District and the New Forest Company in Iringa district) currently operates plantations including forest industries. These privately owned (companies and village and farm plantations) plantations are estimated to cover c. 150 000 ha (TFCMP, 2008). The most important plantation species are various pines (Pinus patula, P. elliottii and P. caribaea), cypress (mainly Cupressus lusitanica), eucalyptus (many species) and teak (Tectona grandis). Softwood plantations cover about 70 000 ha or 85% of the gross plantation area (TFCMP, 2008). A massive plantation establishment is needed to keep up with the demand of raw material for the industry. However, investments in industrial plantations are hampered by limited attention to the current operating environment (e.g. long and tedious land acquisition procedures), lack of effective communication between the private sector representatives and the Government authorities, as well as lack of data on available land for investments (i.e. reliable data on most potential areas and opportunities to expand plantation areas in the future) (MFA, 2010). The on-going National Forest Monitoring and Assessment project (NAFORMA) will prepare national maps of forests and land use. It is, however, important to note that these maps are not prepared for detailed information on lower management levels (district or village). Furthermore, they are not connected to demographic information and hence not giving insight on future land use demand by villages. Therefore, they will not give sufficient information on land availability.

17
2.2.2 Location State industrial forest plantations as well as private (Industrial and non-industrial) forests in Tanzania are scattered all over the country, at altitudes ranging from 160 to 3 125 meters above sea level. The Longuza Forest plantation is located at the lowest altitude of 160 meters above sea level, while the highest parts of the West Kilimanjaro is at an elevation 3 125 meters above sea level as indicated in Table 2. 2.2.3 Climate The climate is generally tropical with distinguishable seasons of long and short rains in the Northern parts of the country, while the further South one goes, the tendency is for one wet and one dry season. For example, the Longuza, Buhindi, Meru, Mtibwa, Rubya, Ukaguru, North Kilimanjaro and West Kilimanjaro plantations experience two rainy seasons, while the Sao Hill, Kiwira, Kawetire and Matogoro plantations have only one rain season lasting for about six months - from November to May. The Rubare forest’s prevailing easterly winds, in combination with the topography have a great influence on the rainfall pattern. Mean rainfall per year in Rubare forest ranges from 700 mm in the Eastern parts of the project area to 2 100 mm on the shores of Lake Nyanza (Lake Victoria) (Table 2). Generally, the rainfall distribution varies (considerably) from year to year and from plantation to plantation. 2.2.4 Temperature Temperatures range between 4°C minimum and 32°C maximum recorded in the North Kilimanjaro forest plantations. The average annual temperatures for the plantations are indicated in Table 2. Some plantations, such as Sao Hill, are characterised by long dry seasons. Unexpected showers can be received during the dry season and night frost may occur as in the Kiwira plantation. Seasonal trends in Kawetire show that between June to mid-August, temperatures experienced at night are very low (down to -50C) thus resulting in frosts. In some plantations, the mean day temperatures of the hottest month October/November are around 300C, with maximum recorded of 350C. In some plantations, e.g. West Kilimanjaro, temperatures within the plantation are affected by the elevation as most of the area is above 1 500 metres above sea level. 2.2.5 Soils Soils in many plantation areas are generally fertile with varying amount of organic matter, mineral content and soil pH. In Rubare forest, soils are chemically poor and have low pH due to long time of leaching and poor parent material. Together with the above, the soils vary considerably from one plantation to another as indicated in Table 2. 2.2.6 Accessibility Almost all forest plantations in Tanzania are easily accessible by roads throughout the year (Table 2). Shume can be reached by both roads and the Tanga railway, while Mtibwa forest accessibility is through the Tanzania highway road, and the Uhuru and Central railway line. In addition, there is a private airfield owned by Mtibwa sugar Estate for light aircrafts and helicopters situated just 5 km from the forest station. Two routes can access the Rondo forest; however, there is no direct public transport to the forest and part of the road is not easily passable during rainy seasons. Ukaguru forest plantation has two outlets i.e. Forest Station to Gairo via Rubeho (42 km) and Forest Station to Mvumi junction (52 km). Both roads are important to the forest plantation, but due to high maintenance costs, the forest station to Mvumi junction has been abandoned.

18
Table 2. Establishment, area (ha), location, climate, soils and accessibility of plantation forests in Tanzania. Source: FBD, 2010
Forest plantation/ management unit
Year establ
Total area (ha)
Alt range (m) Mean annual rainfall (mm)
Soils
Accessi-bility
Meru/Usa 1950’s
5 530 1 500-2 500
844-1 040
Deep, dark brown or black and well drained with pH 5.5-6.5
Easily accessible.
Buhindi
1968
3 210 1 150
1 300
Varies, sandy loam, loamy sandy & clay loam
Easily accessible.
Kiwira
1960
2 784 2 225-2 440 1 707
Thin fine dark volcanic ash with silt and organic matter
Easily accessible
Rondo 1952 2 598 870-885
1 100
Deep leached highly, porous sand soils
Not easily accessible
West Kilimanjaro 1954 6 020 1 562–3 125 700
Volcanic, porous and free draining
Easily accessible
North Kilimanjaro 1926
6 754 1 800 and 2 250 800
Volcanic, well drained and fertile
Easily accessible
Longuza 1952
2 450 160 and 560 1 500
Mainly loam soils
Easily accessible
Mtibwa
1961
1 410 640
1 200
Alluvial and fertile. pH 5-8
Not easily accessible
Rubare 1958
285 1 300
2 100-2 750
Chemically poor and have low pH
Easily accessible
Shume/Magamba 1907
4 591 1 967 and 1 970
700
Mainly loams varying in colour from red through gray brown to black with pH 3.0 to 3.5
Easily accessible
Kawetire
1937
1 956 2 235
1 099
black loam soils rich in clay particles
Easily accessible
Matogoro 1961
868 1 372-1 520
150 Clay silt soils, brownish red or yellow soils.
Easily accessible
Rubya 1951
1 906 1128
1 614 Generally fertile-deep loams
Easily accessible
Ukaguru
1950’s
1 700 1 500
1 300 Mostly deeply weathered with a lot of mica
Not easily accessible
Sao Hill 1939 45 000 1 400-2 000 750-2 010 Moderately acidic, drained & of various types
Easily accessible
2.2.7 Species composition by area Pines are the dominant species in most of the government and private plantations with about 78 % of the total area planted and the remaining 22 % is shared among hardwoods and other softwood species (Table 3). Pines are planted in all plantations except Mtibwa and Longuza forests, where

19
only hardwood species are grown with Tectonal grandis being the dominant species. Half of the plantation trees grown in Tanzania (50%) are for sawn timber, 10 % for pulpwood and the remaining 40 % are for other forest products and services, such as Kawetire forest plantation has natural forests which serve as water catchment area. Harvesting is not allowed in these areas. Table 3. Commercial plantation areas (ha) by species and management objectives. Source: Forest plantations management plans.
Forest Plantation/ Management unit
Total area (ha)
Saw timber (ha)
Pulpwood (ha)
Meru Pines Cypress Grevillea/Olea Acacia melanonoxylon Cassuarina spp Eucalyptus spp Others; Senna, Cedrella, Acacia Sub-total
950
2 080 1 285 199 205 492 352
5 563
5 563
Buhindi Pines Cedrella odorata Sub-total
3 180
38 3 218
3 218
Kiwira Pinus patula C. lusitanica & P. patula & others Sub-total
2 585 199
2 784
2 784
Rondo Pines and Cypress spp. Tectonal grandis Milicia excelsa Other hardwoods Pinus caribaea and others Tectona grandis and few others Sub-total
1 557 174 297 38
1 142 17
2 083
1 563
520
Shume Pines and Cypress spp Eucalyptus spp Juniperus procera Acacia melanoxylon Grevillea robusta Other species Cinamom camphora Acacia mearnsii Seed stands (TTSA) Trial plots under TAFORI Natural forests Sub-total
3 408 101 19 45 138 719 89 196 16 66 77
4 558
3 407
Longuza Tectonal grandis Terminalia spp Eucalyptus spp Chrolophora regia C. odorata, C. tona & T. grandis Natural forests Sub-total
1 346
12 3
<1 348 739
2 449
1 710
Mtibwa Tectona grandis Cedrella odorata Sub-total
1 354
88 1 442
1 302
Rubare Pinus caribaea Sub-total
432 432
432

20
Ukaguru Pinis patula/elliottii Cupressus lusitanica Sub-total
905 36 941
182
Matogoro Pinus patula Grevillea robusta Other species Indigenous spp Natural forests Sub-total
402 15 66 385
3 723 4 592
182
Kawetire Pinus patula Eucalyptus maidenii Sub-total
1 465 136
1 601
1 465
North Kilimanjaro Pinus patula Cupressus lusitanica Mixed softwoods Grevillea robusta Eucalyptus spp Others Natural forest Sub-total
3 304 781 585 232 131 656 193
5 883
5 689
West Kilimanjaro Pinus patula Cupressus lusitanica Grevillea robusta Eucalyptus saglina Other spp Sub-total
38 954 833 28 632
2 485
2 485
Rubya Pines Mixed pines and cedrela Sub-total
1 524 59
1 584
Sao Hill Cupressus lusitanica Pinus sp. Eucalyptus spp Sub-total
104
41 123 3 773 45 000
23 406
9 875
Grand Total
84 615 50 086 10 395
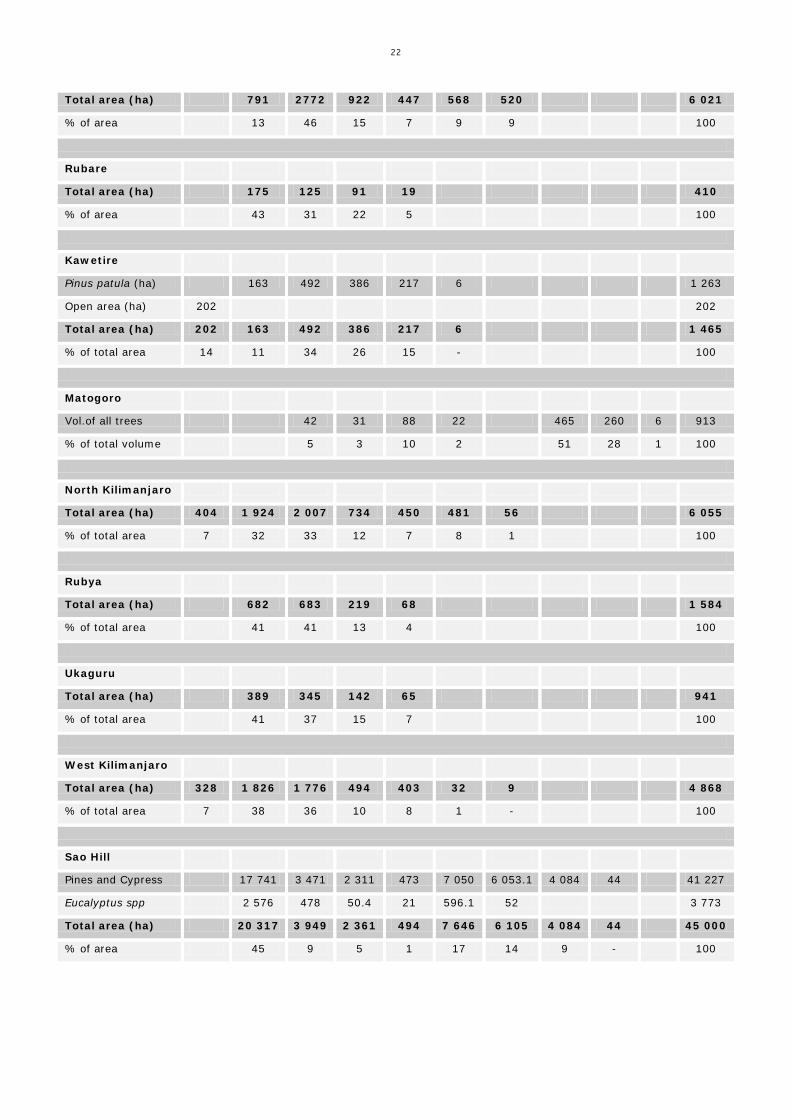
2.2.8 Age class distribution The age class distribution by species and area is presented in Table 4. Young stands (< 5 years) in all plantations constitutes 27.4% of the total area. About 22% of the total growing stock is in age class category 6-10 years, 10.9% in 11-15 years, 6% in 16-20 years, 5% in 21-25 years, 3% in 26-30 years, 9.3% in 31-35 years, 7.5% in 35-40 years, and c. 3.3% is above 41 years. Open areas of 2 106 ha constitute 6% of total area and therefore in the future if all the open areas are planted, the plantations will develop towards more even structure (normal distribution). The results show that the age structure is considerably skewed towards young (27.4%) and older (28.1%) age classes (Figure 2). Table 4. Age class distribution of trees in government plantations. Source: FBD 2010.
Project/species Area in ha; Age class in years
Open area
<5 6-10 11-15 16-20 21-25 26-30 31-35 36-40 >40 Total
Buhindi
P. caribaea 185 240 21 370 1 816

21
P. tecunumanii 744 77 81 902
P. kesiya 78 130 42 249
Other species 25 31 42 98
Total area (ha) 2 032 478 185 370 3 065
% of total 66 16 6 12 100
Rondo
P. caribaea 415 415
Tectona grandis 167 17 184
Milicia excelsa 44 146 122 312
Open area (ha) 1 172 1 172
Total area (ha) 1 172 418 211 146 122 17 2 083
% of total 56 20 10 7 6 1 100
Shume
Pinus patula 354 1 211 582 182 63 2 419
Cupressus lusitanica 295 117 29 151 281 8 881
P. patula/radiata 24 24
P. patula/C.lusit. 57 27 84
Pinus radiata 28 28
Total area (ha) 701 1 327 611 390 371 8 3 436
% of area 21 39 18 11 11 - 100
Longuza
Teak 147 23 20 28 438 575 93 1 324
Terminalia 16 2 17
Total area (ha) 163 23 20 28 438 575 94 1 341
% of area 12 2 1 2 33 43 7 99
Mtibwa
Teak 259 32 2 123 212 373 616 1 617
Cedrella 50 16 20 86.
Total area (ha) 309 48 2 123 212 373 636 1 703
% of area 18 2 - 7 13 22 38 100
Kiwira
Total area (ha) 1 132 742 588 0 2 462
% of area 46 30 24 100
Meru
22
Total area (ha) 791 2772 922 447 568 520 6 021
% of area 13 46 15 7 9 9 100
Rubare
Total area (ha) 175 125 91 19 410
% of area 43 31 22 5 100
Kawetire
Pinus patula (ha) 163 492 386 217 6 1 263
Open area (ha) 202 202
Total area (ha) 202 163 492 386 217 6 1 465
% of total area 14 11 34 26 15 - 100
Matogoro
Vol.of all trees 42 31 88 22 465 260 6 913
% of total volume 5 3 10 2 51 28 1 100
North Kilimanjaro
Total area (ha) 404 1 924 2 007 734 450 481 56 6 055
% of total area 7 32 33 12 7 8 1 100
Rubya
Total area (ha) 682 683 219 68 1 584
% of total area 41 41 13 4 100
Ukaguru
Total area (ha) 389 345 142 65 941
% of total area 41 37 15 7 100
West Kilimanjaro
Total area (ha) 328 1 826 1 776 494 403 32 9 4 868
% of total area 7 38 36 10 8 1 - 100
Sao Hill
Pines and Cypress 17 741 3 471 2 311 473 7 050 6 053.1 4 084 44 41 227
Eucalyptus spp 2 576 478 50.4 21 596.1 52 3 773
Total area (ha) 20 317 3 949 2 361 494 7 646 6 105 4 084 44 45 000
% of area 45 9 5 1 17 14 9 - 100

23
Figure 2. Overall age class distribution of government plantations. 2.3 Plantation management
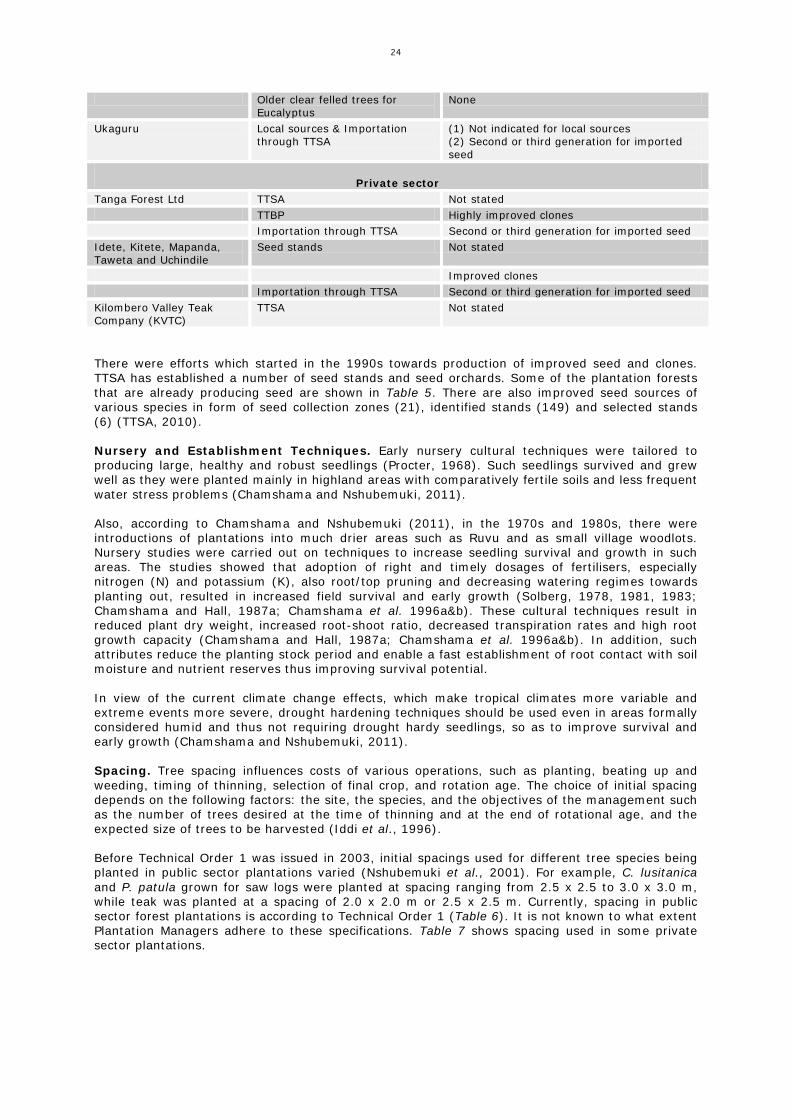
2.3.1 Establishment Seed Sources. When large-scale establishment of plantations started in Tanzania, seed require-ments were initially met by importation from the countries where the various species are indigenous (e.g. Central America, Mexico and Australia) or from South Africa, which had a longer experience with plantation forestry (Chamshama and Nshubemuki, 2011). However, in the 1970s, local seed sources, i.e. seed stands (essentially an interim seed source) and seed orchards, were established for the major species (Forest Division, 1982; Madoffe and Chamshama, 1989). Local seed sources continued to be supplemented by importation to meet domestic demand. For example, seed of Eucalyptus grandis, E. tereticornis, E. saligna, Pinus caribaea, P. elliottii, P. kesiya, P. oocarpa, P. patula, P. tecunumanii and P. taeda were imported by the Tanzania Tree Seed Agency (TTSA) between 2005-2010 (TTSA, 2010). Table 5 shows seed sources for some forest plantations. Although there is some seed importation from second and third generation seed orchards, most of Forest Plantation Managers source their seed from older stands or TTSA unimproved seed source classes as there are only four improved seed orchards of C. lusitanica, Tectona grandis, Eucalyptus tereticornis and Grevillea robusta (TTSA, 2010). The first three already produce seed. Table 5. Seed sources for planting in some public and private sector forest plantations. Sources: Angyelile (2010), Maro (2010), Mrecha (2010), Mnangwone (2010), Mussami (2010) and TTSA (2010). Ownership and name of forest plantation
Source of seed for planting
Level of genetic improvement
Public sector
Sao Hill Older clear felled trees None Local sources & Importation
through TTSA (1) Not indicated for local sources (2)Second or third generation for imported seed
Meru Local sources & Importation through TTSA
(1) Not indicated for local sources (2) Second or third generation for imported seed
SUA Training Forest Local sources & Importation through TTSA
(1) Not indicated for local sources (2) Second or third generation for imported seed
24
Older clear felled trees for Eucalyptus
None
Ukaguru Local sources & Importation through TTSA
(1) Not indicated for local sources (2) Second or third generation for imported seed
Private sector
Tanga Forest Ltd TTSA Not stated TTBP Highly improved clones Importation through TTSA Second or third generation for imported seed Idete, Kitete, Mapanda, Taweta and Uchindile
Seed stands Not stated
Improved clones Importation through TTSA Second or third generation for imported seed Kilombero Valley Teak Company (KVTC)
TTSA Not stated
There were efforts which started in the 1990s towards production of improved seed and clones. TTSA has established a number of seed stands and seed orchards. Some of the plantation forests that are already producing seed are shown in Table 5. There are also improved seed sources of various species in form of seed collection zones (21), identified stands (149) and selected stands (6) (TTSA, 2010). Nursery and Establishment Techniques. Early nursery cultural techniques were tailored to producing large, healthy and robust seedlings (Procter, 1968). Such seedlings survived and grew well as they were planted mainly in highland areas with comparatively fertile soils and less frequent water stress problems (Chamshama and Nshubemuki, 2011). Also, according to Chamshama and Nshubemuki (2011), in the 1970s and 1980s, there were introductions of plantations into much drier areas such as Ruvu and as small village woodlots. Nursery studies were carried out on techniques to increase seedling survival and growth in such areas. The studies showed that adoption of right and timely dosages of fertilisers, especially nitrogen (N) and potassium (K), also root/top pruning and decreasing watering regimes towards planting out, resulted in increased field survival and early growth (Solberg, 1978, 1981, 1983; Chamshama and Hall, 1987a; Chamshama et al. 1996a&b). These cultural techniques result in reduced plant dry weight, increased root-shoot ratio, decreased transpiration rates and high root growth capacity (Chamshama and Hall, 1987a; Chamshama et al. 1996a&b). In addition, such attributes reduce the planting stock period and enable a fast establishment of root contact with soil moisture and nutrient reserves thus improving survival potential. In view of the current climate change effects, which make tropical climates more variable and extreme events more severe, drought hardening techniques should be used even in areas formally considered humid and thus not requiring drought hardy seedlings, so as to improve survival and early growth (Chamshama and Nshubemuki, 2011). Spacing. Tree spacing influences costs of various operations, such as planting, beating up and weeding, timing of thinning, selection of final crop, and rotation age. The choice of initial spacing depends on the following factors: the site, the species, and the objectives of the management such as the number of trees desired at the time of thinning and at the end of rotational age, and the expected size of trees to be harvested (Iddi et al., 1996). Before Technical Order 1 was issued in 2003, initial spacings used for different tree species being planted in public sector plantations varied (Nshubemuki et al., 2001). For example, C. lusitanica and P. patula grown for saw logs were planted at spacing ranging from 2.5 x 2.5 to 3.0 x 3.0 m, while teak was planted at a spacing of 2.0 x 2.0 m or 2.5 x 2.5 m. Currently, spacing in public sector forest plantations is according to Technical Order 1 (Table 6). It is not known to what extent Plantation Managers adhere to these specifications. Table 7 shows spacing used in some private sector plantations.

25
Table 6. Initial spacing used in public sector industrial forest plantations in Tanzania. Source: FBD (2003).
Tree species
Type of end product Initial spacing (m)
Pinus patula, P. patula ssp. Tecunumanii P. elliottii, P. caribaea & C. lusitanica Tectona grandis & Grevillea robusta Eucalyptus species Acacia melanoxylon & Olea capensis
Saw logs Pulp wood logs Saw logs Saw logs Pulp wood logs & Poles Poles & saw logs
3.0 x 3.0 2.0 x 2.0 2.5 x 2.5 3.0 x 3.0 2.0 x 2.0 2.0 x 2.0
Table 7. Initial spacing used in private sector industrial forest plantations in Tanzania. Sources: Bekker et al. (2004), Mnangwone (2010) and Mussami (2010).
Company and Tree species
Type of end product Initial spacing (m)
KVTC Tectona grandis
Saw logs
2 x 2 m (1993-1999) 3 x 3 m (2000+)
Tanga Forests Ltd A. mangium, Eucalyptus spp, Casuariana, Tectona grandis
Saw logs, pulp wood, energy, CO2 sequestration
3 x 2 m 4 x 2 m
Idete, Kitete, Mapanda, Taweta and Uchindile Pinus patula, P. elliottii Eucalyptus camaldulensis, E. saligna, E. grandis
Saw logs, pulp wood, energy, Co2 sequestration Saw logs, pulp wood, poles, energy, Co2 sequestration,
3 x 3 m 2.5 x 2.5 m
Site Preparation Techniques and Planting. A number of studies on the effects of different site preparation techniques on early survival and growth have been carried out in Tanzania (Chamshama and Nshubemuki, 2010). Results show that rigorous site preparation such as complete cultivation (ploughing and harrowing) result in improved survival and early growth of planted seedlings (Chamshama and Hall, 1987b; Kalaghe and Mansy, 1989; Mhando et al., 1993). In almost all plantations, land preparation before planting is normally done by casual labourers under supervision of foresters. This is done by clearing, heaping and burning of debris. The “taungya” system is also used in areas where people prefer to grow seasonal crops before tree planting. The activity commences after the long rains. It has also been observed that squatters are involved in land preparation besides cultivating the land for food crops like in Ukaguru Forest plantation. In extension areas, the natural vegetation is cleared, trees are cut and piled. The heap is given time for drying until it is burnt to coincide with short rains. Many plantations were established through the “taungya” system where farmers or squatters were given temporary rights to clear, cultivate and grow agricultural crops in the forest land, and in return plant and tend tree seedlings until canopy closure (Abeli and Maliondo, 1992; Chamshama et al., 1992). After canopy closure, farmers would move to other areas requiring planting. In the past, mechanical site preparation was carried out at Sao Hill where tractors were used for strip and complete cultivation (ploughing and harrowing). Sub-soilers were also used to break compact soil layers. Currently, all public sector plantations are in the second or third rotation and site preparation mainly involves burning of logging slash before re-planting or food crop planting by taungya farmers. The resulting ash from burning is rich in base nutrients (which may be lost by leaching or surface movement). Further, hot burns (>300°C) result in volatilisation of N and sulphur (S), loss in organic matter, degradation in soil structure, reduction in macropores, erosion by wind and raindrops and decreased infiltration rates due to fire induced water repellence (SAIF, 1994). Slash disposal by burning results in reduced site productivity as shown in a recent study at Shume, North Eastern Tanzania (Mugasha et al., 2006). Site preparation at KVTC involves vegetation clearing and burning, and pre-planting herbicide (Glyphosate roundup 3 l/ha) application (Bekker et al., 2004). At Tanga Forests Ltd, site

26
preparation is done by strip or complete ploughing (Mnangwone, 2010). In Idete, Kitete, Mapanda, Taweta and Uchindile forest plantations, chemical site preparation is used and involves application of roundup (3 l/ha) to the grass followed by screefing before pitting and planting (Mussami, 2010). Proper pitting and planting is necessary to ensure high initial survival and growth. The following general rules apply (Chamshama and Nsubemuki, 2011). Pits should be large: 30 cm deep x 30 cm diameter. Roots are inserted into the pit up to the root collar, avoiding breaking, bending or crushing them. The soil is gently firmed around the roots to eliminate air pockets and bring the earth into intimate contact with the roots. While planting techniques are followed, the main problem in public sector plantations has been low planting rates leading to backlogs. Ukaguru forest plantation for example has a replanting backlog of 1 100 ha (Angyelile, 2010). Other replanting backlogs have been observed in Kiwira, Buhindi and Kawetire (Balama, 2010). Information on replanting backlogs was not available for most forest plantations. Forest Fertilisation is gaining prominence with the extension of plantations into more marginal sites and the need to enhance tree growth and maintain productivity of second and subsequent rotations. A number of reports have indicated nutrient deficiencies in first rotation stands in Tanzania (Procter, 1968; Cannon, 1985; Tangwa et al., 1988). The limiting nutrients include N, phosphorus (P) and boron (B) (Maliondo and Chamshama, 1996). However, so far fertilisers have not been used in forest plantations in Tanzania (Chamshama and Nshubemuki, 2010). Preliminary results from a trial involving P. patula interplanted with Leucaena diversifolia established at Shume, Tanzania in 1998, and assessed for four years, showed that the cumulative growth performance of the second rotation pine plantations in pure stands were generally superior to those recorded in the mixtures with Leucaena trees - mainly resulting from the underground competition for limited nutrient resources (Maliondo et al., 2007). These results were considered preliminary as further monitoring is going on (Chamshama and Nshubemuki, 2010). 2.3.2 Weeding Table 8 shows weeding techniques currently used in some forest plantations though areas weeeded were not available. Weeding ranges from intensive (chemicals or clean weeding by taungya farmers) to low intensity (spot, strip or slashing) with definite impacts on seedling survival and growth (Forest Division, 1982; Isango and Nshubemuki, 1998). Several studies have been carried out on the effects of weeding types/intensities on seedling survival and growth (Sangster, 1956; Willan, 1963; Bryant, 1968; Raunio, 1975; Maghembe, 1979; Maghembe et al., 1986; Sabas and Kalaghe, 1986; Ahimana and Maghembe, 1987). Over-all, clean weeding (manual or chemical) has been shown to result in high survival and initial growth. Spot and strip weedings are often used depending on the site, species and financial availability (Abeli and Maliondo, 1992). Even though less intensive weeding techniques are used, weeding backlogs have been reported in several public sector forest plantations (Balama, 2010).
Table 8. Weeding techniques used in some forest plantations. Sources: Angyelile 2010, Balama 2010, Kiangi 2010a, Maro 2010, Mnangwone 2010, and Mussami 2010.
Ownership and name of forest plantation
Type of weeding techniques used
Public sector Sao Hill Meru Ukaguru Matogoro Mtibwa
Taungya during first year, Spot weeding thereafter Taungya and slashing thereafter Taungya and spot weeding Spot weeding and slashing Spot weeding and slashing
Private sector KVTC Tanga Forests Ltd Idete, Kitete, Mapanda, Taweta and Uchindile
Chemical and manual (spot/complete- not indicated) Strip weeding, spot weeding and chemical weeding Spot weeding using hand hoe 1 m diameter
A recent study at Sao Hill showed that survival of P. patula and P. elliottii aged 1-5 years ranged between 61-77% (Kiangi, 2010b). Height growth was also found to be low when compared with the
27
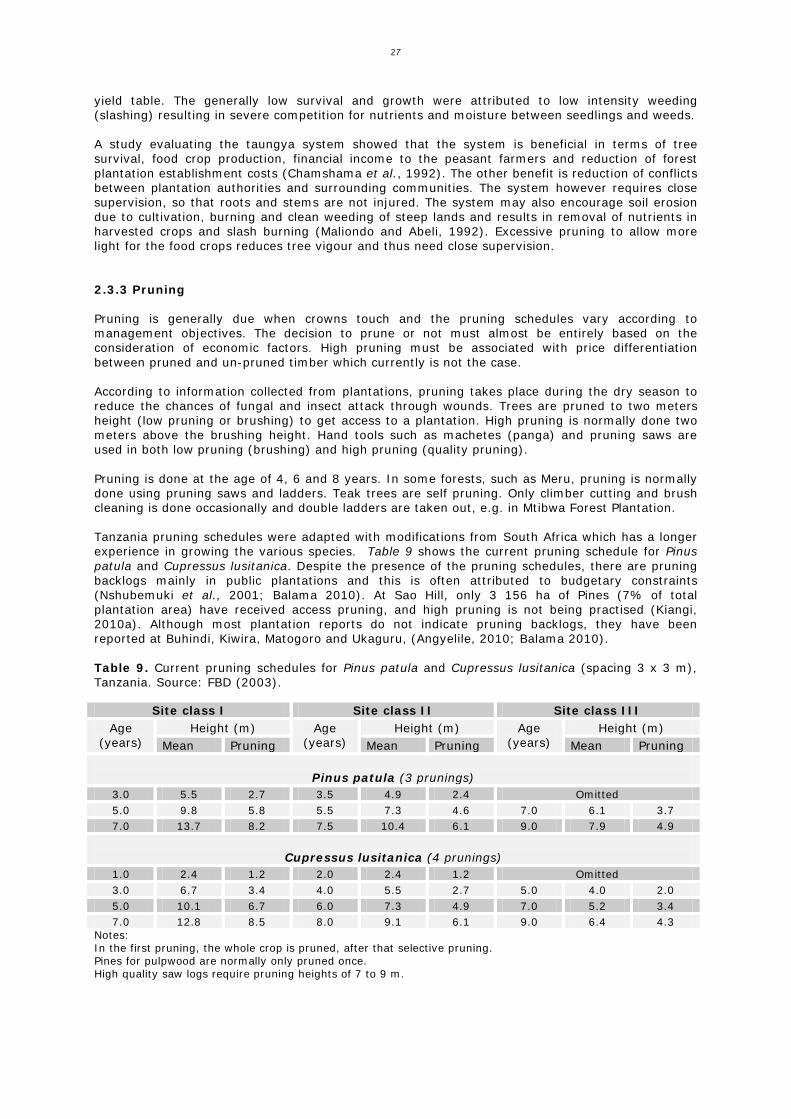
yield table. The generally low survival and growth were attributed to low intensity weeding (slashing) resulting in severe competition for nutrients and moisture between seedlings and weeds. A study evaluating the taungya system showed that the system is beneficial in terms of tree survival, food crop production, financial income to the peasant farmers and reduction of forest plantation establishment costs (Chamshama et al., 1992). The other benefit is reduction of conflicts between plantation authorities and surrounding communities. The system however requires close supervision, so that roots and stems are not injured. The system may also encourage soil erosion due to cultivation, burning and clean weeding of steep lands and results in removal of nutrients in harvested crops and slash burning (Maliondo and Abeli, 1992). Excessive pruning to allow more light for the food crops reduces tree vigour and thus need close supervision. 2.3.3 Pruning Pruning is generally due when crowns touch and the pruning schedules vary according to management objectives. The decision to prune or not must almost be entirely based on the consideration of economic factors. High pruning must be associated with price differentiation between pruned and un-pruned timber which currently is not the case. According to information collected from plantations, pruning takes place during the dry season to reduce the chances of fungal and insect attack through wounds. Trees are pruned to two meters height (low pruning or brushing) to get access to a plantation. High pruning is normally done two meters above the brushing height. Hand tools such as machetes (panga) and pruning saws are used in both low pruning (brushing) and high pruning (quality pruning). Pruning is done at the age of 4, 6 and 8 years. In some forests, such as Meru, pruning is normally done using pruning saws and ladders. Teak trees are self pruning. Only climber cutting and brush cleaning is done occasionally and double ladders are taken out, e.g. in Mtibwa Forest Plantation. Tanzania pruning schedules were adapted with modifications from South Africa which has a longer experience in growing the various species. Table 9 shows the current pruning schedule for Pinus patula and Cupressus lusitanica. Despite the presence of the pruning schedules, there are pruning backlogs mainly in public plantations and this is often attributed to budgetary constraints (Nshubemuki et al., 2001; Balama 2010). At Sao Hill, only 3 156 ha of Pines (7% of total plantation area) have received access pruning, and high pruning is not being practised (Kiangi, 2010a). Although most plantation reports do not indicate pruning backlogs, they have been reported at Buhindi, Kiwira, Matogoro and Ukaguru, (Angyelile, 2010; Balama 2010). Table 9. Current pruning schedules for Pinus patula and Cupressus lusitanica (spacing 3 x 3 m), Tanzania. Source: FBD (2003).
Site class I Site class II Site class III Age
(years) Height (m) Age
(years) Height (m) Age
(years) Height (m)
Mean Pruning Mean Pruning Mean Pruning
Pinus patula (3 prunings) 3.0 5.5 2.7 3.5 4.9 2.4 Omitted 5.0 9.8 5.8 5.5 7.3 4.6 7.0 6.1 3.7 7.0 13.7 8.2 7.5 10.4 6.1 9.0 7.9 4.9
Cupressus lusitanica (4 prunings)
1.0 2.4 1.2 2.0 2.4 1.2 Omitted 3.0 6.7 3.4 4.0 5.5 2.7 5.0 4.0 2.0 5.0 10.1 6.7 6.0 7.3 4.9 7.0 5.2 3.4 7.0 12.8 8.5 8.0 9.1 6.1 9.0 6.4 4.3
Notes: In the first pruning, the whole crop is pruned, after that selective pruning. Pines for pulpwood are normally only pruned once. High quality saw logs require pruning heights of 7 to 9 m.

28
For the private sector plantations, a pruning schedule for teak at KVTC is shown in Table 10. Areas pruned and pruning backlogs were not reported for the private sector plantations which provided information. Craib (1939) has shown that clear timber must be at least 10 cm thick for pruning to be economically justifiable. To obtain this for pruning as high as 7 m, the mean breast height diameter overbark would need to be at least 45 cm for most pines (Marsh, 1978). Other than regular thinning, rotation length must be adjusted to allow for such diameter growth (Zobel et al., 1987). Pruning trials must be developed for new species being planted in forest plantations, as a basis for developing pruning schedules. Table 10. Current pruning schedule for teak at KVTC (spacing 3x3 m). Source: Bekker et al., 2004.
Age, years Stem diameter, cm Prune to, m 4 8 2.5 6 8 5.0 8 8 7.5
2.3.4 Thinning Thinning is felling trees in a stand at any time between establishment and the initiation of a regeneration cutting or clearfelling in which trees removed are the same species as the trees favoured (Chamshama and Malimbwi, 1996). It is generally understood to take place after the onset of competition. The major objectives of thinning are (Evans, 1992; SAIF, 2000): to reduce the number of trees in a stand so that the remaining ones have more space for
crown and root development; to encourage stem diameter increment and so reach a utilisable size sooner; to remove trees of poor form; to prevent severe stress which may induce pests, diseases and stand instability; and, to provide an intermediate financial return from sale of thinnings. More trees are initially established than the required final crop, mainly to ensure sufficient trees from which the final crop can be selected, enhance early canopy closure to suppress weed growth and to utilise the site better (SAIF, 2000). Earlier thinning schedules in Tanzania’s public sector plantations, with modifications where necessary, were based mainly on South African experience. This was necessary initially as thinning experiments were just starting. The current thinning schedules are shown in Table 11 (FBD, 2003). For private sector plantations, thinning schedules for some tree species are shown in Tables 12 and 13 (Bekker et al., 2004; Mussami, 2010). Overall, the teak thinning schedules for KVTC and public sector plantations are very different. The dimensions and quality of the final crop trees arising from these schedules have not yet been evaluated. Table 11. Thinning regimes for different tree species in industrial forest plantations, Tanzania. Source: FBD (2003) Species Age (Years) Stems per Hectare P. caribaea, P. elliottii, P. Patula, P. tecunumanii and C. lusitanica (all planted at 3.0 x 3.0 m spacing)
0 10 15
25-30
1 111 650 400 0
T. grandis (planted at 2.5 x 2.5 m spacing) 0 5 10 15
30-40
1 600 800 400 300 0

29
Table 12. Thinning schedule for teak at Kilombero Valley. Source: Bekker et al. (2004) Species Age (Years) Stems per Hectare Tectona grandis at KVTC 2
8 13 20
30-32
Remove multiple stems 650 400
250-280 0
Table 13. Thinning schedule for Pinus patula at Idete, Kitete, Mapanda, Taweta and Uchindile. Source: Mussami (2010).
Species Age (Years) Stems per Hectare Pinus patula at Idete, Kitete, Mapanda, Taweta and Uchindile
0 10 14 18 25
1 600 800 500 300 0
While thinning is an important silvicultural operation, which must be done at the right time, in the right way, and with the right intensity, various reports and the authors personal observations show that thinning operations in many public plantations in Tanzania do not follow the prescribed schedules (Munishi and Chamshama, 1994; Nshubemuki et al., 2001; Balama, 2010; Kiangi, 2010a). At Sao Hill and Ukaguru, for example, thinning is never carried out (Angyelile, 2010; Kiangi, 2010a). Where thinnings have been carried out, they have been fewer and lighter than recommended, resulting in the standing volume being distributed on too many small trees rather than fewer ones of greater value per m3. The main reasons given for the neglect of thinnings are shortage of funds, lack of markets for unsawn thinnings, lack of plantation management skills and experience. No thinning backlogs were reported for the private sector forest plantations which provided information. Thinning trials should be established for the new tree species being planted in forest plantations. Meanwhile, research results or experiences from countries with similar ecological conditions should be used to prepare the schedules.
2.3.5 Forest health Generally, the health of forest stands is good in most of the plantations. However, it is generally believed that outstanding initial performance of exotic species in the areas of introduction is attributed to the absence of pests or diseases. Nonetheless, with time, diseases and or pests tend to follow (sometimes through accidental introductions) those species in their areas of introduction and hence assume economic importance. Pinus insignis (P. radiata) is believed to be one of the first pine species to be introduced to Tanzania (Anon., 1902; In: Lundgren, 1978; Schabel, 1990). For about 60 years no pests or diseases were reported. In the 1960’s, however, all areas planted with Pinus radiata had to be clearfelled following incidences of Dothistroma needle blight at Shume Forest Project in 1958. It was also attacked by the Cercospora needle blight at Sao Hill (Etheridge, 1965). As a control measure, the planting of P. radiata was banned and Pinus elliottii was introduced as an alternative species. This species soon proved to be susceptible to the pine woolly aphid, Pineus pini, infestations which also attacks P. patula. Biological control of the aphid relying on Tetraphleps raoi, and native predators has minimised the spread of infestation (Odera, 1974). Outbreaks of canker diseases caused by Monochaetia unicornis were first observed in Machakos, Kenya, in 1937 and at Shume, Tanzania, in 1943. In Geita (near Buhindi), the disease was observed in 1963 in trial plots of Cupressus arizonica, and on Ukerewe Island in a C. lusitanica plot. It was later found that C. macrocarpa and its hybrids were more susceptible to canker attack than other Cypress species. The spread of the disease was minimised by the elimination of C. macrocarpa from planting programmes, replacing the areas with C. lusitanica (Forest Division, 1982). Recent infestation of C. lusitanica by Cinara cupressi has threatened future planting programmes (FAO, 1991).

30
Some environmentalists and other members of the society claim that growing trees in plantations, and especially exotics, is dangerous because they are inherently vulnerable to diseases and pests. Partly as a consequence of this, the topic has received wide review (see e.g. Zobel et al., 1987; Evans, 1992; FAO, 2001b; Cossalter and Pye-Smith, 2003; Nair, 2003). The empirical data showed that pest outbreaks do occur in plantations of indigenous tree species and sometimes even in natural forest stands. According to Nair (2003), while plantations are at greater risk of pest outbreaks, plantations of exotics are at no greater risk than plantations of indigenous tree species because the exotic status is only one among the many determinants of pest outbreaks. In a review of pest and disease problems of forest plantations, FAO (2001b) noted that there are several major examples where plantations have faced major disease or insect problems that have stopped the use of a particular species or clones. Overall, diseases and pests have not caused such widespread damage as to seriously question plantation silviculture as a practice. Susceptibility to pests and diseases has been shown to occur under the following situations (FAO, 2001a): Failure to give proper attention to species/site matching “offsite planting”, resulting in trees
growing under stress; Use of planting stock from a narrow genetic base; Failure to maintain optimum stocking levels and tree vigour through intermediate cuttings; and Dependency on one or two species in plantation programme. Perhaps the greatest concern with regard to susceptibility to pests and diseases is the number of species used in a country’s plantation programme. Some SSA countries rely on one or two closely related species, and should a pest/disease appear, the results could be devastating (FAO, 2001a). In some plantations drought is a serious problem for the survival of young trees, especially in sandy soils along the lake shore and in rocky hill tops. In other plantations, such as Sao Hill, fire and windfalls have contributed to the degradation of health and vitality of the plantation. Wild animals around and within the forest, such as Colobus monkey, blue monkey, Baboons’, buffalo’s, waterbucks and elephants, cause damage in the forests by uprooting the trees and/or debarking the top parts of trees, especially Pinus patula. The trees are tipped or shoot broken by these animals, which result into fungal and other pathogen infection. Fire seems to be a major problem in Tanzania’s forest plantations. In the period 2005-2009, for example, close to 6 000 ha were destroyed by fire, most of it in Sao Hill (2 160 ha) and in Kilombero valley (3 300 ha). During the year 2009/10, information provided by some Plantation Managers showed that a total of c. 3 900 ha were affected by forest fires (Kiangi, 2010; Mussami 2010). Strategies need to be in place to ensure that future losses due to forest fires are minimised. Measures are normally undertaken to prevent fire occurrences and/or put off forest fires including cleaning fire breaks before the fire season, purchasing and maintaining fire fighting equipments in a good working condition ready for use in case of fire occurrence, keeping standby firefighting crews and vehicle(s) during the fire season. In addition to the above precautionary measures, forest guards are continually employed for patrolling the forest and reporting any fire incidences. 2.3.6 Maintaining long term site productivity
It is expected that some of the plantations with land set aside for expansion will be opened up for plantations. Nonetheless, future wood needs from government plantations are likely to come from existing sites, i.e. through second and subsequent rotations. The productivity of these will have to be maintained or increased to meet the increasing domestic and international demands for wood and wood products. According to Chamshama and Nsubemuki (2010), maintaining or increasing plantation productivity can be achieved by: Confining harvesting of forest products to stem wood, which generally represents a small
export of nutrients from a site; Proper harvesting planning, which, among others, includes careful re-use of extraction routes
to minimise compaction and erosion (FAO, 2001a); Slash retention on site after harvesting; and,

31
Appropriate soil conservation measures to reduce nutrient losses due to erosion (Evans, 1982; Vichnevetskaia, 1997; FAO, 2001a).
One of the few studies on productivity of second and subsequent rotations of forest plantations is that by Evans (1996) in Usutu, Swaziland. Evans found that there is no evidence of yield decline in three rotations P. patula as a consequence of plantation forestry practices. In Tanzania, only stem wood is harvested, resulting in small export of nutrients. However, harvesting planning is often poor, and slash burning after harvesting is common. These practices jeopardise long-term site productivity. For example, in a recent trial at Shume, northern eastern Tanzania, the effect of post-harvest Cupressus lusitanica slash on early growth of Pinus patula was investigated (Mugasha et al., 2006). Where slash was removed or burned, seedling volume growth (3 years) was found to be significantly poorer compared to where slash was retained. 2.3.7 Growth, yield and rotation age
Generally the growth conditions of the plantations are considered to be good with the highest growing stock in Sao Hill (92%) and lowest in Ukaguru (0.1%). Pines are the most common species grown in the plantations with a Mean Annual Increment (MAI) varying from plantation to plantation, ranging from 20-25 m³/ha/yr. Cypress has a MAI of 25 m³ per ha/yr in North and West Kilimanjaro, 14 m³ per ha/yr in the Meru forest plantations, and in Sao Hill and Shume 12 m³ per ha/yr. The mean annual increments for hardwood species ranges from 10 to 22 m³ per ha/yr in some plantations. The rotation age for softwood species is about 25 years, whereas for hardwood species rotation age varies with respect to productivity and market demand. 2.4 Forest plantation expansion 2.4.1 New areas available for forest plantation expansion Available land for expansion of both public and private plantations are indicated in Table 14. Planting in most of the government plantations continued in the clear felled areas and thus the annual planting target depends on the harvesting speed. In a few plantations, such as Sao Hill, Matogoro, Rubare and Mtibwa, planting continued in both clear felled and new expansion areas. Almost all forest plantations in Tanzania have areas set aside for expansion with the exception of Kiwira, West Kilimanjaro, Rubya, Kawetire, and Shume plantations. The total area available for all government plantation expansion is about 72 000 hectares. Replanting backlogs of the plantations was not indicated in most forest management plans. Table 14. Land available/set aside for plantation expansion in Tanzania. Source: Plantation forest management plans.
Forest plantation Area of available land
Suitable tree species for afforestation
Public plantations
Rondo 1 540 Pinus spp. and Teak
Kiwira 45 Pinus patula
Buhindi 7 570 Pinus spp.
Meru/Usa 13 Pinus spp., Grevillea and Eucalyputs spp.
Shume/Magamba 140 Pinus spp. and Eucalyptus spp.
Longuza 200 Teak and Cedrella odoratta
Mtibwa 75 Teak and Cedrella odoratta
Rubare 1 920 Pinus caribaea
Kawetire 520 Pinus patula and Eucalyptus maidenii
Matogoro 1 960 Pinus patula
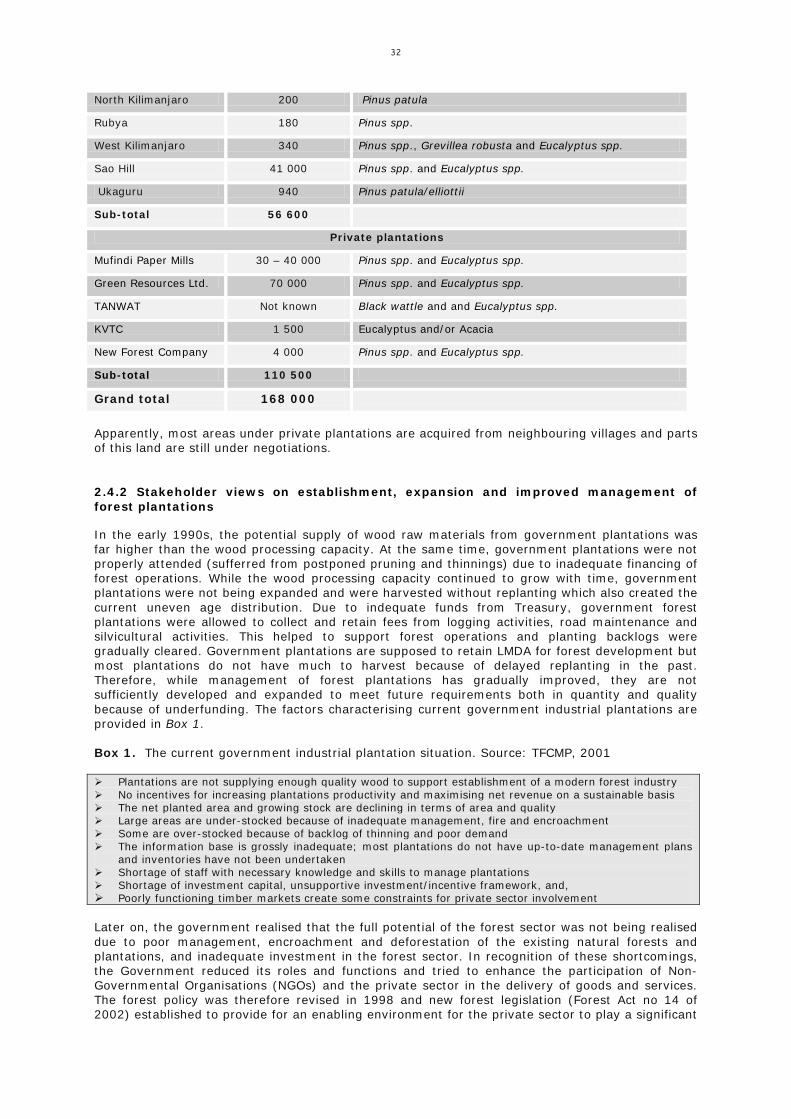
32
North Kilimanjaro 200 Pinus patula
Rubya 180 Pinus spp.
West Kilimanjaro 340 Pinus spp., Grevillea robusta and Eucalyptus spp.
Sao Hill 41 000 Pinus spp. and Eucalyptus spp.
Ukaguru 940 Pinus patula/elliottii
Sub-total 56 600
Private plantations
Mufindi Paper Mills 30 – 40 000 Pinus spp. and Eucalyptus spp.
Green Resources Ltd. 70 000 Pinus spp. and Eucalyptus spp.
TANWAT Not known Black wattle and and Eucalyptus spp.
KVTC 1 500 Eucalyptus and/or Acacia
New Forest Company 4 000 Pinus spp. and Eucalyptus spp.
Sub-total 110 500
Grand total 168 000
Apparently, most areas under private plantations are acquired from neighbouring villages and parts of this land are still under negotiations.
2.4.2 Stakeholder views on establishment, expansion and improved management of forest plantations
In the early 1990s, the potential supply of wood raw materials from government plantations was far higher than the wood processing capacity. At the same time, government plantations were not properly attended (sufferred from postponed pruning and thinnings) due to inadequate financing of forest operations. While the wood processing capacity continued to grow with time, government plantations were not being expanded and were harvested without replanting which also created the current uneven age distribution. Due to indequate funds from Treasury, government forest plantations were allowed to collect and retain fees from logging activities, road maintenance and silvicultural activities. This helped to support forest operations and planting backlogs were gradually cleared. Government plantations are supposed to retain LMDA for forest development but most plantations do not have much to harvest because of delayed replanting in the past. Therefore, while management of forest plantations has gradually improved, they are not sufficiently developed and expanded to meet future requirements both in quantity and quality because of underfunding. The factors characterising current government industrial plantations are provided in Box 1. Box 1. The current government industrial plantation situation. Source: TFCMP, 2001 Plantations are not supplying enough quality wood to support establishment of a modern forest industry No incentives for increasing plantations productivity and maximising net revenue on a sustainable basis The net planted area and growing stock are declining in terms of area and quality Large areas are under-stocked because of inadequate management, fire and encroachment Some are over-stocked because of backlog of thinning and poor demand The information base is grossly inadequate; most plantations do not have up-to-date management plans
and inventories have not been undertaken Shortage of staff with necessary knowledge and skills to manage plantations Shortage of investment capital, unsupportive investment/incentive framework, and, Poorly functioning timber markets create some constraints for private sector involvement Later on, the government realised that the full potential of the forest sector was not being realised due to poor management, encroachment and deforestation of the existing natural forests and plantations, and inadequate investment in the forest sector. In recognition of these shortcomings, the Government reduced its roles and functions and tried to enhance the participation of Non-Governmental Organisations (NGOs) and the private sector in the delivery of goods and services. The forest policy was therefore revised in 1998 and new forest legislation (Forest Act no 14 of 2002) established to provide for an enabling environment for the private sector to play a significant

33
role in the fight against fast-advancing forest destruction, realising the considerable opportunities available to boost the national economy. Efforts to privatise or involve the private sector in development and management of government industrial forest plantations started in the early 2000s through World Bank support. However, lack of an institutional framework, perceptions on privatisation and political will has made it difficult for any of the government forest plantations to be privatised or engage the private sector in development and management. Although forest plantation development by the private sector in Tanzania started with difficulties in the early 1990s, it has gradually grown. For exmple, in 1992, there were only two major companies, viz. the Tanganyika Wattle Company (TANWAT) and the Kilombero Vally Teak Company (KVTC) which operate small areas of forest plantations. Todate, these companies and others have expanded their plantations as discussed in chapter 2.4.1. The study by Kärkkäinen (2005) on the enabling environment for forest industry development in Tanzania confirmed that the Tanzanian government is providing for an enabling environment for the private sector. Efforts by the government and Devepolment Partners to engage the private sector more in forest plantations have been going on. For example, as a continuation of the study by Kärkkäinen (2005), a Public-Private Partnership (PPP) consultancy was funded in 2009 through the National Forest and Beekeeping Programme (NFBKP) by the FBD in the MNRT. The main objective of the PPP consultancy was to create an enabling business environment for the private sector so that increasing investment in timber growing and processing would take place through mutually beneficial PPP arrangements. Particularly, institutional and contractual arrangements in forest management, utilisation and marketing to enable smallholders, communities and other interested parties to seize economic benefits at local level. Among other achievements, the PPP consultancy facilitated establishment of 11 Tree Growers Associations in Iringa and Mbeya regions which have brought some individual/ farmer tree growers together. As discussed in chapter 3, tree planting by farmers and communities has taken place all over the country. The role of the private forest plantations in Tanzania, today and in future, is therefore quite siginficant as reflected in chapter 7 on supply and demand of forest products. 2.4.3 Constraints and opportunities for plantation expansion It is apparent that natural forests are descreasing and demand for forest products is growing rapidly. Forest plantations therefore have great potential to contribute significantly to the national and local economies through the supply of valuable wood products for both domestic and industrial uses as well as environmental services, income generation activities and provide opportunities for employment at local and national levels. Therefore, while the potential for forest expansion is quite high, there are many constraints which affect it and need to be addressed. One of the main constraints is inadequate investment by both the government and private sectors in forestry. Inadequate investment is reflected by poor management of the existing industrial and non-industrial plantations and availablity of potential land for expansion which has remained iddle for many years (Table 14). On the other hand, private investors are constrained by land shortage and unclear land tenure in some areas. The problem is compounded by lack of District Framework Plans (DFPs) and Village Land Use Plans (VLUPs) in many districts and villages. A district and village land use planning is critical to correct the un-availability of information regarding land for appropriate investment in private forestry at various scales. For non-industrial private plantations, there is inadequate awareness and farmers’ general knowledge of tree growing and sustainable forest management is limited. Inadequate financial incentives and limited markets for wood products from private farms, in some places due to free wood supply from public lands, limits investment in tree growing which is considered financially unattractive. Conflicting extension messages for local communities that do not address their preferences in terms of selection of species for tree planting and management of native species has not been adequately promoted as compared to planting of exotic species. Weak markets and wood processing industries, which do not provide the right signals and incentives to potential investors in terms of prices of products, quality of products demanded by customers and availability of market informations, are major constraints to the expansion of forest plantations. Some factors characterising the market and wood processing are provided in Box 2.

34
Box 2. Factors affecting marketing of wood products in Tanzania. Source: FBD (2009) and Indufor (2011). Plantations are not supplying enough quality wood to support establishment of a modern forest industry
Dwindling supply of raw material which has gradually increased logging distances and transportation to mills and hence production costs.
Poor quality of forest products caused by many factors including the quality of raw material, sawing machines, storage and expertise. Most of stakeholders reported to have little entrepreneurial skills. Also, most of producers and traders do not have good storage facilities and sell their products without adequate drying.
High prices of forest products relative to population income caused partly by increased logging, raw material and finished transportation costs, increased prices of fuel and lubricants. In addition, poor infrastructure limited producers and traders to look for cheaper means of transport.
The timing of delivering the products which is also contributed by the small volume and inconsistent production in forest-based industries.
Packaging and presentation, and export financing. Lack of appropriate trade policy. and, Cumbersome procedures and bureaucracy; trade barriers. There are considerable opportunities for expansion of forest plantations in Tanzania because of the following conditions: Availability of land, as indicated in Table 14; already, the government and private companies
have over 160 000 ha in total available for forest plantations; Market oriented economy, and growing domestic and international markets for forest products,
especially in fast growing economy countries like China. Improvements on competitiveness of Tanzanian forest products can increase the market share in international markets. Some aspects for improvement include: product cost at sawmills, quality, prices, infrastructure, forest products market information and tapping emerging markets e.g. forest certification schemes;
Supportive legal and regulatory frameworks, especially the revised national forest policy and forest act to provide an enabling environment for private sector involvement;
The country has remained politically stable since independence over 50 years ago which provide condusive environment for private investments;
Over 50 years of experience in forestry planations with a good number of trained professional and technical perssonnel, and availability of relatively cheap labour force;
Good climate and soils in selected areas producing high growth rates, and availability of silvicultural and management information for key species;
While, in general, the environment in Tanzania is condusive for promotion of plantation forestry and the private sector involvement seems to be gradually growing, there are wide perceptions by investors on risks for private sector involvement in industrial forest plantations (Table 15). Table 15. Perception on risks for private sector investment in industrial forest plantation. Table adapted from ITTO (2009).
Risk for forest investment
Low Medium High SUPRA (Macroeconomy)
Growth of GDP x Exchange Rate x Interest rate x Free Trade Agreements x Political Stability and Government Transparency x Governance issues* x Fiscal Policy x
INTER SECTOR Economic infrastructure x – Transportation x – Energy/Utility x Social infrastructure: (water, sanitation, education, health) x Licenses and permits x Labour x

35
– Laws and labour contracts x – Wages x – Labour productivity x – Labour qualification x Access to credit x Justice and law enforcement x Capital gain policy x Land and resource tenure x – Land tenure x – Land market x – Land use as collateral x Sectorial policies x – Environment policies and restrictions x – Agricultural policies and restrictions x
INTRA-SECTOR Forest Resources (availability) x Subsidies and Financial Mechanisms x Trade Restrictions (on forest products) x Markets x Entrepreneurial Development Service x Forest Vocation Land (land suitable and available for forest)
x
Legal and Institutional Basis x OTHERS
Note: How effectively government policies and measures are being implemented Some of the macroeconomic parameters posing high risks for investment include high interest rates, exchange rates, governance issues and fiscal policies. All these limits access to credit, justice and weak law enforcement and other macroeconomic parameters whose risks are perceived as medium include GDP growth rate, free trade agreements and government transparancy. At inter sectoral level, economic infrastructure especially transportation and energy utilities are also perceived as posing high risks for investment in industrial plantations. A study by Indufor (2011) has shown that in the absence of cheap alternative transport means, tranportation of sawnwood was taking up to 28% of the selling price.
3. OUT-GROWER SCHEMES AND OTHER WOODLOTS 3.1 Extent and impacts of out-grower schemes/other woodlots The national forest policy of 1998 and the forest act of 2002 provide a favourable environment for promotion of private sector involvement in tree growing, either by (i) expanding existing industrial and non-industrial plantations, or (ii) by promoting raising of tree seedlings and managing forests in private woodlots, tree farms and properties under agro-forestry and other traditional/indigenous knowledge management regimes. However, for quite some time, private small-scale tree growers have not received much facilitation and support in terms of establishing their own grassroots associations/organisations and other models. Some DPs, especially Finland, has shown interest and is working with the government to promote small scale tree farms. The number of out-grower schemes and woodlots is increasing quite rapidly in Tanzania. Some of the out-grower schemes have been facilitated by private companies such as the Kilombero Valley Teak Company (KVTC) and the Green Resources Ltd. More information on these outgrowers was not available for the time being. Currently, there is no reliable information on the distribution of out-growers and woodlots in the country. However, it is estimated that there is about 80 000 to 140 000 ha in total of village and farm plantations (Indufor, 2011). Tree planting and woodlot establishment by farmers and communities has taken place in all the districts, but particularly in the Southern Highlands, especially in Mufindi, Njombe and Makete districts in Iringa region. Local communities and
36
individual farmers represent a valuable resource which, under right incentive schemes and other forest policy instruments, can be mobilised to grow trees on a large scale and cost-efficiently. Tree planting activities in many places dates as far back as the German colonial era, when administrators and settlers planted trees in and around offices and residences. This practice was picked up by the local people who worked for the colonial administrators and settlers. After independence, the central government also encouraged people to plant trees in their homesteads (FBD, 2005). Later, with the establishment of local governments, especially district councils, nurseries were established which produced seedlings for planting in schools as well as the local residences. Furthermore, FBD (2005) reports that as tree planting became an entrenched practice by people and when seedlings were not available from local authorities nurseries, residents used seedlings self-geminating under existing trees. A few individuals also established small nurseries to produce seedlings for their own requirements and also for sale to other farmers. The situation today indicates that tree planting is practiced in most villages situated in those areas with climatic and soil conditions conducive to fast tree growth but also in harsher environments, e.g in Shinyanga and Dodoma. A survey in many places show that tree species planted include those for timber production, building poles, firewood and charcoal production, fruit trees, shade provision, and water sources protection and conservation. Tree species planted for timber production are mostly exotic species, including pines, cypress and Grevillea. Tree species planted for building, firewood and charcoal production include eucalyptus, black wattle and Cussonia spp. Trees planted for shade and water sources protection include Cussonia, Ficus, Syzygium, Albizia spp., and others. Also, people have been planting trees for other purposes as well, which may include land improvement, hedges and boundary. 3.2 Factors shaping growth of out-grower schemes and other woodlots Tree planting activities in Tanzania have been encouraged by a number of factors, including: Government policy on tree planting, the push especially being spear-headed by FBD through
extension and outreach activities. Also, the government has declared a national day for tree planting which is earmarked by each region, district, institution and organisation. It is not clear how many trees have been planted through this campaign and what the survival is, but the contribution is significant;
Donor sponsored projects e.g. Danida supported HIMA project, and MEMA in Iringa region, Sida
in Land Management Programme (LAMP) in Manyara region, IUCN in Rufiji, CARE and Wildlife Conservation Society of Tanzania in the Eastern Arc mountains, etc;
NGOs activities including Tanzania Association of Foresters - TAF, CONCERN, WWF, CARE
International, Tanzani Forest Conservation Group (TFCG), among others; Individual activities through CBOs; Growing demand for timber products and income earned by those with trees has stimulated a
lot of people to plant trees. A study by Singunda (2009) showed than 35% of family tree growers in Mufindi district are new (less than 8 years of engagement in tree planting), most of whom have been attracted by the growing demand for wood raw materials. Tree farming is reportedly ranked as a 2nd or 3rd economic activity by most of the participant farmers in Iringa region. However, during the recent past, income generated from selling tree products has shown a considerable increase thereby motivating other farmers to join tree farming as a financially attractive activity (MFA, 2010). Tree farming activities in most villages in Tanzania is carried out on the individual farmers’ initiatives and species grown for commercial purposes include pines, especially Pinus patula, cypress, eucalyptus, some grevillea and black wattle; and,
Expectations to earn income through carbon markets. Already some villages in Iringa region
through facilitation by Green Resource Ltd. have earned USD 120 000.
37
It is apparent that there are key constraints facing out-growers/small-scale farmers and woodlot owners with regard to tree planting, harvesting and marketing in Tanzania. Some of the major constraints include the following: Lack of investment capital/credit and baseline profitability calculations
o Lack of capital or access to credit facilities, partly due to lack of access to new innovative financing schemes that exist internationally;
o Lack of incentive packages; and, o Unavailability of profitability calculations for timber growing per se and in comparison
with other cash crops.
Lack of sufficient knowledge in tree growing and harvesting Most farmers do not have prior technical knowledge on tree farming other than the informal knowledge either gained through experience or from friends and neighbours. Also, they lack the necessary knowledge on the need of proper land preparation prior to field planting, and therefore, most of the farmers do not prepare the land adequately before planting. The lack of knowledge is also noted in planting spacing adopted by the farmers, and not following the various management schedules. This is partly due to inadequate technical support and extension services, especially in timber planting and harvesting activities.
Lack of inputs (seeds and appropriate tools)
The availability and use of quality seeds is one of the primary factors that influence the success of tree farming activities. The farmers in Tanzania mostly get seeds and seedlings from unreliable sources. Due to lack of knowledge, only a few farmers get their seeds from recognised sources, such as the TTSA. The farmers either opt to purchase their seedlings or set-up and maintain small nurseries to meet their own needs and sell the surplus seedlings to their neighbours. Most farmers lack the necessary knowledge and appropriate tools for nursery work.
Lack of market information, marketing and bargaining power o Lack of organised market outlets and bargaining power; o Lack of market information and price data on timber products in key markets (domestic
and neighbouring countries, e.g. Kenya); and, o Poor quality of timber and end products.
Poor infrastructure and modern technologies o Poor infrastructure (roads, railway, sea) and old fashioned timber production facilities/
technologies; and, o Inadequate land due to lack of Land Use Plans in most districts; and o Limited knowledge on woodlot maintenance practices.
The growing demand for wood products domestically and internationally, expansion of industries and carbon trade are some of potential growth factors likely to stimulate and promote out-grower schemes and woodlots in the near future.
4. FOREST AND TREE TENURE 4.1 Current forest/tree tenure systems The current forest type and tree tenure systems in Tanzania are summarized in Tables 16 and 17.

38
Table 16. Forest types and their management in Tanzania. Type of forest Managed/owned by
Type of management
Central and local government forest reserves including village forest reserves
• Central forest authorities • Local government authorities • Communities (village councils and community groups) • Private sector • Special executive agencies
• Joint Forest Management (JFM) for central and local government forest reserves • Leaseholds
Forest plantations (industrial plantations)
• Special executive agencies • Government • Private sector
• Leaseholds • Concessions • Private ownership
Private and community forests involves forestry on leasehold and village lands, including farms, natural forest on lease-hold lands, and traditional forest areas
• Local communities (village councils and community groups) • Private sector
• Village management • Leaseholds • Private ownership
Forests on general lands that have been used for shifting cultivation and grazing, charcoal and firewood collection because of lack of security of tenure and formal user rights
• Central government • Local governments • Villages • Private individuals
• Village Forest Reserves • Community-based Forest Management (CBFM) • Leaseholds • Private ownership
Table 17. Forest ownership structure (tenure).
Category of owner Area, 1000 ha Percent
Central govenment 29 335 87.8
Local govenments 1 580 4.7 Communities 2 485 7.4 Private companies 40 0.1
Total 33 400 100
4.2 Impacts of forest/tree tenure on poverty alleviation and SFM Forests are increasingly important for rural and urban livelihoods. Almost 70% of the population lives in rural areas and 80% of these depend on agriculture and natural resources for their daily needs (TNRF, 2009). Forests provide over 75% of all construction materials in the country. The majority of the communities depend heavily on forest products including firewood and charcoal (bioenergy) for their livelihoods. These communities and a large proportion of urban dwellers depend heavily on bio energy. This is the main source of energy for the rural population and accounts for about 90% of the total energy consumption in the country, and most of it comes from natural forests. Therefore, for sustained economic and social development, Sustainable Forest Management (SFM) is a must. However, it is estimated that Tanzania loses 400,000 ha of forest cover annually. Tanzania is expected to continue to experience a fast expansion in demand for wood raw materials. Illegal tree felling for charcoal and timber processing, forest clearance for livelihoods and other economic and social reasons, bush firing, forest invasion for land occupation and agriculture, are significant challenges. Declining productivity in rural areas, particularly farming, has resulted in a majority of the poor engaging themselves in forest related activities such as charcoal making, firewood and illegal timber extraction posing a big challenge to SFM. The forest reserves, like any other forest categories, suffer from encroachment, wildfires and illegal harvesting. To minimise these problems and improve forest management, the government is using a Joint Forest Management (JFM) approach for some of the Central and Local Government reserves. In this approach, forests adjacent communities enter into joint management agreements to share responsibilities, costs and benefits with the owner. It is estimated that 1 780 000 ha of forests (mostly montane and mangrove forests) are covered by JFM management plans (MNRT, 2008a). This represents 12.8% of the forest area under central and local governments. However,

39
only a few joint management agreements have so far been signed between the parties to JFM due to lack of mechanisms to guide cost/benefit sharing. Communities do not get significant benefits from these forests, which is a disincentive to them. The scope for poverty reduction through forest reserves is therefore limited. The forests under CBFM provide more benefits to communities relative to those under JFM because the former are owned and managed by the communities. There are still challenges to improve benefits also from CBFM, especially where there is little marketable resource to rely on. A study was conducted by Blomley and Iddi (2009) to review the past 15 years of PFM experience in Tanzania and assess the degree to which it has contributed to restore forests and improve livelihoods. According to this study, recent research findings show that while in relative terms forests play a much more important role as sources of cash for poor than for rich and normal households, in absolute terms richer households derive higher cash incomes from forest products. It is further reported that although forest products do not contribute much in terms of cash earnings to rural households, for the poor they deliver a significant part of their annual income. Given the rapid population growth (2.8%), increasing land scarcity, declining yields in agriculture following reduced use of fertilisers and other inputs, and demand for biomass fuels, pressure on the remaining stocks of forestland for poverty alleviation is increasing substantially. Research indicates further that it is particularly poor and vulnerable groups that increasingly seek to use forest resources, including timber, poles and non-timber forest products (NTFPs) in a bid for survival and improved livelihoods. The decline in accessible forest resources and forest land will have serious implications on the economy, poverty reduction and SFM because it is going to affect employment, revenues through sale of wood and non wood products and services, water for domestic and industrial use, irrigation agriculture and power generation. 4.3 Suggestions for improvement of tenure system As pointed out in section 4.2, unreserved and reserved forests suffer from encroachment, wildfires and illegal harvesting. About 47% of forest land is in forest reserves. However, most of the production in terms of timber harvesting, charcoal, firewood collection and NTFPs takes place in unreserved forests. Furthermore, most of the rural communities, especially the poor, depends on these forests for survival and livelihoods. Much of these unreserved forests are poorly managed and are subject to conversion to other land uses such as agriculture, large scale bio-fuel production, repeated and uncontrolled fires. In order to address some of the challenges facing these unreserved forests, communities are participating in the ownership and management of these forests through CBFM. Considering the low capability of government institutions to manage these resources to meet the growing demands for forest products and services, and the growing trends of destruction and degradations, improving and scaling up CBFM and JFM are likely to have a significant contribution to SFM. However, one of the important challenges to be addressed now is to improve benefits to communities from their engagement in conserving these forests, especially through JFM. In contrast to CBFM, JFM divides management costs and benefits between local communities and the forest owner (usually either central or local government). Most JFM initiatives to date have been concentrated in natural forest reserves (NFRs) managed for water catchment and/or biodiversity objectives, and where local use options are severely limited. Even for CBFM, the challenge to increase household income is still there because findings show that, in general, harvesting revenues through CBFM are captured at the community, rather than the individual, level and is used to sustain active forest management, and for public-good investments (schools, health, water supply, etc.) through the Village Council. In addition, participatory forest management (PFM) programmes must deliberately target the poor and marginalised in order to benefit them. Another area which needs to be addressed to improve tenure system is the harmonisation of forest and wildlife policies so that communities can enjoy multiple benefits from natural resource management. Improvement of forest cover has, in some places, increased the number of wild animals and crop raiding, thereby destroying people’s property and at times their lives. The ability of villages to generate income from these wild animals found in the forest remains limited due to the restrictive and bureaucratic rules and regulations regarding community wildlife management in Tanzania. Consequently, increase in wildlife numbers in JFM areas often represents an unwanted

40
and growing cost due to crop raiding and damage to property. This is particularly an issue with regard to larger mammals such as elephants and buffaloes, which threaten life and property. Although traditional forest management is not very much recognised, it plays an important role in the management of forests and woodlands across many parts of Tanzania. Outside any legal or formal framework, small patches of forest are managed and conserved through the use of traditional management practices, enforced through customary or traditional institutions, such as elders or spiritual leaders. As pointed out earlier, given the growing pressures on land for agriculture and demand for forest products, it is important to reinforce such traditional management with formal, legal recognition through the Forest Act to strengthen local forest management rights.
5. FINANCIAL AND HUMAN RESOURCES FOR PLANTA-TIONS AND OUTGROWERS/WOODLOTS 5.1 Current financing mechanisms Currently, the forest sector in Tanzania is financed directly by both the government and DPs through different mechanisms. Also the private sector is financing their forestry activities through their own sources, loans and grants. However, it has been difficult to get information from private companies on their budgets and expenditure. For control purposes, all revenues collected are remitted to the consolidated fund and application is submitted to the Paymaster General in the Ministry of Finance and Economic Affairs (MoFEA) for the release of the agreed amount. The government then finances conservation and management of forests under their jurisdictions through normal financing mechanism (government budget). The latest figures show that the Government has a budget of an equivalent of USD 9.9 million to manage and oversee the 30.9 million ha public forest estate, including the plantation schemes. Of this, the largest share, USD 7.3 million, is for recurrent expenditures. As a comparison, the total budget of the private forest company KVTC to run its 8 000 ha forest plantation estate was USD 800 000, of which much more than half, USD 520 000, was for development purposes. However, the government budget on forestry has consistently been less than 1% of the total national budget. Administration and management of revenue collection from forest resources is weak and the revenue collection system inefficient. It is estimated that only 5 to 10% of the revenue due from the forest reserves and general lands is collected. Furthermore, stumpage rates are determined administratively. In addition to getting funds from the government budget, the Government has introduced a revenue retention scheme to provide incentives for central government Ministries, Departments and Agencies (MDAs) to collect more non-tax revenue such as royalties, charges, licenses and fees. Under this scheme, the MDAs, including the MNRT, retain a percentage of the collection based on agreed targets to stimulate collection efforts. The MNRT has been retaining on average 75% of the revenues collected. For some collection points in the forestry sector 100% of the revenues are retained by the MNRT. However, the allocation percentage of retention scheme to the Ministry has been decreasing in recent years. Nevertheless, it is apparent that development of the forest sector in Tanzania has been dominated by a dependence on donor financing, and sectoral self-financing mechanisms have remained undeveloped. Financial mechanisms in place do not effectively promote long-term investment by private actors. A weak economy with high interest rates has also hampered domestic financing. Private sector financing has been low due to lack of appropriate financing incentives. Support from donors has been declining gradually during the past few years (FBD, 2011). Moreover, some existing international financing mechanisms, e.g. "debt-for-nature-swaps", have not been easy to be adopted by the government due to its inability to raise enough local funds to meet the required conditions (FBD, 2011). The same applies to the country’s capacity to fulfil all international obligations, conventions and other agreements. According to FBD (2011), despite the significant role of international financing of Tanzania’s forest sector, there have been some inconsistencies among development partners and the government in areas of financial management, coordination and management structures. In addition, some DP aid

41
programmes have not had in-built sustainability to allow the government to take over the activities when donor financing ceases. International support to the public sector in Tanzania comes under three funding mechanisms, viz. General Budget Support (GBS), Basket Funds/Sector Wide Approach (SWAp) and Project funding. In addition, most donors also provide direct support to civil society organisations and the private sector. GBS is the mechanism favoured by the Government and indicated in the Paris Declaration as the preferred mechanism for public sector support, it should be noted that the prerequisite for the use of GBS is that the system for management of public sector finances is adequate and fully accountable. Due to inadequate funds to support the forest sector, there are initiatives to introduce payment for environmental services (PES). Environmental services include watershed protection, forest conservation, biodiversity conservation, carbon sequestration and landscape beauty in support of eco-tourism. PES could be a direct incentive to encourage ecosystem management in ways that ensure the continued provision of the services. It is a promising conservation approach that can benefit buyers, sellers and improve the resource base.
5.2 Potential financing mechanisms Financing mechanisms in the forestry sector are challenging because of the long term investments required. That means that financing institutions and other key players need to provide a conducive environment in order to ensure development of the sector. Both issues have an equal value in the decision-making evaluation of the long-term investor’s commitment. Potential funding mechanisms include the following: Provision of bank "soft" financing. Quite often, small and medium-sized enterprises (SMEs) do not have sufficient capital and access to credit facilities at appropriate interest rates. These SMEs therefore depend on financial support. The government of Tanzania could create financial packages, which will motivate them to own or lease plantations of their own. Currently, the 18-20% interest rate in the market does not make investment in plantations viable. Support to access long-term credit by all large and small value-adding companies could help them to introduce modern technology. For example, small saw millers could be assisted to set up drying kilns. One operator suggested establishment of a special fund for a short-term credit facility to exporters to assist in processing a confirmed export order of semi-finished or finished products. Some countries, such as Poland and Brazil, have established an environmental protection bank, or a window within the normal commercial banks, which provide "soft" financing for forestry projects. This type of bank/window lending model can also be considered in Tanzania as a means for channeling investment to sustainable forestry activities. Such a bank could set up a low-interest revolving credit fund for the up-front costs associated with the transition to sustainable management, including new business costs. Private sector investments. The current growth in private investment in forestry and the extension of the global capital market into developing country economies offer potential opportunities. The challenge is to redirect and channel existing private sector resources and capital market investment vehicles and services to SFM. The private sector is increasingly involved in forest extraction and management in Tanzania and other places. Given the declining trend in public financing, the private sector will be the probable source of funds to make up for the current and possibly future shortfall of official assistance and public finance in the forestry sector. Carbon finance. Carbon finance is growing and could provide another avenue for financing forestry activities. Carbon finance facilitates the financial reward through carbon credits for the reduction of greenhouse gas emissions by emitters in developing countries. Credits are awarded to countries, groups or individuals who have reduced their green house gases below their emission quota. Carbon credits can be traded in the international market at their current market price. For over 10 years now, the World Bank (WB) has been using a variety of carbon funds and facilities through the World Bank Carbon Finance Unit (CFU) to purchase project-based greenhouse gas emission reductions in developing countries and countries with economies in transition. The emission reductions are purchased within the framework of the Kyoto Protocol's Clean Development Mechanism (CDM) or Joint Implementation (JI). The carbon funds used by the WB are contributed by governments and companies in Organization for Economic Cooperation Development (OECD) countries. Carbon funds and facilities under World Bank management have grown from USD 145 million to USD 2.3 billion since 2000 (World Bank, cited on 21.05.2011). This
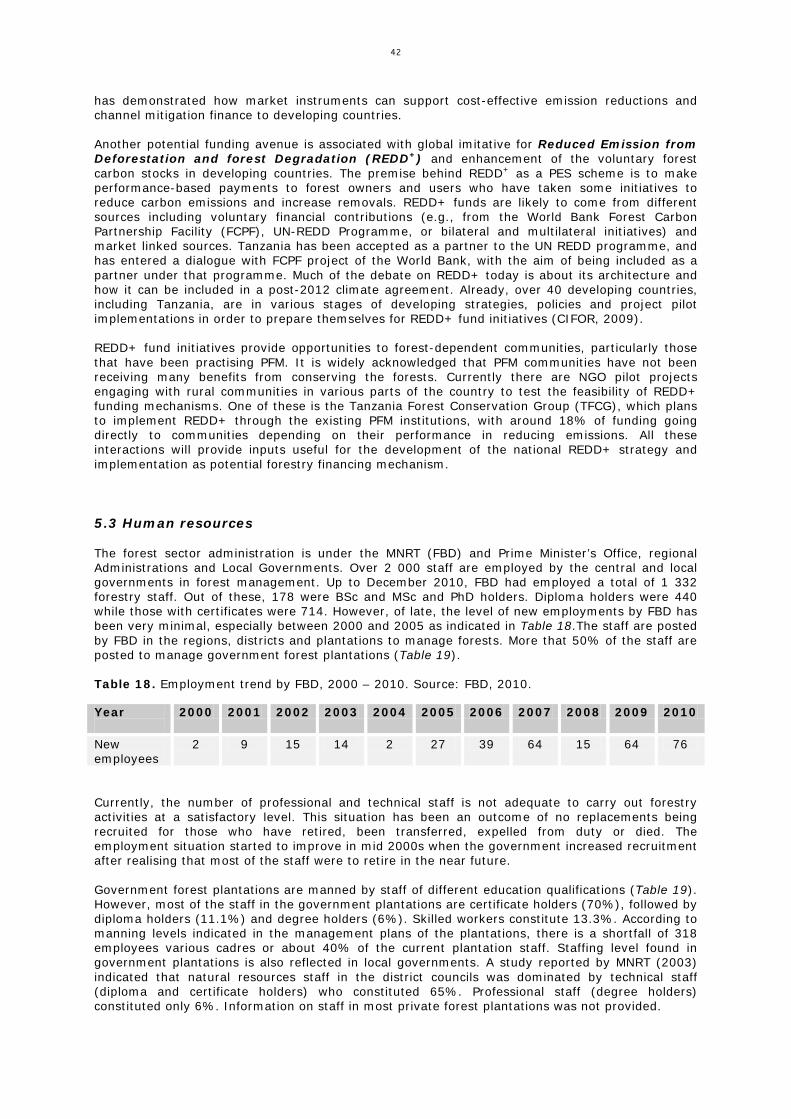
42
has demonstrated how market instruments can support cost-effective emission reductions and channel mitigation finance to developing countries. Another potential funding avenue is associated with global imitative for Reduced Emission from Deforestation and forest Degradation (REDD+) and enhancement of the voluntary forest carbon stocks in developing countries. The premise behind REDD+ as a PES scheme is to make performance-based payments to forest owners and users who have taken some initiatives to reduce carbon emissions and increase removals. REDD+ funds are likely to come from different sources including voluntary financial contributions (e.g., from the World Bank Forest Carbon Partnership Facility (FCPF), UN-REDD Programme, or bilateral and multilateral initiatives) and market linked sources. Tanzania has been accepted as a partner to the UN REDD programme, and has entered a dialogue with FCPF project of the World Bank, with the aim of being included as a partner under that programme. Much of the debate on REDD+ today is about its architecture and how it can be included in a post-2012 climate agreement. Already, over 40 developing countries, including Tanzania, are in various stages of developing strategies, policies and project pilot implementations in order to prepare themselves for REDD+ fund initiatives (CIFOR, 2009). REDD+ fund initiatives provide opportunities to forest-dependent communities, particularly those that have been practising PFM. It is widely acknowledged that PFM communities have not been receiving many benefits from conserving the forests. Currently there are NGO pilot projects engaging with rural communities in various parts of the country to test the feasibility of REDD+ funding mechanisms. One of these is the Tanzania Forest Conservation Group (TFCG), which plans to implement REDD+ through the existing PFM institutions, with around 18% of funding going directly to communities depending on their performance in reducing emissions. All these interactions will provide inputs useful for the development of the national REDD+ strategy and implementation as potential forestry financing mechanism. 5.3 Human resources The forest sector administration is under the MNRT (FBD) and Prime Minister’s Office, regional Administrations and Local Governments. Over 2 000 staff are employed by the central and local governments in forest management. Up to December 2010, FBD had employed a total of 1 332 forestry staff. Out of these, 178 were BSc and MSc and PhD holders. Diploma holders were 440 while those with certificates were 714. However, of late, the level of new employments by FBD has been very minimal, especially between 2000 and 2005 as indicated in Table 18.The staff are posted by FBD in the regions, districts and plantations to manage forests. More that 50% of the staff are posted to manage government forest plantations (Table 19). Table 18. Employment trend by FBD, 2000 – 2010. Source: FBD, 2010.
Year
2000 2001 2002 2003 2004 2005 2006 2007 2008 2009 2010
New employees
2 9 15 14 2 27 39 64 15 64 76
Currently, the number of professional and technical staff is not adequate to carry out forestry activities at a satisfactory level. This situation has been an outcome of no replacements being recruited for those who have retired, been transferred, expelled from duty or died. The employment situation started to improve in mid 2000s when the government increased recruitment after realising that most of the staff were to retire in the near future. Government forest plantations are manned by staff of different education qualifications (Table 19). However, most of the staff in the government plantations are certificate holders (70%), followed by diploma holders (11.1%) and degree holders (6%). Skilled workers constitute 13.3%. According to manning levels indicated in the management plans of the plantations, there is a shortfall of 318 employees various cadres or about 40% of the current plantation staff. Staffing level found in government plantations is also reflected in local governments. A study reported by MNRT (2003) indicated that natural resources staff in the district councils was dominated by technical staff (diploma and certificate holders) who constituted 65%. Professional staff (degree holders) constituted only 6%. Information on staff in most private forest plantations was not provided.

43
Table 19. Professional human resource in government forest plantations. Source: Plantation management plans.
Public Forest plantation
Degree holders
Diploma holders
Certificate holders
Skilled workers
Staff deficit
Buhindi 1 2 30 6 3
Kiwira 1 3 10 1 18
Meru 2 13 46 20
Shume 2 4 7 1 25
Longuza 2 4 16 6 15
Shume 2 6 32 6 25
Ukaguru 1 2 16 2 8
Rubare 3 2 7 1 2
Mtibwa 2 3 19 1 15
Kawetire 3 7 33 8 14
North Kilimanjaro 2 11 42 10 38
Matogoro 3 1 14 4 5
Rubya 1 6 19 3 8
West Kilimanjaro 8 5 43 7 32
Rondo 1 4 4 4 12
Sao Hill 13 15 213 25 113
Total 47 88 551 105 318
As % of total staff 6.0 11.1 69.6 13.3
5.4 Other resources Other resources required for management of forests include transport (vehicles, motorcycles and bicycles), offices and facilities. The results of this study have revealed that government forest plantations, regions and districts are severely constrained in terms of transport. Each management unit (forest plantation, region or district) require at least one vehicle for the management of natural forest resources. While the situation is relatively better in government plantations, it is worse in the surveyed districts. Most of the districts do not have reliable transport. Availability of offices is generally better for both central and local governments. A survey conducted in 21 districts by MNRT (2003) found that, on average, each district had five available rooms allocated for natural resources’ offices, while the requirement was eight rooms. Other facilities found in the offices to support forest management included computers, telephones, radio calls, photocopier and fax machines. Most local governments are severely constrained in office facilities while others are relatively better, especially those who had or have donor funding in the district natural resources department.

44
6. INCENTIVES FOR PLANTATION ESTABLISHMENT BY PUBLIC/PRIVATE SECTOR AND OUTGROWERS 6.1 The rationale behind incentives 6.1.1 The concept of incentives To be of interest and to have an impact, incentives need to improve the relative attractiveness of forest plantation development. Sargent (1994) defines incentives as signals that motivate action. In the context of forest plantation establishment, incentives can act as policy instruments that increase the comparative advantage of forest plantations and thus stimulate investments in plantation establishment and management. This means that incentives in plantation establishments are more than subsidies that are viewed as payments for services provided to reduce the costs or raise the returns of an activity (Enters et al., 2004). The broader definition includes research and extension, which are important elements in supporting plantation development. 6.1.2 Why incentives in forest plantation establishment Where plantations provide environmental services, such as watershed protection and carbon sequestration, incentives are appropriate because private net returns are often lower than social returns. Incentives that fall into this category include those offered under the Agricultural Conservation and the Forest Conservation Programmes in Asian and African countries. In each of these cases, incentives bridge the divergence between public and private goals and support activities that are primarily in the public interest. Incentives are not needed when the private returns from plantation management exceed those from other land uses (Haltia and Keipi, 1997; Williams, 2001) but are justified to increase the pace of plantation development in developing countries where the potential for forest based supplies and services has increased in recent years. 6.2 Current incentives: impacts and effectiveness In the late 1990s, the National Macroeconomic Policy Framework recognised the need for a strong private sector and individuals in plantation forest investment. As a result, the Forest Policy 1998, which is currently under revision, is very supportive to provide a legal incentive structure for private sector involvement in forestry investments. Among others, the policy direct promotion of: financial incentives including credit and other financing mechanisms for forest industries; access to markets and market pricing of products as well as effective training and extension; facilitation of cooperation between forest administration and relevant private sector actors as
well as establishment of joint ventures between private sectors; and, provision of reliable information to those who want to invest in forest plantation. The regulatory framework facilitates appropriate lease and concession arrangements to be developed (MNRT, 2008b). It can therefore be inferred from a policy perspective that forest policy is in place with regard to promotion of forest plantation investment in Tanzania. However little has been done to translate the enabling policy environment into action on the ground. Currently, only four major large scale private investors in Tanzania are fully recognised as forest plantation investors. These include Tanganyika Wattle Company (TANWAT), the Green Resources Ltd., the Kilombero Valley Teak Company (KVTC) and the New Forest Company. Nevertheless, challenges related to the process of land acquisition for large scale plantation establishment, which involved bureaucratic procedures, have been reported by the Green Resources Ltd. Payments for Environmental Services (PES) are one type of economic incentive for those that manage ecosystems to improve the flow of environmental services that they provide. Generally,

45
these incentives are provided by all those who benefit from environmental services, which include local, regional and global beneficiaries. PES is an environmental policy tool that is becoming increasingly important in developing and developed countries. Hundreds of PES schemes are now ongoing all over the world. Buyers, from local water-depending industries to climate aware companies in distant countries, from international conservation organisations to national governments, are increasingly aware of this opportunity and invest in their present resource needs and future local and regional environment. Tanzania is currently piloting PES schemes in the Pangani basin. The following shortcomings are critical with regard to investment in forest plantations: The concept of SFM to commercial private smallholder forestry investors is lacking and not yet
reflected enough in the contemporary Forest Policy; Poor market and price knowledge; limited bargaining power, especially to the private small-
holder investors and emerging tree growers at local level; Technical guidelines and extension services are lacking; Poor seeds, fire damages, poor know-how on establishment and tending of stands; No financial instruments in Forest Regulations to facilitate investments in pulp and saw log
production, which take 8 to 20/25 years to mature; and, Smallholders cut their trees very prematurely due to acute cash needs. 6.3 Suggestions for improvement of incentives The general suggestion to enhance incentives in establishment of forest plantations is to make use of the supportive policies environment to accelerate involvement of private companies, smallholder groups and individuals to invest in forest plantations. More specifically, the following aspects are pertinent to enhance incentives in forest plantation investment: Establishment of land banks. According to the land law, the process of land acquisition and ownership in the country involve a number of processes viewed as disincentives to new investors in forest plantations. Accordingly, the Tanzania Investment Centre (TIC), which is the primary Government agency mandated to coordinate, encourage, promote and facilitate investments in Tanzania and advise the Government on investment matters, is in a good position to smoothen the process. TIC could create so called “land banks” by mediating the whole process involved in land acquisition and ownership for forest plantation investors. Availability of grants to low-income investors. The long period in plantation establishment (at least six to eight years even for fast-growing species) is a problem for communities and small-scale investors who have tenure security of land but limited income alternatives. To overcome pressing cash flow problems of low-income small-holders, Government or donor grants are likely to be an important incentive tool for plantation establishment. Access and provision of improved seed materials. More recently, free or subsidised seedlings constitute physical incentives. These practical incentives have appeal in less developed environ-ments, where more bureaucratic incentives (e.g. loans), requires competition and paperwork which may intimidate small-scale investors.
7. SUPPLY AND DEMAND OF FOREST PRODUCTS 7.1 Suppy scenarios and projections 7.1.1 Government plantations supply Government plantations is the major source of supply of raw material and information available from the plantation managers and from the FBD shows that the total plantation area is some 85 000 ha. The total area of the Sao Hill Forest Plantation (SHFP) alone is about 50% of the total government planted area and is therefore the major wood supply. It is currently supplying over 85% of raw material consumed by industries (Table 20).

46
Table 20. Distribution of government forest plantations. Source: FBD, 2010. Plantation Location Area
(ha) Growing
Stock (1000 m3)
AAC 2009 (1000 m3)
Processing Capacity
(1000 m3) Sao Hill Iringa 44 000 10 232 1 035 1 619 Meru/Usa Arusha 5 710 419 14 150 North Kilimanjaro Kilimanjaro 6 200 394 25 306 West Kilimanjaro Kilimanjaro 6 019 303 18 30 Buhindi Mwanza 3 210 247 30 109 Kiwira Mbeya 2 637 119 2 2 Rondo Lindi 2 599 28 1 0 Kawetire Mbeya 1 956 128 8 0 Rubya Mwanza 1 906 126 5 0 Shume/Magamba Tanga 3 804 317 15 80 Longuza Tanga 2 450 156 18 18 Ukaguru Morogoro 1 700 19 0 0 Mtibwa Morogoro 1 410 87 24 10 Matogoro Songea 868 23 5 0 Ruvu-Woodfuel Coast 633 0 0 0 Rubare Kagera 285 37 0 0
Total 85 387 12 634 1 200 2 323 According to the available information, all the government plantations have a forest management plan (mainly prepared in 2008 and covering a range of 5 years, i.e. until 2012). The annual allowable cut (AAC) used in this study from each plantation were in principle derived from the existing forest management plans. In some cases, plantation managers supplied update information and that has been used. Also same sources were used to get harvesting volumes. In addition, some of the Forest Managers visited explained that forest management plans and AACs are always planned but the actual harvesting volumes vary from year to year. It is important to monitor that the harvesting volumes do not (constantly) exceed the sustainable harvesting potential. It was found out that all the plantations have currently a suboptimal age structure and, according to the management plans, they are managed with the intention to reach a normal forest age distribution structure. Where all the age classes are represented in equal shares, a stable production can be achieved. A detailed examination of some of the government plantations is provided below in order to provide a brief picture on the current status of harvesting and plantation stands.
Figure 3. Annual allowable cut, Sao Hill forest plantation. Source: Indufor, 2011.
0
200 000
400 000
600 000
800 000
1 000 000
1 200 000
1 400 000
m 3
Sao Hill Harvesting Sao Hill AAC

47
Sao Hill Forest Plantation has mainly pine plantations and some areas of eucalyptus and other species. There has been a significant increase in harvesting levels at SHFP since 2006 (Figure 3). The AAC was increased in 2006 to 600 000 m3. However, current harvesting level stands at 1 million m3.
Figure 4. Wood consumption from Sao Hill forest plantations, 2010. Source: Field survey, 2010. The available information indicates that Mufindi Paper Mills (MPM) consumes some 250 000 m3, Sao Hill Industries about 100 000 m3 and small and medium size saw millers consume an estimated 650 000 m3 (Figure 4). At the moment these industries are expanding their production capacity which means that demand for raw material is likely to increase. Sao Hill Industries has a 300 000 m3 annual supply contract with the government for 20 years. Also, MPM has plans to increase the production capacity of the mill from 40 000 tons to 100 000 tons. This would increase the pulp wood consumption to 750 000 m3 and, additionally, the fuel wood consumption increases to some 300 000 m3. Therefore, demand for wood from SHFP in the next few years will significantly exceed the capacity of the plantation supply.
Figure 5. Age class distribution of Sao Hill pine forest pPlantation, 2010. Source: Indufor, 2011. The age distribution of Sao Hill plantations is shown in Figure 5. It is apparent from the age structure that the plantation is skewed towards mature and young stands, and very little in between. Most of the harvesting is now taking place in the mature age stand and if the current harvesting of one million m3 continues it is likely that the mature stands will be cleared in a few

48
years from now. Then there will be a big gap when SHFP will only be able to supply very little. Given the age structure and current harvesting levels, it is predicted that after year 2017 there will be a severe deficit for some 10 years to come if this scenario takes place. Only after 20 years from today harvesting can rise back to current levels.
0
10 000
20 000
30 000
40 000
50 000
60 000
70 000
m3 North Kilimanjaro
Harvesting
North Kilimanjaro AAC
Figure 6. Current harvesting and projected AAC from North Kilimanjaro forest plantations. Source: Indufor, 2011.
North and West Kilimanjaro Plantations. The available data from these plantations indicate that harvesting levels have been going down due to unavailability of raw material (Figures 6 and 7). Plantations are currently very young due to renewal in the past 10 years. It seems the harvesting levels will rise again, but this will take time.
0
5 000
10 000
15 000
20 000
25 000
m3 West Kilimanjaro
Harvesting
West Kilimanjaro AAC
Figure 7. Current harvesting and projected AAC from West Kilimanjaro forest plantations. Source: Indufor 2011.
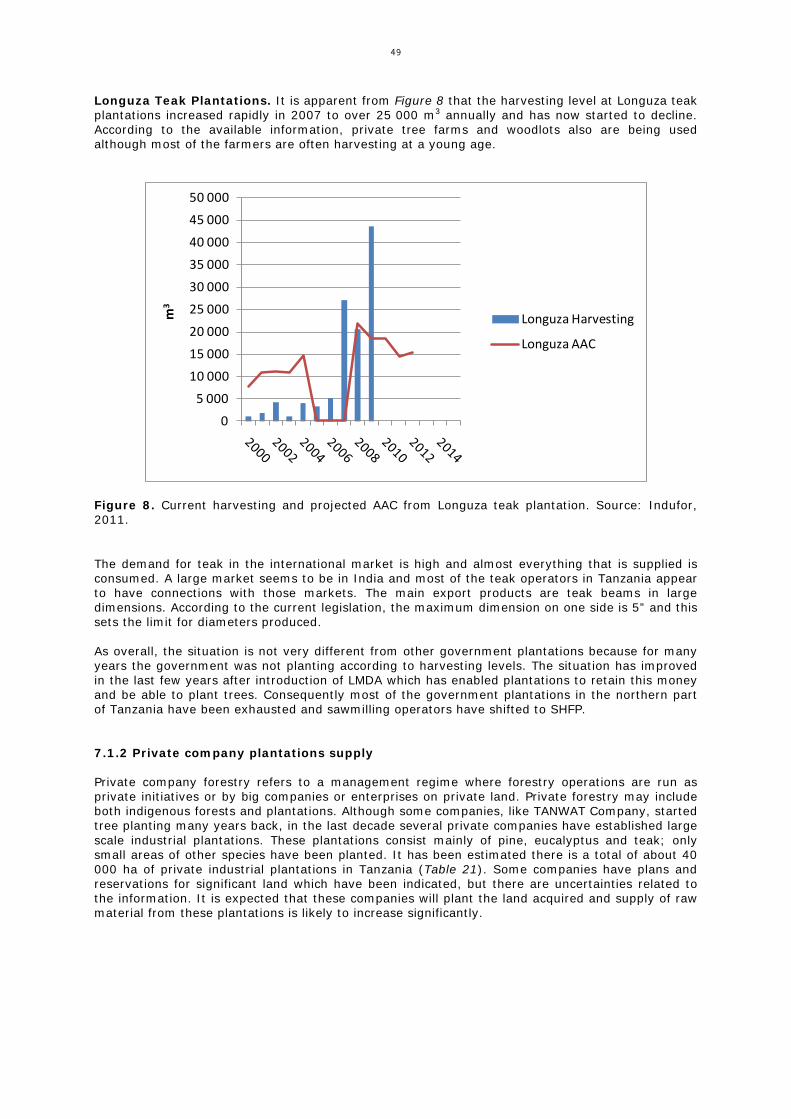
49
Longuza Teak Plantations. It is apparent from Figure 8 that the harvesting level at Longuza teak plantations increased rapidly in 2007 to over 25 000 m3 annually and has now started to decline. According to the available information, private tree farms and woodlots also are being used although most of the farmers are often harvesting at a young age.
0
5 000
10 000
15 000
20 000
25 000
30 000
35 000
40 000
45 000
50 000
m3
Longuza Harvesting
Longuza AAC
Figure 8. Current harvesting and projected AAC from Longuza teak plantation. Source: Indufor, 2011.
The demand for teak in the international market is high and almost everything that is supplied is consumed. A large market seems to be in India and most of the teak operators in Tanzania appear to have connections with those markets. The main export products are teak beams in large dimensions. According to the current legislation, the maximum dimension on one side is 5” and this sets the limit for diameters produced. As overall, the situation is not very different from other government plantations because for many years the government was not planting according to harvesting levels. The situation has improved in the last few years after introduction of LMDA which has enabled plantations to retain this money and be able to plant trees. Consequently most of the government plantations in the northern part of Tanzania have been exhausted and sawmilling operators have shifted to SHFP. 7.1.2 Private company plantations supply Private company forestry refers to a management regime where forestry operations are run as private initiatives or by big companies or enterprises on private land. Private forestry may include both indigenous forests and plantations. Although some companies, like TANWAT Company, started tree planting many years back, in the last decade several private companies have established large scale industrial plantations. These plantations consist mainly of pine, eucalyptus and teak; only small areas of other species have been planted. It has been estimated there is a total of about 40 000 ha of private industrial plantations in Tanzania (Table 21). Some companies have plans and reservations for significant land which have been indicated, but there are uncertainties related to the information. It is expected that these companies will plant the land acquired and supply of raw material from these plantations is likely to increase significantly.

50
Table 21. Information on selected industrial plantations.
Plantation Owner Planted area, (ha)
Species
Tanganyika Wattle Company 14 500 Acacia melanoxylon, Pinus patula, wattle Green Resources Limited 12 000 Pinus patula, Eucalyptus spp and small areas of local
and exotic hardwoods. Kilombero Valley Teak Company
8 150 Tectona grandis
Mufindi Paper Mills (MPM) 3 600 Pinus patula, Eucalyptus spp The New Forest Company 1 500 Pine spp and Eucalyptus spp
Total 39 750 The area planted by private companies is still small and a massive plantation establishment is needed to keep up with the demand of raw material for the industry. However, investments in industrial plantations are hampered by limited attention to the current operating environment (e.g. long and tedious land acquisition procedures), lack of effective communication between the private sector representatives and government of Tanzania authorities, as well as lack of data on available land for investments (i.e. reliable data on most potential areas and opportunities to expand plantation areas in the future). 7.1.3 Non-industrial private plantations supply Individual private plantations/woodlots, also known as non-industrial private forests (NIPF), are currently supplying an estimated 200 000 - 250 000 m3 of roundwood in the Southern Highlands area of Tanzania. A few of these individuals own up to some hundred hectares but most of them are having fairly small woodlots (varying from a few tens of hectares to individual tree groups). The actual information regarding the number and how large area each individual owns is not available in Tanzania. However, small scale tree farmers/woodlot owners cut their trees very prematurely due to acute cash needs and poverty (Msemo, 2008). A study conducted by Singunda (2010) in Mufindi district revealed that 28.1% of the respondents owned between 0 and 4 ha, 22.6% owned between 4.4 and 8.4 ha, 14.8% owned between 8.8 and 12.8 ha, 15.2% owned between 13.2 and 17.2 ha, 11.9% owned between 17.6 and 21.6 ha, and 7.4% owned more than 22 ha. The average land area per household across the surveyed area was 6.8 ha out of which the average land planted with woodlots in the surveyed area was about 2.6 ha. Most of these NIPF are planted with pines and eucalyptus spp. Overall, there are several small scale woodlots and medium sized plantations in Tanzania owned by smallholders, communities, districts, private companies, schools and faith based organizations. The total area of such woodlots is estimated at 120 000 to 140 000 ha. 7.1.4 Natural forests supply There is no reliable information on the actual supply of timber from natural forests in Tanzania. The total productive forest area is estimated to be about 23.8 million ha (URT, 1998). Some 9.3 million ha are central government forests (in 223 production forest reserves) (TFCMP, 2007) and local governments own 169 forest reserves whose total area was estimated at 1.58 million ha in 2001. Most of these forest reserves produce on average between about 4.5 and 5.5 m3/ha of wood annually (FBD, 2003; TFCMP, 2007) and are regarded as a major source of revenue from charcoal and timber sales in the districts. The remaining 12.9 million ha is general land which also supplies significant amounts of charcoal, firewood and timber. The forests on general land are relatively less stocked at the moment and are assumed to produce between 1 and 3 m3/ha of wood annually (TASONABI, 2008). Therefore, the annual harvestable volume in the existing production forests is estimated at 87.7 million m3. However, based on harvesting reports available at FBD from 21 separate districts, an average of about 1 200 m3 of logs are produced annually from each district. Some districts produce very little while others produce more. Although only 35 districts received funds for harvesting from FBD in 2009, interviews with different stakeholders indicate that harvesting takes place in almost every district with natural forests regardless of whether it is a reserve or a production forest. Based on

51
these interviews, a conservative figure of 50% of the districts (70) is assumed to be harvesting. Illegal harvesting is also common in these forests. Therefore, the official figure reported above (1 200 m3) is considered as an underestimate. Based on previous studies (e.g. FBD, 2003; Milledge et al., 2007) and forest inventory reports of 11 districts, we can conservatively assume that 50% of the volume is not recorded. Therefore, current volume harvested annually from natural forests in each district is estimated to be between 1 200 - 2 400 m3. This gives a conservative estimate of between 84 000 and 168 000 m3 of hardwood logs produced annually. Based on the same district reports, about 20% of the volume is annually harvested for poles and other woods, i.e. 17 000 to 34 000 m3. Thus, on average, the industrial (commercial) roundwood extraction would be some 150 000 m3 annually from natural forests in Tanzania. A Study by Milledge and Kaale (2005) suggests the actual harvesting level could be 5 times larger in a certain area than the recorded or official harvesting. Another way to compare the licensed and actual harvesting is to look at the industry structure and registered production capacity. A study by FBD (2005) on evaluation of sawmills and other primary wood industries in Tanzania gives a registered hardwood sawmilling capacity of some 473 000 m3 while production was only 55 000 m3, i.e. 12% capacity utilisation rate. Milledge and Kaale ( 2005) suggests that the actual harvest volume in Rufiji district would have been some 500 000 m3 in 2003 while licenses were issues only for harvesting of 21 000 m3. The data supplied by FBD for this study in 2011 reports harvesting level of 1 500 m3 in 2003 in Rufiji district. Naturally any estimates for the country level illegal harvesting activity are not available from any reliable sources. The above estimated annual extraction (150 000 m3) seems to represent a very small percent of the annual allowable cut. However, most of the wood in production forests is used to supply biomass fuels (firewood and charcoal). The average national biomass fuel consumption per capita is around 1 m3 of solid wood (Kaale, 2005; WWF, 2008). Further, it is reported that 94% of the population relies on biomass fuel for their energy needs (URT, 2003; NBS, 2004). The total population in Tanzania is estimated at 41 million inhabitants in 2010 (URT, 2010), Therefore, based on these figures, it is estimated that 38.5 million m3 of solid wood is used as biomass fuel. A small percentage (10%) of this biomass comes from farm land and other types of forests. Therefore, the commercial harvesting, whether legal or illegal, may not be a major issue for most of the natural forests but the pressure from other land uses, including charcoal production and firewood harvesting is the threat. Availability of harvestable volumes from natural forests is documented in various reports. For example, FBD (2003) reported that Morogoro region had a total of 42 Catchment Forest Reserves (CFRs) with a great variation in size, ranging from 9 to 69 000 ha. These CFRs have been subject to different levels of degradation ranging from 1 to 100%. The total area of CFRs in the region is about 385 000 ha comprising mainly montane forest and a small proportion of sub-montane and lowland forests. The yield from montane forests is about 150 – 200 m3/ha (Malimbwi et al., 2004). With an average yield of 175 m3/ha, the total potential yield from CFRs in Morogoro region is about 55.3 million m3 (roundwood). The average annual allowable cut from montane forests is 4.5 m3/ha. Therefore, the total annual allowable cut for CFRs in the region is 1.4 to 1.5 million m3 of roundwood (FBD, 2003). In Kilimanjaro region, the potential productive area of CFRs was estimated to be 115 000 ha for the montane forest and 500 ha of woodlands (FBD, 2003). At the average yield of 175 m3/ha for the montane forest type, and 60 m3/ha for the woodland type, the potential yield from forests and woodlands in the region was estimated to about 20 million m3. The estimated annual allowable cut for Kilimanjaro region was 1.5 million m3 of roundwood. Furthermore, the potential productive area of CFRs in Tanga region was estimated to be 84 000 ha yielding about 15 million m3 of roundwood. The estimated annual allowable cut for Tanga region was 380 000 m3/ha for montane forest (FBD 2003). Similarly, the potential productive area of CFRs in Arusha region was estimated to be 70 000 ha of montane forest, and the potential yield was estimated to be about 12 million m3 of roundwood. The estimated annual allowable cut from CFRs in Arusha region was about 315 000 m3 of roundwood. Forest inventory reports from 13 regions of Tanzania summarised in Table 22 show that nearly 87% of the forests are harvestable and there is enough harvestable volume in the forests though it is largely from lesser known and commercially unknown species (FBD, 2005). Forest inventory data for 11 districts in Tanzania which was conducted by FBD in 2005 is summarised in Table 23. These inventories indicate that there is reasonable harvestable area and volume in the natural forests, mostly from lesser known species (LKS) and some commercially
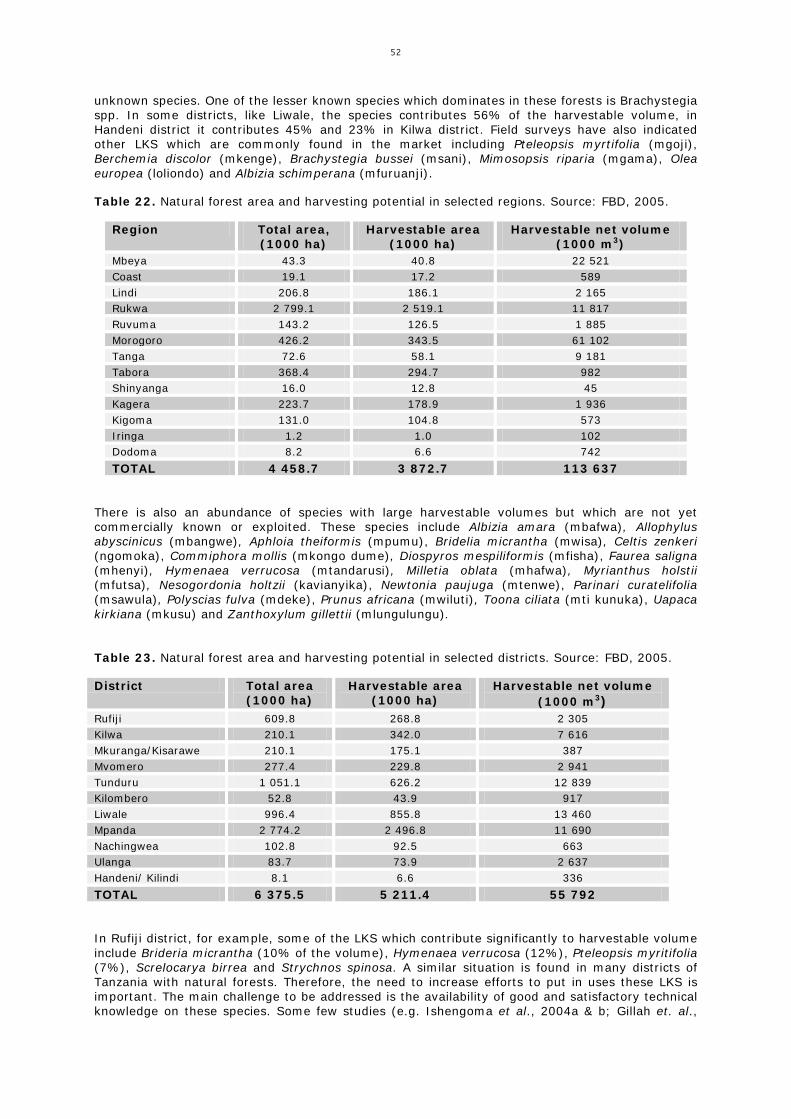
52
unknown species. One of the lesser known species which dominates in these forests is Brachystegia spp. In some districts, like Liwale, the species contributes 56% of the harvestable volume, in Handeni district it contributes 45% and 23% in Kilwa district. Field surveys have also indicated other LKS which are commonly found in the market including Pteleopsis myrtifolia (mgoji), Berchemia discolor (mkenge), Brachystegia bussei (msani), Mimosopsis riparia (mgama), Olea europea (loliondo) and Albizia schimperana (mfuruanji).
Table 22. Natural forest area and harvesting potential in selected regions. Source: FBD, 2005.
Region Total area, (1000 ha)
Harvestable area (1000 ha)
Harvestable net volume (1000 m3)
Mbeya 43.3 40.8 22 521 Coast 19.1 17.2 589 Lindi 206.8 186.1 2 165 Rukwa 2 799.1 2 519.1 11 817 Ruvuma 143.2 126.5 1 885 Morogoro 426.2 343.5 61 102 Tanga 72.6 58.1 9 181 Tabora 368.4 294.7 982 Shinyanga 16.0 12.8 45 Kagera 223.7 178.9 1 936 Kigoma 131.0 104.8 573 Iringa 1.2 1.0 102 Dodoma 8.2 6.6 742
TOTAL 4 458.7 3 872.7 113 637 There is also an abundance of species with large harvestable volumes but which are not yet commercially known or exploited. These species include Albizia amara (mbafwa), Allophylus abyscinicus (mbangwe), Aphloia theiformis (mpumu), Bridelia micrantha (mwisa), Celtis zenkeri (ngomoka), Commiphora mollis (mkongo dume), Diospyros mespiliformis (mfisha), Faurea saligna (mhenyi), Hymenaea verrucosa (mtandarusi), Milletia oblata (mhafwa), Myrianthus holstii (mfutsa), Nesogordonia holtzii (kavianyika), Newtonia paujuga (mtenwe), Parinari curatelifolia (msawula), Polyscias fulva (mdeke), Prunus africana (mwiluti), Toona ciliata (mti kunuka), Uapaca kirkiana (mkusu) and Zanthoxylum gillettii (mlungulungu). Table 23. Natural forest area and harvesting potential in selected districts. Source: FBD, 2005.
District Total area (1000 ha)
Harvestable area (1000 ha)
Harvestable net volume (1000 m3)
Rufiji 609.8 268.8 2 305 Kilwa 210.1 342.0 7 616 Mkuranga/Kisarawe 210.1 175.1 387 Mvomero 277.4 229.8 2 941 Tunduru 1 051.1 626.2 12 839 Kilombero 52.8 43.9 917 Liwale 996.4 855.8 13 460 Mpanda 2 774.2 2 496.8 11 690 Nachingwea 102.8 92.5 663 Ulanga 83.7 73.9 2 637 Handeni/ Kilindi 8.1 6.6 336
TOTAL 6 375.5 5 211.4 55 792 In Rufiji district, for example, some of the LKS which contribute significantly to harvestable volume include Brideria micrantha (10% of the volume), Hymenaea verrucosa (12%), Pteleopsis myritifolia (7%), Screlocarya birrea and Strychnos spinosa. A similar situation is found in many districts of Tanzania with natural forests. Therefore, the need to increase efforts to put in uses these LKS is important. The main challenge to be addressed is the availability of good and satisfactory technical knowledge on these species. Some few studies (e.g. Ishengoma et al., 2004a & b; Gillah et. al.,

53
2004a, b & c) have been going on at Sokoine University of Agriculture to determine some physical and mechanical properties of some LKS. These studies have contributed to bring to the market some LKS such as Brachystegia bussei (msani), Berchemia discolor, Trichilia emetica and Pterocarpus stolzii whose demand is also growing. This should go hand in hand with availability of information of quantities for each of the LKS. The on-going National Forestry Resources Monitoring and Assessment of Tanzania (NAFORMA) will to a large extent provide information on LKS and quantities. 7.1.5 Total supply forecast until 2030 Supply forecasts until 2030 are indicated in Table 24, which was prepared combining the information from government plantations, natural forests, private company plantations and private individual woodlots. Supply of raw materials from government plantations varied from year to year and therefore an average of the last three years was used. However, for the Sao Hill forest plantation, supply was based on the current age structure. Table 24. Supply forecast until 2030. All figures in 1000 m³. Source: File data 2010.
Year Govt plantations
Private plantations
NIPF Natural forests
Total
2010 1 150 160 180 87 700 89 190
2015 1 120 300 230 87 700 89 350
2020 400 700 250 87 700 89 050
2025 560 750 290 87 700 89 300
2030 820 750 290 87 700 89 560
Projections indicate that while at the moment (2010) government industrial plantations supply over 70% of the raw material requirements, by 2020, same plantations will be supplying only about 40%. Private forests will pick up from the current supply of only about one percent to about 40% of raw material requirements. However, it should be pointed out here that much as private forests will increase their supply, it will be for their own consumption. Therefore, SMEs currently getting raw material from government plantations are likely to suffer. Another observation, as Table 24 indicates, is that 98% of the potential wood supply still comes from natural forests, most of which is used fof fuelwood. 7.2 Demand scenarios and projections Several factors have been considered in analysing demand scenarios and projections. These factors include population growth, economic growth, urbanisation and special demand drivers, e.g. the construction sector. Population growth. According to the census of 2002, the population growth is around 2.9% per year and the population size is now estimated at around 40.7 million (URT, 2010). The population has almost doubled in the past 20 years and will continue to grow, most likely at the same rate. The population is very unevenly distributed with high population in some urban centres like Dar es Salaam, Dodoma, Arusha, Tanga and Mwanza. The largest city is Dar es Salaam with an estimated population of about 4 million people and most commercial and business activities takes place there. Economic growth. At present, Tanzania experiences an economic growth rate of 6.0% and the GDP/cap is around USD 577 (URT, 2010). However, the economic growth was very rapid in 2000–2009, with an average of 7% (a figure used in demand forecasts). The main economic sectors include agriculture, forests and hunting (24.6% of GDP), service sectors including trade, transport, communication, hotel and restaurants (43.6% of GDP), and the manufacturing sector (22.0% of GDP)(URT, 2010). The performance of the economy in Tanzania has been impacted by the global financial crisis and the relatively long dry spell in 2008 which saw many sectors performing less well than the previous year. For example, the real GDP grew by 6.0% in 2009 compared to 7.4% in 2008. The government has taken various measures to address the adverse effects of the global financial crisis and there are signs that the economy is performing well (BoT, 2010). Inflation rate has remained high at 7.2% in 2010 and at 12.1% in 2009. The central bank discount rate was 3.9% at the end of 2009 but the commercial banks have a lending rate of over 15%.

54
Urbanisation. Growth of the urban population includes the increasing tendency towards natural demographic growth of urban populations, the migratory movements from rural areas to cities, development of small rural towns to reach the status of urban centres, and the absorption of rural clusters into growing cities. In emerging markets like Tanzania, the urbanisation megatrend and large infrastructure projects mean steady growth in demand for different construction materials. As the rate of urbanisation continues to grow, it drives three key construction segments: residential, commercial and infrastructure. New construction activities are mainly driven by infrastructure and housing needs as there is a strong internal migration movement when young people move into urban centres in search of better opportunities. This movement creates a need for adequate housing, highways and streets, water and sewage, and other services, as well as retail and commercial development. The rise of manufacturing activities in many emerging market countries is leading to increased investments in factories and industrial structures, and the growth of service industries is leading to increased office construction. Industrial jobs also often offer better salaries than agricultural jobs, which will eventually lead to increased demand for leisure time activities and improved housing. All these directly contribute to increased demand also for forest products in Tanzania. In Tanzania, the urban growth rate continues to be high as is apparent in the major cities. The urban population growth rate is estimated to be at 4.2% - 5.4% annually while the rural population is growing at a rate of less than 2% annually. The estimate of urban population share today is 25% of the total population; nevertheless, some estimates are a bit higher depending on the source. Therefore, over 70% of the population is estimated to still remain in rural areas. The economic growth coupled with the rapid population growth and high urbanisation rate will continue to stimulate fast growth in the industry and construction sectors and therefore increase demand for forest products. Demand by subsectors. In Tanzania, roundwood (logs and pulpwood) is consumed by the construction sector, pulp and paper industry, furniture and joinery sector, packaging sector and in utility poles; additionally, some volumes are exported as described earlier. In Figure 9 the demand is divided between consuming sectors, based on the situation in 2010. The total demand for round-wood was estimated at 1.28 million m3 (Indufor, 2011).
Figure 9. Roundwood consumption by subsectors in Tanzania, 2010. Source: Indufor 2011.

55
The Construction sector includes residential/commercial buildings and infrastructure projects. Field observations show that the sector consumes the vast majority of softwood sawn timber and a significant amount of small poles (for formwork) produced in Tanzania. There is apparently no statistics on the construction activity at national level. Statistical information is kept at Municipal or district levels and ends there. Considering that this sector consumes most of the sawntimber produced, it is important that the forest products industry is concerned and mechanisms are developed to follow trends. It was established during the field survey that each municipality issues building permits for construction. However, it was also noted that a lot of construction is going on in un-surveyed areas without building permits. Therefore, it requires a lot of efforts to get reliable information on building permits, which one can use for forecasting.
Figure 10. Utility poles demand by TANESCO in Tanzania, 2009-2011. Source: Tanesco, 2011.
Utility poles. Consumption of utility poles to support electricity transmission is growing and, although to a lesser degree, also in supporting telephone lines. Treated eucalyptus poles are the main product in use. Pole length varies between 8 and 16 metres. Rural electrification in Tanzania is a megatrend that will increase the demand for utility poles in the coming years. Most of the country is today not covered with electricity lines, and as economy grows, the rural electrification will advance. A similar trend is observed in many other countries. In Kenya, for example, the rural electrification is currently expanding rapidly and thus the booming export market for electricity poles (Indufor, 2011). Figure 10 shows the demand for electricity poles by Tanesco. Demand is increasing rapidly and the forecast for 2011 is already 120 000 poles. The shortest poles have the greatest demand while extra long poles are in less demand.
7.2.1 Demand forecasting scenario up to 2030 Taking into account the factors/demand drivers discussed above, particularly population, economic growth and urbanisation, several demand scenarios are presented. The current wood consumption is based on the data for 2010. Forecasts are done separately for different products - sawntimber, utility poles, pulp and paper - and then converted to logs (round wood equivalent, m3) to enable an overall forecast for raw material demand. It is summarised in Table 25. It was difficult to get investment plans for all industries and other demand drivers, like the construction sector, and therefore sudden changes in the demand drivers are not taken into consideration. Also, the forecasts do not separate species and sizes as it was difficult to establish industrial demand breakdowns. Therefore, any significant changes in the production facilities will change the forecast.

56
Two different scenarios are considered: Baseline scenario 1: Current wood consumption level per capita continues (no increase) and future growth is based solely on population growth estimates. This does not take into account economic growth, urbanisation or increased wood use per capita. Substitution of wood products by other products continues as it is now. Realistic scenario 2: Economic growth and urbanisation increase the wood use per capita. Wood supply is able to respond to demand and no major substitution by other materials is taking place. Some amounts of wood products are exported. Table 25. Forecast demand scenarios. Source: Field data.
Year Supply (1000 m³)
Demand Scenario 1 (1000 m³)
Demand Scenario 2 (1000 m³)
2010 89 190 40 140 40 140 2015 89 350 46 308 53 716 2020 89 050 53 423 71 885 2025 89 300 61 632 96 198 2030 89 560 71 102 128 734
Forecast demand in the base scenario indicates that wood demand from plantations will surpass plantations supply by about 400 000 m3 by 2030. However, if the economy grows in the same pace as well as population, forecast demand will significantly exceed supply from plantations by about 2 200 000 m3 by 2030. This is equivalent to a deficit of productive plantations of about 7 000 to 8 000 ha. Furthermore, if natural forests are included and only population is considered, demand will be less than supply by about 18 million m3. However, if economic growth is also considered, demand will surpass supply by about 39 milliom m3 by 2030. Nonetheless, most of the wood from natural forests will be consumed by households for firewood and charcoal. 7.3 Consumer prices Average prices of forest products in Tanzania in 2010 are summarised in Table 26. Only figures for industrial roundwood and sawn wood were available. Most industrial roundwood products (softwood and hardwood) in Tanzania, as discussed in a previous chapter, come from government forests. Prices are determined by the government. Other components of the price inlude LMDA, Value Added Tax (VAT) and CESS (a fee paid to district council where harvesting is taking place, normally 5% of the government royalty fees). Therefore, prices indicated are royalty rates charged by the government. For natural forest hardwoods, figures indicated in Table 26 are royalty rates. Transportation costs are also quite high due to inaccessibility of the harvested sites. Therefore, after transportation, the mill gate price of hardwood logs was estimates to about USD 120–150/m3. For sawnwood, prices vary from one region to another depending on sources of timber and transportation costs. For example, the price for softwood sawnwood (untreated) indicated in the table is for Dar es Salaam, while in Arusha region, its was 246 USD/m3 for untreated timber and 283 USD/m3 for kiln dried. Most of the softwood sawnwood sold in Dar es Salaam and in northern Tanzania comes from the Southern highlands and, according to a study by Indufor (2011), road transportation costs takes about 28% and by rail 22% of the selling price. Further analysis in the same study shows that traders take 28% and various taxes about 8% of the final selling price. The implication of this analysis is that primary producers are left with little of the final price, most of which goes to production and transportation costs. Essentially, none of the actors in the chain gets a significant profit. This indicates that prices of sawnwood in Tanzania are fairly low to make any significant profit which can encourage producers to invest in new technology to increase efficiency and cut down production costs.

57
Table 26. Prices of local timber and wood products in 2010 in Tanzania. Source/product Plantation forests/woodlots
(mainly softwoods) Natural forests
(mainly hardwoods) Industrial roundwood (USD/m³) 28.5 – 32.5 80.0 – 100.0 Sawnwood (USD/m³) 194.0 445.0 7.3 Forest products trade The findings show that Tanzania has been exporting traditional products such as logs, sawntimber, floor boards, planks, sandalwood and poles for a long time. In recent years, many “non-traditional” wood- and/or tree-based products have been introduced on the export market. Some of these non-traditional products include cinchona barks, carvings, furniture, jatropha oil, palm leaves and other products. However, some of these 48 recorded export products are not regularly exported and there is a major problem of record keeping. All trade data for Tanzania is very scattered and conflicting, and different official sources may report different figures for the same year. When comparing export statistics for different products and years, there are obviously erroneous and improbable figures reported. Apparently the best source of trade data is the Tanzania Revenue Authority (TRA) who keeps a record of all trade for the sake of tax collection. Additionally, the TRA works independently of the other ministries and has an electronic format to collect the data. The FBD itself maintains a registry for trade data of forest products. However, this data is not well managed or cross checked. Also FAO collects information on trade of forest products through the annual Joint Forest Sector Questionnaire but apparently Tanzania has not provided reliable data since many of the entries are repeated from year to year, or simply a change rate has been estimated (Indufor, 2011). The leading export of forest products is sawntimber (rough sawn) and was growing according to all sources of trade data, until year 2008 (Figure 10). Information received from the Tanga regional office indicates the sawn timber exports would have grown again in 2010 after a small decline in 2008 - 2009. The effects of the global economic crisis also affected the export markets. The single largest export market for sawn timber is Kenya. Preliminary TRA information for year 2010 shows that Kenya absorbed some 67% of all Tanzania’s exports. From the Tanga crossing point alone, some 34 000 m3 of sawn timber was exported to Kenya in 2010 (Figure 11). Other export destinations include the EU, Japan and China. The level of exports has varied between 20 000 and 40 000 m3 of sawn timber annually. The observations made during the field visit confirm this level of export activity. There are some significantly higher exports reported, especially by the TRA office, but this information is apparently not correct and should be revised. The information FBD has for year 2009 is also apparently not correct as Tanga exports alone exceed that greatly.
Figure 11. Softwood sawntimber exports, 2005-2010. Source: Indufor, 2011.
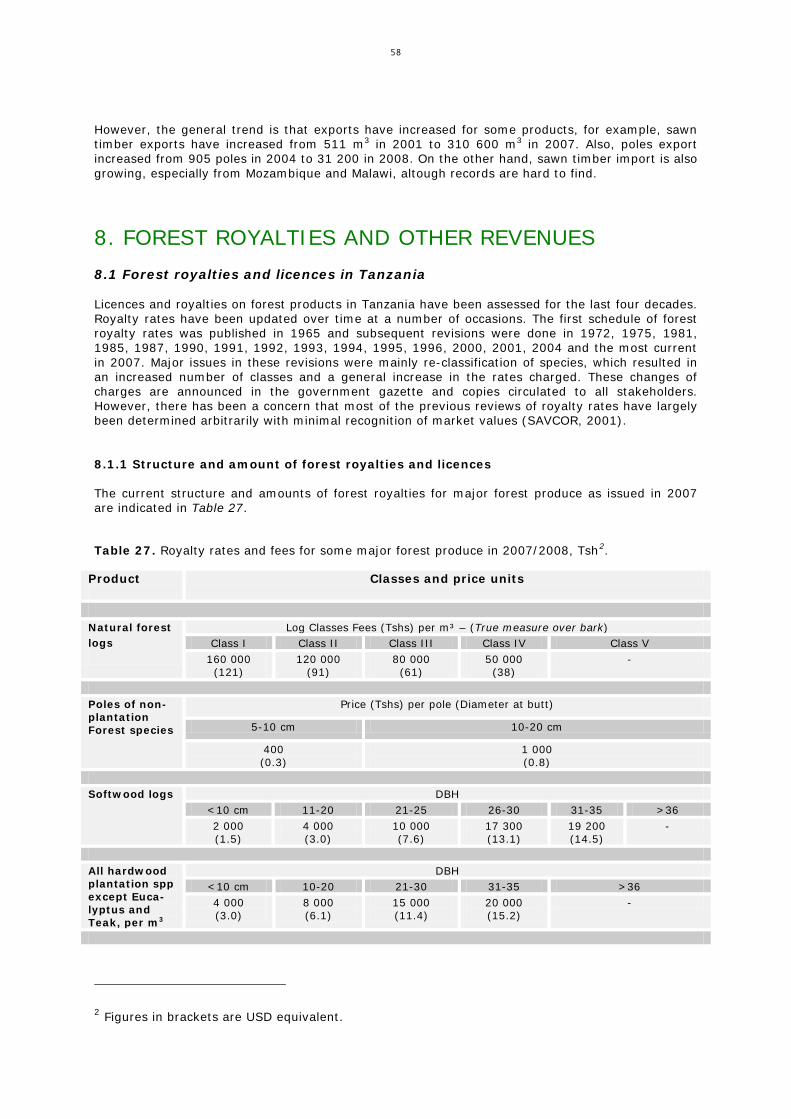
58
However, the general trend is that exports have increased for some products, for example, sawn timber exports have increased from 511 m3 in 2001 to 310 600 m3 in 2007. Also, poles export increased from 905 poles in 2004 to 31 200 in 2008. On the other hand, sawn timber import is also growing, especially from Mozambique and Malawi, altough records are hard to find.
8. FOREST ROYALTIES AND OTHER REVENUES 8.1 Forest royalties and licences in Tanzania Licences and royalties on forest products in Tanzania have been assessed for the last four decades. Royalty rates have been updated over time at a number of occasions. The first schedule of forest royalty rates was published in 1965 and subsequent revisions were done in 1972, 1975, 1981, 1985, 1987, 1990, 1991, 1992, 1993, 1994, 1995, 1996, 2000, 2001, 2004 and the most current in 2007. Major issues in these revisions were mainly re-classification of species, which resulted in an increased number of classes and a general increase in the rates charged. These changes of charges are announced in the government gazette and copies circulated to all stakeholders. However, there has been a concern that most of the previous reviews of royalty rates have largely been determined arbitrarily with minimal recognition of market values (SAVCOR, 2001). 8.1.1 Structure and amount of forest royalties and licences The current structure and amounts of forest royalties for major forest produce as issued in 2007 are indicated in Table 27.
Table 27. Royalty rates and fees for some major forest produce in 2007/2008, Tsh2
.
Product
Classes and price units
Natural forest logs
Log Classes Fees (Tshs) per m³ – (True measure over bark) Class I Class II Class III Class IV Class V
160 000 (121)
120 000 (91)
80 000 (61)
50 000 (38)
-
Poles of non-plantation Forest species
Price (Tshs) per pole (Diameter at butt)
5-10 cm 10-20 cm
400 (0.3)
1 000 (0.8)
Softwood logs DBH
<10 cm 11-20 21-25 26-30 31-35 >36 2 000 (1.5)
4 000 (3.0)
10 000 (7.6)
17 300 (13.1)
19 200 (14.5)
-
All hardwood plantation spp except Euca-lyptus and Teak, per m3
DBH <10 cm 10-20 21-30 31-35 >36 4 000 (3.0)
8 000 (6.1)
15 000 (11.4)
20 000 (15.2)
-
2 Figures in brackets are USD equivalent.

59
Teak per m3 DBH <10 cm 10-20 21-30 31-35 >36 32 000 (24.2)
80 000 (60.6)
120 000 (90.9)
160 000 (121.8)
-
Eucalyptus all species per m3
DBH <10 cm 11-20 21-30 >30 31-35 >36 3 000 (2.3)
6 000 (4.5)
12 000 (9.1)
15 000 (11.4)
- -
LMDA/Road and Silvicul-tural fees
Hardwoods Per m3 of logs
Softwoods Per m3 of logs
Road fee Silvicultural fee Road fee Silvicultural fee 5 000 5 000 10 000 10 000
The royalty charges are paid by the traders for use of products from national forest reserves, plantations and general lands. Most of these charges are based on volume of wood, provision of services such as road, silvicultural, grading fees, etc. According to the approved royalty and permits rates in Table 27, volume estimates are charged per cubic meter of round logs, poles and, in some cases, a pile of firewood harvested from natural forest, general lands and plantations. These charges are usually based on the volume of production but may also, in some cases, be based on the number of trees cut. Variation of log/tree diameter (DBH) is another criteria commonly used in setting the volume based charges, particularly in poles and logs for timber (Table 27). Based on diameter classification, the charges are set in such a way that higher diameter classes assume higher unit price per m3 of wood and vice versa. NWFP products, such as barks, gums, resins, and processed products like mpingo carvings, are charged per kg unit of the product. Others issue permits to produce these products from a certain area for a specified time period flat-rate charges used when they issue these permits. 8.1.2 Suggestions for improvement of forest charges and licences Reduce the number of charges and payment categories: Categories of forest royalties and charges are numerous. Reducing the number of different charges and payment categories need to be considered for an easy implementation of forest charges and licences. The more different payment categories and charges there are, the more complex the system is to manage and monitor. Some fees which, in reality, are not collected and/or the collection does not bring in significant amounts of income, could be abolished at national level (e.g. firewood in rural areas for household consumption, collection of medicinal plants) but maintained at village level so as to ensure sustainable management of the forests. Improve system of setting rates of royalty charges: Despite regular revisions of forest royalties and fees, the royalty charges set by FBD are thought to be low. This is probably due to the system used in setting charges during revision (SAVCOR, 2001) and probably the prevailing high inflation rates of the national currency over time. Understandably, a concise model for determination/setting has never been developed. The economic theory advocates market-based pricing whenever possible (i.e. there are competitive markets, and the product being sold and the conditions of the sale are clearly identified and understood. It means that market-based systems tend to work better in forest plantations than in natural forests where the quantity and quality of product being sold is less easy to determine clearly). It is therefore proposed that stumpage appraisal be used as a model for price determination. This model provides an opportunity to revise prices based on market trend by collection of data on some few parameters of the model and use that information to revise prices of raw materials. Similarly, the 5% levy charged by LGA need to be updated. It could also be useful to consider establishment of a Memorandum of Understanding (MoU) with Districts on revenue collection. This may create an incentive to increase their efforts and compliance in revenue collection, documentation and remittance to the MNRT.

60
8.2 Forest concessions Forest concession arrangements in Tanzania are not operational at the moment. However, the Framework, Criteria and Guidelines for Concession Arrangements in Plantation Forests has been developed for implementation since 2005 (MNRT, 2005). The Concession guidelines act as a manual to assist the forest user in addressing the objectives laid out in a variety of development strategy documents that define an approach to sustainable resource management. The aim of the concession guideline is to ensure a transparent and equal treatment of all individuals and institutions or companies that have an interest in becoming involved in plantation forest management through the concession process. The resources and areas to be put under concession are to be clearly demarcated and appraised to ensure that the plantation is not encumbered by land ownership or land use restrictions. The products of the assessment will include an updated inventory, forest cover maps, a valuation of the plantation (NPV) and a social assessment as part of an EIA. The result of the feasibility study will determine the type of management arrangement to be considered. 8.2.1 Procedures for concession arrangements in plantation forests The guidelines for concession arrangements in plantation forests delineate ten fundamental steps to be involved in forest concession:
i. Advertising a Concession. A Forest Reserve concession is advertised by MNRT, or MNRT receives an application for a Concession. MNRT must endeavour to make reserved land available for interested private and community managers in order to achieve the aims of the government strategy without the private sector driving the process. The time anticipated to complete this process is approximately 1.5 months.
ii. National Forestry Advisory Committee Opinion. Upon receipt of the Expression of Interests,
Tenders or Applications for a Concession, the Minister refers the potential Concessionaire(s) to the National Forestry Advisory Committee (NaFAC) for comments in order to pre-qualify bidders in regards to the technical proposal and for an opinion regarding development of a concession arrangement. This process will take approximately 1 week.
iii. Dialogue between the Stakeholders. Stakeholder (NGO, CBO, civil society, local government
authorities) interests are registered and co-operation between the Concessionaire(s) and Stake-holders is initiated. This will assist in defining future social and environmental responsibilities of the Concessionaire. This process will need 2 months to be completed and longer if there are conflicts in regards to land use.
iv. Evaluation of the Concessionaires. An independent Team of Experts appointed by the Director
FBD will evaluate the qualifications of the Bidder(s)/Concessionaire(s) according to a list of criteria agreed upon at the time of advertising the concession, as set out in the current legislation. The Team will need 1 month to make a thorough assessment of the qualifications.
v. Drafting a Concession Agreement. A Concession Agreement is drafted using experts (Lawyer,
Forest Manager, Economist, Sociologist) chosen by MNRT. The Draft Agreement will be based on the Template developed by FBD and shall include conditions to ensure that the Concessionaire meets the policy objectives and applicable legislation of the GoT including an indication of the remuneration to be paid by the Concessionaire to the GoT. Drafting of the Concession Agreement will take 2 weeks.
vi. Right of Exclusivity. The Concessionaire receives a Letter of Intent (Right of Exclusivity) from
MNRT together with the Draft Concession Agreement for assessment and comment. This will encourage the concessionaire to carry out field verification with regard to the planned concession, including an EIA. All data collected by the Concessionaire is to be made available to the GoT. The timeframe for making an assessment of the concession is 2 months.
vii. Negotiation of a Contract. The evaluation and comments made by the Concessionaire are
assessed and the Concession Agreement is finalised. The Concessionaire is then invited for negotiations with MNRT together with the Team of Experts chosen by MNRT that need to include a Lawyer, Economist and Forest Manager. This process is anticipated to take 1 month.

61
viii. Finalisation and Signing of the Concession Agreement. The Concession Agreement is to be signed upon completion of negotiations and acceptance by Director FBD that the Concessionaire has fulfilled the requirements of presenting a FMP that includes an EIA. Any necessary side-agreements that must be made with local individuals or institutions are to be negotiated directly between the Concessionaire and the Third Party during the initial phase (Year 1) of the concession. This process is anticipated to take 3 months.
ix. Monitoring of the Concessionaire. Monitoring of the Concessionaire is to be carried out on a
regular basis by an institute or individual commissioned by the DFoB. The purpose of the evaluation is to ensure that the Concessionaire is abiding by the rules and regulations agreed upon in the Concession Agreement.
x. Reviewing the Concession Process. A review of the concession process is to be made on a
regular basis, e.g. 5 years, to allow the Parties to the Concession Agreement to make any necessary adaptations. The time between the reviews will depend upon the type of concession that has been given, e.g. a management concession will have a longer period between reviews if compared to a utilisation concession.
8.3 Administration of forestry revenue system 8.3.1 The process of setting forest royalties and taxes Setting of forest royalties and taxes is in accordance with the National Forestry Act. The Forestry and Beekeeping sectors are governed by the Forestry Act No 14 and the Beekeeping Act No. 15 both of 2002. Section 78 (1) of the Forestry Act and Section 38 of the Beekeeping Act give powers to the Minister to describe the processes of setting forest royalties and taxes for which fees shall be charged by forest reserve managers in accordance to the approved charge rates. The Local Government Finance Act of 1982 further empowers Local Government Authorities (LGAs) to charge levy of 5% on the value of all forest products from general land forests within their districts. LGAs and Villages can, however, retain all the fees and levies from Local Authority Forest Reserves and Village Land Forest Reserves respectively. Other relevant legislations in the management of forest resources are the Land Act No. 4 of 1999 and the Village Act no. 5 of 1999. 8.3.2 The overall revenue collection process The process of collecting forest revenues involves the registration of traders, licensing, assessment and the actual collection, accounting and reporting both for FBD or LGAs. The process involves the Headquarters, Regional and District Offices. The checkpoints are used for inspection of forest products. However some of the checkpoints are also collecting some revenue. Exchequer Receipt Vouchers (ERVs) are issued for all cash collected and banked intact in a collection account where it is transferred to HQ telegraphically. Cash collected is regularly reconciled with bank pay in slips. The ERVs are then summarised in the Revenue Collectors Cash Book (RCCB) and submitted to HQ monthly. The HQ uses the RCCB to reconcile the transfers from the districts. Weekly and monthly progress reports are prepared and submitted to FBD HQ. While FBD is using its employees and LGAs staff in revenue collection, LGAs have outsourced the collection of their 5% levy to private collectors in many of the districts in the country. Bee products are currently not charged any fees or levy. However, when one is exporting them FBD charges inspection and export fees. 8.3.4 Monitoring system and collection of revenue The revenue collection and monitoring system involves a number of documents and check mechanisms as outlined in the Regulations of the Forest Act 2002, first schedule to thirty ninth schedule. Forms and monitoring that are commonly used by FBD and District authorities are:

62
Certificate of Registration; Licenses for Harvesting; Transit Passes; Checkpoints; Forest Produce Dealer Records/Stock register; and Reporting. 8.3.5 Process of monitoring revenue collection The revenue administration system supports the revenue collection process. This process is one of royalty collection based on production or harvesting. The collection of revenues at checkpoints and Forest Sevaillance Units (FSU) clearly indicates the degree of non-compliance. Based on the current system, the main activities involved are: A. Trees, logs, poles, charcoal and firewood removed from natural forests (Forest Reserves or General lands) 1. DFO selects the forest area to be harvested; 2. DFO carries out tree and volume assessment; 3. DFO prepares Management plan which includes types of trees to be harvested and size of the
coupe; 4. DFO submits the management plans to Director FBD for approval; 5. For trees, timber, logs, charcoal, poles and firewood removed from natural forests (Reserved
and General land), the licensee does the following: The licensee should have letter of approval from village committee of the village adjacent
to the forest area; The licensee should send application for harvesting to the District Harvesting Committee by
filling application form, Forest Division 1(FD1)); The applicant should be registered as Forest Produce dealer; Every registered dealer of forest products shall be required to pay 5% of the royalty fees as
a special fund for tree planting within the District; The applicant should be listed with the village adjacent to the forest area; The applicant should have trading license; and The applicant should have Tax Identification Number (TIN).
6. DFO submits the approved management plan together with harvesting requests to the District
Sustainable Harvesting committee; 7. The requests are discussed by the District Sustainable Harvesting Committee which normally
sits quarterly; 8. Based on the committee’s recommendations, DFO or DCFM issues licence to the applicant on
payment and issue of Exchequer Receipt Voucher and deposits the money in the MNRT account. The licence issued is valid for 30 days. In exceptional circumstances, the licence may be extended for 15 days on payment of a fee of 20% calculated on royalty;
9. After payment the licensee report to the village government. Village government in collaboration with district foresters supervises the harvesting to make sure that harvesting is carried out in the selected areas and only trees which are shown on the license are harvested;
10. The Licensee applies to the District Forest Officer to remove the tree or other forest products (within 30 days of the issue of the license);
11. The District Forest Officer visits the site with licensee. He re-measures the forest products and hammers the felled trees;
12. The District Forest Officer issues a Transit Pass (TP) allowing the licensee to transport timber within the district (“after due ascertainment of the bona-fide and origin of the forest produce”);
13. If the licensee is transporting his or her product outside the district he or she is issued a Transit Pass (TP) by the Regional Natural Resources Officer or District Forest Officer upon approval by DFoB; and
14. Traders and transporters are subject to verification of load against paperwork/documents at checkpoints, where supplementary assessments/verification is done and if found with excess load is penalised in accordance to Forest Act.
Requests for licences for consignments less than 3 m3 of standing trees and 15 poles should be sent directly to the District Forest Officer (DFO) or District Catchment Forest Manager (DCFM) for license. Requests which exceed 3 m3 of standing trees and 15 poles should be sent to the District Harvesting Committee.

63
B. Trees, logs, firewood and poles removed from the Government Forest Plantations 15. Plantation Manager (PM) prepares management plan which includes harvesting plan; 16. Plantation Manager (PM) submits the management plans to DFoB for approval; 17. The applicant apply to the plantation manager specifying species choice, type of machine,
quantity etc; 18. The applicant should be registered as Forest Produce dealer with Regional Forest Officer; 19. PM submit the approved management plan together with harvesting requests to the Harvesting
committee; 20. The requests are discussed by the Harvesting Committee chaired by Assistant Director
Utilisation which seats annually; 21. Plantation manager demarcates the area, depending on the number of approved dealers,
makes measurements and calculates volume based on tariff tables, and then issues licence to the applicant on payment and issue of Exchequer Receipt Voucher based on the calculated volume;
22. Fees received are deposited in the MNRT account. The licence is usually valid for 1 month to 6 months depending on the size of the licence;
23. After payment the licensee report to the range in charge who supervises the harvesting to make sure that harvesting is carried out in the selected areas and only trees which are shown on the license are harvested;
24. The Licensee applies to PM to remove the tree or other forest products from the forest (within 30 days of the issue of the license);
25. The range in charge visits the site with licensee. He re-measures the forest products and hammers the felled trees;
26. The Plantation Manager issues a Transit Pass (TP) allowing the licensee to remove logs or any other forest products outside the forest plantation; and
27. Traders and transporters are subject to verification of load against paperwork/documents at checkpoints, where supplementary assessments/verification is done and if found with excess load is penalised in accordance to Forest Act.
Five types of forms are used during transactions to receive revenue on forest produce. Table 28 shows detailed information. Table 28. Description of types of forms used in collection forests produces revenue. No Form type
Description
1 Business License
The businessman must have a business license issued by Ministry of Industries and Trade and a TIN Number issued by TRA. This shows that the businessman is a genuine trader and fully registered to pay government tax.
2 Certificate of Registration
When he comes to DFO’s Office he has to show the business license, then he has to be registered as a trader in forest products by paying the Registration fee, which is for one year period July-June. He is then given an application form.
3 Application form for dealing with forest products
In order to actually do business, he must go to the village (with the application form) next to the forest area where he intends to harvest the produce – the village government will fill the form and give an opinion whether they do agree that the trees are available for harvesting.
4 License
With the completed form from the village government, the trader approaches the DFO’s office where it is checked whether it is in agreement with the harvesting plan set by the office, and if so, the request is forwarded to the harvesting committee. If approved, he/she is then issued with a license to harvest the amount approved and asked to pay the required rate. On top of this, the trader will have to pay 5% cess of the District Council if he is to harvest on central government forest reserve area, and pays another 5% for tree planting.
5 Transit Pass
This is issued to the trader on payment of TAS 1 000 to enable him transport the forest products from harvesting site to storage/business site in town. It is used within and outside the region and valid for one day to week.
The internal procedures relating to collection, accounting and banking of cash are: Cash is collected from the licensee and an ERV and harvesting licence is issued; Cash is banked to the MNRT account periodically (weekly, fortnightly) with the designated bank
of the district;

64
The cash book (RCCB) is written up for the banked sums; A copy of the RCCB, ERVs and bank in slip is forwarded to the MNRT for reconciliation; The MNRT (accounts section) reconciles the amounts deposited against received documents
(RCCB, ERVs, and BPS) from the collection center; and, If correct, MNRT (accounts section) issues an acknowledgement receipt to the collector. 8.3.6 Total forest revenue collection An overall assessment of the revenue collected by FBD since 2003/04 is shown in Table 29. Before 2003, only total annual revenue collections could be recorded instead of categorising and specifying them as to which revenue comes from forest royalties, licence fees, charges on processed products and trade, fines and penalties thus leading to poor recording keeping. Systematic record keeping of revenue collections started in 2003. The findings show that the trend is for an increased revenue collection from TAS 4 550 million (4.18 million USD) in 2003/04 to TAS 46 600 million (31.08 Million USD) in 2009/10 (Table 28). The average annual collection for the last four financial years, when some of the recommendations to improve revenue collection started to be implemented, is TAS 24 800 million. This is about 62% of the potential revenue (i.e. TAS 40 Billion) which could be collected according to reports by Koppers (1997) and Kobb (1999). The implication of these findings is that there is still about 38% of the revenue which was not collected, most of which is lost through illegal harvesting, evasion, fraud and forgery of documents. A pilot study on charcoal by TASONABI showed that 45% of the fees were not paid (or under-paid) for charcoal passing along the Morogoro–Dar es Salaam highway on its way to Dar es Salaam (TASONABI, 2009). Table 29. Annual total revenue collection trend for 6 years period (2003/04–2009/10), Million Tsh. (million USD). Source: FBD 2010.
Year
Source of Revenue
Forest Exp. Certificate & Permit
Forest Royalties
Registration fees
Compounding fees
Others
Total Annual revenue
2009/10 400 (0.27)
42 420 (28.28)
1 170 (0.78)
210 (0.14)
2 390 (1.59)
46 600 (31.08)
2008/09 220 (0.17)
13 880 (10.51)
1 120 (0.78)
80 (0.06)
230 (0.17)
15 530 (11.75)
2007/08 250 (0.21)
20 220 (16.91)
820 (0.69)
270 (0.23)
260 (0.22)
21 820 (18.25)
2006/07 210 (0.17)
14 350 (11.64)
340 (0.27)
130 (0.14)
110 (0.09)
15 140 (12.28)
2005/06 210 (0.17)
7 910 (6.32)
240 (0.19)
60 (0.05)
70 (0.06)
8 490 (6.78)
2004/05 170 (0.15)
9 220 (8.21)
20 (0.18)
80 (0.07)
60 (0.05)
9 730 (8.66)
2003/04 160 (0.14)
3 760 (3.45)
570 (0.52)
40 (0.04)
20 (0.02)
4 550 (4.18)
Most of the revenue collected comes from royalties which contributed over 92% of the total revenue collection while registration fees contributed about 4% of the total collection (Table 29). Ernst and Young (2005) also found that forestry royalties contributed 90% and 89% of the total collections from forest products in the financial years 2002/2003 and 2003/2004. Registration fees contributed 6% and 10% in the respective financial years. Therefore, any changes to improve revenue collection must address issues which have direct bearing on collection of royalty fees, for example, prices and scaling of logs/timber and charcoal. 8.3.7 Effectiveness of FBD in revenue collection The effectiveness of FBD in coordinating revenue collection is assessed by examining how revenue collection is planned, implemented and monitored. The FBD has tried to address these challenges in order to improve its own revenues to be able to maintain and expand its operations.
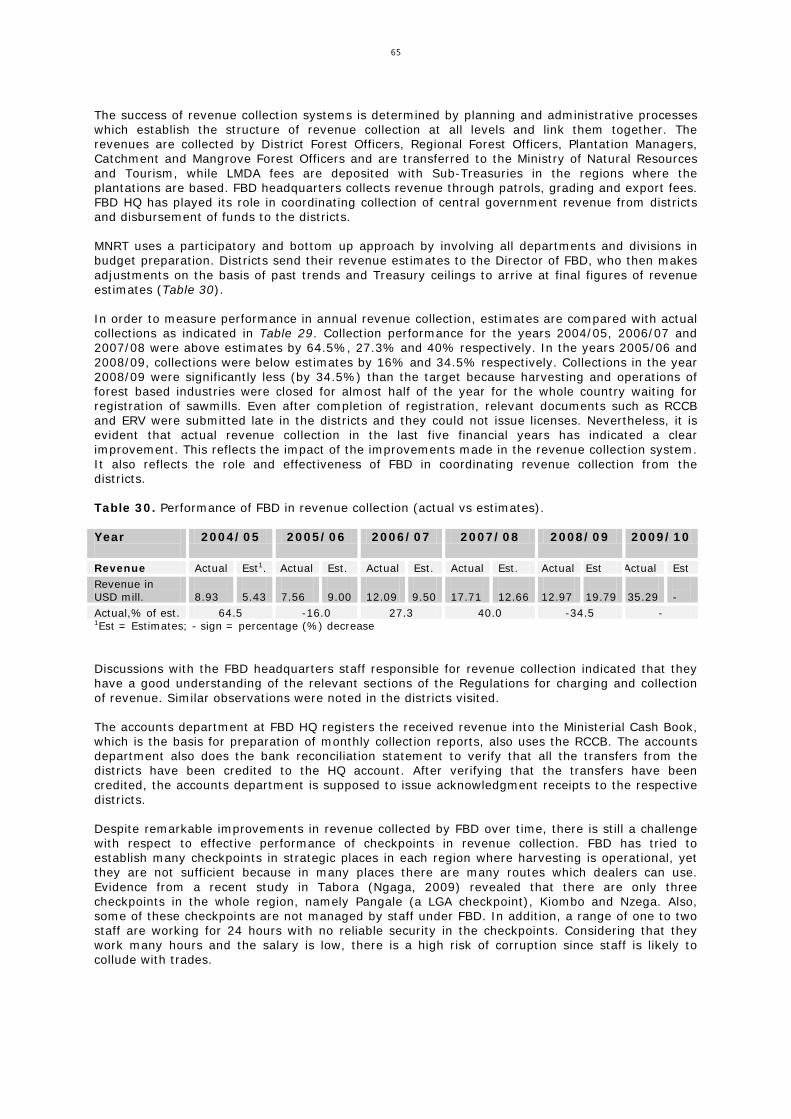
65
The success of revenue collection systems is determined by planning and administrative processes which establish the structure of revenue collection at all levels and link them together. The revenues are collected by District Forest Officers, Regional Forest Officers, Plantation Managers, Catchment and Mangrove Forest Officers and are transferred to the Ministry of Natural Resources and Tourism, while LMDA fees are deposited with Sub-Treasuries in the regions where the plantations are based. FBD headquarters collects revenue through patrols, grading and export fees. FBD HQ has played its role in coordinating collection of central government revenue from districts and disbursement of funds to the districts. MNRT uses a participatory and bottom up approach by involving all departments and divisions in budget preparation. Districts send their revenue estimates to the Director of FBD, who then makes adjustments on the basis of past trends and Treasury ceilings to arrive at final figures of revenue estimates (Table 30). In order to measure performance in annual revenue collection, estimates are compared with actual collections as indicated in Table 29. Collection performance for the years 2004/05, 2006/07 and 2007/08 were above estimates by 64.5%, 27.3% and 40% respectively. In the years 2005/06 and 2008/09, collections were below estimates by 16% and 34.5% respectively. Collections in the year 2008/09 were significantly less (by 34.5%) than the target because harvesting and operations of forest based industries were closed for almost half of the year for the whole country waiting for registration of sawmills. Even after completion of registration, relevant documents such as RCCB and ERV were submitted late in the districts and they could not issue licenses. Nevertheless, it is evident that actual revenue collection in the last five financial years has indicated a clear improvement. This reflects the impact of the improvements made in the revenue collection system. It also reflects the role and effectiveness of FBD in coordinating revenue collection from the districts. Table 30. Performance of FBD in revenue collection (actual vs estimates). Year
2004/05 2005/06 2006/07 2007/08 2008/09 2009/10
Revenue Actual Est1. Actual Est. Actual Est. Actual Est. Actual Est Actual Est Revenue in USD mill.
8.93
5.43
7.56
9.00
12.09
9.50
17.71
12.66
12.97
19.79
35.29
-
Actual,% of est. 64.5 -16.0 27.3 40.0 -34.5 - 1Est = Estimates; - sign = percentage (%) decrease Discussions with the FBD headquarters staff responsible for revenue collection indicated that they have a good understanding of the relevant sections of the Regulations for charging and collection of revenue. Similar observations were noted in the districts visited. The accounts department at FBD HQ registers the received revenue into the Ministerial Cash Book, which is the basis for preparation of monthly collection reports, also uses the RCCB. The accounts department also does the bank reconciliation statement to verify that all the transfers from the districts have been credited to the HQ account. After verifying that the transfers have been credited, the accounts department is supposed to issue acknowledgment receipts to the respective districts. Despite remarkable improvements in revenue collected by FBD over time, there is still a challenge with respect to effective performance of checkpoints in revenue collection. FBD has tried to establish many checkpoints in strategic places in each region where harvesting is operational, yet they are not sufficient because in many places there are many routes which dealers can use. Evidence from a recent study in Tabora (Ngaga, 2009) revealed that there are only three checkpoints in the whole region, namely Pangale (a LGA checkpoint), Kiombo and Nzega. Also, some of these checkpoints are not managed by staff under FBD. In addition, a range of one to two staff are working for 24 hours with no reliable security in the checkpoints. Considering that they work many hours and the salary is low, there is a high risk of corruption since staff is likely to collude with trades.

66
8.3.8 Suggestions for improvement of revenue collection systems Improve staff remuneration in the checkpoints. Establish a mechanism to provide incentives for staff dealing with revenue collection. This is because they work for long hours especially those dealing with patrols and surveillance and checkpoints without compensation while salaries are low. This situation creates a conducive environment for corruption and bending of regulations in favour of dealers and/or self benefits. Improve facilities and number of checkpoints. The study recommended that there is need to strengthen capacity at HQ, districts and checkpoints in terms of facilities. Staff without facilities will not help FBD to realise the intended results. Opening new check points especially in strategic areas (such as along railway lines) in the region where harvesting is operational will improve monitoring operations in the checkpoints. Establishment of effective MIS system. Considering the challenge on available forest revenue data and information overtime in both FBD and in LG offices there is a need to establish a centralised MIS system for consolidation and storage of harvesting and revenue collection data and reports. The unit could be providing accurate data for management purposes in planning and performance evaluation of revenue collection progress. Development of national forest certification scheme. Forest certification is an increasingly common market-led system for (i) improving sustainability of forest management, and (ii) demonstrating to stakeholders, such as purchasers of forest produce, in an objective manner that a certain forest area is managed in a sustainable manner according to agreed standards. Certification schemes for forest produce in the country are yet to be developed. Many markets, especially in Europe, increasingly require chain-of-custody certification for timber products. In the future, certification may be necessary to secure access to international markets particularity to forests produce harvested from natural forests and woodlands which are potential in international markets. Properly functioning certification system (both forest certification and chain-of-custody certification) will improve the transparency of timber business, thereby reducing irregularities with special reference to illegal operations which will be useful outcome for the purpose of improving revenue collection.
9. PROCESSING OF PRODUCE 9.1 Ownership and types of industries 9.1.1 Sawmilling The forest based industry in Tanzania is largely dominated by sawmilling, woodworks/furniture marts and joinery. Other industries include paper, wood based panels, and poles treatment plants. The number of sawmills has increased from about 140 in 1998 to 367 registered in 2005 to 512 surveyed in 2008 (Ngaga, 1998; FBD, 2005; FBD, 2008). About 400+ are small scale wood machinery (locally fabricated circular saw or roller bench with rails or micro-mills), most of which are found around the SHFP. Overall, therefore, over 70% are micro-mills (“dingdongs”) and 25% small (Kara type according to one of the manufacturers) and only 5% are medium size mills. The micro-mills (Figure 12) are characterised by simple mobile technology, powered by a diesel engine, and an all manual operation. Inadequate financing, very small investments to equipment and low level of maintenance lead to poor quality timber products. For example, out of over 200 mills found at SHFP, 100-150 are micro-mills. Each of these micro-mills employ about 4-5 persons. The mills are using good quality sawlogs to produce low quality sawnwood at fairly low recovery rate (33%), resulting in a lot of sawdust (see Figure 12). Other small scale types of sawmills (Kara/Amec, Laimet, CVT, Forester; in all, there are about 50 of these at SHFP) have a log inputs not exceeding 5 000 m3/year and employs about 5 to 8 persons. Also, there are a few medium sized sawmills, like Sao Hill sawmills, TANWAT and KVTC which produce over 20 000 m3 of sawnwood annually with fairly good recovery rates (over 40%) and good quality sawnwood. It was also noted that most of the small scale sawmills do not have the required technical staff as per forest regulations.

67
Figure 12. Example of a micro-mill (“Ding dong”) at SHFP. Sawmillers have formed associations such as the Southern Highlands Forest Industries Association (SAFIA), the Northern Forest Industries Association (NOFIA) and an apex association called Shirika la Viwanda vya Misitu Tanzania (SHIVIMITA). 9.1.2 Pole treatment plants There are several pole treatment plants in the country (Table 31) and many of them produce good quality poles (Figure 13), especially those using standard pole treatment plants (for example, Sao Hill industries, Mufindi Wood Poles and Timber Ltd, Ihembe Industries and TANWAT). However, many of these plants are also producing poor quality poles, especially those using local treatment by soaking or dipping poles (or timber) into a container with chemicals. These poles are also found in the market causing consumers to use poor quality products. Table 31. Production capacity for transmission poles in Tanzania. Source: Field survey 2011.
Name of Company Location Production capacity poles
/year Sheda General Supplies Mafinga, Iringa region 12 000 Ihembe Mafinga, Iringa region 15 000 SaoHill Industries Mafinga, Iringa region 160 000 TANWAT Njombe district, Iringa region 40 000 Lesheya Nyololo, Mufindi district, Iringa region 30 000 Mufindi Wood Pole and Plant and Timber Ltd
Mufindi district, Iringa region 70 000
Muwa Trading Company Ltd Tanga 30 000 Apple Craft Ltd Makambako 10 000 Fibre board 2000 Ltd Arusha 75 000 Kili wood Products Ltd Moshi 75 000 Timber Sales East Africa Ltd Dar es Salaam 22 000 New Forest Company Kilolo, Iringa 100 000
Total
639 000

68
In the poles sector there are also numerous smaller operators as the business has been lucrative. Sourcing is done at village level, only purchasing a few raw poles at a time. The poles are then often treated in the local facilities as described above.
9.1.3 Wood based panels industries Production of wood based panels in Tanzania is fairly small. There are three mills, namely Tanga plywood mill in Tanga region, Fibreboard Africa Limited in Arusha region and Tembo Chipboard in Tanga region (closed). TANWAT has plans to build a new plywood mill in Tanzania and is also considering investing in the production of a Medium Density Fibreboard (MDF) mill. If raw material sourcing can be secured, plywood production is seen as a good investment in Tanzania. Raw material for an MDF plant is available but the economics of sourcing have not been analysed yet. Currently, TANWAT has 14 000 ha of plantations, and is willing to expand them, but has not been able to acquire suitable land for this purpose. The current markets do not consume large amounts of plywood but this is expected to change. Good quality plywood supply will create demand, especially in the construction sector segment. Plantation pine is a good raw material for plywood and globally the most competitive softwood plywood mills use pruned plantation pine logs as their raw material. Further processing, i.e. sanding and possibly coating, of the plywood seems feasible.
Figure 13. Poles treated at Sao Hill industries ready for markets. 9.1.4 Pulp and paper mill Mufindi Paper Mills (MPM) produces some 40 000 tons of kraft paper annually and is expected to expand its production to 100 000 tons/year. The Company sells its products to both domestic and international markets. Export markets include Kenya, Uganda, Malawi, Zambia, India, Sri Lanka, Bangladesh, Malaysia, Vietnam, Iran, Egypt and Saudi Arabia. MPM is investing in its own power production and is installing a biomass boiler. The boiler has a capacity of 36 MW and will consume an estimated 700 tons of biomass daily. Also, as there are plans to increase the production capacity of the mill from 40 000 tons to 100 000 tons, the pulp wood consumption rises to 750 000 m3. Additionally, the fuel wood consumption will increase to

69
some 300 000 m3/year. Total roundwood consumption of the MPM facility would therefore slightly exceed 1 million m3 annually. MPM realises that the government plantations cannot provide the raw material requirements on a sustainable basis and is investing in its own eucalyptus plantations. The Company has a land bank of 20 000 to 30 000 ha and is planting some 2 000 ha annually. So far some 4 000 to 5 000 ha have been planted. 9.2 Raw material supply and quality Almost all industries are getting raw material from government industrial plantations as discussed earlier in chapter 7.1.1 and the total demand for raw material was estimated at 1.6 million m3 of round wood. The quality of sawlogs from government plantations is relatively good compared to sawlogs from individual woodlots where harvesting of immature timber is common. In 2005, the total installed capacity of the mills was 2.66 million m3 per year of which 2.20 million m3 was softwood and 0.5 million m3 was hardwood representing 83% and 17% respectively (FBD, 2005). There has been, therefore, a significant increase in the installed capacity when compared to the annual capacity of 750 000 m3 in 2001. However, the total utilisation capacity of most mills is less than 50% of the installed capacity and the overall production performance has been poor for many years. The main reason is inadequate raw material supply. 9.3 Constraints facing the sub-sector There are many factors that the study has found which affect different levels of the processing chain of forest produce in Tanzania. Similar findings are reported by FBD (2009). Some of these factors include the following: Dwindling supply of raw material which has gradually increased logging distances and
transportation to mills and hence production costs; Poor quality of forest products caused by many factors including the quality of raw material,
sawing machines, storage and expertise. Most stakeholders are reported to have little entrepreneurial skills. Also, most producers and traders do not have good storage facilities and sell their products without proper and adequate drying;
High prices of forest products relative to population income caused partly by increased logging, raw material and finished transportation costs, and increased prices of fuel and lubricants. In addition, poor infrastructure limit producers and traders to look for cheaper means of transport;
The timing of delivering the products which is also contributed by the small volume and inconsistent production in forest-based industries;
Packaging and presentation, and export financing; Lack of appropriate trade policy; and, Cumbersome procedures and bureaucracy, and trade barriers. 9.4 Potential for future investment The potential for future investment in plantations and processing is very high in Tanzania. As pointed out earlier, demand for wood is growing fairly fast and in the next 20 years there is likely to be a shortfall of over 2 million m3 of wood. Some potential areas for future investment are in the following areas: Modernisation of SMEs. The processing industry is characterised by small scale sawmills
using poor technology with very little or no value addition. Smallness of the processors means that they cannot have influence on the marketing chain and end up reaping low profit. As pointed out elsewhere, the sawmilling industry, paper mills and transmission poles are growing. Some sawmills especially medium ones such as Sao Hill sawmills, KVTC and TANWAT, are improving their production lines to increase value additions;

70
Drying of timber. Drying of sawn timber is currently not common in Tanzanian SMEs. Most of the timber is sold green. Improving drying therefore is one of the opportunities for SMEs and larger operators as well. This will improve the product quality and value adding. Drying of sawn timber is one of the important stages in the processing and adding value to the products; without drying there cannot be other value adding processes; and,
Bio-energy in electricity production and other energy alternatives. Most wood residues can
be used to produce electricity in combined heat and power plants if there is excess biomass. Already, several plants (MFP and TANWAT) are using these residues to produce power for the factories and selling to neighbouring towns. Other small scale investors are trying to use sawdust to produce briquettes but still on a very small scale.
10. SOCIO-ECONOMIC AND ENVIRONMENTAL CONTRI-BUTIONS OF FORESTS 10.1 Current and potential income generation The annual value of forest goods and services generated from forestry in Tanzania per year is estimated at USD 2.2 billion which is equivalent to 20% of the Gross Domestic Product (GDP) based on 2006 prices (MNRT, 2008). However, poor pricing complicates the market transactions. Eventually, the GDP contribution reported in the national accounts is small given that forests in Tanzania provide a broad range of goods and services that have high economic value, e.g. maintenance of life support systems like timber, fuel-wood, fodder and non-timber products. Millions of people are generating income in various ways through these products but very informal and therefore not recorded. There are also a lot of resources, especially non-timber forest products which are tapped or not properly utilised to maximise their value and increase incomes. Forests provide a source of natural habitat for biodiversity and repository of genetic wealth, provide means for recreation and opportunities for eco-tourism. In addition, forests help in watershed development, regulating water regimes and conserving soils. They contribute to the process of carbon sequestration and act as carbon sinks, which is important for reduction of green house gases and global warming. In ecologically sensitive areas, like mountains and river catchments, forests play an important role for prevention of floods, etc. All these are potential areas which call for a need to stimulate and promote its potential and ensure proper accounting of the sector. 10.2 Current and Potential employment Employment is one of the major economic contributions of the forest sector of Tanzania. A recent study by SUA and IRA (2006) on Forest Resource Valuation estimated the total direct employment in forest related activities at 1 373 000. This estimate does not include indirect jobs or employment in sawmilling (which employs c. 10 000 people) and, most important, transporting and trading charcoal in the urban areas. According to MNRT (2008), the forest sector provides about 3 million person-years of employment (MNRT, 2008). Employment is provided through forest industries, government forest administration and self-employment in forest related activities. As the informal sector grows, the potential to increase employment in forestry is high, especially by capitalising on opportunities for value addition products and promoting use of NWFP. 10.3 Plantations in forest conservation Tanzanian forest plantations have, as shown in many research reports, a surprisingly high potential biodiversity. Biodiversity conservation has therefore been incorporated in the Management Plans of the plantations. The plantation areas are rich in biodiversity especially in the river valleys e.g. Longuza and Kiwira with different life forms of flora and fauna. Some, for example the Rondo Forest reserve contains a

71
far greater number of endemic species than any other coastal forest. According to the 1993 biological survey, Rondo was ranked as the 44th most important forest in Africa and Madagascar for conservation of threatened birds, and is also a habitat of both mammalian and reptile species which are rarely seen. The forest reserve also has a lot of plant species, some new to biologists. Rondo forest is among the six-biodiversity hotspots in Tanzania and the second among coastal forests. Most plantations retain patches of natural forests especially for preservation of water sources and avoiding loss of biodiversity. They aim at ensuring that protective functions of forests are observed all over the area under the plantation management. Riverine vegetation is left undisturbed during forest resources harvesting, e.g. in Buhindi forest. Other conservation activities include protection against cultivation on steep slopes and on water sources.
11. CONCLUSIONS AND WAY FORWARD 11.1 Conclusions Historically, forest plantations were established and managed by the state for many years and, due to various constraints, the area has remained the same (85 000 ha) for many years. Most of the plantations are not properly managed, especially due to lack of adherence to good silvicultural practices. However, following revision of the national forest policy and the government taking a number of steps to create an enabling environment for private sector participation, private forest plantations are growing fairly rapidly. The available information on out-growers and individual farmers is based on estimates as there is no reliable information collected by the districts all over the country. Generally the health of most plantations is good although fire seem to be a major problem. The current forest/tree tenure puts most of the forest under general land which suffers from illegal tree felling for charcoal and timber processing, forest clearance for livelihoods and other economic and social reasons, bush fires, forest invasion for land occupation and agriculture. To address some of these problems, PFM is being promoted. Collection of revenue by the central government for the past seven years has shown remarkable increase after addressing some of the loopholes. Prices of roundwood are still administratively set. The basic system of revenue collection is operational and seems to be well understood at all levels. Generally, the use of LGAs has enabled FBD to perform relatively well in revenue collection. However, the capacity of the districts to further improve revenue collection is inadequate. Also, there is generally low investments in terms of physical resources in the districts. There are many areas which the government needs to focus on and take some measures to further improve revenue collection. Trade in forest products, particularly sawnwood and poles is growing. Most of the products are exported to Kenya. Also, the number of traded forest products has increased significantly in the past five years. Analysis and forecasts of supply and demand for wood raw materials has revealed that demand will double by 2030 to 4.2 million m3 (of roundwood equivalent) creating a significant supply deficit of about 2.2 million m3. Supply dynamics in the country will undergo a major change after next five years. Government plantations are characterised by an uneven age structure due to lack of replanting in the past. Consequently, roundwood supply from government plantations is forecasted to collapse in the next five years due to the recent trend of increased harvesting. However, it is forecasted that private small individual farmers and commercial plantations will be the major suppliers, although most of the output will be consumed by big companies. SMEs are likely to suffer as most of them will be forced to close down. The processing industry is dominated by micro-sawmills most of which have very low recovery, wasting a lot of valuable wood and producing low quality products. These products find buyers in the domestic market, which is not overly sensitive to quality. This situation, together with a weak economy, makes prices of final products low and, as a result, the profit to producers of raw materials and processors is fairly low. Consequently, the production is less profitable and does not attract any investments into the production.

72
Sustainable forest management in Tanzania, therefore, will require interventions from primary production, processing and marketing of final products. Free market mechanisms can solve most of the prevailing challenges in the long run. It will increase the price of final products and processor can invest in modern technology, lower production costs and produce value added products and profits will trickle down to primary producer. 11.2 Recommendations/way forward Based on the analysis of the public forests and conclusions, the following recommendations are presented: To improve private and public forest plantations in terms of forest management especially fire
management, growing stock, use of improved seeds and germplasm should be considered. Supply forecast shows that there will be a serious shortage of wood raw material for 10 – 15 years beginning 2017;
Non-Industrial plantation forests (woodlots and individual famers) are growing fairly fast. There
is a need to provide technical knowledge on tree farming, access to financial incentives and marketing information;
Commercial private forest plantations are growing and will make significant contributions to
raw material supply. There is a need for the government to continue creating an enabling environment through dialogue between public and private actors on availability of land, improvement of infrastructure and bureaucracy associated with exports;
There is a need to increase transparency and finally allow the market to set the price for logs.
This would enable final sawntimber prices to fluctuate, reflecting the production costs and profit made in a healthier business environment. Higher prices will increase profits, the government will collect more revenue, companies and tree growers will all benefit. This will provide stronger incentives for establishment of new forests and forest plantations in Tanzania;
Given the expected severe shortage of sawlogs in the near future, there is a need to adjust the
harvestable volume to reach sustainable levels while providing time for the industries to adjust to the situation;
There is a serious need to enforce existing regulations and guidelines regarding harvesting of
forests. Currently, there are many micro-mills with low recovery rates operating in public plantations; and,
There is inadequate knowledge of industry, financing, market information and strategies.
Therefore, efforts to build entrepreneurial skills, collection of market information and sharing among different key players should be promoted.
Poor technology resulting to low efficiency in wood processing calls for involving private
companies to invest in better technology both in machinery and training. Consider supply guarantees to serious investors.
Research is needed to bring out good and satisfactory information on technical knowledge (e.g.
mechanical and physical properties) of lesser know species, and where information for some of these species is know it should be brought to attention of end users and producers.
There is serious need for all stakeholders to work together to improve database and
information which is lacking at all levels. Tanzania has established a National Forestry and Beekeeping Databank (NAFOBEDA) but it is fairly weak in terms of resources – staff, facilities and financing.

73
REFERENCES Abeli, W.S. & Maliondo, S.M. 1992. Silvicultural management and harvesting operations in forest
plantations in Tanzania. pp 45-52. In: IUFRO meeting on silviculture and harvesting operations in tropical forests. October 1992. Kuala Lumpur, Malaysia.
Ahimana, C. & Maghembe, J.A. 1987. Growth and biomass production by young E. tereticornis under agroforestry at Morogoro, Tanzania. Forest Ecology & Management, 22: 219-228.
Akida, A. and Blomley, T. 2006. Trends in Forest Ownership, Forest Resources Tenure and Institutional Arrangements: Are They Contributing to Better Forest Management and Poverty Reduction? Case Study from Tanzania. Unpublished Report. FAO, Rome, Italy.
Angyelile, S. 2010. Ukaguru Forest Plantation data and information for Forest and Beekeeping Division paper on forest plantation management in Tanzania. 1pp.
Balama, C. 2010. Some information on management of government forest plantations in Tanzania. TAFORI. 8pp.
Bekker, C., Rance, W. & Monteuus, O. 2004. Teak in Tanzania: The Kilombero Valley Teak Company. Bois et Fôrets des Tropiques 279: 11-21.
Blomley, T. and S. Iddi, 2009. Participatory Forest Management in Tanzania: 1993 – 2009. Lessons Learned and Experiences to date. Ministry of Natural Resources and Tourism, Forestry and Beekeeping Division, Dar es Salaam. 71 pp.
BoT 2010. Economic and operations report for the year ended 30th June, 2010. Bank of Tanzania, Dar es Salaam. http://www.bot-tz.org/Publications/publications and Statistics. 102pp.
Bryant, C.L. 1968. The effect of weed control on the growth of teak in Tanzania. Silviculture Research Note, 8. 2pp.
Canon, P. 1985. Studies in fire protection, stumpage and dieback. FAO Document No. 2, Rome. Chamshama, S.A.O. & Hall, J.B. 1987a. Effects of nursery treatments on E. camaldulensis field
establishment and early growth at Mafiga, Morogoro, Tanzania. Forest Ecology & Management, 21: 91-108.
Chamshama, S.A.O., Monela, G.C., Sekiete, K.E.A. & Persson, A. 1992. Suitability of the Taungya system at North Kilimanjaro forest plantation, Tanzania. Agroforestry Systems, 17: 1-11.
Chamshama, S.A.O., Mugasha, A.G. & Langerud, B.R. 1996a. Effect of moisture stress conditioning on ecophysiology, survival, growth and drought tolerance of L. leucocephala seedlings. Faculty of Forestry, SUA.Record No. 63: 16-23.
Chamshama, S.A.O., Mugasha, A.G. & Langerud, B.R. 1996b. Effects of top pruning on growth and survival of Prosopis chilensis seedlings. pp 194-198. In: Asoka C. Yapa (Editor): Proceedings of International Symposium on Recent Advances in Tropical Tree Seed Technology and Planting stock Production. Muak-Lek, Thailand. 232pp.
Chamshama, S.A.O. and R. E. Malimbwi, 1996. Thinning softwood plantation forests in Tanzania. Faculty of Forestry, SUA.Record No. 63: 41-49.
Chamshama, S. A. O. and L. Nshubemuki, 2011. Plantation forest management in Tanzania: Current situation and future focus. Paper presented at the the forest plantations pests, insects and soil problems workshop, Kibaha, Tanzania. Feb 2011. 25pp.
Cossalter, C. & Pye-Smith, C. 2003. Fast-wood forestry: Myths and realities. CIFOR, Jarkata, Indonesia. 50pp.
Craib, I.J. 1939. Thinning, pruning and management studies on the main exotic conifers grown in South Africa. Dept. of Agriculture and Forestry Bulletin 196. Government Printer, Pretoria, South Africa. 179pp.
Enters, T., Durst, T, B., and Brown, C. 2004. What does it take? The role of incentives in forest plantation development inthe Asia-Pacific Region.
Ernst and Young, 2005. Auditing of the performance and redesign of the revenue collection system for Forestry and Beekeeping Division. Final report. Ministry of Natural Resources and Tourism, Forestry and Beekeeping Division, Dar es Salaam, 20 pp.
Evans, J. 1982. Plantation forestry in the tropics. Clarendon Press, Oxford, UK. 472pp. FAO 1991. Exotic pests of conifers: A crisis in African forestry. Worshop proceedings, Muguga,
Kenya. 3-6 June, 1991. 160pp. FAO 2000. Étude sur les ressources forestières du Sénégal. Période: 1992-1999. In Data Collection
and Analysis for Sustainable Forest Management in ACP Countries. EC-FAO Partnership Programme (1998-2000), Project GCP/INT/679/EC. Rome.
FAO 2001a. Biological sustainability of productivity in successive rotations. Report based on the work of J. Evans. Forest Plantation Thematic Papers, Working Paper 2. Forest Resources Development Service, Forest Resources Division. FAO, Rome, Italy. (Unpublished). 24pp.
FAO. 2001b. Protecting plantations from pests and diseases. Report based on the work of W.M. Ciesla. Forest Plantations Thematic papers, Working Paper 10. Forest Resources Development Service, Forest Resources Division. FAO. Rome, Italy. (Unpublished). 19pp.

74
FAO 2010. State of World’s Forests. Rome. FBD, 2005. Forest Inventory Reports. Districts of Rufiji, Liwale, Kilwa, Mkuranga/Kisarawe,
mvomero, Tunduru, Kilombero, Mpanda, Nachingwea, Ulanga,and Handeni/Kilindi. Ministry of Natural Resources and Tourism, Forestry and Beekeeping Division, Dar es Salaam. 100pp
FBD, 2005. Evaluation of Sawmills and Other Primary Wood Industries in Tanzania. Ministry of Natural Resources and Tourism, Forestry and Beekeeping Division, Dar es Salaam.
FBD, 2008. Evaluation of Sawmills and Plants in Tanzania for Registration. Ministry of Natural Resources and Tourism, Forestry and Beekeeping Division, Dar es Salaam.
FBD, 2010. Plantation forest management plans for all public plantations. FBD 2003. Technical specifications for management of forest plantations in Tanzania. Forestry and
Beekeeping Division, Ministry of Natural Resources and Tourism. Dar es Salaam, Tanzania. 8pp.
Forest Division 1982. Management practices in conifer plantations in Tanzania: notes on forestry operations. Forest Division, Ministry of Natural Resources and Tourism. Dar es Salaam, Tanzania. 68pp.
Green Resources Ltd. 2010. Green Resources Plantations in Africa. Web site visited on 15.11.2010. 7pp.
Haltia, O. & Keipi, K. 1997. Financing forest investments in Latin America: the issue of incentives. Washington, DC: Inter-American Development Bank.
Iddi, S., Chamshama, S.A.O. & Malimbwi, R.E. 1996. Planting spacing in Tanzania – a review. Record No. 63: 25-33.
Indufor, 2011. Timber market dynamics in Tanzania and in key export markets. Private forestry and carbon trade project. 193pp
Isango, J.A. & Nshubemuki, L. 1998. Management of forest plantations in Tanzania with emphasis on planting stock and growth and yield. Faculty of Forestry, University of Joensuu. Research Note, 68: 25-37.
Kalaghe, A.G. & Mansy, W. 1989. Effect of different site preparation intensities on the growth of P. patula at Sao Hill, Tanzania. Forest Ecology & Management, 29: 29-38.
Kiangi, M.A. 2010a. Sao Hill Forest Project data for Forestry and Beekeeping Division paper on forest plantation management in Tanzania. Sao Hill, Tanzania. 10pp.
Kiangi, M.A. 2010b. Early survival and growth of Pinus patula and P. elliottii at Sao Hill Forest Plantations, Iringa, Tanzania. Special Project Report, SUA, Morogoro, Tanzania. 25pp.
Madoffe, S.S. & Chamshama, S.A.O. 1989. Tree improvement activities in Tanzania. Commonwealth Forestry Review 68: 101-107.
Maghembe, J.A. 1979. Effect of weeding and some soil characteristics on the survival and growth of P. caribaea in plantations at Ruvu. Division of Forestry, University of Dar es Salaam, Record No. 8. 12pp.
Maghembe, J.A., Kaoneka, A.R.S. & Lulandala, L.L.L. 1986. Intercropping, weeding and spacing effects on growth and nutrient content in L. leucocephala at Morogoro, Tanzania. Forest Ecology & Management, 16: 269-279.
Maliondo, S.M.S. & Chamshama, S.A.O. 1996. Role of intensive silviculture on increasing plantation productivity in Tanzania. Faculty of Forestry, Sokoine University of Agriculture, Record 63: 50-58.
Maliondo, S. M., Chamshama, S. A., Lulandala, L. L. & Mtui, E. B. 2007. Growth of second rotation Pinus patula stands: effect of intercropping with Leucaena diversiforlia legume at Shume Forest Plantations Project, Tanzania. Tanzania Journal of Forestry and Nature Conservation 76: 110-117.
Maro, R. 2010. Meru Forest Plantations data and information for Forestry and Beekeeping Division paper on forest plantation management in Tanzania. Sao Hill, Tanzania. 3pp.
MFA, 2010. Private forestry and carbon trade project. Project document. Ministry for Foreign Affairs of Finland, Dar es Salaam. 58pp.
Mhando, M.L., Maliondo, S.M.S. & Mugasha, A.G. 1993. Early response of Eucalyptus saligna to site preparation and fertilization at Sao Hill Forest Project, Southern Tanzania. Forest Ecology & Management, 62: 303-311.
Mnangwone, I. Y. 2010. Tanga Forest Limited data and information for Forestry and Beekeeping Division paper on forest plantation management in Tanzania. Sao Hill, Tanzania. 3pp.
MNRT, 2005. The framework, criteria and guidelines for concession arrangements in plantation forests in Tanzania. Forestry and Beekeeping Division (FBD) October 2005.
MNRT 2008a. Participatory Forest Management in Tanzania. Facts and Figures. Forestry and Beekeeping Division. 13pp.
MNRT 2008b. Tanzania Forest Sector Outlook Study: 2008-2018. Forestry and Beekeeping Division. 142pp.
Mrecha, M.S. 2010. SUA Training Forest data and information for Forestry and Beekeeping Division paper on forest plantation management in Tanzania. Sao Hill, Tanzania. 3pp.

75
Mugasha, A.G., Chamshama, S.A.O. & Lupala, Z. 2006. Effect of post-harvest Cupressus lusitanica slash management on early growth of Pinus patula at Shume, Lushoto, Tanzania. Submitted: Tanzania Journal of Forestry and Nature Conservation. 9pp.
Munishi, P.K.T. & Chamshama, S.A.O. 1994. A study of wind damage on P. patula stands in Southern Tanzania. Forest Ecology & Management, 63: 13-21.
Mussami, P.M. 2010. Idete, Kitete, Mapanda, Taweta and Uchindile plantations data and information for Forestry and Beekeeping Division paper on forest plantation management in Tanzania. Sao Hill, Tanzania. 3pp.
Mtuy, M. C. P.1996. Forest plantation management in Tanzania: Past, Present and Future. Faculty of Forestry, SUA.Record No. 63: 4-6.
Ngaga, Y. M. 1998. Analysis of Production and Trade in Forest Products of Tanzania. Doctor Scientiarum thesis. Department of Forest Sciences, Agricultural University of Norway. 248.
Ngaga, Y. M. 2009. Performance of the improvement of revenue collection system for forestry and beekeeping division. A consultant report for Tanzania Forest Conservation and Management Project (TFCMP)- CREDIT No. 3604 – TA, Forestry and Beekeeping Division. Ministry of Natural Resources and Tourism. 56pp.
Nshubemuki, L., Chamshama, S.A.O. & Mugasha, A.G. 2001. Technical specifications on management of forest plantations in Tanzania. Forestry and Beekeeping Division. Ministry of Natural Resources and Tourism, Dar es Salaam. 50pp.
Odera, J.A. 1974. The incidence of host trees of the pine woolly aphid, Pineus pini (L.) in E. Africa. Commonwealth Forestry Review, 53: 128-136.
Procter, J.E.A. 1968. A nutritional disorder of pines. Commonwealth Forestry Review, 46: 145-154. Raunio, A.L. 1975. Clean weeding improves growth of teak in Longuza. Silviculture Technical Note
No. 25. Sabas, E. & Kalaghe, A.G. 1986. The influence of weeding on early growth of E. camaldulensis
Dehn at Igwata, Mwanza. Silviculture Research Note No. 44. 7 pp. SAIF 1994. Forestry Handbook. Pretoria, South Africa. 846 pp. SAIF 2000. South African forestry handbook. South African Institute of Forestry, V&R Printers,
Pretoria, South Africa. 734pp. Sangster, R.G. 1956. Weeding experiments with Eucalyptus. Silviculture Technical Note 3. 3 pp. SAVCOR, 2011. Audit of the performance and redesign of the revenue collection system of forestry
and beekeeping division. A consultant report Ministry of Natural and Tourism (MNRT). 24pp. Singunda, W.T. 2009. Economic Contribution of Private Woodlots to the Economy of Mufindi
District, Tanzania. MSc Dissertation, Faculty of Forestry and Nature Conservation, Sokoine University of Agriculture. 142 pp.
Solberg, K.H. 1978. A nursery and field experiment with various potting soils and fertilization, P. caribaea, Tanzania. Agricultural University of Norway, Dept of Silviculture. Technical Report No. 9: 49pp.
Solberg, K.H. 1981. Relationship between nursery treatments and field performances of P. caribaea var. hondurensis, Tanzania. Paper, 17th IUFRO Congress. Kyoto, Japan. 6pp.
Solberg, K.H. 1983. Evaluation of the field experiments at Ruvu in Tanzania and some considerations about the future of Ruvu afforestation project. Agricultural University of Norway, Department of Silviculture, Aas, Norway. 283pp.
Tangwa, J.L., Chamshama, S.A.O. & Nsolomo, V.R. 1988. Dieback disorder in P. patula, P. elliottii and P. caribaea at Sao Hill, Southern Tanzania. Commonwealth Forestry Review, 67: 263-268.
TASONABI, 2009, Transport based fees for charcoal and fuelwood. Final report. Ministry of Natural Resources and Tourism, Forestry and Beekeeping Division, Dar es Salaam, 53 pp.
TFCMP, 2007. Mapping Sub-component Volume 1 (Main report). Ministry of Natural Resources and Tourism, Forestry and Beekeeping Division, Dar es Salaam. 104pp
TNRF, 2009. How Tanzania’s natural resources contribute to poverty reduction. An analysis of MKUKUTA outcomes (2005-2009) related to forest and wildlife resources as a contribution to the MKUKUTA review. Tanzania Natural Resource Forum with TRAFFIC. 8pp.
Tomforde, M. 1995. Compensation and incentive mechanisms for the sustainable development of natural resources in the tropics: their socio-cultural dimension and economic acceptance. Eschborn: Gesellschaft für Technische Zusammenarbeit (GTZ).
TTSA 2010. Seed production and handling information for the period 2005-2010. TTSA, Morogoro, Tanzania.18pp.
UTR, 2001. National Forestry and Beekeeping Programme, 2001 – 2010. Forestry and Beekeeping Division. Ministry of Natural Resources and Tourism. 132pp.
URT 2008. National Forest Policy (Under review). United Republic of Tanzania. 59pp. URT, 2010. Hali ya Uchumi wa Taifa katika Mwaka 2009. Wizara ya Fedha na Uchumi, Dar es
Salaam. 241 pp.

76
Vichnevetskaia, K. 1997. Factors affecting productivity of tropical forest plantations: Acacia, Eucalypt, Teak and Pine. Working Paper GFSS/WP/02. Global Fibre Supply Study Working Paper Series. Forests Products Division, Forestry Department. FAO, Rome, Italy. 79pp.
Willan, R.L. 1963. Ground preparation and weeding exotic softwoods. Silviculture Technical Note 56. 12pp.
Williams, J. 2001. Financial and other incentives for plantation forestry. In: Proceedings of the International Conference on Timber Plantation.
Zobel, B.J., Van Wyk, G. & Stahl, P. 1987. Growing exotic forests. John Wiley & Sons. 508pp.


Contact us at: African Forest Forum
P.O. Box 30677-00100 Nairobi GPO KENYA Tel: +254 20 722 4203 Fax: +254 20 722 4001
www.afforum.org
African Forest Forum


