U.S.D.A. Forest Service Resource Bulletin SE- I2 October 1968 FOREST STATISTICS ------- -,,,, 2- 40- for the 22, # 8 U.S DEPARTMENT OF AGRICULTURE FOREST SERVICE SOUTHEASTERN FOREST EXPERIMENT STATION ASHEVILLE. NORTH CAROLINA
Transcript
U.S.D.A. F o r e s t S e r v i c e R e s o u r c e B u l l e t i n S E - I 2 O c t o b e r 1968
FOREST S T A T I S T I C S - - - - - - - -,,,,
2- 40- for the 22,
# 8
U.S DEPARTMENT OF AGRICULTURE
FOREST SERVICE
SOUTHEASTERN FOREST EXPERIMENT STATION
ASHEVILLE. NORTH CAROLINA
FOREWORD
This repor t h igh l igh t s t h e p r i n c i p a l f indings of t h e four th ForesL Survey i n t h e Southern Coasta l P l a i n of South Carolina, completed i n July 1968. Findings of t h e t h r e e e a r l i e r surveys, completed in 1936, 1947, and 1958, provide t h e b a s i s fo r measuring t h e changes t h a t have occurred and t h e t rends t h a t have developed over t h e p a s t 30 years.
Fores t Survey, author ized by t h e McSweeney-McNary Forest Research Act of May 22, 1928, a s amended, i s a continuing nationwide undertaking by t h e regional experiment s t a t i o n s of the U. S. Fores t Service . In Flor ida , Georgia, North Carolina, South Carolina, and Virginia , Fores t Survey is an a c t i v i t y of t h e Southeastern Forest Experiment S ta t ion , with head- quar ters a t Ashevi l le , North Carolina. The general ob jec t ive i s t o inven- t o r y p e r i o d i c a l l y f o r e s t lands, t h e i r ex ten t , condition, and volume of timber, and t o a s c e r t a i n r a t e s of f o r e s t growth m d deplet ion. It i s necessary t o keep t h i s bas ic information up t o date t o provide a sound b a s i s f o r t h e f o r m d a t i o n of f o r e s t p o l i c i e s and programs.
The 12-county a r e a covered by t h i s r epor t is one o f t h r e e Survey u n i t s i n South Carol ina . Similar r e p o r t s f o r the Piedmont and Northern Coastal P l a i n have been published, and copies are a v a i l a b l e a t t h e Southeastern S ta t ion . A Statewide s t a t i s t i c a l r epor t i s now being prepared and w i l l conta in addi- t i o n a l da ta a long with a comprehensive ana lys i s of t h e f indings .
Joe P. McClure, P ro jec t Leader, organized and coordinated t h e var ious phases of t h e Southern Coastal P la in Survey. Noel D. Cost was i n charge of da ta c o l l e c t i o n . William H . B. Haines supervised t h e a e r i a l photo preparat ion and i n t e r p r e t a t i o n and t h e d a t a computations. Richard L. Welch was responsible f o r compiling tinioer removal and w r t a i t y informa- t i o n . Herbert A. Knight was i n charge of ana lys i s and repor t ing .
Office personnel a s s i s t i n g in t h i s r epor t were:
Robert A. Cathey A s e s C. Nichols B e r t i e W. Greene Louise Shuford Cec i l C . Hutchins, Jr. Sammy S. Wenningham Joanne Hutchison Dorothy S. White Doniev W . Jackson Camilla E. Young Ruth E. McIntyre
The f i e l d p a r t y included:
John D. Nesbit, F i e l d Supervisor Thomas R . Bellamy, F i e l d Ass i s t an t
Edgar L. Davenport David L. P a i t J e f f r e y E . D u e s John F. P a r l i e r , Jr. Leonard G. Edwards Douglas R . P h i l l i p s Robert S . Hensley Nolan L . Snyder Roy C . Henson Richard J. White, Jr. Harold D . Mathews Lawrence C . Wilson Bruce E . Mullin
VALTON R . SMITH, Assis tant Director Division of Marketing, U t i l i z a t i o n , and Resources Research
FOREST STATISTICS ! I
for t h e
SOUTHERN COASTAL PLAIN of SOUTH CAROLINA 1968
by
N O E L D. COST, A S S O C I A T E RESOURCE A N A L Y S T
HOW TEE FOREST SURVEY IS MADE - - - - - - - - - - - - - - . - - 3
COUNTY TABLES:
1. Area, by land c l a s s - - - - - - - - - - - - - - - - - - . 1 3 2. Area of comm~rcial fo res t land, by o~wnership c l a s s - - - - 14 3. Area of c o m e r c i a l f o r e s t land, by f o r e s t type group - - - 1 5 4. Area of c o m r c i a l fo res t land, by stand-size c l a s s - - - 16 5 . Area of commercial f o r e s t lan3, by s i t e c l a s s - - - - - - 1 7 6. Area of commercial f o r e s t land, by s t o c k i ~ g c l a s ses of
growing-stoc* t r e e s - - - - - - - - - - - - - - - - - - - 18 7 . 1Iolume of sawtimber and growing stock on commercial
f o r e s t land, by species group - - - - - - - - - - - - - - 19 8. Net annual growth of sawtimber and growing stock on
c o m e r c i a l f o r e s t land, by species group - - - - - - - - - 20 9. Annual removals of sawtimber and growing stock on commer-
c i a l fo res t land, by species group - - - - - - - - - - - - 21
UNIT TABLFS:
Area of commercial f o r e s t land, by f o r e s t type and owner- c l a s s - - - - - - - - - - - - - . - - - - - - - . . . 22
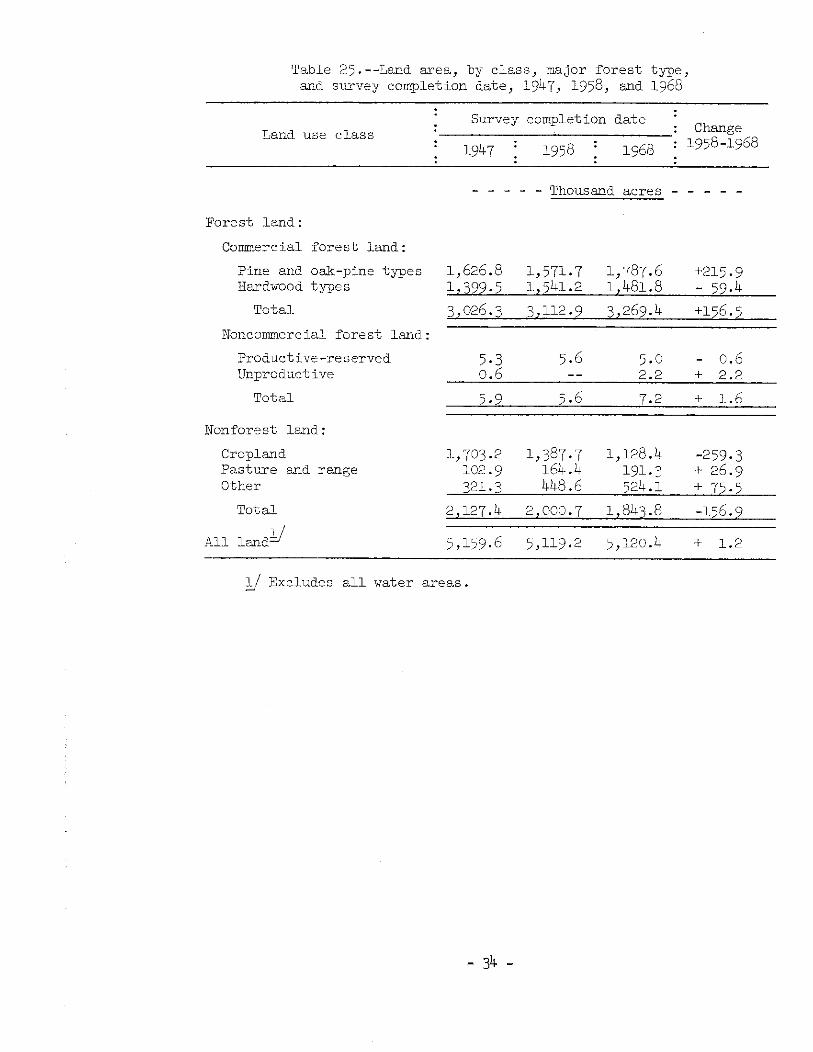
Area af c o m e r c i a l fo res t land, by ownership and stocking c lasses of growing-stock t r e e s - - - - - - - - - - - - - - 22 Volume of timber an conrmercial fo res t land, by c l a s s and speciesgroup . . . . . . . . . . . . . . . . . . . . . . 23 Number of growing-stock t r e e s on commercial fo res t land, by species and diameter c l a s s - - - - - - - - - - - - - - 24 Volume of a l l l i v e t r e e s on c o m r c i a l f o r e s t land, by species and diameter c l a s s - - - - - - - - - - - - - - - - 25 Volume of growing stock an commercial f o r e s t land, by species and diameter c l a s s - - - - - - - - - - - - - - - - 26 Volume of sawtimber on carrimercia1 fo res t land, by species and diameter "lass - . - . . - - - - - . - - - - - - - - - 27 Net annual growth and removals of growing s tack on com- mercial f o r e s t land, by species - - - - - - - - - - - - - 28 Net annual growth and removals of sawtimber on commercial fo res t land, by species - - - - - - - - - - - - - - - - - 29 h u a l mor ta l i ty of growing stock and sawtimber on com- mercial fo res t land, by species - - - - - - - - - - - - - - 30 Volume of a l l l i v e t r e e s and growing stock on commercial f o r e s t land, by ownership c l a s s and species group - - - - - 31 Volume of sawtimber on commercial fo res t land, by orner- s h i p c l a s s and species group - - - - - - - - - - - - - - - 31 Net annual growth and r e m v a l s of growing s tack on c o m r - c i a 1 f o r e s t land, by ownership c l a s s and species group - - 32 Net annual growth and removals of sawtimber on c o m e r c i a l fo res t land, by ownership c l a s s and species group - - - - - 32 Average net volwne per acre of sawtimber, growing stock, and c u l l timber on c o m e r c i a l fo res t land, by ownership c l a s s , major f o r e s t type, and species group - - - - - - - - 33 Land area, by c l a s s , major f o r e s t type , and survey comple- t i o n date - - - - - - . - - - - - . - - - - - - - - - - - - 34
Volume of savtimber, growing stock, and a l l timber on Com- mercial f o r e s t land, by species group, diameter c l a s s , and
date - - - - - - - - - - - - - - - - - - - 35
Since 1958 i n t he Southern Coastal P la in of South Carolina--
--area of commercial fo res t has increased by 156,500 acres, o r 5 percent. Commercial fo res t land t o t a l s almost 3.3 mill ion acres, o r 63 percent of t he t o t a l land area. Especially notice- able i s t he reversion of over 250,000 acres of former agr icul- t u r a l lands t o fo re s t . In contrast , over 104,000 acres of com- mercial fo res t were l o s t t o other land uses. Most of t h i s loss was t o a g r i c u l t d u s e s , but over one-third went t o urban develop- ment.
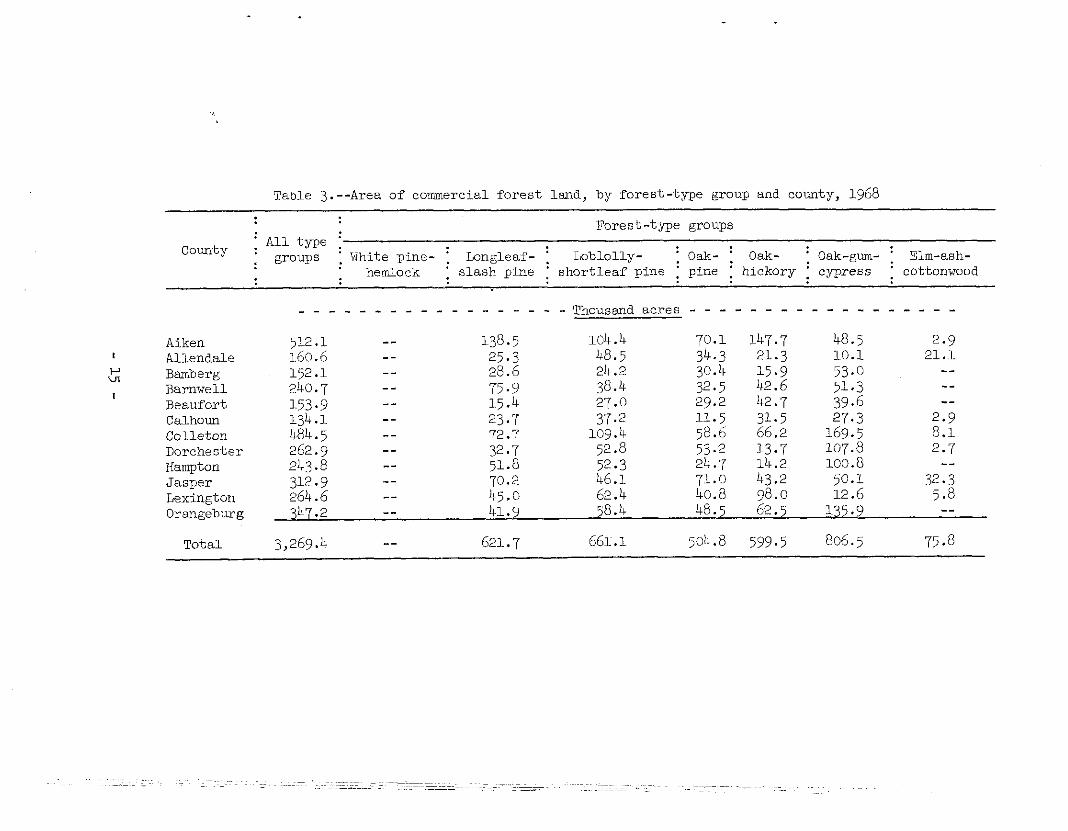
--area i n pine and oak-pine cover types has increased 14 percent and now makes up about 55 percent of the commercial fo res t . I n con- t r a s t , t he area i n hardwood cover types has decreased almost 4 oer- . - cent. Oak-gum-cypress, with over 800,000 acres, i s the leading cover type, followed by lob lo l ly pine, which occupies s l i g h t l y over 500,000 acres.
--area of commercial fo res t land owned by farm operators decreased 13 percent while miscellaneous pr ivate holdings increased 88 per- cent. Commercial forest land owned by farm operators was reduced - by 245,000 acres, most of which presumably shif ted t o the miscel- laneous pr iva te category. Collectively, farmers and miscellaneous pr ivate owners now own 2.6 mill ion acres, or 80 percent of the com- mercial fo re s t . Area i n public ownership i s up s l igh t ly , and for- e s t industry holdings have declined.
--sapling and seedling stands have increased by 167,700 acres , l a rge ly the r e su l t of n a t k a l reversion and planting. Acreage i n poletimber stands has remained about t he same, and sawtimber stands have in - creased by 87,000 acres . The area i n nonstocked fores t land i s down from 355,600 t o 227,000 acres. About 1 5 percent of a l l stands i n t h i s 12-county area originated wholly o r i n par t from a r t i f i c i a l re - generat ion.
--average stand density, measured i n basa l area per acre, of a l l l i v e t r e e s 5.0 inches d.b.h. and la rger has increased from 47 t o 54 square f ee t . S t i l l , only one acre i n e ight i s f u l l y stocked with growing-stock t r ee s , and over one-third of the stands are poorly stocked. This indicates t h a t t he current net growth, which aver- ages about 50 cubic f ee t per acre annually, could be increased sub- s t a n t i a l l y .
zompared t o a 7-percent de- 1;
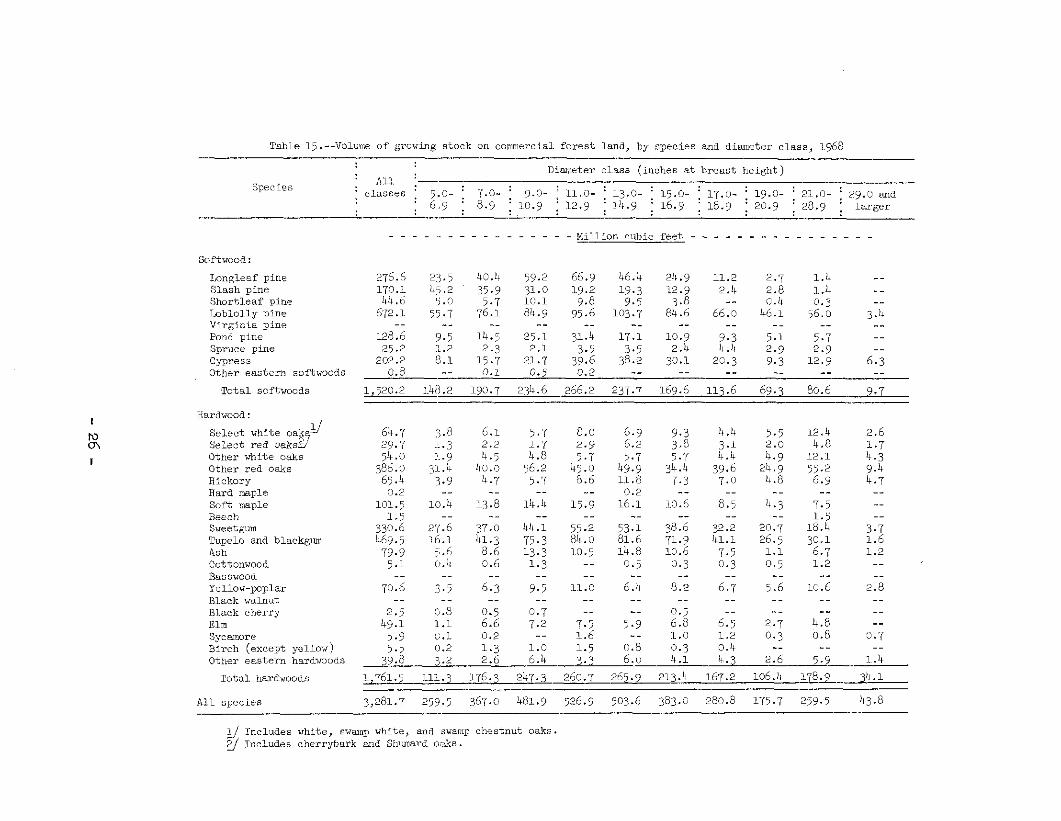
--volume of softwood growing stock, primarily pine, increased from 1 .2 t o 1 . 5 b i l l i o n cubic f e e t , or almost 29 percent, reversing a down-
,
ward trend i n softwood volume between 1947 and 1958. Volume of so f t -
~,
,
wood sawtimber is up almost 24 percent (
crease bet.reen 1947 ~ l d i958. ?+lost cf t'fie re<:&; Lacrease sa&imber volvae was i n iob lo l iy I.or.gleaf pi;les. Ir: 20L3- timber t r ee s , Loblol!.:~ &?d slash piae accc~c.ted Tor incst Of the increase i n voime, 1argel.i i n t he fora of; i a g r o ~ ~ h fro^. ~0Z.e of t h e older pine plantations.
--~iolume of hardwood growi-ng stock has continued. t o incrsase. and a t a f a s t e r r a t e thafi between the t-do previous su-veys. Voluxe of hardwood growing stock i s up 10 percent, compared t o a 2-percsnt increase between 1947 and i956. Volume of hardwood sawtinber i s up 9 percent, which reverses a downward trend i n hardwood sawtim- ber volume between 1947 and 1958. The red oaks a s a group made up most of the increase. Pdpelo and blackgm., however, which a re t he leading har:ir.iood species i n the are?" in tzrms of vol~me, maie very small gains.
--public and forest industry holdhgs produced almost 29 pel-cent cf t he ne t growth of growing stock, although these holdings account for only 20 percent of t he area of comercia1 fores t land. This indicates t h a t these lands are responding t o somewhat more inten- s ive management t h a r i s generally practiced on t h e farmer and mis- cel lmeous pr ivate holdings. This findlng also em2hasizes, how- ever, t h a t col lect ively, t he famer snd miscellaneous pr ivate l m d s s t i l l provide 71 percent of the net growth.
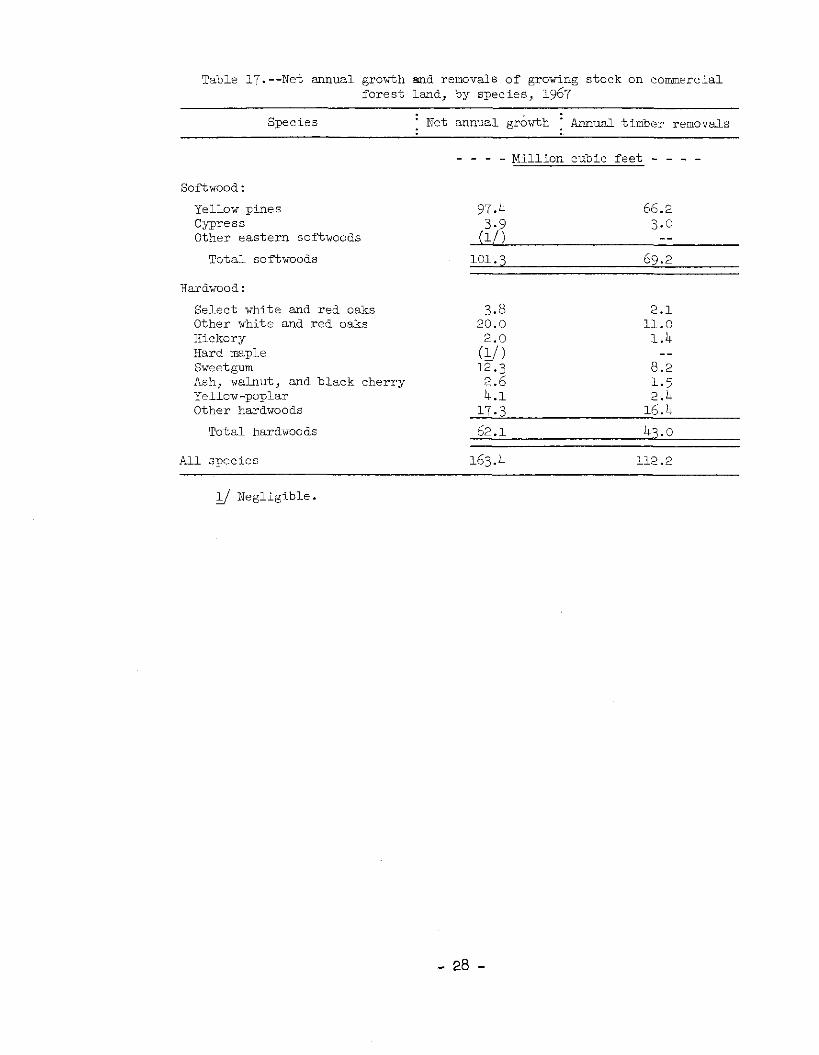
--net growth of growing stock exceeder; reaovais by a e s t i m t e d 51.2 mil l ion cubic fee t , or 46 percent. Over 60 percent of t h i s growth over removal was pine, about 21 percent -$as oak, with cypress and miscellaneous hardwood species accounting f o r t he remaining 19 per- cent. By ownership, 65 percent of the excess gro%ih was on farmer and miscellaneous pr iva te holdings, 18 percent on public holdings, and the remaining 17 percent on forest industry lands.
--net growth of sawtimber exceeded removals by an estimated 157.3 mil l ion board f e e t , or 39 oercent. The breakdowns of t h i s surplus growth by species and ownership follow closely t he breakdowns of growing stock.
--mortality of growino stock was esti;nat,ed t o t o t a l 24.7 miil ion cubic f e e t , which reduced the gross growth by about 13 percent. Over two-thirds of the mortali ty was hardwood, and s~ppres s ion and climakic f2,ctors were t h e leadbig ident i f iable csirses of Ceath.
IiOW TIE FOFU3ST SURVEY IS MADE
The method of survey i s essen t ia l ly a sampling procedure designed t o pro- vide r e l i a b l e s t a t i s t i c s primarily a t the State and Survey Unit levels . Individual county s t a t i s t i c s are presented t o permit adding any combina- t i on of counties together u n t i l t he t o t a l i s large enough t o meet the de- s i red degree of r e l i a b i l i t y . The basic steps of t he survey procedure were a s follows:
1. I n i t i a l estimates of fores t and nonforest areas were based on the c l a s s i f i ca t ion of 30,219'sample points systematically spaced on the l a t e s t a e r i a l photographs available.
2. The i n i t i a l estimates of area by land-use c lass were e i t he r ver i f ied o r adjusted on the basis of a ground check a t 1,789 of these sample points.
3. Estimates of timber volume and fores t c lass i f ica t ions were based on measurements recorded a t 1,144 of the ground check locations which f e l l wi-thin commercial fo res t land. A 10- point c lu s t e r of p lo t s systematically spaced on an acre were measured a t each of these sample locations using a basal area fac tor of 37.5 square f e e t per acre. Trees l e s s than 5.0 inches d.b.h. were t a l l i e d on fixed-radius p lo t s around the point centers.
4. Equations prepared from detai led measurements collected on the t r e e s t a l l i e d a t one out of every 20 sample locations were used t o compute the volumes of individual t a l l y t r e e s . A mirror ca l iper and sect ional aluminum poles were used t o obtain the addi t ional measurements on standing t r e e s required t o construct the volume equations. The same ?-percent sub- sample of p lo t s used for the tree-volume study also served as a qua l i ty control of f i e l d measurements. Felled t r e e s were measured a t act ive cut t ing operations t o provide u t i l i z a - t i o n factors f o r product and species groups and t o supplement t he standing tree-volume study.
5. Permanent sample p lo t s established in 1958 were reconstructed where possible, and t h e i r remeasurement provided the primary estimates of growth, removal, and mortali ty.
6. Ownership information was collected from l o c a l contacts, cor- respondence, and public records. I n those counties where the sample missed a pa r t i cu l a r ownership c lass , temporary sample p lo t s were added and measured t o describe t h e fores t condi- t i o n s within the ownership c lass .
7, A l l f i e l d data were sent t o Ashevi11e for ed i t ing and were pmzhed i n cards and stored on magne-tic tape for machine computi~g, sorting, and tabulation. Final e s t i m t e s were based on s t a t i s t i c a l summasies of the data.
?X?LIABILITY OF TfiE DATA
S t a t i s t i c a l analysis of these data indicates a sampling e r ro r of 5.8 per- cent for. the e s t i r r ~ t e of t o t a l commercial fo res t area, 3.2 percent for t o t a l cubic volume, and 2.7 percent for cubic growth. As these t o t a l s are broken down by county, fores t t w e , species, t r e e diameter, and other subdivisions, the sampling e r ro r increases. The order of t h i s increase i s suggested i n the following tabulat ion which shows the sampling e r ror to which the estimates are l i ab l e , i n te rns of one standard e r ror .
Forest : cubic Smplin ' Net c7x. -ft . ' 3 o m : e r r o r J i growth 1 area . er ror
~housand percent Mil1i0n percent Million Percent acres - cu. ft. cu. ft.
lj By random-sampiing formula. -
DEFINITIONS OF TERMS
Acceptable trees.--Growing-stock trees of commercial species that meet specified standards of size and quality, but not qualifying as desirable trees.
Basal area.--The area in square feet of the cross section at breast height of a single tree or of all the trees in a stand usually expressed as square feet of basal area per acre.
Commercial forest land.--Forest land producing or capable of producing crops of industrial wood and not withdrawn from timber utilization.
Commercial species.--Tree species presently or prospectively suitable for industrial wood products.
Cropland.--Land under cultivation within the past 24 months, including orchards and land in soil-improving crops, but excluding land cultivated in developing improved pasture. Also includes idle farmland.
Desirable trees.--Growing-stock trees of commercial species having no serious defects in quality limiting present or prospective use for timber products, of relatively high vigor, and containing no pathogens that may result in death or serious deterioration before rotation age.
Diameter class.--A classification of trees based on diameter outside bark, measured at breast height (4$ feet above the ground), D.b.h, is the com- mon abbreviation for "diameter at breast height." Two-inch diameter classes are commonly used in Forest Survey, with the even inch the approx- imate midpoint for a class. For example, the 6-inch class includes trees 5.0 through 6.9 inches.d.b.h., inclusive.
Farm.--Either a place operated as a unit of 10 or more acres from which - the sale of agricultural products totaled $50 or more ei-aually, or a place operated as a unit of less than 10 acres from which the sale of agricultural products for the year amounted to at least $250.
Farm operator.--A person who operates a farm, either doing the work him- self or directly supervising the work.
Farmer-owned lands.--Lands owned by farm operators
Forest industry lands.--Lands owned by companies or individuals operating wood-using plants.
Forest land.--Land at least 16.7 percent stocked by forest trees of any size, or formerly having had such tree cover, and not currently developed SOP nonforest use.
Fores t type.--A c l a s s i f i c a t i o n of f o r e s t lani? based upon t h e species forming a p l u r a l i t y of l i v e - t r e e s tocking.
White pine-hemlock.--Forests i n which eas t e rn white pine o r hemlock, s i n g l y o r i n combination, comprises a p l u r a l i t y of t h e s tocking. (Common assoc ia t e s include b i r c h and maple. )
Longleaf-slash pine.--Forests i n which longleaf o r s l a s h pine, s ing ly o r in combination, comprises a p l u r a l i t y of t h e s tocking. (Common a s s o c i a t e s include oak, hickory, and gum.)
Loblol ly-shor t leaf pine.--Forests i n which l o b l o l l y pine, s h o r t l e a f p ine , o r o ther southern yellow pines.except longleaf o r s l a s h p ine . - s i n g l y o r i n combination, comprises 2 p l u r a l i t y of t h e s tocking. (Common assoc ia t e s include oak, hickory, and gum.)
Oak-pine.--Forests i n which hardwoods (usua l ly upland oaks) comprise a p l u r a l i t y of t h e s tocking but i n which p ines comprise 25 t o 50 percent o f the s tocking. (common a s s o c i a t e s include gum, hickory, and yellow-poplar . ) Oak-hickory.--Forests i n which upland oaks o r hickory, s i n g l y o r i n combination, coniprise a p l u r a l i t y of t h e s tocking, except where p ines comprise 25 t o 50 percent , i n which case t h e s tand would be c l a s s i - f i e d oak-pine. (Corn-on as soc ia t e s include yellow-poplar, elm, maple, and b lack walnut . )
Oak-gum-cypress.--Bottomland f o r e s t s i n which tupelo , blackgum, sweet- gum, oaks, o r southern cypress, s i n g l y o r i n combinaxion, comprises a p l u r a l i t y of t h e stocking,except where pines comprise 25 t o 50 per- cent , i n which case t h e s tand would be c l a s s i f i e d oak-pine. (common a s s o c i a t e s include cottonwood, willow, ash, elm, hackberry, and maple.)
Elm-ash-cottonwood.--Forests i n which elm, ash, o r cot~onwood, s i n g l y o r i n combinaticn, comprises a p l u r a l i t y of t h e s tocking. (Common a s s o c i a t e s include willow, sycamore, beech. and maple.)
Gross growth.--Amual increase i n n e t volume of t r e e s i n t h e absence of c u t t i n g and mor ta l i ty .
Growing-stock t rees . - -Live t r e e s of commercial spec ies qua l i fy ing a s d e s i r a b l e o r acceptable t r e e s .
Growing-stock volume.--Net volume i n cubic f e e t o f growing-stock t r e e s 5.0 inches d.b.h. and over from a 1- foot stump t o a m i n i m 4.0-inch t o p diameter outs ide bark of t h e c e n t r a l stem, o r t o t h e poin t where t h e c e n t r a l stem breaks i n t o l imbs.
Iiardvoods.--Dicotyledonous t r e e s , usua l iy broad-leaved and deciduous.
Sof t hardwoods.--Soft-textured hardwoods such as boxelder, red and s i l v e r maple, buckeye, hackberry, loblolly-bay, s i l v e r b e l l ( i n m t s . ), but te rnu t , sweetgum, yellow-poplar, cucumbertree, magnolia, sweetbay, water tupelo , blackgum, sycamore, cottonwood, black cherry, willow, basswood, and elm.
.. Uar2 i:%rdwoods. --FIt?,rd-textllred nar.&2ods such a3 Fior lda and suga.r --- maple; b i rch , hickory, dogwoo&, pers imn ( f o r e s t g r m n ) , beech, ash, hone:~iccust, holly, black walnut; mulberry, a l l com?iercial oaks, and black locus t .
I d l e farniLand.--Includes former croplands, orchards, improved pastures and farm s i t e s not tended within t h e p a s t two years, and p resen t ly l e s s than 16.7 percent stocked with t r e e s .
Impro-V-ed pas ture . --Land cur ren t ly improved fo r grazing by c u l t i ~ r a t i o n , seeding, i r r i g a t i o n , o r c l ea r ing of t r e e s o r brush.
I n d u s t r i a l wood.--All romcwood prod-dcts except fuelwood.
Land a rea .
Bureau of t h e Census.--Tne area of d r y land and land temporari ly o r p a r t l y covered by water such as rrarshes, swamps, and r i v e r flood p la ins (omitt ing t i d a l f i a t s below mean high t i d e ); streams, sloughs, e s t u a r i e s , and canals l e s s then 116 cf a s t a t u t e mile i n width; and lakes , r e se rvo i r s , and ponds l e s s than 40 acres i n a rea .
Forest Survey.--The sane a s the Bureau of t h e Census, except minimum width of streams, e t c . , i s 120 f e e t , and minimum s i z e of lakes , e t c . , i s 1 acre .
,aes.--Thc ,unused por t ions -.f t r e e s cut o r k i l l e d by logging. Luzgi~ig r e s t 2 '
Miscellaneous Federal lands.--Federal lands o ther than National Fores ts , lands administered by the Bureau of Land Management, and Indian iands.
Miscellaneous p r i v a t e lands - corporate.--Lands owned by p r iva te cor- porat ions o the r than f o r e s t indust ry .
Miscellaneous p r iva te lands - individual . - -Pr ivate ly owned lands other than fores t - indust ry , farmer-owned, o r corporate lands.
Mortality.--Number o r somd-wood volume of l i v e t r e e s dying from n a t u r a l causes during a speci f ied period.
National Forest land.--Federal lands which have been legally designated as National Forests or purchase units, and other lands under the adminis- tration of the Forest Service, including experimental areas and Bankhead- Jones Title I11 lands.
Net annual growth.--The increase in volume of a specified size class for a specific year.
Net volume.--Gross volume less deductions for rot, sweep, or other defect affecting use for timber products.
Noncommercial forest land.--(a) Unproductive forest land incapable of yielding crops of industrial wood because of adverse site conditions, and (b) productive-reserved forest land.
Noncommercial species.--Tree species of typically small size, poor form, or inferior quality which normally do not develop into trees suitable for industrial wood products.
Nonforest land.--Land that has never supported forests and lands formerly forested where use for timber management is precluded by development for other uses.
Nonstocked land.--Commercial forest land less than 16.7 percent stocked with growing-stock trees.
Other Federal lands.--Federal lands other than National Forests, includ- ing lands administered by the Bureau of Land Management, Bureau of Indian Affairs, and other Federal agencies.
Other public lands.--Publicly-owned lands other than National Forests.
Overstocked areas.--Areas where growth of trees is significantly reduced by excessive numbers of trees.
Poletimber trees.--Growing-stock trees of commercial species at least 5.0 inches in d.b.h. but smaller than sawtimber size.
Productive-reserved forest land.--Forest land sufficiently productive to qualify as commercial forest land, but withdrawn from timber utilization through statute or administrative designation.
Rangeland.--Land on which the natural plant cover is composed principally of native grasses, forbs, or shrubs valuable for forage.
Rotten trees.--Live trees of commercial species that do not contain at least one 12-foot saw log now or prospectively and/or do not meet Regional specifications for freedom from defect primarily because of rot.
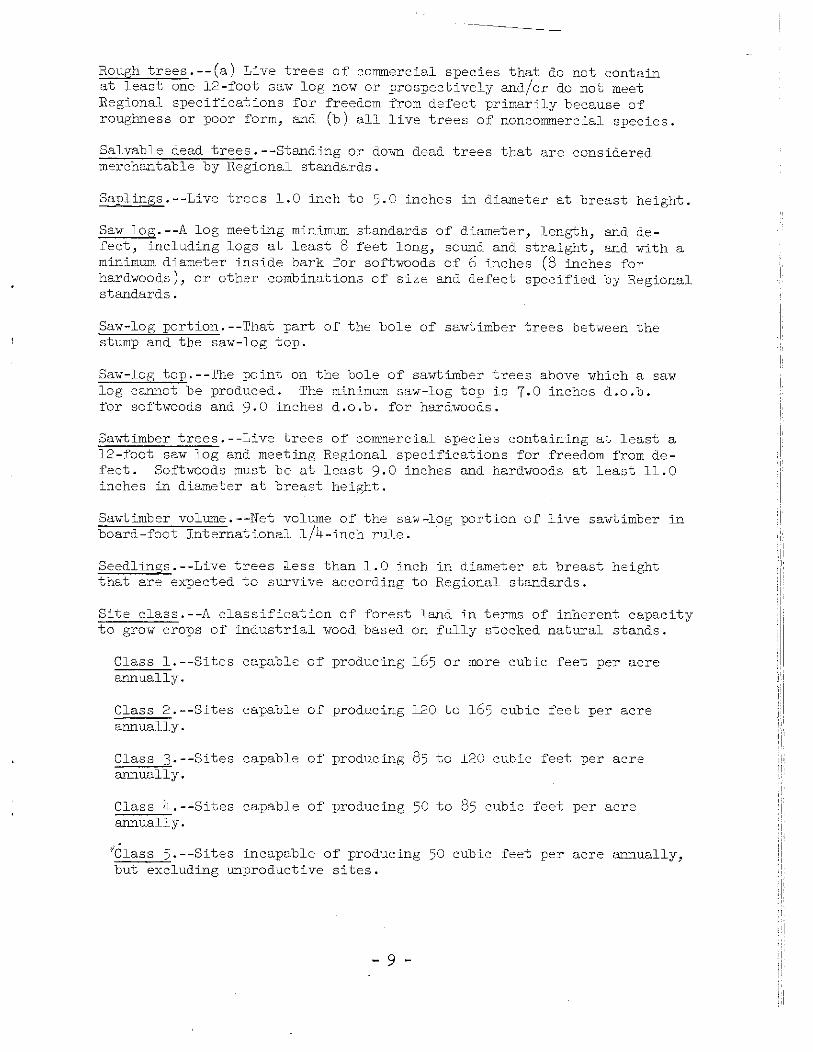
Rough t r e e s . - - ( a ) Live t r e e s of commercial species t h a t do not contain a t l e a s t one 12-foot saw l o g now o r prospect ively and/or do not meet Begional spec i f i ca t ions f o r freedom from defect pr imar i ly because of roughness o r poor form, and ( b ) a l l l i v e t r e e s of noncommercial species .
Salvable dead trees.--Standing o r down dead t r e e s t h a t a r e considered merchantable by Regional s tandards.
Saplings.--Live t r e e s 1 .0 inch t o 5.0 inches i n diameter a t b reas t he ight .
Saw log.--A l o g meeting minimum standards of diameter, length, and de- f e c t , including logs at l e a s t 8 f e e t long, sound and s t r a i g h t , and with a minimum diameter ins ide bark f o r softwoods of 6 inches (8 inches f o r
I hardwoods), o r o the r combinations of s i z e and defect speci f ied by Regional s tandards.
Saw-log portion.--That p a r t of the bole of sawtimber t r e e s between the stump and the saw-log top .
Saw-log top.--The point on the bole of sawtimber t r e e s above which a saw l o g cannot be produced. The minimum saw-log to? i s 7.0 inches d.0.b. f o r softwoods and 9.0 inches d.0.b. f o r hardwoods.
Sawtimber t r ees . - -L ive t r e e s of commercial species containing at l e a s t a 12-foot saw l o g and meeting Regional spec i f i ca t ions f o r freedom from de- f e c t . Softwoods must be a t l e a s t 9.0 inches and hardwoods a t l e a s t 11.0 inches i n diameter a t b reas t he ight .
Sawtimber volume.--Net volume of the saw-log por t ion of l i v e sawtimber i n I I
board-foot I n t e r n a t i o n a l 114-inch r u l e . I
Seedlings.--Live t r e e s l e s s than 1 . 0 inch i n diameter a t b reas t height t h a t a r e expected t o survive according t o Regional standards.
S i t e class.--A c l a s s i f i c a t i o n of f o r e s t land i n terms of inherent capacity t o grow crops of i n d u s t r i a l wood based on f u l l y stocked n a t u r a l s tands.
Class 1 . - -S i t e s capable o f producing 165 o r more cubic f e e t per ac re ' 1 1 annually. ( I
I : I
Class 2 . - -Si tes capable of producing 120 t o 165 cubic f e e t per ac re ; ' I . ,
annually. ;;I
/ I i Class ?.--Sites capable of producing 85 t o 120 cubic f e e t per ac re
, , I ! : II
annually.
Class 4.--Sites capable o f producing 50 t o 85 cubic f e e t per ac re I
annually . I
C i I Class 5.--Sites incapable of producing 50 cubic f e e t per acre annually, 1 I
but excluding unproductive s i t e s . I
: I ' . 8 ' ,
' 1
:'I
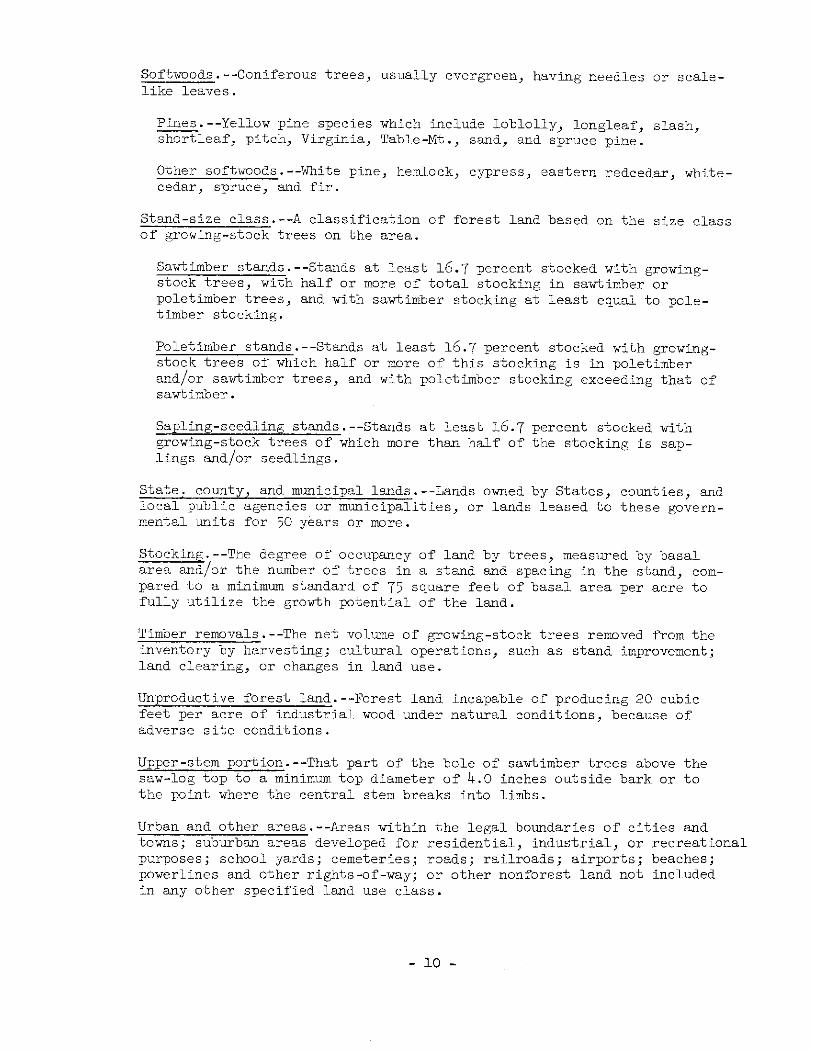
Softwoods.--Coniferous trees, usually evergreen, having needles or scale- like leaves.
Pines.--Yellow - pine species which include loblolly, longleaf, slash, shortleaf, pitch, Virginia, Table-Mt., sand, and spruce pine.
Other softwoods.--White pine, hemlock, cypress, eastern redcedar, white- cedar, spruce, and fir.
Stand-size class.--A classification of forest land based on the size class of growing-stock trees on the area.
Sawtimber stands.--Stands at least 16.7 percent stocked with growing- stock trees, with half or more of total stocking in sa~rtimber or poletimber trees, and with sawtimber stocking at least equal to pole- timber stocking.
Poletimber stands.--Stands at least 16.7 percent stocked with growing- stock trees of which half or more of this stocking is in poletimber and/or sawtimber trees, and with poletimber stocking exceeding that of sawtimber.
Sapling-seedling stands.--Stands at least 16.7 percent stocked with growing-stock trees of which more than half of the stocking is sap- lings and/or seedlings.
State, county, and municipal lands.--Lands owned by States, counties, and local public agencies or municipalities, or lands leased to these govern- mental units for 50 years or more.
Stocking.--The degree of occupancy of land by trees, measured by basal area and/or the n~nber of trees in a stand and spacing in the stand, com- pared to a minimum standard of 75 square feet of basal area per acre to fully utilize the growth potential of the land.
Timber removals.--The net volume of growing-stock trees removed from the inventory by harvesting; cultural operations, such as stand improvement; land clearing, or changes in land use.
Unproductive forest land.--Forest land incapable of producing 20 cubic feet per acre of industrial wood under natural conditions, because of adverse site conditions.
Upper-stem portion.--That part of the bole of sawtimber trees above the saw-log top to a minimum top diameter of 4.0 inches outside bark or to the point where the central stem breaks into limbs.
Urban and other areas.--Areas within the legal boundaries of cities and towns; suburban areas developed for residential, industrial, or recreational purposes; school yards; cemeteries; roads; railroads; airports; beaches; powerlines and other rights-of-way; or other nonforest land not included in any other specified land use class.
Water. - Bureau of t h e Census.--Streams, sloughs, e s tua r ies , and canals more than 118 of a s t a t u t e mile i n width; and lakes , r e se rvo i r s , and ponds more than 40 acres i n area .
Forest Survey.--The same as Census except minimum width o f streams, e t c . , i s 120 f e e t and minimum s i z e of lakes, e t c . , is 1 acre .
Conversion fac to r s :
Cubic f e e t of wood per average cord (excluding bark)
D.b.h. : A l l . ' Other : Soft . : Pine . Hard
c l a s s species . : softwood : hardwood : hardwood
6 60.5 61.0 69.0 59.8 59.5
8 68.3 67.9 76.3 68.2 68.1
10 73.4 73.0 81.3 73.2 73.2
12 76.9 76.5 85.2 76.3 76.3
14 79-3 79.3 88.0 78.3 78.3
16 81.0 81.5 90.4 79.7 79.7
18 82.1 83.2 92.2 80.7 8c.7
Average 75.4 74.5 86.5 75.1 75.1
c o r n TABLES
The county tab les are intended for use i n compiling forest resource estimates for groups of counties. Be- cause the sampling procedure used by the Forest Survey i n the Southern Coastal Plain of South Carolina was in - tended primarily t o furnish inventory data for the Unit as a whole, individual county estimates have l imited and variable accuracy. As county t o t a l s are broken down by various subdivisions, the poss ib i l i t y of e r ro r in - creases and i s greatest fo r the smallest items. The or - der of t h i s increase i s suggested i n the tabulation on page 4.
Table 1.--Area, by land c l a s s and county, 1968
Forest land ' A l l 1 ' Nonforqst County Commercial i Unproductive Productive lan&
From U. S. Bureau of t h e Census, Land and Water Area of the United S ta te s , 1960.
Includes 48,600 acres of water according t o Survey standards of area c l a s s i - f i ca t ion but defined by the Bureau of the Census as land.
1/ Less than 50 ac res .
Table 3.--Area of commercial f o r e s t land, by forest- type group and county, 1968
Forest -type groups A l l type County .
' groups 1 White pine- 1 Longleaf- : Loblolly- : Oak- : Oak- Oak-gum- : Elm-ash- hemlock s l a sh pine : shor t leaf pine : pine : hickory : cypress : cottonwood
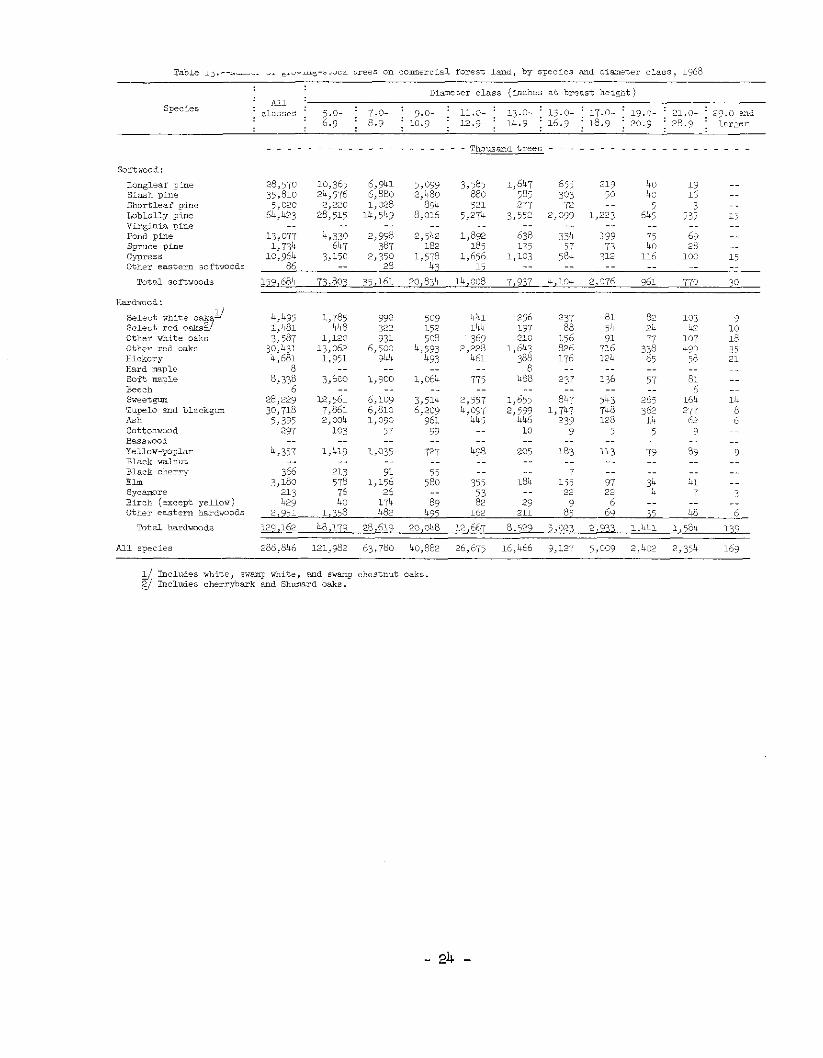
Longleaf p:ne Slash D i n e s h a r t l e z i pine Iob lo l ly pine v i r s i n i a I,-e Pond pine spruce pine C ~ ' " 5 5
Other eas te rn saft?aods
Total saniioods
Hard-~mod :
Select white oak Select re* o&s?7 Other white oaks Other red oaks Hickory Hard m l ? soft maple Beech sweetgun Tupelo and b1aci;q;rm Ash
~~~~
Yellow-poplar Black wu1nrt Black cherry E l m -. , . -. . . . s y c ~ r e 213 76 26 .. 53 .. 22 22 L 7 3 Birch (except yellow) 429 40 174 89 82 29 9 6 .. .. .. o t h r r e a s t e r n h a r d r a a d ~ 2,951 1,358 1182 4% 162 211 85 6.) 35 48 6
~ o t d hardwoods 129,162 18,179 28,619 20,0h8 12,667 8,529 5,.)%3 2,933 :,lr'll 1,184 139
A l l species 288,846 121,982 63,780 40,882 26,675 16,466 9.12-l 512C9 2,4Q 2,354 163
11 Includes white, sianp white, uld swa.np cP.estnlr oaks. I"c1uaes cherrybar* and Shwlard oaks.
Table 14.--volume of a l l l i v e t r e e s an commercial fo res t land, by species und diameter c l a s s , 1968
Diameter c l a s s (inches a t b reas t he igh t )
Species ' A l l : : classes : 5.0- i 7.0- 9.0- 11.0- j 13.0- j 15.0- j 17.0- i 19.0- i 21.0- : 29.0 and
1 6 . 9 : 8.9 1 1 0 . 9 1 1 2 . 9 : 1 4 . 9 1 1 6 . 9 1 1 8 . 9 1 2 0 . 9 128.9 j l a r g e r
Softwood :
Langleaf pine Slash pine Short leaf pine Loblol ly pine Virginia pine Fond pine Spruce pine Cypress Other e a s t e r n soft-mods
Tota l softwoods
Hardwood :
Selec t white oak s/ Selec t r e d o a k s 8 Other white oaks Other red oaks Hickory Hard maple Soft maple Beech Sweetgum Tupelo and blackgwn Ash Cottonwood Basswood Yellow-poplar R l a r l i u ; l ln?>t
Black cherry Elm Svcamare Birch (except yellow) 6.7 0.5 1.5 0.9 2.3 0.8 0.3 0.4 .- -- -- Other eas te rn hardwoods 106.0 21r.l 19.0 18.6 7.8 9.7 6.3 6.7 3.3 8 .1 2.4
Tota l hardwoods 5 3 1 5 . 4 189.2 266.1 329.8 328.7 320.0 254.4 201.9 110.5 239.4 55.4
A l l species 3,883.9 353.1 470.5 571.4 598.3 559.9 424.9 315.5 200.4 323.1 66.8
I/ Includes white, swamp white, and swamp chestnut oaks. Includes cherrybark and Shumard oaks.
Table 15.--Volume of growin8 s tock on c o m r c i a l f o r e s t land, by species and diameter c l a s s , 1968
Diameter c l a s s (inches a t b reas t he igh t ) - . ' All :-- -- Species : classes 1 5.0- 7.0- : 9.0- j 11.0- i 13.0- j 15.0- i 17.0- j 19.0- j 21.0- 29.0 nnd : 6 , 9 1 8.9 j 10.9 : 1.2.9 : 14.9 : 16.9 18.9 20.9 1 28.9 larger
- - - . . . - - - - . . . - - - - Million - cubic f e e t - - - - - - - - - - - - - - - -
Longleaf pine Slash pine Short leaf pine Lobiolly pine Virginia pine Pond pine Spruce pine Cypress Other eastern saf't~roods
Tota l softwoods
Ilardwood :
Select white oak L' Selec t red o a k s d Other white naks Other red oaks Hickory Hard maple Soft nlaple Beech Sweetgum Tupelo and blackgwn Ash Cottonwood Basswood Yellow-poplar Black walnut BI.ack cherry Elm Sycamre Birch (except yellow) Other eabtern hardwoods
1/ Inciudes white, swa~np white, and swam* chestnut oaks Z-/ Includes cherrybark and Stnunard oaks.
.syeo pmnmqs p m yzeqLzzaqs sapnTau1 .SYPO i n u ~ / ~ a q ~ dure11*~ pun ' a l ~ q n dmns ' a ~ l q n sagnrour fi
E'E8.r 9.iirr'c L.84L T . ? ~ T ' T G'gL4'r 4,Goo'z 6 ' 5 0 6 ' ~ 4.038 r.684'6 sa j sads TTV
9'ZCT Z'ZCL T'OW 4'LL9 8'228 T'Eg6 8'428 -- 1.iiESTfj SPOOKPlDq T ~ I O &
.. - 9 '9 G.82 E'6 L'Lt 2.61 L'6r 9'6 9.011 spoonpzoq u l a l s e a .zaqw .. -- -- 8 ' 1 O'T 0.2 ii'E 2.Q ( n o ~ ~ a L ~ d a a a a ) q a z r s . .
r'E 9'T 2'4 6.E -- <.ti -- 4'22 a10w3As -- Z ' t < ' e l L.OT 2.Q 1.42 E '6 l L'Ez - .. S ' ZZT QJI3 - .. .. -- -- .- .. .. 6 ' 1 6'T 6zzaqs y s y g -- -- -- -- .- .. .- .. -- ~ n q e n y a n ~ ~ 4 ' 9.6$ L'QZ 8'0s 8'LE Z'LZ Z'T$ .- 8'022 ~ e ~ d o d - n o ~ ~ a x - - -- .. - - -- - - .. .. . . POOfiSSBE -- 2 ' t, 4 q . r ii ' 1: 8.T .. E'TT ~ O O ~ U O - 0 3 ..
0'4 L'<2 9'47 5'92 6'LE 6 '2s L'62 .. T'zgl qsV 6 ' 1 < ' ~ T T 8'Eor O'94r L.i,<z 8.~6;: tr'93"- t'oLT't u m 9 y s ~ ~ q pue a ~ a d n ~ O'LT L'6L L'16 4 6'1191 i i ' t i n 8'18T - - 6'QGQ 1m8laang .. '7.L .. .. -- -- .. .. $'L qaaas .. 3'62 8.11 O'TE 6 '9s G'6q 9'347 .. Z'LOZ a-ldeur ~ J O S -- -- -- .. .. L'O -- -. L'O a ~ d m PJmli 9'6T 9 '0s 9'OZ Q.82 ir'J.2 E'9i1 8 '82 - - L'T02 fiJoXaiiI E'Tji 2 E ' O O T 8 '291 1 '231 6'ir6r E'64T -- 6'4E0'1 s w o P a l 4 9'Eq ' 1 0.91 8 '61 9.12 6'Lr -- Z'E<T swo a ? r w E'? L'6T E'8 4.21 ?'<C $"I2 4'01 -- E'L6 ,syeo paz l s a ~ a s g.8 ii.l,li L'61 O'LT 2 ' s 9 . ~ 2 ii'irz -- 8 ' t ~ r 6 '1-0 a ~ r w 13aTas f i
: poOfipLeg
L'O* ii'2LE 9 ' 8 ~ t g .gr< J-.E<L ~ ' Z Z O ' T r ' ogo ' r 1'gtrg O'446'ti SPOOAWOS ~ 8 7 0 ~ 1 .. -. -- -. .. -- 9.0 L 'T 5'T spoon:jos uzaqsaa zart30 6'?2 q.44 E ' E v 0.98 2 6 'E t l~ ii'qEr 6'Eg o'tL9 s s a ~ M 3 .- 1 ' 2 1 1'11 Z.LT 8 ' 8 0'Zl 9.21 6 '9 ~ . ' O R auyd a a n z d ~ .. 6.92 O ' E Z Q'Eq 0'0G L'GL E.621 1 . ~ 6 8'0cf aura puoa -- .. -- -- .- - - -- .- -- aurd n ru i8 l rd 8'GT L'i9Z 3.112 6'90E O'38E O'~r<ir 9'06E 6'80E E'8EE'z -- aurd ~TTolqo?
T ' T L.T -- 2'J.T ti's? g'8E O.Z+lT amid j s a ~ q ~ o q g -- 9 ' s 9'TT 6 '6 q'E1 z'6L EL" r'Eor L'LEE aurd q s e ~ g -- 9 ' s 2 8'qG 1 . 6 ~ ~ Z'LTZ L'L62 L'EEz g'Oq6 aurd jeaiauo?
:poonSoS
- - - - - - - - - . . - - - - l a a j pzeoq u o y ~ ~ i ~ - - - - - - - - - - - - - - -
Table 17.--Net vlnual growth end removals o f growing stock on comercia l f o r e s t land, by species, 1967
Species Net annual growth Annual timber removals
Softwood :
Yellow pines Cypress Other eas te rn softwoods
Tota l softwoods
Hardwood :
Select white and red oaks Other white and red oaks Hickory Hard maple Sweetgum Ash, walnut, and black cherry Yellow-poplar Other hardwoods
Tota l hardwoods
A l l species
- - - - Million cubic f e e t - - - -
I/ Negligible.
Table 1 8 . - - ~ e t annual growtin and removals of sawtiaber on commercial fo res t land, by species, 1967
Species Net annual growth : Annual timber removals
- - - - Mill ion board f e e t - - - -
Softwood:
Yellow pines Cypress Other eas te rn softwoods
To ta l sortwoods
Hardwood :
Select white and red oaks Other white and red oaks Hickory Hard maple Sweetgum Ash, walnut, and black cherry Yellow-poplar Other hardwoods
To ta l hardwoods
A l l species
l-/ Negligible.
Table 13.--Mortal i ty of growing stock and sawtimber on co~?r:~ei-cial f o r e s t land, by species , 1967
~ - - -
Species Growing s tock Sawtimber
Mill ion cubic f e e t Mil l ion board f e e t
Yellow pines Cypress Other eas t e rn softwoods
Tota l s o f t ~ ~ o o d s
Selec t white and red oaks 0 .9 3.5 Other white and red oaks 6.3 16.7 Hickory 0.9 3.6 Hard maple - - - - Sweetgum 2.6 7.6 Ash, walnut, and b lack cherry 0.5 0.3 Yellow-poplar 0.2 c.4 Other hardwoods 5 . 1 11.2
Tota l hardwoods 16 .5 43.3
A l l species 24.7 66.9
Table. 20.--Volume of a l l l i v e t r e e s w d growing s tock on commercial fo res t l and , by ownership c l a s s and species group, 1968 -- -.
A l l l i v e t r e e s Groving stock .-. Ownership c la s s . Other : Soft : Hard A 1 1 : Pine . : A n j pine . ' Other 1 Sof t : Nard
Volume of sa~rtimher t r e e s l e s s than 15.0 inches a t 6.b.h. 2/ Volume of sawLimber t r e e s 15.0 inches and l a rge r a t d.b.h. -
Table 22.--Net annual growth and removals of growing s tock on commercial f o r e s t land, by ownership c l a s s and species group, 1967
N e t annual growth Annual timber removals Ownership c l a s s :
Other : Sof t : Hard A l l Pine , . A l l 1 pine . ' Other Sof t Hard 1 species . ' softwood hardwood tlardwood species , : softwood : hardwood : hardwood
- - - - - - - - - - . . . . . - . . . - - Mil l ion cubic f e e t - - - - - - - - - - - . . . . - - - - - - -
National Fores t .- . . .- - - -- - . - - -. - - -.
Miscellaneous p r i v a t e 142.8 87.8 5.2 24. 3 25.5 78.8 119.6 1 . 8 15.2 1.2.2
A l l o~mersh ips 559.8 343.7 1 8 . 2 109.5 88.4 402.5 249.9 11.11 92.0 49.2
Table 24.- Average ne t vo lme per acre of savtimoer, war-ing stack, and other l i v e t i o b e d ' an commercial raresz land by o-ership class, u j o r f o r e s t type, a d species g o ~ p , 1968
Porest type, species group, and : Ownershin class
class of material : ~ l l ownerships : N s t i o n s l ~ o r e s t : o the r publ ic : are st in ;vs t ry : rarmer : xisc. pri.zate
8-d Cubic Board Cubic Bcard Cubic Board Cubic Board C;rblc Board Cubic - - - - - - - - - - f e e t feet feet * feet feet feet * - - - -
Pine types:
Growing stack:
Other t imber:
softwood .. 22.5 -- .. .. 26.9 -- 20.8 -- 19.2 - - 27.7 m d w o o d .. 27.8 -- -- .. 11.0 .. 20.8 .. 37.6 - - 21.2
Tota l .. 5C.3 -- .. .. 37.9 -- 41.6 .. 56.8 - - 48.9
C-opland 1,703.2 1,387.7 1,128.4 -259.3 P a s t u e and range 102. 9 164.4 191.3 + 26.9 Other 321.3 448.6 524.1 + 75.5
T o t a l 2,127.4 2,000.7 1,843.8 -156.9
~1: land d 5,159.6 5,119.2 5,120.4 + 1.2
I! Excludes a l l water areas.
11 Table 26.--volume- of sawtimber, growing stock, and all live timber on commercial forest land, by species group, diameter class, and survey completion date
' All : Diameter class (inches at breast height) Species '
: Year : group : , classes : 5.0- : 7.0- : 9.0- : 11.0- 13.0- : 15.0- 170- : 19.0- 21.0 and
1/ To provide a basis for valid comparisons, adjustments have been made for differences in volume tables and sawtiGber specifications used in previous surveys.