Geological Survey Report of Investigation 2 Report of Investigation 2 – Michigan’s Silurian Oil and Gas Pools – Page 1 of 28 MICHIGAN’S SILURIAN OIL AND GAS POOLS by Garland D. Ells Illustrations by Author Lansing 1967 STATE OF MICHIGAN George Romney, Governor DEPARTMENT OF CONSERVATION Ralph A. MacMullan, Director GEOLOGICAL SURVEY DIVISION Gerald E. Eddy, State Geologist and Supervisor of Wells COMMISSION OF CONSERVATION Carl T. Johnson, Chairman, Grand Rapids, 1963-67 E. M. Laitala, Hancock, 1961-69 Robert C. McLaughlin, Detroit, 1963-68 August Scholle, Royal Oak, 1966 Harry H. Whiteley, Rogers City, 1961-69 Robert J. Furlong, Executive Assistant & Secretary OIL AND GAS ADVISORY BOARD T. G. Caley, Basin Oil Co., Chairman, 1953 George E. Hass, Sun Oil Co., Vice Chairman, 1958 H. L. Fruechtenicht, Consumers Power Co., 1966 O. R. Elliott, Marathon Oil Co., 1959 E. Allen Morrow, Leonard Crude Oil Co., 1960 Charles E. Myler, Muskegon Development Co., 1949 Lyle W. Price, Mich. Dept. Conservation, Secretary, 1962 Published by Authority of State of Michigan CL ‘48 s.321.6 Printed by Speaker-Hines and Thomas, Inc., Lansing, 1967 Available from Publications Room, Dept. of Conservation, Lansing, Michigan 48926 Copies on deposit at public libraries. FOREWORD Few mineral resources excite as much interest and speculation as petroleum. Inasmuch as the value of crude oil and gas at well head in Michigan exceeds $50,000,000 annually, our mineral fuels are an asset of considerable magnitude. On the national level, Michigan ranks 17th among the 31 states producing these vital energy sources. One of the foremost duties of the State Geological Survey is administering the state oil and gas conservation laws. This responsibility extends to an interest and concern in the search for new horizons. As a result of new developments the past few years, much interest has been shown in Silurian rocks as potential oil and gas reservoirs. In response to the need for specific geological information on this topic, the Survey published in 1963, and subsequently reprinted several times, the informal report “Information on Silurian Oil and Gas Pools” by G. D. Ells. The present edition is a completely revised and improved version of the original report. The author, Garland Ells, is a geologist on our staff. He is eminently qualified to present this technical information in the field of petroleum geology, and I am pleased to offer this report to the citizens of Michigan. Gerald E. Eddy State Geologist, and Supervisor of Wells Lansing, Michigan June 20, 1967 Geological Survey Division Department of Conservation CONTENTS Abstract ..............................................................................2 Introduction ........................................................................2 Michigan Basin...................................................................3 Silurian System ..................................................................3 Subsurface Units and Nomenclature .................................5 Correlation Sections ..........................................................5 Lower Silurian (Alexandrian) ..........................................6 Middle Silurian (Niagaran)..............................................6 Clinton...................................................................... 6 Rocks above the Clinton.......................................... 7 Upper Silurian (Cayugan)...............................................8 Salina Group............................................................ 8 Bass Islands Group ............................................... 11 Silurian-Devonian unconformity .......................................11
Transcript
Geological Survey
Report of Investigation 2
Report of Investigation 2 – Michigan’s Silurian Oil and Gas Pools – Page 1 of 28
MICHIGAN’S SILURIAN OIL AND GAS POOLS
by Garland D. Ells
Illustrations by Author
Lansing 1967
STATE OF MICHIGAN George Romney, Governor
DEPARTMENT OF CONSERVATION Ralph A. MacMullan, Director
GEOLOGICAL SURVEY DIVISION Gerald E. Eddy, State Geologist and Supervisor of Wells
COMMISSION OF CONSERVATION Carl T. Johnson, Chairman, Grand Rapids, 1963-67 E. M. Laitala, Hancock, 1961-69 Robert C. McLaughlin, Detroit, 1963-68 August Scholle, Royal Oak, 1966 Harry H. Whiteley, Rogers City, 1961-69 Robert J. Furlong, Executive Assistant & Secretary
OIL AND GAS ADVISORY BOARD T. G. Caley, Basin Oil Co., Chairman, 1953 George E. Hass, Sun Oil Co., Vice Chairman, 1958 H. L. Fruechtenicht, Consumers Power Co., 1966 O. R. Elliott, Marathon Oil Co., 1959 E. Allen Morrow, Leonard Crude Oil Co., 1960 Charles E. Myler, Muskegon Development Co., 1949 Lyle W. Price, Mich. Dept. Conservation, Secretary, 1962
Published by Authority of State of Michigan CL ‘48 s.321.6 Printed by Speaker-Hines and Thomas, Inc., Lansing, 1967
Available from Publications Room, Dept. of Conservation, Lansing, Michigan 48926
Copies on deposit at public libraries.
FOREWORD Few mineral resources excite as much interest and speculation as petroleum. Inasmuch as the value of crude oil and gas at well head in Michigan exceeds $50,000,000 annually, our mineral fuels are an asset of considerable magnitude. On the national level, Michigan ranks 17th among the 31 states producing these vital energy sources.
One of the foremost duties of the State Geological Survey is administering the state oil and gas conservation laws. This responsibility extends to an interest and concern in the search for new horizons.
As a result of new developments the past few years, much interest has been shown in Silurian rocks as potential oil and gas reservoirs. In response to the need for specific geological information on this topic, the Survey published in 1963, and subsequently reprinted several times, the informal report “Information on Silurian Oil and Gas Pools” by G. D. Ells. The present edition is a completely revised and improved version of the original report.
The author, Garland Ells, is a geologist on our staff. He is eminently qualified to present this technical information in the field of petroleum geology, and I am pleased to offer this report to the citizens of Michigan.
Gerald E. Eddy State Geologist, and
Supervisor of Wells
Lansing, Michigan June 20, 1967
Geological Survey Division Department of Conservation
CONTENTS Abstract..............................................................................2 Introduction ........................................................................2 Michigan Basin...................................................................3 Silurian System..................................................................3 Subsurface Units and Nomenclature.................................5 Correlation Sections ..........................................................5
Report of Investigation 2 – Michigan’s Silurian Oil and Gas Pools – Page 2 of 28
Silurian oil and gas pools ................................................ 12 Reefs and reef-associated structures ............................. 13
Niagaran reefs ............................................................. 13 Reef-associated structures.......................................... 14 Reservoir data ............................................................. 16 Gas analysis ................................................................ 16
Salt-cored anticlines........................................................ 18 Reservoir data ............................................................. 24 Gas analysis ................................................................ 24
Oil and gas pool tables.................................................... 24 Future Silurian prospects ................................................ 25
ILLUSTRATIONS
Figures 1 - Generalized geologic map of Michigan. ..............................4
2 - Portions of oil well cores showing brecciation and fossil debris................................................................................7
3 - Diagrammatic sketch of basin margin reef complex. ...........8
Tables 1 – Silurian Oil and Gas Fields or Pools.................................26
2 – Silurian Gas Storage Reserves ........................................26
MICHIGAN’S SILURIAN OIL AND GAS POOLS
ABSTRACT Silurian rooks are an increasingly important source of oil and gas in the Michigan Basin. Except for local areas, these rocks are virtually unexplored. Most Silurian pools found to date are around the southern edge of the basin in the southwestern and southeastern part of the state. Many Devonian structures around the edge of the basin and in the interior are yet to be tested and may eventually yield Silurian hydrocarbons.
Reservoir rocks are reefs and porous, dolomitized intervals of carbonate formations. Oil and gas traps in the latter are often localized on synchronous structures related to underlying reefs or small salt-cored anticlines. Silurian reefs and salt structures are often reflected by structural closures in formations as young as Mississippian. Reefs and synchronous structures are discussed and figured.
Silurian subsurface nomenclature used in oil and gas exploration differs from the formal nomenclature established by outcrop studies. A variety of terms are used. Correlations are based mainly on mechanical log curve characteristics. Terminology is discussed and related to log cross sections and other illustrations.
General pool or field data, production, gas analysis, and some reservoir data are presented.
INTRODUCTION Most of Michigan’s oil has come from Devonian limestones and dolomites while most of the gas has come from Mississippian sandstones. As fewer new sources are found in these rocks, production from them continues to wane and Silurian and Ordovician rocks become increasingly significant as new sources of oil and gas.
Michigan’s first Silurian gas was produced from a well originally drilled for salt. Gas was produced from Diamond Crystal Salt Company’s No. 12 well in St. Clair County from 1927, the year of discovery, until 1931 when gas production ceased. Production from this one-well field aggregated a little over 136 million cubic feet. A small amount of Silurian oil was produced from a single well in the Dorr field, Allegan County, as early as 1937. The Silurian oil venture was deemed uncommercial and the well was abandoned. Silurian oil production in 1952, the first year of record, amounted to almost 2,600 barrels.
Since these early beginnings over 60 Silurian gas and oil pools have been discovered, mostly since the early
Report of Investigation 2 – Michigan’s Silurian Oil and Gas Pools – Page 3 of 28
1950*s. The total hydrocarbons produced is impressive. The total amount of gas produced from Silurian rocks by the end of 1966 amounted to almost 150 billion cubic feet, most of which has been produced since 1948. Oil production has also increased sizably. By the end of 1966, cumulative production reached more than 6 million barrels. A large share of Michigan’s future oil and gas reserves will probably be found in these rocks.
Most of Michigan’s Silurian reservoirs are associated with reefs or with small salt-cored anticlines; one with porosity-permeability pinch-out. Small, salt-cored anticlines have been recognized only in southwestern Michigan, whereas most of the reefs have been found in southeastern Michigan. Silurian oil and gas pools are generally situated along the southern edge of the Michigan basin, the majority in St. Clair and Macomb Counties in southeastern Michigan. Exploration for reefs has been more or less concentrated in this region because most of the larger and more productive fields have been found there. Good oil and gas shows, and favorable porosities and permeabilities have been found elsewhere. But over most of the State, except for local areas, Silurian rocks are virtually unexplored. As exploration techniques improve and more well control becomes available, many more Silurian pools will be found.
The purpose of this circular is to bring together practical and general information on the occurrence and geology of Michigan’s Silurian oil and gas pools. Examples of oil and gas traps are presented, and a variety of other information is summarized in charts and illustrations. The subsurface stratigraphic terms generally applied to the Silurian section by the petroleum industry are discussed because a variety of terms are used in different parts of the basin. Geophysical logs are being increasingly used for correlating formation tops. They provide an excellent means for consistent placement of formation tops, other correlation points, and for standardizing nomenclature. Suggestions along these lines, based on statewide stratigraphic studies, are presented.
The geology of Michigan’s Silurian rocks is complicated. Some aspects of the stratigraphy concerning the oil- and gas-bearing formations of Middle and Late Silurian age are controversial. Comprehensive discussion of the different aspects and stratigraphical concepts applied to the many Silurian rock units in Michigan is beyond the scope of this circular. Selected references for further study are listed at the rear.
Several fields have been selected to illustrate the geology of the different types of Silurian oil and gas traps. The term field, as used in this report, means the general area which is underlaid or appears to be underlaid by at least one pool containing oil or gas, or both. The words field and pool mean the same thing when only one underground reservoir is involved; however, field, unlike pool, may relate to two or more pools. A number of Silurian oil or gas pools are, or have been, subject to well spacing and gas-oil proration
orders. Well spacing and drilling unit orders define an individual pool or field area as covering and including certain sections or parts of sections. The several pools or fields illustrated in this circular may or may not include all the officially-defined area of the pool or field. Structural interpretations and correlations of the author are intended for illustration only and do not supersede any other interpretations which may have been adopted for oil or gas regulatory practices.
Principal sources of this study are: Geological Survey well records, Survey reports, mechanical (geophysical) log correlation and sample studies by the author, and data furnished by other state agencies or companies.
MICHIGAN BASIN The Michigan Basin is a relatively shallow intracratonic basin encompassing all of the Southern Peninsula, the Northern Peninsula and parts of Wisconsin, Illinois, Indiana, Ohio and Ontario. It is bounded on the north and northeast by the Canadian Shield; on the east and southeast by the Algonquin Arch in Ontario and the Findlay Arch in northern Ohio; on the southwest by the Kankakee Arch in northern Indiana and northeastern Illinois; and on the west and northwest by the Wisconsin Arch and Wisconsin Dome. The basin, though roughly circular, has a slight northwest-southeast elongation.
The deepest part is believed to underlie a part of Clare and Gladwin Counties in central Michigan where an estimated 14,000-15,000 feet of sedimentary rocks mantle the Precambrian. The Paleozoic series are represented by Cambrian, Ordovician, Silurian, Devonian, Mississippian, and Pennsylvanian sediments. A small amount of Mesozoic (Jurassic) rock overlies the Pennsylvanian in the central area of the Lower Peninsula. The rocks in the basin are principally carbonates, shales, evaporites and sandstones. Most everywhere bedrock is covered by Pleistocene glacial drift as much as 1,000 feet thick in places, but averaging perhaps 250-300 feet. Outcrops are sparse and generally of small areal extent. The stratigraphic succession of Paleozoic rocks is illustrated in Chart 1, adjacent page.
SILURIAN SYSTEM Rocks of Early, Middle, and Late Silurian age occur throughout most of the basin. They account for over 30 percent of the estimated 108,000 cubic miles of sediment in the basin (Cohee and Landes, 1958). Probably one-third to one-half this volume consists of nearly pure rock salt in the Upper (Late) Silurian sequence. Silurian rocks are thickest, an estimated 4,000 feet, in the central part of the basin. Almost everywhere they are overlaid by Devonian formations (Figure 1). Outward toward the margin of the basin they thin and crop out beneath Pleistocene glacial drift, or at the surface.
Surface exposures of Silurian rocks in Michigan are found mainly in the Northern Peninsula. From here they extend southwest and southeast in arcuate belts around the basin margin forming the Dorr Peninsula of Wisconsin and the Bruce Peninsula of Ontario. In the north, Late Silurian (Cayugan) rocks crop out mainly in the vicinity of the Straits of Mackinac but outcrops of Middle Silurian (Niagaran) rocks are more abundant. Rock formations of Early Silurian (Alexandrian) age are sparingly exposed at widely scattered points. Along the southern margin of the basin Silurian rocks also crop out beneath glacial drift or are exposed at the surface in Monroe County (Michigan), in southern Ontario, northern Ohio, northern Indiana, and in northeastern Illinois.
[1 – Stratigraphic Succession in Michigan, Chart 1, 1964]
Michigan’s Silurian rocks have been variously divided into a number of stratigraphic units based primarily on outcrop and fossil studies. Rocks of Early, Middle, and Late Silurian age have been recognized.
Early Silurian rocks consist of the Cataract Group composed of two formations: the cherty Manitoulin Dolomite and the overlying Cabot Head Shale. The upper part of the Cabot Head shale or its facies equivalent in the northern part of the basin contains some gypsum along with red and green shales. In this area the gypsum bearing interval has been called Moss Lake Formation (Ehlers and Kesling, 1962). Early
Silurian rocks are generally assigned to Alexandrian Series but the terms Albion or Medinan are sometimes used.
Figure 1. Generalized geologic map of Michigan.
Middle Silurian rocks are predominantly carbonates with chert zones and minor shale beds. In the Northern Peninsula where these rocks have been extensively studied, they have been divided in ascending order into: Burnt Bluff Group, the Manistique Group, and the Engadine Dolomite, the latter a formation with a succession of several similar carbonate units. The Burnt Bluff Group consists of three formations called, in ascending order: Lime Island Dolomite, Byron Dolomite, and Hendricks Dolomite which contains a member called Fiborn Limestone. The Manistique Group consists of the Schoolcraft Dolomite and an overlying Cordell Dolomite. The Engadine Dolomite has not been formally divided but is often correlated with Guelph-Lockport rocks with which it has affinities. Middle Silurian rocks are assigned to the Niagaran Series.
Late Silurian rocks consist of the Salina Group and an overlying Bass Islands Group. In the Mackinac Straits area the Salina Group is divided into a St. Ignace Dolomite and the underlying Point aux Chenes Shale. These rocks extend into the basin where they contain many thick salt beds. Rocks of the Bass Islands Group crop out in Monroe County in southeastern Michigan, in parts of northern Ohio, and in the Bass Islands in western Lake Erie. The lower formation, the Put-in-Bay Dolomite, takes its name from a geographic feature of the same name in the Bass Islands. The upper formation, the Raisin River Dolomite, takes its name from outcrops along the Raisin River in Monroe County, Michigan.
Report of Investigation 2 – Michigan’s Silurian Oil and Gas Pools – Page 4 of 28
Report of Investigation 2 – Michigan’s Silurian Oil and Gas Pools – Page 5 of 28
SUBSURFACE UNITS AND NOMENCLATURE
Though large areas of the basin have not been drilled to, or through, Silurian rocks, their general characteristics, thickness, and distribution are perhaps better known in the subsurface than in the outcrop region. The sequence as recognized and divided in outcrops at widely scattered points around the basin margin does not correspond entirely to the subsurface section. The character of the Silurian sequence varies from basin margins to interior. Lower Silurian rocks as defined in the subsurface in eastern and southeastern parts of the basin thicken and change lithologically basinward. Middle Silurian rocks are complicated by extensive reef and carbonate bank deposits associated with platform areas along the basin margin. They are thickest on the margins and platform areas and thinnest in the basin interior. In contrast, Upper Silurian rocks are thickest in the interior and thinnest on the margin where they overlie reef complex. Periodic isolation or semi-isolation of the basin interior from the open sea by late Silurian time allowed the deposition of a thick, alternating or cyclic succession of salt, carbonate, and shale beds. Most of the layers making up this cyclic sequence can be readily traced over much of the basin. In the outcrop they are not individually identifiable and are thus lumped together under such terms as Point aux Chenes Shale, St. Ignace Dolomite, or perhaps Bass Islands. Some of the recognizable subsurface rock units appear to be limited to the basin interior and do not extend to outcrop regions on the basin margin. The salt is largely confined to the basin interior and does not extend to the outcrop areas. Solution and removal of salt beds and subsidence or collapse of overlying rocks further complicate the stratigraphy of Upper Silurian rocks along the margins. An erosional unconformity of considerable magnitude separates Silurian and Devonian rocks over a large part of southwestern Michigan and elsewhere around the rim of the basin.
Uniformity of rock divisions and nomenclature for surface and subsurface use is desirable but not always attainable. Most of the Silurian formation boundaries defined by outcrop studies depend largely on fossil studies. This method is not always feasible or practical when such determinations must be made from well samples or an occasional well core. Features which appear well defined in outcrop studies are not always recognized in subsurface samples. Consequently, many formations are defined differently in the subsurface. Some parts of the subsurface Silurian sequence are more readily divided than the comparative outcrop interval, while other parts are more easily divided in outcrop than in the subsurface. This situation has, in turn, led to an expanded and somewhat different subsurface nomenclature. The increased use of geophysical logs has contributed to the proliferation of subsurface rock units and nomenclature. Currently, the subsurface Silurian succession is divided into rock units based on characteristic geophysical log curves but this
has not led to consistency in rock divisions or nomenclature. Several different systems based on log curves are now used by the oil and gas industry.
Geophysical logs of the radiation type (e.g. gamma ray-neutron) have proved especially useful in correlations in the Michigan Basin. The Silurian sequence is a series of carbonates, shales, salt, and anhydrite which provide sufficient contrast on the log curves to provide many useful markers. Well samples and other types of logs such as sonic and density provide additional support for log correlations. Thus a more reliable system of rock unit divisions can be established from these logs than one devised solely from well sample studies.
Though many Silurian formation “picks” have become more or less standard within the Michigan Basin, considerable differences in formation limits and applied nomenclature exist. Probably by chance rather than design, Silurian rocks are divided differently in different parts of the basin. From this situation a variety of names and divisions have developed, often for the same stratigraphic unit. Such conditions appear related to local or regional drilling compaigns undertaken from time to time during the development of oil and gas resources of a given section of rocks. As an illustration, the top of the A-2 Carbonate as now commonly picked in Allegan County is about 30-40 feet stratigraphically lower in the section than where it was placed at the time of development of the Overisel, Salem, and other Silurian gas pools. The “A-2” top, as then called, is now known to be a part of the B Evaporite; the top of the present “A-2” corresponds stratigraphically to the A-2 Carbonate as picked in St. Clair County about 125 miles to the east. In Allegan, St. Clair, and some other counties, the A-2 Carbonate is called A-2 Dolomite. But in Allegan County the lower part of the unit, being a gray, argillaceous limestone, is called A-2 Lime. In the St. Clair region the lower part of the unit is most often a limestone but less argillaceous and lighter in color than its equivalent facies in Allegan County, yet the term A-2 Lime is very seldom applied to the lower division. In other areas the unit may be entirely a limestone, a dolomite, or both.
These synonymous terms, minor subdivisions, and other differences, appear on well logs, scout tickets, in local and national trade journals, in geological reports, and in other documents. Many difficulties in correlation and communication of basic stratigraphic problems stem from duplicity and multiplicity of data gathered and used from different sources such as those just mentioned. These differences are shown on the correlation sections.
CORRELATION SECTIONS Characteristic gamma ray log curves of Silurian rocks at various points across the Southern Peninsula of Michigan are shown on Correlation Sections 1 and 2. The correlations shown are those favored by the author. The nomenclature used is that recommended by the Survey Geologic Names Committee. Drillers’ terms and other nomenclature and formation tops commonly used
Report of Investigation 2 – Michigan’s Silurian Oil and Gas Pools – Page 6 of 28
by the oil and gas industry are shown where necessary. Well log curves on Correlation Section 2 are arranged for convenience of presentation; all are aligned in reference to the base of the C Unit, the reference plane. Full size gamma ray-neutron logs of these wells are generally available at commercial log libraries. Descriptive logs and sample sets are available from the Survey libraries.
Lower Silurian (Alexandrian) In the subsurface these rocks are generally called Cataract Group. Where possible, they are divided into two formations: a lower Manitoulin Dolomite and an upper Cabot Head Shale. The Manitoulin is buff to light brown dolomite, locally cherty with interbedded shale or shaly dolomite. Small reefs are found in Manitoulin rocks. Moss Lake Formation is not used.
The contact between the Manitoulin Dolomite and the overlying Cabot Head is gradational in many places. Over most of eastern Michigan, where the Cabot Head is most typical and is best developed, it consists of gray, greenish gray, and red shales. Thin carbonate beds are also present. To the west, northwest, and basinward in general, the shales thin, pinch-out, or grade laterally into carbonate beds. Local reefs or regional thickening in the Manitoulin probably causes a thinning in overlying Cabot Head shales. Gamma ray logs curves of the Manitoulin-Cabot Head interval vary regionally according to gradual change in thickness and sediment type. The Cataract Group thickens basinward. Because of the difficulty in separating the two divisions, these rocks have been mapped and designated as Cataract Formation by some investigators (Cohee, 1948).
Middle Silurian (Niagaran) Niagaran rocks in the subsurface are mainly dolomites and limestones. Cherty zones are found in some areas, and thin shale beds are present regionally in the lower part. Niagaran rocks range in thickness from less than 100 to more than 1,000 feet. The sequence is thickest on or along the platforms and structural features such as the Kankakee and Finday Arches at the southern end of the basin. A similar thick sequence is found around the northern rim.
The Niagaran rocks in the subsurface of the Southern Peninsula, because of reefs, facies differences, and irregular thicknesses, are divided into a number of local rock units having more or less provincial names. In eastern and southeastern Michigan, Niagaran rocks are most often divided into a Clinton and overlying Niagaran section, the latter is further sub-divided into two or more units. These units, and others, have been extended to different parts of the basin where they have become mixed with outcrop nomenclature.
Clinton. In eastern and southeastern Michigan, the lower-most unit of Niagaran rocks is called Clinton. It is a relatively thin, persistent sequence of carbonates and
shales. The Clinton as generally defined in this area corresponds to the Clinton Formation of New York where it has been traced from there across Ontario into Michigan. In Ontario these rocks have been split into several formations and designated Clinton Group, but in eastern and southeastern Michigan they are not generally subdivided. Typical eastern facies of the Clinton can be traced as far west as central Michigan where they then begin to change (Cohee, 1948). Clinton rocks change facies basinward. The shales pinch out or grade laterally into carbonates; the whole section expands in thickness and finally merges with lower Niagaran rocks similar to those found in the Northern Peninsula. The Clinton interval correlates with the Burnt Bluff and Manistique Groups of that region.
In the Northern Peninsula, Mayville, Burnt Bluff, and Manistique rocks were classed for many years as formations of the Clinton Group. Later, the Burnt Bluff and Manistique formations were raised to group rank, their several members became formations, and the term Clinton Group was dropped from the nomenclature (Ehlers and Kesling, 1957). In the northern part of the basin and in other places where Clinton rocks are predominantly thick carbonates, an attempt is made to break-out rock units in accordance with Northern Peninsula definitions and nomenclature. The term Clinton continues to be used in subsurface work in these areas, but not in accordance with past usage. It is often used as a formation name together with, but separate from, Burnt Bluff and Manistique rocks which in the subsurface are generally considered as formations rather than groups.
In eastern and southeastern Michigan, there is an almost abrupt transition from the shaley Clinton section to the overlying clean, light colored rocks of the upper Niagaran section. On radiation and electrical logs, the break is shown by a distinctive curve readily recognized on nearly all logs. It is a useful marker in this region and westward around the southern rim of the basin. But Clinton rocks change facies in a westward and basinward direction, and this in turn leads to a change in total Clinton internal log curve characteristics from place to place. The curve indicating a break from clean, light colored carbonates into Clinton shales remains distinctive around much of the southern rim of the basin, but it becomes increasingly difficult to differentiate Clinton rocks from those of the underlying Cataract Group. This has led to the application of the term “Clinton-Cataract” to the log curve otherwise called Clinton. Characteristic log curves of the Clinton and Cataract intervals across southern Michigan are shown on Correlation Section 2. Basinward from this area, log curves change in response to change in sediment facies. The relationship between Clinton and Cataract rocks near the margin of the basin to their counterparts in the basin interior are shown on Correlation Section 1. The rocks above the Clinton constitute the upper part of the Niagaran.
Rocks above the Clinton. Rocks above the Clinton interval are dolomites and limestones which vary in color, textural characteristics, and thickness. In the subsurface they are white, gray, blue-gray, browns and buffs, and In some areas, pink to red in color. Cherts are present at different stratigraphic levels in some parts of the basin. The thickness of section above Clinton rocks varies from as little as 60 to as much as several hundred feet. The presence of isolated reefs standing above the surrounding Niagaran surface, and the presence of reefs within the thicker areas of Niagaran rock has led to the concept of a reef complex thought to be present around much of the basin margin.
The thick section of Niagaran rock which rings much of the basin thins toward the center of the basin. The surface as well as the base of the Niagaran sequence also dips toward the center. The broad area of thin Niagaran rock across southern Michigan includes much of the deeper part of the basin. Cohee (1948) attributed the thinning of the Niagaran sequence to uplift, either in Niagaran time with nondeposition of younger Niagaran rocks or at the close of Niagaran time with subsequent erosion of the upper beds. The term “Mid-Michigan Ridge” was applied to the same region of thin Niagaran rock by Ehlers and Kesling (1962), who also favored the uplift-erosion viewpoint.
The thicker areas of Niagaran rock have also been interpreted as reef banks or as reef complexes which developed on structurally high regions or on platform areas which frame the basin. Niagaran reefs, or bioberms, are exposed at the surface in Silurian outcrop areas found around most of the Michigan Basin. Reefs, reef associated sediments, and biostromes may occur at various stratigraphic levels within the Niagaran. Reefs may range in size from small, isolated, nearly circular masses less than 10 feet in diameter to large complex masses which may cover several hundred acres. Small reef mounds like the former are found in the Byron Dolomite (Burnt Bluff Group) of eastern Wisconsin. The larger and more complex reef masses are exposed in outcrops and quarries at the southern edge of the basin in northern Ohio, northern Indiana, northeastern Illinois, and on the Bruce Peninsula in Ontario. Small bioberms occur in the upper part of the Niagaran in the Northern Peninsula of Michigan. From these outcrop regions, the reef-bearing rocks extend into the subsurface of the Michigan basin.
In the subsurface the area covered by thick Niagaran rock is thought to be a reef complex. It is conceived to be a region of extensive reef development during the latter part of Niagaran time. Along the strike of the basin rim, the lower carbonate units of the thick section are fairly uniform in thickness and character but toward the center of the basin they change. Above the basinward dipping wedge-like units, the carbonate units are less regular in thickness, color, and texture. These upper units are believed to contain the reef masses, all of which are enclosed and buried by carbonate debris.
Changes in environment resulted in reef development during different intervals of Niagaran time and at different locales within the expanding reef environ. Local closures on the surface of the Niagaran, together with greater thicknesses of Niagaran rock beneath the closures, are generally interpreted as indicating the presence of a reef. Where the Niagaran is regionally thick, the closures have low relief. Those that are farther down the slope of the reef complex, where the Niagaran is regionally thinner, may stand as topographic features having several hundred feet of relief above the surrounding Niagaran surface.
Most of the reefs found in the subsurface appear to be algal-stromatoporoid mounds rather than outright coral reefs as they are sometimes called. In either case they have the characteristics of bioberms, and they are seldom considered as erosional remnants. Brecciation and fossil debris common to most are illustrated in Figure 2. The relationship of isolated or semi-isolated reefs to the main reef complex is illustrated in Figure 3.
Carbonate wedges which taper basinward and reefs complicate the division of Niagaran rocks. Cohee (1948) mapped Middle Silurian rocks as Niagara Group, but the discovery and development of reef oil and gas pools has led to a more widely used terminology. The names and divisions commonly used and reported on logs and oil scout tickets are drillers’ terms such as “Brown Niagaran”, “Gray Niagaran”, and “White Niagaran”. These terms are based mainly on color, texture, and stratigraphic position.
Figure 2. Portions of oil well cores showing brecciation and
fossil debris.
Report of Investigation 2 – Michigan’s Silurian Oil and Gas Pools – Page 7 of 28
The three divisions are most widely used in connection with reefs. In eastern Michigan, and to a lesser extent elsewhere, reefs may be divided vertically into three or more units. Gamma ray log curves of reefs in eastern Michigan almost always show a suite of curves which can be used to differentiate the section into arbitrary units. The uppermost unit, the “Brown Niagaran”, lies immediately below the base of the Salina (Upper Silurian) A-1 Evaporite. In areas where an evaporate unit, either salt or anhydrite, does not overlie Niagaran rock, the top is inconsistently placed. The next unit below is called “Gray Niagaran”. The upper and lower boundaries of this unit are not firmly fixed by distinct lithologic change. The basal unit is commonly called “White Niagaran”. The top of this unit is not sharply marked from the overlying section, but the base is easily recognized because of the underlying Clinton shales. Other possible reef divisions are, in descending order: Zone 3 (“reef”), Zone 2, and Zone 1. A similar division is used by some oil companies operating in the Ontario part of the basin (Pounder, 1962). Divisions just mentioned are not necessarily synonymous with Brown, Gray, or White Niagaran.
Brown, gray, and white colored Niagaran rocks are present in varying amounts and thicknesses throughout the basin. Consequently, divisions based on color have been extended to all parts of the basin, regardless of whether or not they correspond to similar divisions in the reef areas. Conflicts based on these divisions undoubtedly occur on many records and published logs. Though log curve characteristics of Niagaran rocks above the Clinton vary regionally in response to rock character, correlations based on log curves appear to be more reliable and consistent than those based solely on sample examination. Characteristic upper Niagaran log curves for various areas across southern Michigan are shown on Correlation Sections 1 and 2.
Upper Silurian (Cayugan) Upper Silurian rocks have the most extensive subsurface terminology. They are generally divided into two groups: the Salina and the Bass Islands. The lower group, the Salina, is divided into a number of units equivalent to formations. These rocks have a more persistent lithologic character; they contain numerous evaporite beds of wide geographic extent, and log curves of the section are more uniform over very wide areas.
The terminology and general rock divisions in current use are based largely on the work of Landes (1948) and Evans (1950). Landes divided Upper Silurian rocks, in ascending order, into Units A through H, Unit H being equivalent to Bass Islands rocks. Evans further divided the A Units. Extensive exploration and development of Silurian pools in Michigan have gradually brought about the further subdivision of Upper Silurian rocks. The subsurface terminology and most rock divisions of Salina and Bass Islands Groups in current use do not relate entirely to the original subsurface terms and divisions.
Most divisions are based on gamma ray log curves which provide more precision in correlation than those based solely on sample studies. For example, the original Unit D, a thin salt bed, was thought to be merely a lens in the upper part of Unit C (Landes, 1945). The D Unit (D Evaporite of current terminology) as presently defined is a distinctive, widespread salt bed overlying the C Unit and underlying the E Unit. It is not considered to be a part of the C Unit as currently defined. Other differences are mostly in the units above the B salt beds.
Figure 3. Diagrammatic sketch of basin margin reef complex.
Correlation Sections 1 and 2 show characteristic log curves used to define the various Salina and Bass Islands divisions used in this report. Most of the divisions are similar to those commonly used by the oil and gas industry.
Salina Group: A-I Evaporite. The A-1 Evaporite is the lowest stratigraphic unit, or formation, of the Salina Group. It is a clean salt over most of the basin interior, but a few thin shale or carbonate lenses occur near the middle of the unit in the deeper parts (Correlation Section 1). In the deeper part of the basin, the unit has a known thickness of 475 feet. Toward the margins of the basin it thins and grades laterally into anhydrite. The anhydrite equivalent thins and finally pinches out against the flanks of the reef complex. Thin beds of carbonate or shaly carbonate laterally continuous with the anhydrite may be present, but these are seldom identified.
The A-1 Evaporite appears to have been deposited wholely within the Michigan Basin. The depositional edge has been modified in some areas by salt solution and subsequent collapse of overlying rocks, or by salt migration and gradual subsidence of the overlying strata. Locally around the inner margin of the reef complex, isolated pillows of A-1 Evaporite salt form cores of small anticlines. It is generally not present, either as salt or anhydrite, high on the flanks or on the crests of tall reefs.
When the A-1 Evaporite is entirely a salt, it is called A-1 salt; when an anhydrite, it is called A-1 anhydrite; and when it contains both salt and anhydrite, as near the transition, it is split into an A-1 salt and A-1 anhydrite. These terms frequently appear on logs, scout tickets,
Report of Investigation 2 – Michigan’s Silurian Oil and Gas Pools – Page 8 of 28
and other well records. All are synonymous with the term A-1 Evaporite.
A-1 Carbonate. The A-1 Carbonate is essentially dark colored limestone, dolomite, or both. On the margins of the basin it is generally dolomite. In the interior of the basin it can be all limestone, all dolomite, or both. In the immediate vicinity of reefs, it may be completely or partially dolomitized. The unit is thinnest in the basin interior and thickest around the inner margin of the basin where it may reach a thickness of 125 feet. It is generally absent over tall reefs and in areas high on the flanks of the reef complex. Like the underlying evaporite unit, the A-1 Carbonate appears to have been deposited entirely within the basin.
Over large areas, the basal part contains intervals of very thinly laminated dolomite separated by carbonaceous partings. These units are varve-like and suggest cyclic deposition in deep or quiet water. The laminated intervals are often called “poker chip shale”. Locally, the A-1 Carbonate contains as many as three thin anhydrite beds. In St. Clair and Macomb Counties, from one to three thin beds occur in association with reefs. The suite of neutron curves marking their presence is sometimes called “rabbit ears”. Those that occur elsewhere in the basin are generally not named. The anhydrite beds have been confused with the anhydrite equivalent of the A-1 Evaporite.
The A-1 Carbonate produces oil, gas, and salt water in various parts of the basin. Where production is obtained, A-1 reservoir rocks are generally dolomite. Because of this, the A-1 is generally called A-1 dolomite by the oil and gas industry. Where these rocks are not separated from underlying Niagaran rocks by the A-1 Evaporite, it is difficult to separate them from dark colored, dolomitized Niagaran rocks. On gamma ray logs, the A-1 Carbonate is readily recognized where bracketed between the A-1 and A-2 Evaporites. Where the underlying A-1 Evaporite is not present, the characteristic A-1 Carbonate curve may still be recognized for considerable distances up the regional slope of the reef complex.
A-2 Evaporite. This formation, nearly a pure salt more than 475 feet thick in the deeper part of the basin, overlies the A-1 Carbonate. It, also, thins outward and grades laterally into an anhydrite equivalent on the margins of the basin. The depositional edge of this unit has been modified by salt solution or salt migration in some areas. In general, it approximates the depositional edge of the A-1 Evaporite. Over Niagaran reefs the A-2 Evaporite is generally represented entirely by anhydrite usually found at the top and at the base of the salt in off-reef wells. The occurrence of an all anhydrite A-2 Evaporite section in regions where this unit is a thick salt may indicate the presence of an underlying, or nearby reef. The practice in these areas is to call an A-2 anhydrite and an A-2 salt. Both are a part of the A-2 Evaporite which was probably deposited chiefly within the basin.
Figure 4. Correlation Section 1, Silurian System.
A-2 Carbonate. The A-2 Carbonate is a widespread formation whose lithologic characteristics are very similar to those of the A-1 Carbonate. It is composed of dark to light colored limestones, dolomites, or both. On the margin of the basin where it overlies the reef complex, it is generally a dolomite. It may also be partially dolomitized over reefs.
The A-2 Carbonate is about 150 feet thick over most of the basin, but sizable local areas may be as much as 275 feet. Over pinnacle reefs such as those in St. Clair County, the unit may thin as much as 40 percent of its off-reef thickness. Depositional thinning also occurs in association with the margin reef complex. In the southwest part of Michigan it has been removed by one or more cycles of erosion.
The A-2 Carbonate is not homogeneous vertically or laterally. Near the middle of the unit in the deeper parts of the basin, one or two poorly developed anhydrite beds occur. In parts of the basin, the unit may be divided into an upper and lower part. The basal part contains “poker chip” intervals similar to those of the A-1 Carbonate.
In Allegan and adjacent counties, southwest Michigan, the lower part of the A-2 Carbonate is a gray, shaly limestone contrasting with the brown and buff dolomites of the upper part. Gas is produced from porous dolomites in the upper part of the A-2 Carbonate and the lower part of the B Evaporite. During the development of the Overisel Salina A-2 gas pool it became popular to designate the clean carbonates as A-2 dolomite and the underlying gray section as A-2 lime. These terms were extended to other Salina pools in the vicinity. The terms
Report of Investigation 2 – Michigan’s Silurian Oil and Gas Pools – Page 9 of 28
Report of Investigation 2 – Michigan’s Silurian Oil and Gas Pools – Page 10 of 28
are currently used by some operators. They also appear on well logs and scout tickets. A-2 dolomite and A-2 lime are included within the A-2 Carbonate.
B Evaporite. The B Evaporite is a widespread formation consisting of clean salt in the lower part, and a series of salt, shale, and dolomite beds in the upper part. As defined by log curves on Correlation Sections 1 and 2, the unit is over 475 feet thick in the deeper part of the basin, and less than 50 feet in the region of the Niagaran reef complex. It has been removed by erosion from part of southwest Michigan.
The lower part of the B Evaporite is a clean salt, confined to the inner part of the reef complex. The upper part contains numerous, thin dolomite or shale beds many of which can be correlated, by use of gamma ray logs, over wide areas. Toward the margin of the basin, the B Evaporite thins and the lower part pinches out. The upper part also thins; the salt beds between the thin dolomites grade to anhydrite, and these in turn pinch out.
In those parts of the basin where the B Evaporite is thin and salt or anhydrite is not present, these rocks are not readily distinguished from the underlying A-2 Carbonate by ordinary sample study. Gamma ray logs may be used to trace the carbonate equivalent of the B Evaporite over the reef complex. The top of the A-2 Carbonate was formerly called on the basis of a distinctive log curve now considered to be a part of the B Evaporite. Many older records of wells drilled to Silurian rocks in Allegan and adjacent counties place the top of the A-2 Carbonate within the B Evaporite. Characteristic log curves of the B Evaporite in southern Michigan are shown on the Correlation Sections.
C Unit. The C Unit as defined on the Correlation Sections is one of the most persistent of Salina Group rock units. Where not removed by post-Silurian erosion, it may be traced throughout the Michigan Basin and as far east as New York (Ulteig, 1963). It is a gray, shaly dolomite averaging about 60 feet in thickness. Locally, perhaps in association with reefs or with B Evaporite salt solution, it reaches a thickness of over 120 feet. The unit does not contain salt beds, but a thin anhydrite bed or zone of pink and white nodular anhydrite appears to be present over large areas of the basin. Log curves of this unit are distinctive and readily recognized.
D Evaporite. The D Evaporite is a salt bed averaging about 40 feet in thickness. The unit is lenticular and occurs within the inner margin of the Niagaran reef complex. It may be absent over Niagaran reefs. The unit is split by a thin, very persistent dolomite bed which causes a consistent deflection on gamma ray logs.
E Unit. The E Unit is a series of gray, greenish gray, and red shales intercalated between thin dolomites. Except where removed by erosion as in Southwestern Michigan, it ranges from 90 to about 120 feet thick. A salt bed about 15 feet thick occurs near the top in the deeper parts of the basin. The salt bed grades into
anhydrite and is confined to a small part of the basin interior.
On the west side of the basin, a porous dolomite occurs near the base of the unit. The porous dolomite grades eastward and basinward into shales. The porous interval is called “E Zone” or “Kintigh Zone”, and oil is produced from it in the Diamond Springs field, Allegan County. The unit is readily recognized on gamma ray curves, especially when it is bounded by the D Evaporite and F Evaporites. Characteristic E Unit log curves are shown on the Correlation Sections.
F Evaporites. The F Evaporites as defined by log curves on the Correlation Sections are a succession of pure and impure salt beds, thin anhydrite and anhydritic shale beds, shaly dolomites, and dolomites. The shales are similar to those of the underlying E Unit, and are gray, greenish gray, and reddish gray in color. Dolomites are gray, buff, and brown. Part of the impure salts are pink to red-tinged in color; others are white to clear.
The F Evaporites, like those lower in the section, are thickest in the deeper parts of the basin. The sequence is nearly 970’ thick in Ogemaw County, but thins outward toward the margin of the basin; most of it is due to depositional thinning of salt beds. In parts of the basin it has been completely removed by erosion and is immediately overlaid by Devonian rocks.
Gamma ray-neutron and other types of geophysical logs indicate the presence of many, widespread lithic units within the F Evaporite sequence. By use of geophysical logs, it is possible to divide these rocks into many arbitrary units, useful in relating the central basin sequence to the equivalent basin-edge section. The sequence has been divided into six convenient units: F Salt 1 upward through F Salt 6 (Ells, 1962). The divisions are based on the deeper basin sequence and characteristic gamma ray-neutron log curves. All units contain a series of salt, anhydrite, shale, and dolomite beds; each may be traced over large parts of the basin. The six units are strictly log divisions since it is doubtful that they could be everywhere recognized with precision by sample studies.
Characteristic log curves of F Evaporite rocks across Southern Michigan and their relationship to the basin sequence is shown on Correlation Sections 1 and 2. In oil field practice, the top of the F Evaporite is called on the first salt bed encountered in drilling, regardless of stratigraphic position of the salt. Thus, the top of the F salt recorded on well log and scout tickets is not necessarily the same salt bed each time. Individual salt beds of a given F salt unit pinch out irregularly near the basin margin, but many of the shale and dolomite beds persist and converge to form essentially shale-dolomite units. This behavior has led to difficulties in defining the uppermost subsurface division of the Salina, the G Unit.
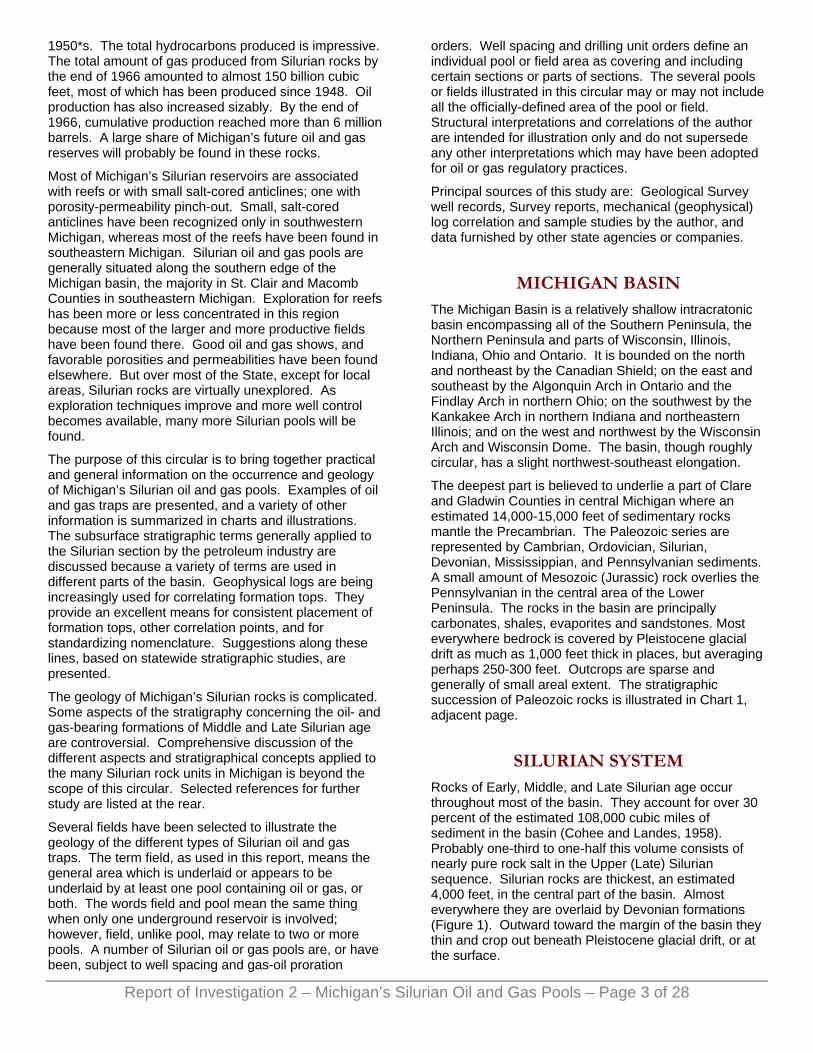
G Unit. The G Unit as defined by log curves shown on the Correlation Sections is different from that described by earlier investigators. Extensive, basin-wide Silurian exploration has provided new information on basin
versus basin-margin relationships of uppermost Salina rocks. The G Unit as picked on the margins of the basin, when traced into the deeper part, can be shown to grade basinward into the F Evaporite. According to the original divisions of Landes (1945), the G Unit was the highest unit of the Salina. The F Unit was believed to be the youngest salt-bearing member. Due to the difference in section between basin and basin-margin, the top of the Salina, or G Unit, has been placed at different stratigraphic levels in different parts of the basin.
Around the margins of the basin, the F Evaporite Unit is comparatively thin in relation to the section farther basinward. It contains fewer salt beds; those that are present are generally part of F Salt 1 or 2. On the basin margin, the top of the Salina, or so-called G Unit, is generally picked at the first thick, gray dolomitic shale section encountered beneath light colored, dense dolomites of the Bass Islands Group. This thick shale interval is consistently recorded on geophysical logs wherever it has not been removed by erosion. Characteristic log curves, labeled “G Unit” for wells A, B, C, and left unlabeled on wells F and G, show how this section relates to the F Salts in wells D and E, Correlation Section 2. If all salt and anhydrite beds are deleted from a log such as D and E and the log curves are reconstructed minus the evaporites, the resulting log curves will have essentially the same configuration and thickness typical of a basin margin log.
In contrast, the top of the Salina in the deeper part of the basin is often picked as shown on Correlation Section 1, and the F Salt is called at the top of the first salt encountered. This leads to a conflict in stratigraphic placement of the Salina top because the same point or rock unit can be traced to the edges of the basin where it is called “H Shale” or Bass Islands shale by some geologists. The H Unit originally meant Bass Islands Group. On the other hand, the G Unit as originally defined, essentially from basin margin wells, when traced basinward grades into F Evaporites. The top of the Salina is variously placed by geologists and these differences are reflected on well records and scout tickets.
Bass Islands Group. Bass Islands rocks, divided into two formations in the outcrop, are seldom divided in the subsurface. These rocks were originally called H Unit, but the term appears not to have been used extensively until recent years. Its present usage as indicated above is in connection with a gray, dolomitic shale bed called G Unit by some geologists and Bass Islands shale by others.
Bass Islands rocks in subsurface are characteristically dense, buff dolomites. The upper part is sparsely oolitic at several horizons. Lower in the section, gray argillaceous dolomites, shaly dolomites, and brown beds are present. Thin anhydrites and several thin salt beds are found in the interior part of the basin. Bass Islands rocks are conformable and transitional downward into Salina Group rocks.
Figure 5. Correlation Section 2, West to East Cross Section.
In the subsurface, Bass Islands range up to 750 feet in thickness in the deeper parts of the basin. An unconformity of considerable magnitude separates these rocks from those of Devonian age. The unconformity is most acute in the southern part of the basin. Here, Bass Islands rocks and a considerable portion of Salina rocks have been stripped away during perhaps several periods of erosion prior to Middle Devonian time. A distinctive, readily recognized break, or unconformity, between Silurian and Devonian rocks is not apparent in the deeper part of the basin.
SILURIAN-DEVONIAN UNCONFORMITY
Salina and Bass Islands rocks are thickest in the center of the basin and thin toward the edge. Much of the thinning is the result of non-deposition of Salina salt, possible solution and leaching of salt beds in local areas, and post-Silurian erosion. Upper Silurian rocks were variously eroded to different stratigraphic levels over much of the basin rim during several periods of emergence following Bass Islands time. Truncation of Upper Silurian rocks is especially pronounced over large
Report of Investigation 2 – Michigan’s Silurian Oil and Gas Pools – Page 11 of 28
areas of southwestern Michigan. Although this erosional surface cannot be mapped in detail everywhere, enough information is available to establish a general pattern.
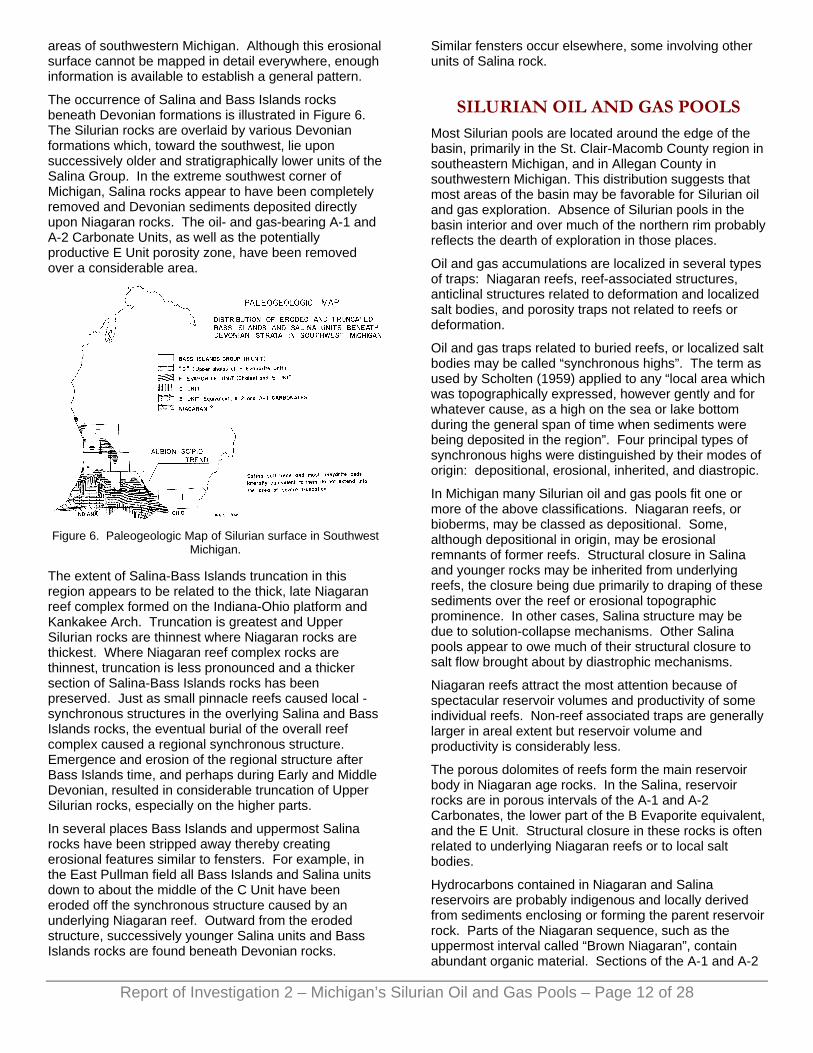
The occurrence of Salina and Bass Islands rocks beneath Devonian formations is illustrated in Figure 6. The Silurian rocks are overlaid by various Devonian formations which, toward the southwest, lie upon successively older and stratigraphically lower units of the Salina Group. In the extreme southwest corner of Michigan, Salina rocks appear to have been completely removed and Devonian sediments deposited directly upon Niagaran rocks. The oil- and gas-bearing A-1 and A-2 Carbonate Units, as well as the potentially productive E Unit porosity zone, have been removed over a considerable area.
Figure 6. Paleogeologic Map of Silurian surface in Southwest
Michigan.
The extent of Salina-Bass Islands truncation in this region appears to be related to the thick, late Niagaran reef complex formed on the Indiana-Ohio platform and Kankakee Arch. Truncation is greatest and Upper Silurian rocks are thinnest where Niagaran rocks are thickest. Where Niagaran reef complex rocks are thinnest, truncation is less pronounced and a thicker section of Salina-Bass Islands rocks has been preserved. Just as small pinnacle reefs caused local -synchronous structures in the overlying Salina and Bass Islands rocks, the eventual burial of the overall reef complex caused a regional synchronous structure. Emergence and erosion of the regional structure after Bass Islands time, and perhaps during Early and Middle Devonian, resulted in considerable truncation of Upper Silurian rocks, especially on the higher parts.
In several places Bass Islands and uppermost Salina rocks have been stripped away thereby creating erosional features similar to fensters. For example, in the East Pullman field all Bass Islands and Salina units down to about the middle of the C Unit have been eroded off the synchronous structure caused by an underlying Niagaran reef. Outward from the eroded structure, successively younger Salina units and Bass Islands rocks are found beneath Devonian rocks.
Similar fensters occur elsewhere, some involving other units of Salina rock.
SILURIAN OIL AND GAS POOLS Most Silurian pools are located around the edge of the basin, primarily in the St. Clair-Macomb County region in southeastern Michigan, and in Allegan County in southwestern Michigan. This distribution suggests that most areas of the basin may be favorable for Silurian oil and gas exploration. Absence of Silurian pools in the basin interior and over much of the northern rim probably reflects the dearth of exploration in those places.
Oil and gas accumulations are localized in several types of traps: Niagaran reefs, reef-associated structures, anticlinal structures related to deformation and localized salt bodies, and porosity traps not related to reefs or deformation.
Oil and gas traps related to buried reefs, or localized salt bodies may be called “synchronous highs”. The term as used by Scholten (1959) applied to any “local area which was topographically expressed, however gently and for whatever cause, as a high on the sea or lake bottom during the general span of time when sediments were being deposited in the region”. Four principal types of synchronous highs were distinguished by their modes of origin: depositional, erosional, inherited, and diastropic.
In Michigan many Silurian oil and gas pools fit one or more of the above classifications. Niagaran reefs, or bioberms, may be classed as depositional. Some, although depositional in origin, may be erosional remnants of former reefs. Structural closure in Salina and younger rocks may be inherited from underlying reefs, the closure being due primarily to draping of these sediments over the reef or erosional topographic prominence. In other cases, Salina structure may be due to solution-collapse mechanisms. Other Salina pools appear to owe much of their structural closure to salt flow brought about by diastrophic mechanisms.
Niagaran reefs attract the most attention because of spectacular reservoir volumes and productivity of some individual reefs. Non-reef associated traps are generally larger in areal extent but reservoir volume and productivity is considerably less.
The porous dolomites of reefs form the main reservoir body in Niagaran age rocks. In the Salina, reservoir rocks are in porous intervals of the A-1 and A-2 Carbonates, the lower part of the B Evaporite equivalent, and the E Unit. Structural closure in these rocks is often related to underlying Niagaran reefs or to local salt bodies.
Hydrocarbons contained in Niagaran and Salina reservoirs are probably indigenous and locally derived from sediments enclosing or forming the parent reservoir rock. Parts of the Niagaran sequence, such as the uppermost interval called “Brown Niagaran”, contain abundant organic material. Sections of the A-1 and A-2
Report of Investigation 2 – Michigan’s Silurian Oil and Gas Pools – Page 12 of 28
Report of Investigation 2 – Michigan’s Silurian Oil and Gas Pools – Page 13 of 28
Carbonates as well as other units of the Salina sequence are highly carbonaceous.
Eastern Michigan reef reservoirs generally have associated oil or gas production from A-1 Carbonate rocks. Where favorable connection existed between reef and A-1 rock, hydrocarbons formed in Salina A-1 Carbonate sediments may have migrated to the dolomitized synchronous structures and entered into porous, underlying Niagaran reef rock. Hydrocarbons could also have moved from surrounding non-reef Niagaran sediments into porous reefs and then upward into the dolomitized A-1 Carbonate rock. In other pools with little or no connection between reef and A-1, the hydrocarbons may be indigenous to the reservoir rock. In A-1 and A-2 Carbonate reservoirs separated by A-2 Evaporite, hydrocarbons are probably indigenous to the parent reservoir rock.
In eastern Michigan, most Niagaran reef fields also produce oil or gas from dolomitized intervals of A-1 Carbonate. Off-reef the A-1 is generally limestone, but around the over reefs it is dolomitized. Off-reef or down on the reef flank, the A-1 is separated from Niagaran rocks by the A-1 Evaporite. The A-1 Evaporite, in this region an anhydrite bed, does not extend completely over tall reefs. The A-1 Carbonate thins or may be absent from the crests. In these cases, interconnection of reef and A-1 Carbonate reservoirs may occur. Both stratigraphic units, reef and A-1 Carbonate, may be considered as one reservoir but each having somewhat different characteristics. Wells may be perforated in both units. Most A-1 oil wells are located down or off structure in relation to associated reefs. In other fields, pressure differentials between reef and A-1 Carbonate reservoirs suggests very little or no interconnection.
Many eastern Michigan reefs have large gas caps. Some of the fields which appear to contain small volumes of oil relative to gas content are classified as gas fields. Others are considered combinations. Oil and gas production by field or pool is summarized in Table 1.
A number of fields have been selected to illustrate the geology associated with Silurian oil and gas traps around the southern edge of the basin. Formation tops and thickness data were determined mainly from gamma ray-neutron logs. Some of the illustrations were constructed during early development of the fields and thus may not show all available well control. Well control is sufficient, however, to demonstrate structural and stratigraphic features discussed herein.
REEFS AND REEF-ASSOCIATED STRUCTURES
Niagaran reefs. Most of the productive Niagaran reef pools are located in St. Clair and Macomb Counties. Others, including nonproductive reefs, occur around the perimeter of the basin. Reefs, therefore, are not restricted to a specific locality on the basin rim, but most are basinward of the reef complex. Only a few wells
have been drilled to Niagaran rocks in the central part of the basin, most of them widely distributed. In the central part of the basin where Niagaran rocks are deepest, a definite reef section has not yet been recognized.
The isolated Niagaran topographic features are generally considered to be reefs. Well samples and cores provide evidence of frame building organisms such as stromatoporoids, algae, and corals. Other reef-associated forms are brachipods, cephalopods, and crinoid debris. Most reef rock is highly dolomitized, thus fossils, bedding planes, and other depositional features are usually obscured or completely destroyed. Main reef builders were probably stromatoporoid and algae colonies that formed mats which acted as traps and binding agents for other reef originating sediments.
Reefs vary in size. Larger ones cover about 400 to 500 acres. Smaller satellite reefs and reef detrital beds associated with the larger reefs may extend the size. The flanking carbonate detrital beds as well as the core are commonly mapped as reef. The larger reefs appear to have several closures along the crest. Those with several closures tend to be linear in plan with a northeast-southwest orientation. A few multi-closure reefs are slightly arcuate in plan. In areas with abundant well control such as Casco Township, T4N, R15E, St. Clair County, where as many as ten variable size reefs occur, orientation is not readily apparent. The presence of smaller reefs and coalescing detrital sediment fans often obscure the reef pattern.
The amount of topographic relief exhibited by individual reefs, from crest to off-reef dry holes, may be as much as 400 to 500 feet. The slope from the highest known point on reef to off-reef dry holes generally does not exceed 15 degrees, although steeper slopes are known. Although commonly called “pinnacle reefs”, these features are more like mounds than pinnacles if breadth and length are compared to height.
Some evidence indicates a relation between the height-breadth ratio of individual reefs to their position basinward from the thicker, more massive Niagaran section. Reefs within the inner margins of the massive Niagaran section appear to have grown rapidly upward in response to a subsiding basin interior while those on the more stable shelf regions were more restricted in vertical growth. The reefs farthest out in the basin tend to be taller and have less areal extent. Reefs nearer the massive reef complex are intermediate in height. Reefs developing, presumably at the same time, on the shallower and more stable positions on the shelf have the least relief but cover a greater area relative to their height. The reef complex which developed around much of the basin margin probably contributed to conditions which led to the deposition of Salina evaporites and the eventual cessation of reef growth. Salina deposits ultimately buried the reef complex.
A few productive reef reservoirs are partly salt-plugged. In others the pore spaces are so completely filled with salt that the production of oil or gas in commercial
Report of Investigation 2 – Michigan’s Silurian Oil and Gas Pools – Page 14 of 28
quantities is hindered. The distribution of salt-plugging in an individual reef appears random. Salt-filled vugs and fissures are found in non-reef-associated rocks; for example, the A-1 Carbonate and, in fact, most units of the Upper Silurian evaporite sequence. Salt-plugged reefs are probably not limited to a single geographic region within the basin. They may be related to the basinward limits of reef development or occurrence, and to the depositional edge of the A-1 and A-2 Evaporite units.
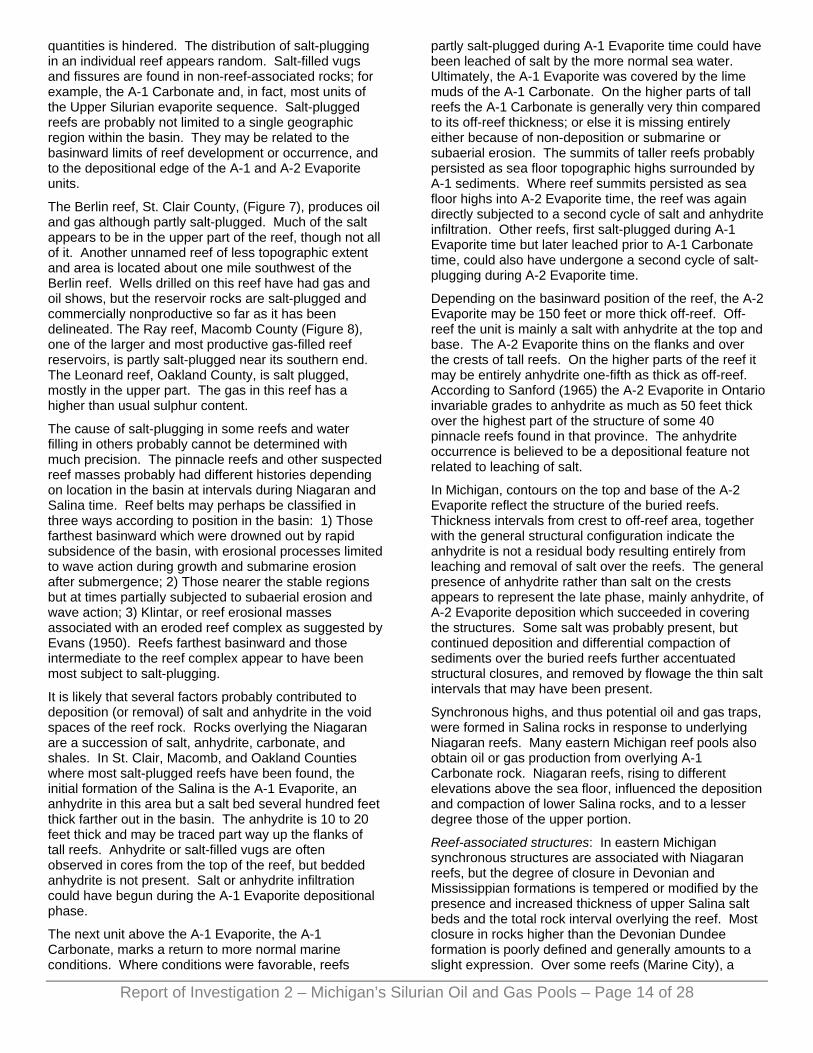
The Berlin reef, St. Clair County, (Figure 7), produces oil and gas although partly salt-plugged. Much of the salt appears to be in the upper part of the reef, though not all of it. Another unnamed reef of less topographic extent and area is located about one mile southwest of the Berlin reef. Wells drilled on this reef have had gas and oil shows, but the reservoir rocks are salt-plugged and commercially nonproductive so far as it has been delineated. The Ray reef, Macomb County (Figure 8), one of the larger and most productive gas-filled reef reservoirs, is partly salt-plugged near its southern end. The Leonard reef, Oakland County, is salt plugged, mostly in the upper part. The gas in this reef has a higher than usual sulphur content.
The cause of salt-plugging in some reefs and water filling in others probably cannot be determined with much precision. The pinnacle reefs and other suspected reef masses probably had different histories depending on location in the basin at intervals during Niagaran and Salina time. Reef belts may perhaps be classified in three ways according to position in the basin: 1) Those farthest basinward which were drowned out by rapid subsidence of the basin, with erosional processes limited to wave action during growth and submarine erosion after submergence; 2) Those nearer the stable regions but at times partially subjected to subaerial erosion and wave action; 3) Klintar, or reef erosional masses associated with an eroded reef complex as suggested by Evans (1950). Reefs farthest basinward and those intermediate to the reef complex appear to have been most subject to salt-plugging.
It is likely that several factors probably contributed to deposition (or removal) of salt and anhydrite in the void spaces of the reef rock. Rocks overlying the Niagaran are a succession of salt, anhydrite, carbonate, and shales. In St. Clair, Macomb, and Oakland Counties where most salt-plugged reefs have been found, the initial formation of the Salina is the A-1 Evaporite, an anhydrite in this area but a salt bed several hundred feet thick farther out in the basin. The anhydrite is 10 to 20 feet thick and may be traced part way up the flanks of tall reefs. Anhydrite or salt-filled vugs are often observed in cores from the top of the reef, but bedded anhydrite is not present. Salt or anhydrite infiltration could have begun during the A-1 Evaporite depositional phase.
The next unit above the A-1 Evaporite, the A-1 Carbonate, marks a return to more normal marine conditions. Where conditions were favorable, reefs
partly salt-plugged during A-1 Evaporite time could have been leached of salt by the more normal sea water. Ultimately, the A-1 Evaporite was covered by the lime muds of the A-1 Carbonate. On the higher parts of tall reefs the A-1 Carbonate is generally very thin compared to its off-reef thickness; or else it is missing entirely either because of non-deposition or submarine or subaerial erosion. The summits of taller reefs probably persisted as sea floor topographic highs surrounded by A-1 sediments. Where reef summits persisted as sea floor highs into A-2 Evaporite time, the reef was again directly subjected to a second cycle of salt and anhydrite infiltration. Other reefs, first salt-plugged during A-1 Evaporite time but later leached prior to A-1 Carbonate time, could also have undergone a second cycle of salt-plugging during A-2 Evaporite time.
Depending on the basinward position of the reef, the A-2 Evaporite may be 150 feet or more thick off-reef. Off-reef the unit is mainly a salt with anhydrite at the top and base. The A-2 Evaporite thins on the flanks and over the crests of tall reefs. On the higher parts of the reef it may be entirely anhydrite one-fifth as thick as off-reef. According to Sanford (1965) the A-2 Evaporite in Ontario invariable grades to anhydrite as much as 50 feet thick over the highest part of the structure of some 40 pinnacle reefs found in that province. The anhydrite occurrence is believed to be a depositional feature not related to leaching of salt.
In Michigan, contours on the top and base of the A-2 Evaporite reflect the structure of the buried reefs. Thickness intervals from crest to off-reef area, together with the general structural configuration indicate the anhydrite is not a residual body resulting entirely from leaching and removal of salt over the reefs. The general presence of anhydrite rather than salt on the crests appears to represent the late phase, mainly anhydrite, of A-2 Evaporite deposition which succeeded in covering the structures. Some salt was probably present, but continued deposition and differential compaction of sediments over the buried reefs further accentuated structural closures, and removed by flowage the thin salt intervals that may have been present.
Synchronous highs, and thus potential oil and gas traps, were formed in Salina rocks in response to underlying Niagaran reefs. Many eastern Michigan reef pools also obtain oil or gas production from overlying A-1 Carbonate rock. Niagaran reefs, rising to different elevations above the sea floor, influenced the deposition and compaction of lower Salina rocks, and to a lesser degree those of the upper portion.
Reef-associated structures: In eastern Michigan synchronous structures are associated with Niagaran reefs, but the degree of closure in Devonian and Mississippian formations is tempered or modified by the presence and increased thickness of upper Salina salt beds and the total rock interval overlying the reef. Most closure in rocks higher than the Devonian Dundee formation is poorly defined and generally amounts to a slight expression. Over some reefs (Marine City), a
small amount of closure is found as high up as the top of the Antrim shale. Over other reefs (Berlin) there appears to be a southward shift in closure, so that nothing more than a structural nosing is evident in Dundee rocks.
Structural closure is formed in virtually all Salina units overlying Niagaran reefs having significant height. In a number of reef fields closure is also found in Devonian and Mississippian formations as well as in the Silurian rocks immediately overlying the reef. The amount of closure is greatest in the A-1 Carbonate and becomes progressively less in successively higher units. The amount of closure in the upper part of the Salina Group and in Devonian and Mississippian rocks appears related to the height of the reef and thickness of strata covering them.
Figure 7. Berlin Field, St. Clair County.
Figure 8. Ray Field, Macomb County.
Structural closure on the C Unit, A-2 Carbonate, and other Silurian formations reflects the underlying Niagaran reef. The first three tests on this gravity prospect failed to find the main
reef mass; the fourth test located the approximate crest of the reef.
The Salina formations immediately overlying Niagaran rocks thicken basinward as do most of the Devonian and Mississippian formations. For example, in St. Clair County, a dry hole on the northeast edge of the Ira field T.4N., R.15E. has about 1060 feet of Salina section (excluding Bass Islands rocks); about 9½ miles farther north on the edge of Big Hand field T.5N., R.15E. the Salina is about 1200 feet thick. About 22 miles north of the Big Hand field the Salina is about 1725 feet thick. The gradual increase in thickness basinward is largely due to the increase in thickness of Salina salt beds. Southward toward the margin of the basin, the Salina salt beds thin and pinch out against the flanks of the thick Niagaran reef complex. Devonian and Mississippian rocks also thin marginward.
Reefs located higher on the flanks of the reef complex where overlying rocks are thinner tend to be reflected by structural closures in formations as young as Mississippian age. In regions where most of the Salina salt is present and the overlying rocks are thicker, underlying Niagaran reefs are reflected to a lesser degree or not at all, by structural closure in overlying Devonian and Mississippian formations. Closures on these synchronous highs have probably been accentuated by differential compaction of sediments over the reef, salt migration or removal of salt by solution, and regional deformation of bedded strata around the less mobile, massive reef bodies. Reef development and the associated closure in overlying rocks appear consistent along the southern margin of the Michigan Basin, but cannot be extended at present to all areas of the basin. In the Illinois Basin to the southwest, structure in Devonian and Mississippian formations in some oil and gas fields is also related to Niagaran reefs (Lowenstam, 1949) and (Howard, 1963).
Salina rocks thin significantly over individual reefs. Thinning occurs mainly in the lower units and to a lesser degree in rocks above the C Unit shale. The degree of thinning varies according to height of the reef and the local thickness of Salina section. In off-reef dry holes the Salina may have as much as 300 feet more section than in a high reef well. The difference is mainly due to thinning of evaporite units, but carbonate units also contribute.
Most of the known productive reefs are in areas where nearly all the Salina evaporites are present. In St. Clair and Macomb Counties, the A-1 Evaporite (an anhydrite over most of this region) thins and pinches out against the flanks of the taller reefs. The A-1 Carbonate also thins toward the crest of the reef and on the highest part of the reef it may be missing. The A-2 Evaporite (salt with anhydrite at the top and base) which may be as much as 150 feet thick off-reef, also thins to a fraction of the thickness found off-reef. Over the higher part of the reef it is largely anhydrite rather than salt. The A-2 Carbonate immediately overlying the evaporite also thins, often to as little as two-thirds its off-reef thickness.
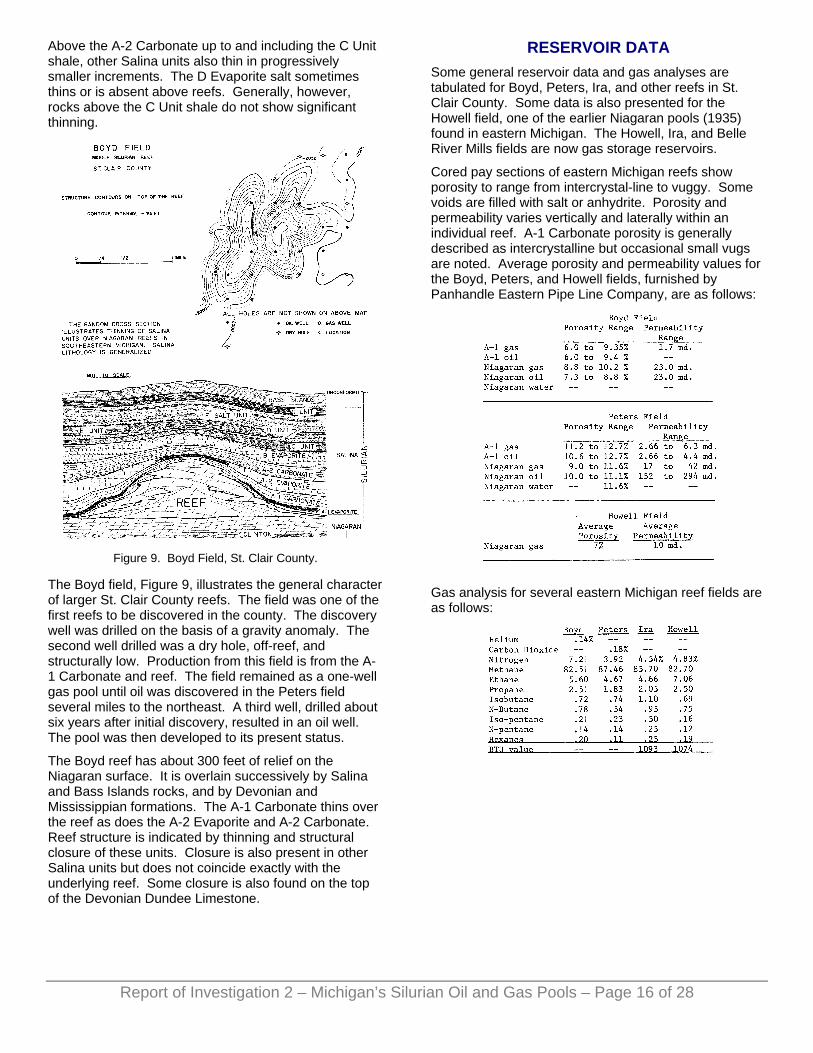
Report of Investigation 2 – Michigan’s Silurian Oil and Gas Pools – Page 15 of 28
Above the A-2 Carbonate up to and including the C Unit shale, other Salina units also thin in progressively smaller increments. The D Evaporite salt sometimes thins or is absent above reefs. Generally, however, rocks above the C Unit shale do not show significant thinning.
Figure 9. Boyd Field, St. Clair County.
The Boyd field, Figure 9, illustrates the general character of larger St. Clair County reefs. The field was one of the first reefs to be discovered in the county. The discovery well was drilled on the basis of a gravity anomaly. The second well drilled was a dry hole, off-reef, and structurally low. Production from this field is from the A-1 Carbonate and reef. The field remained as a one-well gas pool until oil was discovered in the Peters field several miles to the northeast. A third well, drilled about six years after initial discovery, resulted in an oil well. The pool was then developed to its present status.
The Boyd reef has about 300 feet of relief on the Niagaran surface. It is overlain successively by Salina and Bass Islands rocks, and by Devonian and Mississippian formations. The A-1 Carbonate thins over the reef as does the A-2 Evaporite and A-2 Carbonate. Reef structure is indicated by thinning and structural closure of these units. Closure is also present in other Salina units but does not coincide exactly with the underlying reef. Some closure is also found on the top of the Devonian Dundee Limestone.
RESERVOIR DATA Some general reservoir data and gas analyses are tabulated for Boyd, Peters, Ira, and other reefs in St. Clair County. Some data is also presented for the Howell field, one of the earlier Niagaran pools (1935) found in eastern Michigan. The Howell, Ira, and Belle River Mills fields are now gas storage reservoirs.
Cored pay sections of eastern Michigan reefs show porosity to range from intercrystal-line to vuggy. Some voids are filled with salt or anhydrite. Porosity and permeability varies vertically and laterally within an individual reef. A-1 Carbonate porosity is generally described as intercrystalline but occasional small vugs are noted. Average porosity and permeability values for the Boyd, Peters, and Howell fields, furnished by Panhandle Eastern Pipe Line Company, are as follows:
Gas analysis for several eastern Michigan reef fields are as follows:
Report of Investigation 2 – Michigan’s Silurian Oil and Gas Pools – Page 16 of 28
Gas analysis for the Alpine field, a partially salt plugged reef is as follows:
Other synchronous structures associated with buried Niagaran reefs are also found elsewhere around the southern edge of the basin. Several pinnacle reefs near the northern end of the Albion-Scipio trend in Calhoun County also are reflected in beds as high as the Mississippian Sunbury Shale. The Partello reef is located a few miles to the east of the Cal-Lee part of the trend. Synchronous structural closures associated with this reef are shown in Figures 10 and 11.
The discovery well, drilled on the basis of a gravity anomaly, penetrated about 470 feet of Niagaran section overlying the Clinton. Three additional wells penetrated 260 to 275 feet of section above the Clinton. Other wells were not drilled to the Clinton but were structurally low on the Niagaran top. The trend of this reef, possibly a multi-closure structure, is north-northwest. Other reefs in the Cal-Lee area to the west also have this general orientation. Gas is contained in the reef section and A-1 Carbonate.
The A-1 Evaporite, an anhydrite bed, is not present or identifiable in the vicinity of the Partello reef. The A-1 Carbonate is about 60 feet thick off reef, but progressively thins against the flanks of the reef and is about 10 feet thick on the crest. The A-2 Evaporite overlying the reef is largely anhydrite ranging from about 25 to 70 feet thick. The thicker intervals are on the southwest side and near the crest of the structure. The A-2 Carbonate overlying the A-2 Evaporite is about 210 feet thick off-reef but progressively thins to as little as 102 feet on the crest. The B Evaporite overlying the A-2 Carbonate is about 110 feet thick off-reef. This unit
Report of Investigation 2 – Michigan’s Silurian Oil and Gas Pools – Page 17 of 28
which contains salt, thin anhydrites and dolomite stringers off-reef, also thins to as little as 86 feet on the higher part of the structure.
The C Unit shale is about 60 feet thick over the highest part of the reef (SE SE Section 12) but thickens off-reef to about 95 feet. Three off-reef wells have an extra section of C Unit about 30 feet thick. The extra C Unit shale is younger than the main interval of C but older than the overlying E Unit. The intervening D Evaporite is not present this near the inner margin of the reef complex. Structural closure and thinning over the crest of the reef is evident in other Salina units above the C Unit shale and as high stratigraphically as the Mississippian Sunbury shale.
The East Pullman field, Allegan County, illustrates another coincidence of Niagaran reefs with structural closure in Devonian and Mississippian rocks. The field, first drilled and developed as a Traverse oil pool in 1949, is located well outside the area of Salina salt occurrence. The depositional edge of the Salina A-1, A-2, and B Evaporite units is represented by relatively thin anhydrite beds, most of which can be identified in samples and on mechanical logs.
The response of Salina units to the topographic expression of the reef beneath the East Pullman field is similar to that of the Salina units over the reefs in St. Clair and Macomb Counties, the difference being mainly the absence of salt in the East Pullman area. The first Niagaran well drilled in this field was located high on the Traverse structure (Figure 12), and was drilled into rocks commonly called “Clinton” in this region. Over 725 feet of Niagaran section was logged in this hole compared to about 475 feet of Niagaran logged in the Berlin reef, one of the taller reefs in St. Clair County. Other Niagaran tests encountered a shorter and structurally lower Niagaran section. The reef is water-filled; gas is contained in the A-2 Carbonate interval. Initial production from the discovery well was gauged at 4,800 MCF per day.
Subsequent Silurian tests drilled on various parts of the Traverse structure confirm the coincidence of Devonian and Mississippian closures related to reefing. Off-reef the A-1 Evaporite and A-1 Carbonate have normal thickness for this part of the basin, but they pinch out against the flank of the reef and are not present on the crest. The A-2 Evaporite, an anhydrite, also thins against the reef and is not present on the higher parts. The A-2 Carbonate (generally divided in this region into two units, an upper “A-2 dolomite” and a lower “A-2 limestone”) is well developed off-reef. But over the reef it thins, principally by pinch-out of the lower unit and by some thinning in the upper part. Other units of the Salina, the B Evaporite equivalent, the C, E, F, and “G” units are represented off-reef by thicknesses normal for the region. However, over the reef all units from about the middle of the C unit upward are absent and appear to have been truncated by post-Bass Islands erosion. The relationship of Salina units and the truncation of these units over the reef are illustrated in Figure 12.
Other interpretations, unpublished, explain Salina unit - Niagaran stratigraphic relationships to: interfingering of Salina units with the Niagaran reef, or to burial of the reef and non-deposition of Salina units younger than A-2 Carbonate.
SALT-CORED ANTICLINES Anticlines with salt cores occur in Michigan’s Salina rocks. The structures owe their existence to local, more or less lenticular masses of Salina salt. The base of the salt mass is often flat, or nearly so. The upper surface of the salt is domed, thus imparting structure to overlying formations. The salt mass does not perforate and extend upward through the covering rock. Most, but not all, are related to the salt mass of the A-1 Evaporite. Some Salina oil and gas pools are located on structures caused by underlying salt lenses. Such structures have been referred to as synchronous highs; many of them are diastrophic in origin (Scholten, 1959). In Michigan, such structures have been called pseudoanticlines, and their origin has been related to salt solution. The latter view prevails for such structures in Michigan.
Figure 10. Partello Field, Calhoun County.
The seemingly abrupt termination or thinning of various Salina salt beds and the occurrence of isolated lenses of salt in supposedly salt-free areas have led many to conclude that most, if not all, salt-cored structures in Michigan are due to removal of salt by circulating ground waters. Extensive outcrops of Upper Silurian and lower Middle Devonian breccia in the Straits of Mackinac region, as well as intra-formational breccia seen in some
Report of Investigation 2 – Michigan’s Silurian Oil and Gas Pools – Page 18 of 28
Upper Silurian rocks in the southern sector of the basin, is perhaps the most convincing evidence supporting this theory. In the subsurface, variations in structure and rock thickness above and below salt beds, abnormal and variable dips, fractures, small faults, and breccia found in some well cores lend further support to the concept of solution and subsequent collapse or subsidence of overlying strata.
Figure 11. Partello Field, Calhoun County.
Leaching and removal of Salina salt beds, locally and regionally, appears to be widespread particularly along the depositional edge. Numerous collapse structures occur in southwest Ontario (Sanford, 1965). Some are concentric and elongated; some occur above small bioberm reefs. Others are not related to reefs. Some of the elongated collapse features are said to have resulted from leaching of salt along major joint or fault planes. According to Sanford (1965), the process of salt leaching occurred at various times from soon after initial salt deposition to post-Upper Devonian time. The process varied considerably from one region to another. In the Michigan area of the basin, similar salt-free areas occur. Here, the leaching or subsidence also varied from one region to another, but within the same general time range as in Ontario.
Solution of salt is believed to have led to the formation of caves within the salt beds. The collapse of their roofs produced breccia and large down-faulted blocks with varying abnormal dips. Adjacent to these collapse areas, other remaining masses of salt-formed hills or islands. Structures in rocks overlying these salt
prominences were called pseudostructures or pseudoanticlines (Landes, 1948).
Figure 12. East Pullman Field, Allegan County,
Stanton (1966), who studied solution breccias in cores, suggests that cavern formation and roof collapse, although probably a common mode of brecciation at very shallow depths, may be relatively unimportant in the development of solution breccias observed in evaporite deposits. A study of solution breccias, in which all stages of breccia development were preserved, indicated that during brecciation gradual subsidence, evaporite flowage, and small scale precipitation may occur simultaneously with gross evaporite removal.
A core description for a well drilled in the Overisel gas storage pool, a salt cored structure, describes solution-brecciation characteristics similar to those cited and figured by Stanton. This well, Permit No. 23134, Consumers Power Company - CPC No. 7, was cored in the Salina F Evaporite and E Unit, and in the B Evaporite equivalent - A-2 Carbonate intervals. The well is located in the NE NW, Section 27, T. 14 N., R. 14 W., on the higher part of the structure (Figure 21), and reached total depth in the lower part of the A-2 Carbonate.
Cores of the A-1 and A-2 Carbonates, and other Salina units frequently show small fractures, sometimes filled with salt or anhydrite. Many are in thin bands and apparently intra-formational. Parts of cored intervals often show “pull-apart” structure and contortion of bedding planes suggesting deformation prior to complete induration of sediments. Other cores showing salt-filled
Report of Investigation 2 – Michigan’s Silurian Oil and Gas Pools – Page 19 of 28
Report of Investigation 2 – Michigan’s Silurian Oil and Gas Pools – Page 20 of 28
fissures indicate that salt was squeezed into the fissures after complete induration of the sediment. Most of the above features could be used to support a solution-collapse theory, but they are equally supportive of deformation, or solution subsidence.
Collapse structures or pseudoanticlines have been described by Landes (1948) for parts of St. Clair County, eastern Michigan. In Diamond Crystal Salt Company’s cluster of wells in Section 31, T. 5 N., R. 17 E., the driller’s log of well No. 12 showed at least 120 feet of salt above the base of the F Unit, as then defined. Comparison of the driller’s log with samples of nearby wells showed that all but the basal 20 feet of F salt had been leached. The structural data for the top of the Bass Islands rock suggested that the upper Salina and Bass Islands rocks overlaid a hill of unleached F Salt. Extensive drilling in St. Clair, Macomb, and other counties in recent years has disclosed a number of other localities with anomalous thicknesses of Salina salt.
Anomalous salt thicknesses similar to those in the Diamond Crystal Salt Company cluster of wells occur about 14 miles northwest of the previously-mentioned pseudoanticline. The first well drilled in this area was drilled on a gravity anomaly which presumably outlined a Niagaran reef. No reef was found, but anomalous thicknesses of Salina salt units were encountered. Because the absence of salt and the apparent gravity anomaly might be associated with an underlying reef, further tests were eventually drilled. None encountered a reef, but other anomalous salt sections in the area were confirmed. Two additional wells were eventually drilled in the immediate vicinity. Salina subdivisions such as the G, E, C, A-2, and A-1 Carbonates are clearly identified on the logs of the three wells. Data for them are shown in Figure 13 and in Figure 14. The salt units, where present, are readily identified. Where salt is absent, shales, thin dolomites, and thin anhydrites are indicated.
The first well drilled in this area was well B, a Niagaran reef prospect. In this well most of the F Evaporite salt beds, the D Evaporite salt, and most of the B Evaporite salts are missing. The thickness of A-2 Evaporite salt is normal for this area, as is the thickness of the A-1 Evaporite anhydrite. The second exploratory well, A, is located about 1880 feet northeast of well B. In this well, no salt was encountered. The third well, C, was drilled about 990 feet southeast of well B. It encountered F Evaporite salts 1, 2, and 3; the D, B, and A-2 Evaporite salts; and the A-1 Evaporite anhydrite. The Salina sequence in well C compares favorably with other wells drilled several miles away. It is considered to have a normal salt sequence for this area of the basin.
The oldest formation top penetrated in the three wells is the Clinton. Datums on this surface reflect the regional dip to the northwest. The top of the Niagaran has a lesser slope in the same direction, the difference being an increased thickness. The structure in Salina units is due primarily to the difference in salt thickness in wells A, B, and C. Absence or thinning of salt units,
differences in datums, and mixed well cuttings suggesting brecciation neither prove nor disprove solution-collapse theory. Rotary well cuttings provide few clues to the nature of the Salina section in these wells because of current drilling practices using minimum drilling mud concentrations. The well cuttings are too mixed and contaminated to provide a reliable sequence of rock strata.
Anomalous salt thicknesses as noted above, and the occurrence of small, salt-core structures can be accounted for by simple solution and gradual subsidence mechanisms, or by the autonomous isostatic movement of salt. The term “halo-kinesis” has been proposed as a collective term for all processes connected causally with the autonomous isostatic movement of salt. Halo-kinetic structures contrast with halo-tectonic structures which originate predominantly as a result of compressive tectonic forces (Trusheim, 1960).
According to Trusheim, the development of a salt structure normally began with a “salt pillow” stage. The salt pillow consists of a plani-convex accumulation of salt, at first hourglass-shape, later dome-shaped and usually symetrical. Migration of salt into these pillows takes place from sides inward. The mass displacement of salt causes the covering beds to subside at the periphery of the salt pillow, thus causing primary peripheral sinks. The subsidence at the sea bottom surface is compensated by leveling sedimentation which fills in the sinks. Strata in the peripheral sink decreases in thickness toward the salt pillow. If the supply of salt is limited or interrupted, pillow development may be arrested for variable periods of time. With a sufficient supply of salt, the pillow continues to grow, its flanks become steeper until finally, the salt breaks through the upper confining layers of rock. At the piercement or diapir stage, salt movement becomes predominantly vertical.
Salina oil and gas pools related to salt structures are found in Allegan County. Detail geological studies of the eight known pools of this type suggest that all are due to salt flow-age and subsidence rather than solution and collapse mechanisms. All are near the depositional edge of the Salina evaporite units; and all are related to the A-1 Evaporite salt.
The depositional edge of the A-1 Evaporite extends into Allegan County. In the northern part it is a salt bed; to the south the salt grades into a thin anhydrite. The A-2 Evaporite is represented in this area by a thin anhydrite bed, continuous basinward into salt. The B, D, and F Evaporites do not extend into this area as salt beds. The salt structures are located near the salt-anhydrite transition boundary of the A-1 Evaporite. The orientation of the larger structures approximates the strike of the A-1 Evaporite depositional edge in this part of the basin.
All the Allegan County Silurian pools have been found by deeper drilling on Devonian “Traverse limestone” anticlines. Silurian reservoir rocks include: A-1 Carbonate, A-2 Carbonate, part of the B Evaporite
equivalent, and in one field, a porous dolomite in the E Unit. The pools vary in size and shape, amount of relief, and in reservoir characteristics, but are sufficiently similar in other geological aspects to warrant a few general conclusions.
Figure 13. Anomalous salt thickness in St. Clair County wells.
Silurian oil and gas pools coinciding with Devonian “Traverse limestone” structures related to localized salt masses beneath A-1 Carbonate are shown on the following chart:
Larger structures in Allegan County such as Overisel, Fillmore, Salem, and others are salt cored. Wells drilled on the higher parts of these closures penetrate A-1 Evaporite salt between the overlying A-1 Carbonate and the underlying Niagaran rock. Wells drilled off-structure encounter a thinner salt section, or none at all. Wells drilled clearly off-structure penetrate a relatively thin anhydrite rather than salt. The salt mass is about 150 feet thick beneath the Overisel structure and about 100 to 186 feet thick beneath the Salem field, a multi-closure structure. Off structure the anhydrite is about 15 to 20 feet thick.
Unfortunately, few wells on structure are drilled completely through the salt mass. Most development wells, if reservoir rocks are A-1 Carbonate, are bottomed out near the base of the reservoir rock or else in the top of the underlying salt. Wells drilled off structure are more often drilled into the A-1 Evaporite anhydrite, or into the Niagaran. Knowledge of the shape and
distribution of the salt mass is obtained indirectly from A-1 Carbonate structure and thickness data. The amount of A-1 Carbonate structural closure approximates the known thicknesses of salt beneath these structures.
In those fields where enough Silurian tests have been drilled and reliable geological data is available, structural closure is evident in many formations as young as the Cold-water “red-rock”, a Mississippian marker bed. Repetition of log curves and near uniform thickness values for Salina units other than the A-1 Evaporite salt show the relationship of Silurian rocks on and off structure. Similarity of structure in formations above the A-1 Evaporite, and a gradual decrease in structure and thickness in successively higher units, suggests intermittent deformation and salt flowage as the main mechanisms acting to form these small, salt-cored structures.
Figure 14. Salt structure, St. Clair County.
Structural relationships between Salina formations and younger rocks are illustrated by contour maps for the Wayland, Fillmore, and Overisel fields. These fields are similar to other salt structures cited.
The Wayland field is on one of several anticlinal features in the northeastern part of Allegan County. The Traverse oil pool was discovered in 1944; the Salina A-1 Carbonate pool in 1960. The field configuration of the original Traverse pool is shown in Figure 15. Structure contours on selected formations penetrated by Silurian tests drilled since 1960 are shown in Figures 16 and 17. They confirm the structural similarities between Silurian,
Report of Investigation 2 – Michigan’s Silurian Oil and Gas Pools – Page 21 of 28
Devonian, and Mississippian marker beds. The Traverse structure to the northwest (North Wayland), underlying the village of Wayland, has not been tested for Silurian production on the higher part of the closure.
The Fillmore field is a multi-closure, linear structure located in Allegan and Ottawa Counties. The Traverse oil pool was discovered in 1938; the Salina A-2 and A-1 Carbonate gas pools in 1956. The configuration of the original Traverse pool is shown in Figure 18. Fewer Silurian tests have been drilled on this structure because of wider well spacing. Nevertheless, the structural similarities between Silurian and Devonian rocks are evident. Structural data for this field are shown in Figures 19 and 20.
The Overisel field is a large, palmate-shaped structure extending over several square miles. The main Traverse pool was discovered in 1938; the Salina A-2 Carbonate gas pool in 1956. The A-2 pool is now a gas storage reservoir. About 187 wells have been drilled to Silurian rocks in this pool. The structure maps in Figure 21 show the configuration of the closures during an early stage of field development. The generalized cross section shows the relationship between the A-1 Evaporite salt and the overlying Salina units.
In the Overisel field as well as in other fields in the vicinity, the A-2 Carbonate is called A-2 dolomite. The top of the A-2 dolomite as originally called is a part of the B Evaporite equivalent. Gas is produced from dolomites in the lower part of the B Evaporite equivalent and the upper part of the A-2 Carbonate. The reservoir section is a light tan to buff, finely crystalline dolomite interbedded with thin layers of anhydrite. The thickness of the producing interval totals 50 to 60 feet, but usually not more than half the section is permeable.
The porosity in the pay section is inter-crystalline and little solution porosity, except for some isolated vugs, has been observed. Porosities measured in those parts of the section having a permeability of 0.1 md. or more range from a minimum of 2.6 percent to a maximum of about 22.2 percent. The permeability of the dolomite within the reservoir section ranges from 0.1 md. to a maximum of 29.0 md. Permeable lenses are separated by beds of low permeability or by anhydrite having no permeability. The producing section also has an interstitial water content of approximately 29 percent (Fruechtenicht, 1960). Though specific data are not available, reservoir characteristics of other Salina pools in the Allegan area are probably similar to Overisel.
The following data compares some Overisel A-2 reservoir characteristics with those of the Salem A-2 reservoir in the township to the east. The analysis is based on 50 wells in each pool.
Gas analysis for the overisel and Salem Salina A-2 Carbonate gas pools are as follows:
Figure 15. Wayland Field, Allegan County.
Report of Investigation 2 – Michigan’s Silurian Oil and Gas Pools – Page 22 of 28
Figure 16. Wayland Field, Allegan County.
Figure 17. Wayland Field, Allegan County.
Figure 18. Fillmore Field, Allegan and Ottawa Counties.
Figure 19. Fillmore Field, Allegan and Ottawa Counties.
Report of Investigation 2 – Michigan’s Silurian Oil and Gas Pools – Page 23 of 28
Figure 20. Fillmore Field, Allegan and Ottawa Counties.
[Reservoir data]
[Gas analysis]
Figure 21. Overisel Field, Allegan County.
The specific gravities of Overisel and Salem gas are, respectively, .666 and .693. Heating values in BTU/SCF are 1090 and 1110.
OIL AND GAS POOL TABLES The oil and gas pools listed in Table 1 include all Silurian pools discovered through 1966. The tables were compiled from statistical summaries published by the Geological Survey Division, Michigan Department of Conservation. Most of these pools are shown on the oil field map, Figure 22.
In the “Year of Discovery” column, the year shown is that of the initial Silurian pool discovery-well for the field. This is pointed out because a few fields, Boyd and Peters for example, were classified for several years as “one-well” gas fields. Later, oil wells were drilled in these fields, and the first oil well completed as a producer was credited as a new oil discovery for the field even though completed in the same reservoir rocks.
In those fields listed as producing from Salina-Niagaran, gas and/or oil is produced from Salina reservoir rocks as well as Niagaran reservoirs. Some of the wells are completed in the Niagaran, others in the A-1 Carbonate, and others dual completed in both reservoirs. Production from A-1 Carbonate and Niagaran rocks is lumped together and shown in the “Cumulative Production” column.
Fields listed as “shut in” are so classified due to lack of pipe line facilities at the time of this compilation. Some of the fields are currently subject to gas/oil proration regulations and others have been in the past. Proration regulations may be altered as warranted by changing reservoir conditions.
Special well spacing and drilling unit regulations are currently applied to some of the fields. Drilling units vary from the previous standard or minimum 10 acre units, to units of 20, 40, 80, 160, or 320 acres per well. Minimum drilling units are now 40 acre tracts. The acreage figures assigned to gas storage reservoirs are generally the acreage designated prior to conversion of the field to gas storage and does not relate to gas storage area boundaries.
Gas Storage Reservoirs. Prior to 1960 all of Michigan’s gas storage reservoirs were located in the central part of the state where most of the Michigan Stray (Mississippian) gas fields occur. Here the storage reservoir rocks are the Michigan Stray sandstone. The discovery and development of Silurian gas pools such as Overisel in the southwest part of the state in 1956 opened the possibilities of gas storage reservoirs in areas closer to population and industrial centers. Since then a number of Salina gas pools and Niagaran reef pools have been converted to storage reservoirs. General information on these reservoirs is shown on the accompanying Tables. Other Silurian pools will probably be converted to storage in future years.
Report of Investigation 2 – Michigan’s Silurian Oil and Gas Pools – Page 24 of 28
Report of Investigation 2 – Michigan’s Silurian Oil and Gas Pools – Page 25 of 28
FUTURE SILURIAN PROSPECTS The Silurian rocks of Michigan, except for local areas, are virtually unexplored. Practically all the Silurian tests have been made around the southern edge of the basin and in the southeastern part of the state where these rocks are at a relatively shallow depth. Most of the more productive reefs have been found in this region, so most exploration for them is concentrated there. Reefs have been found at other places around the basin margin, but few of them have been as productive of oil or gas as those in the St. Clair-Macomb County region. Large areas around the basin rim have not been explored. It seems probable that other productive reef areas will eventually be established.
Because of the lack of Silurian information for most of the deeper part of the basin, little can be said about the oil and gas potential. The basin Niagaran facies appears to be different from that of the margin reef complex. Reef development in the deeper part may be practically nil. Porosity traps related to up-dip sedimentary wedges are a possibility in the Alexandrian and lower Niagaran “Clinton” section. One gas field of this kind, in “Brown Niagaran” rocks, has been found.
Gas entrapment in the Capac field, St. Clair County, appears related to an up-dip, porosity-permeability pinchout possibly due to salt plugging, a change in sediment facies, or both. Other fields with this type of trap may exist elsewhere around the edge of the basin. The Capac field is about two miles wide and extends about eight miles in a north-south direction. The area covered by the field, about 6200 acres, results from the consolidation of the Lynn, North Capac, and South Capac fields with the Capac field. These fields were consolidated in 1963 and 1964 for administrative and statistical handling rather than from a gas production aspect. Well spacing and drilling units are 160 and 320 acre units per well. On this basis, the several productive areas have been essentially joined together by development drilling. About 50 wells have been declared productive in the field, but the bulk of the gas production has come from several wells in the original Capac field area.
Reservoir rocks are the “Brown Niagaran” section underlying the A-1 Evaporite. The top of the Niagaran is about 500 feet higher on the updip, south edge of the field than at the northern edge. Contours on the Niagaran surface indicate slight undulations and a gradual basinward dip. No unusual topographic features that can be interpreted as reef are evident, yet the southern edge of this field is but a few miles from known reefs such as Berlin. Porosity and permeability figures, not available for publication at this time, indicate considerable variation within the field. There is evidence of low permeability barriers between different parts of the field thus indicating inhomogenous reservoir conditions.
The origin of salt structures in the Michigan Basin is probably more complex than suggested. Some are related to solution of salt and gradual subsidence of
overlying beds. Others are related to salt flowage or migration. Solution of Salina salt beds and collapse of overlying rock has also occurred around the edge of the basin as shown by the Mackinac Breccia in the Straits of Mackinac region.
Small, salt-cored structures are found along the depositional edge of the Salina salt beds. Deformation, perhaps related in part to basin subsidence, caused downwarping of A-1 Carbonate beds. Contemporaneous sedimentation and intermittent deformation ultimately pinched-off relatively small areas of salt which became localized beneath anticlinal folds. The process was probably modified in places by periods of solution and subsidence.
Little data is available on the possibilities of Salina salt structures beneath prominent Devonian anticlinal trends in the deeper parts of the basin, though salt structures coincident with Devonian structures on the shallow basin margin seems well established. Regional deformation and gradual subsidence of the basin interior during Salina and later times probably caused differential movement of formations within the Salina sequence. Subsidence of the basin may have resulted in partial detachment and gliding of Salina rocks down-dip along the basal A-1 Evaporite-Niagaran contact. Thus fold systems, fracture systems, and interformational breccias formed in this way may have no relationship to underlying Niagaran structures, or to those overlying the Salina.
None of the large anticlinal trends in the central part of the basin have been adequately tested for oil and gas in Silurian and older rocks. On anticlinal trends where such Devonian fields as Vernon, Wise, Mt. Pleasant, Porter and others are located, Silurian tests are few, widely dispersed, and do not define the relationship between Salina salt beds and structure in the overlying and underlying formations. Most have encountered small shows of oil or gas in Salina reservoir rocks, but much of the pore space is salt-plugged.
Salina gas has been found on one central basin structure, the Kawkawlin field in Bay County. In 1941, Gulf Refining Company’s No. 1 Bateson, Section 2, T 14 N, R 4 E, encountered gas in the upper part of the A-1 Carbonate at a depth of about 7,778 feet. The well eventually blew-out and caught fire. Data on the A-1 Carbonate gas pay follows:
An undetermined amount of gas and condensate was produced before the well was plugged back and completed as a Devonian Dundee oil well. A second well was drilled about one mile northwest and higher on the Devonian structure. No shows were found in the Salina and the well was abandoned. No further Silurian tests have been drilled on the Kawkawlin structure.
Prominent anticlinal structures such as Kawkawlin in Bay County may eventually yield gas and oil from Salina rocks. Whether or not reefs are associated with these structures is yet to be determined. Many of them may be partially related to salt structure.
Michigan salt structures are capable of trapping oil and gas whether they originate as pseudoanticlines caused by solution of salt and collapse of overlying rock, or, as salt-cored structures caused by salt flowage or deformation. The salt structures of Allegan County are typical. Large unexplored areas around the perimeter as well as in the interior of the basin afford potential for oil and gas traps related to Silurian salt structure. The distribution of known salt structures in relation to other oil and gas pools in the southern half of the Southern Peninsula is shown on the oil and gas field map.
Figure 22. Oil and Gas Field Map, lower half of Southern
Peninsula.
[Table 1 – Silurian Oil and Gas Fields or Pools]
[Table 2 – Silurian Gas Storage Reserves]
In some areas of the basin as the Howell and Northville anticlines, a part of the Washtenaw Anticlinorium (Figure 22), structural closure occurs in Ordovician, Silurian, Devonian, and Mississippian formations. Structural closure is modified by presence of reefs and absence of salt. At least one pinnacle reef appears related to the Northville anticline, and a reef mass appears associated with the Howell field further north on the Howell structure. Absence of certain Salina salt beds is related to non-deposition of salt, and others to solution and removal of salt along fracture or fault systems during the development of these structures. Development of these large anticlines was intermittent and continued at least into Mississippian time. Subsurface studies indicate that salt removal, or migration, took place as early as A-2 Carbonate time and as late as Middle Devonian time.
In Allegan, Ottawa, Kent, Barry, and other counties in southwest Michigan, narrow and linear structural lows on the Traverse limestone flank some of the salt structures. If these structures are indeed due to solution of salt and subsidence or collapse of overlying rock, the adjacent lows may be related to fault systems and thus potential oil and gas traps in pre-Salina rocks.
Report of Investigation 2 – Michigan’s Silurian Oil and Gas Pools – Page 26 of 28
Gravimeter, seismograph, or subsurface studies have been successful in locating reefs on the basin edge. Few wells drilled on gravity or seismic anomalies locate the reef with the first hole. Most are located at the expense of several dry holes. Readily accessible oil and gas markets and the relatively shallow drilling depths in areas of known production make the basin edge a popular place for exploration. At the present time, depth and drilling costs, lack of abundant well control, and the unimpressive performance of some Silurian reservoirs, make the deeper part of the basin a less favorable area to explore.
REFERENCES AND FURTHER READING
Ailing, H. L., and Briggs, L. I. (1961), Stratigraphy of Upper Silurian Cayugan Evaporites: Bull. Amer. Assoc. Petrol. Geol., Vol. 45, No. 4, pp. 515-547.
Bolton, T. E., and Liberty, B. A. (1955), Silurian Stratigraphy of the Niagaran Escarpment, Ontario: Mich. Geol. Soc. Ann. Field Trip, pp. 19-38.
Briggs, Louis I., Quantitative Aspects of Evaporite Deposition (1957), Vol. XLII, Papers of the Michigan Academy of Science, Arts, and Letters.
_____, and Pollack (1967), Digital Model of Evaporite Sedimentation, Science, January, Vol. 155, No. 3761, pp. 453-456.
_____, Evaporite Facies (1958), March, Journal of Sedimentary Petrology.
Cohee, G. V. (1948), Thickness and Lithology of Upper Ordovician and Lower and Middle Silurian Rocks in the Michigan Basin: U.S. Geol. Survey Prelim. Chart 33, Oil and Gas Inv. Ser.
_____, (Chairman) (1954), Southern Peninsula of Michigan, Geologic Cross-section of Paleozoic Rocks, Central Mississippi to Northern Michigan, Amer. Assoc. Petrol. Geol., pp. 20-29.
_____, and Landes, K. K. (1958), Oil in the Michigan Basin, Habitat of Oil, Amer. Assoc. Petrol. Geol., pp. 473-493.
Cotter, E. (1965), Walsortian-type carbonate banks in the Mississippian Lodgepole Formation of Central Montana, The Jour. of Geology, Vol. 73, No. 6, pp. 881-888.
Ehlers, G. M., and Kesling, R. V., (1957) Silurian Rocks of the Northern Peninsula of Michigan: Mich. Geol. Soc. Ann. Geol. Excurs., 63 pp.
Ells, Garland D. (1958), Notes on the Devonian-Silurian in the subsurface of southwest Michigan: Progress Report No. 18, Mich. Geol. Survey Div., Michigan Department of Conservation.
_____, (1962), Structures Associated with the Albion-Scipio Oil Field Trend, Mich. Geol. Survey Div., Michigan Department of Conservation, 86 pp.
_____, (compiler) Michigan’s oil and gas fields, Annual Statistical Summary for 1963, 1964, 1965, 1966, Mich. Geol. Survey Div., Michigan Department of Conservation.
_____, (1964), Michigan’s Silurian reefs enhance widespread areas, World Oil, October, pp. 155-158.
Evans, C. S. (1950), Underground Bunting in the Silurian of Southwestern Ontario, Geol. Assoc. Canada Proc, Vol. 3, pp. 55-85.
Fruechtenicht, H. L., (1960) Underground Gas Storage in Michigan, The Interstate Oil Compact Commission Committee Bulletin, Vol. 2, No. 1, pp. 40-45.
Heard, H. C, and Rubey, W. W. (1966), Tectonic implications of Gypsum Dehydration, Geol. Society of America Bull., Vol. 77, No. 7, pp. 741-760.
Howard, R. H. (1963), Wapella East Oil Pool, DeWitt County, Illinois — A Silurian Reef, Circular 349, Illinois State Geological Survey.
Ingels, J. J. C. (1963), Geometry, Paleontology, and Petrography of Thornton Reef Complex, Silurian of Northeastern Illinois, Bull. Amer. Assoc. Petrol. Geol., Vol. 47, No. 3, pp. 405-440, 16 figures, 1 table.
Ives, R. E., and Ells, G. D. (1956 through 1966), Developments in Michigan, Bull. Amer. Assoc. Petrol. Geol., Annual June issue on Oil and Gas Developments in U. S.
Landes, K. K. (1945), The Salina and Bass Islands Rocks in the Michigan Basin, U. S. Geol. Survey, Prelim. Map No. 40, Oil and Gas Inv. Ser.
Lowenstam, H. A. (1949), Niagaran Reefs in Illinois and their Relation to Oil Accumulation, Report of Investigations No. 145, Illinois State Geological Survey.
_____, (1950) Niagaran Reefs in the Great Lakes Area, The Journal of Geology, Vol. 58, pp. 430-87.
Melhorn, W. N. (1958), Stratigraphic Analysis of Silurian Rocks in Michigan Basin, Bull. Amer. Assoc. Petrol. Geol., Vol. 42, No. 4, pp. 816-838.
Report of Investigation 2 – Michigan’s Silurian Oil and Gas Pools – Page 27 of 28
Report of Investigation 2 – Michigan’s Silurian Oil and Gas Pools – Page 28 of 28
Newcombe, R. B. (1933), Oil and Gas Fields of Michigan, Mich. Geol. Survey Div., Pub. 38, Geol. Ser. 32, Michigan Department of Conservation, 293 pp.
Pinsak, A. P., and Shaver, R. H. (1964), The Silurian Formations of Northern Indiana, Geological Survey Bulletin 32, Indiana Department of Conservation.
Pounder, J. A. (1962), Guelph-Lockport Formation of Southwestern Ontario, Ontario Petroleum Institute, First Annual Conference.
Price, L. W., et al (Compilers), Summary of Operations Oil and Gas Fields (1962) and prior years, Mich. Geol. Survey Div., Michigan Department of Conservation.
Roliff, W. A. (1949), Salina-Guelph Fields in Southwestern Ontario, Bull. Amer. Assoc. Petrol. Geol., Vol. 33, No. 2, pp. 153-188.
Sanford, B. V. (1965), Salina Salt Beds - Southwestern Ontario, Paper 65-9, Geological Survey of Canada.
Scholten, R. (1959), Synchronous highs: preferential habitat of oil?, Bull. Amer. Assoc. Petrol. Geol., Vol. 43, No. 8, pp. 1793-1834.
Sharma, G. D. (1966), Geology of Peters Reef, St. Clair County, Michigan, Bull. Amer. Assoc. Petrol. Geol., Vol. 50, No. 2, pp. 327-350.
Shaver, R. H. (Chairman) (1961) Stratigraphy of the Silurian Rocks of Northern Indiana, Field Conference Guide Book No. 10, Geol. Survey, Indiana Department of Conservation, 62 pp.
Shelden, F. D. (1963), Transgressive Marginal Lithotopes in Niagaran (Silurian) of Northern Michigan Basin, Bull. Amer. Assoc. Petrol. Geol., Vol. 47, No. 1, pp. 129-149, 15 figures.
Silurian Rocks of the Michigan Basin (1962), Mich. Geol. Soc. Ann. Field Excurs., 96 pp., 36 figs., contains the following papers:
1. Alguire, S. L., Some Geologic and Economic Aspects of Niagaran Reefs in Eastern Michigan.
2. Briggs, L. I., Niagaran-Cayugan Sedimentation in the Michigan Basin.
3. Carozzi, A. V., Petrography of Wabash Reef, Wabash, Indiana.
4. Ehlers, G. M., and Kesling, R. V., Silurian Rocks of Michigan and Their Correlation.
5. Ells, Garland D., Silurian Rocks in the Subsurface of Southern Michigan.
6. Geyer, R. A., Uses and Abuses of Gravity Surveys in Reef Exploration.
7. Shaver, R. H., Silurian Rocks at the Southern Edge of the Michigan Basin in Indiana.
8. Willman, H. B., The Silurian Strata of Northeastern Illinois.
Soderman, J. W., and Carozzi, A. V. (1963), Petrography of algal bioberms in Burnt Bluff Group (Silurian) Wisconsin, Bull. Amer. Assoc. Petrol. Geol., Vol. 47, No. 9, pp. 1682-1708.
Stanton Jr., R. J. (1966), The Solution Brecciation Process, Geol. Society of America Bull., Vol. 77, No. 8, pp. 843-848.
Stratigraphy of Silurian rocks in Western Ohio (1963), Mich. Geol. Soc. Ann. Field Excurs., 71 pp., 13 figures, contains the following papers:
1. Forsyth, Jane L., A brief Summary of Ohio’s Pleistocene Glacial Story.
2. Hoover, Karl V., Brassfield Limestone.
3. Summerson, C. H., A resume’ of the Silurian Stratigraphy of Ohio.
4. Ulteig, J. R., Upper Niagaran and Cayugan Stratigraphy in the Subsurface of Northeastern Ohio.
Textoris, D. A., and Carozzi, A. V. (1966), Petrography of a Cayugan (Silurian) Stromatolite Mound and Associated, Fades, Ohio, Bull. Amer. Assoc. Petrol. Geol., Vol. 50, No. 7, pp. 1375-1388.
Trusheim, F. (1960), Mechanism of salt migration in Northern Germany, Bull. Amer. Assoc. Petrol. Geol., Vol. 44, No. 9, pp. 1519-1540.