20


PropIndex is now in its second year! We are delighted to bring toyou the fifth edition of PropIndex. Our previous anniversaryissue was very well received and we thank you for the generouscomments and feedback for this issue.
It has been our endeavour to add more information and betterdepth to every edition and we hope that such improvements helpto make PropIndex more relevant and enabled to capture markettrends. In this issue, we have added – (a) “Realty News”, whichare stories potential for impact on markets in the future (b) trendof “rankings of top localities” based on changing user demandand (c) improved Demand Analytics with City aggregates. Youwill continue to find our regular indices here – the National/CityProperty Index (NPI/CPI), Listed Price Monitor, Rent Monitor,Yield Monitor, Buyer Analytics and Capital Values.
As always, we hope this issue of PropIndex helps you tounderstand the market better and take an informed andintelligent real estate decision. We value the time spent byvarious banks/financial institutions, consultants, developersand policy makers to review the findings in the PropIndex. Wewelcome valuable suggestions from our readers to enrich thequality of our report. Do write in!
FOREWORD
Sudhir PaiBusiness Head, [email protected]

MagicBricksPropIndexMagicBricks.comPropIndex is a tool whichempowers propertyseekers and investors withdetailed information onthe movement ofresidential apartmentprices and supply ofproperties in India. Nocredible property indexcan be a function of directvalues as the changes aregoverned by multiplefactors.
MagicBricks.comPropIndex has taken thisreality into account andproduced an index basedon listing of apartmentsand their capital andrental values on thewebsite.
MagicBricks.com has over 400,000 active propertiesposted by more than1,00,000 active users in 300cities and 3,500 localities.Our users include owners,agents and developers.
MethodologyApartment values arebased on listings onMagicBricks.comPropIndex. These includemultistorey apartmentsand single units on plotteddevelopments, referred toas builder floors onMagicBricks.com.
The Index is structured in
such a way that individualproperties are aggregatedinto respective cities andthen to the National Index.Weightages for PropIndexare based on the supply ofproperties within thelocality/city. Based on thisstructure, PropIndex givesa realistic picture oftrends in price/supplyacross different propertymarkets in each city. Wehave used differentweightages for Listed PriceMonitor/Rent Monitor.Therefore, read as a whole,PropIndex along withtables provided for ListedPrice Monitor, RentMonitor, Yield Monitor andCapital Values, gives anexcellent perspective ofthe property marketperformance in thequarter.
While listing and itsvalues/supply provide alevel of understandinginto the market, there aremeticulous data checks toprevent aberrationscreeping into the Index.These are based onstatistical calculations,industry inputs and logicalinterpretations.
The National PropertyIndex (NPI) is indicative ofthe extent of activity aswell as price movementsacross cities and localitiesin the major cities activeon MagicBricks.com. Theindex includes the top 11
cities (these have beenchosen based on theiractivity levels) and has anindividual city report foreach of these cities. Whilethe NPI and its movementsare of interest to theexpert community ofbankers, builders andinvestors, the PropIndexhas also taken care toexplain the nuances ofindex movements at thelocality level that wouldhelp the huge base ofMagicBricks.comconsumers.
Insights into consumerdemand have beengathered through analysisof search information onthe site. This helpsunderstand the bestlocalities by demand, thetype and configuration ofunits as well as the budget-wise preferences.
The PropIndex is the resultof meticulous research atthe locality level andthrough detaileddiscussions with experts atMagicBricks.com’s offlineand online initiatives.
The Indian real estatemarket is dynamic and thePropIndex reflects thosechanges. Since it is derivedfrom a dynamic database,additions and deletions oflocalities happen as afunction of marketdynamics.
METHODOLOGY
There is a wealth of information within these pages. For better readability, we have presented some data as tablesand others as graphs. Between them, you will find how property markets have performed in the Apr-Jun 2012 quarter from many different perspectives – from that of capital appreciation, from a rental/yieldrealisation perspective and from the stand of supply of properties. Also understand what consumers want in theDemand Analysis section.
We recommend that you evaluate the city report in its entirety and that will provide a rounded perspective of theperformance of the property market within each city. Here are details of what you will find in each of the cityreports enclosed within -
1. City Property Index – This is a composite index which is a function of supply of properties as well as theaverage capital appreciation/drop in various localities of the city in the quarter. The city index is theweighted average of the average rate per square foot in that locality and the supply of properties from thatlocality. Premium localities (with higher average rate per square foot) as well as localities with higher supplyof properties will have a bigger impact on the Index. For example, if the supply of properties from apremium locality drops, that locality will end up having a lower weightage in the index which in turn willpush the Index downwards (and vice-versa). On the other hand, supply of properties remaining unchanged,the index will be influenced by capital appreciation within the locality.
2. Listed Price Monitor – From this issue, we have changed the name of “Price Monitor’’ to “Listed PriceMonitor’’ to reflect the metric more clearly – this metric reflects the movement of “listed prices”onMagicBricks.com over a period of time. This metric shows the capital appreciation/drop within a locality &is calculated on the basis of movement in the “average rate per square foot” within that locality. By andlarge, the movement in the “average rate per square foot” reflects capital appreciation/ drops. However, in afew select cases, we have observed that the average rate per square foot moves due to a change in the mix ofapartments within that locality (e.g. if the ratio of premium apartments, which command a higher persquare foot rate, changes over the quarter). In these few circumstances, the Listed Price Monitor will, inturn, reflect this input. Such changes have been explained in the text of the City Reports.
3. Rent Monitor – This reflects the rental appreciation/drop within a locality. It is calculated on the basis ofmovement in the “average rent per square foot” within that locality. By and large, the movement in the“average rent per square foot” reflects rental appreciation/drops. However, in a few selected cases, we haveobserved that the average rent per square foot moves due to a change in the mix of apartments within thatlocality (e.g. if the ratio of premium apartments, which command a higher per square foot rent, changes overthe quarter). In these few circumstances, the Rent Monitor will, in turn, reflect this input. Such changes havebeen explained in the text of the City Reports.
4. Yield Meter – Yield is the annual rate of return earned on property. The Yield Meter depicts the gross yieldpercentages across various localities. Gross yield is a ratio of average annual rental value to the averagecapital value of the property.
5. Capital Value Tables (given in Annexures) – This shows the actual range of prices within which propertieswere available in each locality in the quarter. Prices are shown in rupees per square foot basis; these are theprevailing rates for properties in each locality.
6. Demand Analysis –This analysis of consumer demand is based on searches and requirements that usershave performed on MagicBricks.com. The top localities by demand gives an insight into consumerpeferences. The demand data has been used to arrive at various aspects of consumer requirements includingBudget-wise analysis, Property type analysis and BHK configuration analysis.
7. Realty News – Property market performance is also dependent on drivers outside the purview of buyingand selling. There are broadly four key drivers that determine the prospects of real estate – infrastructuresuch as water and power, transport links creating new growth corridors, policy such as rental laws, propertytax, etc and return on investment. From this issue onwards, PropIndex focuses on news bytes that impactfuture prospects of real estate in the city.
GLOSSARY & DEFINITIONS

APR-JUN 2012
The National Property Index(NPI) went up by over 4 per cent inthe Apr-Jun 2012 quartercompared to Jan-Mar 2012 quarter.
The NPI is a weighted average ofsupply and prices across 11 citiesin India.
Out of 11 cities in the ApartmentIndex, nine have seen a rise. Thecities include Delhi, Gurgaon,Noida-Ghaziabad, Mumbai, Pune,Ahmedabad, Kolkata, Chennai,Hyderabad and Bangalore.Ahmedabad topped the City Indexchart by registering 10 per centincrease followed by Delhi,Kolkata and Noida with 6 per centincrease each. Ghaziabad, Puneand Mumbai witnessed 4-5 percent rise followed by Chennai andHyderabad (1-3 per cent).Bangalore showed stable indexvalues. Gurgaon witnessed a dropof 4 per cent in the Apr-Jun 2012quarter.
The NPI is a weighted average ofcity indices. Mumbai, Gurgaon,
Pune and Bangalore remained themajor contributors to the NPI.
The MagicBricks.com PropIndexis based on dynamic data minedfrom the portal to show the levelsof supply and the type of propertylisted in each locality. These arecleaned with complex algorithmsto remove outliers and arrive atthe index values at locality, cityand national levels. The Index isimpacted by the number and theaverage price of properties ineach locality and the locality’sweightage in the city.
This is based on its contributionto the city’s property databank.The listings on the website are byend users and market players andthe Index is based on a mix ofnewly developing and establishedlocalities.
New and old constructions alsoform part of the listings. Thecomposite index value of a citydraws from the changing indexvalues of different localities.Localities that were more activecompared to others can contribute
significantly to the index values ofthat city.
This Index is reflective of trendsacross multistorey and singlefloor apartments (commonlyknown as builder floors).
n National Property Index rose by 4 per cent.
n Affordable localities werefound to be more indemand in comparison topremium areas acrossdifferent cities.
n Increasing demand for 1 BHK units registeredacross multiple cities.
n Metro connectivitycontributed to increase inproperty rates across cities.
IN THIS REPORT:
National Property Index...............1
Delhi.........................................4
Gurgaon....................................9
Noida & Ghaziabad................... 15
Mumbai....................................23
Pune........................................29
Ahmedabad..............................34
Kolkata...........,........................ 39
Chennai....................................44
Hyderabad................................50
Bangalore.................................56Annexures.................................65
NATIONAL PROPERTY INDEX (NPI)
VOL 2, ISSUE 1; APR-JUN, FY 2012-13
APR-JUN 2012

2VOL2, ISSUE 1; APR-JUN, FY 2012-13
NATIONAL PROPERTY INDEX
There are certain commonthreads across cities:
l Affordable localities saw abetter rise in values ascompared to premium localitiesin cities such as Mumbai,Ahmadabad, Pune and Kolkata.
l Areas that witnessed good roadinfrastructure, Metroconnectivity and betterfacilities saw a rise in values.
l Increased values wereregistered across IT-drivenlocalities in cities such asBangalore, Pune, Kolkata andChennai for both outrightpurchase and lease.
l Even though the demand fortraditional unit-size propertiesin the 2 and 3BHK categoriesremained stable across thecities, a growing consumerpreference towards smaller 1BHK units was recordedacross cities such asAhmedabad, Bangalore,Chennai, Pune, Mumbai andHyderabad. Supply of larger3BHK units outstrippeddemand across these cities.
l Multistorey apartmentsremained the most sought-afterproperty type across the cities.Demand for larger unit-sizeproperties was mainly
witnessed in premium localities.
l Cities continued to witnessgood demand for properties inand around commercialcenters, for outright purchaseas well as rentals.
During Apr-Jun 2012 quarter, theAhmedabad Index shot up by 10per cent, the maximum among allthe cities. There has been anoverall rise in quoted values while
the transactional values ofmultistorey apartments in thecity remained stable.
The Bangalore Index valueremained same as the Jan-Mar2012 quarter, which was 112. Thetrend in the Bangalore realtymarket this quarter tilted towardsareas offering affordable propertyoptions, while the premiumlocalities or areas having morepremium residential options saw

3VOL2, ISSUE 1; APR-JUN, FY 2012-13
a dip. A dip in capital values wasrecorded in certain localities suchas Sarjapur Road, Electronic Cityand Hebbal, largely becauseaffordable peripheries of premiumlocalities registered a surge inlisting, which prevented the cityindex from any rise.
The Chennai Index rose by 3 percent. More than 60 per cent of thelocalities witnessed marginal risein average capital values, whichexplains the slight increase in thecity index. The absence of overtspeculation has also ensured thatthe developer has moved pricing ofhomes in a stable and gradualmanner.
The Delhi Index rose by 6 per cent.Unlike the previous quarter, therise in values this quarter has onlybeen restricted to certain pockets.The upward trend was attributedto certain localities such asVasundhara Enclave, Uttam Nagar,Chittaranjan Park, Sarita Viharand Mehrauli. An improvement inthe job market is expected to bringback the real estate market inDelhi to the earlier levels ofgrowth.
The Ghaziabad Index rose by 5 per cent. Localities such asCrossings Republik and Bhopurasaw a significant rise in capitalvalues which pushed the cityindex upwards. While CrossingsRepublik registered growing buyerinterest due to the land acquisitionrow in Noida Extension, Bhopuraattracted investors with limitedbudget, owing to the affordableprices and the expected entry ofthe Metro in the area.
The Gurgaon Index witnessed adip in values, registering a fall of 4 per cent in the Apr-Jun 2012quarter. Even though the capitalvalues for multistorey apartmentswitnessed a hike in over 90 percent localities, a decrease in thenumber of active listings incertain localities has tilted the cityindex negatively.
The Hyderabad Index value roseby 1 per cent. Various localitieswitnessed falling average capital
values owing to the prevailingwater problems. The majorcontributors to the slight increasein the city index were Kukatpallyand Madhapur, which scored onthe proximity to IT hubs andaffordable prices.
The Kolkata Index value rose by 6 per cent. Almost all the localitiesrecorded a hike in the averagecapital values in Apr-Jun 2012quarter, which impacted the cityindex positively. This is mainlyowing to increased Metroconnectivity. In certain localitiesMetro work is still in progress, butit has already escalated values.
The Noida Index value was up by 6 per cent in the Apr-Jun 2012quarter. Metro connectivity,planned expansion through well-developed infrastructure, presenceof multinationals and competitiveprices compared to Delhi drove asteady demand for all types ofresidential formats in Noida.Sectors 45, 76, 78 and 93 in Noidaand some pockets on the GreaterNoida Expressway (Sectors 137 and93A) saw a significant increase of9-13 per cent in capital values ofmultistorey apartments, positivelyimpacting the city index.
The Pune Index value rose by 4 per cent. There was consistentgrowth in the average capitalvalues across the city. Localitiessuch as Wagholi in the East andBalewadi in the West saw themaximum increase in capitalvalues. Improved infrastructureand a number of new projectsimpacted values positively.
The Mumbai Index rose by 5 percent. Overall increase in capitalvalues in more than 90 per cent ofthe localities pushed the capitalindex upwards. Localities acrossWestern suburbs such asGoregaon East and West, Andheri,Mira Road in the north, and Virarin Thane saw a steady rise invalues. Affordable residentialoptions saw many takers whichpushed the average capital valuesin Mira Road and Virar.
TOP YIELD GROSSERS
Rental yield is a factor of the changes inrental values locality-wise vis-à-vis thechanges in capital values. Given beloware the top yield-grossing localities ineach city
Locality Gross yield
Bangalore, Electronic City 6.30%
Kolkata, EM Bypass 5.30%
Chennai, OMR 4.88%
Hyderabad, Miyapur 4.32%
Ahmedabad, SG Highway 4.07%
Gurgaon, Sushant Lok-I 3.58%
Mumbai, Bandra East 3.46%
Pune, Wanowrie 3.33%
Ghaziabad, Indirapuram 3.13%
Noida, Sector-62 3.03%
Delhi, Vasundhara Enclave 2.36%
CAPITAL GAINS
The table given below indicates maximum increase in capital values in each city
Locality % Change
Kolkata, EM Bypass 16%
Pune, Wagholi 15%
Gurgaon, Dwarka Expressway 14%
Ghaziabad, Crossings Republik 13%
Mumbai, Bandra West 12%
Bangalore, Airport Road 11%
Hyderabad, Madhapur 11%
Noida, Sector-78 11%
Delhi, Uttam Nagar 10%
Ahmedabad, Bodakdev 6%
Chennai, Velacheri 4%
CHENNAI 44VOL2, ISSUE 1; APR-JUN, FY 2012-13
CITY PROPERTY INDEX
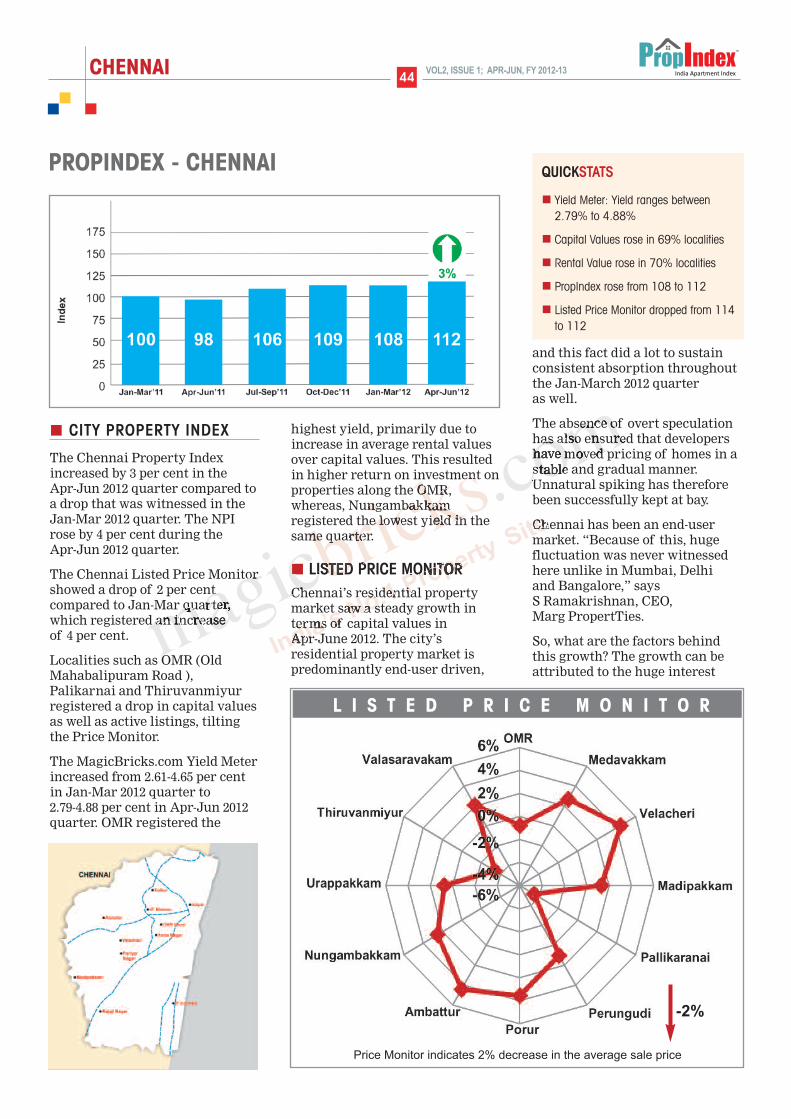
The Chennai Property Indexincreased by 3 per cent in the Apr-Jun 2012 quarter compared toa drop that was witnessed in theJan-Mar 2012 quarter. The NPIrose by 4 per cent during the Apr-Jun 2012 quarter.
The Chennai Listed Price Monitorshowed a drop of 2 per centcompared to Jan-Mar quarter,which registered an increase of 4 per cent.
Localities such as OMR (OldMahabalipuram Road ),Palikarnai and Thiruvanmiyurregistered a drop in capital valuesas well as active listings, tiltingthe Price Monitor.
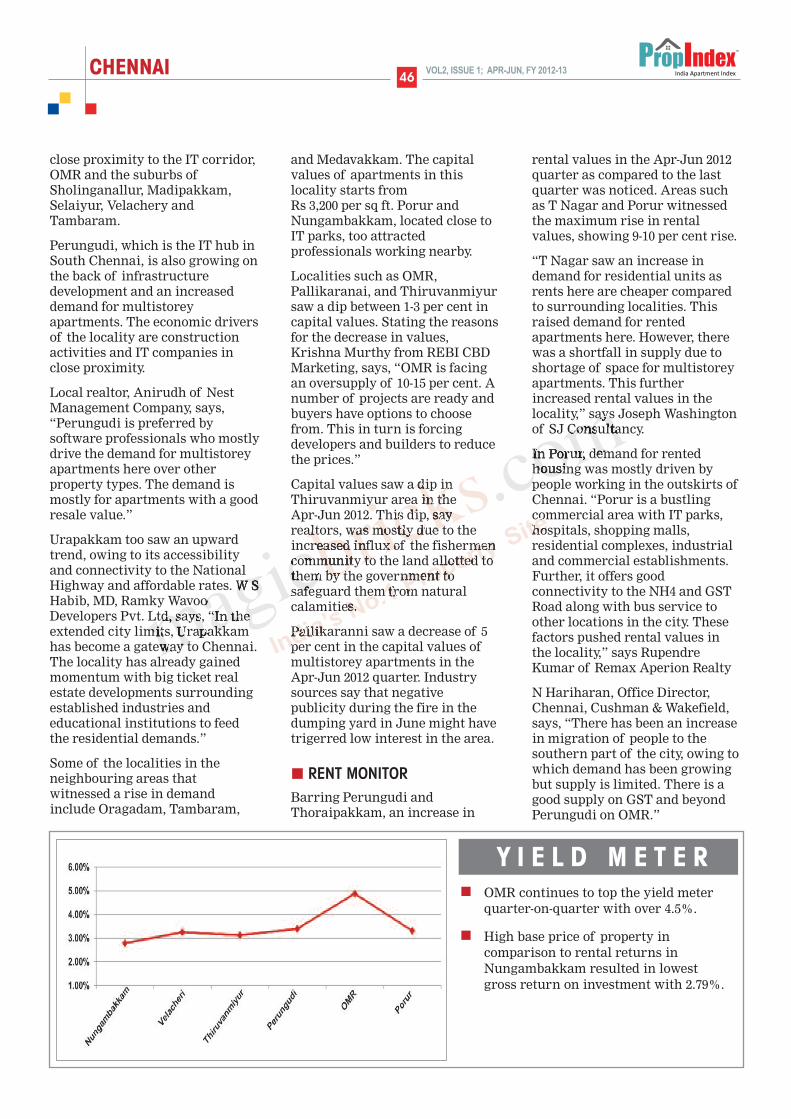
The MagicBricks.com Yield Meterincreased from 2.61-4.65 per centin Jan-Mar 2012 quarter to 2.79-4.88 per cent in Apr-Jun 2012quarter. OMR registered the
highest yield, primarily due toincrease in average rental valuesover capital values. This resultedin higher return on investment onproperties along the OMR,whereas, Nungambakkamregistered the lowest yield in thesame quarter.
LISTED PRICE MONITORChennai’s residential propertymarket saw a steady growth interms of capital values in Apr-June 2012. The city’sresidential property market ispredominantly end-user driven,
and this fact did a lot to sustainconsistent absorption throughoutthe Jan-March 2012 quarter as well.
The absence of overt speculationhas also ensured that developershave moved pricing of homes in astable and gradual manner.Unnatural spiking has thereforebeen successfully kept at bay.
Chennai has been an end-usermarket. “Because of this, hugefluctuation was never witnessedhere unlike in Mumbai, Delhi and Bangalore,” says S Ramakrishnan, CEO, Marg PropertTies.
So, what are the factors behindthis growth? The growth can beattributed to the huge interest
-2%
Price Monitor indicates 2% decrease in the average sale price
L I S T E D P R I C E M O N I T O R
PROPINDEX - CHENNAI QUICKSTATS
n Yield Meter: Yield ranges between2.79% to 4.88%
n Capital Values rose in 69% localities
n Rental Value rose in 70% localities
n PropIndex rose from 108 to 112
n Listed Price Monitor dropped from 114to 112
CHENNAI45VOL2, ISSUE 1; APR-JUN, FY 2012-13
from end users, launch of newprojects and rise in infrastructureactivities around peripherallocations. It was noticed that thegrowth was concentrated aroundareas which saw majormanufacturing and ITdevelopment. Localities in South and Central Chennai havelargely contributed to this growthin the city.
The localities in South Chennaisuch as Medavakkam, Velacheri,Madipakkam, Perungudi,Ambattur, Nungambakkam,Urappakkam and Valasaravakamwitnessed a rise of 1-5 per cent incapital values in the Apr-June2012 quarter. These areas enjoythe advantage of goodconnectivity through GrandSouthern Trunk (GST) Road,access to IT companies andproximity to OMR. Localitiesfrom Central and North Chennaisuch as Porur and Ambattur alsosaw appreciation in valuesbetween 1-5 per cent.
Local realtor Sudha of Realty Softsays, "Madipakkam is the bestplace for real estate investors for
the future. Prices have increasedin this locality."With the MRTSExtension, the growth inMadipakkam is expected to gohigher. Buyers or investors whopurchase apartments here canalso enjoy facilities likesupermarts, temples, schools,hospitals and entertainmentcentres – all within the area.
Looking at Velachery, the localityhas undergone a sea change in thelast few years. It has seen a rise of4 per cent in capital values ofmultistorey apartments in theApr-June quarter, against the riseof 1 per cent in the previousquarter. The locality hasdeveloped into a residential hubtoday, with the availability ofgood schools, malls andentertainment hubs in theneighbourhood. Provision ofbasic facilities such as drinkingwater and power make it afavourable residential hub. One ofthe main reasons why Velacheryis witnessing a huge facelift ascompared to other older localities,is its proximity to the OMR.
Another reason for the
development in the area is itshuge contribution to the ITindustry. The major chunk of ITemployees from thisneighbourhood. Their exposure tomodern developments abroad anddemand for quality residentialspace has pushed up the realestate development in this area.“Velachery is well-connectedthrough MRTS, bus, rail, metroand other private transport and isaccessible from different parts of the city and suburbs,” saysAbhijith Kumar of the Utsav Group.
“Velachery sees transactions fromyoung IT professionals fromneighbouring areas as well asfrom the NRI and HNI market,ensuring a balanced demand inboth affordable and premiumhousing categories,” informsKishore Sen, KonnectConstructions. The currentcapital values of apartments herevary from Rs 5,400-6,750 per sq ftdepending upon location andfacilities.
“With the opening of thePallavaram Highway, which leadsto the International Airport atMeenambakkam, Velachery hasbecome the new gateway to SouthChennai and is fast emerging asone of the most sought-afterhotspots of the city,” says G Ramanarayanan, a real estateconsultant in the locality.
Medavakkam saw 3 per cent risein capital values due to itslocation. Medavakkam, is fastdeveloping into a residential spotdue to its good connectivity and
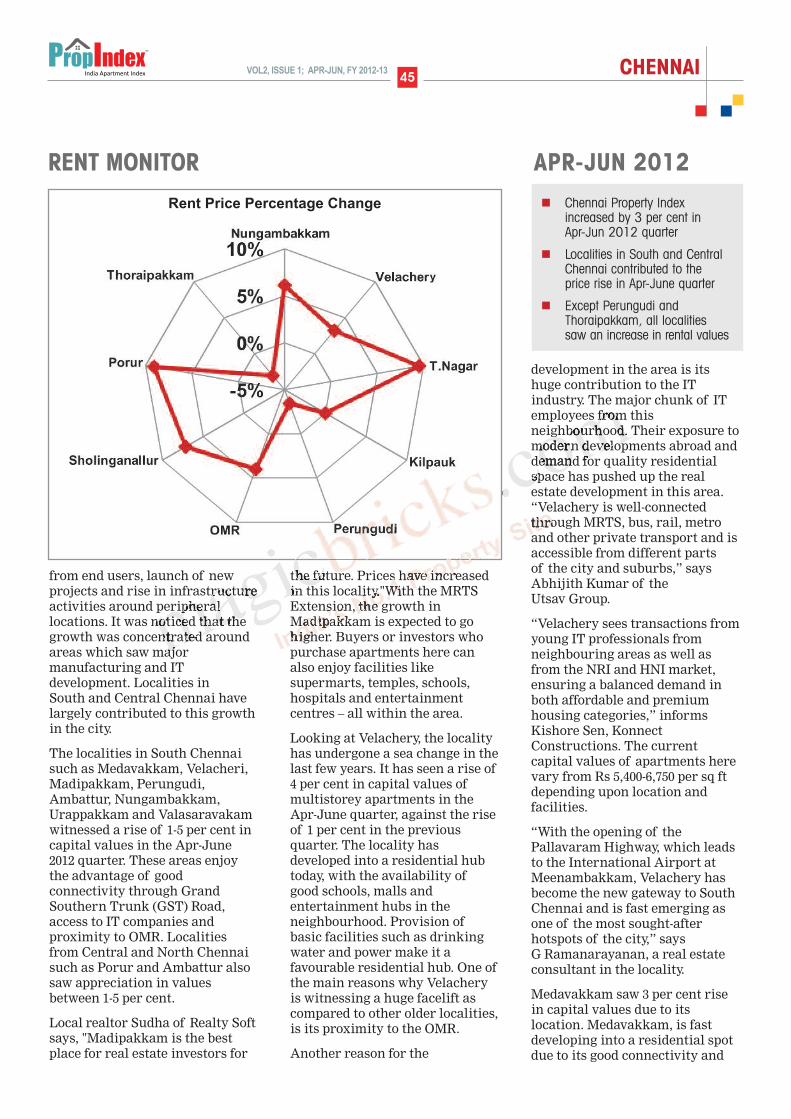
RENT MONITOR
Rent Price Percentage Change
APR-JUN 2012
n Chennai Property Indexincreased by 3 per cent in Apr-Jun 2012 quarter
n Localities in South and CentralChennai contributed to theprice rise in Apr-June quarter
n Except Perungudi andThoraipakkam, all localitiessaw an increase in rental values
close proximity to the IT corridor,OMR and the suburbs ofSholinganallur, Madipakkam,Selaiyur, Velachery andTambaram.
Perungudi, which is the IT hub inSouth Chennai, is also growing onthe back of infrastructuredevelopment and an increaseddemand for multistoreyapartments. The economic driversof the locality are constructionactivities and IT companies inclose proximity.
Local realtor, Anirudh of NestManagement Company, says,“Perungudi is preferred bysoftware professionals who mostlydrive the demand for multistoreyapartments here over otherproperty types. The demand ismostly for apartments with a goodresale value.”
Urapakkam too saw an upwardtrend, owing to its accessibilityand connectivity to the NationalHighway and affordable rates. W SHabib, MD, Ramky WavooDevelopers Pvt. Ltd, says, “In theextended city limits, Urapakkamhas become a gateway to Chennai.The locality has already gainedmomentum with big ticket realestate developments surroundingestablished industries andeducational institutions to feedthe residential demands.”
Some of the localities in theneighbouring areas thatwitnessed a rise in demandinclude Oragadam, Tambaram,
and Medavakkam. The capitalvalues of apartments in thislocality starts from Rs 3,200 per sq ft. Porur andNungambakkam, located close toIT parks, too attractedprofessionals working nearby.
Localities such as OMR,Pallikaranai, and Thiruvanmiyursaw a dip between 1-3 per cent incapital values. Stating the reasonsfor the decrease in values,Krishna Murthy from REBI CBDMarketing, says, “OMR is facingan oversupply of 10-15 per cent. Anumber of projects are ready andbuyers have options to choosefrom. This in turn is forcingdevelopers and builders to reducethe prices.”
Capital values saw a dip inThiruvanmiyur area in the Apr-Jun 2012. This dip, sayrealtors, was mostly due to theincreased influx of the fishermencommunity to the land allotted tothem by the government tosafeguard them from naturalcalamities.
Pallikaranni saw a decrease of 5per cent in the capital values ofmultistorey apartments in theApr-Jun 2012 quarter. Industrysources say that negativepublicity during the fire in thedumping yard in June might havetrigerred low interest in the area.
RENT MONITORBarring Perungudi andThoraipakkam, an increase in
rental values in the Apr-Jun 2012quarter as compared to the lastquarter was noticed. Areas suchas T Nagar and Porur witnessedthe maximum rise in rentalvalues, showing 9-10 per cent rise.
“T Nagar saw an increase indemand for residential units asrents here are cheaper comparedto surrounding localities. Thisraised demand for rentedapartments here. However, therewas a shortfall in supply due toshortage of space for multistoreyapartments. This furtherincreased rental values in thelocality,” says Joseph Washingtonof SJ Consultancy.
In Porur, demand for rentedhousing was mostly driven bypeople working in the outskirts ofChennai. “Porur is a bustlingcommercial area with IT parks,hospitals, shopping malls,residential complexes, industrialand commercial establishments.Further, it offers goodconnectivity to the NH4 and GSTRoad along with bus service toother locations in the city. Thesefactors pushed rental values inthe locality,” says RupendreKumar of Remax Aperion Realty
N Hariharan, Office Director,Chennai, Cushman & Wakefield,says, “There has been an increasein migration of people to thesouthern part of the city, owing towhich demand has been growingbut supply is limited. There is agood supply on GST and beyondPerungudi on OMR.”
CHENNAI 46VOL2, ISSUE 1; APR-JUN, FY 2012-13
Y I E L D M E T E Rn OMR continues to top the yield meter
quarter-on-quarter with over 4.5%.
n High base price of property incomparison to rental returns inNungambakkam resulted in lowestgross return on investment with 2.79%.

CHENNAI47VOL2, ISSUE 1; APR-JUN, FY 2012-13
The availability of services andinfrastructure in the citycontributes to the constant rise inrental rates in the city. Suburbanareas such as OMR, GST Road,and Oragadam have witnessed arise in rental rates over the years owing to the booming ITand manufacturing industries in the area. Rising income levelsis another factor that lends to theincrease in rental rates.
“Development of suburbs and therising income levels of the middleclass have led to an increase inrental rates of most localities inthe city. People are willing tospend more as long as the localityis safe and has a range ofamenities. The average rentvaries based on many factors suchas land prices and electricityrates,” says Kumar of RemaxAperion Realty
According to the data onMagicBricks.com, the rents inSholinganallur during Apr-Jun
2012 quarter ranged between Rs 7-51 per sq ft, per month.Sholinganallur, an IT corridor inthe South of Chennai, saw a riseof 7 per cent in rents. An increasein demand from the IT sectorfuelled rental demand in thislocality.
Sholinganallur offers goodconnectivity to ECR on theEastern side and Velachery MainRoad on the Western side. It alsohosts reputed educationalinstitutions and hospitals, supermarkets, cinema complexes,restaurants and malls.
In Velachery, the rental valuesincreased by 3 per cent in the Apr-Jun quarter. This can beattributed to enhanced demandfor rental housing and improvedoffice leasing, which has openednumerous employmentopportunities in and around the city.
Areas such as Perungudi and
Thoraipakkam witnessed adecrease in rental values ofmultistorey apartments in thequarter. “Both these localities arein industrial regions. Industrialpollution has led to the decreasein the rental values in theselocalities,” says Partha Sarthy ofSai Placements.
Vandalur-Kelambakkam Road sees major developmentThe 18-km stretch from the IT corridor in Kelambakkam to theGrand Southern Trunk (GST) road junction at Vandalur isbristling with activity. Over 15 developers have ongoingresidential projects on either side of the Vandalur-Kelambakkamroad. These range from affordable housing, plotted development,luxury apartments to villas. The presence of Chettinad Hospital,VIT University and engineering colleges have pushed the demandfor housing and nudged others to shift to suburbs. Aerens GoldSouk is under construction near Vandalur on GST road. The roadwidening work on GST road is long overdue and will go a longway in improving housing development in and around the area.
n Times of India, Chennai
ORR project to fuel growth in Maraimalainagar The Chennai Outer Ring Road (ORR)•project, a 30 km-long six-lane road connecting Vandalur with Nemilicheri underconstruction is expected to fuel more growth in Maraimalainagar,a suburb located 40 km away from Chennai. The suburb has beenon the development radar for quite sometime now, both in termsof residential and industrial growth. The setting up of MahindraWorld City, Infosys and the Ford manufacturing planthas pushedMaraimalainagar as a realty destination. The area is well-connected by rail networks and by roads (Trichy-M a d u r a i-K anya k u m a r i Highway).
n The Times of India, Chennai
Hike in guideline values hit housing sector At a time when land values started stabilizing in and aroundChennai, the Tamil Nadu government has increased the guidelinevalues for land registration purposes by hiking the values from 60per cent to 300 per cent. According to official sources, though therevenue for the two month period (April and May) was up by Rs100 crore, the volume of transaction has come down drastically.Industry sources say that city area transactions fell through dueto reluctance on the part of buyers to absorb the hike in stampduty. In vibrant commercial areas like Whites road, the guidelinevalue soared to Rs 16,000 above the market value, say propertyconsultants. The worst hit in the current scenario is theaffordable housing segment.
n The Times of India, Chennai
Water crisis hits Alandur residentsPeople in many city areas are complaining of an acute watershortage. Residents of NSK Road near Vanuvampet in Alandursaid the extended summer has resulted in many bore wells in thearea going dry, while the absence of a Metro water pipeline hascompounded the problem. Recently two water tanks wereprovided for the residents on NSK Road as a temporary relief.Areas in Pazhavanthangal, Nanganallur and Thalakanancheriwere also facing a severe water shortage.
n The Times of India, Chennai
R E A L T Y N E W S
To read full story and more news go to www.content.magicbricks.com
Locality RankQ1 Q4
Velachery 1 1
Adyar 2 3
OMR 3 2
Medavakkam 4 5
Porur 5 10
Thiruvanmiyur 6 4
Madipakkam 7 9
Tambaram 8 -
Mylapore 9 7
Anna Nagar 10 6
Top ten localities - Chennai
Note: Q1 Apr-Jun 2012, Q4 Jan-Mar 2012
Infrastructure and commercial activities in areas such as Valandur-Kelambakkam and ORR is expected to impact property markets. Policy issues include steep increase in guideline values and lack of piped water supply in Alandur areas which can directly impact real estate development
New
New

CHENNAI 48VOL2, ISSUE 1; APR-JUN, FY 2012-13
Budget Wise AnalysisDuring the Apr-Jun 2012 quarter,70 per cent of the buyer interestwas generated by property worthup to Rs 60 lakh. According toMagicBricks.com data, thedemand diminished for propertyworth above Rs 1 crore, eventhough the supply remainedrelatively high.
The Western regions witnessedmaximum demand for apartmentsbelow the Rs 30 lakh mark, whileall other zones recorded the highest demand for units in the Rs
30-60 lakh bracket. Supplyoutstripped demand for unitsbelow the Rs 30 lakh mark in all the zones, except the Centralzone. Availability remained lowcompared to demand across the city for units in the Rs 30-60lakh bracket.
Moderate demand was observedfor units in the Rs 60-100 lakhbracket. The supply marginallyexceeded demand in the Centraland Northern zones, while it fellshort by 2 per cent in the South and the West.
A good demand and supply ratiowas observed in the Rs 1-2 crorebracket with adequate availabilityacross zones.
Supply of property worth aboveRs 2 crore was found to be doublethe existing demand in theCentral localities. All the otherzones exhibited low demand andsupply ratios for the same.
Property Type AnalysisThe city witnessed a maximumdemand for multistoreyapartments during the April-June2012 quarter. A healthy userinterest was also visible forresidential houses and plots with26 and 20 per cent demandrespectively.
An oversupply was observed forbuilder floor units, wherein thesupply was found to be thrice thedemand. Overall, there was ashortfall in demand of residentialplots owing to an increase in theguideline values since April 2012.
The increased guideline valueshave pushed the transaction costof residential plots by more than200 per cent. The buyers have thusdisplayed a reduced interest inthese plots in the last few months,leading to an oversupply in thezone.
High demand for multistoreyapartments was recorded across
Property wise Analysis - South Chennai
60
50
40
30
20
10
0
7
23
47
41
25
1922
17
Demand%
Supply%
Fig
ures
in p
erce
ntag
e(%
)
Single Multistorey Residential Residentialfloor House Plot
Budget wise Analysis - Central Chennai
70
60
50
40
30
20
10
0<30 30-60 60-100 100-200 200 &
above
10
Figures in lakh
9
44
32
2326
15 16
8
17
Demand%
Supply%
Fig
ures
in p
erce
ntag
e(%
)
Budget wise Analysis - South Chennai
70
60
50
40
30
20
10
0<30 30-60 60-100 100-200 200 &
above
20
Figures in lakh
27
55
45
17 15
79
4 5
Demand%
Supply%
Fig
ures
in p
erce
ntag
e(%
)
Budget wise Analysis - West Chennai
70
60
50
40
30
20
10
0<30 30-60 60-100 100-200 200 &
above
46
Figures in lakh
64
39
26
10 8
3 2 2 1
Demand%
Supply%
Fig
ures
in p
erce
ntag
e(%
)
B U Y E R D E M A N D A N A LY S I S
Budget wise Analysis - North Chennai
70
60
50
40
30
20
10
0<30 30-60 60-100 100-200 200 &
above
24
Figures in lakh
31
49
37
14 15
8 84
8
Demand%
Supply%
Fig
ures
in p
erce
ntag
e(%
)
70
60
50
40
30
20
10
0<30 30-60 60-100 100-200 200 &
above
20
Fig
ures
in p
erce
ntag
e(%
)
Figures in lakh
31
50
39
17 159 9
4 7
Demand%
Supply%
100
80
60
40
20
0
7
21
47
38
26
1620
25
Demand%
Supply%
Fig
ures
in p
e rc e
n ta g
e (%
)Single Multistorey Residential Residentialfloor House Plot
New
Budget wise Analysis - City Level
New
Property wise Analysis - City Level

CHENNAI49VOL2, ISSUE 1; APR-JUN, FY 2012-13
various zones while supply fellshort by 3-6 per cent throughoutthe city. The maximum userinterest for residential houses wasgenerated from the Northern
localities followed by the South.However, drastic disparitybetween demand and supply ratiowas registered across all theregions for these units withsupply falling short by largemargins.
An oversupply of residential plotswas witnessed in the Westernregion with supply overshootingdemand by 20 per cent. In all the
other zones, the supply of theseunits fell short by 2-5 per cent.This is owing to a high demandfor multistorey apartments ingated societies with all basicfacilities, especially water andpower backups.
The supply for builder floor unitsexceeded the demand in all thezones with the maximum supplyflowing in from the Central areasfollowed by the North.
BHK Configuration AnalysisMore than 80 per cent of buyersshowed an inclination towards 1 and 2BHK units in the city.
While supply fell short by almost20 per cent for 1BHK apartments,the demand was being adequatelymet for 2BHK units with ashortage of only 3 per cent. Alimited demand was observed forlarger residential units.
However, the supply in thissegment was found to be morethan twice the existing demand.
The maximum user interest wasobserved for 2BHK units withuniform buyer demand acrossvarious zones in the city. Auniform demand of 22-25 per centwas also registered for 1BHKunits across the city.
However, supply fell short by largemargins in all the zones, with adeficit of 16-19 per cent across thezones.
Supply exceeded demand for3BHK units across the city withthe maximum supply flowing infrom the Central and Southernparts of the city. Negligibledemand and supply ratio wasnoted for 4 BHK units. Anoversupply was recorded in thissegment as well.
BHK Configuration - Central Chennai
Figures in percentage (%)
Demand%
Supply%
4 BHK
3 BHK
2 BHK
1 BHK
0 10 20 30 40 50 60 70
<1
5
1737
5854
254
BHK Configuration - South Chennai
Figures in percentage (%)
Demand%
Supply%
4 BHK
3 BHK
2 BHK
1 BHK
0 10 20 30 40 50 60 70
<13
17
37
59
55
245
BHK Configuration - West Chennai
Figures in percentage (%)
Demand%
Supply%
3 BHK
2 BHK
1 BHK
0 10 20 30 40 50 60 70 80
1933
5964
223
Property wise Analysis - Central Chennai
60
50
40
30
20
10
0
7
30
56
50
27
1510
5
Demand%
Supply%
Fig
ures
in p
erce
ntag
e(%
)
Single Multistorey Residential Residentialfloor House Plot
Property wise Analysis - West Chennai
70
60
50
40
30
20
10
0
58
3128
22
2
42
62Demand%
Supply%
Fig
ures
in p
erce
ntag
e(%
)
Single Multistorey Residential Residentialfloor House Plot
60
50
40
30
20
10
0
6
25
41
3531
20 22 20
Demand%
Supply%
Fig
ures
in p
erce
ntag
e(%
)
Single Multistorey Residential Residentialfloor House Plot
Property wise Analysis - North Chennai
Figures in percentage (%)
Demand%
Supply%
4 BHK
3 BHK
2 BHK
1 BHK0 10 20 30 40 50 60 70
<13
1736
5956
245
BHK Configuration - North Chennai
Figures in percentage (%)
Demand%
Supply%
4 BHK
3 BHK
2 BHK
1 BHK
0 10 20 30 40 50 60 70
02
1630
6162
226
New
BHK Configuration - City Level

annexuRes

Adyar 7700 to 10450
Alwarpet 16450 to 20800
Ambattur 3300 to 3950
Anna Nagar 7300 to 9350
Anna Nagar West 7550 to 10450
Avadi 2700 to 3050
Besant Nagar 10650 to 13150
Chembarambakkam 3300 to 3650
Choolaimedu 5300 to 7000
Chromepet 3050 to 3700
Chromepet East 3500 to 4350
Gerugambakkam 3750 to 3900
GST Road 3000 to 3650
Guduvancheri 2650 to 3050
Iyyappanthangal 3500 to 4000
Kalavakkam 3250 to 3900
Kelambakkam 2750 to 3250
Kilpauk 8900 to 11350
Kodambakkam 6650 to 8250
Kolathur 2900 to 3950
Kovur 3400 to 3650
Madhavaram 3750 to 4150
Madipakkam 3700 to 4300
Manapakkam 5450 to 6600
Mangadu 3300 to 3750
Medavakkam 3700 to 4100
Mogapper 4200 to 5450
Mogapper West 4300 to 5700
Nanmangalam 3300 to 3900
Navalur 3650 to 3950
Nolambur 5250 to 5950
Nungambakkam 10250 to 12900
Old Mahabalipuram Road 3100 to 3850
Oragadam 2600 to 3150
Padappai 2850 to 3200
Padur 3500 to 4050
Pallavaram 3450 to 3950
Pallikaranai 3500 to 4000
Perambur 4900 to 6150
Perumbakkam 2950 to 3500
Perungalathur 3700 to 4050
Perungudi 4500 to 5750
Poonamallee 3350 to 4600
Porur 4000 to 5000
R.A Puram 18350 to 23550
Ramapuram 4900 to 5300
Saligramam 5450 to 6750
Selaiyur 3950 to 4800
Sholinganallur 3900 to 4750
Singuperumal Koil 2550 to 2900
Siruseri 3300 to 4050
Sriperumbudur 2450 to 2950
Sunkuvarchatram 2700 to 2750
T.Nagar 8000 to 10350
Tambaram 3200 to 3650
Tambaram East 3300 to 3950
Tambaram West 3100 to 4000
Thirumullaivayal 3250 to 3650
Thiruvanmiyur 7600 to 9950
Thoraipakkam 4450 to 5450
Tirupurur 2550 to 3050
Tiruverkadu 3650 to 3950
Urappakkam 3150 to 4000
Vadapalani 6850 to 9150
Valasaravakkam 4700 to 5350
Vanagaram 3800 to 5000
Vandalur 3900 to 4450
Velachery 5400 to 6750
Villivakkam 4500 to 4950
Virugambakkam 5750 to 7050
CHENNAI73VOL2, ISSUE 1; APR-JUN, FY 2012-13
CAPITAL VALUES – LOCALITY WISE
Average Residential Apartment Prices
Locality Capital Values (Rs/Sq feet)
Locality Capital Values (Rs/Sq feet)
CHENNAI


VOL2, ISSUE 1; APR-JUN, FY 2012-13
D I S C L A I M E REvery effort has been made to make this Index as complete and as accurate as possible. MagicBricksaccepts no responsibility for inaccuracies in the information/data contained in this book. It shall haveneither liability nor responsibility to any person or entity with respect to any loss or damage caused, oralleged to have been caused, directly or indirectly, by the information contained in this book. Theinformation/data in this book is subject to change from time to time due to market condition.
CONTACT US
l Post your feedback to -
propindex @timesgroup.com
l Join our discussion forum at -
openhouse.magicbricks.com
l For business enquiries -
PROPINDEX TEAM
l Content & Research: e Jayashree Kurup, Dipti
Tandon, Indrani Rajkhowa Banerjee, Rishab
Jain, neha nagpal, neha Pathania Kashyap,
sruthi Kailas, Puneet Kukreja & Bikash Kumar
l Layout Design: Harsha Khattar
l Cover Page Design: Raghav Krishnan & Rahul
nair
l Marketing: Gayatri Prasad & Bhawna Mongia
l Operations Management: Girish Bindal


