UNITED STATES SECURITIES AND EXCHANGE COMMISSION WASHINGTON, D.C. 20549 FORM 10-K ANNUAL REPORT PURSUANT TO SECTION 13 OR 15(d) OF THE SECURITIES EXCHANGE ACT OF 1934 For the fiscal year ended: September 30, 2015 Commission File No. 1-07939 VICON INDUSTRIES, INC. (Exact name of registrant as specified in its charter) NEW YORK 11-2160665 (State or other jurisdiction of incorporation or organization) (I.R.S. Employer identification No.) 135 Fell Court, Hauppauge, New York 11788 (Address of principal executive offices) (Zip Code) Registrant's telephone number, including area code: (631) 952-2288 Securities registered pursuant to Section 12(b) of the Act: Common Stock, Par Value $.01 NYSE MKT (Title of class) (Name of each exchange on which registered) Securities registered pursuant to Section 12(g) of the Act: None Indicate by check mark if the registrant is a well-known seasoned issuer, as defined in Rule 405 of the Securities Act. Yes No Indicate by check mark if the registrant is not required to file reports pursuant to Section 13 or Section 15(d) of the Act. Yes No Indicate by check mark whether the registrant (1) has filed all reports required to be filed by Section 13 or 15(d) of the Securities Exchange Act of 1934 during the preceding 12 months (or for such shorter period that the registrant was required to file such reports), and (2) has been subject to such filing requirements for the past 90 days. Yes No Indicate by check mark whether the registrant has submitted electronically and posted on its corporate Web site, if any, every Interactive Data File required to be submitted and posted pursuant to Rule 405 of Regulation S-T (§232.405 of this chapter) during the preceding 12 months (or for such shorter period that the registrant was required to submit and post such files.) Yes No Indicate by check mark if disclosure of delinquent filers pursuant to Item 405 of Regulation S-K is not contained herein, and will not be contained, to the best of registrant's knowledge, in definitive proxy or information statements incorporated by reference in Part III of this Form 10-K or any amendment to this Form 10-K. Indicate by check mark whether the registrant is a large accelerated filer, an accelerated filer, a non-accelerated filer or a smaller reporting company. See definitions of “large accelerated filer”, “accelerated filer” and “smaller reporting company” in Rule 12b-2 of the Exchange Act. Large Accelerated Filer Accelerated Filer Non-Accelerated Filer Smaller Reporting Company Indicate by check mark whether the registrant is a shell company (as defined in Rule 12b-2 of the Securities Exchange Act of 1934) Yes No The aggregate market value of the registrant's common stock held by non-affiliates of the registrant based upon the closing price of $3.52 per share as of March 31, 2015 was approximately $10,706,000. The number of shares outstanding of the registrant's common stock as of December 18, 2015 was 9,341,038.
Transcript
UNITED STATESSECURITIES AND EXCHANGE COMMISSION
WASHINGTON, D.C. 20549
FORM 10-K
ANNUAL REPORT PURSUANT TO SECTION 13 OR 15(d)OF THE SECURITIES EXCHANGE ACT OF 1934
For the fiscal year ended: September 30, 2015
Commission File No. 1-07939
VICON INDUSTRIES, INC.
(Exact name of registrant as specified in its charter)
NEW YORK 11-2160665(State or other jurisdiction of incorporation or organization) (I.R.S. Employer identification No.)
135 Fell Court, Hauppauge, New York 11788(Address of principal executive offices) (Zip Code)
Registrant's telephone number, including area code: (631) 952-2288
Securities registered pursuant to Section 12(b) of the Act:
Common Stock, Par Value $.01 NYSE MKT(Title of class) (Name of each exchange on which registered)
Securities registered pursuant to Section 12(g) of the Act: None
Indicate by check mark if the registrant is a well-known seasoned issuer, as defined in Rule 405 of the Securities Act. Yes No
Indicate by check mark if the registrant is not required to file reports pursuant to Section 13 or Section 15(d) of the Act. Yes No Indicate by check mark whether the registrant (1) has filed all reports required to be filed by Section 13 or 15(d) of the Securities Exchange Act of 1934 during the preceding 12 months (or for such shorter period that the registrant was required to file such reports), and (2) has been subject to such filing requirements for the past 90 days. Yes No
Indicate by check mark whether the registrant has submitted electronically and posted on its corporate Web site, if any, every Interactive Data File required to be submitted and posted pursuant to Rule 405 of Regulation S-T (§232.405 of this chapter) during the preceding 12 months (or for such shorter period that the registrant was required to submit and post such files.) Yes No Indicate by check mark if disclosure of delinquent filers pursuant to Item 405 of Regulation S-K is not contained herein, and will not be contained, to the best of registrant's knowledge, in definitive proxy or information statements incorporated by reference in Part III of this Form 10-K or any amendment to this Form 10-K.
Indicate by check mark whether the registrant is a large accelerated filer, an accelerated filer, a non-accelerated filer or a smaller reporting company. See definitions of “large accelerated filer”, “accelerated filer” and “smaller reporting company” in Rule 12b-2 of the Exchange Act.
Large Accelerated Filer Accelerated Filer Non-Accelerated Filer Smaller Reporting Company
Indicate by check mark whether the registrant is a shell company (as defined in Rule 12b-2 of the Securities Exchange Act of 1934) Yes No The aggregate market value of the registrant's common stock held by non-affiliates of the registrant based upon the closing price of $3.52 per share as of March 31, 2015 was approximately $10,706,000.
The number of shares outstanding of the registrant's common stock as of December 18, 2015 was 9,341,038.
2
PART I
Statements in this Report on Form 10-K that are not strictly historical facts including, without limitation, statements included under the “Business” and “Management’s Discussion and Analysis” captions, are “forward-looking” statements within the meaning of the Private Securities Litigation Reform Act of 1995, Section 27A of the Securities Act of 1933 and Section 21E of the Securities Exchange Act of 1934, that should be considered as subject to the many risks and uncertainties that exist in the Company's operations and business environment. The forward-looking statements are based on current expectations and involve a number of known and unknown risks and uncertainties that could cause the actual results, performance and/or achievements of the Company to differ materially from any future results, performance or achievements, express or implied, by the forward-looking statements. Readers are cautioned not to place undue reliance on these forward-looking statements, and that in light of the significant uncertainties inherent in forward-looking statements, the inclusion of such statements should not be regarded as a representation by the Company or any other person that the objectives or plans of the Company will be achieved. The Company assumes no obligation to publicly update or revise its forward-looking statements or to advise of changes in the assumptions and factors on which they are based.
ITEM 1 - BUSINESS
General
Vicon Industries, Inc. (the "Company"), incorporated in 1967, develops video management software and also designs, assembles and markets a wide range of video system components, comprised principally of cameras, network video servers/recorders, encoders and mass storage units, used in security, surveillance, safety and control applications by a broad group of end users. A video system is typically a private (or hybrid public/private) network that can transmit and receive video, audio and data signals in accordance with the operational needs of the user. The Company's primary business focus is the design of network video systems that it produces and sells worldwide, primarily to authorized dealers, system integrators, government entities and security products distributors.
The Company operates within the electronic protection segment of the security industry. The U.S. security industry consists of thousands of individuals and businesses (exclusive of public sector law enforcement) that provide products and services for the protection and monitoring of people, property and information. The security industry includes fire and detection systems, access control, video surveillance, asset protection, guard services and equipment, locks, safes, armored vehicles, perimeter protection, private investigations, biometric systems, software and network security, among others. The Company’s products are typically used for crime deterrence, visual documentation, observation of inaccessible or hazardous areas, enhancing safety, mitigating liability, obtaining cost savings (such as lower insurance premiums), accumulating command and control data, managing control systems and improving the efficiency and effectiveness of personnel. The Company’s products are used in, among others, office buildings, manufacturing plants, apartment complexes, retail stores, government facilities, airports, highways, transportation operations, prisons, casinos, hotels, sports arenas, health care facilities and financial institutions.
On August 29, 2014, the Company merged with IQinVision, Inc. (“IQinVision”), a California corporation, with IQinVision surviving as a wholly owned subsidiary of the Company (the “Merger”). In connection with the Merger, the Company issued 4,522,335 shares of its common stock to IQinVision shareholders, which represented 50% of the Company’s outstanding common stock at the date of the Merger. In addition, the Company assumed a total of 642,420 IQinVision stock options and stock appreciation rights along with related 2001 and 2011 Stock Incentive Plan provisions at the date of the Merger. The number and exercise prices of these equity instruments assumed were proportionately determined in accordance with a specified merger agreement exchange formula. In connection with the IQinVision merger, on September 12, 2014, the Company paid a special cash dividend of $0.55 per share ($2.5 million in the aggregate) to Company shareholders of record as of July 11, 2014.
IQinVision has been designing HD megapixel IP security cameras since 1998. Their IQeye branded camera product line augments the Company’s OEM camera offering and has historically been sold through many of the same market channels as the Company's products for use in similar end user applications.
Products
The Company’s product line consists of various elements of a video system, including cameras for image capture, stand-alone network video management system (VMS) software and various video recording, storage, management and output devices and peripherals. The Company’s ViconNet branded VMS software is sold either separately or configured in a Network Video Recording (“NVR”) or Digital Video Recording (“DVR”) device. Video capture offerings include a range of analog, digital and high definition (HD) megapixel cameras for both fixed and robotic positioning applications, along with associated housing options to perform in a broad range of climatic and operating environments. The Company also sells and/or produces other video system components such as video encoders decoders and monitors, camera lenses, housings and mounts, matrix video switchers and controls and
3
various video transmission devices. The addition of IQinVision's IQeye line of cameras provides the Company with a proprietary and broader range of HD megapixel camera solutions.
The Company’s products range from a simple camera mounting bracket to a large IP based video camera control, transmission, recording, storage and virtual matrix switching system. The Company’s sales are concentrated principally among its network video products (ViconNet™ (VMS) and Kollector™ (NVR’s and DVR’s)) and its IQinVision's branded camera product offering.
Marketing
The Company’s marketing emphasizes video system solution capability which includes system and network design, pre-ship configuration, project management, technical training and pre and post-sales support. The Company promotes and markets its products through industry trade shows worldwide, product brochures, catalogs, direct marketing and electronic mailings to existing and prospective customers, webinars, technical seminars for system designers, customers and end users, road shows which preview new systems and system components, and advertising through trade and end user magazines and the Company's web site (www.vicon-security.com). The Company’s products are sold principally to independent dealers, system integrators and security products distributors. Sales are made principally by Company field sales engineers supported by inside customer service representatives. The Company’s sales effort is supported by field or in-house professional and technical services staff who provide product information, system and network design, project management, and hardware and software pre-configuration and support.Independent manufacturer sales representative coverage has been added in certain geographic areas to augment existing Company field sales engineers. The Company’s products are utilized in video surveillance applications by: (1) commercial and industrial users, such as office buildings, manufacturing plants, warehouses, apartment complexes, shopping malls and retail stores; (2) federal, state, and local governments for national security purposes, agency facilities, prisons, and military installations; (3) financial institutions, such as banks, clearing houses, brokerage firms and depositories, for security purposes; (4) transportation departments for highway traffic control, bridge and tunnel monitoring, and airport, subway, bus and seaport security and surveillance; (5) gaming casinos, where video surveillance is often mandated by regulatory authorities; (6) health care facilities, such as hospitals; and (7) institutions of education, such as schools and universities.
The Company’s principal sales offices are located in Hauppauge, New York; San Juan Capistrano, California; and Fareham, England.
International Sales
The Company sells its products in Europe, the Middle East and Africa (EMEA) through its European based subsidiary and elsewhere outside the U.S. principally by direct export from its U.S. headquarters. The Company primarily uses a wide range of installation companies and security product distributors in international markets.
Export sales and sales from the Company’s foreign subsidiaries amounted to $12.6 million and $15.0 million, or 28% and 43% of consolidated net sales in fiscal years 2015 and 2014, respectively. The Company’s principal foreign markets are the U.K., Europe, Middle East and the Pacific Rim, which together accounted for approximately 84% of international sales in fiscal 2015.
Competition
The Company operates in a highly competitive marketplace both domestically and internationally. The Company competes by providing a value added video system solution combined with a high level of professional and technical support. The Company is also well known in the security field having specialized in video security applications since its founding in 1967. Generally, the Company does not compete based on price alone.
Many of the Company’s principal competitors are larger companies whose financial resources and scope of operations are substantially greater than the Company’s. Such competitors include security divisions of the Bosch Group, Honeywell International, Schneider Electric, Tyco International, Samsung Group and United Technologies, among others. The Company also competes with many VMS producers such as Avigilon Corporation, Exacq Technologies, Genetec Inc. and Milestone Systems and for cameras with companies such as Axis Communications, Hikvision Digital Technology, Panasonic Corporation and Samsung Electronics, among others. Many additional companies, both domestic and international, produce products that compete against one or more of the Company’s product lines.
4
Engineering and Development
The Company’s principal engineering and development activities are conducted out of its Israeli and California facilities. The Israeli based team has focused principally on the enhancement of existing ViconNet VMS software and development of next generation video management software systems. In recent years, the trend of product development and demand within the video security and surveillance market has been toward enhanced software applications involving the compression, analysis, transmission, storage, manipulation, imaging and display of digital video over IP networks. Since the Company’s target market segment (enterprise applications) requires it to keep pace with changes in technology, the Company has focused its engineering effort in these developing areas. The California based team has focused principally on the enhancement and repositioning of the Company's IQeye camera product offering and development of advanced camera solutions. Development projects are chosen and prioritized based on competitor threats, the Company’s analysis as to the needs of the marketplace, anticipated technological advances and market research.
Engineering and development expense amounted to approximately $5.1 million and $4.6 million, or 11% and 13% of net sales, in fiscal years 2015 and 2014, respectively.
Source and Availability of Raw Materials
The Company relies principally upon independent contract manufacturers and suppliers to produce and assemble its products and expects to continue to rely on such entities in the future. The Company’s relationships with its independent manufacturers, assemblers and suppliers are not covered by formal contractual agreements allowing it to move freely to wherever the best quality and price can be obtained.
Raw materials and components purchased by the Company and its suppliers are generally readily available in the market, subject to market lead times at the time of order. The Company is generally not dependent upon any single source for a significant amount of its raw materials or components.
Intellectual Property
The Company owns a very limited number of patents and trademarks. Most of the Company’s key products utilize proprietary software which is protected by copyright. The Company considers its software to be unique and is a principal element in the differentiation of the Company’s products from its competition. However, the laws of certain foreign countries do not protect intellectual property rights to the same extent or in the same manner as the laws of the U.S. The Company has no significant licenses, franchises or concessions with respect to any of its products or business dealings.
Inventories
The Company generally maintains sufficient finished goods inventory levels to respond to customer demand, since most sales are to security distributors, dealers and system integrators who normally do not carry any significant inventory. The Company principally builds inventory to known or anticipated customer demand. In addition to normal safety stock levels, certain additional inventory levels may be maintained for products with long purchase and manufacturing lead times. The Company believes that it is important to carry adequate inventory levels of parts, components and products to avoid production and delivery delays that may detract from its sales efforts.
Backlog
The backlog of orders believed to be firm as of September 30, 2015 and 2014 was approximately $2.4 million and $2.5 million, respectively. Orders are generally cancelable without penalty at the option of the customer. The Company prefers that its backlog of orders not exceed its ability to fulfill such orders on a timely basis, since experience shows that long delivery schedules only encourage the Company’s customers to look elsewhere for product availability.
5
Employees
At September 30, 2015, the Company employed 148 full-time employees and there are no collective bargaining agreements with any of the Company’s employees. The Company considers its relations with its employees to be good.
ITEM 1B – UNRESOLVED STAFF COMMENTS
None.
ITEM 2 - PROPERTIES
The Company operates from a 30,000 square-foot headquarters facility located at 135 Fell Court, Hauppauge, New York, which it leases. In addition, the Company owns a 14,000 square-foot sales, service and warehouse facility in southern England which services Europe, the Middle East and Africa. This facility is in contract for sale and will be replaced by a smaller leased facility sometime after the closing of the sale transaction. The Company also leases a combined 14,329 square-feet of office space in San Juan Capistrano, California and Yavne, Israel.
The Company believes that its facilities are adequate to meet its current and foreseeable operating needs.
ITEM 3 - LEGAL PROCEEDINGS
None.
ITEM 4 – MINE SAFETY DISCLOSURES
Not applicable
6
PART II
ITEM 5 - MARKET FOR REGISTRANT'S COMMON EQUITY, RELATED STOCKHOLDER MATTERS AND ISSUER PURCHASES OF EQUITY SECURITIES
The Company’s stock is traded on the NYSE MKT under the symbol (VII). The following table sets forth for the periods indicated, the range of high and low prices for the Company's common stock:
Quarter Ended High LowFiscal 2015
December 2.32 1.31March 1.92 1.29June 2.00 1.28September 1.75 1.22
The last sale price of the Company’s common stock on December 18, 2015 as reported on the NYSE MKT was $2.00 per share. As of December 18, 2015, there were approximately 176 shareholders of record.
In connection with the IQinVision merger, on September 12, 2014, the Company paid a special cash dividend of $0.55 per share ($2.5 million in the aggregate) to Company shareholders of record as of July 11, 2014. The Company has never declared or paid any prior cash dividends on its common stock and anticipates that any earnings in the foreseeable future will be retained to finance the growth and development of its business.
In December 2008, the Company’s Board of Directors authorized the purchase of up to $1 million worth of shares of the Company’s outstanding common stock. In December 2009, the Board of Directors authorized the purchase of an additional $1.5 million worth of shares of the Company’s outstanding common stock. The Company did not repurchase any of its common stock during the three month period ended September 30, 2015. The approximate dollar value of shares that may yet be purchased under the program was $972,679 as of September 30, 2015.
ITEM 7. MANAGEMENT'S DISCUSSION AND ANALYSIS OF FINANCIAL CONDITION AND RESULTS OF OPERATIONS
General
Management's Discussion and Analysis of Financial Condition and Results of Operations discusses the Company's consolidated financial statements for the periods indicated, which have been prepared in accordance with accounting principles generally accepted in the United States of America. The preparation of these financial statements requires management to make estimates and assumptions that affect the reported amounts of assets and liabilities and the disclosure of contingent assets and liabilities at the date of the financial statements and the reported amounts of revenues and expenses during the reporting period. On an on-going basis, management evaluates its estimates and judgments, including those related to revenue recognition, bad debts, product warranties, inventories, long lived assets, goodwill and other intangible assets, income taxes and contingencies and litigation. Management bases its estimates and judgments on historical experience and on various other factors including general market conditions that are believed to be reasonable under the circumstances. Actual results may differ from these estimates under different assumptions or conditions. Results for the periods reported herein are not necessarily indicative of results that may be expected in future periods.
7
Overview
The Company designs, assembles and markets video management systems and system components for use in security, surveillance, safety and communication applications by a broad group of end users worldwide. The Company’s product line consists of various elements of a video system, including DVR's, NVR's, video encoders, decoders, servers and related video management software, data storage units, analog, digital and HD megapixel fixed and robotic cameras, virtual and analog matrix video switchers and controls, and system peripherals. The Company sells video surveillance system components in a highly competitive worldwide marketplace principally to authorized security distributors, dealers and system integrators. Such dealers and integrators typically resell and install the Company’s products directly to end users, among other services. The Company’s sales are principally project based and are largely dependent upon winning projects, construction activities and the timing of funding. Sales will vary from period to period depending upon many factors including seasonal and geographic trends in construction activities and the timing of deliveries due to changes in project schedules and funding. The Company usually does not have a large backlog as its customer orders are typically deliverable within three months or often upon receipt of order.
The Company competes in a market of rapid technology shifts which enhance the performance capability of security systems. As a result, the Company spends a significant amount on new product development. In fiscal 2015 and 2014, the Company incurred $5.1 million and $4.6 million of engineering and development expense or 11% and 13% of net sales, respectively. The Company’s expenditures for product development are substantially less than its major competitors. The ongoing market shift to IP based products and network technologies will continue to burden the Company’s development resources and increase ongoing annual expense for product development. Further, the Company’s sales effort requires a high level of customer service and technical support for its products. The Company routinely considers various strategic options that may augment or supplement its present product offerings and technology platforms.
The Company has a foreign sales and distribution subsidiary in Europe that conducts business in British pounds and Euros that represented approximately 20% of the Company’s consolidated sales for fiscal 2015. It also has an Israel based engineering and development subsidiary that incurs a majority of its operating expenses in Shekels that represented approximately 16% of the Company’s operating expenses for fiscal 2015. The Company has historically entered into selected forward currency exchange contracts during favorable exchange rate conditions to help stabilize the impact of changing exchange rates and will consider doing so in the future, financing permitted. However, such hedging activities cannot entirely eliminate the long term effects of foreign currency exchange movements.
Merger Agreement
On August 29, 2014, the Company merged with IQinVision, Inc. (“IQinVision”), a California corporation, with IQinVision surviving as a wholly owned subsidiary of the Company (the “Merger”). In connection with the Merger, the Company issued 4,522,335 shares of its common stock to IQinVision shareholders, which represented 50% of the Company’s outstanding common stock at the date of the Merger. In addition, the Company assumed a total of 642,420 IQinVision stock options and stock appreciation rights along with related 2001 and 2011 Stock Incentive Plan provisions at the date of merger. The number and exercise prices of these equity instruments assumed were proportionately determined in accordance with a specified merger agreement exchange formula. For accounting purposes, the purchase price of the business combination at the date of closing was $14.9 million, consisting of 4,522,335 shares of Vicon common stock valued at $14.2 million on the date of issuance and assumed IQinVision stock options and stock appreciation rights valued at $723,000 in accordance with Financial Accounting Standards Board ASC 718. In connection with the Merger, the Company incurred $1.1 million of transaction and other merger related costs that were expensed in 2014. Subsequent to the merger, the Company began execution of a global integration and restructuring plan (“the Plan”) targeted to, among other things, reduce operating costs and maximize operating cash flow. The Company incurred certain related restructuring costs that have been reflected in its fiscal year 2014 and 2015 results.
In connection with the IQinVision merger, on September 12, 2014, the Company paid a special cash dividend of $0.55 per share ($2.5 million in the aggregate) to Company shareholders of record as of July 11, 2014.
The Merger has been accounted for using the acquisition method of accounting and the Company has been treated as the acquirer for accounting purposes. This determination was made in accordance with the applicable accounting guidance based upon numerous factors including, but not limited to, the relative ownership of the combined company by the Company and former IQinVision shareholders, the composition of the management team and board of directors of the combined company, the structure of the Merger in which IQinVision became a wholly owned subsidiary of the Company, the location of the corporate offices of the combined company, and the continued listing of the Company’s common stock on the NYSE MKT.
8
The IQinVision product line augments the Company’s OEM camera offerings and has historically been sold through many of the same market channels for use in similar end user applications.
RESULTS OF OPERATIONS
Fiscal Year 2015 Compared with 2014
The financial results for fiscal year 2015 include the full year results of operations for IQinVision while fiscal year 2014 include the results of operations for IQinVision only from the August 29, 2014 closing date of the Merger through September 30, 2014.
Net sales for 2015 increased by $10.0 million (29%) to $44.9 million compared with $34.9 million in 2014. Sales of IQinVision products for 2015 were $11.0 million compared with $1.8 million for 2014. Net sales for 2015, exclusive of IQinVision sales, increased by $884,000 (3%) compared with 2014. Sales in the Americas market segment, exclusive of IQinVision, increased $2.3 million (10%) to $24.8 million compared with $22.5 million in 2014, while Europe, Middle East and Africa (EMEA) sales decreased $1.4 million (13%) to $9.1 million compared with $10.5 million in 2014. The EMEA market segment continued to be impacted by weak European economies. Order intake for 2015 increased 33% to $44.8 million compared with $33.7 million in 2014. Orders of IQinVision products for 2015 were $11.4 million compared with $1.0 million in 2014. Americas market segment order intake, exclusive of IQinVision, increased 7% to $24.3 million compared with $22.8 million in 2014, while EMEA order intake decreased 8% to $9.1 million compared with $9.9 million in 2014. The backlog of unfilled orders was $2.4 million at September 30, 2015 compared with $2.5 million at September 30, 2014.
Gross profit margins for 2015 increased to 39.3% compared with 34.9% in 2014. Prior year profit margins were negatively impacted by $519,000 (1.5%) of inventory provisions related to restructuring initiatives. Excluding the effects of restructuring inventory provisions, 2014 margins would have been 36.3%. The 2015 margin improvement was due in part to contributions from the Company's IQeye branded camera line.
Operating expenses for 2015 increased $2.7 million to $22.7 million or 50.6% of net sales compared with $20.0 million or 57.5% of net sales in 2014 due principally to the inclusion of IQinVision operating expenses for the full year in 2015. Selling, general and administrative (SG&A) expenses increased $3.3 million to $17.1 million for 2015 compared with $13.8 million in 2014. Engineering and development expenses increased $467,000 to $5.1 million for 2015 compared with $4.6 million for 2014. The Company has assimilated many of the continuing IQinVision operating expenses, thus now rendering them essentially indistinguishable for comparative reporting purposes. In 2015 and 2014, the Company incurred $573,000 and $520,000, respectively, of severance charges in connection with a merger related integration and restructuring plan. In 2014, the Company incurred $1.1 million of merger related costs in connection with the August 29, 2014 business combination.
The Company incurred an operating loss of $5.1 million for fiscal 2015 compared with an operating loss of $7.9 million for fiscal 2014. Excluding non-recurring merger related expenses and restructuring charges, the Company would have reported operating losses of $4.5 million and $5.8 million for 2015 and 2014, respectively.
In 2015, the Company recorded a $140,000 non-operating foreign exchange loss related to certain U.S. dollar based liabilities of its European subsidiary. In 2014, the Company incurred a $52,000 loss on the sale of its Edgewood, New York headquarters facility.
Interest and other income decreased $12,000 to $2,000 for 2015 compared with $14,000 for 2014 due principally to reduced cash balances.
No income tax benefit was recognized on losses reported for the years presented due to uncertainty of realization. In fiscal 2011, the Company provided a valuation allowance against its deferred tax assets due to the uncertainty of future realization and, thus, no tax benefit has been recognized on subsequent reported pretax losses (see Note 3: Income Taxes).
As a result of the foregoing, the Company reported a net loss of $5.2 million for 2015 compared with a net loss of $7.9 million for 2014.
9
LIQUIDITY AND CAPITAL RESOURCES
Net cash used in operating activities was $5.6 million for fiscal 2015, which included a $3.9 million net loss exclusive of $1.3 million of non-cash charges and a $2.3 million increase in accounts receivable related to higher end of period sales levels. Net cash provided by investing activities was $3.3 million in 2015, consisting principally of net proceeds from the sale of the Company's headquarters facility. Net cash provided by financing activities was $48,000 for 2015 representing proceeds from the exercise of stock options. As a result of the foregoing, cash (exclusive of marketable securities) decreased by $2.4 million in 2015 after the minimal effect of exchange rate changes on the cash position of the Company.
On August 29, 2014, the Company completed its merger with IQinVision, Inc. and subsequently began execution of a global integration and restructuring plan (the "Plan") targeted to, among other things, reduce operating costs and maximize operating cash flow. The Company incurred certain related restructuring costs that have been reflected in its results for 2015. Pursuant to the Plan, the Company closed on the sale of its Edgewood, New York headquarters facility in March 2015 for a net price of $3.3 million. The Company is now leasing a replacement headquarters facility located in Hauppauge, New York.
The Company is also in contract to sell its United Kingdom based operating facility for 1,050,000 Pounds Sterling, which is expected be replaced by a smaller leased facility. The sale is expected to close by January 2016 and generate approximately $1.5 million of net proceeds after transaction costs. This measure was taken in part to support anticipated cash flow requirements during 2016.
The Company presently believes that it will have sufficient cash to meet its anticipated operating costs and capital expenditure requirements for at least the next twelve months. In addition, the Company is presently evaluating various financing proposals from financial institutions, but can give no assurances that an agreement will be executed.
The Company does not have any off-balance sheet transactions, arrangements or obligations (including contingent obligations) that have, or are reasonably likely to have, a material effect on the Company’s financial condition, results of operations, liquidity, capital expenditures or capital resources.
Critical Accounting Policies
The Company’s significant accounting policies are fully described in Note 1 to the consolidated financial statements included in Part IV. Management believes the following critical accounting policies, among others, affect its more significant judgments and estimates used in the preparation of its consolidated financial statements.
Revenue is generally recognized when products are sold and title is passed to the customer. Advance service billings are deferred and recognized as revenues on a pro rata basis over the term of the service agreement. Pursuant to Financial Accounting Standards Board (FASB) Accounting Standards Codification (ASC) 605-25-05, the Company evaluates multiple-element revenue arrangements for separate units of accounting, and follows appropriate revenue recognition policies for each separate unit. Elements are considered separate units of accounting provided that (i) the delivered item has stand-alone value to the customer, (ii) there is objective and reliable evidence of the fair value of the undelivered item, and (iii) if a general right of return exists relative to the delivered item, delivery or performance of the undelivered item is considered probable and substantially within the control of the Company. As applied to the Company, under arrangements involving the sale of product and the provision of services, product sales are recognized as revenue when the products are sold and title is passed to the customer, and service revenue is recognized as services are performed.
For products that include software and for separate licenses of the Company’s software products, the Company recognizes revenue in accordance with the provisions of FASB Accounting Standards Update (ASU) 2009-13, “Revenue Recognition (Topic 605) - Multiple-Deliverable Revenue Arrangements” (ASU 2009-13). ASU 2009-13 provides revenue recognition guidance for establishing separate units of accounting in a multiple element arrangement and requires the allocation of arrangement consideration to each deliverable in the arrangement based on the fair value of the elements. The fair value for each deliverable is based on vendor-specific objective evidence ("VSOE") if available, third-party evidence ("TPE") if VSOE is not available, or best estimate of selling price ("BESP") if neither VSOE nor TPE is available. BESP must be determined in a manner that is consistent with that used to determine the price to sell the specific elements on a standalone basis.
The Company maintains allowances for doubtful accounts for estimated losses resulting from the inability of its customers to make required payments. If the financial condition of its customers were to deteriorate, resulting in an impairment of their ability to make payments, additional allowances may be required.
10
The Company provides for the estimated cost of product warranties at the time revenue is recognized. While the Company engages in product quality programs and processes, including monitoring and evaluating the quality of its component suppliers, its warranty obligation is affected by product failure rates, material usage and service delivery costs incurred in correcting a product failure. Should actual product failure rates, material usage or service delivery costs differ from its estimates, revisions to the estimated warranty liability may be required.
The Company writes down its inventory for estimated obsolescence and slow moving inventory equal to the difference between the carrying cost of inventory and the estimated net realizable market value based upon assumptions about future demand and market conditions. Technology changes and market conditions may render some of the Company’s products obsolete and additional inventory write-downs may be required. If actual future demand or market conditions are less favorable than those projected by management, additional inventory write-downs may be required.
The Company evaluates the establishment of technological feasibility of its software in accordance with ASC 985 ("Accounting for the Costs of Computer Software to be Sold, Leased or Otherwise Marketed"). The Company has determined that technological feasibility for its new products is reached shortly before products are released for field testing. Costs incurred after technological feasibility has been established have not been material and are expensed as incurred.
The Company assesses the recoverability of the carrying value of its long-lived and intangible assets whenever events or changes in circumstances indicate that the carrying amount of the assets may not be recoverable. The Company evaluates the recoverability of such assets based upon the expectations of undiscounted cash flows from such assets. If the sum of the expected future undiscounted cash flows were less than the carrying amount of the asset, a loss would be recognized for the difference between the fair value and the carrying amount.
The Company’s goodwill represents the excess of the purchase price over the fair value of net identifiable assets acquired in the recent business combination. Goodwill is not amortized and is tested for impairment at least annually. When evaluating goodwill for impairment, the Company may first perform an assessment of qualitative factors to determine if the fair value of the reporting unit is more-likely-than-not greater than its carrying amount. If, based on the review of the qualitative factors, the Company determines it is not more-likely-than-not that the fair value of a reporting unit is less than its carrying value, the required two-step impairment test can be bypassed. If the Company does not perform a qualitative assessment or if the fair value of the reporting unit is not more-likely-than-not greater than its carrying value, the Company must perform the first step of the two-step impairment test, and calculate the estimated fair value of the reporting unit. If the carrying value of goodwill exceeds the estimated fair value, there is an indication that impairment may exist and the second step must be performed to measure the amount of impairment loss. The amount of impairment for goodwill is measured as the excess of its carrying amount over its fair value. At September 30, 2015, the Company conducted its annual Step 1 impairment test using the income approach and found no impairment that would require a remeasurement of the recorded goodwill valuation. The Company utilized a cash flow approach in estimating the fair value of the reporting unit, where the discount rate reflects a weighted average cost of capital. The primary assumptions used in the Company's impairment evaluations are based on the best available market information at the time and contain considerable management judgments. These assumptions include sales and gross margin growth rates, associated spending levels and discount rates over the projected period, among other things. Changes in these assumptions or future economic conditions could impact the Company's conclusion regarding an impairment of goodwill and potentially result in a non-cash impairment loss in a future period.
The Company's ability to recover the reported amounts of deferred income tax assets is dependent upon its ability to generate sufficient taxable income during the periods over which net temporary tax differences become deductible. The Company provides for a valuation allowance against all deferred tax assets due to the uncertainty of future realization. The Company plans to provide a full valuation allowance against its deferred tax assets until such time that it can achieve a sustained level of profitability or other positive evidence arises that would demonstrate an ability to recover such assets.
The Company accrues liabilities for identified tax contingencies that result from positions that are being challenged or could be challenged by tax authorities. The Company believes that its accrual for tax liabilities is adequate for all open years, based on Management’s assessment of many factors, including its interpretations of the tax law and judgments about potential actions by tax authorities. However, it is possible that the ultimate resolution of any tax audit may be materially greater or lower than the amount accrued.
Accounting for restructuring activities, as compared to regular operating cost management activities, requires an evaluation of formally committed and approved plans. Restructuring activities have comparatively greater strategic significance and materiality and may involve exit activities, whereas regular cost containment activities are more tactical in nature and are rarely characterized by formal and integrated action plans or exiting a particular product, facility or service.
11
The Company is subject to proceedings, lawsuits and other claims related to labor, product and other matters. The Company assesses the likelihood of an adverse judgment or outcomes for these matters, as well as the range of potential losses. A determination of the reserves required, if any, is made after careful analysis. The required reserves may change in the future due to new developments. Recent Accounting Pronouncements
In May 2014, the FASB issued guidance on revenue from contracts with customers. The underlying principle is that an entity will recognize revenue to depict the transfer of goods or services to customers at an amount that the entity expects to be entitled to in exchange for those goods or services. The guidance provides a five-step analysis of transactions to determine when and how revenue is recognized. Other major provisions include capitalization of certain contract costs, consideration of time value of money in the transaction price, and allowing estimates of variable consideration to be recognized before contingencies are resolved, in certain circumstances. The guidance also requires enhanced disclosures regarding the nature, amount, timing and uncertainty of revenue and cash flows arising from an entity's contracts with customers. This guidance permits the use of either the retrospective or cumulative effect transition method and is effective for the Company beginning in 2019; early adoption is not permitted prior to 2018. The Company has not yet evaluated the impact of this guidance on the Company's financial condition, results of operations and related disclosures.
In August 2014, the FASB issued guidance on management's responsibility in evaluating whether there is substantial doubt about a company's ability to continue as a going concern and related footnote disclosures. Management will be required to evaluate, at each reporting period, whether there are conditions or events that raise substantial doubt about a company's ability to continue as a going concern within one year from the date the financial statements are issued. This guidance is effective prospectively for annual and interim reporting period beginning in 2017. The Company has not yet evaluated the impact of this guidance on the Company’s financial condition, results of operations and related disclosures.
Foreign Currency Activity
The Company’s foreign exchange exposure is principally limited to the relationship of the U.S. dollar to the British pound sterling, the Euro and the Israeli shekel. The Company has historically entered into forward exchange contracts to help mitigate short-term exchange rate exposures during favorable exchange rate conditions. The Company also attempts to reduce the impact of an unfavorable exchange rate condition through cost reductions from its suppliers and shifting product sourcing to suppliers transacting in more stable and favorable currencies. However, there can be no assurance that forward exchange contracts will be obtainable in the future or that the Company will otherwise be effective in limiting long-term foreign currency exposure.
Sales by the Company’s U.K. and German based subsidiaries to customers in Europe are made in British pounds or Euros. In fiscal 2015, approximately $2.2 million of products were sold by the Company to its U.K. based subsidiary for resale. The Company has also entered into certain engineering cost sharing agreements with its U.K. based subsidiary that are denominated in U.S. dollars. The Company’s Israeli based subsidiary incurs shekel based operating expenses which are funded by the Company in U.S. dollars. The Company has historically attempted to minimize its currency exposure on these intercompany transactions through the purchase of forward exchange contracts during favorable exchange rate conditions. As of September 30, 2015 and 2014, the Company had no forward exchange contracts outstanding.
ITEM 8 - FINANCIAL STATEMENTS AND SUPPLEMENTARY DATA
See Part IV, Item 15, for an index to consolidated financial statements and financial statement schedules.
ITEM 9A – CONTROLS AND PROCEDURES
Evaluation of Disclosure Controls and Procedures
The Company’s management, with the participation of its Chief Executive Officer and Chief Financial Officer, conducted an evaluation of the effectiveness of the design and operation of the Company’s disclosure controls and procedures, as required by Exchange Act Rule 13a-15. Based on that evaluation, the Chief Executive Officer and Chief Financial Officer have concluded that, as of the end of the period covered by this report, the Company’s disclosure controls and procedures were effective to ensure that information required to be disclosed by the Company in the reports that it files or submits under the Exchange Act is recorded, processed, summarized and reported within the time periods specified by the Securities and Exchange Commission’s rules and
12
forms and such information is accumulated and communicated to management as appropriate to allow timely decisions regarding required disclosures.
Management's Annual Report on Internal Control over Financial Reporting The Company's management is responsible for establishing and maintaining adequate internal control over financial reporting. The Company's internal control over financial reporting is a process designed under the supervision of its Chief Executive Officer and Chief Financial Officer to provide reasonable assurance regarding the reliability of financial reporting and the preparation of the Company's financial statements for external reporting in accordance with accounting principles generally accepted in the United States of America. Management evaluates the effectiveness of the Company's internal control over financial reporting using the criteria set forth by the 2013 Committee of Sponsoring Organizations of the Treadway Commission (COSO) in Internal Control—Integrated Framework. Management, under the supervision and with the participation of the Company's Chief Executive Officer and Chief Financial Officer, assessed the effectiveness of the Company's internal control over financial reporting as of September 30, 2015 and concluded that it is effective at a reasonable assurance level. Changes in Internal Controls There were no changes in the Company's internal control over financial reporting identified in connection with the evaluation referred to above that occurred during the fourth quarter of the fiscal year ended September 30, 2015 that have materially affected, or are reasonably likely to materially affect, the registrant's internal control over financial reporting.
Limitations on the Effectiveness of Controls
The Company believes that a control system, no matter how well designed and operated, cannot provide absolute assurance that the objectives of the control system are met, and no evaluation of controls can provide absolute assurance that all controls issues and instances of fraud, if any, within a Company have been detected. The Company's disclosure controls and procedures are designed to provide reasonable assurance of achieving their objectives and the Company's Chief Executive Officer and Chief Financial Officer have concluded that such controls and procedures are effective at the "reasonable assurance" level.
ITEM 9B – OTHER INFORMATION
None.
13
PART III
ITEM 10 - DIRECTORS, EXECUTIVE OFFICERS AND CORPORATE GOVERNANCE
The Executive Officers and Directors of the Company are as follows:
Name Age PositionEric S. Fullerton 60 Chief Executive Officer and DirectorJohn M. Badke 56 Senior Vice President, Finance and Chief Financial OfficerBret M. McGowan 50 Senior Vice President, Sales and Marketing (Americas)Peter A. Horn 60 Vice President, OperationsMark S. Provinsal 49 Managing Director, Vicon Industries, Ltd.Julian A. Tiedemann 51 Chairman of the Board of DirectorsJoseph A. Budano 54 DirectorGioia Messinger 53 DirectorArthur D. Roche 77 Director
The business experience, principal occupations and employment, as well as period of service, of each of the officers and directors of the Company during at least the last five years are set forth below.
Eric S. Fullerton - Chief Executive Officer and Director. Mr. Fullerton has served as Chief Executive Officer since joining the Company in September 2014. Prior to joining the Company, Mr. Fullerton served as Chief Sales and Marketing Officer at Milestone Systems A/S, a leading provider of open platform IP video management software, since 2007, and before that as its VP Americas since 2004. Mr. Fullerton was previously Chief Executive Officer of the IT security company netVigilance, Inc. and before that, he held several senior level positions including General Manager of Intel's Converged Edge and Network Systems Divisions, Chief Executive Officer of Cray Communications and Managing Director of NOKIA's Consumer Electronics and Telecommunications divisions in Denmark. Mr. Fullerton brings extensive industry knowledge and experience to the Board. His current term on the Board ends at the 2018 Annual Meeting of Shareholders.
John M. Badke - Senior Vice President, Finance and Chief Financial Officer. Mr. Badke has been Senior Vice President, Finance since May 2004 and Chief Financial Officer since December 1999. Previously, he was Vice President, Finance since October 1998 and served as Controller since joining the Company in 1992. Prior to joining the Company, Mr. Badke was Controller for NEK Cable, Inc. and an audit manager with the international accounting firms of Arthur Andersen & Co. and Peat Marwick Main & Co.
Bret M. McGowan - Senior Vice President, Sales and Marketing (Americas). Mr. McGowan has been Senior Vice President, Sales and Marketing (Americas) since June 2012. Previously, he served in varying Sales and Marketing vice president capacities since 2001. Previously, he served as Director of Marketing since 1998 and as Marketing Manager since 1994. He joined the Company in 1993 as a Marketing Specialist. Peter A. Horn - Vice President, Operations. Mr. Horn has been Vice President, Operations since June 1999. From 1995 to 1999, he was Vice President, Compliance and Quality Assurance. Prior to that time, he served as Vice President in various capacities since his promotion in May 1990.
Mark S. Provinsal - Managing Director, Vicon Industries, Ltd. Mr. Provinsal joined the Company in January 2010 as its Vice President, Marketing and Product Management, and in January 2012 transferred to the Company's U.K. based subsidiary, Vicon Industries, Ltd., to serve as its Director of Sales and Marketing until becoming its Managing Director in June 2014. Prior to joining the Company, Mr. Provinsal served as Executive Vice President of Dedicated Micros Inc. (U.S.) from 2008 and prior as its Vice President Marketing and Product Strategy since 2006. From 2000 to 2006, he served as the Director of Marketing and Product Development of IPIX Corporation.
Julian A. Tiedemann - Chairman of the Board of Directors. Mr. Tiedemann has been a director of the Company since May 2011 and was elected Chairman of the Board on December 4, 2014. Since 2008, he has been Executive Vice President and Chief Operating Officer of The InterTech Group, a holding company and operator of a diverse global group of companies. From 1996 to 2008, Mr. Tiedemann was Vice President of Human Resources, Risk Management and Administration for The InterTech Group. In addition, he previously served on the Board of Directors of Hudson's Bay Company, a multi-billion dollar Canadian national
14
retailer. Mr. Tiedemann brings extensive knowledge and experience in operating and administration matters having served as Chief Operating Officer of a diverse group of global companies and having previously served as a director of a multi-billion dollar retailer. His current term on the Board ends at the 2018 Annual Meeting of Shareholders.
Joseph A. Budano - Director. Mr. Budano was appointed to the Board in August 2014 pursuant to the Merger with IQinVision. Mr. Budano has been the President and Chief Executive Officer of Indyme Solutions LLC, a supplier of retail customer service and loss prevention solutions, since 2012. From 2009 to 2012, Mr. Budano served as Chief Executive Officer of Energy Innovations. Prior to that, Mr. Budano served as Chief Executive Officer of Elgar Electronics from 2002 to 2008. Mr. Budano has served as a senior executive at a diverse group of both publicly listed and private equity backed high tech companies. Prior to his leadership roles, Mr. Budano was a management consultant at the Boston Consulting Group and served in several engineering management and engineering roles at Motorola. Mr. Budano brings extensive experience with merger and acquisition transactions and in post-merger integration. Mr. Budano also provides particular insight into product and sales growth strategies from his consulting background and significant operational experience growing technology companies. His current term on the Board ends at the 2016 Annual Meeting of Shareholders.
Gioia Messinger - Director. Ms. Messinger was appointed to the Board in August 2014 pursuant to the Merger with IQinVision, after having served as a director of IQinVision since 2012. Ms. Messinger is the Chief Executive Officer of LinkedObjects, Inc., a technology and business strategy firm specializing in wireless Internet enabled devices, which she founded in 2012. Prior to being acquired by NETGEAR in 2012, Ms. Messinger served as the Chairman and Chief Executive Officer of Avaak, Inc., a company she founded in 2004. Prior to that, Ms. Messinger was the founder and Chief Executive Officer of an engineering services firm and a medical information systems company, and brings extensive knowledge and experience in operating and administration matters. Her current term on the Board ends at the 2016 Annual Meeting of Shareholders.
Arthur D. Roche - Director. Mr. Roche has been a director of the Company since 1992. He served as Executive Vice President and co-participant in the Office of the President of the Company from August 1993 until his retirement in November 1999. For the six months prior to that time, Mr. Roche provided consulting services to the Company. In October 1991, Mr. Roche retired as a partner of Arthur Andersen & Co., an international accounting firm which he joined in 1960. Mr. Roche brings extensive Company knowledge and financial experience having served as the Company’s Executive Vice President and formerly serving as a partner with an international public accounting firm. Mr. Roche brings particular insight to the Board based on his former management responsibilities and provides strategic planning and financial oversight. His current term on the Board ends at the 2017 Annual Meeting of Shareholders.
There are no family relationships between any director, executive officer or person nominated or chosen by the Company to become a director or officer.
Audit Committee Financial Expert
All Audit Committee members are independent directors. The Board of Directors has determined that Arthur D. Roche, Chairman of the Audit Committee, qualifies as an “Audit Committee Financial Expert”, as defined by Securities and Exchange Commission Rules, based on his education, experience and background. Mr. Roche is independent as that term is used in Item 7(d)(3)(iv) of Schedule 14A under the Exchange Act.
Code of Ethics
The Company has adopted a Code of Ethics and Business Conduct that applies to all its employees, including its chief executive officer, chief financial and accounting officer, controller, and any persons performing similar functions. Such Code of Ethics and Business Conduct is published on the Company’s internet website (www.vicon-security.com).
Compliance with Section 16(a) of the Exchange Act
Based solely upon a review of Forms 3 and 4 and amendments thereto furnished to the Company during the year ended September 30, 2015 and certain written representations that no Form 5 is required, no person who, at any time during the year ended September 30, 2015 was a director, officer or beneficial owner of more than 10 percent of any class of equity securities of the Company registered pursuant to Section 12 of the Exchange Act failed to file on a timely basis, as disclosed in the above forms, reports required by Section 16(a) of the Exchange Act during the year ended September 30, 2015, except that Mr. Fullerton filed one late report on Form 4.
15
ITEM 11 - EXECUTIVE COMPENSATION
COMPENSATION DISCUSSION AND ANALYSIS Compensation Philosophy and Objectives of Our Compensation Program The Company’s compensation programs are intended to enable it to attract, motivate, reward and retain the management talent required to achieve corporate objectives, and thereby increase stockholder value. It is the Company’s policy to provide incentives to senior management to achieve both short-term and long-term objectives and to reward exceptional performance and contributions to the development of the business. To attain these objectives, the executive compensation program includes four key components: Base Salary. Base salary for the Company’s executives is intended to provide competitive remuneration for services provided to the Company over a one-year period. Base salaries are set at levels designed to attract and retain the most appropriately qualified individuals for each of the key management level positions within the Company. Cash Incentive Bonuses. The Company's bonus programs are intended to reward executive officers for the achievement of various annual performance goals approved by the Company’s Board of Directors.
For fiscal 2015, a performance based bonus plan was established for certain of the Company’s executive officers including, among others: Eric S. Fullerton, Chief Executive Officer; John M. Badke, Senior Vice President, Finance and Chief Financial Officer; and Bret M. McGowan, Senior Vice President, Sales and Marketing (Americas), whereby Messrs. Fullerton, Badke and Mr. McGowan could earn amounts up to $75,000, $50,000 and $65,000, respectively, for the achievement of certain operating results as defined for the fiscal year ended September 30, 2015. These financial results targets were based principally on the achievement of specific integration restructuring plan activities pursuant to the IQinVision merger. Such bonuses were fully earned by the named executive officers. For fiscal 2014, no incentive bonus programs were instituted due to financial constraints and the pending merger with IQinVision.
Equity-based Compensation. Equity-based compensation is designed to provide incentives to the Company’s executive officers to build shareholder value over the long term by aligning their interests with the interest of shareholders. The Compensation Committee of the Board of Directors believes that equity-based compensation provides an incentive that focuses the executive's attention on managing the company from the perspective of an owner with an equity stake in the business. Among our executive officers, the number of shares of stock awarded or common stock subject to options granted to each individual generally depends upon the level of that officer's responsibility. The largest grants are generally awarded to the most senior officers who, in the view of the Compensation Committee, have the greatest potential impact on the Company’s profitability and growth. Previous grants of stock options or stock grants are reviewed in determining the size of any executive's award in a particular year. In March 2007, the Board of Directors adopted the Company’s 2007 Stock Incentive Plan, which was approved by the Company’s stockholders at its Annual Meeting of Stockholders held on May 18, 2007. Under such plan, a total of 500,000 shares of common stock were reserved for issuance and include the grant of stock options, restricted stock and other stock awards as determined by the Compensation Committee. The purpose of the Stock Incentive Plan is to attract and retain executive management by providing them with appropriate equity-based incentives and rewards for superior performance and to provide incentive to a broader range of employees. In fiscal 2015, the Compensation Committee awarded a total of 28,000 stock options to named executive officers, consisting of 14,000 to Mr. Badke and 14,000 to Mr. McGowan. No option awards were made to named executive officers in fiscal 2014.
Retirement, Health and Welfare Benefits and Other Perquisites. The Company’s executive officers are entitled to a specified retirement/severance benefit pursuant to employment agreements as detailed below. In addition, the executive officers are entitled to participate in all of the Company’s employee benefit plans, including medical, dental, group life, disability, accidental death and dismemberment insurance and the Company’s sponsored 401(k). The Company’s named executive officers are also provided with either a leased car or automobile allowance.
16
Employment Agreements
On September 10, 2014, the Company entered into an at-will employment offer letter agreement (the “Agreement”) with Eric S. Fullerton upon his appointment as the Company’s Chief Executive Officer. Under the terms of the Agreement, Mr. Fullerton receives a base salary of $300,000 per year and is eligible to receive up to 600,000 shares of the Company’s common stock (the “Shares”). The Shares are issuable in four equal installments on each of the first four anniversaries of the Commencement Date pursuant to a Stock Agreement dated September 10, 2014 between the Company and Mr. Fullerton provided Mr. Fullerton is then employed by the Company. Notwithstanding the foregoing, 50,000 of the Shares otherwise issuable to Mr. Fullerton on the first anniversary of the Commencement Date were instead issued to Mr. Fullerton upon the Company’s Board of Directors’ approval of a restructuring plan for Fiscal Year 2015. The Shares are issuable outside of the Company’s shareholder approved equity incentive plan as an inducement material to Mr. Fullerton’s acceptance of employment pursuant to Section 711(a) of the NYSE MKT Company Guide. Mr. Fullerton has received a total of 150,000 shares under such agreement.
The Agreement provides that if Mr. Fullerton’s employment with the Company is terminated by the Company for any reason other than “cause” (as defined in the Agreement), Mr. Fullerton will be entitled to continuation of his base salary for twelve months; provided, however, that, if his employment with the Company is terminated by the Company for any reason other than “cause” after the first year of his employment, Mr. Fullerton will only be entitled to such severance if he had completed his relocation to the Company’s New York headquarters. Further, any severance will cease immediately upon commencement of Mr. Fullerton’s employment with another company.
As a condition of employment, Mr. Fullerton has entered into a confidentiality and non-solicitation agreement with the Company. Mr. Fullerton is also subject to non-competition covenants that prohibit him from engaging in certain activities during the period of his employment with the Company.
The Company has entered into employment agreements with certain of its named executive officers that provide certain benefits upon termination of employment or change in control of the Company without Board of Director approval. All such agreements provide the named executive officer with a payment of three times their average annual compensation for the previous five year period if there is a change in control of the Company without Board of Director approval, as defined. Such payment can be taken in a present value lump sum or equal installments over a three year period. The agreements also provide the named executive officers with certain severance/retirement benefits upon certain occurrences including termination of employment without cause as defined, termination of employment due to the Company’s breach of specified employment conditions (good reason termination), death, disability or retirement at a specified age. Such severance/retirement benefit provisions survive the expiration of the agreements and include a fixed stated benefit of $350,000 for Mr. Badke and $290,000 for Mr. McGowan. In addition, Mr. Badke receives an additional deferred compensation benefit upon termination of employment in certain circumstances in the form of 6,561 shares of the Company’s common stock.
17
2015 Summary Compensation Table The following table sets forth all compensation for the fiscal year ended September 30, 2015 awarded to or earned by the Company’s Chief Executive Officer and by each of its other named executive officers whose total compensation exceeded $100,000 during such period.
Name and Principal Position Year Salary ($)
Bonus($)(2)
StockAwards($)(3)
OptionAwards($)(4)
All OtherCompensation
($)(5) Total ($)
Eric S. Fullerton Chief Executive Officer
2015 300,000 75,000 — — 6,000 381,000
2014 17,308 (1) — 1,998,000 — — 2,015,308
John M. Badke Senior Vice President and Chief Financial Officer
2015 190,000 50,000 — 13,090 8,045 261,135
2014 190,000 — — — 7,933 197,933
Bret M. McGowan Senior Vice President, Sales and Marketing (Americas)
2015 190,000 65,000 — 13,090 6,000 274,090
2014 190,000 — — — 6,000 196,000
(1) Mr. Fullerton commenced employment on September 10, 2014.(2) Represents earned cash bonus approved by the Board of Directors upon the recommendation of its Compensation
Committee.(3) Represents employment inducement award covering the right to be issued up to 600,000 shares of common stock over
a four year period from the start of his employment with the Company. Reflects the grant date fair value computed in accordance with ASC 718. See Employment Agreements section above for further details.
(4) Represents the aggregate grant date fair value of option awards computed in accordance with ASC 718. See Note 1 to the accompanying financial statements for assumptions made in the valuation of these awards.
(5) Represents automobile expense paid by the Company.
18
Outstanding Equity Awards at Fiscal 2015 Year-End The following table sets forth information with respect to the outstanding equity awards of the named executive officers as of September 30, 2015.
(1) Options vest over a five year period in five equal annual installments beginning on the first anniversary of the grant date. Options expire after the tenth anniversary of the grant date.
(2) Options vest over a four year period as to 30% of the shares on the second anniversary of the grant date, 30% of the shares on the third anniversary of the grant date and the remaining 40% of the shares on the fourth anniversary of the grant date. Options expire after the sixth anniversary of the grant date.
(3) Options vest over a four year period in four equal annual installments beginning on the first anniversary of the grant date. Options expire after the tenth anniversary of the grant date.
(4) Represents employment inducement award covering the right to be issued up to 600,000 shares of common stock over a four year period from the start of his employment with the Company. See Employment Agreements section for further details.
19
Fiscal 2015 Directors' Compensation The table below summarizes the compensation paid by the Company to non-employee directors for the fiscal year ended September 30, 2015.
NameFees Earned orPaid in Cash ($)
Option Awards($)(1) Total ($)
Joseph A. Budano 49,000 7,013 56,013Gioia Messinger 49,000 7,013 56,013Arthur D. Roche 50,000 7,013 57,013Julian A. Tiedemann 58,000 7,013 65,013
(1) Reflects the aggregate grant date fair value computed in accordance with ASC 718. As of September 30, 2015, the aggregate number of outstanding option awards for each director were as follows: Mr. Budano - 7,500; Ms. Messinger - 7,500; Mr. Roche - 32,000; and Mr. Tiedemann - 22,500.
Directors’ Compensation and Term
Non-employee directors are compensated at the rate of $35,000 per year retainer and $1,000 per committee meeting attended in person or by teleconference, with the non-executive Chairman of the Board receiving an additional annual retainer of $15,000. Also, the Chairman of the Audit Committee receives an additional annual retainer of $8,000 and the Chairperson of each of the Compensation and Nominating and Governance Committees receives an additional annual retainer of $6,000. Employee directors are not compensated for Board or committee meetings. Directors may not stand for reelection after age 70, except that any director may serve additional three-year terms after age 70 with the unanimous consent of the Board of Directors.
Compensation Committee Interlocks and Insider Participation
The Compensation Committee of the Board of Directors consists of Mr. Budano (Chairman), Mr. Roche and Mr. Tiedemann, none of whom has ever been an officer of the Company except for Mr. Roche, who served as Executive Vice President from August 1993 until his retirement in November 1999.
EQUITY COMPENSATION PLAN INFORMATIONat September 30, 2015
Plan category
Number of securitiesto be issued upon
exercise ofoutstanding options,warrants and rights
(a)
Weighted averageexercise price of
outstanding options,
warrants and rights
(b)
Number of securitiesremaining available forfuture issuance underequity compensation
plans(excluding securities
reflected in column (a))(c)
Equity compensation plans approved by securityholders
465,517 $3.71 167,581 (2)
Equity compensation plans not approved by securityholders
711,140 (1) $2.68 —
Total 1,176,657 $3.31 167,581
(1) Includes (i) 16,320 shares of common stock issuable to certain officers under deferred compensation benefit arrangements upon retirement and other termination of employment events; (ii) 450,000 shares of common stock issuable to Eric Fullerton as described under Employment Agreements section and (iii) 244,820 shares subject to stock options and stock appreciation rights assumed by the Company in connection with the IQinVision Merger.
(2) Represents awards available for issuance under the Company's Stock Incentive Plans.
20
ITEM 12 - SECURITY OWNERSHIP OF CERTAIN BENEFICIAL OWNERS AND MANAGEMENT AND RELATED STOCKHOLDER MATTERS
The following table sets forth the beneficial ownership of the Company’s common stock as of December 18, 2015 by (i) those persons known by the Company to be beneficial owners of more than 5% of the Company’s outstanding common stock; (ii) each current executive officer named in the Summary Compensation Table; (iii) each director; and (iv) all directors and executive officers as a group.
Name and AddressOf Beneficial Owner
Number of SharesBeneficially Owned (1)
% of Class
Gordian, Inc. and Gregory A. Bone424 Peachtree LanePaso Robles, CA 93446 1,382,111 (2) 14.8%
CBC Co., Ltd. and affiliates2-15-13 Tsukishima, Chuo-ku,Tokyo, Japan 104 543,715 5.8%
Martin D. GrayP.O. Box 24Rancho Santa Fe, CA 92067 536,912 5.7%
Eric S. Fullerton 380,000 4.1%Arthur D. Roche 95,071 (3) 1.0%John M. Badke 81,046 (4) *Bret M. McGowan 38,435 (5) *Julian A. Tiedemann 19,000 (6) *Gioia Messinger 10,409 *Joseph A. Budano — *
Total all Executive Officers and Directors as a Group (9 persons) 731,797 (7) 7.7%* Less than 1%
(1) All information was determined in accordance with Rule 13d-3 under the Securities Exchange Act of 1934 and based on 9,341,038 shares of common stock outstanding on December 18, 2015. Unless otherwise indicated, the Company believes that all persons named in the table have sole voting and investment power over the shares of stock owned.
(2) Includes 1,306,350 shares held by Gordian, Inc. and 75,761 shares held by Gregory A. Bone. Mr. Bone is the President, a director and the principal shareholder of Gordian, Inc. and therefore may be deemed to beneficially own the securities held by Gordian, Inc.
(3) Includes 15,000 shares held by Mr. Roche’s wife and currently exercisable options to purchase 24,500 shares.(4) Includes currently exercisable options to purchase 36,200 shares.(5) Includes currently exercisable options to purchase 20,200 shares.(6) Includes currently exercisable options to purchase 15,000 shares.(7) Includes currently exercisable options to purchase 150,300 shares.
ITEM 13 - CERTAIN RELATIONSHIPS AND RELATED TRANSACTIONS, AND DIRECTOR INDEPENDENCE
None.
21
ITEM 14 – PRINCIPAL ACCOUNTANT FEES AND SERVICES
The following table details: the aggregate fees billed by BDO USA, LLP for professional services rendered for the audit of the Company’s consolidated annual financial statements and review of the financial statements included in the Company’s quarterly reports on Form 10-Q; the aggregate fees billed by BDO USA, LLP for audit related matters and; the aggregate fees billed by BDO USA, LLP for tax compliance, tax advice and tax planning during fiscal years ended September 30, 2015 and 2014:
Audit Committee Pre-Approval of Audit and Permissible Non-Audit Services of Independent Auditors
The Audit Committee pre-approves all audit and permissible non-audit services provided by the independent auditors. These services may include audit services, audit related services, tax services and other services. The Audit Committee has adopted a policy for the pre-approval of services provided by the independent auditors. Under the policy, pre-approval generally is provided for an annual period and any pre-approval is detailed as to the particular service or category of services and is subject to a specific limit. In addition, the Audit Committee may also pre-approve particular services on a case-by-case basis, which must be accompanied by a detailed explanation for each proposed service. The Audit Committee may delegate pre-approval authority to one or more of its members. Such member must report any decisions to the Audit Committee at the next scheduled meeting.
PART IV
ITEM 15 – EXHIBITS AND FINANCIAL STATEMENT SCHEDULES
(a) (1) Financial Statements
Included in Part IV, Item 15:
Report of Independent Registered Public Accounting Firm
Financial Statements:
Consolidated Statements of Operations, years ended September 30, 2015 and 2014
Consolidated Statements of Comprehensive Loss, years ended September 30, 2015 and 2014
Consolidated Balance Sheets at September 30, 2015 and 2014
Consolidated Statements of Shareholders’ Equity, years ended September 30, 2015 and 2014
Consolidated Statements of Cash Flows, years ended September 30, 2015 and 2014
Notes to Consolidated Financial Statements, years ended September 30, 2015 and 2014
(a) (2) All schedules for which provision is made in the applicable accounting regulations of the Securities and Exchange Commission have been omitted because they are not required under the related instructions or are not applicable or are included in the financial statements and notes thereto included in this Form 10-K.
22
(a)(3) Exhibits
Number Description2.1 Agreement and Plan of Merger and Reorganization dated March 28, 2014 by and among the Registrant, VI Merger Sub Inc.
and IQinVision, Inc. (Incorporated by reference to the Current Report on Form 8-K dated March 31, 2014)3.1 Articles of Incorporation and By-Laws, as amended (Incorporated by reference to the 1985 Annual Report on Form 10-K;
Form S-2 filed in Registration Statement No. 33-10435 and Exhibit A, B and C of the 1987 Proxy Statement)3.2 Amendment of the Company’s By-Laws effective January 1, 2008 (Incorporated by reference to the 2007 Annual Report
on Form 10-K)3.3 Amendment of the Certificate of Incorporation dated May 7, 2002 (Incorporated by reference to the 2002 Annual Report
on Form 10-K)10.3 2002 Incentive Stock Option Plan (Incorporated by reference to the 2002 Annual Report on Form 10-K)10.4 2002 Non-Qualified Stock Option Plan (Incorporated by reference to the 2002 Annual Report on Form 10-K)10.5 Employment and Deferred Compensation Agreement dated January 1, 2006 between the Registrant and John M. Badke
(Incorporated by reference to the Current Report on Form 8-K dated March 6, 2006)10.6 Amendment 1 to the Employment and Deferred Compensation Agreement dated November 13, 2006 between the Registrant
and John M. Badke (Incorporated by reference to the Current Report on Form 8-K dated November 16, 2006)10.7 Employment Agreement dated August 7, 2006 between the Registrant and Bret M. McGowan (Incorporated by reference
to the 2006 Annual Report on Form 10-K)10.8 2007 Stock Incentive Plan (Incorporated by reference to the Proxy Statement filed on April 27, 2007)10.9 Employment Agreement dated September 10, 2014 between the Registrant and Eric S. Fullerton (Incorporated by reference
to the Current Report on Form 8-K dated September 11, 2014)10.10 Stock Agreement dated September 10, 2014 between the Registrant and Eric S. Fullerton (Incorporated by reference to the
Current Report on Form 8-K dated September 11, 2014)10.11 Contract of Sale between the Registrant, as Seller, and MD Jahirul Islam, as Buyer, with respect to 131 Heartland Blvd.,
Edgewood, New York, as of November 12, 2014 (Incorporated by reference to the Current Report on Form 8-K datedNovember 18, 2014)
21 Subsidiaries of the Registrant (Incorporated by reference to the Notes to the Consolidated Financial Statements)23 Consent of BDO USA, LLP
Rule 13a-14(a)/15d-14(a) Certifications31.1 Certification of Chief Executive Officer pursuant to Section 302 of the Sarbanes-Oxley Act of 200231.2 Certification of Chief Financial Officer pursuant to Section 302 of the Sarbanes-Oxley Act of 2002
Section 1350 Certifications32.1 Certification of Chief Executive Officer pursuant to 18 U.S.C. Section 1350, as adopted pursuant to Section 906 of the
Sarbanes-Oxley Act of 200232.2 Certification of Chief Financial Officer pursuant to 18 U.S.C. Section 1350, as adopted pursuant to Section 906 of the
* In accordance with Regulation S-T, the XBRL-related information in Exhibit 101 to this Annual Report on Form 10-Kshall be deemed to be “furnished” and not “filed.”
No other exhibits are required to be filed.
23
Report of Independent Registered Public Accounting Firm
The Board of Directors and ShareholdersVicon Industries, Inc.
We have audited the accompanying consolidated balance sheets of Vicon Industries, Inc. as of September 30, 2015 and 2014 and the related consolidated statements of operations, comprehensive loss, shareholders’ equity, and cash flows for the years then ended. These consolidated financial statements are the responsibility of the Company’s management. Our responsibility is to express an opinion on these consolidated financial statements based on our audits.
We conducted our audits in accordance with the standards of the Public Company Accounting Oversight Board (United States). Those standards require that we plan and perform the audit to obtain reasonable assurance about whether the financial statements are free of material misstatement. The Company is not required to have, nor were we engaged to perform, an audit of its internal control over financial reporting. Our audits included consideration of internal control over financial reporting as a basis for designing audit procedures that are appropriate in the circumstances, but not for the purpose of expressing an opinion on the effectiveness of the Company’s internal control over financial reporting. Accordingly, we express no such opinion. An audit also includes examining, on a test basis, evidence supporting the amounts and disclosures in the financial statements, assessing the accounting principles used and significant estimates made by management, as well as evaluating the overall financial statement presentation. We believe that our audits provide a reasonable basis for our opinion.
In our opinion, the consolidated financial statements referred to above present fairly, in all material respects, the financial position of Vicon Industries, Inc. at September 30, 2015 and 2014, and the results of its operations and its cash flows for the years then ended, in conformity with accounting principles generally accepted in the United States of America.
/s/ BDO USA, LLP
Melville, New YorkDecember 29, 2015
24
VICON INDUSTRIES, INC. AND SUBSIDIARIESCONSOLIDATED STATEMENTS OF OPERATIONS
Years Ended September 30, 2015 and 2014
2015 2014
Net sales $ 44,884,015 $ 34,878,409Cost of sales 27,237,862 22,724,144
Selling, general and administrative expense 17,089,392 13,848,891Engineering and development expense 5,063,010 4,595,545Merger related expense — 1,077,066Restructuring charges 572,913 520,000
22,725,315 20,041,502
Operating loss (5,079,162) (7,887,237)Other income (expense):
Other expense (140,853) (52,048)Interest income 1,713 13,873
Loss before income taxes (5,218,302) (7,925,412)
Income tax expense — —
Net loss $ (5,218,302) $ (7,925,412)Loss per share:
Basic $ (.57) $ (1.61)Diluted $ (.57) $ (1.61)
See accompanying notes to consolidated financial statements.
25
VICON INDUSTRIES, INC. AND SUBSIDIARIESCONSOLIDATED STATEMENTS OF COMPREHENSIVE LOSS
Years Ended September 30, 2015 and 2014
2015 2014Net loss $ (5,218,302) $ (7,925,412)Other comprehensive income (loss): Unrealized gain on securities 2,898 1,664 Foreign currency translation adjustment (166,712) 19,098Other comprehensive income (loss) (163,814) 20,762 Comprehensive loss $ (5,382,116) $ (7,904,650)
See accompanying notes to consolidated financial statements.
26
VICON INDUSTRIES, INC. AND SUBSIDIARIESCONSOLIDATED BALANCE SHEETS
September 30, 2015 and 2014
ASSETS 2015 2014Current Assets:
Cash and cash equivalents $ 2,390,409 $ 4,751,270Marketable securities 13,047 120,310Accounts receivable (less allowance of $993,000 in 2015 and $907,000 in 2014) 10,816,348 8,632,393Inventories:
Total current liabilities 11,094,369 10,878,814Unearned revenue-non current 104,779 134,816Other long-term liabilities 1,508,801 1,583,997
Total liabilities 12,707,949 12,597,627Commitments and contingencies - Note 8Shareholders' equity:
Common stock, par value $.01 per share authorized - 25,000,000 shares issued - 10,010,995 and 9,900,868 shares 100,109 99,008Capital in excess of par value 40,972,206 40,544,228Retained earnings (accumulated deficit) (15,350,975) (10,132,673)
Treasury stock at cost, 806,198 shares in 2015 and 856,198 shares in 2014 (3,979,852) (4,226,852)Accumulated other comprehensive loss (277,306) (113,492)
Total shareholders' equity 21,464,182 26,170,219TOTAL LIABILITIES AND SHAREHOLDERS' EQUITY $ 34,172,131 $ 38,767,846
See accompanying notes to consolidated financial statements.
27
VICON INDUSTRIES, INC. AND SUBSIDIARIESCONSOLIDATED STATEMENTS OF SHAREHOLDERS' EQUITY
See accompanying notes to consolidated financial statements.
28
VICON INDUSTRIES, INC. AND SUBSIDIARIESCONSOLIDATED STATEMENTS OF CASH FLOWS
Years Ended September 30, 2015 and 2014
2015 2014Cash flows from operating activities:
Net loss $ (5,218,302) $ (7,925,412)Adjustments to reconcile net loss to net cash used in operating activities:
Loss on sale of building — 52,048Depreciation and amortization 725,365 434,533Amortization of deferred compensation 2,912 4,767Stock compensation expense 625,061 154,749
Change in assets and liabilities, net of acquisition: Accounts receivable, net (2,301,924) 1,336,186Inventories 143,944 2,076,174Prepaid expenses and other current assets (83,921) 373,637Other assets 241,073 70,622Accounts payable 352,832 817,749Accrued compensation and employee benefits (38,306) (52,635)Accrued expenses (428,751) 191,423Unearned revenue 441,504 (98,400)Other liabilities (70,591) (169,037)
Net cash used in operating activities (5,609,104) (2,733,596)
Cash flows from investing activities: Proceeds from sale of building, net 3,325,000 —Net decrease (increase) in marketable securities 110,161 (3,213)Cash acquired in business combination — 1,886,342Capital expenditures (125,246) (140,211)
Net cash provided by investing activities 3,309,915 1,742,918
Cash flows from financing activities: Proceeds from exercise of stock options 48,106 —Dividend paid — (2,487,284)
Net cash provided by (used in) financing activities 48,106 (2,487,284)
Effect of exchange rate changes on cash (109,778) (52,482)Net decrease in cash (2,360,861) (3,530,444)Cash and cash equivalents at beginning of year 4,751,270 8,281,714Cash and cash equivalents at end of year $ 2,390,409 $ 4,751,270
Cash paid during the fiscal year for: Income taxes $ 19,465 $ 15,057Interest $ — $ —
Non-cash investing and financing activities:Common stock issued and equity securities assumed in connection with businesscombination $ — $ 14,877,981
See accompanying notes to consolidated financial statements.
29
VICON INDUSTRIES, INC. AND SUBSIDIARIESNOTES TO CONSOLIDATED FINANCIAL STATEMENTS
Years Ended September 30, 2015 and 2014
NOTE 1. Summary of Significant Accounting Policies
Nature of Business
The Company designs, assembles and markets video management systems and system components for use in security, surveillance, safety and control purposes by end users. The Company markets its products worldwide primarily to installing dealers, systems integrators, government entities and distributors.
Basis of Presentation
The accompanying consolidated financial statements include the accounts of Vicon Industries, Inc. (the Company) and its wholly owned subsidiaries: IQinVision, Inc., Vicon Industries Limited and subsidiary (Vicon Deutschland GmbH) and TeleSite U.S.A., Inc. and subsidiary (Vicon Systems Ltd.), after elimination of intercompany accounts and transactions.
Revenue Recognition
Revenue is generally recognized when products are sold and title is passed to the customer. Advance service billings are deferred and recognized as revenues on a pro rata basis over the term of the service agreement. Pursuant to Financial Accounting Standards Board (FASB) Accounting Standards Codification (ASC) 605-25-05, the Company evaluates multiple-element revenue arrangements for separate units of accounting, and follows appropriate revenue recognition policies for each separate unit. Elements are considered separate units of accounting provided that (i) the delivered item has stand-alone value to the customer, (ii) there is objective and reliable evidence of the fair value of the undelivered item, and (iii) if a general right of return exists relative to the delivered item, delivery or performance of the undelivered item is considered probable and substantially within the control of the Company. As applied to the Company, under arrangements involving the sale of product and the provision of services, product sales are recognized as revenue when the products are sold and title is passed to the customer, and service revenue is recognized as services are performed.
For products that include software and for separate licenses of the Company’s software products, the Company recognizes revenue in accordance with the provisions of FASB Accounting Standards Update (ASU) 2009-13, “Revenue Recognition (Topic 605) — Multiple-Deliverable Revenue Arrangements” (ASU 2009-13). ASU 2009-13 provides revenue recognition guidance for establishing separate units of accounting in a multiple element arrangement and requires the allocation of arrangement consideration to each deliverable in the arrangement based on the fair value of the elements. The fair value for each deliverable is based on vendor-specific objective evidence ("VSOE") if available, third-party evidence ("TPE") if VSOE is not available, or best estimate of selling price ("BESP") if neither VSOE nor TPE is available. BESP must be determined in a manner that is consistent with that used to determine the price to sell the specific elements on a standalone basis.
Cash and Cash Equivalents
Cash and cash equivalents include cash on deposit and amounts invested in highly liquid money market funds.
Marketable Securities
At September 30, 2015, marketable securities consisted of mutual fund investments principally in federal, state and local government debt securities of $13,047. Such mutual fund investments are stated at market value based on quoted market prices (Level 1 inputs) and are classified as available-for-sale under ASC 320, with cumulative unrealized gains and losses reported in accumulated other comprehensive loss as a component of shareholders’ equity. The cost of such securities was $13,355 and $123,516 at September 30, 2015 and 2014, respectively, with $(308) and $(3,206) of cumulative unrealized losses, net of tax where applicable, included in the carrying amounts at September 30, 2015 and 2014, respectively.
Allowances for Doubtful Accounts
The Company maintains allowances for doubtful accounts for estimated losses resulting from the inability of its customers to make required payments. If the financial condition of its customers were to deteriorate, resulting in an impairment of their ability to make payments, additional allowances may be required.
30
Inventories
Inventories are valued at the lower of cost (on a moving average basis which approximates a first-in, first-out method) or market. When it is determined that a product or product line will be sold below carrying cost, affected on hand inventories are written down to their estimated net realizable values.
Assets Held for Sale
At September 30, 2014, the Company had classified both its New York headquarters and United Kingdom based operating facilities as assets held for sale. The carrying values of these facilities approximated $3,325,000 and $800,902, respectively, at September 30, 2014. The Company sold its New York headquarters during fiscal 2015, while its United Kingdom facility remained unsold as of September 30, 2015. Such remaining facility is presently in contract to be sold sometime in January 2016 and recorded as assets held for sale as of September 30, 2015.
Long-Lived and Intangible Assets
Long-lived assets include reported property, plant, and equipment and intangible assets. The Company reviews its long-lived assets for impairment whenever events or circumstances indicate that the carrying amount of an asset may not be recoverable. If the sum of the expected cash flows, undiscounted and without interest, is less than the carrying amount of the asset, an impairment loss is recognized as the amount by which the carrying amount of the asset exceeds its fair value. There was no impairment of long-lived assets for the years ended September 30, 2015 and 2014.
Property, plant, and equipment are recorded at cost and are being depreciated over periods ranging from 2 to 10 years. Depreciation expense was $725,365 and $434,533 for the years ended September 30, 2015 and 2014, respectively, and was calculated on a straight-line basis over the estimated useful lives of the assets.
Goodwill
The Company’s goodwill represents the excess of the purchase price over the fair value of net identifiable assets acquired in the 2014 business combination with IQinVision. Goodwill is not amortized and is tested for impairment on an annual basis. When evaluating goodwill for impairment, the Company may first perform an assessment of qualitative factors to determine if the fair value of the reporting unit is more-likely-than-not greater than its carrying amount. If, based on the review of the qualitative factors, the Company determines it is not more-likely-than-not that the fair value of a reporting unit is less than its carrying value, the required two-step impairment test can be bypassed. If the Company does not perform a qualitative assessment or if the fair value of the reporting unit is not more-likely-than-not greater than its carrying value, the Company must perform the first step of the two-step impairment test, and calculate the estimated fair value of the reporting unit. If the carrying value of goodwill exceeds the estimated fair value, there is an indication that impairment may exist and the second step must be performed to measure the amount of impairment loss. The amount of impairment for goodwill is measured as the excess of its carrying amount over its fair value.
Engineering and Development
Product engineering and development costs are charged to expense as incurred, and amounted to $5,063,010 and $4,595,545 in fiscal 2015 and 2014, respectively. The Company evaluates the establishment of technological feasibility of its software in accordance with ASC 985 ("Accounting for the Costs of Computer Software to be Sold, Leased or Otherwise Marketed"). The Company has determined that technological feasibility for its new products is reached shortly before products are released for field testing. Costs incurred after technological feasibility has been established have not been material and are expensed as incurred.
Earnings Per Share
Basic EPS is computed based on the weighted average number of common shares outstanding. Diluted EPS reflects the maximum dilution that would have resulted from the exercise of stock options, warrants and incremental shares issuable under a deferred compensation agreement (see Note 7). In periods when losses are incurred, the effects of these securities are antidilutive and, therefore, are excluded from the computation of diluted EPS.
Foreign Currency Translation
The Company translates the financial statements of its foreign subsidiaries by applying the current rate method under which assets and liabilities are translated at the exchange rate on the balance sheet date, while revenues, costs, and expenses are translated at
31
the average exchange rate for the reporting period. The resulting cumulative translation adjustment of $(276,998) and $(110,286) at September 30, 2015 and 2014, respectively, is recorded as a component of shareholders' equity in accumulated other comprehensive loss.
Income Taxes
The Company accounts for income taxes under the provisions of ASC 740 ("Accounting for Income Taxes"), which requires recognition of deferred tax liabilities and assets for the expected future tax consequences of events that have been included in the financial statements or tax returns. Under this method, deferred tax assets and liabilities are determined based on the difference between the financial statement and tax bases of assets and liabilities using enacted tax rates in effect for the year in which the differences are expected to reverse. Deferred U.S. income taxes are not provided on undistributed earnings of foreign subsidiaries as the Company presently intends to reinvest such earnings indefinitely, and any plan to repatriate any of such earnings in the future is not expected to result in a material incremental tax liability to the Company. The Company provides for a valuation allowance against its entire net deferred tax asset balance due to the uncertainty of future realization (see Note 3 for further discussion).
The Company accrues liabilities for identified tax contingencies that result from positions that are being challenged or could be challenged by tax authorities. The Company believes that its accrual for tax liabilities is adequate for all open years, based on Management’s assessment of many factors, including its interpretations of the tax law and judgments about potential actions by tax authorities. However, it is possible that the ultimate resolution of any tax audit may be materially greater or lower than the amount accrued.
Product Warranties
The Company provides for the estimated cost of product warranties at the time revenue is recognized. While the Company engages in product quality programs and processes, including monitoring and evaluating the quality of its component suppliers, its warranty obligation is affected by product failure rates, material usage and service delivery costs incurred in correcting a product failure. Should actual product failure rates, material usage or service delivery costs differ from its estimates, revisions to the estimated warranty liability may be required.
Changes in the Company's warranty liability (included in accrued expenses) for the fiscal years ended September 30, 2015 and 2014 were as follows:
2015 2014Balance at beginning of year $ 849,000 $ 411,000Provision for warranties 171,000 207,000Provision assumed in IQinVision business combination — 488,000Expenses incurred (370,000) (257,000)Balance at end of year $ 650,000 $ 849,000
Fair Value of Financial Instruments
The majority of the Company’s non-financial assets and liabilities are not required to be carried at fair value on a recurring basis, but the Company is required on a non-recurring basis to use fair value measurements when analyzing asset impairment as it relates to long-lived assets. The carrying amounts for trade accounts, other receivables and accounts payable approximate fair value due to the short-term maturity of these instruments.
Fair value estimates are made at a specific point in time based on relevant market information about the financial instrument. These estimates are subjective in nature and involve uncertainties and matters of significant judgment and, therefore, cannot be determined with precision. Changes in assumptions could significantly affect the estimates.
Accounting for Stock-Based Compensation
The Company follows ASC 718 (“Share-Based Payment”), which requires that all share based payments to employees, including stock options, stock appreciation rights (SARs) and common stock share awards, be recognized as compensation expense in the consolidated financial statements based on their fair values and over the requisite service period. For the years ended September 30,
32
2015 and 2014, the Company recorded non-cash compensation expense of $625,061 ($.07 per basic and diluted share) and $154,749 ($.03 per basic and diluted share), respectively, relating to stock-based compensation.
The fair value for options granted during the fiscal years ended September 30, 2015 and 2014 was determined at the date of grant using a Black-Scholes valuation model and the straight-line attribution approach using the following weighted average assumptions:
2015 2014Risk-free interest rate 2.1% 2.3%Dividend yield 0.0% 0.0%Volatility factor 63.7% 60.3%Weighted average expected life 7.0 years 7.5 years
The fair value for options and SARs assumed on August 29, 2014 pursuant to the IQinVision business combination (see Note 10) was determined at the date of assumption using a Black-Scholes valuation model and the straight-line attribution approach using the following weighted average assumptions:
Risk-free interest rate 0.6%Dividend yield 0.0%Volatility factor 74.4%Weighted average expected life 2.3 years
The risk-free interest rate used in the Black-Scholes valuation method is based on the implied yield currently available in U.S. Treasury securities at maturity with an equivalent term. Other than a one-time special dividend paid in connection with the IQinVision Merger, the Company never declared or paid any cash dividends and does not currently expect to do so in the future. Expected volatility is based on the annualized daily historical volatility of the Company’s stock over a representative period. The weighted-average expected life represents the period over which stock-based awards are expected to be outstanding and was determined based on a number of factors, including historical weighted average and projected holding periods for the remaining unexercised shares, the contractual terms of the Company’s stock-based awards, vesting schedules and expectations of future employee behavior.
The Black-Scholes option valuation model was developed for use in estimating the fair value of traded options which have no vesting restrictions and are fully transferable. In addition, option valuation models require the input of highly subjective assumptions including the expected stock price volatility. Because the Company's employee stock options and SARs have characteristics significantly different from traded options, and because changes in the subjective input assumptions can materially affect the fair value estimate, in management's opinion, the existing models do not necessarily provide a reliable single measure of the fair value of its employee stock options and SARs.
Restructuring
Accounting for restructuring activities, as compared to regular operating cost management activities, requires an evaluation of formally committed and approved plans. Restructuring activities have comparatively greater strategic significance and materiality and may involve exit activities, whereas regular cost containment activities are more tactical in nature and are rarely characterized by formal and integrated action plans or exiting a particular product, facility or service.
Use of Estimates
The preparation of financial statements in conformity with generally accepted accounting principles requires management to make estimates and assumptions that affect the reported amounts of assets and liabilities, and disclosure of contingent assets and liabilities at the date of the financial statements, and the reported amounts of revenues and expenses during the reporting period. Such estimates include, but are not limited to, provisions for doubtful accounts receivable, net realizable value of inventory, warranty obligations, income tax accruals, deferred tax valuation and assessments of the recoverability of the Company’s long-lived and intangible assets. Actual results could differ from those estimates. Reclassifications
Certain prior year amounts have been reclassified to conform to current year presentation.
33
NOTE 2. Goodwill and Intangible Assets
The Company’s goodwill represents the excess of the purchase price over the fair value of net identifiable assets acquired in the August 29, 2014 IQinVision business combination (see Note 10). Goodwill is not amortized and is tested for impairment on an annual basis during the Company's fourth quarter, or more frequently if circumstances indicate impairment might exist. Goodwill is evaluated for impairment through the comparison of fair value of reporting units to their carrying values. When evaluating goodwill for impairment, the Company may first perform an assessment of qualitative factors to determine if the fair value of the reporting unit is more-likely-than-not greater than its carrying amount. This qualitative assessment is referred to as a "step zero" approach. If, based on the review of the qualitative factors, the Company determines it is not more-likely-than-not that the fair value of a reporting unit is less than its carrying value, the required two-step impairment test can be bypassed. If the Company does not perform a qualitative assessment or if the fair value of the reporting unit is not more-likely-than-not greater than its carrying value, the Company must perform the first step of the two-step impairment test, and calculate the estimated fair value of the reporting unit. If the carrying value of goodwill exceeds the estimated fair value, there is an indication that impairment may exist and the second step must be performed to measure the amount of impairment.
The amount of impairment is determined by comparing the implied fair value of the reporting unit goodwill to the carrying value of the goodwill in the same manner as if the reporting unit was being acquired in a business combination. If the implied fair value of goodwill is less than the recorded goodwill, an impairment loss for the difference would be recorded. In considering the step zero approach to testing goodwill for impairment, a qualitative analysis is performed evaluating factors including, but not limited to, macro-economic conditions, market and industry conditions, internal cost factors, competitive environment, share price fluctuations, results of past impairment tests, and the operational stability and the overall financial performance of the reporting units. At September 30, 2015, the Company conducted its annual Step 1 impairment test using the income approach and found no impairment that would require a remeasurement of the $6.0 million recorded goodwill valuation.
The components and estimated useful lives of intangible assets as of September 30, 2015 and 2014 are stated below. Amortization is provided on a straight line method, or in the case of customer relationships, on an accelerated method, over the following estimated useful lives:
September 30, 2015 September 30, 2014Gross
AmountAccumulatedAmortization
Gross Amount
Accumulated Amortization
EstimatedUseful Life
Definite-lived intangibles: Technology $ 2,500,000 $ 270,833 $ 2,500,000 $ 20,833 10 years Customer relationships 910,000 148,833 910,000 10,833 7 years Tradenames 660,000 47,667 660,000 3,667 15 years
$ 4,070,000 $ 467,333 $ 4,070,000 $ 35,333
The activity in the goodwill balance consists of the following:
Balance at October 1, 2013 —Acquisition of IQinVision 6,016,469Balance at September 30, 2014 6,016,469Changes in Goodwill —Balance at September 30, 2015 $ 6,016,469
34
Amortization expense related to intangible assets for the year ended September 30, 2015 and 2014 was $432,000 and $35,333, respectively. Annual amortization expense for intangible assets over the next five years ending September 30 and thereafter is summarized as follows:
Fiscal Year Amount2016 $ 517,0002017 518,0002018 427,0002019 373,0002020 341,000Thereafter 1,426,667
NOTE 3. Income Taxes
No income tax benefit was recognized on losses reported for the years presented due to uncertainty of realization. In fiscal 2011, the Company provided a valuation allowance against its deferred tax assets due to the uncertainty of future realization and, thus, no tax benefit has been recognized on subsequent reported pretax losses.
A reconciliation of the U.S. statutory tax rate to the Company’s effective tax rate follows:
2015 2014Amount Percent Amount Percent
U.S. statutory tax $ (1,774,000) (34.0)% $ (2,695,000) (34.1)%Increase in valuation allowance 1,420,000 27.2 2,144,000 27.1Foreign tax rate differences 281,000 5.4 303,000 3.8Permanent differences 53,000 1.0 349,000 4.4State tax, net of federal benefit (105,000) (2.0) (141,000) (1.8)Other, net 125,000 2.4 40,000 0.5
Effective tax rate $ — — % $ — — %
35
The tax effects of temporary differences that give rise to deferred tax assets and liabilities at September 30, 2015 and 2014 are presented below:
2015 2014Deferred tax assets:
Inventories $ 1,627,000 $ 1,740,000Accrued compensation 753,000 763,000Warranty accrual 244,000 306,000Depreciation 115,000 145,000Allowance for doubtful accounts receivable 342,000 471,000Unearned revenue 346,000 170,000U.S. net operating loss carryforwards 5,383,000 4,253,000Foreign net operating loss carryforwards 1,575,000 1,434,000Tax credits 989,000 989,000Other 590,000 407,000
Deferred tax assets and liabilities are recognized based on the differences between the financial statement carrying amounts and the tax basis of assets and liabilities. Deferred tax assets represent items to be used as a tax deduction or credit in future tax returns for which a tax benefit has been recorded in the income statement. As of September 30, 2015, there were no undistributed earnings of foreign subsidiaries.
The Company provides for a valuation allowance against its deferred tax assets due to the uncertainty of future realization. The full valuation allowance is determined to be appropriate due to the Company's operating losses since fiscal year 2010 and the inherent uncertainties of predicting future operating results in periods over which such net tax differences become deductible.
Pretax domestic loss amounted to approximately $(3,947,000) and ($5,714,000) in fiscal years 2015 and 2014, respectively. Pretax foreign loss amounted to approximately ($1,271,000) and ($2,211,000) in fiscal years 2015 and 2014, respectively. The Company has U.S. and foreign net operating loss carryforwards (NOLs) of approximately $14.5 million and $6.9 million, respectively, available to offset future taxable income. Such NOLs can be carried forward over periods through September 30, 2035 in the U.S. and indefinitely in foreign jurisdictions. On August 29, 2014, the Company merged with IQinVision, Inc. (see Note 10). In connection with this merger, the Company's ability to utilize pre-merger net operating losses and tax credit carryforwards in the future is subject to certain limitations pursuant to Section 382 of the Internal Revenue Code. No determination has been made at this time as to the occurrence of a Section 382 change in ownership. However, in such event, the annual limitation on utilization of the Company's U.S. net operating loss carryforwards is presently estimated at $500,000 based on a preliminary entity valuation.
36
The Company follows the provisions of ASC 740 as it relates to uncertain tax positions. Unrecognized tax benefits activity for the years ended September 30, 2015 and 2014 is summarized below:
2015 2014
Beginning balance $ 45,000 $ 45,000
Additions (reductions) based on tax positions related to prior years — —
Additions (reductions) based on tax positions related to the current year — —
Ending balance $ 45,000 $ 45,000
The Company recognizes potential accrued interest and penalties related to unrecognized tax benefits in income tax expense. At September 30, 2015 and 2014, there was no accrued net interest and penalties related to tax positions taken or to be taken on the Company’s tax returns and recorded as part of the reserves for uncertain tax positions. The Company files U.S. Federal and State income tax returns and foreign tax returns in the United Kingdom, Germany and Israel. The Company is generally no longer subject to tax examinations for fiscal years prior to 2011 in the U.S. and 2009 in the U.K., Germany and Israel.
NOTE 4. Accumulated Other Comprehensive Loss
The accumulated other comprehensive loss balances at September 30, 2015 and 2014 consisted of the following:
2015 2014Foreign currency translation adjustment $ (276,998) $ (110,286)Unrealized loss on marketable securities (308) (3,206)Accumulated other comprehensive loss $ (277,306) $ (113,492)
NOTE 5. Segment and Geographic Information
The Company operates in one business segment which encompasses the design, assembly and marketing of video management systems and system components for the electronic protection segment of the security industry. Its U.S. based operations consist of Vicon Industries, Inc., the Company’s corporate headquarters and principal operating entity and its IQinVision, Inc. subsidiary. Its Europe-based operation consists of Vicon Industries Limited, which markets and distributes the Company’s products principally within Europe and the Middle East.
Net sales and long-lived assets related to operations in the United States and other foreign countries for the fiscal years ended September 30, 2015 and 2014 are as follows:
2015 2014Net sales
U.S. $ 35,696,491 $ 24,320,059Foreign 9,187,524 10,558,350
Total $ 44,884,015 $ 34,878,409Long-lived assets
U.S. $ 10,201,358 $ 10,738,673Foreign 112,725 182,151
Total $ 10,314,083 $ 10,920,824
U.S. sales include $3,426,346 and $4,456,916 for export in fiscal years 2015 and 2014, respectively. Foreign sales principally represent sales from the Company’s Europe based subsidiaries.
37
NOTE 6. Long-Term Equity Incentive Plans
The Company maintains stock incentive plans that provide for the grant of incentive and non-qualified options, stock appreciation rights ("SARs") and common stock awards covering a total of 1,344,238 shares of common stock reserved for issuance to key employees, including officers and directors, as of September 30, 2015. In connection with the IQinVision business combination, the Company assumed a total of 379,834 stock options and 262,586 SARs along with related 2001 and 2011 Stock Incentive Plan provisions. All options and SARs are issued at fair market value at the grant date and are exercisable in varying installments according to the plans. SARs provide the holder the right to receive, upon exercise, the excess of the exercise date fair market value over the grant date fair market value of a share of the Company's common stock in the form of equivalent shares of common stock at market value, cash or a combination of both. The plans allow for the payment of option exercises through the surrender of previously owned mature shares based on the fair market value of such shares at the date of surrender. Such surrendering of mature shares by holders results in an increase to treasury stock based on the stock price on date of surrender. There were 167,581 options and SARs available for grant under these plans at September 30, 2015.
Changes in outstanding stock options for the two years ended September 30, 2015 are as follows:
Numberof Options
WeightedAverageExercise
Price
WeightedAverage
RemainingContractual
Term(in years)
AggregateIntrinsic
ValueOutstanding at September 30, 2013 454,000 $4.32 Options assumed in IQinVision business combination 379,834 $2.40Options granted 15,000 $2.62 Options exercised — — Options forfeited (85,000) $3.81 Outstanding at September 30, 2014 763,834 $4.31Options granted 123,000 $1.49 Options exercised (110,127) $0.44 Options forfeited (236,939) $3.56 Outstanding at September 30, 2015 539,768 $3.36 5.5 $25,029Exercisable at September 30, 2015 374,038 $4.00 4.1 $13,699
The weighted-average grant date fair value of options granted during the years ended September 30, 2015 and 2014 was $0.94 and $2.06, respectively. As of September 30, 2015, there was $143,022 of total unrecognized compensation cost, net of estimated forfeitures, related to nonvested stock options, which is expected to be recognized over a weighted-average period of 1.4 years.
38
Changes in outstanding SARs for the two years ended September 30, 2015 are as follows:
Numberof SARs
WeightedAverage
BasePrice
WeightedAverage
RemainingContractual
Term(in years)
AggregateIntrinsic
ValueOutstanding at September 30, 2013 — —SARs assumed in IQinVision business combination 262,586 $3.11SARs granted — —SARs exercised — —SARs forfeited — —Outstanding at September 30, 2014 262,586 $3.11SARs granted — —SARs exercised — —SARs forfeited (161,592) $3.15Outstanding at September 30, 2015 100,994 $3.05 .5 —Exercisable at September 30, 2015 112,357 $3.06 .5 —
The weighted-average grant date fair value of SARs assumed in the IQinVision business combination was $1.05. As of September 30, 2015, there was $3,273 of total unrecognized compensation cost, net of estimated forfeitures, related to nonvested SARs, which is expected to be recognized over a weighted-average period of 0.5 years.
On September 10, 2014, the Company entered into a Stock Agreement with its Chief Executive Officer whereby he is eligible to receive up to 600,000 restricted shares of the Company’s common stock (the “Shares”) in four equal installments on each of the first four anniversaries of his employment commencement date, so long as he is then employed by the Company. Notwithstanding the foregoing, 50,000 of the Shares otherwise issuable on the first anniversary of the commencement date were issued to him upon the Company’s Board of Directors’ approval of a restructuring plan for fiscal year 2015. An additional 100,000 of the Shares were issued in October 2015 following the one year anniversary of employment. The fair value of this award was $2.0 million based upon the market value of Company common stock at the date of grant. As of September 30, 2015, there was approximately $1.5 million of total unrecognized compensation cost related to this award, which is expected to be recognized over the four year vesting period.
39
NOTE 7. Loss Per Share
The following table provides the components of the basic and diluted loss per share (EPS) computations:
2015 2014Basic EPS ComputationNet loss $ (5,218,302) $ (7,925,412)Weighted average shares outstanding 9,152,509 4,918,720Basic loss per share $ (.57) $ (1.61)
Diluted EPS ComputationNet loss $ (5,218,302) $ (7,925,412)Weighted average shares outstanding 9,152,509 4,918,720Stock options — —Stock compensation arrangements — —Diluted shares outstanding 9,152,509 4,918,720Diluted loss per share $ (.57) $ (1.61)
For fiscal years 2015 and 2014, all outstanding stock options and shares issuable under stock compensation arrangements totaling 657,082 and 1,042,740 shares, respectively, have been omitted from the calculation of diluted EPS as their effect would have been antidilutive. The actual effect of these stock options and shares, if any, on the diluted earnings per share calculation will vary significantly depending on fluctuations in the market price of the Company's stock.
NOTE 8. Commitments and Contingencies
The Company leases vehicles and occupies certain facilities under operating leases that expire at various dates through 2020. The leases, which cover periods from three to eight years, generally provide for renewal options at specified rental amounts. The aggregate operating lease commitment at September 30, 2015 was $1,880,000 with minimum rentals for the fiscal years shown as follows: 2016 - $611,000; 2017 - $514,000; 2018 - $378,000; 2019 - $312,000; and 2020 - $65,000. Rent expense for fiscal 2015 and 2014 was approximately $415,000 and $43,000, respectively.
The Company is a party to employment agreements with certain of its officers that provide for, among other things, the payment of compensation if there is a change in control without Board of Director approval (as defined in the agreements). The contingent liability under such change in control provisions at September 30, 2015 would have been approximately $1.6 million. Certain of the Company’s employment agreements with its officers provide for a severance/retirement benefit upon certain occurrences or at a specified date of retirement, absent a change in control, aggregating $1.0 million at September 30, 2015. The Company is amortizing such obligation to expense on the straight-line method through the specified dates of retirement. Such expense amounted to approximately $50,000 and $65,000 in fiscal 2015 and 2014, respectively. In addition, at September 30, 2015, the Company was obligated to pay $234,000 of severance liabilities to former officers pursuant to separation of services agreements.
The Company has agreements with certain of its officers to provide a deferred compensation benefit in the form of 16,320 shares of common stock. Such shares vest upon retirement or earlier under certain occurrences including death, involuntary termination or a change in control of the Company. The market value of such shares approximated $63,000 at the dates of grant, which is being amortized on the straight-line method through the specified dates of retirement.
NOTE 9. Headquarters Facility Sale
In November 2014, the Company entered into a contract for the sale of its former headquarters facility in Edgewood (Brentwood), New York at a gross sale price of $3.5 million, which was included in assets held for sale as of September 30, 2014 in the accompanying consolidated balance sheets. The resulting loss on this sale of approximately $52,000 has been reflected in the accompanying consolidated statement of operations for 2014 after factoring in selling and transaction costs. In March 2015, the Company closed on the sale, receiving net proceeds of approximately $3.3 million.
40
NOTE 10. Business Combination
On August 29, 2014, the Company merged with IQinVision, Inc. (“IQinVision”), a California corporation, with IQinVision surviving as a wholly owned subsidiary of the Company (the “Merger”). In connection with the Merger, the Company issued 4,522,335 shares of its common stock to IQinVision shareholders, which represented 50% of the Company’s outstanding common stock at the date of the Merger. In addition, the Company assumed a total of 642,420 of IQinVision stock options and stock appreciation rights along with related 2001 and 2011 Stock Incentive Plan provisions at the date of merger. The number and exercise prices of these equity instruments assumed were proportionately determined in accordance with a specified common stock exchange formula as to number and exercise price. The purchase price of the business combination at the date of closing was $14.9 million, consisting of 4,522,335 shares of Vicon common stock valued at $14.2 million on the date of issuance and assumed IQinVision stock options and stock appreciation rights valued at $723,000 in accordance with Financial Accounting Standards Board ASC 718. In connection with the Merger, the Company incurred $1.1 million of transaction and other merger related costs that were expensed in 2014 and, on September 12, 2014, paid a special cash dividend of $0.55 per share ($2.5 million in the aggregate) to Company shareholders of record as of July 11, 2014.
The Merger has been accounted for using the acquisition method of accounting and the Company has been treated as the acquirer for accounting purposes. This determination was made in accordance with the applicable accounting guidance based upon numerous factors including, but not limited to, the relative ownership of the combined company by the Company and former IQinVision shareholders, the composition of the management team and board of directors of the combined company, the structure of the Merger in which IQinVision became a wholly owned subsidiary of the Company, the location of the corporate offices of the combined company, and the continued listing of the Company’s common stock on the NYSE MKT.
The table below details the consideration transferred to acquire IQinVision:
ConversionCalculation
EstimatedFair Value
Vicon Industries, Inc. shares of common stock issued at merger 4,522,335Per share price (ex-dividend) of Vicon Industries, Inc. common stock at August 29, 2014 $ 3.13 $ 14,154,909Estimated fair value of vested IQinVision Stock Options assumed (1) 570,873Estimated fair value of vested IQinVision SAR's assumed (1) 152,199Estimated purchase price consideration $ 14,877,981
(1) The fair value was determined using the Black-Scholes valuation model. Assumptions used are the same as those for acquired awards as disclosed in Note 1 of Notes to Consolidated Financial Statements.
The transaction has been accounted for using the acquisition method of accounting which requires that assets acquired and liabilities assumed be recognized at their fair values as of the acquisition date. The following table summarizes the allocation of the purchase price as of the acquisition date:
August 29, 2014Fair value of net assets acquired $ 4,791,512Intangible assets 4,070,000Goodwill 6,016,469Net assets acquired $ 14,877,981
Critical estimates in valuing certain intangible assets include but are not limited to estimating future expected cash flows from assets acquired and determining discount rates. Management’s estimates of fair value are based upon assumptions believed to be reasonable, but which are inherently uncertain and unpredictable and, as a result, actual results may differ from estimates. Estimates associated with the accounting for the acquisition may change as additional information becomes available.
The goodwill recognized is attributable primarily to expected synergies and other benefits that the Company believes will result from combining the operations of IQinVision with the operations of the Company. The $6.0 million goodwill that was acquired is not expected to be deductible for income tax purposes.
41
NOTE 11. Restructuring Charges
Pursuant to the August 29, 2014 IQinVision merger, the Company initiated certain integration and restructuring activities pursuant to an approved plan (the "Plan"). The Company recognized $572,913 and $520,000 of severance charges in fiscal 2015 and 2014, respectively, in connection with the Plan pursuant to notification of termination benefits. The Company also recognized $519,000 of inventory provisions in fiscal 2014 related to the Plan.
Accounting for restructuring activities, as compared to regular operating cost management activities, requires an evaluation of formally committed and approved plans. Restructuring activities have comparatively greater strategic significance and materiality and may involve exit activities, whereas regular cost containment activities are more tactical in nature and are rarely characterized by formal and integrated action plans or exiting a particular product, facility or service.
Such restructuring amounts were reported in the Company's consolidated statement of operations for fiscal 2015 and 2014 as follows:
2015 2014Cost of goods sold — $ 519,000Operating expense 572,913 520,000Total restructuring charges $ 572,913 $ 1,039,000
NOTE 12: Recent Accounting Pronouncements
In May 2014, the FASB issued guidance on revenue from contracts with customers. The underlying principle is that an entity will recognize revenue to depict the transfer of goods or services to customers at an amount that the entity expects to be entitled to in exchange for those goods or services. The guidance provides a five-step analysis of transactions to determine when and how revenue is recognized. Other major provisions include capitalization of certain contract costs, consideration of time value of money in the transaction price, and allowing estimates of variable consideration to be recognized before contingencies are resolved, in certain circumstances. The guidance also requires enhanced disclosures regarding the nature, amount, timing and uncertainty of revenue and cash flows arising from an entity's contracts with customers. This guidance permits the use of either the retrospective or cumulative effect transition method and is effective for the Company beginning in 2019; early adoption is not permitted prior to 2018. The Company has not yet evaluated the impact of this guidance on the Company's financial condition, results of operations and related disclosures.
In August 2014, the FASB issued guidance on management's responsibility in evaluating whether there is substantial doubt about a company's ability to continue as a going concern and related footnote disclosures. Management will be required to evaluate, at each reporting period, whether there are conditions or events that raise substantial doubt about a company's ability to continue as a going concern within one year from the date the financial statements are issued. This guidance is effective prospectively for annual and interim reporting period beginning in 2017. The Company has not yet evaluated the impact of this guidance on the Company’s financial condition, results of operations and related disclosures.
42
SIGNATURES
Pursuant to the requirements of the Section 13 or 15(d) of the Securities Exchange Act of 1934, the registrant has duly caused this report to be signed on its behalf by the undersigned, thereunto duly authorized.
VICON INDUSTRIES, INC.
By /s/ Eric S. Fullerton By /s/ John M. BadkeEric S. Fullerton John M. BadkeChief Executive Officer Senior Vice President, Finance(Principal Executive Officer) and Chief Financial Officer
(Principal Financial and Accounting Officer)
December 29, 2015
Pursuant to the requirements of the Securities Exchange Act of 1934, this report has been signed below by the following persons in the capacities and on the dates indicated:
VICON INDUSTRIES, INC.
/s/ Julian A. Tiedemann December 29, 2015Julian A. Tiedemann Chairman of the Board of Directors Date
/s/ Joseph A. Budano December 29, 2015Joseph A. Budano Director Date
/s/ Eric S. Fullerton December 29, 2015Eric S. Fullerton Director Date /s/ Gioia Messinger December 29, 2015Gioia Messinger Director Date /s/ Arthur D. Roche December 29, 2015Arthur D. Roche Director Date


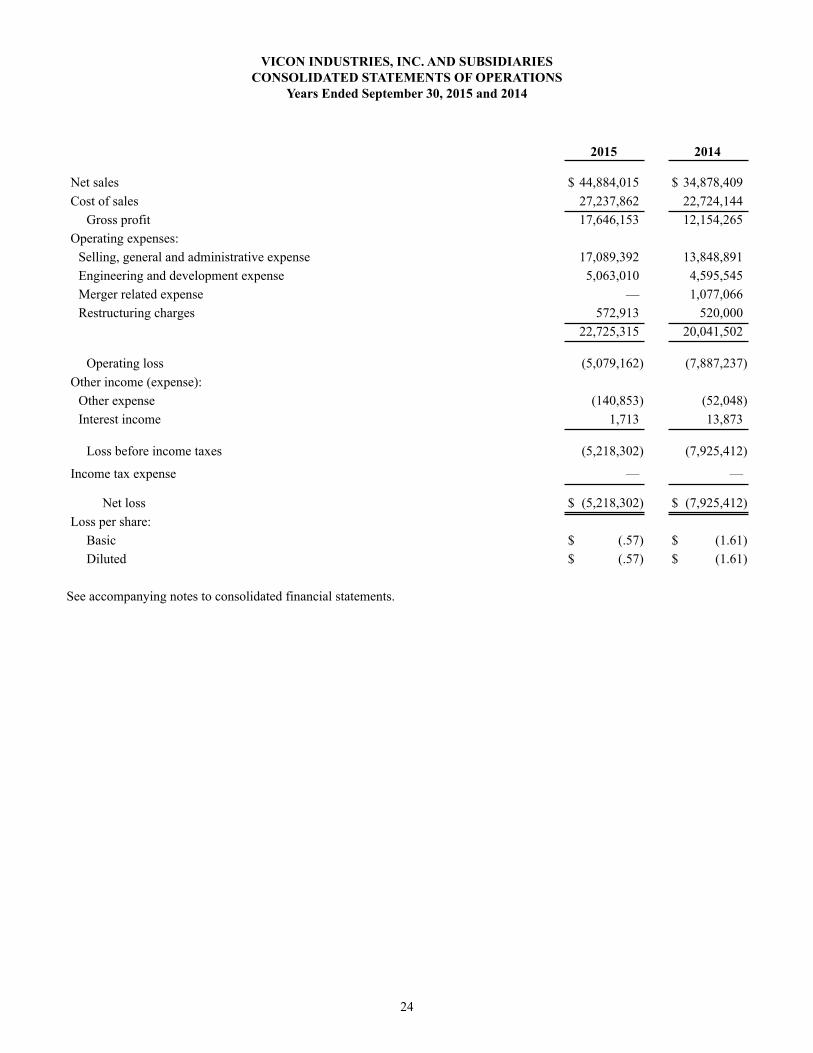


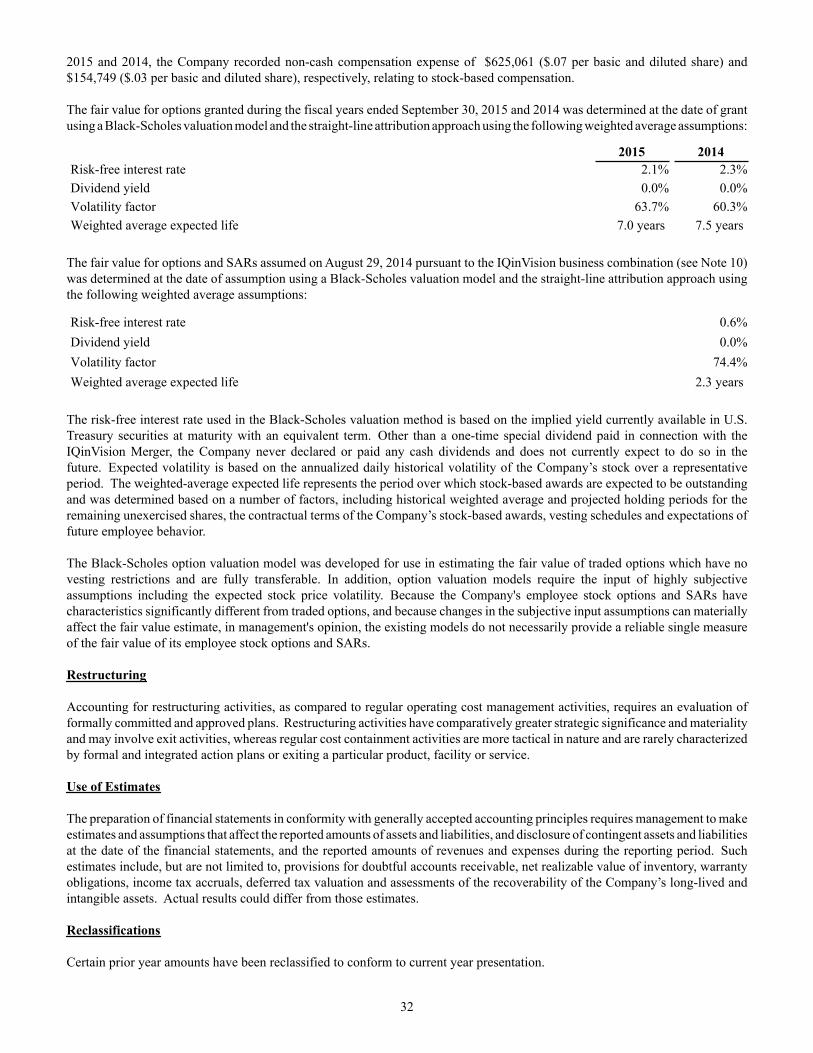

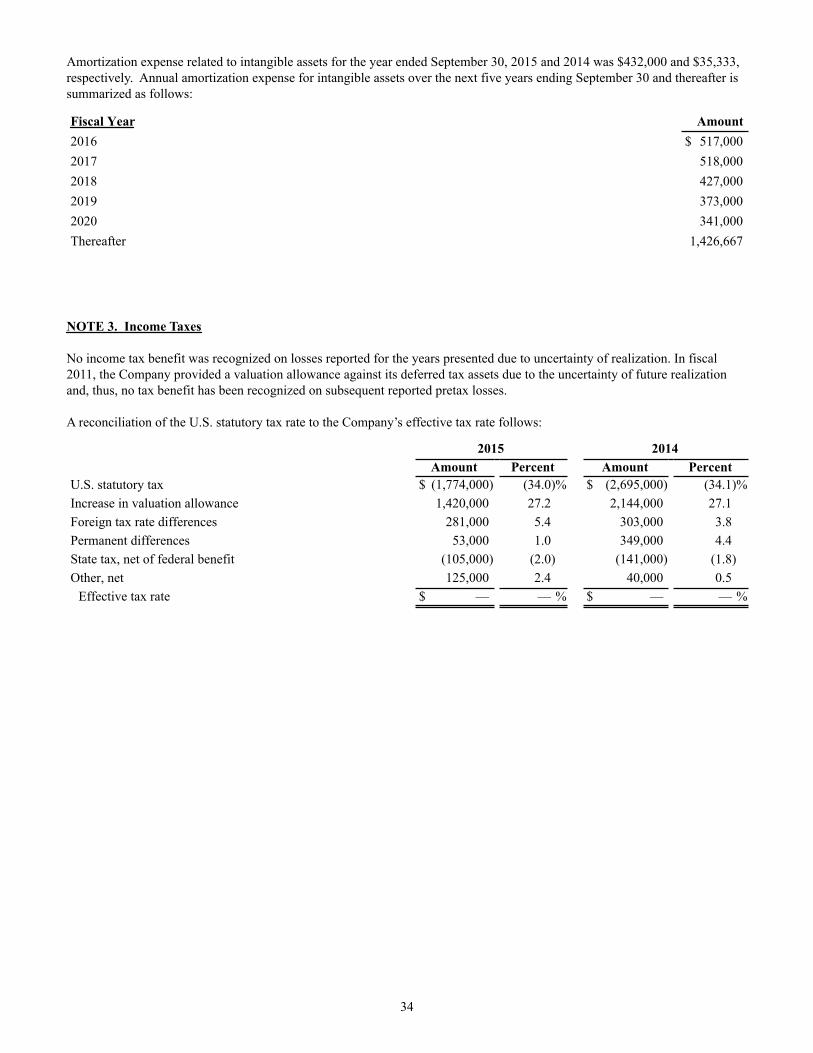
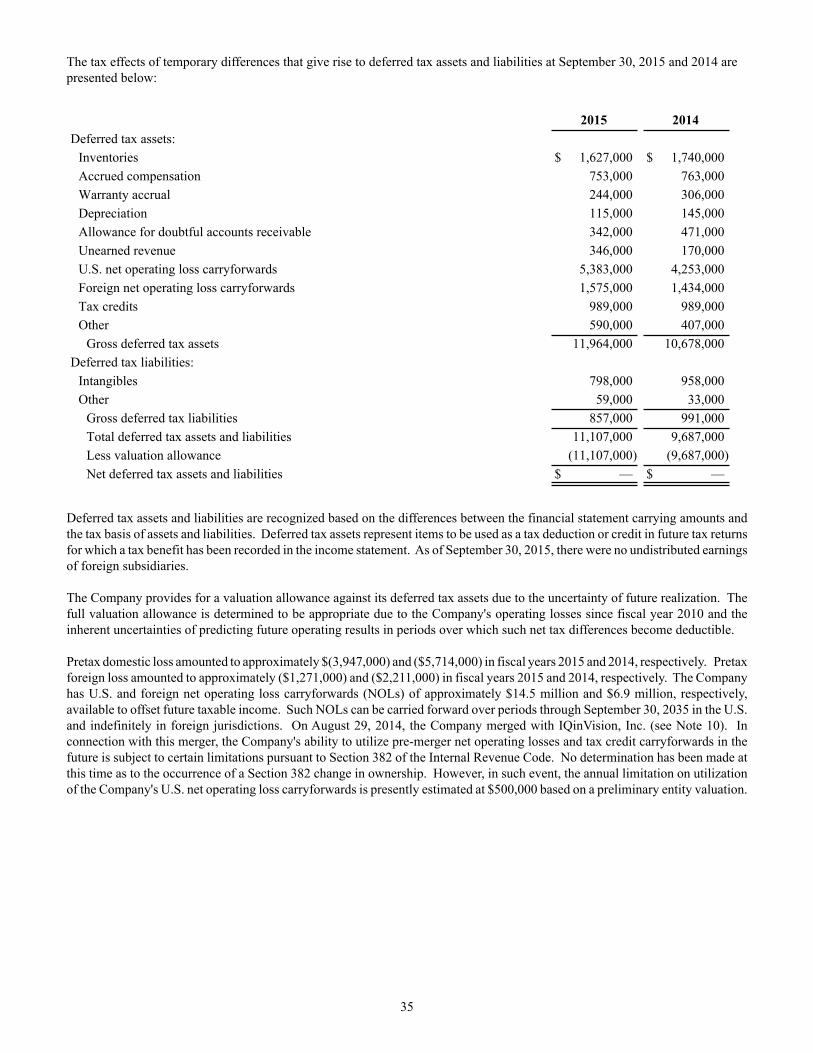


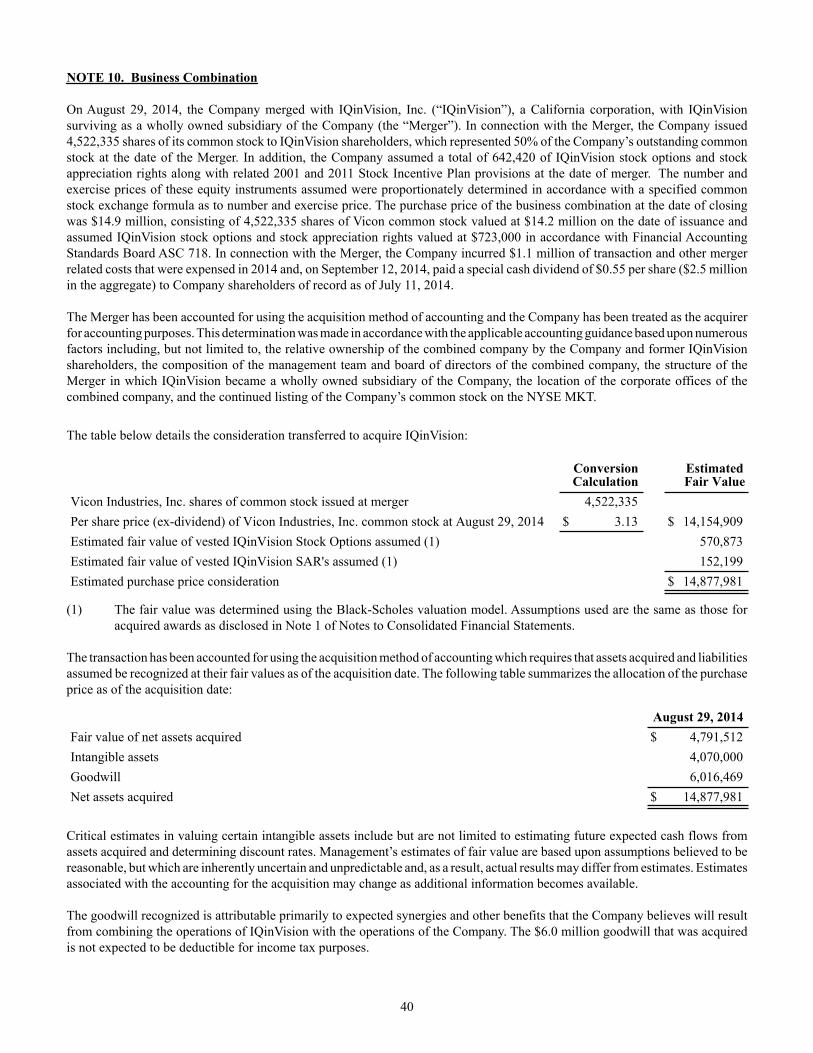
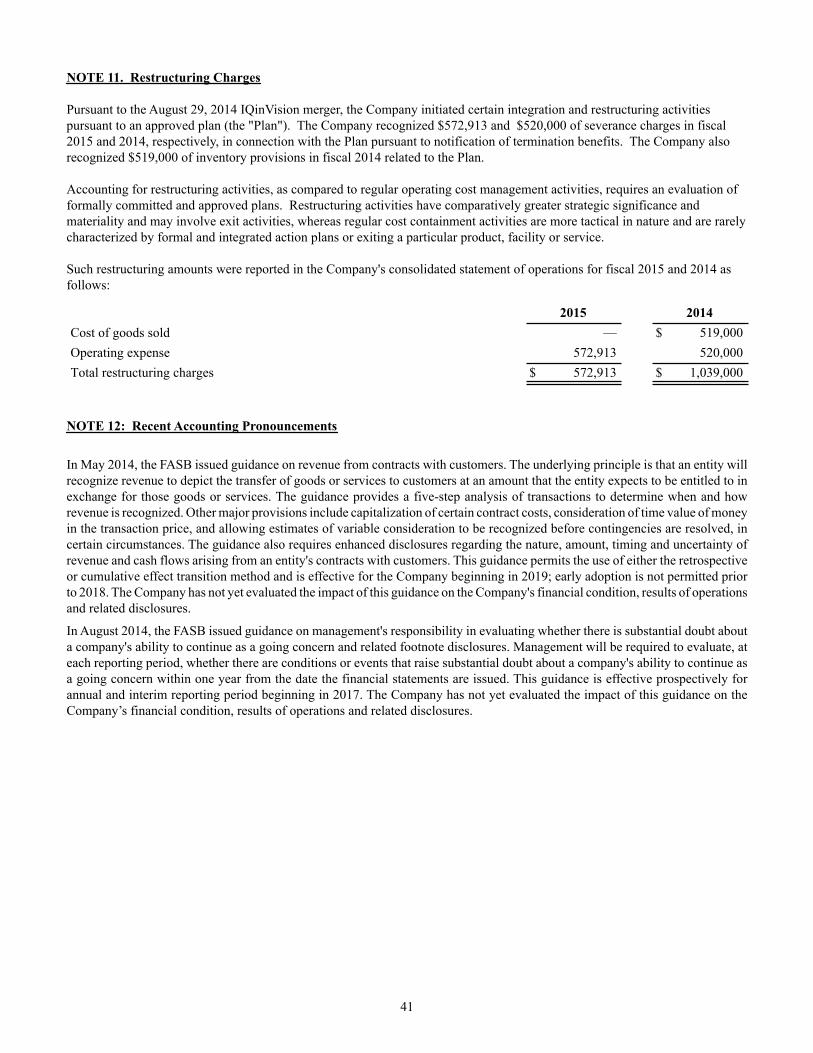
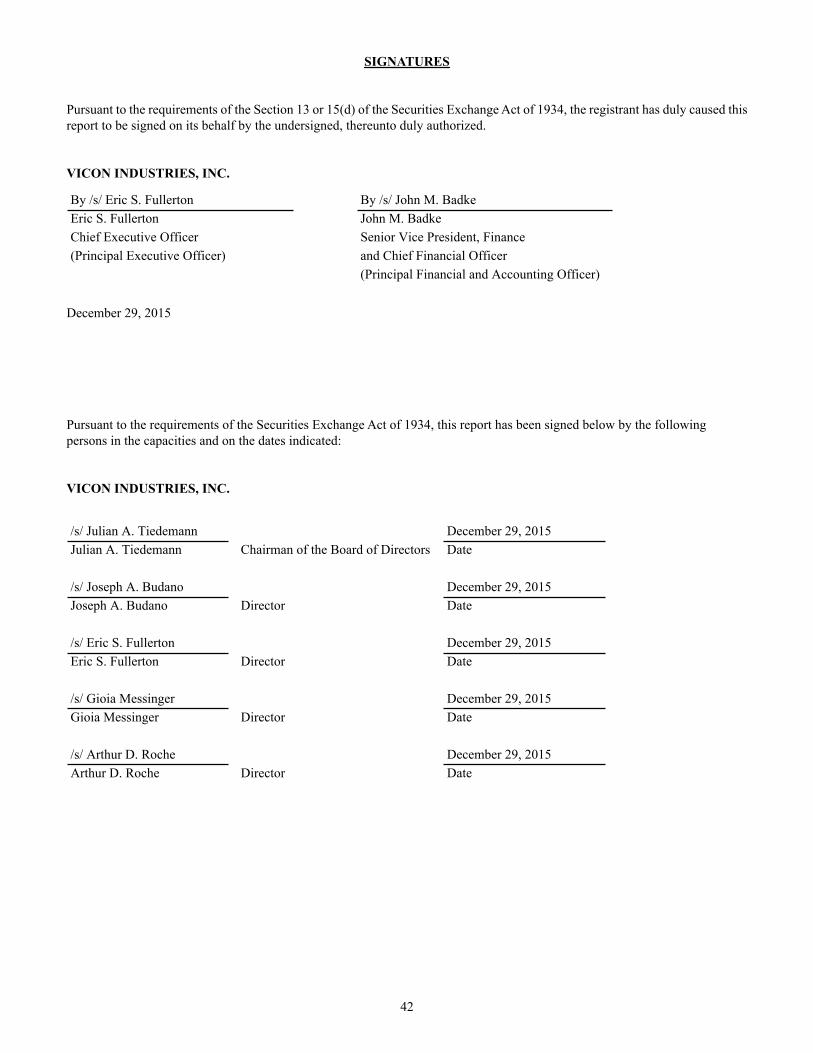


![FORM 10-K | X · 10/31/2015 · form 10-K or any amendment to this Form 10-K. [ ] Indicate by check mark whether the Registrant is a large accelerated filer, an accelerated filer,](https://static.documents.pub/doc/80x56/60014cbd90dc951b66396cda/form-10-k-x-10312015-form-10-k-or-any-amendment-to-this-form-10-k-indicate.jpg)


