UNITED STATES SECURITIES AND EXCHANGE COMMISSION Washington, DC 20549-1004 Form 10-K Í ANNUAL REPORT PURSUANT TO SECTION 13 OR 15(d) OF THE SECURITIES EXCHANGE ACT OF 1934 For the fiscal year ended December 31, 2016 OR ‘ TRANSITION REPORT PURSUANT TO SECTION 13 OR 15(d) OF THE SECURITIES EXCHANGE ACT OF 1934 For the transition period from to Commission file number 001-34960 GENERAL MOTORS COMPANY (Exact name of registrant as specified in its charter) STATE OF DELAWARE 27-0756180 (State or other jurisdiction of incorporation or organization) (I.R.S. Employer Identification No.) 300 Renaissance Center, Detroit, Michigan 48265-3000 (Address of principal executive offices) (Zip Code) Registrant’s telephone number, including area code (313) 556-5000 Securities registered pursuant to Section 12(b) of the Act: Title of each class Name of each exchange on which registered Common Stock New York Stock Exchange/Toronto Stock Exchange Warrants (expiring July 10, 2019) New York Stock Exchange Securities registered pursuant to Section 12 (g) of the Act: None Indicate by check mark if the registrant is a well-known seasoned issuer, as defined in Rule 405 of the Securities Act. Yes Í No ‘ Indicate by check mark if the registrant is not required to file reports pursuant to Section 13 or Section 15(d) of the Act. Yes ‘ No Í Indicate by check mark whether the registrant (1) has filed all reports required to be filed by Section 13 or 15(d) of the Securities Exchange Act of 1934 during the preceding 12 months (or for such shorter period that the registrant was required to file such reports), and (2) has been subject to such filing requirements for the past 90 days. Yes Í No ‘ Indicate by check mark whether the registrant has submitted electronically and posted on its company Web site, if any, every Interactive Data File required to be submitted and posted pursuant to Rule 405 of Regulation S-T (§ 232.405 of this chapter) during the preceding 12 months (or for such shorter period that the registrant was required to submit and post such files). Yes Í No ‘ Indicate by check mark if disclosure of delinquent filers pursuant to Item 405 of Regulation S-K (§ 229.405 of this chapter) is not contained herein, and will not be contained, to the best of registrant’s knowledge, in definitive proxy or information statements incorporated by reference in Part III of this Form 10-K or any amendment to this Form 10-K. ‘ Indicate by check mark whether the registrant is a large accelerated filer, an accelerated filer, a non-accelerated filer, or a smaller reporting company. See definition of “large accelerated filer,” “accelerated filer” and “small reporting company” in Rule 12b-2 of the Exchange Act. (Check one): Large accelerated filer Í Accelerated filer ‘ Non-accelerated filer ‘ Smaller reporting company ‘ Do not check if a smaller reporting company Indicate by check mark whether the registrant is a shell company (as defined in Rule 12b-2 of the Exchange Act). Yes ‘ No Í The aggregate market value of the voting stock held by non-affiliates of the registrant (assuming only for purposes of this computation that directors and executive officers may be affiliates) was approximately $44.1 billion as of June 30, 2016. As of January 31, 2017 the number of shares outstanding of common stock was 1,497,964,557 shares. DOCUMENTS INCORPORATED BY REFERENCE Portions of the registrant’s definitive Proxy Statement related to the Annual Stockholders Meeting to be filed subsequently are incorporated by reference into Part III of this Form 10-K.
Transcript
UNITED STATES SECURITIES AND EXCHANGE COMMISSIONWashington, DC 20549-1004
Form 10-KÍ ANNUAL REPORT PURSUANT TO SECTION 13 OR 15(d) OF THE SECURITIES EXCHANGE ACT OF 1934
For the fiscal year ended December 31, 2016
OR
‘ TRANSITION REPORT PURSUANT TO SECTION 13 OR 15(d) OF THE SECURITIES EXCHANGE ACT OF 1934
For the transition period from to
Commission file number 001-34960
GENERAL MOTORS COMPANY(Exact name of registrant as specified in its charter)
STATE OF DELAWARE 27-0756180(State or other jurisdiction of
incorporation or organization)(I.R.S. Employer
Identification No.)
300 Renaissance Center, Detroit, Michigan 48265-3000(Address of principal executive offices) (Zip Code)
Registrant’s telephone number, including area code(313) 556-5000
Securities registered pursuant to Section 12(b) of the Act:
Title of each class Name of each exchange on which registeredCommon Stock New York Stock Exchange/Toronto Stock Exchange
Warrants (expiring July 10, 2019) New York Stock Exchange
Securities registered pursuant to Section 12 (g) of the Act: None
Indicate by check mark if the registrant is a well-known seasoned issuer, as defined in Rule 405 of the Securities Act. Yes Í No ‘
Indicate by check mark if the registrant is not required to file reports pursuant to Section 13 or Section 15(d) of the Act. Yes ‘ No Í
Indicate by check mark whether the registrant (1) has filed all reports required to be filed by Section 13 or 15(d) of the Securities Exchange Act of1934 during the preceding 12 months (or for such shorter period that the registrant was required to file such reports), and (2) has been subject to suchfiling requirements for the past 90 days. Yes Í No ‘
Indicate by check mark whether the registrant has submitted electronically and posted on its company Web site, if any, every Interactive Data Filerequired to be submitted and posted pursuant to Rule 405 of Regulation S-T (§ 232.405 of this chapter) during the preceding 12 months (or for suchshorter period that the registrant was required to submit and post such files). Yes Í No ‘
Indicate by check mark if disclosure of delinquent filers pursuant to Item 405 of Regulation S-K (§ 229.405 of this chapter) is not contained herein,and will not be contained, to the best of registrant’s knowledge, in definitive proxy or information statements incorporated by reference in Part III ofthis Form 10-K or any amendment to this Form 10-K. ‘
Indicate by check mark whether the registrant is a large accelerated filer, an accelerated filer, a non-accelerated filer, or a smaller reporting company.See definition of “large accelerated filer,” “accelerated filer” and “small reporting company” in Rule 12b-2 of the Exchange Act. (Check one):
Large accelerated filer Í Accelerated filer ‘ Non-accelerated filer ‘ Smaller reporting company ‘Do not check if a smaller reporting company
Indicate by check mark whether the registrant is a shell company (as defined in Rule 12b-2 of the Exchange Act). Yes ‘ No Í
The aggregate market value of the voting stock held by non-affiliates of the registrant (assuming only for purposes of this computation thatdirectors and executive officers may be affiliates) was approximately $44.1 billion as of June 30, 2016.
As of January 31, 2017 the number of shares outstanding of common stock was 1,497,964,557 shares.
DOCUMENTS INCORPORATED BY REFERENCE
Portions of the registrant’s definitive Proxy Statement related to the Annual Stockholders Meeting to be filed subsequently are incorporated byreference into Part III of this Form 10-K.
General Motors Company (sometimes referred to as we, our, us, ourselves, the Company, General Motors, or GM) wasincorporated as a Delaware corporation in 2009. We design, build and sell cars, trucks, crossovers and automobile parts worldwide.We also provide automotive financing services through General Motors Financial Company, Inc. (GM Financial). Except for pershare amounts or as otherwise specified, amounts presented within tables are stated in millions.
Automotive Our automotive operations meet the demands of our customers through our automotive segments: GM North America(GMNA), GM Europe (GME), GM International Operations (GMIO) and GM South America (GMSA).
GM primarily meets the demands of customers in North America with vehicles developed, manufactured and/or marketed under theBuick, Cadillac, Chevrolet and GMC brands. GM primarily meets the demands of customers outside North America with vehiclesdeveloped, manufactured and/or marketed under the Buick, Cadillac, Chevrolet, GMC, Holden, Opel and Vauxhall brands. We alsohave equity ownership stakes in regional joint ventures (JVs), which meet the demands of customers in Asia with vehicles developed,manufactured and/or marketed under the Baojun, Buick, Cadillac, Chevrolet, Jiefang and Wuling brands.
In addition to the vehicles we sell through our dealer network to retail customers, we also sell vehicles directly or through ourdealer network to fleet customers, including daily rental car companies, commercial fleet customers, leasing companies andgovernments. Our customers can obtain a wide range of aftersale vehicle services and products through our dealer network, such asmaintenance, light repairs, collision repairs, vehicle accessories and extended service warranties.
Competitive Position and Vehicle Sales The principal factors that determine consumer vehicle preferences in the markets inwhich we operate include overall vehicle design, price, quality, available options, safety, reliability, fuel economy and functionality.Market leadership in individual countries in which we compete varies widely. We present both wholesale and retail vehicle sales datato assist in the analysis of our revenue and our market share.
Wholesale vehicle sales data, which represents sales directly to dealers and others, including sales to fleet customers, is the measurethat correlates to our revenue from the sale of vehicles, which is the largest component of Automotive net sales and revenue.Wholesale vehicle sales exclude vehicles sold by joint ventures. In the year ended December 31, 2016, 46.3% of our wholesalevehicle sales volume was generated outside the U.S. The following table summarizes total wholesale vehicle sales of new vehicles byautomotive segment (vehicles in thousands):
Retail vehicle sales data, which represents sales to end customers based upon the good faith estimates of management, includingsales to fleet customers, does not correlate directly to the revenue we recognize during the period. However retail vehicle sales data isindicative of the underlying demand for our vehicles. Market share information is based primarily on retail vehicle sales volume. Incountries where retail vehicle sales data is not readily available other data sources, such as wholesale or forecast volumes, are used toestimate retail vehicle sales to end customers.
1
GENERAL MOTORS COMPANY AND SUBSIDIARIES
Retail vehicle sales data includes all sales by joint ventures on a total vehicle basis, not based on the percentage of ownership in thejoint venture. Certain joint venture agreements in China allow for the contractual right to report vehicle sales of non-GM trademarkedvehicles by those joint ventures. Retail vehicle sales data includes vehicles used by dealers under courtesy transportation programsand vehicles sold through the dealer registration channel primarily in Europe. This sales channel consists primarily of dealerdemonstrator, loaner and self-registered vehicles which are not eligible to be sold as new vehicles after being registered by dealers.Certain fleet sales that are accounted for as operating leases are included in retail vehicle sales at the time of delivery to daily rentalcar companies. The following table summarizes total industry retail sales, or estimated sales where retail sales volume is not available,of vehicles and our related competitive position by geographic region (vehicles in thousands):
(a) Our Europe sales include Opel and Vauxhall sales of 1,159, 1,113 and 1,078, and market share of 5.7%, 5.8% and 5.8% in the years endingDecember 31, 2016, 2015 and 2014.
(b) Our China sales include the Automotive China JVs SAIC General Motors Sales Co., Ltd. (SGMS), SAIC GM Wuling Automobile Co., Ltd.(SGMW) and FAW-GM Light Duty Commercial Vehicle Co., Ltd. (FAW-GM). Wholesale volumes were used for Industry, GM and Market
2
GENERAL MOTORS COMPANY AND SUBSIDIARIES
Share. Our retail sales in China were 3,871, 3,613 and 3,435 in the years ended December 31, 2016, 2015 and 2014. In 2017, we will beginusing vehicle registrations data as the basis for calculating industry volume and market share in China on a prospective basis.
(c) We do not currently export vehicles to Cuba, Iran, North Korea, Sudan or Syria. Accordingly these countries are excluded from industry salesdata and corresponding calculation of market share.
In the year ended December 31, 2016 we estimate we had the largest market share in North America and South America, thenumber three market share in the Asia/Pacific, Middle East and Africa region, which included the number two market share in China,and the number eight market share in Europe. In the year ended December 31, 2016 the Asia/Pacific, Middle East and Africa regionwas our largest region by retail vehicle sales volume and represented 45.8% of our global retail vehicle sales. Refer to the Overview inManagement’s Discussion and Analysis of Financial Condition and Results of Operations (MD&A) for discussion on changes inmarket share by region.
The sales and market share data provided in the table above includes both fleet vehicle sales and sales to retail customers. Certainfleet transactions, particularly sales to daily rental car companies, are generally less profitable than sales to retail customers. Asignificant portion of the sales to daily rental car companies are recorded as operating leases under U.S. GAAP with no recognition ofrevenue at the date of initial delivery due to guaranteed repurchase obligations. The following table summarizes estimated fleet salesand those sales as a percentage of total retail vehicle sales (vehicles in thousands):
Product Pricing Several methods are used to promote our products, including the use of dealer, retail and fleet incentives such ascustomer rebates and finance rate support. The level of incentives is dependent in large part upon the level of competition in themarkets in which we operate and the level of demand for our products. In 2017 we plan to continue to price vehicles competitively,including offering incentives as required. We believe this strategy, coupled with sound inventory management, will continue tostrengthen our brands.
Cyclical Nature of Business Retail sales are cyclical and production varies from month to month. Vehicle model changeoversoccur throughout the year as a result of new market entries. The market for vehicles depends on general economic conditions, creditavailability and consumer spending.
3
GENERAL MOTORS COMPANY AND SUBSIDIARIES
Relationship with Dealers We market vehicles worldwide primarily through a network of independent authorized retail dealers.These outlets include distributors, dealers and authorized sales, service and parts outlets.
The following table summarizes the number of authorized dealerships:
December 31, 2016 December 31, 2015 December 31, 2014
We and our joint ventures enter into a contract with each authorized dealer agreeing to sell to the dealer one or more specifiedproduct lines at wholesale prices and granting the dealer the right to sell those vehicles to retail customers from an approved location.Our dealers often offer more than one GM brand at a single dealership in a number of our markets in order to enhance dealerprofitability. Authorized dealers offer parts, accessories, service and repairs for GM vehicles in the product lines that they sell usingGM parts and accessories. Our dealers are authorized to service GM vehicles under our limited warranty program and those repairsare made only with GM parts. Our dealers generally provide their customers with access to credit or lease financing, vehicle insuranceand extended service contracts provided by GM Financial and other financial institutions.
The quality of GM dealerships and our relationship with our dealers and distributors are critical to our success as dealers maintainthe primary sales and service interface with the end consumer of our products. In addition to the terms of our contracts with ourdealers we are regulated by various country and state franchise laws that may supersede those contractual terms and impose specificregulatory requirements and standards for initiating dealer network changes, pursuing terminations for cause and other contractualmatters.
Research, Product and Business Development and Intellectual Property Costs for research, manufacturing engineering, productengineering and design and development activities relate primarily to developing new products or services or improving existingproducts or services including activities related to vehicle emissions control, improved fuel economy, the safety of drivers andpassengers, urban mobility and autonomous vehicles. In the years ended December 31, 2016, 2015 and 2014 research anddevelopment expenses were $8.1 billion, $7.5 billion and $7.4 billion.
Product Development The Product Development organization is responsible for designing and integrating vehicle and powertraincomponents to maximize part sharing across multiple vehicle segments. Global teams in Design, Program Management,Component & Subsystem Engineering, Product Integrity, Safety, Propulsion and Purchasing & Supply Chain collaborate to meetcustomer requirements and maximize global economies of scale.
Our global vehicle architecture development has been consolidated and headquartered at our Global Technical Center in Warren,Michigan, to further the standardization of our overall vehicle development process. Cross-segment part sharing is an essential enablerto our Vehicle Set Strategy, designed to reduce our overall number of global vehicle architectures to four major vehicle sets. As weimplement the four vehicle sets, we will continue to leverage our current architecture portfolio to accommodate our customers aroundthe world while achieving our financial goals.
Hybrid, Plug-In, Extended Range and Battery Electric Vehicles We are investing in multiple technologies offering increasinglevels of vehicle electrification including eAssist, plug-in hybrid, full hybrid, extended range and battery electric vehicles. Wecurrently offer six models in the U.S. featuring some form of electrification and continue to develop plug-in hybrid electric vehicletechnology and extended range electric vehicles such as the Chevrolet Volt. In 2016 we began production and sales of the ChevroletBolt EV, which provides an EPA-rated 238 miles of range on a full charge.
4
GENERAL MOTORS COMPANY AND SUBSIDIARIES
Car- and Ride-Sharing In 2016, we executed several steps in our strategy to redefine personal mobility. In January 2016 weannounced a new car-sharing service called Maven, which combines our multiple car-sharing programs under a single brand. Mavengives customers access to highly personalized, on-demand mobility services. During 2016 we expanded our Maven offerings to16 cities across the U.S. In January 2016 we also purchased a 9% equity ownership interest in Lyft, Inc. (Lyft), a privately heldcompany, for $0.5 billion. In March 2016 we announced a new program called Express Drive, which leverages our Lyft relationshipto expand our ride-sharing offerings. Under the Express Drive program, Lyft drivers in multiple cities across the U.S. can rent GeneralMotors vehicles on a weekly basis. We are also considering additional options to expand our ride-sharing offerings. In November2016 we announced that we are partnering with Uber Technologies Inc. (Uber) to pilot a program under which Uber drivers can rentGeneral Motors vehicles on a weekly basis. Additionally, we plan to develop an integrated network of on-demand autonomousvehicles in the U.S.
Autonomous Technology We see autonomous technology leading to significant advances in convenience, mobility and safety,since more than 90% of crashes are caused by driver error. We have millions of miles of real-world experience with embeddedconnectivity through OnStar, LLC (OnStar) and advanced safety features that are the building blocks to more advanced automationfeatures that we believe will eventually lead to fully autonomous vehicles. An example of advanced automation is Super Cruise, ahands-free driving customer convenience feature that will debut in 2017 on the Cadillac CT6 sedan.
In May 2016 we acquired all of the outstanding capital stock of Cruise Automation Inc. (Cruise), an autonomous vehicletechnology company, to further accelerate our development of autonomous vehicles. We are also actively testing autonomous vehicleson public roads in San Francisco, California, Scottsdale, Arizona and Warren, Michigan.
Alternative Fuel Vehicles We believe alternative fuels offer significant potential to reduce petroleum consumption in thetransportation sector. By leveraging experience and capability developed around these technologies in our global operations wecontinue to develop FlexFuel vehicles that can run on gasoline-ethanol blend fuels as well as vehicles that run on compressed naturalgas (CNG) and liquefied petroleum gas (LPG).
We currently offer 11 FlexFuel vehicles in the U.S. for the 2017 model year to retail customers plus an additional seven models tofleet and commercial customers capable of operating on gasoline, E85 ethanol or any combination of the two. In Brazil a substantialmajority of vehicles sold were FlexFuel vehicles capable of running on 100% ethanol blends. We also market FlexFuel vehicles inother global markets where biofuels have emerged in the marketplace. In addition, we are studying ethanol-based fuels as well asother high-octane fuel blends and the role they can play in maximizing efficiencies of future internal combustion engine technologydevelopment to meet the escalating fuel economy and greenhouse gas emission regulations in the U.S. and other markets.
We produce CNG bi-fuel capable vehicles in Europe such as the Opel Zafira Tourer and the Opel Combo van. In the U.S. we aredeveloping a program to offer a wide selection of truck and van options through a specialty vehicle manufacturing program, operatingon CNG or LPG, which are suitable for fleet and commercial applications and retail customers alike. Availability is scheduled tobegin in 2017. Globally, we offer CNG and LPG capable vehicles in select markets reflecting the infrastructure, regulatory focus andnatural resource availability of the markets in which they are sold. We support the development of biodiesel blend fuels, which arealternative diesel fuels produced from renewable sources.
Hydrogen Fuel Cell Technology As part of our long-term strategy to reduce petroleum consumption and greenhouse gasemissions we are committed to development of our hydrogen fuel cell technology. Our Chevrolet Equinox fuel cell electric vehicledemonstration programs, such as Project Driveway, have accumulated more than 3 million miles of real-world driving by consumers,celebrities, business partners and government agencies. These programs are helping us identify consumer and infrastructure needs tounderstand the business case for potential production of vehicles with this technology. We are exploring non-traditional automotiveuses for fuel cells in several areas, including demonstrations with the U.S. Army and U.S. Navy.
We signed a co-development agreement with Honda Motor Company in October 2016 for a next-generation fuel cell system andhydrogen storage technologies, aiming for the 2020 timeframe for commercialization. The collaboration expects to succeed by sharingexpertise, economies of scale and common sourcing strategies and builds upon GM’s and Honda Motor Company’s strengths asleaders in hydrogen fuel cell technology.
5
GENERAL MOTORS COMPANY AND SUBSIDIARIES
Fuel Efficiency We are committed to improving fuel efficiency and meeting regulatory standards through a combination ofstrategies including: (1) extensive technology improvements to conventional powertrains; (2) increased use of smaller displacementengines and improved and advanced automatic transmissions; and (3) vehicle improvements including increased use of lighter, front-wheel drive architectures.
OnStar OnStar is a wholly-owned subsidiary of GM serving more than 7.2 million subscribers in the U.S., Canada, Mexico,China (through a joint venture), South America and Europe. OnStar is a provider of connected safety, security and mobility solutionsand advanced information technology and is available on the majority of our 2017 model year vehicles. OnStar’s key services includeautomatic crash response, stolen vehicle assistance, remote door unlock, turn-by-turn navigation, vehicle diagnostics, hands-freecalling and 4G LTE wireless connectivity.
Intellectual Property We generate and hold a significant number of patents in a number of countries in connection with theoperation of our business. While none of these patents are individually material to our business as a whole, these patents are importantto our operations and continued technological development. We hold a number of trademarks and service marks that are veryimportant to our identity and recognition in the marketplace.
Raw Materials, Services and Supplies We purchase a wide variety of raw materials, parts, supplies, energy, freight,transportation and other services from numerous suppliers to manufacture our products. The raw materials primarily include steel,aluminum, resins, copper, lead and platinum group metals. We have not experienced any significant shortages of raw materials andnormally do not carry substantial inventories of such raw materials in excess of levels reasonably required to meet our productionrequirements.
In some instances, we purchase systems, components, parts and supplies from a single source and may be at an increased risk forsupply disruptions. The inability or unwillingness of these sources to supply us with parts and supplies could have a material adverseeffect on our production capacity. Refer to Item 1A. Risk Factors for further discussion of these risks. Combined purchases from ourtwo largest suppliers have ranged from approximately 11% to 12% of our total purchases in the years ended December 31, 2016, 2015and 2014.
Environmental and Regulatory Matters
Automotive Emissions Control We are subject to laws and regulations that require us to control automotive emissions, includingvehicle exhaust emission standards, vehicle evaporative emission standards and onboard diagnostic (OBD) system requirements.Advanced OBD systems are used to identify and diagnose problems with emission control systems. Problems detected by the OBDsystem and in-use compliance monitoring may increase warranty costs and the likelihood of recall. Emission and OBD requirementsbecome more stringent each year as vehicles must meet lower emission standards and new diagnostics are required throughout theworld with very little harmonization of global regulations. Zero emission vehicle (ZEV) requirements have been adopted by someU.S. states as well as the Canadian Province of Quebec and there is the possibility that additional jurisdictions could adopt ZEVrequirements in the future. While we believe all our products are designed and manufactured in material compliance with substantiallyall vehicle emissions requirements, regulatory authorities may conduct ongoing evaluations of the emissions compliance of productsfrom all manufacturers. This includes vehicle emissions testing, including CO2 and nitrogen oxide emissions testing, and review ofemission control strategies.
The U.S. federal government imposes stringent emission control requirements on vehicles sold in the U.S. and various stategovernments impose additional requirements. Canada’s federal government vehicle emission requirements are generally aligned withthe U.S. federal requirements. Each model year we must obtain certification for each test group that our vehicles will meet emissionrequirements from the U.S. Environmental Protection Agency (EPA) before we can sell vehicles in the U.S. and Canada and from theCalifornia Air Resources Board (CARB) before we can sell vehicles in California and other states that have adopted the Californiaemissions requirements.
CARB’s latest emission requirements include more stringent exhaust emission and evaporative emission standards including anincrease in ZEVs which must be offered for sale in California. CARB has adopted 2018 model year and later requirements for
6
GENERAL MOTORS COMPANY AND SUBSIDIARIES
increasing volumes of ZEVs to achieve greenhouse gas as well as criteria pollutant emission reductions to help achieve the state’slong-term greenhouse gas reduction goals. The EPA has adopted similar exhaust emission and evaporative emission standards whichphase in with the 2017 model year, but do not include ZEV requirements. These new requirements will also increase the time andmileage periods over which manufacturers are responsible for a vehicle’s emission performance.
The Clean Air Act permits states that have areas with air quality compliance issues to adopt the California car and light-duty truckemission standards in lieu of the federal requirements. Thirteen states currently have these standards in effect and 10 of these 13 stateshave adopted the ZEV requirements.
Emissions in the European Union are regulated by the European Commission (EC) and by governmental authorities in eachEuropean Union Member State (EU Member States). The EC imposes emission control requirements on vehicles sold in all 28 EUMember States. We must demonstrate that vehicles will meet emission requirements from an approval authority in one EU MemberState before we can sell vehicles in any EU Member State. The regulatory requirements include random testing of newly assembledvehicles and a manufacturer in-use surveillance program. The European Union requirements are equivalent in terms of stringency andimplementation to the framework of the United Nations Economic Commission for Europe.
The existing level of European Union exhaust emission standards for cars and light-duty trucks, Euro 6, was effective in 2014 fornew vehicle approvals and 2015 for new vehicle registrations. Future emission standards focus particularly on further reducingemissions from diesel vehicles by introducing new testing criteria based on “real world driving” emissions (RDE). RDE tests willbecome effective in 2017. The new requirements will require additional technologies and further increase the cost of diesel engines,which currently cost more than gasoline engines to manufacture. To comply with RDE tests we believe it will be necessary toimplement technologies which will introduce additional cost pressures on the already challenging European Union market for smalland mid-size diesel vehicles. Declines in diesel penetration may make fleet CO2 compliance more challenging. Gasoline engines arealso affected by the new requirements. The potential implementation of technology into gasoline vehicles to reduce exhaust pollutantemissions may further increase the cost of gasoline engines and could have adverse effects on vehicle fuel economy.
In addition, increased scrutiny of compliance with emissions standards may result in changes to these standards, including theimplementation of RDE tests, as well as stricter interpretations or redefinition of these standards and more rigorous enforcement. Thismay lead to increased costs, penalties, lack of certainty with respect to product portfolio planning, negative publicity or reputationimpact for us. Refer to Item 1A. Risk Factors for further discussion of these risks.
In the long-term, we expect that the EC will continue devising regulatory requirements on the emission test cycle, RDE, lowtemperature testing, fuel evaporation and OBD.
China has implemented European type China 4 standards nationally with European OBD requirements for new vehicleregistrations. Cities such as Beijing, Shanghai and Guangzhou each currently require China 5 standards for new vehicle registrations.China implemented the China 5 standards for light duty gasoline nationwide at the beginning of 2017. The China 5 standards includemore stringent emission requirements and increase the time and mileage periods over which manufacturers are responsible for avehicle’s emission performance. China officially released a unique China 6 emission standard with the potential to combine elementsof both European and U.S. standards. Local implementation is expected as early as 2018. Nationwide implementation for newregistrations is expected in July 2020 for the base China 6a standard and July 2023 for the more stringent China 6b standard.
In South America certain countries follow the U.S. test procedures, standards and OBD requirements and others follow theEuropean Union test procedures, standards and OBD requirements with different levels of stringency. Brazil implemented nationalL6 standards for light diesel vehicles in 2012 and OBD installation for light diesel vehicles in 2015. L6 standards for light gasolinevehicles were implemented in 2015 for all models.
Automotive Fuel Economy In the U.S., Corporate Average Fuel Economy (CAFE) reporting is required for three separate fleets:domestically produced cars, imported cars and light-duty trucks. Both car and light-duty truck standards were established using targetsfor various vehicle sizes and vehicle model sales volumes. In 2017 our domestic car standard is estimated to be 38.1 mpg, our import
7
GENERAL MOTORS COMPANY AND SUBSIDIARIES
car standard is estimated to be 41.7 mpg, and our light-duty truck standard is estimated to be 27.6 mpg. Our current product plan isexpected to be compliant with the federal CAFE program through the 2017 model year. In addition to federal CAFE reporting, theEPA requires compliance with greenhouse gas requirements that are similar to the CAFE program. Our current product plan isexpected to be compliant with the federal greenhouse gas program through the 2017 model year. CARB has agreed that compliancewith the federal program is deemed to be compliant with the California program for the 2012 through 2017 model years. AlthoughCanada has no parallel CAFE-style fuel economy regulations there are Canadian greenhouse gas regulations that are aligned with theU.S. EPA regulations and Canadian fleets are expected to be compliant with these regulations through the 2017 model year. Weregularly evaluate our current and future product plans and strategies for compliance with fuel economy and greenhouse gasregulations.
Unlike other jurisdictions, the European Union’s climate change policy framework focuses on fleet average CO2 emissions ratherthan fuel economy. The European Union has implemented legislation regulating fleet average CO2 emissions in Europe and hasadopted an even more stringent fleet average CO2 target for 2020. Requirements must be met through the introduction of CO2
reducing technologies on conventional gasoline and diesel engines or through ultra-low CO2 vehicles. We are developing acompliance plan by adopting operational CO2 targets for each market entry in Europe. The EC will also devise regulatoryrequirements on the CO2 emission test cycle as of 2017.
China has both an individual vehicle pass-fail type approval requirement based on Phase 3 standards and a fleet fuel consumptionrequirement based on Phase 4 standards effective in 2016. The China Phase 4 fleet fuel consumption standard is based on curb weightwith full compliance to 5.0 L/100 km required by 2020. China has continued subsidies for plug-in hybrid, battery electric and fuel cellvehicles. China proposes a Phase 5 fleet fuel consumption standard effective beginning in 2021 with full compliance to 4.0L/100kmrequired by 2025.
In Brazil the government has set fuel economy requirements called Inovar Auto. Original equipment manufacturers have mandatoryfleet average compliance required by October 2017 resulting in a reduction from 2012 levels. The Brazilian government providesindirect tax incentives to eligible participant companies that meet certain requirements including these fuel economy targets. The levelof potential indirect tax incentives varies based on the timing and degree to which the targets are met. Participating companies that failto meet the required criteria are subject to clawback provisions and specific fines.
Industrial Environmental Control Our operations are subject to a wide range of environmental protection laws including thoseregulating air emissions, water discharge, waste management and environmental cleanup. Certain environmental statutes require thatresponsible parties fund remediation actions regardless of fault, legality of original disposal or ownership of a disposal site. Undercertain circumstances these laws impose joint and several liability as well as liability for related damages to natural resources.
To mitigate the effects our worldwide operations have on the environment and reduce greenhouse gas emissions associated withwaste disposal, we are committed to converting as many of our worldwide operations as possible to landfill-free operations. AtDecember 31, 2016, 100 (or approximately 60%) of our manufacturing operations were landfill-free. Additionally we have 52 non-manufacturing operations that are landfill-free. At our landfill-free manufacturing operations approximately 90% of waste materialsare reused or recycled and approximately 10% are converted to energy at waste-to-energy facilities. Including construction,demolition and remediation wastes, we estimate that we reused, recycled or composted over 2.5 million metric tons of waste materialsat our global manufacturing operations, converted over 137,000 metric tons of waste materials to energy at waste-to-energy facilitiesand avoided approximately 9 million metric tons of greenhouse gas emissions in the year ended December 31, 2016.
In addition to minimizing our impact on the environment our landfill-free program and total waste reduction commitments generaterevenue from the sale of production by-products, reduce our use of material, reduce our carbon footprint and help to reduce the risksand financial liabilities associated with waste disposal.
We continue to search for ways to increase our use of renewable energy and improve our energy efficiency and work to drivegrowth and scale of renewables. We have committed to meeting the electricity needs of our operations worldwide with renewableenergy by 2050. At December 31, 2016 we had implemented projects globally that had increased our total renewable energy capacity
8
GENERAL MOTORS COMPANY AND SUBSIDIARIES
to over 167 megawatts. In 2016 we also met the EPA Energy Star Challenge for Industry (EPA Challenge) at 12 of our sites globallyby reducing energy intensity an average of 18% at these sites. To meet the EPA Challenge industrial sites must reduce energyintensity by 10% in five years or fewer. Two of the sites achieved the goal for the first time, bringing the total number of GM-ownedsites to have met the EPA Challenge to 75, with many sites achieving the goal multiple times. These efforts minimize our utilityexpenses and are part of our approach to addressing climate change through setting a greenhouse gas emissions reduction target,collecting accurate data, following our business plan and publicly reporting progress against our target.
Chemical Regulations We continually monitor the implementation of chemical regulations to maintain compliance and evaluatetheir effect on our business, suppliers and the automotive industry.
Governmental agencies in both the U.S. and Canada continue to introduce new regulations and legislation related to the selectionand use of chemicals or substances of concern by mandating broad prohibitions, green chemistry, life cycle analysis and productstewardship initiatives. These initiatives give broad regulatory authority to ban or restrict the use of certain chemical substances andpotentially affect automobile manufacturers’ responsibilities for vehicle components at the end of a vehicle’s life, as well as chemicalselection for product development and manufacturing. Chemical restrictions in Canada are progressing rapidly as a result ofEnvironment Canada’s Chemical Management Plan to assess existing substances and implement risk management controls on anychemical deemed toxic. In June 2016, the U.S. enacted the Chemical Safety for the 21st Century Act that grants the EPA moreauthority to regulate and ban chemicals from use in the U.S. and is expected to increase the level of regulation of chemicals invehicles. These emerging regulations will potentially lead to increases in costs and supply chain complexity. We believe that we arematerially in compliance with substantially all of these requirements or expect to be materially in compliance by the required date.
In 2007 the European Union implemented its regulatory requirements, the EU REACH regulation among others, to register,evaluate, authorize and restrict the use of chemical substances. This regulation requires chemical substances manufactured in orimported into the European Union to be registered with the European Chemicals Agency before 2018. Under this regulation,“substances of very high concern” may either require authorization for further use or may be restricted in the future. This couldpotentially increase the cost of certain alternative substances that are used to manufacture vehicles and parts, or result in a supplychain disruption when a substance is no longer available to meet production timelines. Our research and development initiatives maybe used to address future requirements. We believe that we are materially in compliance with substantially all of these requirements orexpect to be materially in compliance by the required date.
There are various regulations in China stipulating the requirements for chemical management. Among other things, theseregulations catalogue and restrict the use and the import and export of various chemical substances. The failure of our joint venturepartners or our suppliers to comply with these regulations could disrupt production in China or prevent our joint venture partners fromselling the affected products in the China market.
Safety In the U.S. the National Traffic and Motor Vehicle Safety Act of 1966 prohibits the sale of any new vehicle or equipmentin the U.S. that does not conform to applicable vehicle safety standards established by the National Highway Traffic SafetyAdministration (NHTSA). If we or NHTSA determine that either a vehicle or vehicle equipment does not comply with a safetystandard or if a vehicle defect creates an unreasonable safety risk the manufacturer is required to notify owners and provide a remedy.We are required to report certain information relating to certain customer complaints, warranty claims, field reports and notices andclaims involving property damage, injuries and fatalities in the U.S. and claims involving fatalities outside the U.S. We are alsorequired to report certain information concerning safety recalls and other safety campaigns outside the U.S.
Outside the U.S. safety standards and recall regulations often have the same purpose as the U.S. standards but may differ in theirrequirements and test procedures, adding complexity to regulatory compliance.
Automotive Financing — GM Financial GM Financial is our global captive automotive finance company and our global providerof automobile finance solutions. GM Financial conducts its business in North America, Europe, South America and through a jointventure in China.
9
GENERAL MOTORS COMPANY AND SUBSIDIARIES
GM Financial provides retail loan and lease lending across the credit spectrum. Additionally GM Financial offers commercialproducts to dealers that include new and used vehicle inventory financing, inventory insurance, working capital, capital improvementloans, and storage center financing.
In North America GM Financial’s retail automobile finance programs include prime and sub-prime lending and full credit spectrumleasing. The sub-prime lending program is primarily offered to consumers with FICO scores less than 620 who have limited access toautomobile financing through banks and credit unions and is expected to sustain a higher level of credit losses than prime lending. Theleasing product is offered through our franchised dealers and primarily targets prime consumers leasing new vehicles. GM Financialhas expanded its leasing, near prime and prime lending programs through our franchised dealers, and as a result, leasing and primelending have become a larger percentage of originations and the retail portfolio balance.
Internationally GM Financial’s retail automobile finance programs focus on prime quality financing through loan and leaseproducts.
Generally GM Financial seeks to fund its operations in each country through local sources to minimize currency and country risk.GM Financial primarily finances its loan, lease and commercial origination volume through the use of secured and unsecured creditfacilities, through securitization transactions where such markets are developed and through the issuance of unsecured debt in publicmarkets including accepting deposits from retail banking customers in Germany.
Employees At December 31, 2016 we employed 135,000 (60%) hourly employees and 90,000 (40%) salaried employees. AtDecember 31, 2016 55,000 (53%) of our U.S. employees were represented by unions, a majority of which were represented by theInternational Union, United Automobile, Aerospace and Agriculture Implement Workers of America (UAW). The following tablesummarizes worldwide employment (in thousands):
December 31, 2016 December 31, 2015 December 31, 2014
Executive Officers of the Registrant As of February 7, 2017 the names and ages of our executive officers and their positions withGM are as follows:
Name (Age) Present GM Position (Effective Date) Positions Held During the Past Five Years (Effective Date)
Mary T. Barra (55) Chairman & Chief ExecutiveOfficer (2016)
Chief Executive Officer and Member of the Board ofDirectors (2014) Executive Vice President, GlobalProduct Development, Purchasing & Supply Chain(2013)Senior Vice President, Global Product Development(2011)
Daniel Ammann (44) President (2014) Executive Vice President & Chief Financial Officer(2013)Senior Vice President & Chief Financial Officer (2011)
Alan S. Batey (53) Executive Vice President &President, North America (2014)
Senior Vice President, Global Chevrolet and BrandChief and U.S. Sales and Marketing (2013)GM Vice President, U.S. Sales and Service, and InterimGM Chief Marketing Officer (2012)Vice President, U.S. Chevrolet Sales and Service(2010)
Senior Vice President, Global Connected CustomerExperience (2014)Vice President, Global Quality and U.S. CustomerExperience (2012)
Carel Johannes de Nysschen (56) Executive Vice President &President, Cadillac (2014)
Infiniti Motor Company, President (2012)Audi of America, Inc., President (2004)
Barry L. Engle (53) Executive Vice President &President, South America (2015)
Agility Fuel Systems, CEO (2011)
Stefan Jacoby (58) Executive Vice President &President, GM International (2013)
Volvo Car Corporation — Global Chief ExecutiveOfficer and President (2010)
Craig B. Glidden (59) Executive Vice President &General Counsel (2015)
LyondellBasell, Executive Vice President and ChiefLegal Officer (2009)
Karl-Thomas Neumann (55) Executive Vice President &President, Europe and Chairman ofthe Management Board of OpelGroup GmbH (2013)
CEO, Opel Group GmbH & President, GM Europe(2013)Volkswagen Group China — Chief Executive Officerand President (2010)
John J. Quattrone (64) Senior Vice President, GlobalHuman Resources (2014)
VP of Human Resources, Global Product Development& Global Purchasing & Supply Chain / CorporateStrategy, Business Development & Global Planning &Program organizations (2009)
Mark L. Reuss (53) Executive Vice President, GlobalProduct Development, Purchasing& Supply Chain (2014)
Executive Vice President & President, North America(2013)GM Vice President & President, North America (2009)
Charles K. Stevens, III (57) Executive Vice President & ChiefFinancial Officer (2014)
Chief Financial Officer, GM North America (2010)Interim Chief Financial Officer, GM South America(2011)
Matthew Tsien (56) Executive Vice President &President, GM China (2014)
GM Consolidated International Operations VicePresident, Planning, Program Management, & StrategicAlliances China (2012)Executive Vice President, SAIC GM Wuling (2009)
Thomas S. Timko (48) Vice President, Controller & ChiefAccounting Officer (2013)
Applied Materials Inc. — Corporate Vice President,Chief Accounting Officer, and Corporate Controller(2010)
11
GENERAL MOTORS COMPANY AND SUBSIDIARIES
There are no family relationships between any of the officers named above and there is no arrangement or understanding betweenany of the officers named above and any other person pursuant to which he or she was selected as an officer. Each of the officersnamed above was elected by the Board of Directors to hold office until the next annual election of officers and until his or hersuccessor is elected and qualified or until his or her earlier resignation or removal. The Board of Directors elects the officersimmediately following each annual meeting of the stockholders and may appoint other officers between annual meetings.
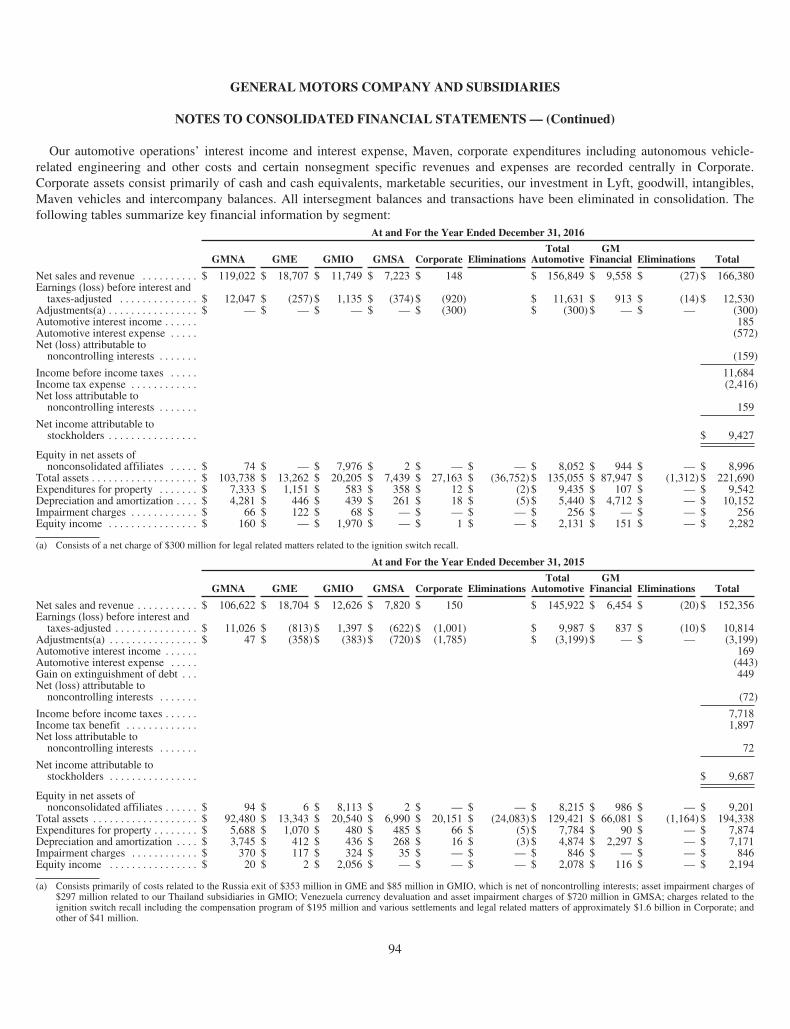
Segment Reporting Data Operating segment data and principal geographic area data for the years ended December 31, 2016, 2015and 2014 are summarized in Note 23 to our consolidated financial statements.
Website Access to Our Reports Our internet website address is www.gm.com. In addition to the information about us and oursubsidiaries contained in this 2016 Form 10-K information about us can be found on our website including information on ourcorporate governance principles and practices. Our Investor Relations website at www.gm.com/investors contains a significantamount of information about us, including financial and other information for investors. We encourage investors to visit our website,as we frequently update and post new information about our company on our website and it is possible that this information could bedeemed to be material information. Our website and information included in or linked to our website are not part of this 2016Form 10-K.
Our annual reports on Form 10-K, quarterly reports on Form 10-Q, current reports on Form 8-K and amendments to those reportsfiled or furnished pursuant to Section 13(a) or 15(d) of the Securities Exchange Act of 1934, as amended (Exchange Act) are availablefree of charge through our website as soon as reasonably practicable after they are electronically filed with or furnished to theSecurities and Exchange Commission (SEC). The public may read and copy the materials we file with the SEC at the SEC’s PublicReference Room at 100 F Street, NE, Washington, DC 20549. The public may obtain information on the operation of the PublicReference Room by calling the SEC at 1-800-SEC-0330. Additionally the SEC maintains an internet site that contains reports, proxyand information statements and other information. The address of the SEC’s website is www.sec.gov.
* * * * * * *
Item 1A. Risk Factors
We face a number of significant risks and uncertainties in connection with our operations. Our business and the results of ouroperations could be materially adversely affected by the factors described below. The risks described below are not the only risksfacing our operations. Risks and uncertainties not currently known to us or that we currently deem to be immaterial also could have amaterial adverse impact on our business and results of operations.
If we do not deliver new products, services and customer experiences in response to new participants in the automotive industry,our business could suffer. We believe that the automotive industry will experience significant and continued change in the comingyears. In addition to our traditional competitors, we must also be responsive to the entrance of non-traditional participants in theautomotive industry. These non-traditional participants may seek to disrupt the historic business model of the industry through theintroduction of new technologies, new products or services, new business models or new methods of travel. It is strategicallysignificant that we lead the technological disruption occurring in our industry. As our business evolves, the pressure to innovate willencompass a wider range of products and services, including products and services that may be outside of our historically corebusiness, such as autonomous vehicles, car- and ride-sharing and transportation as a service. If we do not accurately predict, preparefor and respond to new kinds of technological innovations, market developments and changing customer needs, our sales, profitabilityand long-term competitiveness may be harmed.
Our ability to maintain profitability is dependent upon our ability to fund and introduce new and improved vehicle models thatare able to attract a sufficient number of consumers. We operate in a very competitive industry with market participants routinelyintroducing new and improved vehicle models designed to meet rapidly evolving consumer expectations. Producing new andimproved vehicle models competitively and preserving our reputation for designing, building and selling high quality cars and trucksis critical to our long-term profitability. We will launch a substantial number of new vehicles in 2017. Successful launches of our newvehicles are critical to our short-term profitability. In addition, our growth strategies require us to make significant investment in ourbrands to appeal to new markets.
12
GENERAL MOTORS COMPANY AND SUBSIDIARIES
Our long-term profitability depends upon successfully creating and funding technological innovations in design, engineering andmanufacturing, which requires extensive capital investment and the ability to retain and recruit talent. In some cases the technologiesthat we plan to employ are not yet commercially practical and depend on significant future technological advances by us and by oursuppliers. Although we will seek to obtain intellectual property protection for our innovations to protect our competitive position, it ispossible we may not be able to protect some of these innovations. There can be no assurance that advances in technology will occur ina timely or feasible way, or that others will not acquire similar or superior technologies sooner than we do or that we will acquiretechnologies on an exclusive basis or at a significant price advantage.
It generally takes two years or more to design and develop a new vehicle, and a number of factors may lengthen that time period.Because of this product development cycle and the various elements that may contribute to consumers’ acceptance of new vehicledesigns, including competitors’ product introductions, technological innovations, fuel prices, general economic conditions andchanges in styling preferences, an initial product concept or design may not result in a vehicle that generates sales in sufficientquantities and at high enough prices to be profitable. Our high proportion of fixed costs, both due to our significant investment inproperty, plant and equipment as well as other requirements of our collective bargaining agreements, which limit our flexibility toadjust personnel costs to changes in demands for our products, may further exacerbate the risks associated with incorrectly assessingdemand for our vehicles.
Our profitability is dependent upon the success of full-size pick-up trucks and SUVs. While we offer a balanced and completeportfolio of small, mid-size and large cars, crossovers, sport utility vehicles (SUVs) and trucks, we generally recognize higher profitmargins on our full-size pick-up trucks and SUVs. Our success is dependent upon consumer preferences and our ability to sell highermargin vehicles in sufficient volumes. Any shift in consumer preferences toward smaller, more fuel efficient vehicles, whether as aresult of increases in the price of oil or any sustained shortage of oil, including as a result of global political instability or otherreasons, could weaken the demand for our higher margin full-size pick-up trucks and SUVs.
Our business is highly dependent upon global automobile market sales volume, which can be volatile. Our business andfinancial results are highly sensitive to sales volume, changes to which can have a disproportionately large effect on our profitability.A number of economic and market conditions drive changes in vehicle sales, including real estate values, levels of unemployment,availability of affordable financing, fluctuations in the cost of fuel, consumer confidence, political unrest and global economicconditions. We cannot predict future economic and market conditions with certainty.
Our business in China is subject to aggressive competition. Maintaining a strong position in the Chinese market is a keycomponent of our global growth strategy. The automotive market in China is highly competitive with competition from many of thelargest global manufacturers and numerous smaller domestic manufacturers. As the size of the Chinese market continues to increasewe anticipate that additional competitors, both international and domestic, will seek to enter the Chinese market and that existingmarket participants will act aggressively to increase their market share. Increased competition may result in price reductions, reducedmargins and our inability to gain or hold market share.
The international scale and footprint of our operations exposes us to additional risks. We manufacture, sell and serviceproducts globally and rely upon a global supply chain to deliver the raw materials, components, systems and parts that we need tomanufacture our products. Our global operations subject us to extensive domestic and foreign regulations and expose us to a variety ofdomestic and foreign political, economic and other risks, including: changes in foreign or domestic government leadership; changes inforeign or domestic laws or regulations impacting our overall business model or restricting our ability to manufacture, purchase or sellproducts, and political pressures to change any aspect of our business model or practices and source raw materials, components,systems and parts on competitive terms in a manner consistent with our current practice; changes in domestic or foreign tax laws;economic tensions between governments and changes in international trade and investment policies, including restrictions on therepatriation of dividends, especially between the U.S. and China, more detailed inspections, new or higher tariffs, for example, onproducts imported from Mexico into the U.S.; new barriers to entry or domestic preference procurement requirements, or changes toor withdrawals from free trade agreements; changes in foreign currency exchange rates and interest rates; economic downturns inforeign countries or geographic regions where we have significant operations, such as China; significant changes in conditions in thecountries in which we operate with the effect of competition from new market entrants and in the United Kingdom (U.K.) with
13
GENERAL MOTORS COMPANY AND SUBSIDIARIES
passage of a referendum to discontinue membership in the European Union; differing local product preferences and productrequirements, including fuel economy, vehicle emissions and safety; impact of compliance with U.S. and other foreign countries’export controls and economic sanctions; liabilities resulting from U.S. and foreign laws and regulations, including those related to theForeign Corrupt Practices Act and certain other anti-corruption laws; differing labor regulations and union relationships; anddifficulties in obtaining financing in foreign countries for local operations.
A significant amount of our operations are conducted by joint ventures that we cannot operate solely for our benefit. Many ofour operations, primarily in China, are carried out by joint ventures. In joint ventures we share ownership and management of acompany with one or more parties who may not have the same goals, strategies, priorities or resources as we do and may competewith us outside the joint venture. Joint ventures are intended to be operated for the equal benefit of all co-owners, rather than for ourexclusive benefit. Operating a business as a joint venture often requires additional organizational formalities as well as time-consuming procedures for sharing information and making decisions. In joint ventures we are required to foster our relationships withour co-owners as well as promote the overall success of the joint venture, and if a co-owner changes or relationships deteriorate, oursuccess in the joint venture may be materially adversely affected. The benefits from a successful joint venture are shared among theco-owners, therefore we do not receive all the benefits from our successful joint ventures. In addition, because we share ownershipand management with one or more parties, we may have limited control over the actions of a joint venture, particularly when we owna minority interest. As a result, we may be unable to prevent misconduct or other violations of applicable laws by a joint venture.Moreover, a joint venture may not follow the same requirements regarding compliance, internal controls and internal control overfinancial reporting that we follow. To the extent another party makes decisions that negatively impact the joint venture or internalcontrol issues arise within the joint venture, we may have to take responsive or other action or we may be subject to penalties, fines orother related actions for these activities.
We are subject to extensive laws, governmental regulations and policies, including those regarding fuel economy and emissionscontrols, that can significantly increase our costs and affect how we do business. We are significantly affected by governmentalregulations that can increase costs related to the production of our vehicles and affect our product portfolio. Meeting or exceedingmany of these regulations is costly and often technologically challenging, especially where standards may not be harmonized acrossjurisdictions, a significant challenge with respect to mandated emissions and fuel economy standards. We anticipate that the numberand extent of these regulations, and the related costs and changes to our product portfolio, may increase significantly in the future.These government regulatory requirements could significantly affect our plans for global product development and given theuncertainty surrounding enforcement and regulatory definitions, may result in substantial costs, including civil or criminal penalties.In addition, an evolving but un-harmonized regulatory framework may limit or dictate the types of vehicles we sell and where we sellthem, which can affect revenue. Refer to the “Environmental and Regulatory Matters” section of Item 1. Business for furtherinformation on these regulatory requirements. We also expect that manufacturers will continue to be subject to increased scrutinyfrom regulators globally. For example, in Germany, the Ministry of Transportation and the Kraftfahrt-Bundesamt have requested theparticipation of a number of automotive manufacturers, including our German subsidiary, in continuing discussions on emissionscontrol issues and have also requested, from time to time, written responses from our subsidiary on the subject. Our Germansubsidiary has participated in these discussions and has provided the requested responses to inquiries concerning nitrogen oxideemission control systems of its diesel engines. In addition, the German and the EU Parliaments have instigated Inquiry Commissionsinto government agencies’ oversight of emissions enforcement, requesting our German subsidiary’s participation. At the same time,the German government has initiated further industry-wide inquiries about CO2 emissions. This scrutiny, regulatory changes or novelinterpretations of current regulations, as well as increased enforcement has led to and may result in further increased testing and re-testing of our vehicles and analysis of their emissions control systems, which could lead to increased costs, penalties, negativepublicity or reputational impact, and recall activity if regulators determine that emission levels and required regulatory complianceshould be based on either a wider spectrum of driving conditions for future testing parameters or stricter or novel interpretations andconsequent enforcement of existing requirements. No assurance can be given that the ultimate outcome of any potential investigationsor increased testing resulting from this scrutiny would not materially and adversely affect us.
We expect that to comply with fuel economy and emission control requirements we will be required to sell a significant volume ofhybrid electric vehicles, as well as develop and implement new technologies for conventional internal combustion engines, all atincreased cost levels. There is no assurance that we will be able to produce and sell vehicles that use such technologies on a profitable
14
GENERAL MOTORS COMPANY AND SUBSIDIARIES
basis or that our customers will purchase such vehicles in the quantities necessary for us to comply with these regulatory programs.Alternative compliance measures may not be sufficiently available in the marketplace to meet volume driven compliancerequirements.
In the current uncertain regulatory framework, environmental liabilities for which we may be responsible and that are notreasonably estimable could be substantial. Alleged violations of safety or emissions standards could result in legal proceedings, therecall of one or more of our products, negotiated remedial actions, fines, restricted product offerings or a combination of any of thoseitems. Any of these actions could have substantial adverse effects on our operations including facility idling, reduced employment,increased costs and loss of revenue.
We could be materially adversely affected by a negative outcome in unusual or significant litigation, governmentalinvestigations or other legal proceedings. We are subject to legal proceedings involving various issues, including product liabilitylawsuits, stockholder litigation and governmental investigations, such as the legal proceedings related to the Ignition Switch Recall.Such legal proceedings could in the future result in the imposition of damages, including punitive damages, substantial fines, civillawsuits and criminal penalties, interruptions of business, modification of business practices, equitable remedies and other sanctionsagainst us or our personnel as well as significant legal and other costs. For a further discussion of these matters refer to Note 15 to ourconsolidated financial statements.
If, in the discretion of the U.S. Attorney’s Office for the Southern District of New York (the Office), we do not comply with theterms of the Deferred Prosecution Agreement (the DPA), the Office may prosecute us for charges alleged by the Office includingthose relating to faulty ignition switches. On September 17, 2015 we announced that we entered into the DPA with the Officeregarding its investigation of the events leading up to certain recalls announced in February and March of 2014 relating to faultyignition switches. Under the DPA, we consented to, among other things, the filing of a two-count information (the Information) in theU.S. District Court for the Southern District of New York charging GM with a scheme to conceal material facts from a governmentregulator and wire fraud. We pled not guilty to the charges alleged in the Information. The DPA further provides that, in the event theOffice determines during the period of deferral of prosecution (or any extensions thereof) that we have violated any provision of theDPA, including violating any U.S. federal law or our obligation to cooperate with and assist the independent monitor, the Office may,in its discretion, either prosecute us on the charges alleged in the Information or impose an extension of the period of deferral ofprosecution of up to one additional year. Under such circumstance, the Office would be permitted to rely upon the admissions wemade in the DPA and would benefit from our waiver of certain procedural and evidentiary defenses. Such a criminal prosecutioncould subject us to penalties.
The costs and effect on our reputation of product safety recalls could materially adversely affect our business. Governmentsafety standards require manufacturers to remedy certain product safety defects through recall campaigns. Under these standards, wecould be subject to civil or criminal penalties or may incur various costs, including significant costs for free repairs. At present, thecosts we incur in connection with these recalls typically include the cost of the part being replaced and labor to remove and replacethe defective part. We currently source a variety of systems, components, raw materials and parts, including but not limited to air baginflators, from third parties. From time to time these items may have performance or quality issues that could harm our reputation andcause us to incur significant costs. For example, we are currently conducting recalls for certain Takata Corporation (Takata) air baginflators used in some of our prior model year vehicles. We are continuing to assess the situation. Further recalls, if any, that may berequired to remediate Takata air bag inflators in our vehicles could have a material impact on our business. In addition, product recallscan harm our reputation and cause us to lose customers, particularly if those recalls cause consumers to question the safety orreliability of our products. Conversely not issuing a recall or not issuing a recall on a timely basis can harm our reputation, potentiallyexpose us to significant monetary penalties, and cause us to lose customers for the same reasons as expressed above.
Any disruption in our suppliers’ operations could disrupt our production schedule. Our automotive operations are dependentupon the continued ability of our suppliers to deliver the systems, components, raw materials and parts that we need to manufactureour products. Our use of “just-in-time” manufacturing processes allows us to maintain minimal inventory quantities of systems,components, raw materials and parts. As a result our ability to maintain production is dependent upon our suppliers deliveringsufficient quantities of systems, components, raw materials and parts on time to meet our production schedules. In some instances we
15
GENERAL MOTORS COMPANY AND SUBSIDIARIES
purchase systems, components, raw materials and parts from a single source and may be at an increased risk for supply disruptions.Financial difficulties or solvency problems with our suppliers, including Takata, which may be exacerbated by the cost of remediatingquality issues with these items, could lead to uncertainty in our supply chain or cause supply disruptions for us which could, in turn,disrupt our operations, including production of certain of our higher margin vehicles. Where we experience supply disruptions, wemay not be able to develop alternate sourcing quickly. Any disruption of our production schedule caused by an unexpected shortage ofsystems, components, raw materials or parts even for a relatively short period of time could cause us to alter production schedules orsuspend production entirely.
We are dependent on our manufacturing facilities around the world. We assemble vehicles at various facilities around theworld. These facilities are typically designed to produce particular models for particular geographic markets. No single facility isdesigned to manufacture our full range of vehicles. In some cases certain facilities produce products that disproportionately contributea greater degree to our profitability than others. Should these or other facilities become unavailable either temporarily or permanentlyfor any number of reasons, including labor disruptions, the inability to manufacture vehicles there may result in harm to ourreputation, increased costs, lower revenues and the loss of customers. We may not be able to easily shift production of vehicles at aninoperable facility to other facilities or to make up for lost production. Any new facility needed to replace an inoperablemanufacturing facility would need to comply with the necessary regulatory requirements, need to satisfy our specializedmanufacturing requirements and require specialized equipment. Even though we carry business interruption insurance policies, wemay suffer losses as a result of business interruptions that exceed the coverage available or any losses which may be excluded underour insurance policies.
We operate in a highly competitive industry that has excess manufacturing capacity and attempts by our competitors to sell morevehicles could have a significant negative effect on our vehicle pricing, market share and operating results. The globalautomotive industry is highly competitive and overall manufacturing capacity in the industry exceeds demand. Many manufacturershave relatively high fixed labor costs as well as significant limitations on their ability to close facilities and reduce fixed costs. Ourcompetitors may respond to these relatively high fixed costs by providing subsidized financing or leasing programs, offeringmarketing incentives or reducing vehicle prices. Our competitors may also seek to benefit from economies of scale by consolidatingor entering into other strategic agreements such as alliances intended to enhance their competitiveness.
Domestic manufacturers in lower cost countries, such as China and India, have become competitors in key emerging markets andannounced their intention to export their products to established markets as a low cost alternative to established entry-levelautomobiles. In addition, foreign governments may decide to implement tax and other policies that favor their domestic manufacturersat the expense of international manufacturers, including GM and its joint venture partners. These actions have had, and are expectedto continue to have, a significant negative effect on our vehicle pricing, market share and operating results, and present a significantrisk to our ability to enhance our revenue per vehicle.
We may continue to restructure or divest our operations in various countries, but we may not succeed in doing so. We facedifficult market and operating conditions in certain parts of the world that may require us to restructure or rationalize these operations,which may result in impairments. In many countries across our regions we have experienced challenges in our operations andcontinue to strategically assess the manner in which we operate in certain countries. As we continue to assess our performancethroughout our regions, additional restructuring and rationalization actions may be required and may be material.
Our future competitiveness and ability to achieve long-term profitability depends on our ability to control our costs, whichrequires us to successfully implement operating effectiveness initiatives throughout our automotive operations. We arecontinuing to implement a number of operating effectiveness initiatives to improve productivity and reduce costs. Our futurecompetitiveness depends upon our continued success in implementing these initiatives throughout our automotive operations. Whilesome of the elements of cost reduction are within our control, others, such as interest rates or return on investments, which influenceour expense for pensions, depend more on external factors, and there can be no assurance that such external factors will not materiallyadversely affect our ability to reduce our costs. Reducing costs may prove difficult due to our focus on increasing advertising and ourbelief that engineering and other expenses necessary to improve the performance, safety and customer satisfaction of our vehicles andto continue to innovate our technology and product offerings to meet changing customer needs and market developments are likely toincrease.
16
GENERAL MOTORS COMPANY AND SUBSIDIARIES
Security breaches and other disruptions to our vehicles, information technology networks and systems could interfere with thesafety of our customers or our operations and could compromise the confidentiality of private customer data or our proprietaryinformation. We rely upon information technology networks and systems, including in-vehicle systems and mobile devices, someof which are managed by third-parties, to process, transmit and store electronic information, and to manage or support a variety ofvehicle or business processes and activities. Additionally we collect and store sensitive data, including intellectual property,proprietary business information, proprietary business information of our dealers and suppliers, as well as personally identifiableinformation of our customers and employees, in data centers and on information technology networks. The secure operation of theseinformation technology networks and in-vehicle systems, and the processing and maintenance of this information, is critical to ourbusiness operations and strategy. Despite security measures and business continuity plans, our information technology networks andsystems and in-vehicle systems may be vulnerable to damage, disruptions or shutdowns due to attacks by hackers or breaches due toerrors or malfeasance by employees, contractors and others who have access to our networks and systems or computer viruses. Theoccurrence of any of these events could compromise our networks and the information stored there could be accessed, publiclydisclosed, lost or stolen. These occurrences could also impact vehicle safety. We have been the target of these types of attacks in thepast and future attacks are likely to occur. If successful, these types of attacks on our network or systems, including in-vehicle systemsand mobile devices, or service failures could result in, among other things, the loss of proprietary data, interruptions or delays in ourbusiness operations and damage to our reputation. In addition, any such access, disruption, technological failures, disclosure or otherloss of information could result in legal claims or proceedings, liability or regulatory penalties under laws protecting the privacy ofpersonal information, disrupt operations and reduce the competitive advantage we hope to derive from our investment in advancedtechnologies.
We rely on GM Financial to provide financial services to our dealers and customers in a majority of the markets in which wesell vehicles. GM Financial faces a number of business, economic and financial risks that could impair its access to capital andnegatively affect its business and operations and its ability to provide leasing and financing to retail consumers and commerciallending to our dealers to support additional sales of our vehicles. We rely on GM Financial in North America, Europe,South America and China to support leasing and sales of our vehicles to consumers requiring vehicle financing and also to providecommercial lending to our dealers. Any reduction in GM Financial’s ability to provide such financial services would negatively affectour efforts to support additional sales of our vehicles and expand our market penetration among consumers and dealers.
As an entity operating in the financial services sector, GM Financial is required to comply with a wide variety of laws andregulations that may be costly to adhere to and may affect our consolidated operating results. Compliance with these laws andregulations requires that GM Financial maintain forms, processes, procedures, controls and the infrastructure to support theserequirements and these laws and regulations often create operational constraints both on GM Financial’s ability to implementservicing procedures and on pricing. Laws in the financial services industry are designed primarily for the protection of consumers.The failure to comply with these laws could result in significant statutory civil and criminal penalties, monetary damages, attorneys’fees and costs, possible revocation of licenses and damage to reputation, brand and valued customer relationships.
The primary factors that could adversely affect GM Financial’s business and operations and reduce its ability to provide financingservices at competitive rates include the availability of borrowings under its credit facilities to fund its retail and commercial financeactivities; its ability to access a variety of financing sources including the asset-backed securities market and other secured andunsecured debt markets; the performance of loans and leases in its portfolio, which could be materially affected by delinquencies,defaults or prepayments; wholesale auction values of used vehicles; higher than expected vehicle return rates and the residual valueperformance on vehicles GM Financial leases to customers; fluctuations in interest rates and currencies; and changes to regulation,supervision and licensing across various jurisdictions, including new regulations or sanctions imposed in the U.S. by the Departmentof Justice, SEC and Consumer Financial Protection Bureau.
Our defined benefit pension plans are currently underfunded and our pension funding requirements could increasesignificantly due to a reduction in funded status as a result of a variety of factors, including weak performance of financialmarkets, declining interest rates, changes in laws or regulations, changes in assumptions or investments that do not achieveadequate returns. Our employee benefit plans currently hold a significant amount of equity and fixed income securities. A detaileddescription of the investment funds and strategies is disclosed in Note 14 to our consolidated financial statements, which alsodescribes significant concentrations of risk to the plan investments.
17
GENERAL MOTORS COMPANY AND SUBSIDIARIES
There are additional risks due to the complexity and magnitude of our investments. Examples include implementation of significantchanges in investment policy, insufficient market liquidity in particular asset classes and the inability to quickly rebalance illiquid andlong-term investments.
Our future funding requirements for our U.S. defined benefit pension plans depend upon the future performance of assets placed intrusts for these plans, the level of interest rates used to determine funding levels, the level of benefits provided for by the plans andany changes in government laws and regulations. Future funding requirements generally increase if the discount rate decreases or ifactual asset returns are lower than expected asset returns, assuming other factors are held constant. Our potential funding requirementsare described in Note 14 to our consolidated financial statements.
Factors which affect future funding requirements for our U.S. defined benefit plans generally affect the required funding for non-U.S. plans. Certain plans outside the U.S. do not have assets and therefore the obligation is funded as benefits are paid. If local legalauthorities increase the minimum funding requirements for our non-U.S. plans, we could be required to contribute more funds.
* * * * * * *
Item 1B. Unresolved Staff Comments
None
* * * * * * *
Item 2. Properties
At December 31, 2016 we had over 100 locations in the U.S., excluding our automotive financing operations and dealerships,which are primarily for manufacturing, assembly, distribution, warehousing, engineering and testing. Leased properties are primarilycomposed of warehouses and administration, engineering and sales offices.
We have manufacturing, assembly, distribution, office or warehousing operations in 61 countries, including equity interests inassociated companies which perform manufacturing, assembly, or distribution operations. The major facilities outside the U.S., whichare principally vehicle manufacturing and assembly operations, are located in Argentina, Australia, Brazil, Canada, China, Colombia,Ecuador, Egypt, Germany, Kenya, Mexico, Poland, South Africa, South Korea, Spain, Thailand and the U.K.
GM Financial leases facilities for administration and regional credit centers. GM Financial has 50 facilities, of which 25 are locatedin the U.S. The major facilities outside the U.S. are located in Brazil, Canada, China, Germany, Mexico and the U.K.
We, our subsidiaries, or associated companies in which we own an equity interest, own most of the above facilities.
* * * * * * *
Item 3. Legal Proceedings
Refer to the discussion in the Litigation-Related Liability and Tax Administrative Matters section in Note 15 to our consolidatedfinancial statements for information relating to legal proceedings.
* * * * * * *
Item 4. Mine Safety Disclosures
Not applicable
* * * * * * *
18
GENERAL MOTORS COMPANY AND SUBSIDIARIES
PART II
Item 5. Market for Registrant’s Common Equity, Related Stockholder Matters and Issuer Purchases of Equity Securities
Market Information Shares of our common stock have been publicly traded since November 18, 2010 when our common stockwas listed and began trading on the New York Stock Exchange and the Toronto Stock Exchange. The following table summarizes thequarterly price ranges of our common stock based on high and low prices from intraday trades on the New York Stock Exchange, theprincipal market on which the stock is traded:
Holders At January 31, 2017 we had 1.5 billion issued and outstanding shares of common stock held by 591 holders of record.
Dividends Our Board of Directors began declaring quarterly dividends on our common stock in the three months ended March 31,2014. It is anticipated that dividends on our common stock will continue to be declared and paid quarterly. However the declaration ofany dividend on our common stock is a matter to be acted upon by our Board of Directors in its sole discretion. Any dividend will bepaid out of funds legally available for that purpose. Our payment of dividends in the future will depend on business conditions, ourfinancial condition, earnings, liquidity and capital requirements and other factors. Refer to Item 6. Selected Financial Data for cashdividends declared on our common stock for the years ended December 31, 2016, 2015 and 2014.
Purchases of Equity Securities The following table summarizes our purchases of common stock in the three months endedDecember 31, 2016:
(a) Shares purchased consist of: (1) shares purchased under our previously announced common stock repurchase program; (2) shares retained by usfor the payment of the exercise price upon the exercise of warrants; and (3) shares delivered by employees or directors to us for the payment oftaxes resulting from issuance of common stock upon the vesting of Restricted Stock Units (RSUs) and Restricted Stock Awards (RSAs) relatingto compensation plans. Refer to Note 21 to our consolidated financial statements for additional details on employee stock incentive plans andNote 19 to our consolidated financial statements for additional details on warrants issued.
(b) In January 2016 our Board of Directors authorized the purchase of up to an additional $4 billion of our common stock under our previouslyannounced common stock repurchase program before the end of 2017. In January 2017 we announced that our Board of Directors hadauthorized the purchase of up to an additional $5 billion of our common stock with no expiration date.
(a) In the year ended December 31, 2015 we recorded the reversal of deferred tax asset valuation allowances of $3.9 billion in GME and recordedcharges related to the Ignition Switch Recall for various legal matters of approximately $1.6 billion. In the year ended December 31, 2014 werecorded charges of approximately $2.9 billion in Automotive cost of sales related to recall campaigns and courtesy transportation, a catch-upadjustment of $0.9 billion related to the change in estimate for recall campaigns and a charge of $0.4 billion related to the Ignition Switch Recallcompensation program. In the year ended December 31, 2012 we recorded Goodwill impairment charges of $27.1 billion, the reversal ofdeferred tax asset valuation allowances of $36.3 billion in the U.S. and Canada, pension settlement charges of $2.7 billion and GME long-livedasset impairment charges of $5.5 billion.
(b) In December 2014 we redeemed all of the remaining shares of our Series A Preferred Stock for $3.9 billion, which reduced Net incomeattributable to common stockholders by $0.8 billion. In September 2013 we purchased 120 million shares of our Series A Preferred Stock heldby the UAW Retiree Medical Benefits Trust (New VEBA) for $3.2 billion, which reduced Net income attributable to common stockholders by$0.8 billion.
(c) In the year ended December 31, 2013 GM Financial acquired Ally Financial Inc.’s international operations in Europe and Latin America.
* * * * * * *
Item 7. Management’s Discussion and Analysis of Financial Condition and Results of Operations
This Management’s Discussion and Analysis of Financial Condition and Results of Operations (MD&A) should be read inconjunction with the accompanying audited consolidated financial statements and notes. Forward-looking statements in this MD&Aare not guarantees of future performance and may involve risks and uncertainties that could cause actual results to differ materiallyfrom those projected. Refer to the “Forward-Looking Statements” section of this MD&A and Item 1A. “Risk Factors” for a discussionof these risks and uncertainties.
Non-GAAP Measures Our non-GAAP measures include earnings before interest and taxes (EBIT)-adjusted presented net ofnoncontrolling interests, EPS-diluted-adjusted, return on invested capital-adjusted (ROIC-adjusted) and adjusted automotive free cashflow. Our calculation of these non-GAAP measures may not be comparable to similarly titled measures of other companies due topotential differences between companies in the method of calculation. As a result, the use of these non-GAAP measures haslimitations and should not be considered superior to, in isolation from, or as a substitute for, related U.S. GAAP measures.
These non-GAAP measures allow management and investors to view operating trends, perform analytical comparisons andbenchmark performance between periods and among geographic regions to understand operating performance without regard to itemswe do not consider a component of our core operating performance. Furthermore, these non-GAAP measures allow investors theopportunity to measure and monitor our performance against our externally communicated targets and evaluate the investment
20
GENERAL MOTORS COMPANY AND SUBSIDIARIES
decisions being made by management to improve ROIC-adjusted. Management uses these measures in its financial, investment andoperational decision-making processes, for internal reporting and as part of its forecasting and budgeting processes. Further, ourBoard of Directors uses these and other measures as key metrics to determine management performance under our performance-basedcompensation plans. For these reasons we believe these non-GAAP measures are useful for our investors.
EBIT-adjusted is used by management and can be used by investors to review our consolidated operating results because itexcludes automotive interest income, automotive interest expense and income taxes as well as certain additional adjustments that arenot considered part of our core operations. Examples of adjustments to EBIT include but are not limited to impairment charges relatedto goodwill; impairment charges on long-lived assets and other exit costs resulting from strategic shifts in our operations or discretemarket and business conditions; costs arising from the ignition switch recall and related legal matters; and certain currencydevaluations associated with hyperinflationary economies. For EBIT-adjusted and our other non-GAAP measures, once we have madean adjustment in the current period for an item, we will also adjust the related non-GAAP measure in any future periods in whichthere is an impact from the item.
EPS-diluted-adjusted is used by management and can be used by investors to review our consolidated diluted earnings per shareresults on a consistent basis. EPS-diluted-adjusted is calculated as net income attributable to common stockholders-diluted less certainadjustments noted above for EBIT-adjusted and gains or losses on the extinguishment of debt obligations on an after-tax basis as wellas redemptions of preferred stock and certain income tax adjustments divided by weighted-average common shares outstanding-diluted. Examples of income tax adjustments include the establishment or reversal of significant deferred tax asset valuationallowances.
ROIC-adjusted is used by management and can be used by investors to review our investment and capital allocation decisions. Wedefine ROIC-adjusted as EBIT-adjusted for the trailing four quarters divided by average net assets, which is considered to be theaverage equity balances adjusted for average automotive debt and interest liabilities, exclusive of capital leases; average automotivenet pension and other postretirement benefits (OPEB) liabilities; and average automotive net income tax assets during the sameperiod.
Adjusted automotive free cash flow is used by management and can be used by investors to review the liquidity of our automotiveoperations and to measure and monitor our performance against our capital allocation program and evaluate our automotive liquidityagainst the substantial cash requirements of our automotive operations. We measure adjusted automotive free cash flow as automotivecash flow from operations less capital expenditures adjusted for management actions, primarily related to strengthening our balancesheet, such as prepayments of debt and discretionary contributions to employee benefit plans. Refer to the “Liquidity and CapitalResources” section of this MD&A for our reconciliation of Net Automotive cash provided by (used in) operating activities under U.S.GAAP to this non-GAAP measure.
21
GENERAL MOTORS COMPANY AND SUBSIDIARIES
The following table reconciles Net income attributable to stockholders under U.S. GAAP to EBIT-adjusted used in the calculationof ROIC-adjusted:
(a) These adjustments were excluded because of the unique events associated with the ignition switch recall. These events included the creation ofthe ignition switch recall compensation program, as well as various investigations, inquiries, and complaints from various constituents.
(b) This adjustment was excluded because it resulted from our decision to change the method we use to estimate costs associated with recallcampaigns in GMNA.
(c) These adjustments were excluded because of the significant restructuring of our Thailand operations and the strategic actions taken to focus onthe production of pick-up trucks and SUVs.
(d) This adjustment was excluded because of the devaluation of the Venezuela Bolivar Fuerte (BsF), our inability to transact at the ComplementarySystem of Foreign Currency Administration (SICAD) rate to obtain U.S. Dollars and the market restrictions imposed by the Venezuelan government.
(e) These adjustments were excluded because they were driven by deteriorating market conditions in Russia, which led to asset impairments in2014 and our decision to exit the Russia market in 2015. The Russia exit costs primarily consisted of sales incentives, dealer restructuring andother contract cancellation costs, and asset impairments.
The following table reconciles diluted earnings per common share under U.S. GAAP to EPS-diluted-adjusted:
Years Ended December 31,
2016 2015 2014
Amount Per Share Amount Per Share Amount Per Share
(a) Refer to the reconciliation of Net income attributable to stockholders under U.S. GAAP to EBIT-adjusted within this section of MD&A for thedetails of each individual adjustment.
22
GENERAL MOTORS COMPANY AND SUBSIDIARIES
(b) The tax effect of each adjustment is determined based on the tax laws and valuation allowance status of the jurisdiction in which the adjustmentrelates.
(c) These adjustments primarily consist of the tax benefit related to the valuation allowance reversal in Europe. The adjustment was excludedbecause valuation allowance reversals are not considered part of our core operations.
We define return on equity (ROE) as Net income attributable to stockholders for the trailing four quarters divided by average equityfor the same period. Management uses average equity to provide comparable amounts in the calculation of ROE. The following tablesummarizes the calculation of ROE (dollars in billions):
(a) Refer to the reconciliation of Net income attributable to stockholders under U.S. GAAP to EBIT-adjusted within this section of MD&A.
Overview Our strategic plan includes several major initiatives that we anticipate will help us achieve our goal of 9% to 10%margins on an EBIT-adjusted basis (EBIT-adjusted margins, calculated as EBIT-adjusted divided by Net sales and revenue) by earlynext decade: earn customers for life by delivering great products to our customers, leading the industry in quality and safety andimproving the customer ownership experience; lead in technology and innovation, including OnStar 4G LTE and connected car,alternative propulsion, urban mobility including ride- and car-sharing through Maven and our investment in Lyft, active safetyfeatures and autonomous vehicles; grow our brands, particularly the Cadillac brand in the U.S. and China and the Chevrolet brandglobally; continue our growth in China; continue the growth of GM Financial into our full captive automotive financing company; anddeliver core operating efficiencies.
In addition to our EBIT-adjusted margin improvement goal, our overall financial targets include expected total annual operationaland functional cost savings of $6.5 billion through 2018 compared to 2014 costs, of which approximately $4 billion has been realizedas of December 31, 2016, and which we expect will more than offset our incremental investments in brand building, engineering andtechnology as we launch new products in 2017 and beyond; and execution of our capital allocation program as described in the“Liquidity and Capital Resources” section of this MD&A.
For the year ending December 31, 2017 we expect to continue to generate strong consolidated financial results including improvedtotal net sales and revenue, EBIT-adjusted and EBIT-adjusted margins that equal or exceed the corresponding amounts in 2016,ROIC-adjusted of greater than 25%, Automotive operating cash flow of approximately $15 billion, adjusted automotive free cash flowof approximately $6 billion and EPS-diluted and EPS-diluted-adjusted of between $6.00 and $6.50. We do not consider the potentialfuture impact of adjustments on our expected financial results. We expect these financial results in part to be driven by favorableshifts in mix for our new or refreshed product launches, including crossovers.
23
GENERAL MOTORS COMPANY AND SUBSIDIARIES
The following table reconciles expected automotive net cash provided by operating activities under U.S. GAAP to expectedadjusted automotive free cash flow (dollars in billions):
We face continuing challenges from a market, operating and regulatory standpoint in a number of countries across the globe due to,among other factors, weak economic conditions, competitive pressures, our product portfolio offerings, emissions standards, foreignexchange volatility and political uncertainty. As a result of these conditions, we continue to strategically assess our performance andability to achieve acceptable returns on our invested capital. As we continue to assess our performance, additional restructuring andrationalization actions may be required or a determination may be made that the carrying amount of our long-lived assets may not berecoverable in certain of these countries. Such a determination may give rise to future asset impairments or other charges which mayhave a material impact on our results of operations.
GMNA In the year ended December 31, 2016 industry sales to retail and fleet customers were 21.9 million units representing a1.7% increase compared to the corresponding period in 2015 due to strong consumer demand driven by credit availability, lowinterest rates and low fuel prices.
In the year ended December 31, 2016 our vehicle sales in the U.S., our largest market in North America, totaled 3.0 million unitsfor market share of 17.0%, representing a decrease of 0.3 percentage points compared to the corresponding period in 2015. Thedecrease in our U.S. market share was driven primarily by lower fleet market share due to a planned reduction in rental deliveries,partially offset by higher retail market share. U.S. retail sales, generally more profitable than fleet sales, generated an increase of0.5 percentage points in market share, primarily driven by Chevrolet.
We achieved EBIT-adjusted margins of 10.1% during 2016 on continued strength of U.S. industry light vehicle sales, new productlaunches and material and other cost savings, which partially offset launch related costs. Based on our current cost structure, wecontinue to estimate GMNA’s breakeven point at the U.S. industry level to be in the range of 10.0 — 11.0 million units. We expect tosustain an EBIT-adjusted margin of 10% in 2017 on continued strength of U.S. industry light vehicle sales, key product launches andcontinued focus on overall cost savings.
GME As a result of moderate economic growth across Europe (excluding Russia) automotive industry sales to retail and fleetcustomers continued improving in the year ended December 31, 2016 with industry sales to retail and fleet customers of 18.8 millionunits representing a 6.1% increase compared to the corresponding period in 2015.
Our European operations are benefiting from this trend and vehicle sales continue to show signs of improvement underscored byfurther improvement in our Opel and Vauxhall retail vehicle sales of 1.2 million units for market share of 5.7% in the year endedDecember 31, 2016 consistent with the corresponding period in 2015. We continue to implement various strategic actions tostrengthen our operations and increase our competitiveness.
Despite the improvements we experienced through most of 2016 we were unable to overcome the impacts of the U.K. referendumvote to leave the European Union (Brexit) resulting in a $0.3 billion unfavorable impact due primarily to adverse movement in theBritish Pound against the U.S. Dollar.
We anticipate the impacts of Brexit to continue through 2017. We also anticipate headwinds associated with industry pricingpressures and increased costs associated with depreciation, amortization, marketing and costs associated with our new productlaunches. We intend to mitigate these headwinds with the full benefit of our recently launched Astra and Mokka X along with the2017 launches of the Insignia, Ampera E, and two new crossovers that we believe will substantially increase our competitiveness inthis growing market.
24
GENERAL MOTORS COMPANY AND SUBSIDIARIES
The German Ministry of Transportation and the Kraftfahrt-Bundesamt have requested the participation of a number of automotivemanufacturers, including our German subsidiary, in continuing discussions on emissions control issues and have also requested, fromtime to time, written responses from our subsidiary on the subject. Our German subsidiary has participated in these discussions andhas provided the requested responses to inquiries concerning nitrogen oxide emission control systems of its diesel engines. Inaddition, the German and the EU Parliaments have instigated Inquiry Commissions into government agencies’ oversight of emissionsenforcement, requesting our German subsidiary’s participation. At the same time, the German government has instigated furtherindustry-wide inquiries about CO2 emissions. This scrutiny, regulatory changes and increased enforcement has led to increased testingand re-testing of our vehicles and analysis of their emissions control systems, which could lead to increased costs, penalties, negativepublicity or reputational impact, and recall activity if regulators determine that emission levels and required regulatory complianceshould be based on either a wider spectrum of driving conditions for future testing parameters or stricter or novel interpretations andconsequent enforcement of existing requirements. No assurance can be given that the ultimate outcome of any potential investigationsor increased testing resulting from this scrutiny would not materially and adversely affect us.
GMIO In the year ended December 31, 2016 China industry sales were 28.3 million units, representing an increase of 12.9%compared to the corresponding period in 2015. In the year ended December 31, 2016 our China wholesale volumes increased by 4.9%compared to the corresponding period in 2015. Our market share decreased to 13.8%, down 1.1 percentage points as our volumegrowth was less than that of the industry. Strong growth in Cadillac, Buick and Baojun passenger vehicles, including SUVs, werepartially offset by lower Chevrolet sales because of model changeover and lower Wuling sales because of a continued segment shiftaway from mini commercial vehicles. In the year ended December 31, 2016 our Automotive China JVs generated equity income of$2.0 billion. We expect moderate industry growth in 2017 and continuation of pricing pressures which will continue to pressuremargins. We continue to expect an increase in vehicle sales driven by new launches and expect to sustain strong China equity incomeby focusing on vehicle mix improvements, cost improvements and efficiencies, and downstream performance optimization.
A weaker economy due partially to lower oil prices and foreign exchange volatility, among other factors, negatively impacted theoverall automotive industry in the rest of Asia Pacific, Africa and the Middle East and led to industry sales to retail and fleetcustomers of 18.9 million units, representing a decrease of 3.2% in the year ended December 31, 2016 compared to the correspondingperiod in 2015. In the year ended December 31, 2016 our retail sales totaled 0.7 million units leading to a market share of 3.6%,representing a decrease of 0.5 percentage points compared to the corresponding period in 2015. The decrease in retail sales volumeswas due primarily to overall industry volume declines, foreign currency availability and economic challenges in the Middle East,Egypt and South Africa.
In 2017 we expect the operating environment to remain challenging. As we strategically assess our performance and the manner inwhich we operate in certain countries, additional restructuring and rationalization actions may be required and may have a materialimpact on our results of operations.
GMSA The South American automotive industry continues to be challenged by weak economic conditions and lack of consumerconfidence. Industry sales to retail and fleet customers were 3.7 million units in the year ended December 31, 2016 representing a12.3% decrease compared to the corresponding period in 2015. In the year ended December 31, 2016, our vehicle sales in Brazil, ourlargest market in South America, totaled 0.3 million units for market share of 16.9%, representing an increase of 1.8 percentage pointscompared to the corresponding period in 2015 primarily driven by a refreshed portfolio.
In 2017 we expect conditions in South America to improve as the economy recovers driven by higher consumer confidence andlower interest rates. We will continue to monitor conditions in South America and take actions to address challenges in the region.
Corporate In connection with our capital allocation program, as detailed in the “Liquidity and Capital Resources” section of thisMD&A, we previously announced that our Board of Directors had authorized programs to purchase up to $5 billion and $4 billion ofour common stock before the end of 2016 and 2017. We completed the $5 billion program in the three months ended September 30,2016 and $1 billion of the $4 billion program in the three months ended December 31, 2016. In January 2017 we announced that ourBoard of Directors had authorized the purchase of up to an additional $5 billion of our common stock with no expiration date,subsequent to completing the remaining portion of the previously announced programs. Through February 1, 2017 we had purchased180 million shares of our outstanding common stock under our common stock repurchase program for $6.0 billion.
25
GENERAL MOTORS COMPANY AND SUBSIDIARIES
The Ignition Switch Recall has led to various inquiries, investigations, subpoenas, requests for information and complaints fromagencies or other representatives of U.S., federal, state and Canadian governments. In addition these and other recalls have resulted ina number of claims and lawsuits. Such lawsuits and investigations could in the future result in the imposition of material damages,fines, civil consent orders, civil and criminal penalties or other remedies. Refer to Note 15 to our consolidated financial statements foradditional information.
Takata Matters On May 4, 2016 NHTSA issued an amended consent order requiring Takata to file defect information reports(DIRs) for previously unrecalled front airbag inflators that contain an ammonium nitrate-based propellant without a moistureabsorbing desiccant on a multi-year, risk-based schedule through 2019 impacting tens of millions of vehicles produced by numerousautomotive manufacturers. NHTSA concluded that the likely root cause of the rupturing of the airbag inflators is a function of time,temperature cycling and environmental moisture. On May 16, 2016 Takata issued its first DIR in connection with the amendedconsent order, and on January 3, 2017, Takata issued its second set of DIRs.
Although we do not believe there is a safety defect at this time in any GM vehicles within the scope of the Takata DIR, incooperation with NHTSA we filed Preliminary DIRs on May 27, 2016, updated as of June 13, 2016, covering 2.5 million of certain ofour GMT900 vehicles, which are full-size pick-up trucks and SUVs. On November 15, 2016, we filed a petition for inconsequentialityand request for deferral of determination regarding certain GMT900 vehicles equipped with Takata inflators. On November 28, 2016,NHTSA granted GM’s deferral request in connection with this petition. The deferral provides GM until August 31, 2017 to presentevidence and analysis that our vehicles do not pose an unreasonable risk to motor vehicle safety. We believe that this timeline willpermit us to complete our testing of the relevant non-desiccated Takata inflators in GMT900 vehicles and to prove to NHTSA that theinflators in these vehicles do not present an unreasonable risk to safety and that no repair will ultimately be required.
Takata filed a second set of equipment DIRs on January 3, 2017 and we filed a second set of Preliminary DIRs for certain GMT900vehicles on January 10, 2017. These January 2017 DIRs are consistent with GM’s May 2016 DIRs. On the same day, we also filed asecond petition for inconsequentiality and deferral of decision with respect to the vehicles subject to our January 2017 DIRs. OnJanuary 18, 2017, NHTSA consolidated our first and second petitions for inconsequentiality and will rule on both at the same time.
We believe these vehicles are currently performing as designed and ongoing testing continues to support the belief that thevehicles’ unique design and integration mitigates against inflator degradation. For example, the airbag inflators used in the vehiclesare a variant engineered specifically for our vehicles, and include features such as greater venting, unique propellant waferconfigurations, and machined steel end caps. The inflators are packaged in the instrument panel in such a way as to minimizeexposure to moisture from the climate control system. Also, these vehicles have features that minimize the maximum temperature towhich the inflator will be exposed, such as larger interior volumes and standard solar absorbing windshields and side glass. Webelieve that the results of further testing and analysis will demonstrate that the vehicles do not present an unreasonable risk to safetyand that no repair will ultimately be required. Accordingly, no warranty provision has been made for any repair associated with ourvehicles subject to the Preliminary DIRs and amended consent order. However, in the event we are ultimately obligated to repair theinflators in these vehicles, we estimate a reasonably possible cost of up to $880 million for the 6.9 million vehicles subject to eitherthe Preliminary DIRs or future Takata DIRs under the amended consent order.
Through January 27, 2017 we were aware of one putative class action pending against GM in federal court in the U.S., one putativeclass action in Mexico and seven putative class actions pending in various Provincial Courts in Canada arising out of allegations thatairbag inflators manufactured by Takata are defective. In addition, the New Mexico Attorney General has initiated litigation againstTakata and numerous automotive manufacturers, including GM. At this early stage of these proceedings, we are unable to provide anevaluation of the likelihood that a loss will be incurred or an estimate of the amounts or range of possible loss.
Automotive Financing — GM Financial Summary and Outlook GM Financial has expanded its leasing, near prime and primelending programs in North America; therefore, leasing and prime lending have become a larger percentage of the originations andretail portfolio balance. GM Financial’s retail penetration in North America grew to approximately 33% in the year endedDecember 31, 2016 from approximately 30% in the corresponding period in 2015 as a result of the expanded leasing and lendingprograms. In the year ended December 31, 2016 GM Financial’s revenue consisted of leased vehicle income of 62%, retail finance
26
GENERAL MOTORS COMPANY AND SUBSIDIARIES
charge income of 30%, commercial finance charge income of 5% and other income of 3%. We believe that offering a comprehensivesuite of financing products will generate incremental sales of our vehicles, drive incremental GM Financial earnings and help supportour sales throughout various economic cycles.
Consolidated Results We review changes in our results of operations under five categories: volume, mix, price, cost and other.Volume measures the impact of changes in wholesale vehicle volumes driven by industry volume, market share and changes in dealerstock levels. Mix measures the impact of changes to the regional portfolio due to product, model, trim, country and option penetrationin current year wholesale vehicle volumes. Price measures the impact of changes related to Manufacturer’s Suggested Retail Price andvarious sales allowances. Cost includes primarily: (1) material and freight; (2) manufacturing, engineering, advertising, administrativeand selling and warranty expense; and (3) non-vehicle related activity. Other includes primarily foreign exchange and non-vehiclerelated automotive revenues as well as equity income or loss from our nonconsolidated affiliates. Refer to the regional sections of thisMD&A for additional information.
Total Net Sales and Revenue
Years Ended December 31, Favorable/(Unfavorable) %
The most significant element of our Automotive cost of sales is material cost which makes up approximately two-thirds of the totalamount. The remaining portion includes labor costs, depreciation and amortization, engineering, and product warranty and recallcampaigns.
Factors which most significantly influence a region’s profitability are industry volume, market share, and the relative mix ofvehicles (cars, trucks, crossovers) sold. Variable profit is a key indicator of product profitability. Variable profit is defined as revenueless material cost, freight, the variable component of manufacturing expense and warranty and recall-related costs. Vehicles withhigher selling prices generally have higher variable profit.
Refer to the regional sections of this MD&A for additional information on volume and mix.
In the year ended December 31, 2016 unfavorable Cost was due primarily to: (1) increased other costs of $2.1 billion primarilymanufacturing, engineering, depreciation and amortization and warranty which are inclusive of launch costs; partially offset by(2) decreased material and freight costs of $2.8 billion related to carryover vehicles, partially offset by increased material and freightcosts of $1.7 billion related to vehicles launched within the last twelve months incorporating significant exterior and/or interiorchanges (Majors); and (3) impairments of $0.4 billion related to Thailand and Venezuela in 2015. In the year ended December 31,2016 favorable Other was due primarily to the foreign currency effect of $2.1 billion due primarily to the BsF devaluation in 2015 andthe weakening of the Argentine Peso, Canadian Dollar and other currencies against the U.S. Dollar; and costs related to our exit ofRussia of $0.2 billion in 2015.
In the year ended December 31, 2015 favorable Cost was due primarily to (1) a decrease in recall campaign and courtesytransportation charges of $2.8 billion, including the $0.9 billion catch-up adjustment; (2) decreased material and freight costs of$2.9 billion related to carryover vehicles, partially offset by increased material and freight costs of $0.7 billion related to Majors; (3) anet decrease in separation charges of $0.4 billion primarily related to the Bochum plant closing in GME in 2014; (4) favorableintangible asset amortization of $0.3 billion; and (5) decreased costs of $0.3 billion related to parts and accessories sales; partiallyoffset by (6) an increase in engineering expense of $0.4 billion; and (7) an increase in warranty costs of $0.3 billion. In the year endedDecember 31, 2015 favorable Other was due primarily to favorable net foreign currency effect of $6.9 billion due primarily to the
28
GENERAL MOTORS COMPANY AND SUBSIDIARIES
weakening of the Euro, Brazilian Real, Canadian Dollar, British Pound and Mexican Peso against the U.S. Dollar, partially offset byfurther BsF devaluation.
Automotive Selling, General and Administrative Expense
In the year ended December 31, 2016 Automotive selling, general and administrative expense decreased due primarily to: (1) a netdecrease in charges of $1.5 billion for matters related to the ignition switch recall; and (2) favorable net foreign currency effect of$0.2 billion due primarily to the weakening of various currencies against the U.S. Dollar.
In the year ended December 31, 2015 Automotive selling, general and administrative expense increased due primarily to:(1) charges related to the Ignition Switch Recall of $1.4 billion; (2) increased advertising expense of $0.2 billion; (3) an increase inemployee related costs of $0.1 billion; and (4) costs related to the Russia exit of $0.1 billion; partially offset by (5) favorable netforeign currency effect of $0.7 billion due primarily to the weakening of the Euro and Brazilian Real against the U.S. Dollar.
In the year ended December 31, 2016 Income tax expense increased due primarily to the absence of the 2015 income tax benefitfrom the release of GME’s valuation allowance of $3.9 billion and an increase in income tax expense of $1.0 billion due primarily toan increase in pre-tax income; partially offset by $0.6 billion in tax benefits related to foreign currency losses.
In the year ended December 31, 2015 Income tax expense decreased due primarily to the income tax benefit from the release ofGME’s valuation allowances of $3.9 billion; partially offset by an increase in income tax expense of $1.8 billion due primarily to anincrease in pre-tax income.
For the year ended December 31, 2016 our effective tax rate was 21%, and we expect the effective tax rate to be similar for the yearending December 31, 2017. Refer to Note 16 to our consolidated financial statements for additional information related to Income taxexpense (benefit).
29
GENERAL MOTORS COMPANY AND SUBSIDIARIES
GM North America
Years Ended December 31, Favorable/(Unfavorable) %
GMNA Total Net Sales and Revenue In the year ended December 31, 2016 Total net sales and revenue increased due primarilyto: (1) increased net wholesale volumes reflecting our strategic decision to reduce daily rental activity, strong retail demand for theChevrolet Malibu and Spark, full-size trucks and SUVs and the Buick Envision; (2) favorable pricing for Majors of $1.8 billion; and(3) favorable mix associated with full-size trucks and SUVs and a reduction in rental car activities, partially offset by the ChevroletMalibu and Spark; partially offset by (4) unfavorable Other due primarily to the foreign currency effect resulting from the weakeningof the Mexican Peso and Canadian Dollar against the U.S. Dollar.
In the year ended December 31, 2015 Total net sales and revenue increased due primarily to: (1) increased net wholesale volumesassociated with full-size SUVs, mid-size pick-ups and the Chevrolet Trax, Impala and Cruze, partially offset by decreases in theChevrolet Malibu; and (2) favorable mix due to full-size SUVs and full-size pick-ups partially offset by an increase in rental cars soldat auction and the Chevrolet Trax; partially offset by (3) unfavorable pricing primarily related to carryovers including passenger carsand compact SUVs; and (4) unfavorable Other due primarily to unfavorable foreign currency effect related to the weakening of theCanadian Dollar and the Mexican Peso against the U.S. Dollar of $1.7 billion, partially offset by increased revenue related to OnStarof $0.2 billion.
GMNA EBIT-Adjusted The most significant factors which influence profitability are industry volume and market share. Whilenot as significant as industry volume and market share, another factor affecting profitability is the relative mix of vehicles sold.Trucks, crossovers and cars sold currently have a variable profit of approximately 180%, 70% and 30% of our GMNA portfolio on aweighted-average basis.
In the year ended December 31, 2016 EBIT-adjusted increased due primarily to: (1) increased net wholesale volumes; and(2) favorable pricing; partially offset by (3) unfavorable Cost including increased material costs for Majors of $1.1 billion,restructuring charges of $0.2 billion related to the UAW cash severance incentive program and increased other costs of $2.8 billionprimarily engineering, depreciation and amortization, manufacturing, warranty and marketing which are inclusive of launch costs,partially offset by favorable material and freight costs related to carryover vehicles of $2.0 billion; (4) unfavorable mix associatedwith the Chevrolet Malibu, Volt and Spark, partially offset by full-size trucks and SUVs and a reduction in rental car activities; and(5) unfavorable Other due primarily to the foreign currency effect resulting from the weakening of the Mexican Peso and CanadianDollar against the U.S. Dollar.
In the year ended December 31, 2015 EBIT-adjusted increased due primarily to: (1) favorable Cost of $2.9 billion includingdecreased material and freight costs of $2.2 billion and a decrease in recall-related charges of $1.9 billion, partially offset by warranty
30
GENERAL MOTORS COMPANY AND SUBSIDIARIES
of $0.3 billion, engineering of $0.3 billion, General Motors of Canada Company (GM Canada) pension curtailment and restructuringcharges of $0.2 billion and advertising of $0.2 billion; (2) increased net wholesale volumes; and (3) favorable mix; partially offset by(4) unfavorable pricing.
GME Total Net Sales and Revenue In the year ended December 31, 2016 Total net sales and revenue remained flat due primarilyto: (1) increased net wholesale volumes associated with higher demand primarily for the Astra across the region, partially offset bydecreases across the Russian portfolio and decreased sales of the Corsa and Insignia in the U.K.; and (2) favorable pricing for Majorsprimarily related to the Astra; offset by (3) unfavorable country and vehicle mix; and (4) unfavorable Other due primarily to theforeign currency effect resulting from the weakening of the British Pound against the U.S. Dollar.
In the year ended December 31, 2015 Total net sales and revenue decreased due primarily to: (1) decreased net wholesale volumesassociated with decreases across the Russian portfolio and lower demand for the Zafira multipurpose vehicle across the region,partially offset by higher demand primarily for the Vivaro commercial van, the Mokka crossover and the Astra and the recentlylaunched KARL passenger vehicles across the region; and (2) unfavorable Other due primarily to the foreign currency effect resultingfrom the weakening of the Euro, British Pound and Russian Ruble against the U.S. Dollar; partially offset by (3) favorable pricingprimarily related to the next generation Corsa passenger vehicle and Vivaro and the recently launched next generation Astra.
GME EBIT (Loss)-Adjusted In the year ended December 31, 2016 EBIT (loss)-adjusted decreased due primarily to: (1) favorableCost due primarily to favorable material and freight costs related to carryover vehicles of $0.5 billion and fixed cost improvements of$0.5 billion, partially offset by unfavorable material performance for Majors related to the Astra of $0.4 billion; (2) favorable pricing;and (3) increased net wholesale volumes; partially offset by (4) unfavorable country and vehicle mix; and (5) unfavorable Other dueprimarily to the foreign currency effect resulting from the weakening of the British Pound against the U.S. Dollar as a result of Brexit.
In the year ended December 31, 2015 EBIT (loss)-adjusted decreased due primarily to: (1) favorable pricing; and (2) favorable Costdue primarily to a net decrease in restructuring related charges of $0.7 billion, partially offset by unfavorable material costs of$0.2 billion primarily related to the next generation Corsa and Vivaro; partially offset by (3) decreased net wholesale volumes; and(4) unfavorable Other due to unfavorable foreign currency effect of $0.2 billion.
The vehicle sales of our Automotive China JVs are not recorded in Total net sales and revenue. The results of our joint ventures arerecorded in Equity income, which is included in EBIT-adjusted above.
GMIO Total Net Sales and Revenue In the year ended December 31, 2016 Total net sales and revenue decreased due primarilyto: (1) decreased wholesale volumes of pick-up trucks and passenger cars in Egypt and South Africa and full-size trucks and SUVs inthe Middle East due to low oil prices, partially offset by increased sales of the Chevrolet Spark and Malibu in Korea and the MiddleEast; and (2) unfavorable Other of $0.4 billion due primarily to the foreign currency effect resulting from the weakening of theEgyptian Pound and South African Rand against the U.S. Dollar.
In the year ended December 31, 2015 Total net sales and revenue decreased due primarily to: (1) decreased wholesale volumesassociated with the withdrawal of the Chevrolet brand from Europe, decreased sales in Korea, India, Southeast Asia and South Africa,partially offset by increased wholesale volumes of new full-size trucks and SUVs in the Middle East; and (2) unfavorable Other dueprimarily to the foreign currency effect of $1.0 billion resulting from the weakening of the Australian Dollar, South Korean Won andSouth African Rand against the U.S. Dollar and decreased sales of components, parts and accessories of $0.4 billion; partially offsetby (3) favorable mix and pricing primarily due to increased sales of full-size trucks and SUVs in the Middle East.
GMIO EBIT-Adjusted In the year ended December 31, 2016 EBIT-adjusted decreased due primarily to: (1) unfavorable mix dueprimarily to decreased sales of full size trucks and SUVs in the Middle East as a result of a weaker economy due to low oil prices;(2) unfavorable Other due primarily to the foreign currency effect resulting from the weakening of the Egyptian Pound andSouth African Rand against the U.S. Dollar; and (3) decreased wholesale volume; partially offset by (4) favorable Cost associatedwith material and freight performance related to carryover vehicles.
In the year ended December 31, 2015 EBIT-adjusted increased due primarily to: (1) favorable pricing and mix in the Middle Eastdue primarily to sales of new full-size trucks and SUVs; and (2) favorable cost due primarily to favorable material and freight
32
GENERAL MOTORS COMPANY AND SUBSIDIARIES
performance of $0.3 billion; partially offset by (3) decreased net wholesale volumes; and (4) unfavorable Other due to the foreigncurrency effect.
We view the Chinese market as important to our global growth strategy and are employing a multi-brand strategy led by our Buickand Chevrolet brands. In the coming years we plan to increasingly leverage our global architectures to increase the number of productofferings under the Buick, Chevrolet and Cadillac brands in China and continue to grow our business under the local Baojun andWuling brands, with Baojun seizing the growth opportunities in less developed cities and markets. We operate in the Chinese marketthrough a number of joint ventures and maintaining good relations with our joint venture partners, which are affiliated with theChinese government, is an important part of our China growth strategy.
The following tables summarize certain key operational and financial data for the Automotive China JVs (vehicles in thousands):
GMSA Total Net Sales and Revenue In the year ended December 31, 2016 Total net sales and revenue decreased due primarilyto: (1) decreased wholesale volumes due to difficult economic conditions in Brazil and Venezuela that drove an industry reduction of12.3% compared to the same period in 2015 offset by a gain in market share of 1.8% in Brazil; (2) unfavorable Other due primarily tothe foreign currency effect resulting from the weakening of all currencies across the region against the U.S. Dollar; partially offset by(3) favorable pricing related to carryover vehicles due primarily to high inflation in Argentina; and (4) favorable mix due to the launchof Chevrolet Cruze in Brazil and increased sales of pick-up trucks in Argentina.
In the year ended December 31, 2015 Total net sales and revenue decreased due primarily to: (1) decreased wholesale volumesassociated with lower demand for the Chevrolet Celta, Onix and Prisma small vehicles and Cobalt sedan in Brazil and decreases
33
GENERAL MOTORS COMPANY AND SUBSIDIARIES
across the portfolio primarily in Chile and Colombia caused by difficult economic conditions; and (2) unfavorable Other due primarilyto unfavorable foreign currency effect due to the weakening of all currencies across the region against the U.S. Dollar; partially offsetby (3) favorable pricing due primarily to high inflation in Venezuela and Argentina; and (4) favorable vehicle mix due to decreasedsales of lower priced vehicles in Brazil and increased sales of the Chevrolet Silverado and Cruze in Venezuela.
GMSA EBIT (Loss)-Adjusted In the year ended December 31, 2016 EBIT (loss)-adjusted decreased due primarily to:(1) favorable pricing; and (2) favorable Cost due primarily to lower engineering expenses; partially offset by (3) unfavorable mix dueprimarily to the lack of vehicle sales in Venezuela; (4) unfavorable wholesale volumes; and (5) unfavorable Other due primarily to theforeign currency effect resulting from the weakening of all currencies across the region against the U.S. Dollar.
In the year ended December 31, 2015 EBIT (loss)-adjusted increased due primarily to: (1) decreased wholesale volumes; and(2) unfavorable Other due primarily to the foreign currency effect due to the weakening of all currencies across the region against theU.S. Dollar; and (3) unfavorable Cost due primarily to IT expenses; partially offset by (4) favorable pricing.
Venezuelan Operations Our operations in Venezuela, which remain consolidated, continue to be negatively impacted byeconomic recession and political instability in the country. During the years ended December 31, 2015 and 2014 we recordeddevaluation and asset impairment charges of $0.7 billion and $0.4 billion in Automotive cost of sales related to our inability totransact at the SICAD rate to obtain U.S. Dollars and the market restrictions imposed by the Venezuelan government. We monitor theenvironment in Venezuela closely to assess whether changes evolve such that we no longer maintain a controlling financial interest.Absent ongoing vehicle production, our Venezuelan subsidiaries may require additional financial support. At this time no decision hasbeen made whether we will provide further financial support if required. If a determination is made in the future that we no longermaintain control, we may incur a charge based on exchange rates at December 31, 2016 of up to $0.1 billion.
GM Financial
Years Ended December 31, 2016 vs. 2015 Change 2015 vs. 2014 Change
GM Financial Revenue In the year ended December 31, 2016 Total revenue increased due primarily to increased leased vehicleincome of $3.1 billion due to a larger lease portfolio.
In the year ended December 31, 2015 Total revenue increased due primarily to: (1) increased leased vehicle income of $1.7 billiondue to a larger lease portfolio; partially offset by (2) net decrease in finance charge income and other income of $0.1 billion whichconsists of a decrease of $0.3 billion outside of North America, partially offset by an increase of $0.2 billion in North America.
GM Financial Earnings Before Income Taxes-Adjusted In the year ended December 31, 2016 Earnings before income taxes-adjusted increased due primarily to: (1) increased revenue of $3.1 billion; partially offset by (2) increased leased vehicle expenses of$2.3 billion due to a larger lease portfolio; (3) net increase in interest expense of $0.5 billion due to an increase in average debtoutstanding; and (4) increased operating expenses of $0.2 billion.
In the year ended December 31, 2015 Earnings before income taxes-adjusted remained flat due primarily to: (1) increased revenueof $1.6 billion; and (2) increased equity income of $0.1 billion from SAIC-GMAC Automotive Finance Company Limited (SAIC-GMAC); offset by (3) increased leased vehicle expenses of $1.4 billion due to a larger lease portfolio; (4) net increase in interestexpense of $0.2 billion which consists of an increase of $0.4 billion in North America due to an increase in average debt outstanding,
34
GENERAL MOTORS COMPANY AND SUBSIDIARIES
partially offset by a decrease of $0.2 billion outside of North America; and (5) net increase in operating expenses of $0.1 billion whichconsists of an increase of $0.2 billion in North America, partially offset by a decrease of $0.1 billion outside of North America.
Liquidity and Capital Resources We believe that our current level of cash and cash equivalents, marketable securities andavailability under our revolving credit facilities will be sufficient to meet our liquidity needs. We expect to have substantial cashrequirements going forward which we plan to fund through total available liquidity and cash flows generated from operations. Wealso maintain access to the capital markets and may issue debt or equity securities from time to time, which may provide an additionalsource of liquidity. Our future uses of cash, which may vary from time to time based on market conditions and other factors, arefocused on three objectives: (1) reinvest in our business; (2) maintain an investment-grade balance sheet; and (3) return excess cash tostockholders. Our known future material uses of cash include, among other possible demands: (1) capital expenditures ofapproximately $9 billion annually as well as payments for engineering and product development activities; (2) payments associatedwith previously announced vehicle recalls, the settlements of the multidistrict litigation and any other recall-related contingencies;(3) payments to service debt and other long-term obligations, including discretionary and mandatory contributions to our pensionplans; (4) dividend payments on our common stock that are declared by our Board of Directors; and (5) payments to purchase sharesof our common stock authorized by our Board of Directors.
Our liquidity plans are subject to a number of risks and uncertainties, including those described in the “Forward-LookingStatements” section of this MD&A and Item 1A. Risk Factors, some of which are outside of our control.
We continue to monitor and evaluate opportunities to strengthen our competitive position over the long-term while maintaining aninvestment-grade balance sheet. These actions may include opportunistic payments to reduce our long-term obligations as well as thepossibility of acquisitions, dispositions, investments with joint venture partners and strategic alliances that we believe would generatesignificant advantages and substantially strengthen our business. These actions may negatively impact our liquidity in the short term.
Our senior management evaluates our capital allocation program on an ongoing basis and recommends any modifications to theprogram to our Board of Directors not less than once annually. Over the last six months of 2016, management conducted an extensivereview of various capital allocation strategies including consideration of potential variations in our capital structure, changes in thepacing and/or nature of return of capital to shareholders (including a potential increase in our share repurchase program) and issuanceor distribution of preferred or other securities. We regularly engage with our shareholders and received input as to the views of certainof our shareholders on capital allocation during this review. Ultimately, management reaffirmed and our Board of Directors approvedthe capital allocation program, which includes reinvesting in our business at an average target ROIC-adjusted rate of 20% or greater,maintaining a strong investment grade balance sheet, including a target cash balance of $20 billion, and returning remaining free cashflow to shareholders. We also announced in January 2017 that our Board of Directors had authorized the purchase of up to anadditional $5 billion of our common stock with no expiration date, subsequent to completing the remaining portion of the previouslyannounced programs.
As part of our capital allocation program we previously announced that our Board of Directors had authorized programs to purchaseup to $5 billion and $4 billion of our common stock before the end of 2016 and 2017. We completed the $5 billion program in thethree months ended September 30, 2016 and $1 billion of the $4 billion program in the three months ended December 31, 2016.Through February 1, 2017 we had purchased an aggregate of 180 million shares of our outstanding common stock under our commonstock repurchase program for $6.0 billion. In the year ended December 31, 2016, we returned total cash to shareholders of$4.8 billion, consisting of dividends paid on our common stock and purchases of our common stock.
In February 2016 we issued $2.0 billion in aggregate principal amount of automotive senior unsecured notes and used the entire netproceeds to fund discretionary contributions to our U.S. hourly pension plan in the year ended December 31, 2016 to improve itsfunded status. Refer to Note 13 to our consolidated financial statements for additional information on the senior unsecured notes.
In May 2016 we amended our two primary revolving credit facilities, increasing our aggregate borrowing capacity from$12.5 billion to $14.5 billion. These facilities consist of a three-year, $4.0 billion facility and a five-year, $10.5 billion facility. Bothfacilities are available to us as well as certain wholly-owned subsidiaries, including GM Financial. The three-year, $4.0 billion facility
35
GENERAL MOTORS COMPANY AND SUBSIDIARIES
allows for borrowings in U.S. Dollars and other currencies and includes a GM Financial borrowing sub-limit of $1.0 billion and aletter of credit sub-facility of $1.0 billion. The five-year, $10.5 billion facility allows for borrowings in U.S. Dollars and othercurrencies and includes a GM Financial borrowing sub-limit of $3.0 billion and a letter of credit sub-limit of $500 million.
Automotive Liquidity Total available liquidity includes cash, cash equivalents, marketable securities and funds available undercredit facilities. The amount of available liquidity is subject to intra-month and seasonal fluctuations and includes balances held byvarious business units and subsidiaries worldwide that are needed to fund their operations.
We manage our liquidity primarily at our treasury centers as well as at certain of our significant consolidated overseas subsidiaries.Over 90% of our available liquidity excluding funds available under credit facilities was held within North America and at ourregional treasury centers at December 31, 2016. Our available liquidity includes approximately $0.6 billion deemed indefinitelyreinvested in our foreign subsidiaries. We have used and will continue to use other methods including intercompany loans to utilizethese funds across our global operations as needed.
Our cash equivalents and marketable securities balances are primarily denominated in U.S. Dollars and include investments in U.S.government and agency obligations, foreign government securities, time deposits, corporate debt securities and mortgage and asset-backed securities. Our investment guidelines, which we may change from time to time, prescribe certain minimum credit worthinessthresholds and limit our exposures to any particular sector, asset class, issuance or security type. The majority of our currentinvestments in debt securities are with A/A2 or better rated issuers.
We use credit facilities as a mechanism to provide additional flexibility in managing our global liquidity. The total size of our creditfacilities was $14.6 billion and $12.6 billion at December 31, 2016 and 2015, which consisted principally of our two primaryrevolving credit facilities. We did not have any borrowings against our primary facilities, but had letters of credit outstanding underour sub-facility of $0.6 billion at December 31, 2016. GM Financial had access to our revolving credit facilities at December 31, 2016and 2015 but did not borrow against them. Refer to Note 13 to our consolidated financial statements for additional information oncredit facilities. At December 31, 2016 and 2015 we had intercompany loans from GM Financial of $0.5 billion and $0.4 billion,which consisted primarily of commercial loans to dealers we consolidate, and we had no intercompany loans to GM Financial. Thefollowing table summarizes our automotive available liquidity (dollars in billions):
In the year ended December 31, 2016 the change in Pension and OPEB activities was due primarily to discretionary contributionsof $2.0 billion made to our U.S. hourly pension plan and pension income from the refinement to the discount rate methodology forservice and interest cost. The change in Working capital was due primarily to increased accounts payable due to increased productionvolumes and decreased inventories due to lower repurchased rental car activity. The change in Accrued and other liabilities was dueprimarily to an increase in sales incentives of $1.6 billion. The change in Income taxes was due primarily to the reversal of valuationallowances in 2015. The change in Other was due primarily to foreign exchange and increase in deposits.
In the year ended December 31, 2015 the change in Working capital was due primarily to increased accounts payable due toincreased production volumes. The change in Equipment on operating leases was due primarily to the reduction of units provided torental car companies. The change in Accrued and other liabilities was due primarily to recalls and deposits from rental car companies.The change in Income taxes was due primarily to the reversal of valuation allowances, partially offset by deferred tax expense in 2015compared to deferred tax benefit in 2014.
In the year ended December 31, 2016 the change in Acquisitions and liquidations of marketable securities, net was due primarily tothe acquisition of sovereign debt and corporate debt available-for-sale securities. In the year ended December 31, 2015 the change inAcquisitions and liquidations of marketable securities, net was due primarily to the liquidation of our sovereign debt tradingsecurities.
In the year ended December 31, 2016 the change in Net automotive cash used in financing activities was due primarily to theissuance of senior unsecured notes and the purchase of common stock as part of the common stock repurchase program. In the yearended December 31, 2015 the change in Net automotive cash used in financing activities was due primarily to the purchase ofcommon stock as part of the common stock repurchase program.
Adjusted Automotive Free Cash Flow (Dollars in Billions)
Status of Credit Ratings We receive ratings from four independent credit rating agencies: DBRS Limited, Fitch Ratings (Fitch),Moody’s Investor Service (Moody’s) and Standard & Poor’s (S&P). All four credit rating agencies currently rate our corporate creditat investment grade. The following table summarizes our credit ratings at February 1, 2017:
Rating actions taken by each of the credit rating agencies from January 1, 2016 through February 1, 2017 were as follows:(1) Moody’s revised their outlook to Positive from Stable in February 2016, and upgraded our debt rating, including the revolvingcredit facilities, to Baa2 from Baa3, and revised their outlook to Stable from Positive in January 2017. Our senior unsecured bondswere upgraded to Baa3 from Ba1 and remain notched below our revolving credit facilities rating; (2) S&P revised their outlook toPositive from Stable in April 2016, and upgraded our corporate rating, revolving credit facilities rating and senior unsecured rating toBBB from BBB- and revised their outlook to Stable from Positive in January 2017; (3) Fitch revised their outlook to Positive fromStable in June 2016; and (4) DBRS Limited upgraded our corporate rating and revolving credit facilities rating to BBB from BBB(low) and revised their outlook to Stable from Positive in March 2016.
38
GENERAL MOTORS COMPANY AND SUBSIDIARIES
Automotive Financing — GM Financial Liquidity GM Financial’s primary sources of cash are finance charge income, leasingincome and proceeds from the sale of terminated leased vehicles, servicing fees, net distributions from secured debt facilities,including securitizations, secured and unsecured borrowings and collections and recoveries on finance receivables. GM Financial’sprimary uses of cash are purchases of retail finance receivables and leased vehicles, the funding of commercial finance receivables,repayment of secured and unsecured debt, funding credit enhancement requirements in connection with securitizations and secureddebt facilities, operating expenses, and interest costs. GM Financial continues to monitor and evaluate opportunities to optimize itsliquidity position and the mix of its debt. The following table summarizes GM Financial’s available liquidity (dollars in billions):
In the year ended December 31, 2016 available liquidity decreased due primarily to increased usage of secured debt facilities andincreased usage of committed unsecured lines of credit primarily due to asset growth.
GM Financial has the ability to borrow up to $1.0 billion against our three-year, $4.0 billion revolving credit facility and up to$3.0 billion against our five-year, $10.5 billion revolving credit facility. In September 2014 we and GM Financial entered into asupport agreement which, among other things, established commitments of funding from us to GM Financial. This agreement alsoprovides that we will continue to own all of GM Financial’s outstanding voting shares so long as any unsecured debt securities remainoutstanding at GM Financial. In addition we are required to use our commercially reasonable efforts to ensure GM Financial remainsa subsidiary borrower under our corporate revolving credit facilities.
Credit Facilities In the normal course of business, in addition to using its available cash, GM Financial utilizes borrowings underits credit facilities, which may be secured or unsecured, and GM Financial repays these borrowings as appropriate under its cashmanagement strategy. At December 31, 2016 secured, committed unsecured and uncommitted unsecured credit facilities totaled$25.8 billion, $1.4 billion and $2.4 billion with advances outstanding of $9.8 billion, $1.0 billion and $2.4 billion.
In the years ended December 31, 2016 and 2015 Net cash provided by operating activities increased due primarily to an increase inleased vehicle income, partially offset by increased operating expenses and interest expense.
In the year ended December 31, 2016 Net cash used in investing activities increased due primarily to: (1) increased purchases ofleased vehicles of $4.5 billion; and (2) increased purchases and funding of finance receivables of $2.0 billion; partially offset by(3) increased proceeds from the termination of leased vehicles of $1.5 billion; (4) increased collections on finance receivables of$1.4 billion; and (5) prior year impact of cash used for the acquisition of the equity interest in SAIC-GMAC of $0.9 billion.
In the year ended December 31, 2015 Net cash used in investing activities increased due primarily to: (1) increased purchases ofleased vehicles of $10.4 billion; (2) increased purchases and funding of finance receivables of $1.0 billion; and (3) net cash used forthe acquisition of the equity interest in SAIC-GMAC of $0.9 billion; partially offset by (4) increased proceeds from the termination ofleased vehicles of $0.6 billion.
39
GENERAL MOTORS COMPANY AND SUBSIDIARIES
In the years ended December 31, 2016 and 2015 Net cash provided by financing activities increased due primarily to a net increasein borrowings.
Off-Balance Sheet Arrangements We do not currently utilize off-balance sheet securitization arrangements. All trade or financereceivables and related obligations subject to securitization programs are recorded on our consolidated balance sheets at December 31,2016 and 2015. Refer to Note 15 of our consolidated financial statements for detailed information related to guarantees we haveprovided and for our noncancelable operating lease obligations.
Contractual Obligations and Other Long-Term Liabilities We have minimum commitments under contractual obligations,including purchase obligations. A purchase obligation is defined as an agreement to purchase goods or services that is enforceable andlegally binding on us and that specifies all significant terms, including fixed or minimum quantities to be purchased or fixed minimumprice provisions, and the approximate timing of the transaction. Based on these definitions, the following table includes only thosecontracts which include fixed or minimum obligations. The majority of our purchases are not included in the table as they are madeunder purchase orders which are requirements based and accordingly do not specify minimum quantities. The following tablesummarizes aggregated information about our outstanding contractual obligations and other long-term liabilities at December 31,2016:
(a) Amounts include automotive interest payments based on contractual terms and current interest rates on our debt and capital lease obligations.Automotive interest payments based on variable interest rates were determined using the interest rate in effect at December 31, 2016.
(b) GM Financial interest payments were determined using the interest rate in effect at December 31, 2016 for floating rate debt and the contractualrates for fixed rate debt. GM Financial interest payments on floating rate tranches of the securitization notes payable were converted to a fixedrate based on the floating rate plus any expected hedge payments.
(c) Amounts include OPEB payments under the current U.S. contractual labor agreements through 2019 and Canada labor agreements through2020. These agreements are generally renegotiated in the year of expiration. Amounts do not include pension funding obligations, which arediscussed in Note 14 to our consolidated financial statements.
(d) Amounts do not include future cash payments for long-term purchase obligations and other accrued expenditures (unless specifically listed inthe table above) which were recorded in Accounts payable or Accrued liabilities at December 31, 2016.
(e) Amounts include all expected future payments for both current and expected future service at December 31, 2016 for OPEB obligations forsalaried and hourly employees extending beyond the current North American union contract agreements. Amounts do not include pensionfunding obligations, which are discussed in Note 14 to our consolidated financial statements.
40
GENERAL MOTORS COMPANY AND SUBSIDIARIES
The table above does not reflect product warranty and related liabilities of $9.7 billion and unrecognized tax benefits of $1.2 billiondue to the uncertainty regarding the future cash outflows potentially associated with these amounts.
Critical Accounting Estimates Accounting estimates are an integral part of the consolidated financial statements. These estimates requirethe use of judgments and assumptions that affect the reported amounts of assets and liabilities, the disclosure of contingent assets andliabilities at the date of the financial statements and the reported amounts of revenues and expenses in the periods presented. We believe theaccounting estimates employed are appropriate and the resulting balances are reasonable; however, due to the inherent uncertainties indeveloping estimates actual results could differ from the original estimates, requiring adjustments to these balances in future periods. Refer toNote 2 to our consolidated financial statements for our significant accounting policies related to our critical accounting estimates.
Pension and OPEB Plans Our defined benefit pension plans are accounted for on an actuarial basis, which requires the selectionof various assumptions, including an expected long-term rate of return on plan assets, a discount rate, mortality rates of participantsand expectation of mortality improvement. The expected long-term rate of return on U.S. plan assets that is utilized in determiningpension expense is derived from periodic studies, which include a review of asset allocation strategies, anticipated future long-termperformance of individual asset classes, risks using standard deviations and correlations of returns among the asset classes thatcomprise the plans’ asset mix. While the studies give appropriate consideration to recent plan performance and historical returns, theassumptions are primarily long-term, prospective rates of return.
In December 2016 an investment policy study was completed for the U.S. pension plans. The study resulted in new target assetallocations being approved for the U.S. pension plans with resulting changes to the expected long-term rate of return on assets. Theweighted-average long-term rate of return on assets decreased from 6.3% at December 31, 2015 to 6.2% at December 31, 2016. Theexpected long-term rate of return on plan assets used in determining pension expense for non-U.S. plans is determined in a similarmanner to the U.S. plans.
Another key assumption in determining net pension and OPEB expense is the assumed discount rate used to discount planobligations. We estimate the assumed discount rate for U.S. plans using a cash flow matching approach, which uses projected cashflows matched to spot rates along a high quality corporate yield curve to determine the weighted-average discount rate for thecalculation of the present value of cash flows. Effective 2016 we applied the individual annual yield curve rates instead of theassumed discount rate to determine the service cost and interest cost. This refinement more specifically links the cash flows related toservice cost and interest cost to bonds maturing in their year of payment. The refinement reduced the service cost and interest cost in2016 by $0.8 billion. There was no effect on the determination of the plan obligations which continues to be calculated using theassumed discount rate.
We have reviewed and incorporated the mortality improvement tables published by the Society of Actuaries in the three monthsended December 31, 2016 that lowered life expectancies and thereby indicated the amount of estimated aggregate benefit payments toour U.S. pension plans’ participants was decreasing. This change in assumption decreased the December 31, 2016 U.S. pension andOPEB plans’ benefit obligations by $0.9 billion.
Significant differences in actual experience or significant changes in assumptions may materially affect the pension obligations.The effects of actual results differing from assumptions and the changing of assumptions are included in unamortized net actuarialgains and losses that are subject to amortization to pension expense over future periods. The unamortized pre-tax actuarial loss on ourpension plans was $4.8 billion and $3.7 billion at December 31, 2016 and 2015. The year-over-year change is primarily due to thedecrease in discount rates partially offset by assumption changes, primarily the U.S. mortality improvement scale. At December 31,2016 $2.9 billion of the unamortized pre-tax actuarial loss is outside the corridor (10% of the projected benefit obligation (PBO)) andsubject to amortization. The weighted-average amortization period is approximately twelve years resulting in amortization expense of$0.2 billion in 2017.
The underfunded status of the U.S. pension plans decreased by $3.2 billion in the year ended December 31, 2016 to $7.2 billion dueprimarily to: (1) a favorable effect of actual returns on plan assets of $4.0 billion; (2) contributions of $2.1 billion; and (3) favorableassumption changes, primarily the U.S. mortality improvement scale of $0.9 billion; partially offset by (4) interest and service cost of$2.4 billion; and (5) an unfavorable effect due to a decrease in discount rates of $1.5 billion.
41
GENERAL MOTORS COMPANY AND SUBSIDIARIES
The following table illustrates the sensitivity to a change in certain assumptions for the pension plans, holding all other assumptionsconstant:
(a) The sensitivity does not include the effects of the individual annual yield curve rates applied for the calculation of the service cost and interestcost effective in 2016.
Refer to Note 14 to our consolidated financial statements for additional information on pension contributions, investment strategies,assumptions, the change in benefit obligations and related plan assets, pension funding requirements and future net benefit payments.Refer to Note 2 to our consolidated financial statements for a discussion of the inputs used to determine fair value for each significantasset class or category.
Valuation of Deferred Tax Assets The ability to realize deferred tax assets depends on the ability to generate sufficient taxableincome within the carryback or carryforward periods provided for in the tax law for each applicable tax jurisdiction. The assessmentregarding whether a valuation allowance is required or should be adjusted is based on an evaluation of possible sources of taxableincome and also considers all available positive and negative evidence factors. Our accounting for the valuation of deferred tax assetsrepresents our best estimate of future events. Changes in our current estimates, due to unanticipated market conditions, governmentallegislative actions or events, could have a material effect on our ability to utilize deferred tax assets.
At December 31, 2016 total deferred tax assets were $40 billion and valuation allowances against those deferred tax assets were$4.6 billion. Refer to Note 16 to our consolidated financial statements for additional information on the composition of these valuationallowances.
If law is enacted that reduces the U.S. statutory tax rate, we would record a significant, one-time reduction to the net deferred taxassets and related increase to income tax expense in the period that includes the enactment date of the tax rate change.
Valuation of GM Financial Equipment on Operating Leases Assets and Residuals GM Financial has investments in leasedvehicles recorded as operating leases, which relate to vehicle leases to retail customers with lease terms ranging from two to fiveyears. At the beginning of the lease contract a determination is made of the estimated realizable value (i.e., residual value) of thevehicle at the end of the lease term, which is the critical assumption underlying the estimated carrying value of leased assets. Theestimated realizable value is based on the lower of the contracted residual value or the current market estimate of residual value basedon independent lease guides. Since the customer is not obligated to purchase the vehicle at the end of the contract, GM Financial isexposed to a risk of loss to the extent the value of the vehicle at the end of the lease term is below the residual value estimated atcontract inception. Over the life of the lease GM Financial evaluates the adequacy of the estimate of the residual value and may makeadjustments to the extent the expected value of the vehicle at lease termination changes. Adjustments could result in a change in thedepreciation rate of the leased asset or if an impairment exists, an impairment charge.
The following table summarizes vehicles included in GM Financial equipment on operating leases, net (vehicles in thousands):
At December 31, 2016 GM Financial’s estimated residual value of the leased assets at the end of the lease term was $23.6 billion.The following table illustrates the effect of a 1% change in the estimated residual values at December 31, 2016, which will increase ordecrease depreciation expense over the remaining term of GM Financial’s operating leases, holding all other assumptions constant:
Product Warranty and Recall Campaigns The estimates related to product warranties are established using historical informationon the nature, frequency and average cost of claims of each vehicle line or each model year of the vehicle line and assumptions aboutfuture activity and events. When little or no claims experience exists for a model year or a vehicle line, the estimate is based oncomparable models.
In GMNA we primarily accrue the costs for recall campaigns at the time of vehicle sale. In the other regions, there is not sufficienthistorical data to support the application of an actuarial-based estimation technique and the estimated costs are accrued at the timewhen they are probable and reasonably estimable, which typically occurs once it is determined a specific recall campaign is neededand announced.
The estimates related to recall campaigns accrued at the time of vehicle sale are established by applying a frequency times severityapproach that considers the number of recall events, the number of vehicles per recall event, the assumed number of vehicles that willbe brought in by customers for repair (take rate) and the cost per vehicle for each recall event. These estimates consider the nature,frequency and magnitude of historical recall campaigns. Costs associated with recall campaigns not accrued at the time of vehicle saleare estimated based on the estimated cost of repairs and the estimated vehicles to be repaired. Depending on part availability and timeto complete repairs we may, from time to time, offer courtesy transportation at no cost to our customers. These estimates are re-evaluated on an ongoing basis and based on the best available information. Revisions are made when necessary based on changes inthese factors.
The estimated amount accrued for recall campaigns at the time of vehicle sale is most sensitive to the estimated number of recallevents, the number of vehicles per recall event, the take rate, and the cost per vehicle for each recall event. The estimated cost of arecall campaign that is accrued on an individual basis is most sensitive to our estimated assumed take rate that is primarily developedbased on our historical take rate experience. A 10% increase in the estimated take rate for all recall campaigns would increase theestimated cost by approximately $0.3 billion.
Actual experience could differ from the amounts estimated requiring adjustments to these liabilities in future periods. Due to theuncertainty and potential volatility of the factors contributing to developing estimates, changes in our assumptions could materiallyaffect our results of operations.
Sales Incentives The estimated effect of sales incentives offered to dealers and end customers is recorded as a reduction ofAutomotive net sales and revenue at the later of the time of sale or announcement of an incentive program to dealers. There may benumerous types of incentives available at any particular time, including a choice of incentives for a specific model. Incentiveprograms are generally brand specific, model specific or sales region specific and are for specified time periods, which may beextended. Significant factors used in estimating the cost of incentives include the volume of vehicles that will be affected by theincentive programs offered by product, the product mix, the rate of customer acceptance of any incentive program and the likelihoodthat an incentive program will be extended, all of which are estimated based on historical experience and assumptions concerningcustomer behavior and future market conditions. When an incentive program is announced, the number of vehicles in dealer inventoryeligible for the incentive program is determined and a reduction of Automotive net sales and revenue is recorded in the period in
43
GENERAL MOTORS COMPANY AND SUBSIDIARIES
which the program is announced. If the actual number of affected vehicles differs from this estimate, or if a different mix of incentivesis actually paid, the reduction in Automotive net sales and revenue due to incentives could be affected. There are a multitude of inputsaffecting the calculation of the estimate for sales incentives and an increase or decrease in any of these variables could have asignificant effect on recorded sales incentives.
Forward-Looking Statements In this 2016 Form 10-K and in reports we subsequently file and have previously filed with the SECon Forms 10-K and 10-Q and file or furnish on Form 8-K, and in related comments by our management, we use words like“anticipate,” “appears,” “approximately,” “believe,” “continue,” “could,” “designed,” “effect,” “estimate,” “evaluate,” “expect,”“forecast,” “goal,” “initiative,” “intend,” “may,” “objective,” “outlook,” “plan,” “potential,” “priorities,” “project,” “pursue,” “seek,”“should,” “target,” “when,” “will,” “would,” or the negative of any of those words or similar expressions to identify forward-lookingstatements that represent our current judgment about possible future events. In making these statements we rely on assumptions andanalyses based on our experience and perception of historical trends, current conditions and expected future developments as well asother factors we consider appropriate under the circumstances. We believe these judgments are reasonable, but these statements arenot guarantees of any events or financial results, and our actual results may differ materially due to a variety of important factors, bothpositive and negative. These factors, which may be revised or supplemented in subsequent reports on SEC Forms 10-Q and 8-K,include among others the following: (1) our ability to deliver new products, services and customer experiences in response to newparticipants in the automotive industry; (2) our ability to fund and introduce new and improved vehicle models that are able to attracta sufficient number of consumers; (3) the success of our full-size pick-up trucks and SUVs, which may be affected by increases in theprice of oil; (4) global automobile market sales volume, which can be volatile; (5) aggressive competition in China; (6) theinternational scale and footprint of our operations which exposes us to a variety of domestic and foreign political, economic andregulatory risks, including the risk of changes in existing, the adoption of new, or the introduction of novel interpretations of, lawsregulations, policies or other activities of governments, agencies and similar organizations particularly laws, regulations and policiesrelating to free trade agreements, vehicle safety including recalls, and, including such actions that may affect the production,licensing, distribution or sale of our products, the cost thereof or applicable tax rates; (7) our joint ventures, which we cannot operatesolely for our benefit and over which we may have limited control; (8) our ability to comply with extensive laws and regulationsapplicable to our industry, including those regarding fuel economy and emissions; (9) costs and risks associated with litigation andgovernment investigations including the potential imposition of damages, substantial fines, civil lawsuits and criminal penalties,interruptions of business, modification of business practices, equitable remedies and other sanctions against us in connection withvarious legal proceedings and investigations relating to our various recalls; (10) our ability to comply with the terms of the DPA;(11) our ability to maintain quality control over our vehicles and avoid material vehicle recalls and the cost and effect on ourreputation and products; (12) the ability of our suppliers to deliver parts, systems and components without disruption and at suchtimes to allow us to meet production schedules; (13) our dependence on our manufacturing facilities around the world; (14) our highlycompetitive industry, which is characterized by excess manufacturing capacity and the use of incentives and the introduction of newand improved vehicle models by our competitors; (15) our ability to realize production efficiencies and to achieve reductions in costsas we implement operating effectiveness initiatives throughout our automotive operations; (16) our ability to successfully restructureour operations in various countries; (17) our ability to manage risks related to security breaches and other disruptions to our vehicles,information technology networks and systems; (18) our continued ability to develop captive financing capability through GMFinancial; (19) significant increases in our pension expense or projected pension contributions resulting from changes in the value ofplan assets, the discount rate applied to value the pension liabilities or mortality or other assumption changes; and (20) significantchanges in economic, political, regulatory environment, market conditions, foreign currency exchange rates or political stability in thecountries in which we operate, particularly China, with the effect of competition from new market entrants and in the United Kingdomwith passage of a referendum to discontinue membership in the European Union.
We caution readers not to place undue reliance on forward-looking statements. We undertake no obligation to update publicly orotherwise revise any forward-looking statements, whether as a result of new information, future events or other factors that affect thesubject of these statements, except where we are expressly required to do so by law.
* * * * * * *
44
GENERAL MOTORS COMPANY AND SUBSIDIARIES
Item 7A. Quantitative and Qualitative Disclosures About Market Risk
Automotive The overall financial risk management program is under the responsibility of the Chief Financial Officer with supportfrom the Financial Risk Council which reviews and, where appropriate, approves strategies to be pursued to mitigate these risks. TheFinancial Risk Council comprises members of our management and functions under the oversight of the Audit Committee andFinance Committee of the Board of Directors. The Audit Committee and Finance Committee assist and guide the Board of Directorsin its oversight of our financial and risk management strategies. A risk management control framework is utilized to monitor thestrategies, risks and related hedge positions in accordance with the policies and procedures approved by the Financial Risk Council.Our financial risk management policy is designed to protect against risk arising from extreme adverse market movements on ourkey exposures.
The following analyses provide quantitative information regarding exposure to foreign currency exchange rate risk and interest raterisk. Sensitivity analysis is used to measure the potential loss in the fair value of financial instruments with exposure to market risk.The models used assume instantaneous, parallel shifts in exchange rates and interest rate yield curves. For options and otherinstruments with nonlinear returns, models appropriate to these types of instruments are utilized to determine the effect of marketshifts. There are certain shortcomings inherent in the sensitivity analyses presented, due primarily to the assumption that interest rateschange in a parallel fashion and that spot exchange rates change instantaneously. In addition the analyses are unable to reflect thecomplex market reactions that normally would arise from the market shifts modeled and do not contemplate the effects of correlationsbetween foreign currency pairs or offsetting long-short positions in currency pairs which may significantly reduce the potential lossin value.
Foreign Currency Exchange Rate Risk We have foreign currency exposures related to buying, selling and financing incurrencies other than the functional currencies of our operations. At December 31, 2016 our most significant foreign currencyexposures were the Euro/British Pound, U.S. Dollar/Canadian Dollar, Euro/U.S. Dollar, U.S. Dollar/Mexican Peso, Euro/SouthKorean Won and U.S. Dollar/South Korean Won. Derivative instruments such as foreign currency forwards, swaps and options areused primarily to hedge exposures with respect to forecasted revenues, costs and commitments denominated in foreign currencies. AtDecember 31, 2016 such contracts had remaining maturities of up to 12 months.
At December 31, 2016 and 2015 the net fair value liability of financial instruments with exposure to foreign currency risk was $1.0billion and $0.8 billion. These amounts are calculated utilizing a population of foreign currency exchange derivatives, embeddedderivatives and foreign currency denominated debt and exclude the offsetting effect of foreign currency cash, cash equivalents andother assets. The potential loss in fair value for such financial instruments from a 10% adverse change in all quoted foreign currencyexchange rates would have been $0.2 billion and $0.3 billion at December 31, 2016 and 2015.
We are exposed to foreign currency risk due to the translation and remeasurement of the results of certain international operationsinto U.S. Dollars as part of the consolidation process. Fluctuations in foreign currency exchange rates can therefore create volatility inthe results of operations and may adversely affect our financial condition.
The following table summarizes the amounts of automotive foreign currency translation and transaction and remeasurement losses:
Interest Rate Risk We are subject to market risk from exposure to changes in interest rates related to certain financialinstruments, primarily debt, capital lease obligations and certain marketable securities. At December 31, 2016 and 2015 we did nothave any interest rate swap positions to manage interest rate exposures in our automotive operations. At December 31, 2016 and 2015the fair value liability of debt and capital leases was $11.6 billion and $9.1 billion. The potential increase in fair value resulting from a10% decrease in quoted interest rates would have been $0.5 billion and $0.4 billion at December 31, 2016 and 2015.
45
GENERAL MOTORS COMPANY AND SUBSIDIARIES
At December 31, 2016 and 2015 we had marketable securities of $11.8 billion and $7.6 billion classified as available-for-sale andan insignificant amount and $0.6 billion classified as trading. The potential decrease in fair value from a 50 basis point increase ininterest rates would have had an insignificant effect at December 31, 2016 and 2015.
Automotive Financing — GM Financial
Interest Rate Risk Fluctuations in market interest rates can affect GM Financial’s gross interest rate spread, which is thedifference between interest earned on finance receivables and interest paid on debt. Typically retail finance receivables purchased byGM Financial bear fixed interest rates and are funded by variable or fixed rate debt. Commercial finance receivables originated byGM Financial bear variable interest rates and are funded by variable rate debt. The variable rate debt is subject to adjustments toreflect prevailing market interest rates. To help mitigate interest rate risk or mismatched funding, GM Financial may employ hedgingstrategies to lock in the interest rate spread.
Fixed interest rate receivables purchased by GM Financial may be pledged to secure borrowings under its credit facilities. Amountsborrowed under these credit facilities bear interest at variable rates that are subject to frequent adjustments to reflect prevailing marketinterest rates. To protect the interest rate spread within each credit facility, GM Financial is contractually required to enter into interestrate cap agreements in connection with borrowings under its credit facilities.
In GM Financial’s securitization transactions it can transfer fixed rate finance receivables to securitization trusts that, in turn, selleither fixed rate or floating rate securities to investors. Derivative financial instruments, such as interest rate swaps and caps, are usedto manage the gross interest rate spread on the floating rate transactions.
GM Financial had interest rate swaps and caps in asset positions with notional amounts of $22.7 billion and $10.4 billion and inliability positions with notional amounts of $29.5 billion and $13.9 billion at December 31, 2016 and 2015. The fair value of thesederivative financial instruments in asset positions was insignificant and in liability positions was $341 million and insignificant atDecember 31, 2016 and 2015.
The following table summarizes GM Financial’s interest rate sensitive assets and liabilities, excluding derivatives, by year ofexpected maturity and the fair value of those assets and liabilities at December 31, 2016:
The impact of GM Financial’s discount rate, prepayment and credit loss assumptions is consistent with assumptions applied tointerest rate sensitive assets and liabilities reported at December 31, 2015. GM Financial estimates the realization of financereceivables in future periods using discount rate, prepayment and credit loss assumptions similar to its historical experience. Creditfacilities and securitization notes payable amounts have been classified based on expected payoff. Senior notes principal amountshave been classified based on maturity.
Foreign Currency Exchange Rate Risk GM Financial is exposed to foreign currency risk due to the translation andremeasurement of the results of certain international operations into U.S. Dollars as part of the consolidation process. Fluctuations inforeign currency exchange rates can therefore create volatility in the results of operations and may adversely affect GM Financial’sfinancial condition.
GM Financial primarily finances its receivables and leased assets with debt in the same currency. When a different currency is usedGM Financial may use foreign currency swaps to convert substantially all of its foreign currency debt obligations to the local currencyof the receivables and lease assets to minimize any impact to earnings.
GM Financial had foreign currency swaps in asset positions with notional amounts of $1.6 billion and $1.5 billion and in liabilitypositions with notional amounts of $910 million and an insignificant amount at December 31, 2016 and 2015. The fair value of thesederivative financial instruments was insignificant.
The following table summarizes GM Financial’s foreign currency translation and transaction and remeasurement losses:
REPORT OF INDEPENDENT REGISTERED PUBLIC ACCOUNTING FIRM
General Motors Company, its Directors, and Stockholders:
We have audited the accompanying Consolidated Balance Sheets of General Motors Company and subsidiaries (the “Company”) asof December 31, 2016 and 2015, and the related Consolidated Statements of Income, Comprehensive Income, Cash Flows, and Equityfor each of the three years in the period ended December 31, 2016. We also have audited the Company’s internal control overfinancial reporting as of December 31, 2016, based on criteria established in Internal Control — Integrated Framework (2013) issuedby the Committee of Sponsoring Organizations of the Treadway Commission. The Company’s management is responsible for thesefinancial statements, for maintaining effective internal control over financial reporting, and for its assessment of the effectiveness ofinternal control over financial reporting, included in the accompanying Management’s Report on Internal Control over FinancialReporting. Our responsibility is to express an opinion on these financial statements and an opinion on the Company’s internal controlover financial reporting based on our audits.
We conducted our audits in accordance with the standards of the Public Company Accounting Oversight Board (United States).Those standards require that we plan and perform the audit to obtain reasonable assurance about whether the financial statements arefree of material misstatement and whether effective internal control over financial reporting was maintained in all material respects.Our audits of the financial statements included examining, on a test basis, evidence supporting the amounts and disclosures in thefinancial statements, assessing the accounting principles used and significant estimates made by management, and evaluating theoverall financial statement presentation. Our audit of internal control over financial reporting included obtaining an understanding ofinternal control over financial reporting, assessing the risk that a material weakness exists, and testing and evaluating the design andoperating effectiveness of internal control based on the assessed risk. Our audits also included performing such other procedures as weconsidered necessary in the circumstances. We believe that our audits provides a reasonable basis for our opinions.
A company’s internal control over financial reporting is a process designed by, or under the supervision of, the company’s principalexecutive and principal financial officers, or persons performing similar functions, and effected by the company’s board of directors,management, and other personnel to provide reasonable assurance regarding the reliability of financial reporting and the preparationof financial statements for external purposes in accordance with generally accepted accounting principles. A company’s internalcontrol over financial reporting includes those policies and procedures that (1) pertain to the maintenance of records that, inreasonable detail, accurately and fairly reflect the transactions and dispositions of the assets of the company; (2) provide reasonableassurance that transactions are recorded as necessary to permit preparation of financial statements in accordance with generallyaccepted accounting principles, and that receipts and expenditures of the company are being made only in accordance withauthorizations of management and directors of the company; and (3) provide reasonable assurance regarding prevention or timelydetection of unauthorized acquisition, use, or disposition of the company’s assets that could have a material effect on the financialstatements.
Because of the inherent limitations of internal control over financial reporting, including the possibility of collusion or impropermanagement override of controls, material misstatements due to error or fraud may not be prevented or detected on a timely basis.Also, projections of any evaluation of the effectiveness of the internal control over financial reporting to future periods are subject tothe risk that the controls may become inadequate because of changes in conditions, or that the degree of compliance with the policiesor procedures may deteriorate.
In our opinion, the consolidated financial statements referred to above present fairly, in all material respects, the financial positionof General Motors Company and subsidiaries as of December 31, 2016 and 2015, and the results of their operations and their cashflows for each of the three years in the period ended December 31, 2016, in conformity with accounting principles generally acceptedin the United States of America. Also, in our opinion, the Company maintained, in all material respects, effective internal control overfinancial reporting as of December 31, 2016, based on the criteria established in Internal Control — Integrated Framework(2013) issued by the Committee of Sponsoring Organizations of the Treadway Commission.
/s/ DELOITTE & TOUCHE LLP
Detroit, MichiganFebruary 7, 2017
48
GENERAL MOTORS COMPANY AND SUBSIDIARIES
Item 8. Financial Statements and Supplementary Data
CONSOLIDATED INCOME STATEMENTS(In millions, except per share amounts)
Reference should be made to the notes to consolidated financial statements.
52
GENERAL MOTORS COMPANY AND SUBSIDIARIES
NOTES TO CONSOLIDATED FINANCIAL STATEMENTS
Note 1. Nature of Operations and Basis of Presentation
General Motors Company was incorporated as a Delaware corporation in 2009. We design, build and sell cars, trucks, crossoversand automobile parts worldwide. We also provide automotive financing services through GM Financial. We analyze the results of ourbusiness through the following segments: GMNA, GME, GMIO, GMSA and GM Financial. Nonsegment operations and Maven, ourride- and car-sharing business, are classified as Corporate. Corporate includes certain centrally recorded income and costs such asinterest, income taxes, corporate expenditures including autonomous vehicle-related engineering costs and certain nonsegmentspecific revenues and expenses.
Principles of Consolidation The consolidated financial statements are prepared in conformity with U.S. GAAP. All intercompanybalances and transactions have been eliminated in consolidation. Except for per share amounts or as otherwise specified, amountspresented within tables are stated in millions.
We consolidate entities that we control due to ownership of a majority voting interest and we consolidate variable interest entities(VIEs) when we have variable interests and are the primary beneficiary. We continually evaluate our involvement with VIEs todetermine when these criteria are met. Our share of earnings or losses of nonconsolidated affiliates is included in our consolidatedoperating results using the equity method of accounting when we are able to exercise significant influence over the operating andfinancial decisions of the affiliate. We use the cost method of accounting if we are not able to exercise significant influence over theoperating and financial decisions of the affiliate.
Use of Estimates in the Preparation of the Financial Statements Accounting estimates are an integral part of the consolidatedfinancial statements. These estimates require the use of judgments and assumptions that affect the reported amounts of assets andliabilities, the disclosure of contingent assets and liabilities at the date of the financial statements and the reported amounts ofrevenues and expenses in the periods presented. We believe that the accounting estimates employed are appropriate and the resultingbalances are reasonable; however, due to the inherent uncertainties in making estimates actual results could differ from the originalestimates, requiring adjustments to these balances in future periods.
GM Financial The amounts presented for GM Financial have been adjusted to include the effect of our tax attributes on GMFinancial’s deferred tax positions and provision for income taxes, which are not applicable to GM Financial on a stand-alone basis,and to eliminate the effect of transactions between GM Financial and the other members of the consolidated group. Accordingly, theamounts presented will differ from those presented by GM Financial on a stand-alone basis.
Note 2. Significant Accounting Policies
The accounting policies which follow are utilized by our automotive and automotive financing operations, unless otherwiseindicated.
Revenue Recognition
Automotive Automotive net sales and revenue primarily consist of revenue generated from the sale of vehicles. Vehicle sales arerecorded when title and risks and rewards of ownership have passed to our customers. For the majority of our automotive sales thisoccurs when a vehicle is released to the carrier responsible for transporting it to a dealer and when collectability is reasonably assured.Vehicle sales are recorded when the vehicle is delivered to the dealer in most remaining cases. Provisions for recurring or announceddealer and customer sales and leasing incentives, consisting of allowances and rebates, are recorded as reductions to Automotive netsales and revenue at the time of vehicle sale. All other incentives, allowances and rebates related to vehicles previously sold arerecorded as reductions to Automotive net sales and revenue when announced. Taxes assessed by various government entities, such assales, use and value-added taxes, collected at the time of sale are excluded from Automotive net sales and revenue.
Vehicle sales to daily rental car companies with guaranteed repurchase obligations are accounted for as operating leases. Estimatedlease revenue is recorded ratably over the estimated term of the lease based on the difference between net sales proceeds and the
53
GENERAL MOTORS COMPANY AND SUBSIDIARIES
NOTES TO CONSOLIDATED FINANCIAL STATEMENTS — (Continued)
guaranteed repurchase amount. The difference between the cost of the vehicle and estimated residual value is depreciated on astraight-line basis over the estimated term of the lease.
Automotive Financing — GM Financial Finance charge income earned on receivables is recognized using the effective interestmethod. Fees and commissions (including incentive payments) received and direct costs of originating loans are deferred andamortized over the term of the related finance receivables using the effective interest method and are removed from the consolidatedbalance sheets when the related finance receivables are sold, charged off or paid in full. Accrual of finance charge income on retailfinance receivables is generally suspended on accounts that are more than 60 days delinquent, accounts in bankruptcy and accounts inrepossession. Payments received on nonaccrual loans are first applied to any fees due, then to any interest due and then any remainingamounts are recorded to principal. Interest accrual generally resumes once an account has received payments bringing the delinquencyto less than 60 days past due. Accrual of finance charge income on commercial finance receivables is generally suspended on accountsthat are more than 90 days delinquent, upon receipt of a bankruptcy notice from a borrower, or where reasonable doubt exists aboutthe full collectability of contractually agreed upon principal and interest. Payments received on nonaccrual loans are first applied toprincipal. Interest accrual resumes once an account has received payments bringing the account fully current and collection ofcontractual principal and interest is reasonably assured (including amounts previously charged off).
Income from operating lease assets, which includes lease origination fees, net of lease origination costs and incentives, is recordedas operating lease revenue on a straight-line basis over the term of the lease agreement.
Advertising and Promotion Expenditures Advertising and promotion expenditures, which are expensed as incurred inAutomotive selling, general and administrative expense, were $5.3 billion, $5.1 billion and $5.2 billion in the years endedDecember 31, 2016, 2015 and 2014.
Research and Development Expenditures Research and development expenditures, which are expensed as incurred in Automotivecost of sales, were $8.1 billion, $7.5 billion and $7.4 billion in the years ended December 31, 2016, 2015 and 2014.
Cash Equivalents and Restricted Cash Cash equivalents are defined as short-term, highly-liquid investments with originalmaturities of 90 days or less. Cash and cash equivalents subject to contractual restrictions and not readily available are classified asrestricted cash. We are required to post cash as collateral as part of certain agreements that we enter into as part of our operations.Restricted cash is invested in accordance with the terms of the underlying agreements and include amounts related to various deposits,escrows and other cash collateral. Restricted cash is included in Other current assets and Other assets in the consolidated balancesheets.
Fair Value Measurements A three-level valuation hierarchy, based upon observable and unobservable inputs, is used for fair valuemeasurements. Observable inputs reflect market data obtained from independent sources, while unobservable inputs reflect marketassumptions based on the best evidence available. These two types of inputs create the following fair value hierarchy: Level 1 —Quoted prices for identical instruments in active markets; Level 2 — Quoted prices for similar instruments in active markets, quotedprices for identical or similar instruments in markets that are not active and model-derived valuations whose significant inputs areobservable; and Level 3 — Instruments whose significant inputs are unobservable. Financial instruments are transferred in and/or outof Level 1, 2 or 3 at the beginning of the accounting period in which there is a change in the valuation inputs.
Marketable Securities We classify marketable securities as available-for-sale or trading. Various factors, including turnover ofholdings and investment guidelines, are considered in determining the classification of securities. Available-for-sale securities arerecorded at fair value with unrealized gains and losses recorded net of related income taxes in Accumulated other comprehensive lossuntil realized. Trading securities are recorded at fair value with changes in fair value recorded in Interest income and other non-operating income, net. We determine realized gains and losses for all securities using the specific identification method.
We measure the fair value of our marketable securities using a market approach where identical or comparable prices are availableand an income approach in other cases. If quoted market prices are not available, fair values of securities are determined using pricesfrom a pricing service, pricing models, quoted prices of securities with similar characteristics or discounted cash flow models. These
54
GENERAL MOTORS COMPANY AND SUBSIDIARIES
NOTES TO CONSOLIDATED FINANCIAL STATEMENTS — (Continued)
prices represent non-binding quotes. Our pricing service utilizes industry-standard pricing models that consider various inputs. Weconduct an annual review of our pricing service and believe the prices received from our pricing service are a reliable representationof exit prices.
An evaluation is made quarterly to determine if unrealized losses related to non-trading investments in securities are other-than-temporary. Factors considered include the length of time and extent to which the fair value has been below cost, the financialcondition and near-term prospects of the issuer and the intent to sell or likelihood to be forced to sell the security before anyanticipated recovery.
GM Financial Receivables Finance receivables are carried at amortized cost, net of allowance for loan losses. The component ofthe allowance for retail finance receivables that is collectively evaluated for impairment is based on a statistical calculation which issupplemented by management judgment. GM Financial uses a combination of forecasting models to determine the allowance for loanlosses. Factors that are considered when estimating the allowance include historical delinquency migration to loss, probability ofdefault and loss given default. The loss confirmation period is a key assumption within the models and represents the average amountof time from when a loss event first occurs to when the receivable is charged off. GM Financial also considers an evaluation of overallportfolio credit quality based on various indicators.
Retail finance receivables that become classified as troubled debt restructurings (TDRs) are separately assessed for impairment. Aspecific allowance is estimated based on the present value of the expected future cash flows of the receivable discounted at the loan’soriginal effective interest rate. Finance charge income from loans classified as TDRs is accounted for in the same manner as otheraccruing loans. Cash collections on these loans are allocated according to the same payment hierarchy methodology applied to loansthat are not classified as TDRs.
Retail finance receivables are generally charged off in the month in which the account becomes 120 days contractually delinquent ifGM Financial has not yet recorded a repossession charge-off. A charge-off generally represents the difference between the estimatednet sales proceeds and the amount of the contract, including accrued interest.
Inventories Inventories are stated at the lower of cost or net realizable value. Net realizable value is the estimated selling price inthe ordinary course of business less cost to sell, and considers general market and economic conditions, periodic reviews of currentprofitability of vehicles, product warranty costs and the effect of current and expected incentive offers at the balance sheet date. Netrealizable value for off-lease and other vehicles is current auction sales proceeds less disposal and warranty costs. Productive material,work in process, supplies and service parts are reviewed to determine if inventory quantities are in excess of forecasted usage or ifthey have become obsolete.
Equipment on Operating Leases Equipment on operating leases, net is reported at cost, less accumulated depreciation andimpairment, net of origination fees or costs and lease incentives. Estimated income from operating lease assets, which includes leaseorigination fees, net of lease origination costs, is recorded as operating lease revenue on a straight-line basis over the term of the leaseagreement. Leased vehicles are depreciated on a straight-line basis to an estimated residual value over the term of the leaseagreements.
We have significant investments in vehicle operating lease portfolios, which consist of vehicle leases to retail customers with leaseterms of two to five years and vehicles leased to rental car companies with lease terms that average eight months. We are exposed tochanges in the residual values of these assets. For impairment purposes the residual values represent estimates of the values of thevehicles leased at the end of the lease contracts and are determined based on forecasted auction proceeds when there is a reliable basisto make such a determination. Realization of the residual values is dependent on the future ability to market the vehicles underprevailing market conditions. The adequacy of the estimate of the residual value is evaluated over the life of the lease and adjustmentsmay be made to the extent the expected value of the vehicle at lease termination changes. Adjustments may be in the form of revisionsto the depreciation rate or recognition of an impairment charge. Impairment is determined to exist if an impairment indicator existsand the expected future cash flows, which include estimated residual values, are lower than the carrying amount of the vehicles
55
GENERAL MOTORS COMPANY AND SUBSIDIARIES
NOTES TO CONSOLIDATED FINANCIAL STATEMENTS — (Continued)
leased. If the carrying amount is considered impaired an impairment charge is recorded for the amount by which the carrying amountexceeds fair value. Fair value is determined primarily using the anticipated cash flows, including estimated residual values.
In our automotive operations when a leased vehicle is returned the asset is reclassified from Equipment on operating leases, net toInventories at the lower of cost or estimated selling price, less cost to sell. Upon disposition, proceeds are recorded in Automotive netsales and revenue and costs are recorded in Automotive cost of sales. In our automotive finance operations when a leased vehicle isreturned or repossessed the asset is recorded in Other assets at the lower of cost or estimated selling price, less costs to sell. Upondisposition a gain or loss is recorded in GM Financial interest, operating and other expenses for any difference between the net bookvalue of the leased asset and the proceeds from the disposition of the asset.
Depreciation expense and impairment charges related to Equipment on operating leases, net are recorded in Automotive cost ofsales or GM Financial interest, operating and other expenses.
Valuation of Cost and Equity Method Investments When events and circumstances warrant, investments accounted for under thecost or equity method of accounting are evaluated for impairment. An impairment charge is recorded whenever a decline in value ofan investment below its carrying amount is determined to be other-than-temporary. Impairment charges related to equity methodinvestments are recorded in Equity income. Impairment charges related to cost method investments are recorded in Interest incomeand other non-operating income, net.
Property, net Property, plant and equipment, including internal use software, is recorded at cost. Major improvements that extendthe useful life or add functionality are capitalized. The gross amount of assets under capital leases is included in property, plant andequipment. Expenditures for repairs and maintenance are charged to expense as incurred. We depreciate all depreciable property usingthe straight-line method. Leasehold improvements are amortized over the period of lease or the life of the asset, whichever is shorter.The amortization of the assets under capital leases is included in depreciation expense. Upon retirement or disposition of property,plant and equipment, the cost and related accumulated depreciation are eliminated and any resulting gain or loss is recorded inearnings. Impairment charges related to property are recorded in Automotive cost of sales, Automotive selling, general andadministrative expense or GM Financial interest, operating and other expenses.
Special Tools Special tools represent product-specific powertrain and non-powertrain related tools, dies, molds and other items usedin the vehicle manufacturing process. Expenditures for special tools are recorded at cost and are capitalized. We amortize special toolsover their estimated useful lives using the straight-line method or an accelerated amortization method based on their historical andestimated production volume. Impairment charges related to special tools are recorded in Automotive cost of sales.
Goodwill Goodwill is tested for impairment annually on October 1 or when events occur or circumstances change that would triggersuch a review. A two-step impairment test is used to identify potential goodwill impairment. Impairment exists when the carryingamount of goodwill exceeds its implied fair value. When performing our goodwill impairment testing, the fair values of our reportingunits are determined based on valuation techniques using the best available information, primarily discounted cash flow projections.Because the fair value of goodwill can be measured only as a residual amount and cannot be determined directly we calculate theimplied goodwill for those reporting units failing Step 1 in the same manner that goodwill is recognized in a business combinationpursuant to Accounting Standards Codification (ASC) 805.
Intangible Assets, net Intangible assets, excluding goodwill, primarily include brand names, technology and intellectual property,customer relationships and dealer networks. Intangible assets are amortized on a straight-line or an accelerated method of amortizationover their estimated useful lives. An accelerated amortization method reflecting the pattern in which the asset will be consumed isutilized if that pattern can be reliably determined. We consider the period of expected cash flows and underlying data used to measurethe fair value of the intangible assets when selecting a useful life. Impairment charges related to intangible assets are recorded inAutomotive selling, general and administrative expense or Automotive cost of sales. Amortization of developed technology andintellectual property is recorded in Automotive cost of sales. Amortization of brand names, customer relationships and our dealernetworks is recorded in Automotive selling, general and administrative expense or GM Financial interest, operating and otherexpenses.
56
GENERAL MOTORS COMPANY AND SUBSIDIARIES
NOTES TO CONSOLIDATED FINANCIAL STATEMENTS — (Continued)
Valuation of Long-Lived Assets The carrying amount of long-lived assets and finite-lived intangible assets to be held and used inthe business are evaluated for impairment when events and circumstances warrant. If the carrying amount of a long-lived asset groupis considered impaired, a loss is recorded based on the amount by which the carrying amount exceeds fair value. Product-specificlong-lived asset groups and non-product specific long-lived assets are separately tested for impairment on an asset group basis. Fairvalue is determined using either the market or sales comparison approach, cost approach or anticipated cash flows discounted at a ratecommensurate with the risk involved. Long-lived assets to be disposed of other than by sale are considered held for use untildisposition.
Pension and OPEB Plans
Attribution, Methods and Assumptions The cost of benefits provided by defined benefit pension plans is recorded in the periodemployees provide service. The cost of pension plan amendments that provide for benefits already earned by plan participants isamortized over the expected period of benefit which may be the duration of the applicable collective bargaining agreement specific tothe plan, the expected future working lifetime or the life expectancy of the plan participants.
The cost of medical, dental, legal service and life insurance benefits provided through postretirement benefit plans is recorded inthe period employees provide service. The cost of postretirement plan amendments that provide for benefits already earned by planparticipants is amortized over the expected period of benefit which may be the average period to full eligibility or the average lifeexpectancy of the plan participants.
An expected return on plan asset methodology is utilized to calculate future pension expense for certain significant funded benefitplans. A market-related value of plan assets methodology is also utilized that averages gains and losses on the plan assets over aperiod of years to determine future pension expense. The methodology recognizes 60% of the difference between the fair value ofassets and the expected calculated value in the first year and 10% of that difference over each of the next four years.
The discount rate assumption is established for each of the retirement-related benefit plans at their respective measurement dates. Inthe U.S. we use a cash flow matching approach that uses projected cash flows matched to spot rates along a high quality corporatebond yield curve to determine the present value of cash flows to calculate a single equivalent discount rate. Effective 2016 we appliedthe individual annual yield curve rates instead of the single equivalent discount rate to determine the service cost and interest cost forour pension and OPEB plans. This refinement more specifically links the cash flows related to service cost and interest cost to bondsmaturing in their year of payment.
The benefit obligation for pension plans in Canada, the U.K. and Germany represents 91% of the non-U.S. pension benefitobligation at December 31, 2016. The discount rates for plans in Canada, the U.K. and Germany are determined using a cash flowmatching approach similar to the U.S. approach.
Plan Asset Valuation Due to the lack of timely available market information for certain investments in the asset classes describedbelow as well as the inherent uncertainty of valuation, reported fair values may differ from fair values that would have been used hadtimely available market information been available.
Common and Preferred Stock Common and preferred stock for which market prices are readily available at the measurement dateare valued at the last reported sale price or official closing price on the primary market or exchange on which they are actively tradedand are classified in Level 1. Such equity securities for which the market is not considered to be active are valued via the use ofobservable inputs, which may include, among others, the use of adjusted market prices last available, bids or last available sales pricesand/or other observable inputs and are classified in Level 2. Common and preferred stock classified in Level 3 are privately issuedsecurities or other issues that are valued via the use of valuation models using significant unobservable inputs that generally consider,among others, aged (stale) pricing, earnings multiples, discounted cash flows and/or other qualitative and quantitative factors.
Debt Securities Valuations for debt securities are based on quotations received from independent pricing services or from dealerswho make markets in such securities. Debt securities priced via pricing services that utilize matrix pricing which considers readily
57
GENERAL MOTORS COMPANY AND SUBSIDIARIES
NOTES TO CONSOLIDATED FINANCIAL STATEMENTS — (Continued)
observable inputs such as the yield or price of bonds of comparable quality, coupon, maturity and type as well as dealer suppliedprices, are classified in Level 2. Debt securities that are typically priced by dealers and pricing services via the use of proprietarypricing models which incorporate significant unobservable inputs are classified in Level 3. These inputs primarily consist of yield andcredit spread assumptions, discount rates, prepayment curves, default assumptions and recovery rates.
Investment Funds, Private Equity and Debt Investments and Real Estate Investments Investment funds, private equity and debtinvestments and real estate investments are valued based on the Net Asset Value (NAV) per Share (or its equivalent) as a practicalexpedient to estimate fair value due to the absence of readily available market prices.
NAV’s are provided by the respective investment sponsors or investment advisers and are subsequently reviewed and approved bymanagement. In the event management concludes a reported NAV does not reflect fair value or is not determined as of the financialreporting measurement date, we will consider whether and when deemed necessary to make an adjustment at the balance sheet date.In determining whether an adjustment to the external valuation is required, we will review material factors that could affect thevaluation, such as changes in the composition or performance of the underlying investments or comparable investments, overallmarket conditions, expected sale prices for private investments which are probable of being sold in the short-term and other economicfactors that may possibly have a favorable or unfavorable effect on the reported external valuation.
Stock Incentive Plans Our stock incentive plans include RSUs, RSAs, Performance Share Units (PSUs) and stock options. Wemeasure and record compensation expense based on the fair value of our common stock on the date of grant for RSUs, RSAs andPSUs and the grant date fair value of stock options determined utilizing a lattice model or the Black-Scholes-Merton formula.Compensation cost for awards that do not have an established accounting grant date is based on the fair value of our common stock atthe end of each reporting period. We record compensation cost for RSUs, RSAs and PSUs on a straight-line basis over the entirevesting period, or for retirement eligible employees over the requisite service period. We use the graded vesting method to recordcompensation cost for stock options over the lesser of the vesting period or the time period an employee becomes eligible to retain theaward at retirement. The liability for stock incentive plan awards settled in cash is remeasured to fair value at the end of eachreporting period.
Product Warranty and Recall Campaigns The estimated costs related to product warranties are accrued at the time products aresold and are charged to Automotive cost of sales. These estimates are established using historical information on the nature, frequencyand average cost of claims of each vehicle line or each model year of the vehicle line and assumptions about future activity andevents. Revisions are made when necessary and are based on changes in these factors.
The estimated costs related to recall campaigns are generally accrued at the time of vehicle sale in GMNA by applying a frequencytimes severity approach that considers the number of historical recall campaigns, the number of vehicles per recall campaign, theestimated number of vehicles to be repaired and the cost per vehicle for each recall campaign. The estimated costs associated withrecall campaigns in other geographical regions are accrued when probable and estimable using the estimated costs of repairs and theestimated number of vehicles to be repaired. Costs associated with recall campaigns are charged to Automotive cost of sales.Revisions are made when necessary based on changes in these factors.
Income Taxes The liability method is used in accounting for income taxes. Deferred tax assets and liabilities are recorded fortemporary differences between the tax basis of assets and liabilities and their reported amounts in the consolidated financialstatements using the statutory tax rates in effect for the year in which the differences are expected to reverse. The effect on deferredtax assets and liabilities of a change in tax rates is recorded in the results of operations in the period that includes the enactment dateunder the law.
Deferred income tax assets are evaluated quarterly to determine if valuation allowances are required or should be adjusted. Weestablish valuation allowances for deferred tax assets based on a more likely than not standard. The ability to realize deferred taxassets depends on the ability to generate sufficient taxable income within the carryback or carryforward periods provided for in the taxlaw for each applicable tax jurisdiction. The assessment regarding whether a valuation allowance is required or should be adjustedalso considers all available positive and negative evidence factors. It is difficult to conclude a valuation allowance is not required
58
GENERAL MOTORS COMPANY AND SUBSIDIARIES
NOTES TO CONSOLIDATED FINANCIAL STATEMENTS — (Continued)
when there is significant objective and verifiable negative evidence, such as cumulative losses in recent years. We utilize a rollingthree years of actual and current year results as the primary measure of cumulative losses in recent years.
Income tax expense (benefit) for the year is allocated between continuing operations and other categories of income such as Othercomprehensive income (loss). In periods in which there is a pre-tax loss from continuing operations and pre-tax income in anotherincome category, the tax benefit allocated to continuing operations is determined by taking into account the pre-tax income of othercategories.
We record uncertain tax positions on the basis of a two-step process whereby we determine whether it is more likely than not thatthe tax positions will be sustained based on the technical merits of the position, and for those tax positions that meet the more likelythan not recognition, we recognize the largest amount of tax benefit that is greater than 50% likely to be realized upon ultimatesettlement with the related tax authority. We record interest and penalties on uncertain tax positions in Income tax expense (benefit).
Foreign Currency Transactions and Translation The assets and liabilities of foreign subsidiaries that use the local currency astheir functional currency are translated to U.S. Dollars based on the current exchange rate prevailing at each balance sheet date andany resulting translation adjustments are included in Accumulated other comprehensive loss. The assets and liabilities of foreignsubsidiaries whose local currency is not their functional currency are remeasured from their local currency to their functional currencyand then translated to U.S. Dollars. Revenues and expenses are translated into U.S. Dollars using the average exchange ratesprevailing for each period presented.
Gains and losses arising from foreign currency transactions and the effects of remeasurements discussed in the preceding paragraphare recorded in Automotive cost of sales and GM Financial interest, operating and other expenses unless related to Automotive debt,which are recorded in Interest income and other non-operating income, net. Foreign currency transaction and remeasurement losseswere $358 million, $829 million and $437 million in the years ended December 31, 2016, 2015 and 2014.
Derivative Financial Instruments Derivative financial instruments are recognized as either assets or liabilities at fair value. Theaccounting for changes in the fair value of each derivative financial instrument depends on whether it has been designated andqualifies as an accounting hedge, as well as the type of hedging relationship identified. Derivative instruments are not used for tradingor speculative purposes.
Automotive We utilize options, swaps and forward contracts to manage foreign currency and commodity price risks. The changein fair value of option and forward contracts not designated as hedges is recorded in Interest income and other non-operating income,net. Cash flows for all derivative financial instruments are classified in cash flows from operating activities. At December 31, 2016and 2015 we had derivative instruments not designated as hedges in asset positions with notional amounts of $5.7 billion and $6.8billion and in liability positions with notional amounts of $651 million and $264 million. The fair value of these derivativeinstruments was insignificant at December 31, 2016 and 2015.
Certain foreign currency and commodity forward contracts have been designated as cash flow hedges. The risk being hedged is theforeign currency and commodity price risk related to forecasted transactions. If the contract has been designated as a cash flow hedge,the effective portion of changes in the fair value of the cash flow hedge is deferred in Accumulated other comprehensive loss and isrecognized in Automotive cost of sales when the hedged item affects earnings. Any ineffective portion is recorded in Automotive costof sales in the period of remeasurement. At December 31, 2016 the notional amount of these derivative instruments in asset positionswas $909 million and was insignificant at December 31, 2015. The fair value of these derivative instruments was insignificant atDecember 31, 2016 and 2015.
Automotive Financing — GM Financial GM Financial utilizes interest rate option and swap agreements to manage interest raterisk and foreign currency swap agreements to manage foreign currency risk. The change in fair value of the option and swapagreements not designated as hedges is recorded in GM Financial interest, operating and other expenses. Cash flows for all derivativefinancial instruments are classified in cash flows from operating activities. At December 31, 2016 and 2015 GM Financial hadderivative instruments not designated as hedges in asset positions with notional amounts of $20.7 billion and $11.9 billion and
59
GENERAL MOTORS COMPANY AND SUBSIDIARIES
NOTES TO CONSOLIDATED FINANCIAL STATEMENTS — (Continued)
liability positions with notional amounts of $20.6 billion and $13.9 billion. The fair value of these derivatives was insignificant atDecember 31, 2016 and 2015.
Certain interest rate swap agreements have been designated as fair value hedges of fixed-rate debt. At December 31, 2016 and 2015the notional amounts of these instruments in liability positions were $7.7 billion and $1.0 billion. The fair value of these derivativeinstruments in liability positions was $276 million at December 31, 2016 and was insignificant at December 31, 2015. The risk beinghedged is the risk of changes in the fair value of the hedged debt attributable to changes in the benchmark interest rate. If the swap hasbeen designated as a fair value hedge, the changes in the fair value of the hedged debt are recorded in Interest expense. The change infair value of the related derivative (excluding accrued interest) is also recorded in Interest expense.
Beginning in 2016 certain interest rate swap and foreign currency swap agreements have been designated as cash flow hedges. AtDecember 31, 2016 the notional amount of these designated instruments in asset positions was $3.5 billion and in liability positionswas $2.1 billion. The fair value of these derivative instruments was insignificant at December 31, 2016. The risk being hedged is theforeign currency and interest rate risk related to forecasted transactions. If the contract has been designated as a cash flow hedge, theeffective portion of changes in the fair value of the cash flow hedge is deferred in Accumulated other comprehensive loss and isrecognized in GM Financial interest, operating and other expenses when the hedged item affects earnings. Any ineffective portion isrecorded in GM Financial interest, operating and other expenses in the period of remeasurement.
The gains or losses on all derivative instruments included in the consolidated income statements and Accumulated othercomprehensive loss were insignificant in the years ended December 31, 2016, 2015 and 2014.
Recently Adopted Accounting Standards Effective January 1, 2016 we retrospectively adopted Accounting Standards Update(ASU) 2015-17, “Balance Sheet Classification of Deferred Taxes”, which requires all deferred tax assets and liabilities to be classifiedas non-current. As a result current Deferred income taxes and Accrued liabilities decreased by $8.6 billion and $249 million and non-current Deferred income taxes increased by $8.4 billion at December 31, 2015 in our consolidated balance sheets.
In November 2016 the Financial Accounting Standards Board (FASB) issued ASU 2016-18, “Statement of Cash Flows (Topic230): Restricted Cash” (ASU 2016-18), which clarifies the presentation of restricted cash and restricted cash equivalents in thestatements of cash flows. Under ASU 2016-18 restricted cash and restricted cash equivalents are included with cash and cashequivalents when reconciling the beginning-of-period and end-of-period total amounts shown on the statements of cash flows. Weadopted ASU 2016-18 during the three months ended December 31, 2016 on a retrospective basis. As a result Net cash provided byoperating activities decreased by $287 million in the year ended December 31, 2015 and increased by an insignificant amount in theyear ended December 31, 2014. Net cash used in investing activities decreased by $325 million and $339 million in the years endedDecember 31, 2015 and 2014 and beginning-of-period cash, cash equivalents and restricted cash increased by $2.1 billion, $2.2 billionand $2.0 billion in 2016, 2015 and 2014.
Accounting Standards Not Yet Adopted In May 2014 the FASB issued ASU 2014-09, “Revenue from Contracts with Customers”(ASU 2014-09), which requires us to recognize revenue when a customer obtains control rather than when we have transferredsubstantially all risks and rewards of a good or service and requires expanded disclosures. ASU 2014-09, as amended, is effective forus beginning January 1, 2018. ASU 2014-09 will affect the amount and timing of certain revenue related transactions primarilyresulting from the earlier recognition of certain sales incentives and fixed fee license arrangements. Upon adoption of ASU 2014-09sales incentives will be recorded at the time of sale rather than at the later of sale or announcement and fixed fee license arrangementswill be recognized when the customer is granted access to intellectual property instead of over the contract period. Certaintransactions with daily rental car companies may also qualify to be accounted for as a sale as opposed to the current accounting as anoperating lease. We have not yet determined whether we will adopt the provisions of ASU 2014-09 on a retrospective basis or througha cumulative adjustment to equity. We do not expect the adoption of ASU 2014-09 to be material to our consolidated financialstatements. We continue to assess the overall impact the adoption of ASU 2014-09 will have on our consolidated financial statements,and anticipate testing our new controls and processes designed to comply with ASU 2014-09 throughout 2017 to permit adoption byJanuary 1, 2018.
60
GENERAL MOTORS COMPANY AND SUBSIDIARIES
NOTES TO CONSOLIDATED FINANCIAL STATEMENTS — (Continued)
In January 2016 the FASB issued ASU 2016-01, “Recognition and Measurement of Financial Assets and Financial Liabilities”(ASU 2016-01), which requires, among other items, equity investments that are not accounted for under the equity method ofaccounting to be measured at fair value with changes recognized in net income and updates certain presentation and disclosurerequirements. ASU 2016-01 is effective for us beginning January 1, 2018. At December 31, 2016 the carrying value of equityinvestments that are not accounted for under the equity method of accounting totaled $526 million and unrealized gains or losses wereinsignificant. Currently we do not believe the adoption of ASU 2016-01 will have a material impact on our consolidated financialstatements, however changes in future market conditions and equity investment balances prior to the implementation date will affectthe impact the adoption may have on our consolidated financial statements.
In February 2016 the FASB issued ASU 2016-02, “Leases” (ASU 2016-02), which requires us as the lessee to recognize mostleases on the balance sheet thereby resulting in the recognition of lease assets and liabilities for those leases currently classified asoperating leases. The accounting for leases where we are the lessor remains largely unchanged. ASU 2016-02 is effective for usbeginning January 1, 2019 with early adoption permitted. While we are currently assessing the impact ASU 2016-02 will have on ourconsolidated financial statements, we expect the primary impact to our consolidated financial position upon adoption will be therecognition, on a discounted basis, of our minimum commitments under noncancelable operating leases on our consolidated balancesheets resulting in the recording of right of use assets and lease obligations. Our current minimum commitments under noncancelableoperating leases are disclosed in Note 15.
In June 2016 the FASB issued ASU 2016-13, “Financial Instruments – Credit Losses (Topic 326): Measurement of Credit Losseson Financial Instruments” (ASU 2016-13), that requires entities to use a new impairment model based on expected losses. Under thisnew model an entity would recognize an impairment allowance equal to its current estimate of credit losses on financial assetsmeasured at amortized cost. ASU 2016-13 is effective for us beginning January 1, 2020 with early adoption permitted January 1,2019. Credit losses under the new model will consider relevant information about past events, current conditions and reasonable andsupportable forecasts, resulting in recognition of lifetime expected credit losses by GM Financial upon loan origination as comparedto our current accounting that recognizes credit losses as incurred. We are currently evaluating new processes to calculate credit lossesin accordance with ASU 2016-13 that, once completed, will determine the impact on our consolidated financial statements which atthe date of adoption will increase the allowance for credit losses with a resulting negative adjustment to retained earnings.
Note 3. Marketable Securities
The following table summarizes the fair value of cash equivalents and marketable securities which approximates cost:
Fair ValueLevel December 31, 2016 December 31, 2015
Sales proceeds from investments classified as available-for-sale and sold prior to maturity were $8.5 billion, $7.9 billion and$5.9 billion in the years ended December 31, 2016, 2015 and 2014. Net unrealized gains and losses on trading securities wereinsignificant in the years ended December 31, 2016, 2015 and 2014.
The following table provides a reconciliation of cash, cash equivalents and restricted cash reported within the consolidated balancesheets that sum to the total of the same amounts shown in the consolidated statements of cash flows:
GM Financial estimates the fair value of retail finance receivables using observable and unobservable Level 3 inputs within a cashflow model. The inputs reflect assumptions regarding expected prepayments, deferrals, delinquencies, recoveries and charge-offs ofthe loans within the portfolio. The cash flow model produces an estimated amortization schedule of the finance receivables. Theprojected cash flows are then discounted using current risk-adjusted rates to derive the fair value of the portfolio. Macroeconomicfactors could affect the credit performance of the portfolio and therefore could potentially affect the assumptions used in GMFinancial’s cash flow model. A substantial majority of GM Financial’s commercial finance receivables have variable interest rates andmaturities of one year or less. Therefore, the carrying amount, a level 2 input, is considered to be a reasonable estimate of fair value.
The allowance for loan losses on retail and commercial finance receivables included a collective allowance of $560 million, $553million and $518 million and a specific allowance of $283 million, $229 million and $177 million at December 31, 2016, 2015 and 2014.
Retail Finance Receivables GM Financial uses proprietary scoring systems in its underwriting process that measure the creditquality of retail finance receivables using several factors, such as credit bureau information, consumer credit risk scores (e.g. FICOscores or its equivalent) and contract characteristics. In addition to GM Financial’s proprietary scoring systems GM Financialconsiders other individual consumer factors such as employment history, financial stability and capacity to pay. Subsequent toorigination GM Financial reviews the credit quality of retail finance receivables based on customer payment activity. In NorthAmerica, while we historically focused on consumers with lower than prime credit scores, we have expanded our prime lendingprograms. At December 31, 2016 and 2015, 48% and 60% of the retail finance receivables in North America were from consumerswith sub-prime credit scores, which are defined as FICO scores or its equivalent of less than 620 at the time of loan origination. At thetime of loan origination, substantially all of GM Financial’s international consumers have the equivalent of prime credit scores.
GM Financial purchases retail finance contracts from automobile dealers without recourse, and accordingly, the dealer has noliability to GM Financial if the consumer defaults on the contract. Finance receivables are collateralized by vehicle titles and GMFinancial has the right to repossess the vehicle in the event the consumer defaults on the payment terms of the contract.
63
GENERAL MOTORS COMPANY AND SUBSIDIARIES
NOTES TO CONSOLIDATED FINANCIAL STATEMENTS — (Continued)
An account is considered delinquent if a substantial portion of a scheduled payment has not been received by the date such paymentwas contractually due. At December 31, 2016 and 2015 the accrual of finance charge income had been suspended on delinquent retailfinance receivables with contractual amounts due of $807 million and $778 million. The following table summarizes the contractualamount of delinquent retail finance receivables, which is not significantly different than the recorded investment of the retail financereceivables:
Total finance receivables more than 30 days delinquent or in repossession . . . . . . . . $ 1,828 5.5% $ 1,764 6.0%
At December 31, 2016 and 2015 retail finance receivables classified as TDRs and individually evaluated for impairment were $1.9billion and $1.6 billion and the allowance for loan losses included $276 million and $220 million of specific allowances on thesereceivables.
Commercial Finance Receivables GM Financial’s commercial finance receivables consist of dealer financings, primarily forinventory purchases. A proprietary model is used to assign a risk rating to each dealer. A credit review of each dealer is performed atleast annually, and if necessary, the dealer’s risk rating is adjusted on the basis of the review. Dealers in Group VI are subject toadditional restrictions on funding, up to suspension of lines of credit and liquidation of assets. At December 31, 2016 and 2015 thecommercial finance receivables on non-accrual status were insignificant. The following table summarizes the credit risk profile bydealer grouping of the commercial finance receivables:
Equipment on operating leases in our automotive operations consists of vehicle sales to daily rental car companies with aguaranteed repurchase obligation.
Depreciation expense related to GM Financial equipment on operating leases, net was $4.6 billion, $2.3 billion and $868 million inthe years ended December 31, 2016, 2015 and 2014.
The following table summarizes minimum rental payments due to GM Financial on leases to retail customers:
Note 7. Equity in Net Assets of Nonconsolidated Affiliates
Nonconsolidated affiliates are entities in which an equity ownership interest is maintained and for which the equity method ofaccounting is used due to our ability to exert significant influence over decisions relating to their operating and financial affairs.Revenue and expenses of our joint ventures are not consolidated into our financial statements; rather, our proportionate share of theearnings of each joint venture is reflected as Equity income.
At December 31, 2016 and 2015 the carrying amount of our investments in certain joint ventures exceeded our share of theunderlying net assets by $4.3 billion primarily related to goodwill from the application of fresh-start reporting and purchase ofadditional interests in nonconsolidated affiliates.
The following table summarizes our direct ownership interests in China JVs at December 31, 2016 and 2015:
SGM is a joint venture we established with Shanghai Automotive Industry Corporation (SAIC) (50%). SGM has interests in threeother joint ventures in China: SGM Norsom, SGM DY and SGM DYPT. These three joint ventures are jointly held by SGM (50%),SAIC (25%) and ourselves. These four joint ventures are engaged in the production, import and sale of a range of products under theBuick, Chevrolet and Cadillac brands. SGM also has interests in Shanghai OnStar (20%), Shanghai Chengxin Used Car (33%) andSAIC-GMAC (20%). Shanghai Automotive Group Finance Company Ltd., a subsidiary of SAIC, owns 45% of SAIC-GMAC.
Summarized Financial Data of Nonconsolidated Affiliates
Transactions with Nonconsolidated Affiliates Our nonconsolidated affiliates are involved in various aspects of the development,production and marketing of cars, trucks, crossovers and automobile parts. We enter into transactions with certain nonconsolidatedaffiliates to purchase and sell component parts and vehicles. The following tables summarize transactions with and balances related toour nonconsolidated affiliates:
NOTES TO CONSOLIDATED FINANCIAL STATEMENTS — (Continued)
The amount of capitalized software included in Property, net was $1.1 billion and $907 million at December 31, 2016 and 2015.The amount of interest capitalized and excluded from Automotive interest expense related to Property, net was insignificant in theyears ended December 31, 2016, 2015 and 2014.
(a) Included in depreciation and amortization expense.
Note 9. Acquisition of Business
On May 12, 2016 we acquired all of the outstanding capital stock of Cruise, an autonomous vehicle technology company, to furtheraccelerate our development of autonomous vehicles. The deal consideration at closing was $581 million, of which $291 million waspaid in cash and approximately $290 million was paid through the issuance of new common stock. The fair value of the commonstock issued was determined based on the closing price of our common stock on May 12, 2016. In conjunction with the acquisition,we entered into other agreements that will result in future costs contingent upon the continued employment of key individuals andadditional performance-based awards contingent upon the achievement of specific technology and commercialization milestones.
Of the total consideration, $130 million was allocated to intangible assets, primarily in-process research and development with anindefinite life until fully developed and commercialized, $39 million was allocated to deferred tax liabilities, net of other assets, and$490 million was allocated to non-tax-deductible goodwill in Corporate primarily related to the synergies expected to arise as a resultof the acquisition.
The results of operations associated with this acquisition were not significant to our consolidated financial statements. Accordingly,pro forma financial information is not presented. We have included the financial results of Cruise in our consolidated financialstatements from the date of acquisition.
Note 10. Goodwill and Intangible Assets
At December 31, 2016 our total goodwill balance of $1.9 billion consisted of $1.4 billion recorded in GM Financial and $490million included in Corporate. At December 31, 2015 our goodwill balance of $1.4 billion was recorded in GM Financial.
Our amortization expense related to Intangible assets was $328 million, $327 million, and $676 million in the years endedDecember 31, 2016, 2015 and 2014.
Amortization expense related to Intangible assets is estimated to be approximately $200 million in each of the next five years.
68
GENERAL MOTORS COMPANY AND SUBSIDIARIES
NOTES TO CONSOLIDATED FINANCIAL STATEMENTS — (Continued)
Note 11. Variable Interest Entities
GM Financial uses special purpose entities (SPEs) that are considered VIEs to issue variable funding notes to third party bank-sponsored warehouse facilities or asset-backed securities to investors in securitization transactions. The debt issued by these VIEs isbacked by finance receivables and leasing related assets transferred by GM Financial to the VIEs (Securitized Assets). GM Financialdetermined that it is the primary beneficiary of the SPEs because the servicing responsibilities for the Securitized Assets give GMFinancial the power to direct the activities that most significantly impact the performance of the VIEs and the variable interests in theVIEs give GM Financial the obligation to absorb losses and the right to receive residual returns that could potentially be significant.The assets serve as the sole source of repayment for the debt issued by these entities. Investors in the notes issued by the VIEs do nothave recourse to GM Financial or its other assets, with the exception of customary representation and warranty repurchase provisionsand indemnities that GM Financial provides as the servicer. GM Financial is not required and does not currently intend to provideadditional financial support to these SPEs. While these subsidiaries are included in GM Financial’s consolidated financial statements,they are separate legal entities and their assets are legally owned by them and are not available to GM Financial’s creditors. Thefollowing table summarizes the assets and liabilities related to GM Financial’s consolidated VIEs:
GM Financial recognizes finance charge, leased vehicle and fee income on the Securitized Assets and interest expense on thesecured debt issued in a securitization transaction and records a provision for loan losses to recognize probable loan losses inherent inthe finance receivables.
During the three months ended September 30, 2014 we began accruing the costs for recall campaigns at the time of vehicle sale inGMNA, which resulted in a charge due to a change in estimate for previously sold vehicles of $874 million recorded in the three monthsended June 30, 2014. We had historically accrued estimated costs related to recall campaigns in GMNA when probable and reasonablyestimable, which typically occurred once it was determined a specific recall campaign was needed and announced. We estimate ourreasonably possible loss in excess of amounts accrued for recall campaigns to be an insignificant amount at December 31, 2016.
(a) Includes net discount and debt issuance costs of $499 million and $549 million at December 31, 2016 and 2015.(b) Includes coupon rates on debt denominated in various foreign currencies and interest free loans.
The fair value of automotive debt measured utilizing Level 1 inputs was based on quoted prices in active markets for identicalinstruments that a market participant can access at the measurement date. The fair value of automotive debt measured utilizing Level 2inputs was based on a discounted cash flow model using observable inputs. This model utilizes observable inputs such as contractualrepayment terms and benchmark yield curves, plus a spread based on our senior unsecured notes that is intended to represent ournonperformance risk. We obtain the benchmark yield curves and yields on unsecured notes from independent sources that are widelyused in the financial industry. At December 31, 2016 and December 31, 2015 the fair value of automotive debt exceeded its carryingamount due primarily to a decrease in bond yields compared to yields at the time of issuance.
In February 2016 we issued $2.0 billion in aggregate principal amount of senior unsecured notes comprising $1.25 billion of 6.60%notes due in 2036 and $750 million of 6.75% notes due in 2046. These notes contain terms and covenants customary of these types ofsecurities including limitations on the amount of certain secured debt we may incur. The net proceeds from the issuance of thesesenior unsecured notes were used to fund discretionary contributions to our U.S. hourly pension plan as described in Note 14.
70
GENERAL MOTORS COMPANY AND SUBSIDIARIES
NOTES TO CONSOLIDATED FINANCIAL STATEMENTS — (Continued)
In May 2016 we amended and restated our two primary revolving credit facilities, increasing our aggregate borrowing capacityfrom $12.5 billion to $14.5 billion. These facilities consist of a three-year, $4.0 billion facility and a five-year, $10.5 billion facility.Both facilities are available to us as well as certain wholly-owned subsidiaries, including GM Financial. The three-year, $4.0 billionfacility allows for borrowings in U.S. Dollars and other currencies and includes a GM Financial borrowing sub-limit of $1.0 billionand a letter of credit sub-facility of $1.0 billion. The five-year, $10.5 billion facility allows for borrowings in U.S. Dollars and othercurrencies and includes a GM Financial borrowing sub-limit of $3.0 billion and a letter of credit sub-limit of $500 million.
The revolving credit facilities require us to maintain at least $4.0 billion in global liquidity and at least $2.0 billion in U.S. liquidity.If we fail to maintain an investment grade corporate rating from at least two of the following credit rating agencies: Fitch, Moody’sand S&P, certain subsidiaries of ours will be required to provide guarantees under the terms of the revolving credit facilities. Interestrates on obligations under the revolving credit facilities are based on prevailing annual interest rates for Eurodollar loans or analternative base rate, plus an applicable margin.
In the years ended December 2015 and 2014 we prepaid and retired debt obligations with a total carrying amount of $538 millionand $325 million which primarily represented unsecured debt in Brazil and recorded a net gain on extinguishment of debt of $449million and $202 million.
The fair value of GM Financial debt measured utilizing Level 2 inputs was based on quoted market prices for identical instrumentsand if unavailable, quoted market prices of similar instruments. For debt that has terms of one year or less or has been priced withinthe last six months, the carrying amount or par value is considered to be a reasonable estimate of fair value. The fair value of GMFinancial debt measured utilizing Level 3 inputs was based on the discounted future net cash flows expected to be settled usingcurrent risk-adjusted rates.
Secured debt consists of revolving credit facilities and securitization notes payable. Most of the secured debt was issued by VIEsand is repayable only from proceeds related to the underlying pledged Securitized Assets. Refer to Note 11 for additional informationon GM Financial’s involvement with VIEs. The weighted-average interest rate on secured debt was 2.09% at December 31, 2016. Therevolving credit facilities have maturity dates over periods ranging up to six years. At the end of the revolving period, if not renewed,the debt will amortize over a defined period. GM Financial is required to hold certain funds in restricted cash accounts to provideadditional collateral for borrowings under certain secured credit facilities. Securitization notes payable at December 31, 2016 are duebeginning in 2018 through 2024. In the year ended December 31, 2016 GM Financial issued securitization notes payable of$16.9 billion and entered into new or renewed credit facilities with a total net additional borrowing capacity of $4.0 billion, which hadsubstantially the same terms as existing debt.
Unsecured debt consists of senior notes, credit facilities, retail customer deposits and other unsecured debt. Senior notesoutstanding at December 31, 2016 are due beginning in 2017 through 2026 and have a weighted-average interest rate of 3.33%. InMarch 2016 GM Financial issued $2.75 billion in aggregate principal amount of senior notes comprising $1.5 billion of 4.20% notesdue in March 2021 and $1.25 billion of 5.25% notes due in March 2026. In May 2016 GM Financial issued $3.0 billion in aggregateprincipal amount of senior notes comprising $1.4 billion of 2.40% notes due in May 2019, $1.2 billion of 3.70% notes due in May2023 and $400 million of floating rate notes due in May 2019. Also in May 2016 GM Financial issued Euro 500 million of 1.168%term notes due in May 2020. In July 2016 GM Financial issued $2.0 billion of 3.20% senior notes due in July 2021. In September
71
GENERAL MOTORS COMPANY AND SUBSIDIARIES
NOTES TO CONSOLIDATED FINANCIAL STATEMENTS — (Continued)
2016 GM Financial issued Euro 750 million of 0.955% term notes due in September 2023. In October 2016 GM Financial issued$1.75 billion in aggregate principal amount of senior notes comprising $750 million of 2.35% notes due in October 2019,$750 million of 4.00% notes due in October 2026 and $250 million of floating rate notes due in October 2019. In November 2016 GMFinancial issued Euro 100 million of floating rate notes due in December 2017. In January 2017 GM Financial issued $2.5 billion inaggregate principal amount of senior notes comprising $1.25 billion of 3.45% notes due in January 2022, $750 million of 4.35% duein January 2027 and $500 million of floating rate notes due in January 2022. Each of these notes contain terms and covenantsincluding limitations on GM Financial’s ability to incur certain liens.
GM Financial accepts deposits from retail banking customers in Germany. At December 31, 2016 and December 31, 2015 theoutstanding balance of these deposits was $1.9 billion and $1.3 billion, of which 42% and 44% were overnight deposits, and hadweighted-average interest rates of 0.91% and 1.25%.
The terms of advances on revolving credit facilities and other unsecured debt have original maturities of up to five years. Theweighted-average interest rate on credit facilities and other unsecured debt was 7.50% at December 31, 2016.
(a) Secured debt, credit facilities and other unsecured debt are based on expected payoff date. Senior notes principal amounts are based on maturity.
At December 31, 2016 future interest payments on automotive capital lease obligations were $371 million. GM Financial had nocapital lease obligations at December 31, 2016.
Compliance with Debt Covenants Several of our loan facilities, including our revolving credit facilities, require compliance withcertain financial and operational covenants as well as regular reporting to lenders, including providing certain subsidiary financialstatements. Some of GM Financial’s secured and unsecured debt agreements also contain various covenants, including maintainingportfolio performance ratios as well as limits on deferment levels. Failure to meet certain of these requirements may result in acovenant violation or an event of default depending on the terms of the agreement. An event of default may allow lenders to declareamounts outstanding under these agreements immediately due and payable, to enforce their interests against collateral pledged underthese agreements or restrict our ability or GM Financial’s ability to obtain additional borrowings. No technical defaults or covenantviolations existed at December 31, 2016.
72
GENERAL MOTORS COMPANY AND SUBSIDIARIES
NOTES TO CONSOLIDATED FINANCIAL STATEMENTS — (Continued)
Note 14. Pensions and Other Postretirement Benefits
Employee Pension and Other Postretirement Benefit Plans
Defined Benefit Pension Plans Defined benefit pension plans covering eligible U.S. hourly employees (hired prior to October2007) and Canadian hourly employees (hired prior to October 2016) generally provide benefits of negotiated, stated amounts for eachyear of service and supplemental benefits for employees who retire with 30 years of service before normal retirement age. Thebenefits provided by the defined benefit pension plans covering eligible U.S. (hired prior to January 1, 2001) and Canadian salariedemployees and employees in certain other non-U.S. locations are generally based on years of service and compensation history.Accrual of defined pension benefits ceased in 2012 for U.S. and Canadian salaried employees. There is also an unfunded nonqualifiedpension plan covering primarily U.S. executives for service prior to January 1, 2007 and it is based on an “excess plan” for serviceafter that date.
The funding policy for qualified defined benefit pension plans is to contribute annually not less than the minimum required byapplicable laws and regulations or to directly pay benefit payments where appropriate. In the year ended December 31, 2016 all legalfunding requirements were met; additionally we made discretionary contributions to our U.S. hourly pension plan of $2.0 billion.These discretionary contributions were funded with the net proceeds from the issuance of the automotive senior unsecured notesdescribed in Note 13. The following table summarizes contributions made to the defined benefit pension plans:
We expect to contribute $73 million to our U.S. non-qualified plans and $970 million to our non-U.S. pension plans in 2017.
Based on our current assumptions, over the next five years we expect no significant mandatory contributions to our U.S. qualifiedpension plans and mandatory contributions totaling $1.8 billion to our Canada and U.K. pension plans.
Other Postretirement Benefit Plans Certain hourly and salaried defined benefit plans provide postretirement medical, dental,legal service and life insurance to eligible U.S. and Canadian retirees and their eligible dependents. Certain other non-U.S.subsidiaries have postretirement benefit plans, although most non-U.S. employees are covered by government sponsored oradministered programs. We made contributions to the U.S. OPEB plans of $335 million, $340 million and $354 million in the yearsended December 31, 2016, 2015 and 2014. Plan participants’ contributions were insignificant in the years ended December 31, 2016,2015 and 2014.
Defined Contribution Plans We have defined contribution plans for eligible U.S. salaried and hourly employees that providediscretionary matching contributions. Contributions are also made to certain non-U.S. defined contribution plans. We madecontributions to our defined contribution plans of $594 million, $535 million and $513 million in the years ended December 31, 2016,2015 and 2014.
Significant Plan Amendments, Benefit Modifications and Related Events
Other Remeasurements We incorporated the mortality improvement tables issued by the Society of Actuaries (SOA) in the threemonths ended December 31, 2016 that lowered life expectancies and thereby indicated the amount of estimated aggregate benefitpayments to our U.S. pension plans’ participants was decreasing. This change in assumption decreased the December 31, 2016 U.S.pension and OPEB plans’ obligations by $888 million. In the three months ended December 31, 2014 the SOA issued new mortalityand mortality improvement tables that raised life expectancies and thereby indicated the amount of estimated aggregate benefit
73
GENERAL MOTORS COMPANY AND SUBSIDIARIES
NOTES TO CONSOLIDATED FINANCIAL STATEMENTS — (Continued)
payments to our U.S. pension plans’ participants was increasing. We incorporated these SOA mortality and mortality improvementtables into our December 31, 2014 measurement of our U.S. pension and OPEB plans’ benefit obligations. The change in theseassumptions increased the December 31, 2014 U.S. pension and OPEB plans’ obligations by $2.2 billion.
Pension and OPEB Obligations and Plan Assets
Year Ended December 31, 2016 Year Ended December 31, 2015
Pension Benefits GlobalOPEBPlans
Pension Benefits GlobalOPEBPlansU.S. Non-U.S. U.S. Non-U.S.
NOTES TO CONSOLIDATED FINANCIAL STATEMENTS — (Continued)
The following table summarizes the total accumulated benefit obligations (ABO), the ABO and fair value of plan assets for definedbenefit pension plans with ABO in excess of plan assets, and the PBO and fair value of plan assets for defined benefit pension planswith PBO in excess of plan assets:
The following table summarizes the components of net periodic pension and OPEB expense along with the assumptions used todetermine benefit obligations:
Year Ended December 31, 2016 Year Ended December 31, 2015 Year Ended December 31, 2014
Pension Benefits GlobalOPEBPlans
Pension Benefits GlobalOPEBPlans
Pension Benefits GlobalOPEBPlansU.S. Non-U.S. U.S. Non-U.S. U.S. Non-U.S.
(a) The curtailment charges recorded in the year ended December 31, 2015 were due primarily to the GM Canada hourly pension plan that was remeasured as a resultof a voluntary separation program.
(b) As a result of ceasing the accrual of additional benefits for salaried plan participants, the rate of compensation increase does not have a significant effect on ourU.S. pension and OPEB plans.
Effective January 2016 the discount rate used to determine the service cost and interest cost for our pension and OPEB plans wasbased on individual annual yield curve rates. This refinement was considered a change in estimate and applied prospectively. The useof the individual annual yield curve rates has reduced the service cost and interest cost by $768 million in the year endedDecember 31, 2016, which was offset in the actuarial gains and losses upon the December 31, 2016 remeasurement of the plans’obligations.
75
GENERAL MOTORS COMPANY AND SUBSIDIARIES
NOTES TO CONSOLIDATED FINANCIAL STATEMENTS — (Continued)
U.S. pension plan service cost includes administrative expenses and Pension Benefit Guarantee Corporation premiums which wereinsignificant in the years ended December 31, 2016, 2015 and 2014. Weighted-average assumptions used to determine net expense aredetermined at the beginning of the period and updated for remeasurements. Non-U.S. pension plan administrative expenses includedin service cost were insignificant in the years ended December 31, 2016, 2015 and 2014.
Estimated amounts to be amortized from Accumulated other comprehensive loss into net periodic benefit cost in the year endingDecember 31, 2017 based on December 31, 2016 plan measurements are $261 million, consisting primarily of amortization of the netactuarial loss in the non-U.S. pension plans.
Assumptions
Investment Strategies and Long-Term Rate of Return Detailed periodic studies are conducted by our internal asset managementgroup as well as outside actuaries and are used to determine the long-term strategic mix among asset classes, risk mitigation strategiesand the expected long-term return on asset assumptions for the U.S. pension plans. The U.S. study includes a review of alternativeasset allocation and risk mitigation strategies, anticipated future long-term performance and risk of the individual asset classes thatcomprise the plans’ asset mix. Similar studies are performed for the significant non-U.S. pension plans with the assistance of outsideactuaries and asset managers. While the studies incorporate data from recent plan performance and historical returns, the expectedlong-term return on plan asset assumptions are determined based on long-term prospective rates of return.
We continue to pursue various options to fund and derisk our pension plans, including continued changes to the pension assetportfolio mix to reduce funded status volatility. The strategic asset mix and risk mitigation strategies for the plans are tailoredspecifically for each plan. Individual plans have distinct liabilities, liquidity needs and regulatory requirements. Consequently thereare different investment policies set by individual plan fiduciaries. Although investment policies and risk mitigation strategies maydiffer among plans, each investment strategy is considered to be appropriate in the context of the specific factors affecting each plan.
In setting new strategic asset mixes, consideration is given to the likelihood that the selected asset mixes will effectively fund theprojected pension plan liabilities, while aligning with the risk tolerance of the plans’ fiduciaries. The strategic asset mixes for U.S.defined benefit pension plans are increasingly designed to satisfy the competing objectives of improving funded positions (marketvalue of assets equal to or greater than the present value of the liabilities) and mitigating the possibility of a deterioration in fundedstatus.
Derivatives may be used to provide cost effective solutions for rebalancing investment portfolios, increasing or decreasing exposureto various asset classes and for mitigating risks, primarily interest rate and currency risks. Equity and fixed income managers arepermitted to utilize derivatives as efficient substitutes for traditional securities. Interest rate derivatives may be used to adjust portfolioduration to align with a plan’s targeted investment policy. Alternative investment managers are permitted to employ leverage,including through the use of derivatives, which may alter economic exposure.
In December 2016 an investment policy study was completed for the U.S. pension plans. The study resulted in new target assetallocations being approved for the U.S. pension plans with resulting changes to the expected long-term rate of return on assets. Theweighted-average long-term rate of return on assets decreased from 6.3% at December 31, 2015 to 6.2% at December 31, 2016. Theexpected long-term rate of return on plan assets used in determining pension expense for non-U.S. plans is determined in a similarmanner to the U.S. plans.
76
GENERAL MOTORS COMPANY AND SUBSIDIARIES
NOTES TO CONSOLIDATED FINANCIAL STATEMENTS — (Continued)
Target Allocation Percentages The following table summarizes the target allocations by asset category for U.S. and non-U.S.defined benefit pension plans:
(a) Primarily includes private equity, real estate and absolute return strategies which mainly consist of hedge funds.
Assets and Fair Value Measurements The following tables summarize the fair value of U.S. and non-U.S. defined benefitpension plan assets by asset class:
December 31, 2016 December 31, 2015
Level 1 Level 2 Level 3 Total Level 1 Level 2 Level 3 Total
(a) Includes U.S. and sovereign government and agency issues.(b) Cash held by the plans, net of amounts receivable/payable for unsettled security transactions and payables for investment manager fees, custody
fees and other expenses.
The activity attributable to U.S. and non-U.S. Level 3 defined benefit pension plan investments was insignificant in the years endedDecember 31, 2016 and 2015.
Alternative Investment Strategies Investment funds include hedge funds, funds of hedge funds, equity funds and fixed incomefunds. Hedge funds and funds of hedge funds managers typically seek to achieve their objectives by allocating capital across a broadarray of funds and/or investment managers. Equity funds invest in U.S. common and preferred stocks as well as similar equitysecurities issued by companies incorporated, listed or domiciled in developed and/or emerging market countries. Fixed income fundsinclude investments in high quality funds and, to a lesser extent, high yield funds. High quality fixed income funds invest ingovernment securities, investment-grade corporate bonds and mortgage and asset-backed securities. High yield fixed income fundsinvest in high yield fixed income securities issued by corporations which are rated below investment grade. Other investment fundsalso included in this category primarily represent multi-strategy funds that invest in broadly diversified portfolios of equity, fixedincome and derivative instruments.
Private equity and debt investments primarily consist of investments in private equity and debt funds. These investments provideexposure to and benefit from long-term equity investments in private companies, including leveraged buy-outs, venture capital anddistressed debt strategies.
Real estate investments include funds that invest in entities which are primarily engaged in the ownership, acquisition,development, financing, sale and/or management of income-producing real estate properties, both commercial and residential. Thesefunds typically seek long-term growth of capital and current income that is above average relative to public equity funds.
Significant Concentrations of Risk The assets of the pension plans include certain investment funds, private equity and debtinvestments and real estate investments. Investment managers may be unable to quickly sell or redeem some or all of theseinvestments at an amount close or equal to fair value in order to meet a plan’s liquidity requirements or to respond to specific eventssuch as deterioration in the creditworthiness of any particular issuer or counterparty.
Illiquid investments held by the plans are generally long-term investments that complement the long-term nature of pensionobligations and are not used to fund benefit payments when currently due. Plan management monitors liquidity risk on an ongoing
78
GENERAL MOTORS COMPANY AND SUBSIDIARIES
NOTES TO CONSOLIDATED FINANCIAL STATEMENTS — (Continued)
basis and has procedures in place that are designed to maintain flexibility in addressing plan-specific, broader industry and marketliquidity events.
The pension plans may invest in financial instruments denominated in foreign currencies and may be exposed to risks that theforeign currency exchange rates might change in a manner that has an adverse effect on the value of the foreign currency denominatedassets or liabilities. Forward currency contracts may be used to manage and mitigate foreign currency risk.
The pension plans may invest in debt securities for which any change in the relevant interest rates for particular securities mightresult in an investment manager being unable to secure similar returns upon the maturity or the sale of securities. In addition changesto prevailing interest rates or changes in expectations of future interest rates might result in an increase or decrease in the fair value ofthe securities held. Interest rate swaps and other financial derivative instruments may be used to manage interest rate risk.
Benefit Payments Benefits for most U.S. pension plans and certain non-U.S. pension plans are paid out of plan assets rather thanour Cash and cash equivalents. The following table summarizes net benefit payments expected to be paid in the future, which includeassumptions related to estimated future employee service:
Litigation-Related Liability and Tax Administrative Matters In the normal course of business, we are named from time to timeas a defendant in various legal actions, including arbitrations, class actions and other litigation, that arise in connection with ourbusiness as a global company. We identify below the material individual proceedings and investigations in connection with which webelieve a material loss is reasonably possible or probable. We accrue for matters when we believe that losses are probable and can bereasonably estimated. At December 31, 2016 and 2015, accruals were $1.3 billion and $1.2 billion and were recorded in Accruedliabilities and Other liabilities. In many proceedings, it is inherently difficult to determine whether any loss is probable or evenreasonably possible or to estimate the size or range of the possible loss. Accordingly an adverse outcome from such proceedings couldexceed the amounts accrued by an amount that could be material to our results of operations or cash flows in any particular reportingperiod.
Proceedings Related to Ignition Switch Recall and Other Recalls In 2014 we announced various recalls relating to safety,customer satisfaction and other matters. Those recalls included recalls to repair ignition switches that could under certaincircumstances unintentionally move from the “run” position to the “accessory” or “off” position with a corresponding loss of power,which could in turn prevent airbags from deploying in the event of a crash.
Through January 27, 2017 we were aware of 100 putative class actions pending against GM in various federal and state trial courtsin the U.S. and 21 putative class actions pending in various Provincial Courts in Canada alleging that consumers who purchased orleased vehicles manufactured by GM or General Motors Corporation had been economically harmed by one or more of the recallsannounced in 2014 and/or the underlying vehicle conditions associated with those recalls (economic-loss cases). In general, theseeconomic-loss cases seek recovery for purported compensatory damages, such as alleged benefit-of-the-bargain damages or damagesrelated to alleged diminution in value of the vehicles, as well as punitive damages, injunctive relief and other relief. There are also twocivil actions brought by state governmental entities relating to the 2014 recalls that seek injunctive relief as well as civil penalties andattorneys’ fees for alleged violations of state laws.
79
GENERAL MOTORS COMPANY AND SUBSIDIARIES
NOTES TO CONSOLIDATED FINANCIAL STATEMENTS — (Continued)
Through January 27, 2017 we were aware of 284 actions pending in various federal and state trial courts in the U.S. and 14 actionspending in various Provincial Courts in Canada alleging injury or death as a result of defects that may be the subject of recallsannounced in 2014 (personal injury cases). In general, these personal injury cases seek recovery for purported compensatory damages,punitive damages and other relief.
During 2016, the U.S. District Court for the Southern District of New York (the district court) and a Texas court administering aTexas state multidistrict litigation scheduled a combined eight ignition-switch personal injury cases for bellwether trials. None ofthose resulted in a finding of liability against GM; juries in two cases returned verdicts in favor of GM, a court dismissed one case onsummary judgment, plaintiffs dismissed two cases with prejudice before trial, and the parties settled the remaining three cases. Thedistrict court has scheduled additional personal injury bellwether trials for 2017 and 2018. Each bellwether trial will be tried on itsfacts and the result of any subsequent bellwether trial may be different from the earlier bellwether trials.
On July 15, 2016 the district court granted in part and denied in part GM’s motion to dismiss plaintiffs’ complaint seeking damagesfor alleged economic loss relating to the ignition switch and other recalls by GM in 2014. The district court dismissed plaintiffs’claims brought under the Racketeer Influenced and Corrupt Organization Act (RICO), and those brought by any plaintiff whosevehicle was not allegedly defective when sold. The district court also rejected Plaintiffs’ broadest theory of damages – that plaintiffscould seek recovery for alleged reduction in the value of their vehicles due to damage to GM’s reputation and brand as a result of theignition switch matter. The district court also held that plaintiffs did not have a common basis for their claims across all defects andmodels to proceed as a single class, and that the remaining claims may have to proceed individually or in subclasses of vehiclesaffected by a common defect. Further, the district court held that the named plaintiffs may assert claims only on behalf of owners ofthe same vehicle models that they themselves purchased (or leased) or models with sufficiently similar defects, and that it will notspecify the specific permissible class claims until the class-certification stage. Finally, the district court granted GM’s motion todismiss with respect to certain state law claims but denied it as to other state law claims. The court held that the viability of state lawclaims will depend on each state’s specific laws and plaintiffs’ specific factual allegations. While the ruling addressed post-bankruptcy claims, we believe the district court’s legal holdings should apply to limit plaintiffs’ pre-bankruptcy claims similarly. OnSeptember 15, 2016, Plaintiffs filed a Fourth Amended Consolidated Complaint amending their economic-loss claims. OnDecember 7, 2016 GM moved to dismiss certain claims in that complaint as well.
Because many plaintiffs in the actions described in the above paragraphs are suing over the conduct of General Motors Corporationor vehicles manufactured by that entity for liabilities not expressly assumed by GM, we moved to enforce the terms of the July 2009Sale Order and Injunction (2009 Sale Order) issued by the United States Bankruptcy Court for the Southern District of New York(Bankruptcy Court) to preclude claims from being asserted against us for, among other things, personal injuries based on pre-saleaccidents, any economic-loss claims based on acts or conduct of General Motors Corporation and claims asserting successor liabilityfor obligations owed by General Motors Corporation (successor liability claims). On April 15, 2015 the Bankruptcy Court issued adecision precluding claims against us based upon pre-sale accidents, claims based upon the acts or conduct by General MotorsCorporation and successor liability claims, except for claims asserting liabilities that had been expressly assumed by us in the July2009 Sale Agreement, and claims that could be asserted against us only if they were otherwise viable and arose solely out of our ownindependent post-closing acts and did not in any way rely on acts or conduct by General Motors Corporation. Plaintiffs appealed theBankruptcy Court’s decision and we cross appealed with respect to certain issues to preserve our rights.
On July 13, 2016 a three judge panel of the United States Court of Appeals for the Second Circuit (Second Circuit) issued adecision and judgment affirming in part, reversing in part, and vacating portions of the Bankruptcy Court’s April 15, 2015 decisionand subsequent judgment. Among other things, the Second Circuit held that the 2009 Sale Order could not be enforced to bar claimsagainst GM asserted by either plaintiffs who purchased used vehicles after the sale closing or against purchasers who asserted claimsrelating to the ignition switch defect, including pre-closing personal injury claims and economic-loss claims. The Second Circuit alsovacated that portion of the Bankruptcy Court judgment enforcing the 2009 Sale Order against plaintiffs with pre-sale claims based ondefects other than the ignition switch and remanded that issue to the Bankruptcy Court for further proceedings. The Second Circuitdenied our request for an en banc review of the panel’s decision and judgment. On December 13, 2016 we petitioned for certiorari tothe United States Supreme Court. In 2014 GM voluntarily established the Ignition Switch Recall Compensation Program (the
80
GENERAL MOTORS COMPANY AND SUBSIDIARIES
NOTES TO CONSOLIDATED FINANCIAL STATEMENTS — (Continued)
Program), administered by an independent administrator, which provided compensation for individuals who died or suffered personalinjuries (or for their families) as a result of the ignition switch defect, both before and after bankruptcy. The Program completed itsclaims review process in the three months ended September 30, 2015, but continues to process acceptances that require court approvaland resolve liens related to accepted claims. Accident victims (or their families) that accept a payment under the Program agree tosettle all claims against GM related to the accident. As a result, certain pre-closing personal injury claims relating to the ignitionswitch defect were resolved through this program.
In the putative shareholder class action filed in the United States District Court for the Eastern District of Michigan (EasternDistrict) on behalf of purchasers of our common stock from November 17, 2010 to July 24, 2014 (Shareholder Class Action), the leadplaintiff, the New York State Teachers’ Retirement System, alleged that GM and several current and former officers and employeesmade material misstatements and omissions relating to problems with the ignition switch and other matters in SEC filings and otherpublic statements. On May 23, 2016 the Eastern District entered a judgment approving a class-wide settlement of the ShareholderClass Action for $300 million. One shareholder has filed an appeal of the decision approving the settlement.
On February 11, 2016 the Delaware Supreme Court affirmed the dismissal of four consolidated shareholder derivative actions thathad been pending in the Delaware Chancery Court. In light of the Delaware Supreme Court’s decision, proceedings have resumed inthe two consolidated shareholder derivative actions in the Eastern District that had been stayed pending disposition of the Delawarecases and the Eastern District is now considering our motion to dismiss in those actions. In early 2016 an additional shareholderderivative action was filed in the Eastern District against certain current and former GM directors and officers making similarallegations to the two other shareholder derivative actions that are pending in the Eastern District. This new derivative action has beentransferred to the same judge handling those two other shareholder derivative actions. Two derivative actions filed in the Circuit Courtof Wayne County, Michigan, which have been consolidated, are stayed pending disposition of the federal derivative actions.
In connection with the 2014 recalls, we have from time to time received subpoenas and other requests for information related toinvestigations by agencies or other representatives of U.S. federal, state and the Canadian governments. On January 18, 2017, GMresolved an SEC investigation. On December 15, 2016, we received notice of a Final Decision and Order from the Federal TradeCommission closing its investigation into GM’s certified pre-owned vehicle advertising. The Final Decision and Order does notrequire any payment by GM, but it does require GM to make certain advertising disclosures and send notices to certain customers whopurchased certified pre-owned vehicles. Ongoing matters of investigations as of December 31, 2016 include litigation initiated by theArizona Attorney General, litigation initiated by the Orange County District Attorney, and investigations by 49 state attorneys generalwhich may result in litigation. We believe we are cooperating fully with all reasonable pending requests for information. We haveaccrued for these matters to the extent required by law and regulations. Such matters could in the future result in the imposition ofmaterial damages, fines, civil consent orders, civil and criminal penalties or other remedies.
Under the DPA we consented to the filing of a two-count information (the information) in the district court charging GM with ascheme to conceal material facts from a government regulator, in violation of Title 18, United States Code, Section 1001, and wirefraud, in violation of Title 18, United States Code, Section 1343. We have pled not guilty to the charges alleged in the information.Under the DPA we paid the United States $900 million as a financial penalty. Payment was made in the three months endedSeptember 30, 2015.
Pursuant to the DPA, the Office agreed to recommend to the district court that prosecution of GM on the information be deferredfor three years. The Office also agreed that if we are in compliance with all of our obligations under the DPA, the Office will, within30 days after the expiration of the period of deferral (including any extensions thereto), seek dismissal with prejudice of theinformation filed against GM. The DPA further provides that, in the event the Office determines during the period of deferral ofprosecution (or any extensions thereof) that we have violated any provision of the DPA, the Office may in its discretion eitherprosecute GM on the charges alleged in the information or impose an extension of the period of deferral of prosecution of up to oneadditional year, but in no event will the total term of the deferral-of-prosecution period under the DPA exceed four years.
In the DPA, we also agreed to retain an independent monitor (the Monitor) for a period of three years to review and assess ourpolicies, practices or procedures related to statements about motor vehicle safety, the provision of information to those responsible for
81
GENERAL MOTORS COMPANY AND SUBSIDIARIES
NOTES TO CONSOLIDATED FINANCIAL STATEMENTS — (Continued)
recall decisions, recall processes and addressing known defects in certified pre-owned vehicles. The Office has the authority tolengthen the Monitor’s term up to one year if the Office determines we have violated the DPA. Likewise, the Office may shorten theMonitor’s term if the Office determines that a monitor is no longer necessary. We are required to pay the compensation and expensesof the Monitor and of the persons hired under his or her authority. The Monitor commenced his term in November 2015.
The total amount accrued at December 31, 2016 reflects amounts for a combination of settled but unpaid matters, and for theremaining unsettled investigations, claims and/or lawsuits relating to the ignition switch recalls and other related recalls represents acombination of our best single point estimates where determinable and, where no such single point estimate is determinable, ourestimate of the low end of the range of probable loss with regard to such matters, if that is determinable. We believe it is probable thatwe will incur additional liabilities beyond what has already been accrued with regard to at least a portion of the remaining matters,whether through settlement or judgment; however, we are currently unable to estimate an overall amount or range of loss becausethese matters involve significant uncertainties, including the legal theory or the nature of the investigations, claims and/or lawsuits,the complexity of the facts, the lack of documentation available to us with respect to particular cases or groups of cases, the results ofany investigation or litigation and the timing of resolution of the investigation or litigations, including any appeals, furtherproceedings following the Supreme Court’s decision as to whether it will grant review of the Second Circuit’s July 13, 2016 decision,and further proceedings following the district court’s July 15, 2016 decision and its decision on GM’s motion to dismiss the FourthAmended and Consolidated Complaint in the multidistrict litigation. We will continue to consider resolution of pending mattersinvolving ignition switch recalls and other recalls where it makes sense to do so.
GM Canada Dealers’ Claim On February 12, 2010 a claim was filed in the Ontario Superior Court of Justice against GM Canadaon behalf of a purported class of over 200 former GM Canada dealers (the Plaintiff Dealers) which had entered into wind-downagreements with GM Canada. In May 2009 in the context of the global restructuring of GM’s business and the possibility that GMCanada might be required to initiate insolvency proceedings, GM Canada offered the Plaintiff Dealers the wind-down agreements toassist with their exit from the GM Canada dealer network and to facilitate winding down their operations in an orderly fashion. ThePlaintiff Dealers allege that their Dealer Sales and Service Agreements were wrongly terminated by GM Canada and that GM Canadafailed to comply with certain disclosure obligations, breached its statutory duty of fair dealing and unlawfully interfered with thePlaintiff Dealers’ statutory right to associate in an attempt to coerce the Plaintiff Dealers into accepting the wind-down agreements.The Plaintiff Dealers seek damages and assert that the wind-down agreements are rescindable. The Plaintiff Dealers’ initial pleadingmakes reference to a claim “not exceeding” 750 million Canadian Dollars, without explanation of any specific measure of damages.On March 1, 2011 the court approved certification of a class for the purpose of deciding a number of specifically defined issues. Anumber of former dealers opted out of participation in the litigation, leaving 181 dealers in the certified class. On July 8, 2015 theOntario Superior Court dismissed the Plaintiff Dealers’ claim against GM Canada. The court also dismissed GM Canada’scounterclaim against the Plaintiff Dealers for repayment of the wind-down payments made to them by GM Canada as well as for otherrelief. All parties have filed notices of appeal. The appeals and cross appeals were heard by the Ontario Court of Appeal in January2017.
GM Korea Wage Litigation Commencing on or about September 29, 2010 current and former hourly employees of GM KoreaCompany (GM Korea) filed eight separate group actions in the Incheon District Court in Incheon, Korea. The cases, which inaggregate involve more than 10,000 employees, allege that GM Korea failed to include bonuses and certain allowances in itscalculation of Ordinary Wages due under the Presidential Decree of the Korean Labor Standards Act. On November 23, 2012 theSeoul High Court (an intermediate level appellate court) affirmed a decision of the Incheon District Court in a case involving five GMKorea employees which was contrary to GM Korea’s position. GM Korea appealed to the Supreme Court of the Republic of Korea(Supreme Court). On May 29, 2014 the Supreme Court remanded the case to the Seoul High Court for consideration consistent withearlier Supreme Court precedent holding that while fixed bonuses should be included in the calculation of Ordinary Wages, claims forretroactive application of this rule would be barred under certain circumstances. On reconsideration, the Seoul High Court held in GMKorea’s favor on October 30, 2015, after which the plaintiffs appealed to the Supreme Court. In July 2014 GM Korea and its laborunion also agreed to include bonuses and certain allowances in Ordinary Wages retroactive to March 1, 2014. Therefore our accrualrelated to these cases was reclassified from a contingent liability to the Pensions liability. We estimate our reasonably possible loss inexcess of amounts accrued to be 611 billion South Korean Won (equivalent to $506 million) at December 31, 2016, which relates to
82
GENERAL MOTORS COMPANY AND SUBSIDIARIES
NOTES TO CONSOLIDATED FINANCIAL STATEMENTS — (Continued)
periods before March 1, 2014. We are also party to litigation with current and former salaried employees over allegations relating toOrdinary Wages regulation. On November 26 and 27, 2015 the Supreme Court remanded two salary cases to the Seoul High Court fora review of the merits. At December 31, 2016 we identified a reasonably possible loss for salary cases in excess of the amountsaccrued to be 186 billion South Korean Won (equivalent to $154 million). Both the scope of claims asserted and GM Korea’sassessment of any or all of the individual claim elements may change if new information becomes available. These cases are currentlypending before various courts in Korea.
Other Litigation-Related Liability and Tax Administrative Matters Various other legal actions, governmental investigations,claims and proceedings are pending against us or our related companies or joint ventures, including matters arising out of allegedproduct defects; employment-related matters; governmental regulations relating to product and workplace safety, emissions and fueleconomy; product warranties; financial services; dealer, supplier and other contractual relationships; government regulations relatingto payments to foreign companies; government regulations relating to competition issues; tax-related matters not subject to theprovision of ASC 740, Income Taxes (indirect tax-related matters); and environmental protection laws, including laws regulating airemissions, water discharges, waste management and environmental remediation. We believe that appropriate accruals have beenestablished for losses that are probable and can be reasonably estimated. It is possible that the resolution of one or more of thesematters could exceed the amounts accrued in an amount that could be material to our results of operations.
Indirect tax-related matters are being litigated globally pertaining to value added taxes, customs, duties, sales, property taxes andother non-income tax related tax exposures. The various non-U.S. labor-related matters include claims from current and formeremployees related to alleged unpaid wage, benefit, severance and other compensation matters. Certain South American administrativeproceedings are indirect tax-related and may require that we deposit funds in escrow or provide an alternative form of security whichmay range from $200 million to $600 million at December 31, 2016. Some of the matters may involve compensatory, punitive orother treble damage claims, environmental remediation programs or sanctions that, if granted, could require us to pay damages ormake other expenditures in amounts that could not be reasonably estimated at December 31, 2016. We believe that appropriateaccruals have been established for losses that are probable and can be reasonably estimated. For indirect tax-related matters weestimate our reasonably possible loss in excess of amounts accrued to be up to approximately $1.1 billion at December 31, 2016.
Takata Matters On May 4, 2016 NHTSA issued an amended consent order requiring Takata to file DIRs for previously unrecalledfront airbag inflators that contain an ammonium nitrate-based propellant without a moisture absorbing desiccant on a multi-year, risk-based schedule through 2019 impacting tens of millions of vehicles produced by numerous automotive manufacturers. NHTSAconcluded that the likely root cause of the rupturing of the airbag inflators is a function of time, temperature cycling andenvironmental moisture. On May 16, 2016 Takata issued its first DIR in connection with the amended consent order, and onJanuary 3, 2017, Takata issued its second set of DIRs.
Although we do not believe there is a safety defect at this time in any GM vehicles within scope of the Takata DIR, in cooperationwith NHTSA we filed Preliminary DIRs on May 27, 2016, updated as of June 13, 2016, covering 2.5 million of certain of ourGMT900 vehicles, which are full-size pick-up trucks and SUVs. On November 15, 2016 we filed a petition for inconsequentiality andrequest for deferral of determination regarding certain GMT900 vehicles equipped with Takata inflators. On November 28, 2016NHTSA granted GM’s deferral request in connection with this petition. The deferral provides GM until August 31, 2017 to presentevidence and analysis that our vehicles do not pose an unreasonable risk to motor vehicle safety. We believe that this timeline willpermit us to complete our testing of the relevant non-desiccated Takata inflators in GMT900 vehicles and to prove to NHTSA that theinflators in these vehicles do not present an unreasonable risk to safety and that no repair will ultimately be required.
Takata filed a second set of equipment DIRs on January 3, 2017 and we filed a second set of Preliminary DIRs for certain GMT900vehicles on January 10, 2017. These January 2017 DIRs are consistent with GM’s May 2016 DIRs. On the same day, we also filed asecond petition for inconsequentiality and deferral of decision with respect to the vehicles subject to our January 2017 DIRs. OnJanuary 18, 2017, NHTSA consolidated our first and second petitions for inconsequentiality and will rule on both at the same time.
We believe these vehicles are currently performing as designed and ongoing testing continues to support the belief that thevehicles’ unique design and integration mitigates against inflator degradation. We believe that the results of further testing and
83
GENERAL MOTORS COMPANY AND SUBSIDIARIES
NOTES TO CONSOLIDATED FINANCIAL STATEMENTS — (Continued)
analysis will demonstrate that the vehicles do not present an unreasonable risk to safety and that no repair will ultimately be required.Accordingly, no warranty provision has been made for any repair associated with our vehicles subject to the Preliminary DIRs andamended consent order. However, in the event we are ultimately obligated to repair the inflators in these vehicles, we estimate areasonably possible cost of up to $880 million for the 6.9 million vehicles subject to either the Preliminary DIRs or future TakataDIRs under the amended consent order.
Through January 27, 2017 we were aware of one putative class action pending against GM in federal court in the U.S., one putativeclass action in Mexico and seven putative class actions pending in various Provincial Courts in Canada arising out of allegations thatairbag inflators manufactured by Takata are defective. In addition, the New Mexico Attorney General has initiated litigation againstTakata and numerous automotive manufacturers, including GM. At this early stage of these proceedings, we are unable to provide anevaluation of the likelihood that a loss will be incurred or an estimate of the amounts or range of possible loss.
Product Liability With respect to product liability claims (other than claims relating to the ignition switch recalls discussed above)involving our and General Motors Corporation products, we believe that any judgment against us for actual damages will beadequately covered by our recorded accruals and, where applicable, excess liability insurance coverage. In addition we indemnifydealers for certain product liability related claims including products sold by General Motors Corporation’s dealers. At December 31,2016 and 2015 liabilities of $656 million and $712 million were recorded in Accrued liabilities and Other liabilities for the expectedcost of all known product liability claims plus an estimate of the expected cost for product liability claims that have already beenincurred and are expected to be filed in the future for which we are self-insured. In light of vehicle recalls in recent years it isreasonably possible that our accruals for product liability claims may increase in future periods in material amounts, although wecannot estimate a reasonable range of incremental loss based on currently available information.
Guarantees We enter into indemnification agreements for liability claims involving products manufactured primarily by certainjoint ventures. We also provide vehicle repurchase guarantees and payment guarantees on commercial loans outstanding with thirdparties such as dealers. These guarantees terminate in years ranging from 2017 to 2031 or upon the occurrence of specific events orare ongoing. We believe that the related potential costs incurred are adequately covered and our recorded accruals are insignificant.The maximum liability, calculated as future undiscounted payments, was $4.4 billion and $2.6 billion for these guarantees atDecember 31, 2016 and 2015, the majority of which relate to the indemnification agreements.
In some instances certain assets of the party whose debt or performance we have guaranteed may offset, to some degree, the amountof certain guarantees. Our payables to the party whose debt or performance we have guaranteed may also reduce the amount of certainguarantees. If vehicles are required to be repurchased under vehicle repurchase obligations, the total exposure would be reduced to theextent vehicles are able to be resold to another dealer.
We periodically enter into agreements that incorporate indemnification provisions in the normal course of business. It is notpossible to estimate our maximum exposure under these indemnifications or guarantees due to the conditional nature of theseobligations. Insignificant amounts have been recorded for such obligations as the majority of them are not probable or estimable atthis time and the fair value of the guarantees at issuance was insignificant.
Credit Cards Credit card programs offer rebates that can be applied primarily against the purchase or lease of our vehicles. AtDecember 31, 2016 and 2015, our redemption liability was insignificant, our deferred revenue was $286 million and $258 million, andqualified cardholders had rebates available, net of deferred program revenue, of $1.9 billion and $2.0 billion. Our redemption liabilityand deferred revenue are recorded in Accrued liabilities and Other liabilities.
84
GENERAL MOTORS COMPANY AND SUBSIDIARIES
NOTES TO CONSOLIDATED FINANCIAL STATEMENTS — (Continued)
Noncancelable Operating Leases The following table summarizes our minimum commitments under noncancelable operatingleases having initial terms in excess of one year, primarily for property:
Provisions are made for estimated U.S. and non-U.S. income taxes, less available tax credits and deductions, which may be incurred on theremittance of our basis differences in investments in foreign subsidiaries and corporate joint ventures not deemed to be indefinitelyreinvested. Taxes have not been provided on basis differences in investments primarily as a result of earnings in foreign subsidiaries whichare deemed indefinitely reinvested of $2.4 billion and $2.8 billion at December 31, 2016 and 2015. Additional basis differences related toinvestments in nonconsolidated China JVs exist of $4.1 billion at December 31, 2016 and 2015 as a result of fresh-start reporting.Quantification of the deferred tax liability, if any, associated with indefinitely reinvested basis differences is not practicable. The non-U.S.deferred income tax benefit in the year ended December 31, 2015 relates primarily to the release of valuation allowances in GME.
85
GENERAL MOTORS COMPANY AND SUBSIDIARIES
NOTES TO CONSOLIDATED FINANCIAL STATEMENTS — (Continued)
(a) Refer to Note 15 for additional information on the DPA.
Deferred Income Tax Assets and Liabilities Deferred income tax assets and liabilities at December 31, 2016 and 2015 reflect theeffect of temporary differences between amounts of assets, liabilities and equity for financial reporting purposes and the bases of suchassets, liabilities and equity as measured based on tax laws, as well as tax loss and tax credit carryforwards. The following tablesummarizes the components of temporary differences and carryforwards that give rise to deferred tax assets and liabilities:
(a) At December 31, 2015 deferred tax assets related to certain sales incentives were reclassified from Miscellaneous to Warranties, dealer andcustomer allowances, claims and discounts to conform to the current period presentation.
(b) At December 31, 2016 U.S. operating loss and tax credit carryforwards of $8.7 billion expire by 2036 if not utilized and the remaining balanceof $0.3 billion may be carried forward indefinitely.
(c) At December 31, 2016 Non-U.S. operating loss and tax credit carryforwards of $1.3 billion expire by 2036 if not utilized and the remainingbalance of $4.3 billion may be carried forward indefinitely.
86
GENERAL MOTORS COMPANY AND SUBSIDIARIES
NOTES TO CONSOLIDATED FINANCIAL STATEMENTS — (Continued)
Valuation Allowances At December 31, 2016 valuation allowances against deferred tax assets of $4.6 billion were comprised ofcumulative losses and tax credits, primarily in GME, South Korea and certain U.S. states.
At December 31, 2015 as a result of business restructuring and improving profitability in certain European businesses evidenced bythree years of adjusted cumulative earnings and the completion of our near- and medium-term business plans in the three monthsended December 31, 2015 that forecast continuing improvement in profitability, we determined that it was more likely than not thatour future earnings will be sufficient to realize the deferred tax assets in these European businesses. Accordingly we reversed$3.9 billion of GME’s valuation allowances resulting in an income tax benefit.
Uncertain Tax Positions The following table summarizes activity of the total amounts of unrecognized tax benefits:
At December 31, 2016 and 2015 there were $712 million and $896 million of unrecognized tax benefits that if recognized wouldfavorably affect our effective tax rate in the future. In the years ended December 31, 2016, 2015 and 2014 income tax related interestand penalties were insignificant. At December 31, 2016 and 2015 we had liabilities of $172 million and $183 million for income taxrelated interest and penalties.
At December 31, 2016 it is not possible to reasonably estimate the expected change to the total amount of unrecognized tax benefitsin the next twelve months.
Other Matters Income tax returns are filed in multiple jurisdictions and are subject to examination by taxing authoritiesthroughout the world. We have open tax years from 2006 to 2016 with various significant tax jurisdictions. Tax authorities may havethe ability to review and adjust net operating loss or tax credit carryforwards that were generated prior to these periods if utilized in anopen tax year. These open years contain matters that could be subject to differing interpretations of applicable tax laws andregulations as they relate to the amount, character, timing or inclusion of revenue and expenses or the sustainability of income taxcredits for a given audit cycle. Given the global nature of our operations there is a risk that transfer pricing disputes may arise.
We have net operating loss carryforwards in Germany through November 30, 2009 that, as a result of reorganizations that tookplace in 2008 and 2009, were not recorded as deferred tax assets. Depending on the outcome of pending European court decisionsthese loss carryforwards may be available to reduce future taxable income in Germany.
87
GENERAL MOTORS COMPANY AND SUBSIDIARIES
NOTES TO CONSOLIDATED FINANCIAL STATEMENTS — (Continued)
Note 17. Restructuring and Other Initiatives
We have executed various restructuring and other initiatives and we plan to execute additional initiatives in the future, if necessary, toalign manufacturing capacity and other costs with prevailing global automotive production and to improve the utilization of remainingfacilities. To the extent these programs involve voluntary separations, no liabilities are generally recorded until offers to employees areaccepted. If employees are involuntarily terminated, a liability is generally recorded at the communication date. Related charges arerecorded in Automotive cost of sales and Automotive selling, general and administrative expense. The following table summarizes thereserves and charges related to restructuring and other initiatives, including postemployment benefit reserves and charges:
(a) Included temporary layoff benefits of $354 million at December 31, 2014 for GMNA.
In the year ended December 31, 2016 restructuring and other initiatives related primarily to charges of $240 million at GMNArelated to the cash severance incentive program to qualified U.S. hourly employees under our 2015 labor agreement with the UAW,and separation and other programs in Australia, Korea and India and the withdrawal of the Chevrolet brand from Europe which hadcosts of $110 million, a total cost since inception in 2013 of $805 million and affected a total of approximately 4,510 employees inGMIO through December 31, 2016. We expect to complete these previously announced programs in GMIO in 2017 and incuradditional restructuring and other charges related to these programs of approximately $65 million.
In the year ended December 31, 2015 restructuring and other initiatives related primarily to the reversal of the U.S. SupplementalUnemployment Benefit Plan accrual for temporary layoff benefits of $317 million resulting from a plan amendment in the 2015 UAWAgreement at GMNA and the separation and other programs in Australia, Korea, Thailand, Indonesia and India and the withdrawal ofthe Chevrolet brand from Europe which had costs incurred of $208 million, a total cost since inception of $722 million and affected atotal of approximately 5,490 employees in GMIO through December 31, 2015.
In the year ended December 31, 2014 restructuring and other initiatives related primarily to the termination of all vehicle andtransmission production at our Bochum, Germany facility completed in December 2014 which had costs incurred of $620 million anda total cost since inception of $841 million at GME through December 31, 2014 and the separation programs in Australia and Korea,the withdrawal of the Chevrolet brand from Europe and the cessation of manufacturing in Australia which had costs incurred of $193million and a total cost since inception of $514 million at GMIO through December 31, 2014.
Exit of Russia In March 2015 we announced plans to exit Russia and ceased manufacturing, eliminated Opel brand distribution andreduced Chevrolet brand distribution in the year ended December 31, 2015. This decision impacted 300 dealers and distributors and1,130 employees. As a result we recorded pre-tax charges of $443 million at GME and GMIO through December 31, 2015, net ofnoncontrolling interests of $56 million.
88
GENERAL MOTORS COMPANY AND SUBSIDIARIES
NOTES TO CONSOLIDATED FINANCIAL STATEMENTS — (Continued)
Note 18. Interest Income and Other Non-Operating Income
Total interest income and other non-operating income, net . . . . . . . . . . . . . . . . . . . . . . . . . . . . . . . $ 429 $ 621 $ 823
Note 19. Stockholders’ Equity and Noncontrolling Interests
Preferred and Common Stock We have 2.0 billion shares of preferred stock and 5.0 billion shares of common stock authorized forissuance. At December 31, 2016 and 2015 we had 1.5 billion shares of common stock issued and outstanding.
Common Stock Holders of our common stock are entitled to dividends at the sole discretion of our Board of Directors. Ourdividends declared per common share were $1.52, $1.38 and $1.20 and our total dividends paid on common stock were $2.3 billion,$2.2 billion and $1.9 billion for the years ended December 31, 2016, 2015 and 2014. Holders of common stock are entitled to one voteper share on all matters submitted to our stockholders for a vote. The liquidation rights of holders of our common stock are secondaryto the payment or provision for payment of all our debts and liabilities and to holders of our preferred stock, if any such shares arethen outstanding.
In the years ended December 31, 2016 and 2015 we purchased 77 million and 102 million shares of our outstanding common stockfor $2.5 billion and $3.5 billion as part of the common stock repurchase program announced in March 2015, which our Board ofDirectors increased and extended in January 2016 and January 2017.
Warrants At December 31, 2015 the number of warrants outstanding was 70 million consisting of two tranches of warrants thatwe issued in July 2009. The first tranche expired on July 10, 2016. The second tranche is exercisable at any time prior to July 10, 2019at an exercise price of $18.33 per share. We had 42 million of these warrants outstanding at December 31, 2016.
Series A Preferred Stock In December 2014 we redeemed all of the remaining outstanding shares of our Series A Preferred Stockat a price equal to the aggregate liquidation amount, including accumulated dividends, of $3.9 billion, which reduced Net incomeattributable to common stockholders by $809 million.
89
GENERAL MOTORS COMPANY AND SUBSIDIARIES
NOTES TO CONSOLIDATED FINANCIAL STATEMENTS — (Continued)
The following table summarizes the significant components of Accumulated other comprehensive loss:
(a) The income tax effect was insignificant in the years ended December 31, 2016, 2015 and 2014.(b) Related to the Russia exit in the year ended December 31, 2015. Included in Automotive cost of sales. Refer to Note 17 for additional
information.(c) Included in the computation of net periodic pension and OPEB (income) expense. Refer to Note 14 for additional information.
90
GENERAL MOTORS COMPANY AND SUBSIDIARIES
NOTES TO CONSOLIDATED FINANCIAL STATEMENTS — (Continued)
Note 20. Earnings Per Share
Basic and diluted earnings per share are computed by dividing Net income attributable to common stockholders by the weighted-average common shares outstanding in the period. Diluted earnings per share is computed by giving effect to all potentially dilutivesecurities that are outstanding.
Years Ended December 31,
2016 2015 2014
Basic earnings per shareNet income attributable to stockholders . . . . . . . . . . . . . . . . . . . . . . . . . . . . . . . . . . . . . . . . . $ 9,427 $ 9,687 $ 3,949Less: cumulative dividends on preferred stock and charge related to redemption and
(a) Potentially dilutive securities attributable to outstanding warrants and stock options were excluded from the computation of diluted earnings pershare because the securities would have had an antidilutive effect.
Note 21. Stock Incentive Plans
We grant to certain employees RSUs, RSAs, PSUs and stock options (collectively, stock incentive awards) under our 2016 EquityIncentive Plan, our 2014 Long-Term Incentive Plan and, prior to our 2014 Long-Term Incentive Plan, RSUs under our 2009 Long-Term Incentive Plan. Shares awarded under the plans are subject to forfeiture if the participant leaves the company for reasons otherthan those permitted under the plans such as retirement, death or disability.
RSU awards granted either cliff vest or ratably vest generally over a three-year service period, as defined in the terms of eachaward. PSU awards vest at the end of a three-year performance period, based on performance criteria determined by the ExecutiveCompensation Committee of the Board of Directors at the time of award. The number of shares earned may equal, exceed or be lessthan the targeted number of shares depending on whether the performance criteria are met, surpassed or not met. Stock optionsgranted expire 10 years from the grant date, with two-fifths of the award becoming exercisable approximately 19 months after the dateof grant and the remainder vest ratably over the next three years based on the performance of our common stock relative to that of aspecified peer group.
In connection with our acquisition described in Note 9, RSAs and PSUs were granted. The RSAs vest ratably, generally over athree-year service period. The PSUs are contingent upon achievement of specific technology and commercialization milestones.
91
GENERAL MOTORS COMPANY AND SUBSIDIARIES
NOTES TO CONSOLIDATED FINANCIAL STATEMENTS — (Continued)
Total compensation expense related to the above awards was $650 million, $446 million and $245 million in the years endedDecember 31, 2016, 2015 and 2014.
At December 31, 2016 the total unrecognized compensation expense for nonvested equity awards granted was $323 million. Thisexpense is expected to be recorded over a weighted-average period of 2.4 years. The total fair value of stock incentive awards vestedwas $325 million, $228 million and $221 million in the years ended December 31, 2016, 2015 and 2014.
Note 22. Supplementary Quarterly Financial Information (Unaudited)
The following tables summarize supplementary quarterly financial information:
The three months ended December 31, 2015 included an income tax benefit of $3.9 billion related to the reversal of deferred taxasset valuation allowances at GME, and a gain on extinguishment of debt of $449 million related to unsecured debt in Brazil inGMSA on a pre-tax basis. The three months ended September 30, 2015 included charges for various legal matters of approximately$1.5 billion related to the Ignition Switch Recall in Corporate on a pre-tax basis. The three months ended June 30, 2015 included assetimpairment charges of $297 million related to our Thailand subsidiaries in GMIO, and a charge of $604 million for the Venezuela
92
GENERAL MOTORS COMPANY AND SUBSIDIARIES
NOTES TO CONSOLIDATED FINANCIAL STATEMENTS — (Continued)
currency devaluation in GMSA, each on a pre-tax basis. The three months ended March 31, 2015 included costs related to the Russiaexit of $337 million in GME and $91 million in GMIO and a charge of $150 million for the Ignition Switch Recall compensationprogram in Corporate, each on a pre-tax basis.
Note 23. Segment Reporting
We analyze the results of our business through the following segments: GMNA, GME, GMIO, GMSA and GM Financial. Thechief operating decision maker evaluates the operating results and performance of our automotive segments through earnings beforeinterest and income taxes-adjusted, which is presented net of noncontrolling interests. The chief operating decision maker evaluatesGM Financial through earnings before income taxes-adjusted because interest income and interest expense are part of operatingresults when assessing and measuring the operational and financial performance of the segment. Each segment has a managerresponsible for executing our strategies. Our automotive manufacturing operations are integrated within the segments, benefit frombroad-based trade agreements and are subject to regulatory requirements. While not all vehicles within a segment are individuallyprofitable on a fully allocated cost basis, those vehicles attract customers to dealer showrooms and help maintain sales volumes forother, more profitable vehicles and contribute towards meeting required fuel efficiency standards. As a result of these and otherfactors, we do not manage our business on an individual brand or vehicle basis.
Substantially all of the cars, trucks, crossovers and automobile parts produced are marketed through retail dealers in North Americaand through distributors and dealers outside of North America, the substantial majority of which are independently owned. In additionto the products sold to dealers for consumer retail sales, cars, trucks and crossovers are also sold to fleet customers, including dailyrental car companies, commercial fleet customers, leasing companies and governments. Fleet sales are completed through the dealernetwork and in some cases directly with fleet customers. Retail and fleet customers can obtain a wide range of after-sale vehicleservices and products through the dealer network, such as maintenance, light repairs, collision repairs, vehicle accessories andextended service warranties.
GMNA primarily meets the demands of customers in North America with vehicles developed, manufactured and/or marketed underthe Buick, Cadillac, Chevrolet and GMC brands. The demands of customers outside North America are primarily met with vehiclesdeveloped, manufactured and/or marketed under the Buick, Cadillac, Chevrolet, GMC, Holden, Opel and Vauxhall brands. We alsohave equity ownership stakes directly or indirectly in entities through various regional subsidiaries, primarily in Asia. These entitiesdesign, manufacture and/or market vehicles under the Baojun, Buick, Cadillac, Chevrolet, Jiefang and Wuling brands.
93
GENERAL MOTORS COMPANY AND SUBSIDIARIES
NOTES TO CONSOLIDATED FINANCIAL STATEMENTS — (Continued)
Our automotive operations’ interest income and interest expense, Maven, corporate expenditures including autonomous vehicle-related engineering and other costs and certain nonsegment specific revenues and expenses are recorded centrally in Corporate.Corporate assets consist primarily of cash and cash equivalents, marketable securities, our investment in Lyft, goodwill, intangibles,Maven vehicles and intercompany balances. All intersegment balances and transactions have been eliminated in consolidation. Thefollowing tables summarize key financial information by segment:
At and For the Year Ended December 31, 2016
GMNA GME GMIO GMSA Corporate EliminationsTotal
AutomotiveGM
Financial Eliminations Total
Net sales and revenue . . . . . . . . . . $ 119,022 $ 18,707 $ 11,749 $ 7,223 $ 148 $ 156,849 $ 9,558 $ (27) $ 166,380Earnings (loss) before interest and
(a) Consists primarily of costs related to the Russia exit of $353 million in GME and $85 million in GMIO, which is net of noncontrolling interests; asset impairment charges of$297 million related to our Thailand subsidiaries in GMIO; Venezuela currency devaluation and asset impairment charges of $720 million in GMSA; charges related to theignition switch recall including the compensation program of $195 million and various settlements and legal related matters of approximately $1.6 billion in Corporate; andother of $41 million.
94
GENERAL MOTORS COMPANY AND SUBSIDIARIES
NOTES TO CONSOLIDATED FINANCIAL STATEMENTS — (Continued)
At and For the Year Ended December 31, 2014
GMNA GME GMIO GMSA Corporate EliminationsTotal
AutomotiveGM
Financial Eliminations Total
Net sales and revenue . . . . . . . . . . $ 101,199 $ 22,235 $ 14,392 $ 13,115 $ 151 $ 151,092 $ 4,854 $ (17) $ 155,929Earnings (loss) before interest and
(a) Consists of a catch-up adjustment related to the change in estimate for recall campaigns of $874 million in GMNA; asset impairment charges of $245 million related to ourRussian subsidiaries in GME; asset impairment charges of $158 million related to our Thailand subsidiary in GMIO; Venezuela currency devaluation charges of $419 millionand Goodwill impairment charges of $120 million in GMSA; a charge related to the ignition switch recall compensation program of $400 million in Corporate; and other of$111 million.
Automotive revenue is attributed to geographic areas based on the country in which our subsidiary is located. GM Financialrevenue is attributed to the geographic area where the financing is originated. The following table summarizes information concerningprincipal geographic areas:
No individual country other than the U.S. represented more than 10% of our total Net sales and revenue or Long-lived assets.
95
GENERAL MOTORS COMPANY AND SUBSIDIARIES
NOTES TO CONSOLIDATED FINANCIAL STATEMENTS — (Continued)
Note 24. Supplemental Information for the Consolidated Statements of Cash Flows
The following table summarizes the sources (uses) of cash provided by Change in other operating assets and liabilities and Cashpaid for income taxes and interest:
Item 9. Changes in and Disagreements with Accountants on Accounting and Financial Disclosure
None* * * * * * *
Item 9A. Controls and Procedures
Disclosure Controls and Procedures We maintain disclosure controls and procedures designed to provide reasonable assurance thatinformation required to be disclosed in reports filed under the Exchange Act is recorded, processed, summarized and reported withinthe specified time periods and accumulated and communicated to our management, including our principal executive officer andprincipal financial officer, as appropriate, to allow timely decisions regarding required disclosure.
Our management, with the participation of our CEO and CFO, evaluated the effectiveness of our disclosure controls and procedures(as defined in Rules 13a-15(e) or 15d-15(e) promulgated under the Exchange Act) at December 31, 2016. Based on this evaluationrequired by paragraph (b) of Rules 13a-15 or 15d-15, our CEO and CFO concluded that our disclosure controls and procedures wereeffective as of December 31, 2016.
Management’s Report on Internal Control over Financial Reporting Our management is responsible for establishing andmaintaining effective internal control over financial reporting as defined in Rules 13a-15(f) and 15d-15(f) under the Exchange Act.This system is designed to provide reasonable assurance regarding the reliability of financial reporting and the preparation ofconsolidated financial statements for external purposes in accordance with U.S. GAAP. Because of the inherent limitations of internalcontrol over financial reporting, including the possibility of collusion or improper management override of controls, misstatementsdue to error or fraud may not be prevented or detected on a timely basis.
Our management performed an assessment of the effectiveness of our internal control over financial reporting at December 31,2016, utilizing the criteria discussed in the “Internal Control — Integrated Framework (2013)” issued by the Committee ofSponsoring Organizations of the Treadway Commission. The objective of this assessment was to determine whether our internalcontrol over financial reporting was effective at December 31, 2016. Based on management’s assessment, we have concluded that ourinternal control over financial reporting was effective at December 31, 2016.
The effectiveness of our internal control over financial reporting has been audited by Deloitte & Touche LLP, an independentregistered public accounting firm, as stated in its report which is included herein.
Changes in Internal Control over Financial Reporting There have not been any changes in our internal control over financialreporting during the three months ended December 31, 2016 that have materially affected, or are reasonably likely to materially affect,our internal control over financial reporting.
/s/ MARY T. BARRA /s/ CHARLES K. STEVENS III
Mary T. BarraChairman & Chief Executive Officer
Charles K. Stevens IIIExecutive Vice President and Chief Financial Officer
February 7, 2017 February 7, 2017
* * * * * * *
Item 9B. Other Information
None* * * * * * *
97
GENERAL MOTORS COMPANY AND SUBSIDIARIES
PART III
Item 10. Directors, Executive Officers and Corporate Governance
We have adopted a code of ethics that applies to the Company’s directors, officers, and employees, including the CEO, CFO,Controller and Chief Accounting Officer and any other persons performing similar functions. The text of our code of ethics, “WinningWith Integrity,” has been posted on our website at www.gm.com/company/investors at Corporate Governance. We will provide acopy of the code of ethics without charge upon request to Corporate Secretary, General Motors Company, Mail Code 482-C25-A36,300 Renaissance Center, P.O. Box 300, Detroit, MI 48265-3000. We will disclose on our website any amendment to or waiver fromour code of ethics on behalf of any of our executive officers or directors.
* * * * * * *
Items 10, 11, 12, 13 and 14
Information required by (Items 10, 11, 12, 13 and 14) of this Form 10-K is incorporated by reference from our definitive ProxyStatement for our 2017 Annual Meeting of Stockholders, which will be filed with the SEC, pursuant to Regulation 14A, not later than120 days after the end of the 2016 fiscal year, all of which information is hereby incorporated by reference in, and made part of, thisForm 10-K, except the information required by Item 10 with respect to our code of ethics in Item 10 above and disclosure of ourexecutive officers, which is included in Item 1 of this report.
* * * * * * *
98
GENERAL MOTORS COMPANY AND SUBSIDIARIES
PART IV
ITEM 15. Exhibits
(a) 1. All Financial Statements and Supplemental Information
2. Financial Statement Schedules
All financial statement schedules are omitted as the required information is inapplicable or the information is presented inthe consolidated financial statements and notes thereto in Item 8.
3. Exhibits
(b) Exhibits
Exhibit Number Exhibit Name
3.1 Restated Certificate of Incorporation of General Motors Company dated December 7,2010, incorporated herein by reference to Exhibit 3.2 to the Current Report on Form 8-Kof General Motors Company filed December 13, 2010
Incorporated by Reference
3.2 Amended and Restated Bylaws of General Motors Company, dated as of March 4, 2016,incorporated herein by reference to Exhibit 3.1 to the Current Report on Form 8-K ofGeneral Motors Company filed March 8, 2016
Incorporated by Reference
4.1 Indenture dated as of September 27, 2013, between General Motors Company and theBank of New York Mellon, as Trustee, incorporated herein by reference to Exhibit 4.2 tothe Registration Statement on Form S-3 of General Motors Company filed April 30,2014
Incorporated by Reference
4.2 First Supplemental Indenture dated as of September 27, 2013 to the Indenture dated asof September 27, 2013 between General Motors Company and the Bank of New YorkMellon, as Trustee, incorporated herein by reference to Exhibit 4.3 to the RegistrationStatement on Form S-4 of General Motors Company filed May 22, 2014
Incorporated by Reference
4.3 Second Supplemental Indenture dated as of November 12, 2014 to the Indenture dated asof September 27, 2013 between General Motors Company and the Bank of New YorkMellon, as Trustee, incorporated herein by reference to Exhibit 4.4 to the Current Reporton Form 8-K of General Motors Company filed November 12, 2014
Incorporated by Reference
4.4 Third Supplemental Indenture, dated as of February 23, 2016, to the Indenture, dated asof September 27, 2013, between General Motors Company, as issuer, and The Bank ofNew York Mellon, as Trustee, incorporated herein by reference to Exhibit 4.1 to theCurrent Report on Form 8-K of General Motors Company filed February 23, 2016
Incorporated by Reference
10.1 Stockholders Agreement, dated as of October 15, 2009 between General MotorsCompany, the United States Department of the Treasury, Canada GEN InvestmentCorporation (fka 7176384 Canada Inc.), the UAW Retiree Medical Benefits Trust, and,for limited purposes, General Motors LLC, incorporated herein by reference toExhibit 10.8 to the Current Report on Form 8-K of General Motors Company filedNovember 16, 2009
Incorporated by Reference
10.2* Equity Registration Rights Agreement, dated as of October 15, 2009, between GeneralMotors Company, the United States Department of Treasury, Canada GEN InvestmentCorporation (fka 7176384 Canada Inc.), the UAW Retiree Medical Benefits Trust, MotorsLiquidation Company, and, for limited purposes, General Motors LLC, incorporated hereinby reference to Exhibit 10.1 to the Current Report on Form 8-K of Motors LiquidationCompany filed October 21, 2009
Incorporated by Reference
99
GENERAL MOTORS COMPANY AND SUBSIDIARIES
Exhibit Number Exhibit Name
10.3* Letter Agreement regarding Equity Registration Rights Agreement, dated October 21,2010, among General Motors Company, the United States Department of Treasury,Canada GEN Investment Corporation, the UAW Retiree Medical Benefits Trust andMotors Liquidation Company, incorporated herein by reference to Exhibit 10.43 toAmendment No. 5 to the Registration Statement on Form S-1 (File No. 333-168919) ofGeneral Motors Company filed November 3, 2010
Incorporated by Reference
10.4* Form of Compensation Statement, incorporated herein by reference to Exhibit 10.14 tothe Annual Report on Form 10-K of General Motors Company filed April 7, 2010
Incorporated by Reference
10.5* General Motors Company 2009 Long-Term Incentive Plan, as amended January 13,2014, incorporated herein by reference to Exhibit 10.7 to the Annual Report onForm 10-K of General Motors Company filed February 6, 2014
Incorporated by Reference
10.6* The General Motors Company Deferred Compensation Plan for Non-EmployeeDirectors, incorporated herein by reference to Exhibit 10.1 to the Quarterly Report onForm 10-Q of General Motors Company filed May 6, 2011
Incorporated by Reference
10.7* General Motors Company Executive Retirement Plan, with modifications throughOctober 10, 2012, incorporated herein by reference to Exhibit 10.12 to the AnnualReport on Form 10-K of General Motors Company filed February 15, 2013
Incorporated by Reference
10.8* Amendment No. 1 to General Motors Company Executive Retirement Plan, withmodifications through October 10, 2012, incorporated herein by reference to Exhibit10.2 to the Current Report on Form 8-K of General Motors Company filed February 3,2016
Incorporated by Reference
10.9* General Motors Company Salary Stock Plan, as amended January 13, 2014, incorporatedherein by reference to Exhibit 10.10 to the Annual Report on Form 10-K of GeneralMotors Company filed February 6, 2014
Incorporated by Reference
10.10* General Motors Company 2014 Short-Term Incentive Plan, incorporated herein byreference to Exhibit 10.2 to the Current Report on Form 8-K of General MotorsCompany filed June 12, 2014
Incorporated by Reference
10.11* Amendment No. 1 to General Motors Company Short-Term Incentive Plan, incorporatedherein by reference to Exhibit 10.3 to the Current Report on Form 8-K of GeneralMotors Company filed February 3, 2016
Incorporated by Reference
10.12* General Motors Company 2014 Long-Term Incentive Plan, incorporated herein byreference to Exhibit 10.1 to the Current Report on Form 8-K of General MotorsCompany filed June 12, 2014
Incorporated by Reference
10.13* General Motors Company 2016 Equity Incentive Plan, incorporated herein by referenceto Exhibit 99.1 to the Registration Statement on Form S-8 of General Motors Companyfiled May 13, 2016
Incorporated by Reference
10.14* Form of General Motors Company Restricted Stock Unit Agreement (cash settlement)dated December 15, 2011 under the 2009 Long-Term Incentive Plan, incorporated hereinby reference to Exhibit 10.26 to the Annual Report on Form 10-K of General MotorsCompany filed February 27, 2012
Incorporated by Reference
10.15* Form of General Motors Company Restated Stock Agreement (share settlement) datedDecember 15, 2011 under the 2009 Long-Term Incentive Plan, incorporated herein byreference to Exhibit 10.27 to the Annual Report on Form 10-K of General MotorsCompany filed February 27, 2012
Incorporated by Reference
100
GENERAL MOTORS COMPANY AND SUBSIDIARIES
Exhibit Number Exhibit Name
10.16* General Motors Company Vehicle Operations — Senior Management Vehicle Program(SMVP) Supplement, revised December 15, 2005, incorporated herein by reference toExhibit 10(g) to the Annual Report on Form 10-K of Motors Liquidation Company filedMarch 28, 2006
Incorporated by Reference
10.17* General Motors LLC U.S. Executive Severance Program, incorporated herein by reference toExhibit 10.1 to the Current Report on Form 8-K of General Motors Company filedFebruary 3, 2016
Incorporated by Reference
10.18 Amended and Restated Warrant Agreement, dated as of October 16, 2009, betweenGeneral Motors Company and U.S. Bank National Association, including Form ofWarrant Certificate attached as Exhibit D thereto, relating to warrants with a $30 original($10 after stock split) exercise price and a July 10, 2016 expiration date, incorporatedherein by reference to Exhibit 10.29 to the Annual Report on Form 10-K of GeneralMotors Company filed April 7, 2010
Incorporated by Reference
10.19 Amended and Restated Warrant Agreement, dated as of October 16, 2009, betweenGeneral Motors Company and U.S. Bank National Association, as Warrant Agent,including a Form of Warrant Certificate attached as Exhibit D thereto, relating towarrants with a $55 original ($18.33 after stock split) exercise price and a July 10, 2019expiration date, incorporated herein by reference to Exhibit 10.30 to the Annual Reporton Form 10-K of General Motors Company filed April 7, 2010
Incorporated by Reference
10.20† Amended and Restated Master Agreement, dated as of December 19, 2012, betweenGeneral Motors Holdings LLC and Peugeot S.A., incorporated herein by reference toExhibit 10.24 to the Annual Report on Form 10-K of General Motors Company filedFebruary 6, 2014
Incorporated by Reference
10.21† Second Amended and Restated 3-Year Revolving Credit Agreement, dated as of May 26,2016, among General Motors Company, General Motors Financial Company, Inc., GMEurope Treasury Company AB, General Motors do Brasil Ltda., the subsidiary borrowersfrom time to time parties thereto, the several lenders from time to time parties thereto,JPMorgan Chase Bank, N.A., as administrative agent, and Citibank, N.A., as syndicationagent, incorporated herein by reference to Exhibit 10.1 to the Current Report on Form 8-K of General Motors Company filed June 2, 2016
Incorporated by Reference
10.22† Second Amended and Restated 5-Year Revolving Credit Agreement, dated as of May 26,2016, among General Motors Company, General Motors Financial Company, Inc.,General Motors do Brasil Ltda., the subsidiary borrowers from time to time partiesthereto, the several lenders from time to time parties thereto, JPMorgan Chase Bank,N.A., as administrative agent, and Citibank, N.A., as syndication agent, incorporatedherein by reference to Exhibit 10.2 to the Current Report on Form 8-K of General MotorsCompany filed June 2, 2016
Incorporated by Reference
10.23* Director’s Service Agreement between Adam Opel AG and Dr. Karl-Thomas Neumann,incorporated herein by reference to Exhibit 10.28 to the Annual Report on Form 10-K ofGeneral Motors Company filed February 6, 2014
Incorporated by Reference
10.24 Amendment to Warrant Agreements between General Motors Company and U.S. BankNational Association, incorporated herein by reference to Exhibit 10.1 to the QuarterlyReport on Form 10-Q of General Motors Company filed April 24, 2014
Incorporated by Reference
10.25* Form of General Motors Company Restricted Stock Unit Award Agreement under the2014 Long-Term Incentive Plan, incorporated herein by reference to Exhibit 10.1 to theQuarterly Report on Form 10-Q of General Motors Company filed July 24, 2014
Incorporated by Reference
10.26* Form of General Motors Company Performance Stock Unit Award Agreement under the2014 Long-Term Incentive Plan, incorporated herein by reference to Exhibit 10.2 to theQuarterly Report on Form 10-Q of General Motors Company filed July 24, 2014
Incorporated by Reference
101
GENERAL MOTORS COMPANY AND SUBSIDIARIES
Exhibit Number Exhibit Name
10.27* Form of Non-Qualified Stock Option Agreement under the 2014 Long-Term IncentivePlan, incorporated herein by reference to Exhibit 10.1 to the Current Report on Form 8-K of General Motors Company filed July 30, 2015
Incorporated by Reference
10.28* Form of General Motors Company Restricted Stock Unit Award Agreement under the2014 Long-Term Incentive Plan, incorporated herein by reference to Exhibit 10.4 to theQuarterly Report on Form 10-Q of General Motors Company filed April 21, 2016
Incorporated by Reference
10.29* Form of General Motors Company Performance Stock Unit Award Agreement under the2014 Long-Term Incentive Plan, incorporated herein by reference to Exhibit 10.5 to theQuarterly Report on Form 10-Q of General Motors Company filed April 21, 2016
Incorporated by Reference
10.30* Form of Director and Officer Indemnification Agreement, incorporated herein byreference to Exhibit 10.6 to the Quarterly Report on Form 10-Q of General MotorsCompany filed April 21, 2016
Incorporated by Reference
12 Computations of Ratio of Earnings to Fixed Charges and Ratio of Earnings to CombinedFixed Charges and Preferred Stock Dividends for the Years Ended December 31, 2016,2015, 2014, 2013 and 2012
Filed Herewith
21 Subsidiaries and Joint Ventures of the Registrant as of December 31, 2016 Filed Herewith
23.1 Consent of Independent Registered Public Accounting Firm for audited financialstatements of General Motors Company
Filed Herewith
23.2 Consent of Independent Auditors for audited financial statements of SAIC GeneralMotors Corp., Ltd.
Filed Herewith
24 Power of Attorney for Directors of General Motors Company Filed Herewith
31.1 Section 302 Certification of the Chief Executive Officer Filed Herewith
31.2 Section 302 Certification of the Chief Financial Officer Filed Herewith
32 Certification Pursuant to 18 U.S.C. Section 1350, As Adopted Pursuant to Section 906of the Sarbanes-Oxley Act of 2002
Furnished with this Report
99.1 SAIC General Motors Corp., Ltd. (F.K.A. Shanghai General Motors Corp., Ltd.) andsubsidiaries audited consolidated financial statements including the consolidated balancesheet as of December 31, 2016 and 2015, and the related consolidated statements ofincome and comprehensive income, equity and cash flow for the years then ended
† Certain confidential portions have been omitted pursuant to a granted request for confidential treatment, which has been separately filed with theSEC.
* Management contracts and compensatory plans and arrangements required to be filed as exhibits pursuant to Item 15(b) of this Report.
* * * * * * *
102
GENERAL MOTORS COMPANY AND SUBSIDIARIES
SIGNATURES
Pursuant to the requirements of Section 13 of the Securities Exchange Act of 1934, the registrant has duly caused this report to besigned on its behalf by the undersigned, hereunto duly authorized.
GENERAL MOTORS COMPANY (Registrant)
By: /s/ MARY T. BARRA
Mary T. BarraChairman & Chief Executive Officer
Date: February 7, 2017
103
GENERAL MOTORS COMPANY AND SUBSIDIARIES
Pursuant to the requirements of the Securities Exchange Act of 1934, this report has been signed below on this 7th day of February2017 by the following persons on behalf of the registrant and in the capacities indicated, including a majority of the directors.
Signature Title
/s/ MARY T. BARRA
Mary T. Barra
Chairman & Chief Executive Officer
/s/ CHARLES K. STEVENS III
Charles K. Stevens III
Executive Vice President and Chief Financial Officer
/s/ THOMAS S. TIMKO
Thomas S. Timko
Vice President, Controller and Chief Accounting Officer
/s/ THEODORE M. SOLSO*
Theodore M. Solso
Lead Director
/s/ JOSEPH J. ASHTON*
Joseph J. Ashton
Director
/s/ LINDA R. GOODEN*
Linda R. Gooden
Director
/s/ JOSEPH JIMENEZ*
Joseph Jimenez
Director
/s/ JANE L. MENDILLO*
Jane L. Mendillo
Director
/s/ ADMIRAL MICHAEL G. MULLEN, USN (ret.)*
Admiral Michael G. Mullen, USN (ret.)
Director
/s/ JAMES J. MULVA*
James J. Mulva
Director
/s/ PATRICIA F. RUSSO*
Patricia F. Russo
Director
/s/ THOMAS M. SCHOEWE*
Thomas M. Schoewe
Director
/s/ CAROL M. STEPHENSON*
Carol M. Stephenson
Director
*By: /s/ JILL E. SUTTON
Jill E. SuttonAttorney-in-Fact
104
Exhibit 12
GENERAL MOTORS COMPANY AND SUBSIDIARIES
COMPUTATIONS OF RATIO OF EARNINGS TO FIXED CHARGES AND RATIO OF EARNINGS TO COMBINEDFIXED CHARGES AND PREFERRED STOCK DIVIDENDS
Earnings in the year ended December 31, 2012 were inadequate to cover fixed charges by $28.8 billion and combined fixed chargesand preferred stock dividends by $29.7 billion.
Exhibit 31.1GENERAL MOTORS COMPANY AND SUBSIDIARIES
CERTIFICATION
I, Mary T. Barra, certify that:
1. I have reviewed this Annual Report on Form 10-K of General Motors Company;
2. Based on my knowledge, this report does not contain any untrue statement of a material fact or omit to state a material factnecessary to make the statements made, in light of the circumstances under which such statements were made, not misleading withrespect to the period covered by this report;
3. Based on my knowledge, the financial statements, and other financial information included in this report, fairly present in allmaterial respects the financial condition, results of operations and cash flows of the registrant as of, and for, the periods presented inthis report;
4. The registrant’s other certifying officer and I are responsible for establishing and maintaining disclosure controls and procedures(as defined in Exchange Act Rules 13a-15(e) and 15d-15(e)) and internal control over financial reporting (as defined in Exchange ActRules 13a-15(f) and 15d-15(f)) for the registrant and have:
a) Designed such disclosure controls and procedures, or caused such disclosure controls and procedures to be designed underour supervision, to ensure that material information relating to the registrant, including its consolidated subsidiaries, is madeknown to us by others within those entities, particularly during the period in which this report is being prepared;
b) Designed such internal control over financial reporting, or caused such internal control over financial reporting to bedesigned under our supervision, to provide reasonable assurance regarding the reliability of financial reporting and thepreparation of financial statements for external purposes in accordance with generally accepted accounting principles;
c) Evaluated the effectiveness of the registrant’s disclosure controls and procedures and presented in this report ourconclusions about the effectiveness of the disclosure controls and procedures, as of the end of the period covered by this reportbased on such evaluation; and
d) Disclosed in this report any change in the registrant’s internal control over financial reporting that occurred during theregistrant’s most recent fiscal quarter (the registrant’s fourth fiscal quarter in the case of an annual report) that has materiallyaffected, or is reasonably likely to materially affect, the registrant’s internal control over financial reporting; and
5. The registrant’s other certifying officer and I have disclosed, based on our most recent evaluation of internal control overfinancial reporting, to the registrant’s auditors and the Audit Committee of the registrant’s Board of Directors (or persons performingthe equivalent functions):
a) All significant deficiencies and material weaknesses in the design or operation of internal control over financial reportingwhich are reasonably likely to adversely affect the registrant’s ability to record, process, summarize and report financialinformation; and
b) Any fraud, whether or not material, that involves management or other employees who have a significant role in theregistrant’s internal control over financial reporting.
/s/ MARY T. BARRA
Mary T. BarraChairman & Chief Executive Officer
Date: February 7, 2017
Exhibit 31.2GENERAL MOTORS COMPANY AND SUBSIDIARIES
CERTIFICATION
I, Charles K. Stevens III, certify that:
1. I have reviewed this Annual Report on Form 10-K of General Motors Company;
2. Based on my knowledge, this report does not contain any untrue statement of a material fact or omit to state a material factnecessary to make the statements made, in light of the circumstances under which such statements were made, not misleading withrespect to the period covered by this report;
3. Based on my knowledge, the financial statements, and other financial information included in this report, fairly present in allmaterial respects the financial condition, results of operations and cash flows of the registrant as of, and for, the periods presented inthis report;
4. The registrant’s other certifying officer and I are responsible for establishing and maintaining disclosure controls and procedures(as defined in Exchange Act Rules 13a-15(e) and 15d-15(e)) and internal control over financial reporting (as defined in Exchange ActRules 13a-15(f) and 15d-15(f)) for the registrant and have:
a) Designed such disclosure controls and procedures, or caused such disclosure controls and procedures to be designed underour supervision, to ensure that material information relating to the registrant, including its consolidated subsidiaries, is madeknown to us by others within those entities, particularly during the period in which this report is being prepared;
b) Designed such internal control over financial reporting, or caused such internal control over financial reporting to bedesigned under our supervision, to provide reasonable assurance regarding the reliability of financial reporting and thepreparation of financial statements for external purposes in accordance with generally accepted accounting principles;
c) Evaluated the effectiveness of the registrant’s disclosure controls and procedures and presented in this report ourconclusions about the effectiveness of the disclosure controls and procedures, as of the end of the period covered by this reportbased on such evaluation; and
d) Disclosed in this report any change in the registrant’s internal control over financial reporting that occurred during theregistrant’s most recent fiscal quarter (the registrant’s fourth fiscal quarter in the case of an annual report) that has materiallyaffected, or is reasonably likely to materially affect, the registrant’s internal control over financial reporting; and
5. The registrant’s other certifying officer and I have disclosed, based on our most recent evaluation of internal control overfinancial reporting, to the registrant’s auditors and the Audit Committee of the registrant’s Board of Directors (or persons performingthe equivalent functions):
a) All significant deficiencies and material weaknesses in the design or operation of internal control over financial reportingwhich are reasonably likely to adversely affect the registrant’s ability to record, process, summarize and report financialinformation; and
b) Any fraud, whether or not material, that involves management or other employees who have a significant role in theregistrant’s internal control over financial reporting.
/s/ CHARLES K. STEVENS III
Charles K. Stevens IIIExecutive Vice President and Chief Financial Officer
Date: February 7, 2017
Exhibit 32
GENERAL MOTORS COMPANY AND SUBSIDIARIES
CERTIFICATION PURSUANT TO18 U.S.C. SECTION 1350,
AS ADOPTED PURSUANT TOSECTION 906 OF THE SARBANES-OXLEY ACT OF 2002
In connection with the Annual Report of General Motors Company (the “Company”) on Form 10-K for the period endedDecember 31, 2016 as filed with the Securities and Exchange Commission on the date hereof (the “Report”), each of the undersignedofficers of the Company, certify, pursuant to 18 U.S.C. § 1350, as adopted pursuant to § 906 of the Sarbanes-Oxley Act of 2002, thatto the best of such officer’s knowledge:
1. The Report fully complies with the requirements of section 13(a) or 15(d) of the Securities Exchange Act of 1934; and
2. The information contained in the Report fairly presents, in all material respects, the financial condition and results ofoperations of the Company.
/S/ MARY T. BARRA
Mary T. BarraChairman & Chief Executive Officer
/s/ CHARLES K. STEVENS III
Charles K. Stevens IIIExecutive Vice President and Chief Financial Officer