UNITED STATES SECURITIES AND EXCHANGE COMMISSION Washington, D.C. 20549 FORM 10-K/A [X] ANNUAL REPORT PURSUANT TO SECTION 13 OR 15(d) OF THE SECURITIES EXCHANGE ACT OF 1934 For the fiscal year ended December 31, 1999 OR [ ] TRANSITION REPORT PURSUANT TO SECTION 13 OR 15(d) OF THE SECURITIES EXCHANGE ACT OF 1934 For the transition period from to Commission File No. 1-12328 CHELSEA GCA REALTY, INC. (Exact name of registrant as specified in its charter) Maryland 22-3251332 (State or other jurisdiction (I.R.S. Employer of incorporation or organization) Identification No.) 103 Eisenhower Parkway, Roseland, New Jersey 07068 (Address of principal executive offices - zip code) (973) 228-6111 (Registrant’s telephone number, including area code) Securities registered pursuant to Section 12(b) of the Act: Name of each exchange on Title of each class which registered Common stock, $0.01 par value New York Stock Exchange Securities registered pursuant to Section 12 (g) of the Act: None Indicate by check mark whether the registrant (1) has filed all reports required to be filed by Section 13 or 15(d) of the Securities Exchange Act of 1934 during the preceding 12 months (or for such shorter period that the registrant was required to file such reports), and (2) has been subject to such filing requirements for the past 90 days. Yes X No Indicate by check mark if the disclosure of delinquent filers pursuant to Item 405 of Regulation S-K is not contained herein, and will not be contained, to the best of the registrant’s knowledge, in definitive proxy or information statements incorporated by reference in Part III of this Form 10-K or any amendment to this Form 10-K. [x] Based on the closing sales price on February 24, 2000 of $25.938 per share the aggregate market value of the voting stock held by non-affiliates of the registrant was $411,371,389. The number of shares outstanding of the registrant’s common stock, $0.01 par value was 15,934,133 at February 24, 2000. Documents incorporated by reference: Portions of the registrant’s definitive Proxy Statement relating to its 2000 Annual Meeting of Shareholders are incorporated by reference into Part III as set forth herein.
Transcript
UNITED STATESSECURITIES AND EXCHANGE COMMISSION
Washington, D.C. 20549
FORM 10-K/A
[X] ANNUAL REPORT PURSUANT TO SECTION 13 OR 15(d) OFTHE SECURITIES EXCHANGE ACT OF 1934
For the fiscal year ended December 31, 1999
OR[ ] TRANSITION REPORT PURSUANT TO SECTION 13 OR 15(d) OF
THE SECURITIES EXCHANGE ACT OF 1934For the transition period from to
Commission File No. 1-12328
CHELSEA GCA REALTY, INC.(Exact name of registrant as specified in its charter)
Maryland 22-3251332(State or other jurisdiction (I.R.S. Employer
of incorporation or organization) Identification No.)
103 Eisenhower Parkway, Roseland, New Jersey 07068(Address of principal executive offices - zip code)
(973) 228-6111(Registrant’s telephone number, including area code)
Securities registered pursuant to Section 12(b) of the Act:
Name of each exchange on Title of each class which registered
Common stock, $0.01 par value New York Stock Exchange
Securities registered pursuant to Section 12 (g) of the Act: None
Indicate by check mark whether the registrant (1) has filed all reports required to be filed by Section 13 or 15(d) of theSecurities Exchange Act of 1934 during the preceding 12 months (or for such shorter period that the registrant was requiredto file such reports), and (2) has been subject to such filing requirements for the past 90 days.Yes X No
Indicate by check mark if the disclosure of delinquent filers pursuant to Item 405 of Regulation S-K is not contained herein,and will not be contained, to the best of the registrant’s knowledge, in definitive proxy or information statementsincorporated by reference in Part III of this Form 10-K or any amendment to this Form 10-K. [x]
Based on the closing sales price on February 24, 2000 of $25.938 per share the aggregate market value of the voting stockheld by non-affiliates of the registrant was $411,371,389.
The number of shares outstanding of the registrant’s common stock, $0.01 par value was 15,934,133 at February 24, 2000.
Documents incorporated by reference:
Portions of the registrant’s definitive Proxy Statement relating to its 2000 Annual Meeting of Shareholders are incorporatedby reference into Part III as set forth herein.
2
PART I
Item 1. Business
The Company
Chelsea GCA Realty, Inc. (the "Company") is a self-administered and self-managed real estate investment trust("REIT") formed through the merger of The Chelsea Group ("Chelsea") and Ginsburg Craig Associates ("GCA").The Company made its initial public offering of common stock on November 2, 1993 (the "IPO") andsimultaneously became the managing general partner of Chelsea GCA Realty Partnership, L.P. (the "OperatingPartnership" or “OP”), a partnership that owns, develops, redevelops, leases, markets and manages upscale andfashion-oriented manufacturers’ outlet centers. At the end of 1999, the Company owned and operated 19 centers(the "Properties") with approximately 5.2 million square feet of gross leasable area ("GLA") in 11 states. AtDecember 31, 1999, the Company had approximately 424,000 square feet of wholly-owned new GLA underconstruction, comprising the 232,000 square foot first phase of Allen Premium Outlets (Allen, Texas – located on USHighway 75 approximately 30 miles north of Dallas), the 104,000 square-foot third phase of Leesburg Corner andexpansions totaling 88,000 square feet at two centers; these openings and expansions are part of a total ofapproximately 550,000 square feet of wholly-owned new space scheduled for completion in 2000. Additionally,construction is underway on Orlando Premium Outlets (“OPO”), a 430,000 square-foot upscale outlet center locatedon Interstate 4 midway between Walt Disney World/EPCOT and Sea World in Orlando, Florida and phase one ofGotemba Premium Outlets (“GPO”) a 220,000 square foot center located in Gotemba, outside of Tokyo, Japan.OPO is a joint venture project between the Company and Simon Property Group, Inc. (“Simon”) and is scheduled toopen as a single phase in mid-2000. GPO is a joint venture project 40% owned by the Company and 30% each byMitsubishi Estate Co., Ltd. and Nissho Iwai Corporation, and is scheduled to open mid-2000. The Company’sexisting portfolio includes properties in or near New York City, Los Angeles, San Francisco, Sacramento, Boston,Portland (Oregon), Atlanta, Washington DC, Cleveland, Honolulu, Napa Valley, Palm Springs and the MontereyPeninsula.
The Company's executive offices are located at 103 Eisenhower Parkway, Roseland, New Jersey 07068 (telephone973-228-6111). The Company was incorporated in Maryland on August 24, 1993.
The Company is taxed as a REIT under the provisions of the Internal Revenue Code. The Company generally will notbe taxed at the corporate level on income it currently distributes to its shareholders, provided it distributes at least 95%of its taxable income each year.
Recent Developments
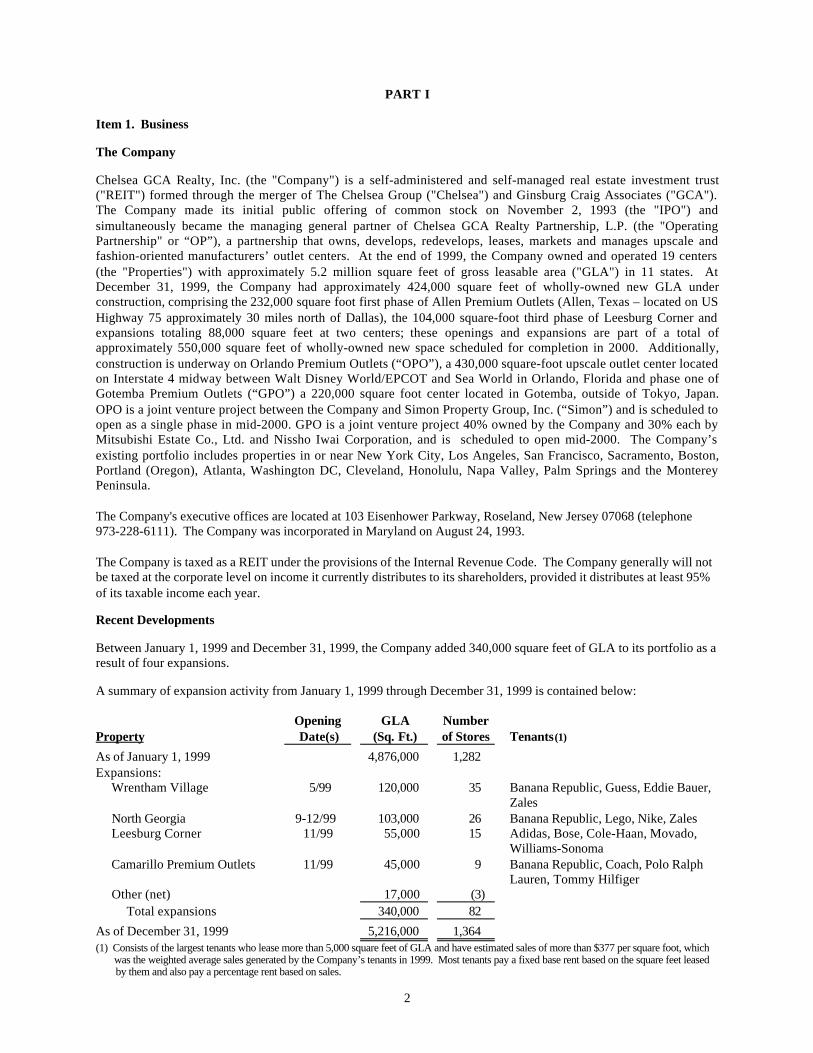
Between January 1, 1999 and December 31, 1999, the Company added 340,000 square feet of GLA to its portfolio as aresult of four expansions.
A summary of expansion activity from January 1, 1999 through December 31, 1999 is contained below:
Opening GLA NumberProperty Date(s) (Sq. Ft.) of Stores Tenants(1)
As of January 1, 1999 4,876,000 1,282Expansions: Wrentham Village 5/99 120,000 35 Banana Republic, Guess, Eddie Bauer,
Williams-Sonoma Camarillo Premium Outlets 11/99 45,000 9 Banana Republic, Coach, Polo Ralph
Lauren, Tommy Hilfiger Other (net) 17,000 (3) Total expansions 340,000 82
As of December 31, 1999 5,216,000 1,364(1) Consists of the largest tenants who lease more than 5,000 square feet of GLA and have estimated sales of more than $377 per square foot, which was the weighted average sales generated by the Company’s tenants in 1999. Most tenants pay a fixed base rent based on the square feet leased by them and also pay a percentage rent based on sales.
3
The most recent newly developed or expanded centers are discussed below:
Wrentham Village Premium Outlets, Wrentham, Massachusetts. Wrentham Village Premium Outlets, a 473,000 squarefoot center containing 125 stores, opened in three phases in October 1997, May 1998 and May 1999. The center islocated near the junction of Interstates 95 and 495 between Boston and Providence. The populations within a 30-mile,60-mile and 100-mile radius are approximately 3.9 million, 6.9 million and 10.3 million, respectively. Averagehousehold income within a 30-mile radius is approximately $52,000.
North Georgia Premium Outlets, Dawsonville, Georgia. North Georgia Premium Outlets, a 537,000 square foot centercontaining 135 stores, opened in four phases, in May 1996, May 1997, October 1998 and September 1999. The centeris located 40 miles north of Atlanta on Georgia State Highway 400 bordering Lake Lanier, at the gateway to the NorthGeorgia mountains. The populations within a 30-mile, 60-mile and 100-mile radius are approximately 700,000, 3.6million and 5.8 million, respectively. Average household income within a 30-mile radius is approximately $55,000.
Leesburg Corner Premium Outlets, Leesburg, Virginia. Leesburg Corner Premium Outlets, a 325,000 square footcenter containing 73 stores, opened in two phases, in October 1998 and November 1999. The center is located 35 milesnorthwest of Washington, DC at the intersection of Routes 7 and 15. The populations within a 30-mile, 60-mile and100-mile radius are approximately 2.4 million, 7.1 million and 9.8 million, respectively. Average household incomewithin a 30-mile radius is approximately $78,000.
Camarillo Premium Outlets, Camarillo, California . Camarillo Premium Outlets, a 454,000 square foot centercontaining 124 stores, opened in eight phases, from March 1995 through November 1999. The center is located 48miles north of Los Angeles, about 55 miles south of Santa Barbara on Highway 101. The populations within a 30-mile,60-mile and 100-mile radius are approximately 1.1 million, 8.3 million and 14.6 million, respectively. Averagehousehold income within a 30-mile radius is approximately $66,000.
The Company has started construction on approximately 424,000 square feet of wholly-owned new GLA scheduledfor completion in 2000, including the 232,000 square-foot first phase of Allen Premium Outlets, the 104,000 square-foot third phase of Leesburg Corner and expansions totaling 88,000 square feet at two centers. In addition,construction is well underway on two joint venture projects, Orlando Premium Outlets, a 430,000 square-foot centerlocated in Orlando, Florida and the 220,000 square-foot first phase of Gotemba Premium Outlets, located outsideTokyo, Japan. These projects, and others, are in various stages of development and there can be no assurance theywill be completed or opened, or that there will not be delays in opening or completion.
Strategic Alliance and Joint Ventures
In June 1999, the Company signed a definitive agreement with Mitsubishi Estate Co., Ltd. and Nissho IwaiCorporation to jointly develop, own and operate premium outlet centers in Japan. The joint venture, known asChelsea Japan Co., Ltd. (“Chelsea Japan”) is developing its initial project in the city of Gotemba. In conjunctionwith the agreement, the Company contributed $1.7 million in equity. In addition, an equity investee of the Companyentered into a 4 billion yen (US $40 million) line of credit guaranteed by the Company and OP to fund its share ofconstruction costs. At December 31, 1999, no amounts were outstanding under the loan. In December 1999,construction began on the 220,000 square-foot first phase of Gotemba Premium Outlets with opening scheduled formid-2000. Gotemba is located on the Tomei Expressway, approximately 60 miles west of Tokyo and midwaybetween Mt. Fuji and the Hakone resort area. Subject to governmental and other approvals, Chelsea Japan alsoexpects to announce during the next quarter a project outside Osaka, the second-largest city in Japan, to open in late2000.
In May 1997, the Company announced the formation of a strategic alliance with Simon to develop and acquire high-end outlet centers with GLA of 500,000 square feet or more in the United States. The Company and Simon are co-managing general partners, each with 50% ownership of the joint venture and any entities formed with respect tospecific projects; the Company will have primary responsibility for the day-to-day activities of each project. Inconjunction with the alliance, on June 16, 1997, the Company completed the sale of 1.4 million shares of commonstock to Simon for an aggregate price of $50 million. Proceeds from the sale were used to repay borrowings under theCredit Facilities. Simon is one of the largest publicly traded real estate companies in North America as measured bymarket capitalization, and at February 2000 owned, had an interest in and/or managed approximately 184 millionsquare feet of retail and mixed-use properties in 36 states.
4
The Company announced in October 1998 that it sold its interest in and terminated the development of HoustonPremium Outlets, a joint venture project with Simon. Under the terms of the agreement, the Company will receivenon-compete payments totaling $21.4 million from The Mills Corporation; $3.0 million was received at closing, andfour annual installments of $4.6 million are to be received on each January 2, through 2002. The Company has alsobeen reimbursed for its share of land costs, development costs and fees related to the project.
Construction is underway on Orlando Premium Outlets (“OPO”), a 430,000 square-foot upscale outlet center locatedon Interstate 4 midway between Walt Disney World/EPCOT and Sea World in Orlando, Florida. OPO is a jointventure project between the Company and Simon and is scheduled to open as a single phase in mid-2000. InFebruary 1999, the joint venture entered into a $82.5 million construction loan agreement that is expected to fundapproximately 75% of the project costs. The loan is 50% guaranteed by each of the Company and Simon and as ofDecember 31, 1999, $20.8 million was outstanding.
Organization of the Company
The Company was organized to combine Chelsea and GCA, two leading outlet center development companies, into theOperating Partnership, providing for greater access to the public and private capital markets. Virtually all of theCompany’s assets are held by and all of its business activities conducted through the Operating Partnership. TheCompany is the sole general partner of the Operating Partnership (which owned 82.6% in the Operating Partnership asof December 31, 1999) and has full and complete control over the management of the Operating Partnership and eachof the Properties, excluding joint ventures.
The Manufacturers' Outlet Business
Manufacturers' outlets are manufacturer-operated retail stores that sell primarily first-quality, branded goods atsignificant discounts from regular department and specialty store prices. Manufacturers' outlet centers offer numerousadvantages to both consumer and manufacturer: by eliminating the third party retailer, manufacturers are often able tocharge customers lower prices for brand name and designer merchandise; manufacturers benefit by being able to sellfirst quality in-season, as well as out-of-season, overstocked or discontinued merchandise without compromising theirrelationships with department stores or hampering the manufacturers' brand name. In addition, outlet stores enablemanufacturers to optimize the size of production runs while maintaining control of their distribution channels.
Business of the Company
The Company believes its strong tenant relationships, high-quality property portfolio and managerial expertise give itsignificant advantages in the manufacturers’ outlet business.
Strong Tenant Relationships. The Company maintains strong tenant relationships with high-fashion, upscalemanufacturers that have a selective presence in the outlet industry, such as Armani, Brooks Brothers, Cole Haan,Donna Karan, Gap/Banana Republic, Gucci, Jones New York, Nautica, Polo Ralph Lauren, Tommy Hilfiger andVersace, as well as with national brand-name manufacturers such as Adidas, Carter’s, Nike, Phillips-Van Heusen(Bass, Izod, Gant, Van Heusen), Timberland and Sara Lee (Champion, Hanes, Coach Leather). The Company believesthat its ability to draw from both groups is an important factor in providing broad customer appeal and higher tenantsales.
High Quality Property Portfolio . The Properties generated weighted average reported tenant sales during 1999 of $377per square foot, the highest among the three publicly traded outlet companies. As a result, the Company has beensuccessful in attracting some of the world’s most sought-after brand-name designers, manufacturers and retailers andeach year has added new names to the outlet business and its centers. The Company believes that the quality of itscenters gives it significant advantages in attracting customers and negotiating multi-lease transactions with tenants.
Management Expertise. The Company believes it has a competitive advantage in the manufacturers’ outlet business asa result of its experience in the business, long-standing relationships with tenants and expertise in the development andoperation of manufacturers’ outlet centers. Management developed a number of the earliest and most successful outletcenters in the industry, including Liberty Village (one of the first manufacturers’ outlet centers in the U.S.) in 1981,Woodbury Common in 1985, and Desert Hills and Aurora Farms in 1990. Since the IPO, the Company has addedsignificantly to its senior management in the areas of development, leasing and property management withoutincreasing general and administrative expenses as a percentage of total revenues; additionally, the Company intends tocontinue to invest in systems and controls to support the planning, coordination and monitoring of its activities.
5
Growth Strategy
The Company seeks growth through increasing rents in its existing centers; developing new centers and expandingexisting centers; and acquiring and re-developing centers.
Increasing Rents at Existing Centers. The Company’s leasing strategy includes aggressively marketing available spaceand maintaining a high level of occupancy; providing for inflation-based contractual rent increases or periodic fixedcontractual rent increases in substantially all leases; renewing leases at higher base rents per square foot; re-tenantingspace occupied by underperforming tenants; and continuing to sign leases that provide for percentage rents.
Developing New Centers and Expanding Existing Centers. The Company believes that there continue to be significantopportunities to develop manufacturers’ outlet centers across the United States. The Company intends to undertakesuch development selectively, and believes that it will have a competitive advantage in doing so as a result of itsdevelopment expertise, tenant relationships and access to capital. The Company expects that the development of newcenters and the expansion of existing centers will continue to be a substantial part of its growth strategy. The Companybelieves that its development experience and strong tenant relationships enable it to determine site viability on a timelyand cost-effective basis. However, there can be no assurance that any development or expansion projects will becommenced or completed as scheduled.
International Development. The Company intends to develop, own and operate premium outlet centers in Japanthrough its joint venture company, Chelsea Japan Co., Ltd. Chelsea Japan is currently developing its first outletcenter in Gotemba, located outside Tokyo, and is seeking governmental approval on another site outside Osaka,Japan. The Company believes that there are significant opportunities to develop manufacturers’ outlet centers inJapan and intends to pursue these opportunities as viable sites are identified.
The Company has minority interests ranging from 5 to 15% in several outlet centers and outlet development projectsin Europe. Two outlet centers, Bicester Village outside of London, England and La Roca Company Stores outsideof Barcelona, Spain, are currently open and operated by Value Retail PLC and its affiliates. Three new Europeanprojects and expansions of the two existing centers are in various stages of development and are expected to openwithin the next two years. The Company’s total investment in Europe as of February 2000 is approximately $4.5million. The Company has also agreed to provide up to $22 million in limited debt service guarantees under astandby facility for loans arranged by Value Retail PLC to construct outlet centers in Europe. The term of thestandby facility is three years and guarantees shall not be outstanding for longer than five years after projectcompletion. As of February 2000, the Company has provided limited debt service guarantees of approximately $20million for three projects.
Acquiring and Redeveloping Centers. The Company intends to selectively acquire individual properties and portfoliosof properties that meet its strategic investment criteria as suitable opportunities arise. The Company believes that itsextensive experience in the outlet center business, access to capital markets, familiarity with real estate markets andadvanced management systems will allow it to evaluate and execute acquisitions competitively. Furthermore,management believes that the Company will be able to enhance the operation of acquired properties as a result of its (i)strong tenant relationships with both national and upscale fashion retailers; and (ii) development, marketing andmanagement expertise as a full-service real estate organization. Additionally, the Company may be able to acquireproperties on a tax-advantaged basis through the issuance of Operating Partnership units. However, there can be noassurance that any acquisitions will be consummated or, if consummated, will result in an advantageous return oninvestment for the Company.
Operating Strategy
The Company’s primary business objectives is to enhance the value of its properties and operations by increasing cashflow. The Company plans to achieve these objectives through continuing efforts to improve tenant sales andprofitability, and to enhance the opportunity for higher base and percentage rents.
Leasing . The Company pursues an active leasing strategy through long-standing relationships with a broad range oftenants including manufacturers of men’s, women’s and children’s ready-to-wear, lifestyle apparel, footwear,accessories, tableware, housewares, linens and domestic goods. Key tenants are placed in strategic locations to drawcustomers into each center and to encourage shopping at more than one store. The Company continually monitorstenant mix, store size, store location and sales performance, and works with tenants to improve each center through re-sizing, re-location and joint promotion.
6
Market and Site Selection . To ensure a sound long-term customer base, the Company generally seeks to develop sitesnear densely-populated, high-income metropolitan areas, and/or at or near major tourist destinations. While these areastypically impose numerous restrictions on development and require compliance with complex entitlement andregulatory processes, the Company believes that these areas provide the most attractive long-term demographiccharacteristics. The Company generally seeks to develop sites that can support at least 400,000 square feet of GLA andthat offer the long-term opportunity to dominate their respective markets through a critical mass of tenants.Marketing . The Company pursues an active, property-specific marketing strategy using a variety of media includingnewspapers, television, radio, billboards, regional magazines, guide books and direct mailings. The centers aremarketed to tour groups, conventions and corporations; additionally, each property participates in joint destinationmarketing efforts with other area attractions and accommodations. Virtually all consumer marketing expenses incurredby the Company are reimbursable by tenants.
Property Design and Management. The Company believes that effective property design and management aresignificant factors in the success of its properties and works continually to maintain or enhance each center’s physicalplant, original architectural theme and high level of on-site services. Each property is designed to be compatible withits environment and is maintained to high standards of aesthetics, ambiance and cleanliness in order to promote longervisits and repeat visits by shoppers. Of the Company’s 388 full-time and 99 part-time employees, 286 full-time and 97part-time employees are involved in on-site maintenance, security, administration and marketing. Centers are generallymanaged by an on-site property manager with oversight from a regional operations director.
Financing
The Company seeks to maintain a strong, flexible financial position by: (i) maintaining a conservative level ofleverage, (ii) extending and sequencing debt maturity dates, (iii) managing floating interest rate exposure and (iv)maintaining liquidity. Management believes these strategies will enable the Company to access a broad array of capitalsources, including bank or institutional borrowings, secured and unsecured debt and equity offerings.
On September 3, 1999, the OP completed a private sale of $65 million of Series B Cumulative RedeemablePreferred Units (“Preferred Units”) to an institutional investor. The private placement took the form of 1.3 millionPreferred Units at a stated value of $50 each. The Preferred Units may be called at par on or after September 3,2004, have no stated maturity or mandatory redemption and pay a cumulative quarterly dividend at an annualizedrate of 9.0%. The Preferred Units are exchangeable into Series B Cumulative Redeemable Preferred Stock of theCompany after ten years. Proceeds from the sale were used to pay down borrowings under the Senior CreditFacility.
In November 1998, the OP obtained a $60 million term loan that expires April 2000 and bears interest at a rate ofLondon Interbank Offered Rate (LIBOR) plus 1.40% (7.53% at December 31, 1999). Proceeds from the loan wereused to pay down borrowings under the Senior Credit Facility. The Company is currently exploring severalrefinancing alternatives including an extension or payoff of this loan.
On March 30, 1998, the OP replaced its two unsecured bank revolving lines of credit, totaling $150 million (the“Credit Facilities”), with a $160 million senior unsecured bank line of credit (the “Senior Credit Facility”). TheSenior Credit Facility expires on March 30, 2002 and the OP has an annual right to request a one-year extension ofthe Senior Credit Facility which may be granted at the option of the lenders. The OP has requested and expectsapproval to extend the Facility until March 30, 2003. The Facility bears interest on the outstanding balance, payablemonthly, at a rate equal of LIBOR plus 1.05% (7.24% at December 31, 1999) or the prime rate, at the OP’s option.The LIBOR rate spread ranges from 0.85% to 1.25% depending on the Company’s Senior Debt rating. A fee on theunused portion of the Senior Credit Facility is payable quarterly at rates ranging from 0.15% to 0.25% depending onthe balance outstanding. At December 31, 1999, $94 million was available under the Senior Credit Facility.
Also on March 30, 1998, the OP entered into a $5 million term loan (the “Term Loan”) which carries the sameinterest rate and maturity as the Senior Credit Facility. The Lender has credit committee approval to extend theTerm Loan to March 30, 2003.
In October 1997, the OP completed a $125 million offering of 7.25% unsecured term notes due October 2007 (the“7.25% Notes”). The 7.25% Notes were priced to yield 7.29% to investors. Net proceeds from the offering wereused to repay substantially all borrowings under the Company’s Credit Facilities, redeem $40 million of Reset Notesand for general corporate purposes.
7
In October 1997, the Company issued 1.0 million shares of non-voting 8.375% Series A Cumulative RedeemablePreferred Stock (the “Preferred Stock”), par value $0.01 per share, with a liquidation preference of $50.00 per share.The Preferred Stock has no stated maturity and is not convertible into any other securities of the Company. ThePreferred Stock is redeemable on or after October 15, 2027 at the Company’s option. Net proceeds from theoffering were used to repay borrowings under the Company’s Credit Facilities.
In January 1996, the OP completed a $100 million offering of 7.75% unsecured term notes due January 2001 (the“7.75% Notes”), which are guaranteed by the Company. The five-year non-callable 7.75% Notes were priced toyield 7.85% to investors.
Competition
The Properties compete for retail consumer spending on the basis of the diverse mix of retail merchandising and valueoriented pricing. Manufacturers' outlet centers have established a niche capitalizing on consumers’ desire for value-priced goods. The Properties compete for customer spending with other outlet locations, traditional shopping malls,off-price retailers, and other retail distribution channels. The Company believes that the Properties generally are theleading manufacturers' outlet centers in each market. The Company carefully considers the degree of existing andplanned competition in each proposed market before deciding to build a new center.
Environmental Matters
The Company is not aware of any environmental liabilities relating to the Properties that would have a material impacton the Company's financial position and results of operations.
Personnel
As of December 31, 1999, the Company had 388 full-time and 99 part-time employees. None of the employees aresubject to any collective bargaining agreements, and the Company believes it has good relations with its employees.
Item 2. Properties
The Properties are upscale, fashion-oriented manufacturers’ outlet centers located near large metropolitan areas,including New York City, Los Angeles, San Francisco, Boston, Washington DC, Atlanta, Sacramento, Portland(Oregon), and Cleveland, or at or near tourists destinations, including Honolulu, Napa Valley, Palm Springs and theMonterey Peninsula. The Properties were 99% leased as of December 31, 1999 and contained approximately 1,400stores with approximately 450 different tenants. During 1999 and 1998, the Properties generated weighted averagetenant sales of $377 and $360 per square foot, respectively. As of December 31, 1999, the Company had 19 operatingoutlet centers. Of the 19 operating centers, 18 are owned 100% in fee; and one, American Tin Cannery PremiumOutlets, is held under a long-term lease expiring December 2004. The Company manages all of its Properties.
Approximately 34% and 35% of the Company’s revenues for the years ended December 31, 1999 and 1998,respectively, were derived from the Company’s two centers with the highest revenues, Woodbury Common PremiumOutlets and Desert Hills Premium Outlets. The loss of either center or a material decrease in revenues from eithercenter for any reason might have a material adverse effect on the Company. In addition, approximately 30% and 34%of the Company’s revenues for the years ended December 31, 1999 and 1998, respectively, were derived from theCompany’s centers in California, including Desert Hills.
8
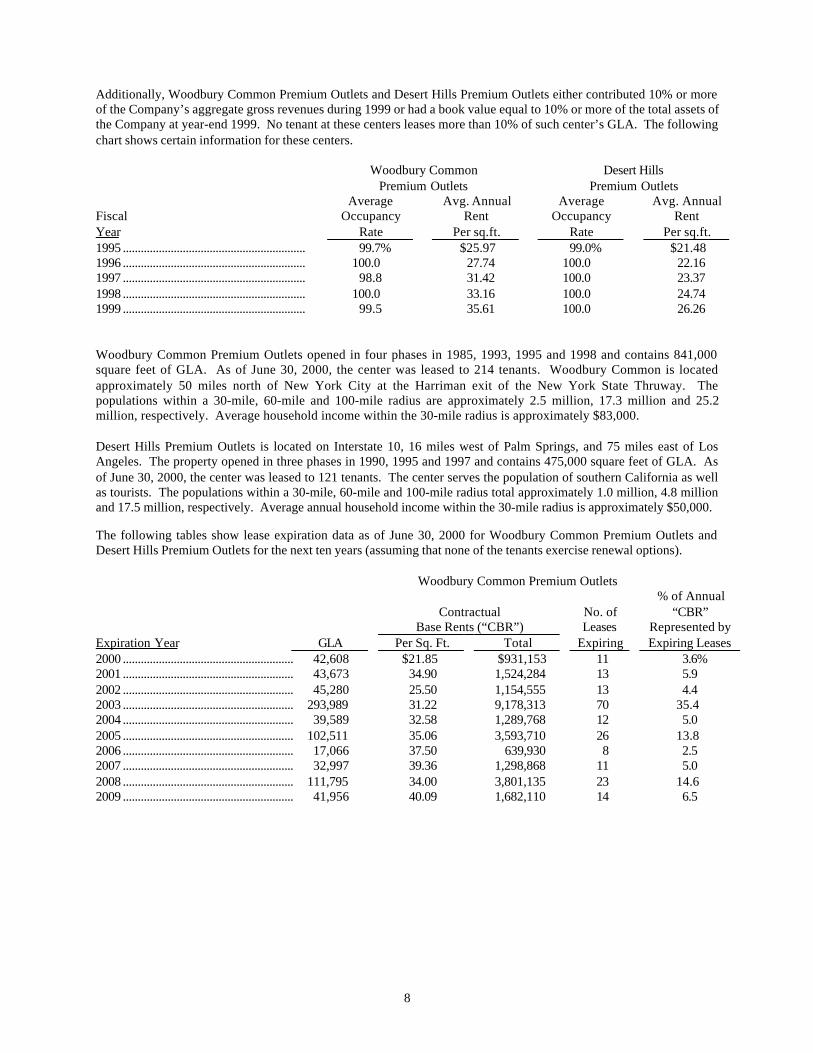
Additionally, Woodbury Common Premium Outlets and Desert Hills Premium Outlets either contributed 10% or moreof the Company’s aggregate gross revenues during 1999 or had a book value equal to 10% or more of the total assets ofthe Company at year-end 1999. No tenant at these centers leases more than 10% of such center’s GLA. The followingchart shows certain information for these centers.
Woodbury Common Premium Outlets opened in four phases in 1985, 1993, 1995 and 1998 and contains 841,000square feet of GLA. As of June 30, 2000, the center was leased to 214 tenants. Woodbury Common is locatedapproximately 50 miles north of New York City at the Harriman exit of the New York State Thruway. Thepopulations within a 30-mile, 60-mile and 100-mile radius are approximately 2.5 million, 17.3 million and 25.2million, respectively. Average household income within the 30-mile radius is approximately $83,000.
Desert Hills Premium Outlets is located on Interstate 10, 16 miles west of Palm Springs, and 75 miles east of LosAngeles. The property opened in three phases in 1990, 1995 and 1997 and contains 475,000 square feet of GLA. Asof June 30, 2000, the center was leased to 121 tenants. The center serves the population of southern California as wellas tourists. The populations within a 30-mile, 60-mile and 100-mile radius total approximately 1.0 million, 4.8 millionand 17.5 million, respectively. Average annual household income within the 30-mile radius is approximately $50,000.
The following tables show lease expiration data as of June 30, 2000 for Woodbury Common Premium Outlets andDesert Hills Premium Outlets for the next ten years (assuming that none of the tenants exercise renewal options).
Woodbury Common Premium Outlets% of Annual
Contractual No. of “CBR”Base Rents (“CBR”) Leases Represented by
Depreciation on Woodbury Common Premium Outlets and Desert Hills Premium Outlets is calculated using thestraight line method over the estimated useful life of the real property and land improvements which ranges from 10 to40 years. At December 31, 1999, the Federal tax basis in these centers was as follows: Woodbury Common PremiumOutlets - $129,508,887 and Desert Hills Premium Outlets - $55,340,210.
The realty tax rate on the above centers is approximately $4.73 per $100 of assessed value for Woodbury CommonPremium Outlets and $1.16 per $100 of assessed value for Desert Hills Premium Outlets. Estimated 2000 taxes forthese centers are as follows: $3,270,000 for Woodbury Common Premium Outlets and $907,000 for Desert HillsPremium Outlets.
The Company believes the Properties are adequately covered by insurance.
The Company does not consider any single store lease to be material; no individual tenant, combining all of its storeconcepts, accounts for more than 5% of the Company’s gross revenues or total GLA; and only two tenants occupymore than 4% of the Company’s total GLA. As a result, and considering the Company’s past success in re-leasingavailable space, the Company believes the loss of any individual tenant would not have a significant effect on futureoperations.
10
Set forth in the table below is certain property information as of December 31,1999:
Name/LocationYear
OpenedGLA
(Sq. Ft.)No. ofStores Tenants
Woodbury Common 1985 841,000 213 Brooks Brothers, Calvin Klein, Coach Leather, Gap, Central Valley, NY (New York City metro area) Gucci, Last Call Neiman Marcus, Polo Ralph Lauren
North Georgia 1996 537,000 135 Brooks Brothers, Donna Karan, Gap, Nautica, Off Dawsonville, GA (Atlanta metro area) 5th-Saks Fifth Avenue, Williams-Sonoma
Desert Hills 1990 475,000 120 Burberry, Coach Leather, Giorgio Armani, Gucci, Cabazon, CA (Palm Springs-Los Angeles area) Nautica, Polo Ralph Lauren, Tommy Hilfiger
Wrentham Village 1997 473,000 125 Brooks Brothers, Calvin Klein, Donna Karan, Wrentham, MA (Boston/Providence metro area) Gap, Polo Jeans Co., Sony, Versace
Camarillo Premium Outlets 1995 454,000 124 Ann Taylor, Barneys New York, Bose, Cole-Haan, Camarillo, CA (Los Angeles metro area) Donna Karan, Jones NY, Off 5th-Saks Fifth Avenue
Leesburg Corner 1998 325,000 73 Banana Republic, Brooks Brothers, Gap, Donna Leesburg, VA (Washington DC area) Karan, Off 5th-Saks Fifth Avenue
Aurora Premium Outlets 1987 297,000 69 Ann Taylor, Bose, Brooks Brothers, Carters, Liz Aurora, OH (Cleveland metro area) Claiborne, Nautica, Off 5th-Saks Fifth Avenue
Clinton Crossing 1996 272,000 67 Coach Leather, Crate & Barrel, Donna Karan, Gap, Clinton, CT (I-95/NY-New England corridor) Off 5th-Saks Fifth Avenue, Polo Ralph Lauren
Folsom Premium Outlets 1990 246,000 68 Bass, Donna Karan, Gap, Liz Claiborne, Nike, Folsom, CA (Sacramento metro area) Off 5th-Saks Fifth Avenue
Waikele Premium Outlets (1) 1997 214,000 52 Barneys New York, Bose, Donna Karan, Guess, Waipahu, HI (Honolulu area) Polo Jeans Co., Off 5th-Saks Fifth Avenue
Petaluma Village 1994 196,000 51 Ann Taylor, Bose, Brooks Brothers, Donna Petaluma, CA (San Francisco metro area) Karan, Off 5th-Saks Fifth Avenue
Napa Premium Outlets 1994 171,000 48 Cole-Haan, Dansk, Ellen Tracy, Esprit, J. Crew, Napa, CA (Napa Valley) Nautica, Timberland, TSE Cashmere
Columbia Gorge 1991 164,000 44 Adidas, Carter’s, Gap, Harry & David, Troutdale, OR (Portland metro area) Mikasa
Liberty Village 1981 157,000 56 Calvin Klein, Donna Karan, Ellen Tracy, Flemington, NJ (New York-Phila. metro area) Polo Ralph Lauren, Tommy Hilfiger
American Tin Cannery 1987 135,000 48 Anne Klein, Bass, Carole Little, Nine West, Pacific Grove, CA (Monterey Peninsula) Reebok, Totes
Santa Fe Premium Outlets 1993 125,000 40 Brooks Brothers, Coach Leather, Donna Santa Fe, NM Karan, Liz Claiborne, Nine West
Patriot Plaza 1986 76,000 11 Lenox, Polo Ralph Lauren, WestPoint Stevens Williamsburg, VA (Norfolk-Richmond area)
Mammoth Premium Outlets 1990 35,000 11 Bass, Polo Ralph Lauren Mammoth Lakes, CA (Yosemite National Park)
St. Helena Premium Outlets 1992 23,000 9 Brooks Brothers, Coach Leather, Donna Karan, St. Helena, CA (Napa Valley) Joan & David
Total 5,216,000 1,364(1) Acquired in March 1997
The Company rents approximately 27,000 square feet of office space in its headquarters facility in Roseland, NewJersey and approximately 4,000 square feet of office space for its west coast regional development office in NewportBeach, California.
Item 3. Legal Proceedings
The Company is not presently involved in any material litigation other than routine litigation arising in the ordinarycourse of business and that is either expected to be covered by liability insurance or to have no material impact on theCompany's financial position and results of operations.
Item 4. Submission of Matters to a Vote of Security Holders
None.
11
Directors and Executive Officers of the Company
The following table sets forth the directors and executive officers of the Company:
Name Age PositionDavid C. Bloom 43 Chairman of the Board (term expires in 2002)
and Chief Executive OfficerWilliam D. Bloom 37 Vice Chairman
and Director (term expires in 2000)Brendan T. Byrne 75 Director (term expires in 2001)Robert Frommer 65 Director (term expires in 2000)Barry M. Ginsburg 62 Director (term expires in 2002)Philip D. Kaltenbacher 62 Director (term expires in 2002)Reuben S. Leibowitz 52 Director (term expires in 2000)Leslie T. Chao 43 PresidentThomas J. Davis 44 Chief Operating OfficerBruce Zalaznick 43 Executive Vice President-InternationalMichael J. Clarke 46 Chief Financial OfficerChristina M. Casey 44 Vice President-Human ResourcesDenise M. Elmer 43 Vice President, General Counsel and SecretaryAnthony J. Galvin 40 Vice President-LeasingEric K. Helstrom 41 Vice President-Architecture and ConstructionJohn R. Klein 41 Vice President-Acquisitions and DevelopmentGregory C. Link 50 Vice President-OperationsMichele Rothstein 41 Vice President-MarketingCatherine A. Lassi 40 TreasurerSharon M. Vuskalns 36 Controller
David C. Bloom, Chairman of the Board and Chief Executive Officer since 1993. Mr. Bloom was a founder and principalof Chelsea, and was President of Chelsea from 1985 to 1993. As Chairman of the Board and Chief Executive Officer ofthe Company, he sets policy and coordinates and directs all the Company’s primary functions. Prior to founding Chelsea,he was an equity analyst with The First Boston Corporation (now Credit Suisse First Boston Corporation) in New York.Mr. Bloom graduated from Dartmouth College and received an MBA from Harvard Business School.
William D. Bloom, Vice Chairman since 2000 and Director since 1995. Mr. Bloom joined The Chelsea Group in 1986with responsibility for the leasing of the Company’s projects and was appointed Executive Vice President-Leasing in1993 and Executive Vice President-Strategic Relationships in 1996. Prior to joining Chelsea, he was an institutional bondbroker with Mabon Nugent in New York. Mr. Bloom graduated from Boston University School of Management.
Brendan T. Byrne, Director since 1993. Since 1982, Mr. Byrne has been a senior partner in the law firm of Carella,Byrne, Bain, Gilfillan, Cecchi, Stewart & Olstein. He previously served as Governor of New Jersey from 1974 to 1982,Prosecutor of Essex County (New Jersey), President of the Public Utility Commission and Assignment Judge of the NewJersey Superior Court. He has also served as Vice President of the National District Attorneys Association; Trustee ofPrinceton University; Chairman of the Princeton University Council on New Jersey Affairs; Chairman of the UnitedStates Marshals Foundation; and Chairman of the National Commission on Criminal Justice Standards and Goals (1977).He serves on a Board of the National Judicial College, is a former Commissioner of the New Jersey Sports andExposition Authority, and was a member of the board of directors of New Jersey Bell Telephone Company,Elizabethtown Water Company, Ingersoll-Rand Company and a former director of The Prudential Insurance Company ofAmerica. He is a member of the Board of Mack-Cali, Inc. Mr. Byrne graduated from Princeton University and receivedan LL.B. from Harvard Law School.
12
Robert Frommer, Director since 1993. Mr. Frommer has been responsible for developing major commercial, residentialand mixed-use real estate projects throughout the “U.S.” in such cities as New York, Philadelphia, Baltimore,Washington, DC, Chicago and Seattle. He has served as President of the Pebble Beach Co., the Ritz-Carlton Hotel ofChicago and PG&E Properties in California. Mr. Frommer is a graduate of the Wharton School of the University ofPennsylvania, and received an LL.B. from Yale Law School.
Barry M. Ginsburg, Director since 1993. Mr. Ginsburg was a founder and principal of GCA and its predecessorcompanies from 1986 to 1993 and Vice Chairman of the Company from 1993 to 1999. From 1966 through 1985, he wasemployed by Dansk International Designs, Ltd. and was corporate Chief Operating Officer and Director from 1980 to1985. Dansk operated a chain of 31 manufacturers’ outlet stores. He is a Director of Liz Lange Maternity and NewMilford (Connecticut) Hospital. Mr. Ginsburg graduated from Colby College and received an MBA from CornellUniversity.
Philip D. Kaltenbacher, Director since 1993. Since 1974, Mr. Kaltenbacher has been Chairman of the Board of Directorsand Chief Executive Officer of Seton Company, a manufacturer of leather; health care products; industrial foams, films,tapes, adhesives and laminates; and chemicals. Mr. Kaltenbacher was a Commissioner of The Port Authority of NewYork and New Jersey from September 1985 through February 1993, and served as Chairman from September 1985through April 1990. Mr. Kaltenbacher graduated from Yale University and received an LL.B. from Yale Law School.
Reuben S. Leibowitz, Director since 1993. Mr. Leibowitz is a Managing Director of E.M. Warburg, Pincus & Co., LLC(“Warburg, Pincus”), a venture banking firm. He has been associated with Warburg, Pincus since 1984. Mr. Leibowitzcurrently serves on the board of directors of Grubb & Ellis Company and Lennar Corporation. Mr. Leibowitz graduatedfrom Brooklyn College, received an MBA from New York University, a JD from Brooklyn Law School, and an LL.M.from New York University School of Law.
Leslie T. Chao, President since April 1997. As President of the Company, Mr. Chao oversees the corporate finance,international development, legal, administrative, investor relations and human resource functions of the Company. Hejoined Chelsea in 1987 as Chief Financial Officer. Prior to joining Chelsea, he was a Vice President in the corporatefinance/treasury area of Manufacturers Hanover Corporation (now The Chase Manhattan Corporation), a New York bankholding company. Mr. Chao graduated from Dartmouth College and received an MBA from Columbia Business School.
Thomas J. Davis, Chief Operating Officer since April 1997. As Chief Operating Officer, Mr. Davis oversees the assetmanagement activities of the Company including leasing, operations and marketing as well as development andconstruction. Mr. Davis joined Chelsea in 1996 as Executive Vice President-Asset Management. From 1988 to 1995, heheld various senior positions at Phillips-Van Heusen Corporation, most recently as Vice President-Real Estate. Mr. Davishas over twenty years of factory outlet industry experience and has served the industry in various trade associationpositions including Chairman of Manufacturers Idea Exchange as well as a board member of the Steering Committee forFOMA (Factory Outlet Marketing Association). Mr. Davis received the 1995 Value Retail News Award of Excellencefor individual achievement in the outlet industry.
Bruce Zalaznick, Executive Vice President-International since 1999. Mr. Zalaznick joined the Company in 1994 as VicePresident-Acquisitions responsible for the Company’s site acquisition activities. From 1996 to 1999 he served asExecutive Vice President-Real Estate, responsible for the site selection, development, design and construction activitiesof the Company. In July 1999, Mr. Zalaznick was named Executive Vice President-International and is responsible forthe Company’s development outside the United States. From 1990 to 1994, he was Senior Vice President-SiteAcquisition at Prime Retail, Inc., a publicly traded REIT, and in that capacity was responsible for the acquisition andentitlement of approximately three million square feet of outlet space in ten states. Mr. Zalaznick graduated from CornellUniversity and received an MBA from the Wharton School at the University of Pennsylvania.
Michael J. Clarke, Chief Financial Officer since 1999. Since joining the Company in 1994, Mr. Clarke has held varioussenior level financial positions. As Chief Financial Officer, he is responsible for Chelsea’s financial functions includingtreasury, accounting, budgeting, banking and rating agency relations. From 1985 to 1993, he held various seniorpositions at Prime Hospitality Corp., a NYSE-listed operator of hotels, most recently as Executive Vice President & ChiefFinancial Officer. Mr. Clarke graduated from Seton Hall University and is a certified public accountant.
13
Christina M. Casey, Vice President-Human Resources since 1998. Ms. Casey joined the Company in 1996 as Director ofHuman Resources. As Vice President-Human Resources, she oversees all aspects of the Company’s human resourceactivities, including recruitment, benefits, compensation, policy development, training and employee relations. From1987 to 1996 she held various positions in Human Resources with Boise Cascade Corporation, Specialty Paperboard andRock-Tenn Company. Ms. Casey graduated from Villanova University and received a Masters in Social Service fromBryn Mawr Graduate School.
Denise M. Elmer, Vice President, General Counsel and Secretary since 1993. Ms. Elmer joined Chelsea as GeneralCounsel in 1993. As Vice President, General Counsel and Secretary, she oversees the legal activities of the Company,including those related to property acquisition and development, leasing, finance and operations. From 1988 to 1993, shewas an attorney in the New York law firm of Stadtmauer Bailkin Levine & Masur, where she specialized in commercialreal estate law and became a partner in 1990. Ms. Elmer graduated from St. Lawrence University and received a JD fromDuke University School of Law.
Anthony J. Galvin, Vice President-Leasing since 1997. As Vice President-Leasing, Mr. Galvin is responsible for themanagement of the Company’s leasing activities. From 1995 to 1997, he was Director of Real Estate for Coach Leather,a division of Sara Lee Corporation. From 1987 to 1995 he held positions in both real estate and construction at Phillips-Van Heusen Corporation. Mr. Galvin has served the industry in various trade association positions including Chairpersonof the Northeast Merchants Association and the Board of Directors of ORMA (Outlet Retail Merchants Association). Mr.Galvin is a graduate of Glassboro State College (now Rowan University), where he serves on the Executive Committee ofthe Alumni Advisory Council for the School of Business.
Eric K. Helstrom, Vice President-Architecture and Construction, since 1996. Mr. Helstrom joined the Company in 1995as Director-Development and was named Vice President-Architecture and Construction in 1996. He oversees the design,engineering and construction activities of the Company. From 1987 to 1995, he held various positions includingDirector-Architecture/Construction with Alexander Haagen Properties, an AMEX-listed REIT. Mr. Helstrom graduatedfrom California Polytechnic San Luis Obispo and received a Masters in Real Estate Development from the University ofSouthern California. Mr. Helstrom is a licensed architect and general contractor.
John R. Klein, Vice President-Acquisitions and Development, since 1996. Mr. Klein joined the Company in 1995 asDirector-Acquisitions and was named Vice President-Acquisitions and Development in 1996. He oversees theCompany’s acquisitions and development activities including site selection and entitlements. From 1991 to 1995, he heldvarious positions at Prime Retail, Inc., most recently as Vice President-Site Acquisition. At Prime, Mr. Klein wasinvolved in the acquisition and entitlement of over two million square feet of manufacturers’ outlet space in nine states.Mr. Klein graduated from Columbia University and received an MBA from George Washington University School ofBusiness.
Gregory C. Link, Vice President-Operations since 1996. Mr. Link joined the Company in 1994 as Vice President-Leasing responsible for the management of the Company’s leasing activities. In January 1996, Mr. Link was appointedVice President-Operations and is responsible for supervising property management activities at the Company’s operatingproperties. From 1987 to 1994, he was Chairman, President and Chief Executive Officer of The Ribbon Outlet, Inc., anaffiliate of the world’s largest ribbon manufacturer, and in that capacity opened over 100 factory outlet stores across theUnited States. From 1971 to 1987 he held various senior merchandising positions with Phillips-Van Heusen Corporation,Westpoint Pepperell Corporation, May Department Stores and Associated Dry Goods Corporation. Mr. Link graduatedfrom the College of Business and Public Administration of the University of Arizona at Tucson.
Michele Rothstein, Vice President-Marketing since 1993. Ms. Rothstein joined Chelsea in 1989 as Vice President-Marketing. As Vice President-Marketing of the Company, she oversees all aspects of the Company’s marketing andpromotion activities. From 1987 to 1989, she was a product manager at Regina Company and, prior to 1987, was withWaring & LaRosa Advertising in New York. Ms. Rothstein graduated from the School of Business at the StateUniversity of New York at Albany.
14
Catherine A. Lassi, Treasurer since 1997. Ms. Lassi joined Chelsea in 1987, became Controller in 1990 and Treasurer inJanuary 1997. As Treasurer, she oversees budgeting, forecasting, contract administration, cash management, banking,information systems and lease accounting activities for the Company. Ms. Lassi is a certified public accountant andgraduated from the University of South Florida.
Sharon M. Vuskalns, Controller since 1997. Ms. Vuskalns joined the Company in 1995 as Director of AccountingServices. As Controller, she oversees the accounting and financial reporting activities for the Company. Prior to joiningChelsea, she was a Senior Audit Manager with Ernst & Young, LLP. Ms. Vuskalns graduated from Indiana Universityand is a certified public accountant.
David C. Bloom and William D. Bloom are brothers.
15
PART II
Item 5. Market for the Registrant’s Common Stock and Related Security Matters
The common stock of the Company is traded on the New York Stock Exchange under the ticker symbol CCG. As ofFebruary 24, 2000 there were 545 shareholders of record. The Company believes it has more than 12,000 beneficialholders of common stock. The following table sets forth the quarterly high and low closing sales price per share (asderived from the Wall Street Journal) and the cash distributions declared in 1999 and 1998:
Sales Price ($) DistributionsQuarter Ended High Low ($)
While the Company intends to continue paying regular quarterly dividends, future dividend declarations will be at thediscretion of the Board of Directors and will depend on the cash flow and financial condition of the Company; capitalrequirements; annual distribution requirements under the REIT provisions of the Internal Revenue Code; covenantlimitations under the Senior Credit Facility and the Term Notes; and such other factors as the Board of Directors deemsrelevant.
On June 16, 1997, pursuant to a Stock Subscription Agreement dated May 16, 1997 (the “Subscription Agreement”)the Company sold to Simon Property Group, Inc. (“Simon”) an aggregate of 1,408,450 shares of Common Stock at apurchase price of $35.50 per share, for an aggregate purchase price of approximately $50 million. Pursuant to theSubscription Agreement, the Company agreed not to sell for cash any equity securities (or securities convertible into orexercisable for equity securities) unless it offers to Simon the right to buy a pro rata share of such securities. Simonagreed not to acquire any additional securities of the Company or, directly or indirectly, seek to acquire control of theCompany without prior consent of the Company’s Board of Directors for a period of five years from the date of theSubscription Agreement (or two years after the Simon joint venture is terminated). If Simon acquires an aggregate of$100 million of securities of the Company, it will have the right to elect a director of the Company.
16
Item 6: Selected Financial DataChelsea GCA Realty, Inc.
(In thousands except per share, and number of centers)
Income before minority interest and extraordinary item.................................................................. 47,556 25,436 35,155 31,360 29,650
Net income to common shareholders ..................................... $34,093 $17,162 $27,449 $20,854 $19,572
Income per common share before extraordinary item (diluted) (1)........................................... $2.14 $1.12 $1.86 $1.79 $1.73Net income per common share (diluted) (1) .......................... $2.14 $1.10 $1.85 $1.74 $1.73
Ownership Interest:REIT common shares ............................................................... 15,908 15,672 14,866 11,964 11,289Operating Partnership units ...................................................... 3,389 3,431 3,435 5,316 5,601Weighted average shares/units outstanding........................... 19,297 19,103 18,301 17,280 16,890
Other Data:Funds from operations to common shareholders (2)............. $79,980 $67,994 $57,417 $48,616 $41,870Cash flows from: Operating activities ................................................................ $87,590 $78,731 $56,594 $53,510 $36,797 Investing activities ................................................................. (77,578) (119,807) (199,250) (99,568) (82,393) Financing activities ................................................................ (10,781) 36,169 143,308 55,957 40,474
GLA at end of period................................................................ 5,216 4,876 4,308 3,610 2,934Weighted average GLA (3) ...................................................... 4,995 4,614 3,935 3,255 2,680Centers in operation at end of the period ............................... 19 19 20 18 16New centers opened.................................................................. - 1 1 2 1Centers expanded ...................................................................... 4 7 5 5 7Center sold ................................................................................. 1 - - - 1Centers held for sale.................................................................. 1 2 - - -Center acquired.......................................................................... - - 1 - -
17
Notes to Selected Financial Data:(1) The earnings per share amounts prior to 1997 have been restated as required to comply with Statement of Financial
Accounting Standards No. 128, Earnings Per Share. For further discussion of earnings per share and the impact ofStatement No. 128, see the notes to the consolidated financial statements beginning on page F-6.
(2) The Company believes that FFO is helpful to investors as a measure of the performance of an equity REIT because, alongwith cash flow from operating activities, financing activities and investing activities, it provides investors with an indicationof the ability of the Company to incur and service debt, to make capital expenditures and to fund other cash needs. TheCompany computes FFO in accordance with the current standards established by NAREIT which may not be comparable toFFO reported by other REIT’s that do not define the term in accordance with the current NAREIT definition or that interpretthe current NAREIT definition differently than the Company. FFO does not represent cash generated from operatingactivities in accordance with GAAP and should not be considered as an alternative to net income (determined in accordancewith GAAP) as an indication of the Company’s financial performance or to cash flow from operating activities (determinedin accordance with GAAP) as a measure of the Company’s liquidity, nor is it indicative of funds available to fund theCompany’s cash needs, including its ability to make cash distributions. See Management’s Discussion and Analysis fordefinition of FFO.
(3) GLA weighted by months in operation.
Item 7. Management's Discussion and Analysis of Financial Condition and Results of Operations
The following discussion should be read in connection with the financial statements and notes thereto appearingelsewhere in this annual report.
Certain comparisons between periods have been made on a percentage or weighted average per square foot basis. Thelatter technique adjusts for square footage changes at different times during the year.
General Overview
At December 31, 1999 and 1998, the Company operated 19 manufacturers’ outlet centers, compared to 20 at the end of1997. The Company’s operating gross leasable area (“GLA”) at December 31, 1999 was 5.2 million square feetcompared to 4.9 million square feet and 4.3 million square feet at December 31, 1998 and 1997, respectively.
From January 1, 1997 to December 31, 1999, the Company grew by increasing rents at its operating centers, openingtwo new centers, acquiring one center and expanding nine centers. Increasing rents at operating centers resulted in baseand percentage rent revenue growth of $13.8 million. The opening of two new centers, acquisition of one center andexpansion of nine centers increased base and percentage rent revenues by $10.6 million, $6.3 million and $20.0 million,respectively during the three year period ended December 31, 1999. The 1.6 million square feet (“sf”) of net GLAadded during the period is detailed as follows:
18
SinceJanuary 1,
1997 1999 1998 1997
Changes in GLA (sf in 000’s):
New centers developed:Leesburg Corner 270 - 270 -Wrentham Village 227 - - 227
Total new centers 497 - 270 227
Centers expanded: Wrentham Village 246 120 126 - North Georgia 245 103 31 111
Centers held for sale:Solvang Designer Outlets (52) - (52) -Lawrence Riverfront (146) - (146) -
(198) - (198) -
Center acquired:Waikele Premium Outlets 214 - - 214
Net GLA added during the period 1,606 340 568 698
Other Data:GLA at end of period 5,216 4,876 4,308Weighted average GLA (1) 4,995 4,614 3,935Centers in operation at end of period 19 19 20New centers opened - 1 1Centers expanded 4 7 5Centers sold 1 - -Centers held for sale 1 2 -Center acquired - - 1
Note: (1) Average GLA weighted by months in operation
The Company’s centers produced weighted average reported tenant sales of approximately $377 per square foot in1999 and $360 per square foot in 1998 and 1997. Weighted average sales is a measure of tenant performance that has adirect effect on base and percentage rents that can be charged to tenants over time.
Two of the Company’s centers, Woodbury Common and Desert Hills, generated approximately 34%, 35% and 34% ofthe Company’s total revenue for the years 1999, 1998 and 1997, respectively. In addition, approximately 30%, 34%,and 38% of the Company's revenues for the years ended December 31, 1999, 1998 and 1997, respectively, werederived from the Company’s centers in California, including Desert Hills.
The Company does not consider any single store lease to be material; no individual tenant, combining all of its storeconcepts, accounts for more than 5% of the Company’s gross revenues or total GLA; and only two tenants occupymore than 4% of the Company’s total GLA. In view of these statistics and the Company’s past success in re-leasingavailable space, the Company believes the loss of any individual tenant would not have a significant effect on futureoperations.
19
The discussion below is based upon operating income before minority interest and extraordinary item. The minorityinterest in net income varies from period to period as a result of changes in Operating Partnership interests and theCompany’s 50% investment in Solvang prior to June 30, 1997.
Comparison of year ended December 31, 1999 to year ended December 31, 1998
Operating income before interest, depreciation and amortization increased $18.6 million, or 19.8%, to $112.2 million in1999 from $93.6 million in 1998. This increase was primarily the result of expansions and a new center openingduring 1999 and 1998. Income from operations increased $7.1 million or 17.3% to $48.3 million in 1999 from $41.2million in 1998. Increased revenues from expansions and a new center opening during 1999 and 1998 were offset byhigher interest costs.
Base rentals increased $12.2 million, or 14.1%, to $98.8 million in 1999 from $86.6 million in 1998 due to expansions,a new center opening in 1998 and higher average rents. Base rental revenue per weighted average square footincreased to $19.79 in 1999 from $18.77 in 1998 as a result of higher rental rates on new leases and renewals .
Percentage rents increased $2.3 million, or 16.9%, to $15.7 million in 1999 from $13.4 million in 1998. The increasewas primarily due to a new center opening in 1998, expansions of existing centers and increase in tenants contributingpercentage rents.
Expense reimbursements, representing contractual recoveries from tenants of certain common area maintenance,operating, real estate tax, promotional and management expenses, increased $4.4 million, or 12.5%, to $39.7 million in1999 from $35.3 million in 1998, due to the recovery of operating and maintenance costs from increased GLA. On aweighted average square foot basis, expense reimbursements increased 3.9% to $7.96 in 1999 from $7.66 in 1998. Theaverage recovery of reimbursable expenses was 90.8% in 1999 compared to 91.3% in 1998.
Other income increased $4.7 million to $8.7 million in 1999 from $4.0 million in 1998. The increase was primarilydue to income from the agreement not to compete with the Mills Corporation in the Houston, Texas area.
Interest, in excess of amounts capitalized, increased $4.2 million to $24.2 million in 1999 from $20.0 million in 1998,due to higher debt balances from increased GLA in operation.
Operating and maintenance expenses increased $5.1 million, or 13.1%, to $43.8 million in 1999 from $38.7 million in1998. The increase was primarily due to costs related to increased GLA. On a weighted average square foot basis,operating and maintenance expenses increased 4.4% to $8.76 in 1999 from $8.39 in 1998 as a result of increased realestate tax and promotion costs.
General and administrative expenses were $4.8 million during 1999 and 1998 due to stabilized overhead costs during1999.
Depreciation and amortization expense increased $7.2 million to $39.7 million in 1999 from $32.5 million in 1998.The increase was due to depreciation of expansions and a new center opened in 1998.
The loss on writedown of assets of $0.7 million in 1999 and $15.7 million in 1998 was attributable to the re-valuationof two centers held for sale at their estimated fair values and the write-off of pre-development costs of an abandonedsite.
Other expenses remained stable at $2.1 million during 1999 and 1998.
Comparison of year ended December 31, 1998 to year ended December 31, 1997
Operating income before interest, depreciation and amortization increased $18.2 million, or 24.2%, to $93.6 million in1998 from $75.4 million in 1997. This increase was primarily the result of expansions and new center openings during1997 and 1998. Income from operations increased $6.0 million, or 17.1%, to $41.2 million in 1998 from $35.2 millionin 1997. Increased revenues from expansions and new center openings in 1997 and 1998 were offset by increasedinterest costs.
20
Base rentals increased $15.9 million, or 22.5%, to $86.6 million in 1998 from $70.7 million in 1997 due to expansions,new center openings in 1997 and 1998, one acquired center and higher average rents. Base rental revenue per weightedaverage square foot increased to $18.77 in 1998 from $17.97 in 1997 as a result of higher rental rates on new leases andrenewals .
Percentage rents increased $2.6 million, or 23.5%, to $13.4 million in 1998 from $10.8 million in 1997. The increasewas primarily due to a new center opening in 1997, increased tenant sales and a higher number of tenants contributingpercentage rents.
Expense reimbursements, representing contractual recoveries from tenants of certain common area maintenance,operating, real estate tax, promotional and management expenses, increased $6.3 million, or 21.9%, to $35.3 million in1998 from $29.0 million in 1997, due to the recovery of operating and maintenance costs from increased GLA. On aweighted average square foot basis, expense reimbursements increased 4.1% to $7.66 in 1998 from $7.36 in 1997. Theaverage recovery of reimbursable expenses was 91.3% in 1998 compared to 92.2% in 1997.
Other income increased $1.1 million to $4.0 million in 1998 from $2.9 million in 1997. The increase was due toincome from the agreement not to compete with the Mills Corporation in the Houston, Texas area and a $0.3 millionincrease in outparcel income during 1998.
Interest, in excess of amounts capitalized, increased $4.6 million to $20.0 million in 1998 from $15.4 million in 1997,due to higher debt balances from increased GLA in operation.
Operating and maintenance expenses increased $7.3 million, or 23.2%, to $38.7 million in 1998 from $31.4 million in1997. The increase was primarily due to costs related to increased GLA. On a weighted average square foot basis,operating and maintenance expenses increased 5.0% to $8.39 in 1998 from $7.99 in 1997 as a result of increased realestate tax and promotion costs.
Depreciation and amortization expense increased $7.5 million to $32.5 million in 1998 from $25.0 million in 1997.The increase was due to depreciation of expansions and new centers opened in 1997 and 1998.
General and administrative expenses increased $1.0 million to $4.8 million in 1998 from $3.8 million in 1997. On aweighted average square foot basis, general and administrative expenses increased 8.2% to $1.05 in 1998 from $0.97 in1997 primarily due to increased personnel, overhead costs and accrual for deferred compensation.
The loss on writedown of assets of $15.7 million in 1998 was attributable to the re-valuation of two centers held forsale at their estimated fair values and the write-off of pre-development costs of an abandoned site.
Other expenses decreased $0.4 million to $2.2 million in 1998 from $2.6 million in 1997. The decrease was primarilydue to recoveries of bad debts previously written off.
Liquidity and Capital Resources
The Company believes it has adequate financial resources to fund operating expenses, distributions, and planneddevelopment and construction activities over the short-term, which is less than 12 months and the long-term, which is12 months or more. Operating cash flow in 1999 of $87.6 million is expected to increase with a full year of operationsof the 340,000 square feet of GLA added during 1999 and scheduled openings of approximately 853,000 square feet in2000, which includes the Company’s 50% ownership share in Orlando Premium Outlets and 40% ownership share inGotemba Premium Outlets. The Company has adequate funding sources to complete and open all of its currentdevelopment projects through the use of available cash of $8.9 million; construction loans for the Orlando and Allenprojects up to a maximum borrowing of $82.5 million and $40.0 million, respectively; a yen-denominated line of credittotaling 4 billion yen (US $40 million) for the Company’s share of projects in Japan; and approximately $90 millionavailable under its Senior Credit Facility. Chelsea also has the ability to access the public markets through its $175million debt shelf registration and if current market conditions become favorable through its $200 million equity shelfregistration.
Operating cash flow is expected to provide sufficient funds for dividends and distributions in accordance with REITfederal income tax requirements. In addition, the Company anticipates retaining sufficient operating cash to fund re-tenanting and lease renewal tenant improvement costs, as well as capital expenditures to maintain the quality of itscenters.
21
Common distributions declared and recorded in 1999 were $55.2 million or $2.88 per share or unit. The Company’s1999 distribution payout ratio as a percentage of net income before minority interest, loss on writedown of assets anddepreciation and amortization, exclusive of amortization of deferred financing costs, (“FFO”) was 69%. The SeniorCredit Facility limits aggregate dividends and distributions to the lesser of (i) 90% of FFO on an annual basis or (ii)100% of FFO for any two consecutive quarters.
The Company’s ratio of earnings to fixed charges for each of the three years ended December 31, 1999, 1998 and1997 was 2.5, 2.3 and 2.4, respectively. For purposes of computing the ratio, earnings consist of income fromcontinuing operations after depreciation and before minority interest and fixed charges, exclusive of interestcapitalized and amortization of loan costs capitalized. Fixed charges consist of interest expense, including interestcosts capitalized, the portion of rent expense representative of interest and total amortization of debt issuance costsexpensed and capitalized.
On September 3, 1999, the OP completed a private sale of $65 million of Series B Cumulative RedeemablePreferred Units (“Preferred Units”) to an institutional investor. The private placement took the form of 1.3 millionPreferred Units at a stated value of $50 each. The Preferred Units may be called at par on or after September 3,2004, have no stated maturity or mandatory redemption and pay a cumulative quarterly dividend at an annualizedrate of 9.0%. The Preferred Units are not convertible to any other securities of the OP or Company. Proceeds fromthe sale were used to pay down borrowings under the Senior Credit Facility.
On March 30, 1998, the OP replaced its two unsecured bank revolving lines of credit, totaling $150 million (the“Credit Facilities”), with a new $160 million senior unsecured bank line of credit (the “Senior Credit Facility”). TheSenior Credit Facility expires on March 30, 2002 and the OP has an annual right to request a one-year extension ofthe Senior Credit Facility which may be granted at the option of the lenders. The OP has requested and expectsapproval to extend the Facility until March 30, 2003. The Facility bears interest on the outstanding balance, payablemonthly, at a rate equal to the London Interbank Offered Rate (“LIBOR”) plus 1.05% (7.24% at December 31,1999) or the prime rate, at the OP’s option. The LIBOR spread ranges from 0.85% to 1.25% depending on theOperating Partnership’s Senior Debt rating. A fee on the unused portion of the Senior Credit Facility is payablequarterly at rates ranging from 0.15% to 0.25% depending on the balance outstanding.
In November 1998, the OP obtained a $60 million term loan which expires April 2000 and bears interest on theoutstanding balance at a rate equal to LIBOR plus 1.40% (7.53% at December 31, 1999). Proceeds from the loanwere used to pay down borrowings under the Senior Credit Facility. The Company is currently exploring severalrefinancing alternatives including extension and payoff of this loan.
The Company is in the process of planning development for 2000 and beyond. At December 31, 1999, approximately424,000 square feet of the Company’s planned 2000 development was under construction including the 232,000 squarefoot first phase of Allen Premium Outlets (Allen, Texas – located on US Highway 75 approximately 30 miles north ofDallas), the 104,000 square foot third phase of Leesburg Corner and expansions totaling 88,000 square feet at two othercenters. These projects are under development and there can be no assurance that they will be completed or opened, orthat there will not be delays in opening or completion. Excluding separately financed joint venture projects, theCompany anticipates 2000 development and construction costs of $40 million to $50 million. Funding is currentlyexpected from borrowings under the Senior Credit Facility, additional debt offerings, and/or equity offerings, exceptAllen Premium Outlets. In February 2000, Chelsea Allen Development L.P., a subsidiary of the Company entered intoa $40 million construction loan agreement that is expected to fund approximately 75% of the costs of the Allen project.The loan, guaranteed by the OP, matures February 2003 and bears interest at LIBOR plus 1.625% .
Construction is also underway on Orlando Premium Outlets (“OPO”), a 430,000 square-foot upscale outlet centerlocated on Interstate 4 midway between Walt Disney World/EPCOT and Sea World in Orlando, Florida. OPO is ajoint venture project between the Company and Simon and is scheduled to open as a single phase in mid-2000. InFebruary 1999, the joint venture entered into a $82.5 million construction loan agreement that is expected to fundapproximately 75% of the costs of the project and as of December 31, 1999, $20.8 million was outstanding. Theloan which matures March 2002 and bears interest at LIBOR plus 1.50% is 50% guaranteed by each of theCompany and Simon.
In June 1999, the Company signed a definitive agreement with Mitsubishi Estate Co., Ltd. and Nissho IwaiCorporation to jointly develop, own and operate premium outlet centers in Japan. The joint venture, known asChelsea Japan Co., Ltd. (“Chelsea Japan”) intends to develop its initial project in the city of Gotemba. In
22
conjunction with the agreement, the Company contributed $1.7 million in equity. In addition, Chelsea InternationalOperating Corp., a subsidiary of the Company entered into a 4 billion yen (US $40 million) line of credit guaranteedby the Company and OP to fund its share of construction costs. The line of credit bears interest at yen LIBOR plus1.35% and matures April 2002. At December 31, 1999, no amounts were outstanding under the loan. In December1999, construction began on the 220,000 square-foot first phase of Gotemba Premium Outlets with openingscheduled for mid-2000. Gotemba is located on the Tomei Expressway, approximately 60 miles west of Tokyo andmidway between Mt. Fuji and the Hakone resort area. Subject to governmental and other approvals, Chelsea Japanalso expects to announce a project outside Osaka, the second-largest city in Japan, to open in late 2000.
The Company has minority interests ranging from 5 to 15% in several outlet centers and outlet development projectsin Europe. Two outlet centers, Bicester Village outside of London, England and La Roca Company Stores outsideof Barcelona, Spain, are currently open and operated by Value Retail PLC and its affiliates. Three new Europeanprojects and expansions of the two existing centers are in various stages of development and are expected to openwithin the next two years. The Company’s total investment in Europe as of February 2000 is approximately $4.5million. The Company has also agreed to provide up to $22 million in limited debt service guarantees under astandby facility for loans arranged by Value Retail PLC to construct outlet centers in Europe. The term of thestandby facility is three years and guarantees shall not be outstanding for longer than five years after projectcompletion. As of February 2000, the Company has provided limited debt service guarantees of approximately $20million for three projects.
The Company announced in October 1998 that it sold its interest in and terminated the development of HoustonPremium Outlets, a joint venture project with Simon. Under the terms of the agreement, the Company will receivenon-compete payments totaling $21.4 million from The Mills Corporation; $3.0 million was received at closing, andfour annual installments of $4.6 million will be received on each January 2, 1999 through 2002. The Company hasalso been reimbursed for its share of land costs, development costs and fees related to the project.
To achieve planned growth and favorable returns in both the short and long-term, the Company’s financing strategy isto maintain a strong, flexible financial position by: (i) maintaining a conservative level of leverage; (ii) extending andsequencing debt maturity dates; (iii) managing exposure to floating interest rates; and (iv) maintaining liquidity.Management believes these strategies will enable the Company to access a broad array of capital sources, includingbank or institutional borrowings and secured and unsecured debt and equity offerings, subject to market conditions.
Net cash provided by operating activities was $87.6 million and $78.7 million for the years ended December 31,1999 and 1998, respectively. The increase was primarily due to the growth of the Company’s GLA to 5.2 millionsquare feet in 1999 from 4.9 million square feet in 1998 and receipt of payment on a non-compete receivable. Netcash used in investing activities decreased $42.2 million for the year ended December 31, 1999 compared to thecorresponding 1998 period, as a result of decreased construction activity, proceeds from sale of a center and receiptof payment on a note receivable. For the year ended December 31, 1999, net cash provided by financing activitiesdecreased by $47.0 million primarily due to higher borrowings during 1998 offset in part by the sale of preferredunits in September 1999. Proceeds from the sale were used to repay borrowings under the Company’s Senior CreditFacility.
Net cash provided by operating activities was $78.7 million and $56.6 million for the years ended December 31,1998 and 1997, respectively. The increase was primarily due to the growth of the Company’s GLA to 4.9 millionsquare feet in 1998 from 4.3 million square feet in 1997. Net cash used in investing activities decreased $79.4million for the year ended December 31, 1998 compared to the corresponding 1997 period, primarily as a result ofthe Waikele Factory Outlets acquisition in March 1997. For the year ended December 31, 1998, net cash providedby financing activities decreased by $107.1 million primarily due to borrowings for the Waikele Factory Outletsacquisition and excess capital raised for development during 1997.
Year 2000 Compliance
In prior years, the Company discussed the nature and progress of its plans to become Year 2000 ready. In late 1999,the Company completed its remediation and testing of systems. As a result of those planning and implementationefforts, the Company experienced no significant disruptions in mission-critical information technology and non-information technology systems and believes those systems successfully responded to the Year 2000 date change.The Company expensed less than $100,000 during 1999 in connection with remediating its systems. The Company
23
is not aware of any material problems resulting from Year 2000 issues, either with its internal systems, or theproducts and services of third parties. The Company will continue to monitor its mission critical computerapplications and those of its suppliers and vendors throughout the year 2000 to ensure that any latent Year 2000matters that may arise are addressed promptly.
Funds from Operations
Management believes that funds from operations (“FFO”) should be considered in conjunction with net income, aspresented in the statements of operations included elsewhere herein, to facilitate a clearer understanding of theoperating results of the Company. The White Paper on Funds from Operations (“FFO”) approved by the Board ofGovernors of NAREIT in October 1999 defines FFO as net income (loss) (computed in accordance with GAAP),excluding gains (or losses) from debt restructuring and sales of properties, plus real estate related depreciation andamortization and after adjustments for unconsolidated partnerships and joint ventures. The Company believes thatFFO is helpful to investors as a measure of the performance of an equity REIT because, along with cash flow fromoperating activities, financing activities and investing activities, it provides investors with an indication of the abilityof the Company to incur and service debt, to make capital expenditures and to fund other cash needs. The Companycomputes FFO in accordance with the current standards established by NAREIT which may not be comparable toFFO reported by other REIT’s that do not define the term in accordance with the current NAREIT definition or thatinterpret the current NAREIT definition differently than the Company. FFO does not represent cash generated fromoperating activities in accordance with GAAP and should not be considered as an alternative to net income(determined in accordance with GAAP) as an indication of the Company’s financial performance or to cash flowfrom operating activities (determined in accordance with GAAP) as a measure of the Company’s liquidity, nor is itindicative of funds available to fund the Company’s cash needs, including its ability to make cash distributions.
Year Ended December 31,1999 1998
Income to common shareholders before extraordinary item................... $34,093 $17,445Add: Depreciation and amortization .................................................................. 39,716 32,486 Amortization of deferred financing costs and depreciation of non-rental real estate assets ................................................................. (1,849) (1,453) Loss on writedown of assets ...................................................................... 694 15,713 Minority interest.......................................................................................... 9,275 3,803 Preferred unit distribution .......................................................................... (1,949) -FFO ................................................................................................................. $79,980 $67,994Average shares/units outstanding ............................................................... 19,297 19,103Dividends declared per share....................................................................... $2.88 $2.76
Economic Conditions
Substantially all leases contain provisions, including escalations of base rents and percentage rentals calculated ongross sales, to mitigate the impact of inflation. Inflationary increases in common area maintenance and real estate taxexpenses are substantially all reimbursed by tenants.
Virtually all tenants have met their lease obligations and the Company continues to attract and retain quality tenants.The Company intends to reduce operating and leasing risks by continually improving its tenant mix, rental rates andlease terms, and by pursuing contracts with creditworthy upscale and national brand-name tenants.
24
Item 7-A. Quantitative and Qualitative Disclosures about Market Risk
The Company is exposed to changes in interest rates primarily from its floating rate debt arrangements. Under itscurrent policies, the Company does not use interest rate derivative instruments to manage exposure to interest ratechanges. A hypothetical 100 basis point adverse move (increase) in US Treasury and LIBOR rates would adverselyaffect the Company’s annual interest cost by approximately $1.3 million annually.
Following is a summary of the Company’s debt obligations at December 31, 1999 (in thousands):
Expected Maturity Date2000 2001 2002 2003 2004 Thereafter Total Fair Value
Item 8. Financial Statements and Supplementary Data
The financial statements and financial information of the Company for the years ended December 31, 1999, 1998 and1997 and the Report of the Independent Auditors thereon are included elsewhere herein. Reference is made to thefinancial statements and schedules in Item 14.
Item 9. Changes in and Disagreements with Accountants on Accounting and Financial Disclosure
None.
PART III
Items 10, 11, 12 and 13.
The required information in the following items will appear in the Company’s Proxy Statement furnished toshareholders in connection with the 2000 Annual Meeting, and is incorporated by reference in this Form 10-K AnnualReport.
Item 10. Directors and Executive Officers of the Registrant*
Item 11. Executive Compensation
Item 12. Security Ownership of Certain Beneficial Owners and Management
Item 13. Certain Relationships and Related Transactions
* Certain information regarding Directors and Officers is included at the end of Part I.
25
PART IV
Item 14. Exhibits, Financial Statement Schedules and Reports on Form 8-K
(a) 1 and 2. The response to this portion of Item 14 is submitted as a separate section of this report.
3. Exhibits
3.1 Articles of Incorporation of the Company, as amended, including Articles Supplementary relating to 8 3/8%Series A Cumulative Redeemable Preferred Stock and Articles Supplementary relating to 9% Series BCumulative Redeemable Preferred Stock.
3.2 By-laws of the Company. Incorporated by reference to Exhibit 3.2 to Registration Statement filed by theCompany on Form S-11 under the Securities Act of 1933 (file No. 33-67870) (S-11).
3.3 Agreement of Limited Partnership for the Operating Partnership. Incorporated by reference to Exhibit 3.3 toS-11.
3.4 Amendments No. 1 and No. 2 to Partnership Agreement dated March 31, 1997 and October 7, 1997.Incorporated by reference to Exhibit 3.4 to Form 10K for the year ended December 31, 1997.
3.5 Amendment No. 3 to Partnership Agreement dated September 3, 1999.
4.1 Form of Indenture among the Company, Chelsea GCA Realty Partnership, L.P., and State Street Bank andTrust Company, as Trustee. Incorporated by reference to Exhibit 4.4 to Registration Statement filed by theCompany on Form S-3 under the Securities Act of 1933 (File No. 33-98136).
10.1 Registration Rights Agreement among the Company and recipients of Units. Incorporated by reference toExhibit 4.1 to S-11.
10.2 Term Loan Agreement dated November 3, 1998 among Chelsea GCA Realty Partnership, L.P., BankBoston,N.A., individually and as an agent, and other Lending Institutions listed therein. Incorporated by reference toExhibit 10.2 to Form 10K for the year ended December 31, 1998 (“1998 10K”).
10.3 Credit Agreement dated March 30, 1998 among Chelsea GCA Realty Partnership, L.P., BankBoston, N.A,individually and as an agent, and other Lending Institutions listed therein. Incorporated by reference toExhibit 10.3 to 1998 10K.
10.4 Agreement dated October 23, 1998, among Chelsea GCA Realty Partnership, L.P., Chelsea GCA Realty,Inc., Simon Property Group, L.P., the Mills Corporation and related parties. Incorporated by reference toExhibit 10.4 to 1998 10K.
10.5 Limited Liability Company Agreement of Simon/Chelsea Development Co., L.L.C. dated May 16, 1997between Simon DeBartolo Group, L.P. and Chelsea GCA Realty Partnership, L.P. Incorporated by referenceto Exhibit 10.3 to Form 10K for the year ended December 31, 1997.
10.6 Subscription Agreement dated as of March 31, 1997 by and among Chelsea GCA Realty Partnership, L.P.,WCC Associates and KM Halawa Partners. Incorporated by reference to Exhibit 1 to current report on Form8-K reporting on an event which occurred March 31, 1997.
10.7 Stock Subscription Agreement dated May 16, 1997 between Chelsea GCA Realty, Inc. and Simon DeBartoloGroup, L.P. Incorporated by reference to Exhibit 10.5 to Form 10K for the year ended December 31, 1997.
26
PART IV
Item 14. Exhibits, Financial Statement Schedules and Reports on Form 8-K (continued)
10.8 Contribution Agreement by and among an institutional investor and Chelsea GCA Realty Partnership, L.P.and Chelsea GCA Realty, Inc. dated September 3, 1999.
10.9 Joint Venture Agreement among Chelsea GCA Realty Partnership, L.P., Mitsubishi Estate Co., Ltd. andNissho Iwai Corporation dated June 16, 1999.
23.1 Consent of Ernst & Young LLP.
(b) Reports on Form 8-K.None
(c) ExhibitsSee (a) 3
(d) Financial Statement Schedules - The response to this portion of Item 14 is submitted as a separate schedule of thisreport.
Item 8, Item 14(a)(1) and (2) and Item 14(d)
(a)1. Financial Statements
Form 10-K
Report PageConsolidated Financial Statements–Chelsea GCA Realty, Inc.
Report of Independent Auditors................................................................................................................. F-1Consolidated Balance Sheets as of December 31, 1999 and 1998....................................................... F-2Consolidated Statements of Income for the years ended December 31, 1999,
1998 and 1997........................................................................................................................................ F-3Consolidated Statements of Stockholders’ Equity for the years ended
December 31, 1999, 1998 and 1997.................................................................................................. F-4Consolidated Statements of Cash Flows for the years ended December 31, 1999,
1998 and 1997........................................................................................................................................ F-5Notes to Consolidated Financial Statements............................................................................................ F-6
(a)2 and (d) Financial Statement Schedule
Schedule III–Consolidated Real Estate and Accumulated Depreciation............................................. F-20
and F-21
All other schedules are omitted since the required information is not present or is not present in amountssufficient to require submission of the schedule, or because the information required is included in theconsolidated financial statements and notes thereto.
F-28
Report of Independent Auditors
Board of DirectorsChelsea GCA Realty, Inc.
We have audited the accompanying consolidated balance sheets of Chelsea GCA Realty, Inc. as of December 31,1999 and 1998, and the related consolidated statements of income, stockholders’ equity and cash flows for each ofthe three years in the period ended December 31, 1999. Our audits also included the financial statement schedulelisted in the Index as Item 14(a). These financial statements and schedule are the responsibility of the managementof Chelsea GCA Realty, Inc. Our responsibility is to express an opinion on the financial statements and schedulebased on our audits.
We conducted our audits in accordance with auditing standards generally accepted in the United States. Thosestandards require that we plan and perform the audit to obtain reasonable assurance about whether the financialstatements are free of material misstatement. An audit includes examining, on a test basis, evidence supporting theamounts and disclosures in the financial statements. An audit also includes assessing the accounting principles usedand significant estimates made by management, as well as evaluating the overall financial statement presentation.We believe that our audits provide a reasonable basis for our opinion.
In our opinion, the financial statements referred to above present fairly, in all material respects, the consolidatedfinancial position of Chelsea GCA Realty, Inc. as of December 31, 1999 and 1998, and the consolidated results of itsoperations and its cash flows for each of the three years in the period ended December 31, 1999, in conformity withaccounting principles generally accepted in the United States. Also, in our opinion, the related financial statementschedule, when considered in relation to the basic financial statements taken as a whole, presents fairly in allmaterial respects the information set forth therein.
Ernst & Young LLP
New York, New YorkFebruary 2, 2000
F-29
Chelsea GCA Realty, Inc.Consolidated Balance Sheets
Stockholders’ equity:8.375% series A cumulative redeemable preferred stock, $0.01 par value, authorized 1,000 shares, issued and outstanding 1,000 shares in 1999 and 1998 (aggregate liquidation preference $50,000)............................. 10 10Common stock, $0.01 par value, authorized 50,000 shares, issued and outstanding 15,932 in 1999 and 15,608 in 1998................... 159 156Paid-in-capital...................................................................................................... 347,725 339,490Distributions in excess of net income .............................................................. (70,598) (59,265)
Total stockholders’ equity 277,296 280,391Total liabilities and stockholders’ equity............................................................ $ 806,055 $ 773,352
The accompanying notes are an integral part of the financial statements.
F-30
Chelsea GCA Realty, Inc.Consolidated Statements of Income
Income before extraordinary item.................................. 38,281 21,633 28,560Extraordinary item–loss on early extinguishment of
debt, net of minority interest in the amount of$62 in 1998 and $48 in 1997................................... - (283) (204)
Net income ......................................................................... 38,281 21,350 28,356Preferred dividend requirement...................................... (4,188) (4,188) (907)
Net income to common shareholders ........................ $34,093 $17,162 $27,449
Earnings per shareBasic:Income per common share before extraordinary item $2.17 $1.13 $1.89Extraordinary item per common share.......................... - (0.02) (0.01)Net income per common share....................................... $2.17 $1.11 $1.88
Weighted average common shares outstanding.......... 15,742 15,440 14,605Diluted:Income per common share before extraordinary item $2.14 $1.12 $1.86Extraordinary item per common share.......................... - (0.02) (0.01)Net income per common share....................................... $2.14 $1.10 $1.85
Weighted average common shares outstanding.......... 15,908 15,672 14,866
The accompanying notes are an integral part of the financial statements.
F-31
Chelsea GCA Realty, Inc.Consolidated Statements of Stockholders’ Equity
(In thousands, except per share data)
PreferredStock At
CommonStock At Paid-in-
Distrib. inExcess of
TotalStockholders’
Par Value Par Value Capital Net Income Equity
Balance December 31, 1996............................................ $ - $124 $207,910 ($22,694) $185,340Net income ......................................................................... - - - 28,356 28,356Preferred dividend requirement...................................... - - - (907) (907)Cash distributions declared ($2.58 per common
share of which $0.49represented a return of capital forfederal income tax purposes).................................. - - - (38,475) (38,475)
Exercise of stock options................................................. - - 1,205 - 1,205Shares issued in exchange for units of the
Operating Partnership............................................... - 15 19,984 - 19,999Sales of stock (net of costs) ............................................ 10 14 98,382 - 98,406Shares issued through dividend
Net income ......................................................................... - - - 21,350 21,350Preferred dividend requirement...................................... - - - (4,188) (4,188)Cash distributions declared ($2.76 per common
share of which $0.30 representeda return of capital for federal incometax purposes).............................................................. - - - (42,707) (42,707)
Exercise of stock options................................................. - - 849 - 849Shares issued through dividend
Net income......................................................................... - - - 38,281 38,281Preferred dividend requirement................................. - - - (4,188) (4,188)Cash distributions declared ($2.88 per common
share of which $0.86 represented areturn of capital for federal incometax purposes)............................................................ - - - (45,426) (45,426)
Exercise of stock options ............................................... - - 1,286 - 1,286Shares issued through dividend
reinvestment program........................................... - 3 5,987 - 5,990Shares issued in exchange for units
of the Operating Partnership............................... - - 903 - 903Shares issued through Employee Stock Purchase
Plan (net of costs).................................................... - - 59 - 59
Balance December 31, 1999 ......................................... $10 $159 $347,725 ($70,598) $277,296
The accompanying notes are an integral part of the financial statements.
F-32
Chelsea GCA Realty, Inc.Consolidated Statements of Cash Flows
(In thousands)
Year ended December 31,1999 1998 1997
Cash flows from operating activitiesNet income ........................................................................................ $38,281 $21,350 $28,356Adjustments to reconcile net income to net cash provided by operating activities:
Depreciation and amortization .............................................. 39,716 32,486 24,995Minority interest in net income ............................................. 9,275 3,803 6,547Loss on writedown of assets .................................................. 694 15,713 -Proceeds from non-compete receivable ............................... 4,600 - -Amortization of non-compete revenue ................................ (5,136) (856) -Extraordinary loss on early extinguishment of debt.......... - 345 252Additions to deferred lease costs .......................................... (2,771) (3,178) (6,629)Other operating activities ....................................................... 511 460 319Changes in assets and liabilities:
Straight-line rent receivable................................................. (1,554) (1,900) (1,523) Other assets ............................................................................ (3,076) 1,094 287 Accounts payable and accrued expenses ......................... 7,050 9,414 3,990Net cash provided by operating activities ................................... 87,590 78,731 56,594
Cash flows from investing activitiesAdditions to rental properties ........................................................ (62,119) (116,339) (195,058)Additions to deferred development costs .................................... (753) (3,468) (2,237)Proceeds from sale of center.......................................................... 4,483 - -Loans to related parties................................................................... (2,213) - -Payments from related parties ....................................................... 4,500 - -Additions to investments in joint ventures .................................. (21,476) - -Other investing activities................................................................ - - (1,955)Net cash used in investing activities ............................................ (77,578) (119,807) (199,250)
Cash flows from financing activitiesNet proceeds from sale of preferred units ................................... 63,315 - -Net proceeds from sale of common stock................................... 7,335 8,287 54,951Net proceeds from sale of preferred stock................................... - - 48,406Distributions..................................................................................... (60,752) (56,366) (48,791)Debt proceeds ................................................................................. 49,000 154,000 261,710Repayments of debt......................................................................... (69,000) (68,000) (172,000)Additions to deferred financing costs .......................................... (679) (1,695) (855)Other financing activities ............................................................... - (57) (113)Net cash (used in) provided by financing activities................... (10,781) 36,169 143,308
Net (decrease) increase in cash and cash equivalents ............... (769) (4,907) 652Cash and cash equivalents, beginning of period ........................ 9,631 14,538 13,886Cash and cash equivalents, end of period.................................... $8,862 $9,631 $14,538
The accompanying notes are an integral part of the financial statements.
F-33
Notes to Financial Statements
1. Organization and Basis of Presentation
Organization
Chelsea GCA Realty, Inc. (the “Company”) is engaged in the development, ownership, acquisition and operation ofmanufacturers’ outlet centers. As of December 31, 1999 the Company operated 19 manufacturers’ outlet centers in11 states. The Company is a self-administered and self-managed real estate investment trust (“REIT”). TheCompany is the sole general partner in Chelsea GCA Realty Partnership, L.P. (the “Operating Partnership” or
Basis of Presentation
All of the Company’s assets are held by, and all of its operations conducted through, the Operating Partnership. Dueto the Company’s ability, as the sole general partner, to exercise financial and operational control over the OperatingPartnership, the Operating Partnership is consolidated in the accompanying financial statements. All significantintercompany transactions and accounts have been eliminated in consolidation. The Company accounts for its non-controlling investments under the equity method. Such investments are included in other assets in the financialstatements.
Disclosure about fair value of financial instruments is based on pertinent information available to management as ofDecember 31, 1999 and 1998 using available market information and appropriate valuation methodologies.Although management is not aware of any factors that would significantly affect the reasonable fair value amounts,such amounts have not been comprehensively revalued for purposes of these financial statements since that date andcurrent estimates of fair value may differ significantly from the amounts presented herein.
2. Summary of Significant Accounting Principles
Rental Properties
Rental properties are presented at cost net of accumulated depreciation. Depreciation is computed on the straight-line basis over the estimated useful lives of the assets. The Company uses 25-40 year estimated lives for buildings,and 15- and 5-7 year estimated lives for improvements and equipment, respectively. Expenditures for ordinarymaintenance and repairs are charged to operations as incurred, while significant renovations and enhancements thatimprove and/or extend the useful life of an asset are capitalized and depreciated over the estimated useful life.Statement of Financial Accounting Standards No. 121 (“SFAS No. 121”), Accounting for the Impairment of Long-Lived Assets and for Long-Lived Assets to be Disposed Of, requires that the Company review real estate assets forimpairment wherever events or changes in circumstances indicate that the carrying value of assets to be held andused may not be recoverable. Impaired assets are reported at the lower of cost or fair value. Assets to be disposedof are reported at the lower of cost or fair value less cost to sell.
Gains and losses from sales of real estate are recorded when title is conveyed to the buyer, subject to the buyer’sfinancial commitment being sufficient to provide economic substance to the sale.
Cash and Equivalents
All demand and money market accounts and certificates of deposit with original terms of three months or less fromthe date of purchase are considered cash equivalents. At December 31, 1999 and 1998 cash equivalents consisted ofrepurchase agreements which were held by one financial institution, commercial paper and “U.S.” Governmentagency securities which matured in January of the following year. The carrying amount of such investmentsapproximated fair value.
F-34
Notes to Financial Statements (continued)
2. Summary of Significant Accounting Principles (continued)
Development Costs
Development costs, including interest, taxes, insurance and other costs incurred in developing new properties, arecapitalized. Upon completion of construction, development costs are amortized on a straight-line basis over theuseful lives of the respective assets.
Capitalized Interest
Interest, including the amortization of deferred financing costs for borrowings used to fund development andconstruction, is capitalized as construction in progress and allocated to individual property costs.
Foreign Currency Translation
The Company conforms to the requirements of the Statement of Financial Accounting Standards No. 52 (SFAS 52)entitled “Foreign Currency Translation.” Accordingly, assets and liabilities of foreign equity investees are translatedat prevailing year-end rates of exchange. Gains and losses related to foreign currency were not material for the threeyear period ending December 31, 1999.
Rental Expense
Rental expense is recognized on a straight-line basis over the initial term of the lease.
Deferred Lease Costs
Deferred lease costs consist of fees and direct costs incurred to initiate and renew operating leases, and areamortized on a straight-line basis over the initial lease term or renewal period as appropriate.
Deferred Financing Costs
Deferred financing costs are amortized as interest costs on a straight-line basis over the terms of the respectiveagreements. Unamortized deferred financing costs are expensed when the associated debt is retired before maturity.
Revenue Recognition
Leases with tenants are accounted for as operating leases. Base rent revenue is recognized on a straight-line basisover the lease term according to the provisions of the lease. Due and unpaid rents are included in other assets in theaccompanying balance sheet. Certain lease agreements contain provisions for rents which are calculated on apercentage of sales and recorded on the accrual basis. These rents are accrued monthly once the required thresholdsper the lease agreement are exceeded. Virtually all lease agreements contain provisions for additional rentsrepresenting reimbursement of real estate taxes, insurance, advertising and common area maintenance costs.
Bad Debt Expense
Bad debt expense included in other expense totaled $0.8 million, $0.6 million and $0.8 million for the years endedDecember 31, 1999, 1998 and 1997, respectively. The allowance for doubtful accounts included in other assetstotaled $1.0 million and $1.1 million at December 31, 1999 and 1998, respectively.
F-35
Notes to Financial Statements (continued)
2. Summary of Significant Accounting Principles (continued)
Income Taxes
The Company is taxed as a REIT under Section 856(c) of the Internal Revenue Code of 1986, as amended,commencing with the tax year ended December 31, 1993. As a REIT, the Company generally is not subject tofederal income tax. To maintain qualification as a REIT, the Company must distribute at least 95% of its REITtaxable income to its stockholders and meet certain other requirements. If the Company fails to qualify as a REIT inany taxable year, the Company will be subject to federal income tax on its taxable income at regular corporate rates.The Company may also be subject to certain state and local taxes on its income and property. Under certaincircumstances, federal income and excise taxes may be due on its undistributed taxable income. At December 31,1999 and 1998, the Company was in compliance with all REIT requirements and was not subject to federal incometaxes.
Net Income Per Common Share
In 1997, the Financial Accounting Standards Board issued Statement No. 128, Earnings per Share. Statement 128replaced the calculation of primary and fully diluted earnings per share with basic and diluted earnings per share.Unlike primary earnings per share, basic earnings per share excludes any dilutive effects of options, warrants andconvertible securities. Diluted earnings per share is very similar to the previously reported fully diluted earnings pershare.
Basic earnings per common share is computed using the weighted average number of shares outstanding. Dilutedearnings per common share is computed using the weighted average number of shares outstanding adjusted for theincremental shares attributed to outstanding options to purchase common stock of 0.2 million in 1999 and 1998 and0.3 million in 1997, respectively.
The following table sets forth the computation of basic and diluted earnings per share for the periods indicated:
(In thousands, except per share amounts) 1999 1998 1997NumeratorNumerator for basic and diluted earnings per share - net income to common shareholders ............................... $34,093 $17,162 $27,449
DenominatorDenominator for basic earnings per share – weighted average shares...................................................................... 15,742 15,440 14,605Effect of dilutive securities: Stock options ....................................................................... 166 232 261Denominator for diluted earnings per share – adjusted weighted-average shares and assumed conversions...... 15,908 15,672 14,866Per share amounts:
Net income – basic .............................................................. $2.17 $1.11 $1.88
Net income – diluted........................................................... $2.14 $1.10 $1.85
Stock Option Plan
The Company follows Accounting Principles Board Opinion No. 25 (Accounting for Stock Issued to Employees)and the related interpretations in accounting for its employee stock options. In accordance with SFAS No. 123(Accounting for Stock-Based Compensation), the Company has provided the required footnote disclosure for thecompensation expense related to the fair value of the outstanding stock options.
F-36
Notes to Financial Statements (continued)
2. Summary of Significant Accounting Principles (continued)
Concentration of Company’s Revenue and Credit Risk
Approximately 34%, 35% and 34% of the Company’s revenues for the years ended December 31, 1999, 1998 and1997, respectively, were derived from the Company’s two centers with the highest revenues, Woodbury Commonand Desert Hills. The loss of either center or a material decrease in revenues from either center for any reason mayhave a material adverse effect on the Company. In addition, approximately 30%, 34% and 38% of the Company’srevenues for the years ended December 31, 1999, 1998 and 1997, respectively, were derived from the Company’scenters in California, which includes Desert Hills.
Management of the Company performs ongoing credit evaluations of its tenants and requires certain tenants toprovide security deposits. Although the Company’s tenants operate principally in the retail industry, there is nodependence upon any single tenant.
Use of Estimates
The preparation of financial statements in conformity with accounting principles generally accepted in the UnitedStates requires management to make estimates and assumptions that affect the amounts reported in the financialstatements and accompanying notes. Actual results could differ from those estimates.
Minority Interest
Minority interest is comprised of the following:
• The common unitholders’ interest in the OP which was issued in exchange for the assets contributed to theOP on November 2, 1993 and additional units exchanged for property acquisitions during 1997. Theunitholders’ interest at December 31, 1999 and 1998 was 17.4% and 18.0% (3,357 units and 3,429 units),respectively. Common shares are reserved for the potential conversion of the units. Units may beexchanged for shares of the Company’s common stock on a one for one basis. Upon exchange, shares arevalued at the book value of the units on the date of the exchange. During the years ended December 31,1999, 1998 and 1997, the Company made the following distributions per unit:
1999 1998 1997Distributions per unit $2.88 $2.76 $2.58Return of capital (0.86) (0.30) (0.49)Ordinary income $2.02 $2.46 $2.09
• The preferred unitholder’s interest in the OP issued in a private sale of $65 million of Series B CumulativeRedeemable Preferred Units to an institutional investor in September 1999.
• Through June 30, 1997, the Company was the sole general partner and had a 50% interest in SolvangDesigner Outlets (“Solvang”), a limited partnership. Accordingly, the accounts of Solvang were includedin the consolidated financial statements of the Company. On June 30, 1997, the Company acquired theremaining 50% interest in Solvang. Solvang is not material to the operations or financial position.
F-37
Notes to Financial Statements (continued)
2. Summary of Significant Accounting Principles (continued)
Segment Information
Effective January 1, 1998, the Company adopted the Financial Accounting Standards Board’s Statement ofFinancial Accounting Standards No. 131, Disclosures about Segments of an Enterprise and Related Information(“Statement 131”). Statement 131 superseded FASB Statement No. 14, Financial Reporting for Segments of aBusiness Enterprise. Statement 131 establishes standards for the way that public business enterprises reportinformation about operating segments in annual financial statements and requires that those enterprises reportselected information about operating segments in interim financial reports. Statement 131 also establishes standardsfor related disclosures about products and services, geographic areas, and major customers. The adoption ofStatement 131 did not affect results of operations, financial position or disclosure of segment information as theCompany is engaged in the development, ownership, acquisition and operation of manufacturers’ outlet centers andhas one reportable segment, retail real estate. The Company evaluates real estate performance and allocatesresources based on net operating income and weighted average sales per square foot. The primary sources ofrevenue are generated from tenant base rents, percentage rents and reimbursement revenue. Operating expensesprimarily consist of common area maintenance, real estate taxes and promotional expenses. The retail real estatebusiness segment meets the quantitative threshold for determining reportable segments. The Company’s investmentin foreign operations is not material to the consolidated financial statements.
Comprehensive Income
In 1997, the FASB issued Statement No. 130, “Reporting Comprehensive Income” (“Statement 130”) which iseffective of fiscal years beginning after December 15, 1997. Statement 130 established standards for reportingcomprehensive income and its components in a full set of general-purpose financial statements. Statement 130requires that all components of comprehensive income be reported in a financial statement that is displayed with thesame prominence as other financial statements. The adoption of this standard had no impact on the Company’sfinancial position or results of operations.
Recently Issued Accounting Pronouncements
In June 1998, the Financial Accounting Standards Board issued Statement No. 133, Accounting for DerivativeInstruments and Hedging Activities (as amended by FASB Statement No. 137), which is required to be adopted inyears beginning after June 15, 2000. Statement 133 permits early adoption as of the beginning of any fiscal quarterafter its issuance. The Company expects to adopt the new Statement effective January 1, 2001. The Statement willrequire the Company to recognize all derivatives on the balance sheet at fair value. Derivatives that are not hedgesmust be adjusted to fair value through income. If a derivative is a hedge, depending on the nature of the hedge,changes in the fair value of the derivative will either be offset against the change in fair value of the hedged asset,liability, or firm commitment through earnings, or recognized in other comprehensive income until the hedged itemis recognized in earnings. The ineffective portion of a derivative’s change in fair value will be immediatelyrecognized in earnings. The Company does not anticipate that the adoption of the Statement will have a significanteffect on its results of operations or financial position.
In December 1999, the SEC staff issued Staff Accounting Bulletin 101 (“SAB 101”), Revenue Recognition. SAB101 discusses the SEC staff views on certain revenue recognition transactions. The Company is required to adoptSAB 101 no later than the second quarter of 2000 and any change in accounting would be recognized as acumulative effect of a change in accounting principle as of January 1, 2000. The Company does not anticipate thatthe adoption of the SAB will have a material effect of its results of operations or financial position.
Notes to Financial Statements (continued)
3. Rental Properties
The following summarizes the carrying values of rental properties as of December 31 (in thousands):
1999 1998
F-38
Land and improvements ................................................... $266,441 $245,814Buildings and improvements ........................................... 552,240 512,080Construction-in-process.................................................... 19,288 25,534Equipment and furniture ................................................... 10,844 9,298Total rental property.......................................................... 848,813 792,726Accumulated depreciation and amortization................. (138,221) (102,851)Total rental property, net .................................................. $710,592 $689,875
Interest costs capitalized as part of buildings and improvements were $3.1 million, $5.2 million and $4.8 million forthe years ended December 31, 1999, 1998 and 1997, respectively.
Commitments for land, new construction, development, and acquisitions, excluding separately financed jointventure activity, totaled approximately $6.2 million at December 31, 1999.
Depreciation expense (including amortization of the capital lease) amounted to $35.6 million, $29.2 million and$22.3 million for the years ended December 31, 1999, 1998 and 1997, respectively.
4. Waikele Acquisition
Pursuant to a Subscription Agreement dated as of March 31, 1997, the Company acquired Waikele Factory Outlets,a manufacturers’ outlet shopping center located in Hawaii. The consideration paid by the Company consisted of theassumption of $70.7 million of indebtedness outstanding with respect to the property (which indebtedness wasrepaid in full by the Company immediately after the closing) and the issuance of special partnership units in theOperating Partnership, having a fair market value of $0.5 million. Immediately after the closing, the Company paida special cash distribution of $5.0 million on the special units. The cash used by the Company in the transaction wasobtained through borrowings under the Company’s Credit Facilities.
The following condensed pro forma (unaudited) information assumes the acquisition had occurred on January 1,1997:
1997
Total revenue............................................................... $115,349
Income to common shareholders before extraordinary items ...............................................
28,137
Net income to common shareholders...................... 27,933
Earnings per share:Basic: Income before extraordinary items .................... $1.93 Net income ............................................................. $1.91
Diluted: Income before extraordinary items .................... $1.89 Net income ............................................................. $1.88
F-39
Notes to Financial Statements (continued)
5. Deferred Costs
The following summarizes the carrying amounts for deferred costs as of December 31 (in thousands):
As of December 31, 1999, properties held for sale represented the fair value, less estimated costs to sell, of SolvangDesigner Outlets (“Solvang”). As of December 31, 1998, Lawrence Riverfront Plaza was also included in propertiesheld for sale; the property was sold on March 26, 1999.
During the second quarter of 1998, the Company accepted an offer to purchase Solvang, a 51,000 square foot centerin Solvang, California, for a net selling price of $5.6 million. The center had a book value of $10.5 million,resulting in a writedown of $4.9 million in the second quarter of 1998. During the fourth quarter of 1998, the initialpurchase offer was withdrawn and the Company received another offer for a net selling price of $4.0 million,requiring a further writedown of $1.6 million. In January 2000, the center was sold for a net selling price of $3.3million resulting in an additional writedown of $0.7 million recognized in the fourth quarter of 1999. For the yearsended December 31, 1999 and 1998, Solvang accounted for less than 1% of the Company’s revenues and netoperating income.
Management decided to sell these two properties during 1998 as part of the Company’s long-term objective ofdevoting resources to and focusing on productive properties. Management determined that the time and effortnecessary to support these two underperforming centers was not worth the economic benefit to the Company.Management also concluded that these centers would be more useful as office and/or residential space, which areoutside the Company’s area of expertise.
7. Non-Compete Agreement
In October 1998, the Company signed a definitive agreement to terminate the development of Houston PremiumOutlets, a joint venture project with Simon Property Group, Inc. (“Simon”). Under the terms of the agreement, theCompany withdrew from the Houston development partnership and agreed to certain restrictions on competing inthe Houston market through 2002. The Company will receive non-compete payments totaling $21.4 million fromThe Mills Corporation; $3.0 million was received at closing, the first of four annual installments of $4.6 million wasreceived in January 1999 and the remaining installments are to be received on each January 2, through 2002. TheCompany has also been reimbursed for its share of land costs, development costs and fees related to the project. Therevenue is being recognized on a straight-line basis over the term of the non-compete agreement and the Companyrecognized income of $5.1 million and $0.9 million during the years ended December 31, 1999 and 1998,respectively. Such amounts are included in other income.
F-40
Notes to Financial Statements (continued)
8. Debt
On March 30, 1998, the OP replaced its two unsecured bank revolving lines of credit, totaling $150 million (the“Credit Facilities”), with a $160 million senior unsecured bank line of credit (the “Senior Credit Facility”). TheSenior Credit Facility expires on March 30, 2001 and the OP has an annual right to request a one-year extension ofthe Senior Credit Facility which may be granted at the option of the lenders. The OP has requested and expectsapproval to extend the Facility until March 30, 2003. The Facility bears interest on the outstanding balance, payablemonthly, at a rate equal to the London Interbank Offered Rate (“LIBOR”) plus 1.05% (7.24% at December 31,1999) or the prime rate, at the OP’s option. The LIBOR rate spread ranges from 0.85% to 1.25% depending on theCompany’s Senior Debt rating. A fee on the unused portion of the Senior Credit Facility is payable quarterly atrates ranging from 0.15% to 0.25% depending on the balance outstanding. At December 31, 1999, $94 million wasavailable under the Senior Credit Facility.
Also on March 30, 1998, the OP entered into a $5 million term loan (the “Term Loan”) which carries the sameinterest rate and maturity as the Senior Credit Facility. The Lender has credit committee approval to extend theTerm Loan to March 30, 2003.
In November 1998, the OP obtained a $60 million term loan that expires April 2000 and bears interest on theoutstanding balance at a rate equal to LIBOR plus 1.40% (7.53% at December 31, 1999). Proceeds from the loanwere used to pay down borrowings under the Senior Credit Facility. The Company is currently exploring severalalternatives regarding refinancing or payoff of this loan.
In January 1996, the OP completed a $100 million offering of 7.75% unsecured term notes due January 2001 (the“7.75% Notes”), which are guaranteed by the Company. The five-year non-callable 7.75% Notes were priced toyield 7.85% to investors. At December 31, 1999, in the opinion of management, the 7.75% Notes approximated fairvalue.
In October 1997, the Company’s OP completed a $125 million debt offering of 7.25% unsecured term notes dueOctober 2007 (the “7.25% Notes”). The 7.25% Notes were priced to yield 7.29% to investors, 120 basis points overthe 10-year U.S. Treasury rate. At December 31, 1999, in the opinion of management, the fair value of the 7.25%Notes was approximately $113 million.
Interest paid, excluding amounts capitalized, was $24.1 million, $19.8 million and $14.1 million for the years endedDecember 31, 1999, 1998 and 1997, respectively.
9. Preferred Units
On September 3, 1999, the OP completed a private sale of $65 million of Series B Cumulative RedeemablePreferred Units (“Preferred Units”) to an institutional investor. The private placement took the form of 1.3 millionPreferred Units at a stated value of $50 each. The Preferred Units may be called at par on or after September 3,2004, have no stated maturity or mandatory redemption and pay a cumulative quarterly dividend at an annualizedrate of 9.0%. The Preferred Units are exchangeable into Series B Cumulative Redeemable Preferred Stock of theCompany after ten years. The proceeds from the sale were used to pay down borrowings under the Senior CreditFacility. Activity related to the Preferred Units is included in Minority Interest.
10. Preferred Stock
In October 1997, the Company issued 1.0 million shares of nonvoting 8.375% Series A Cumulative RedeemablePreferred Stock (the “Preferred Stock”), par value $0.01 per share, having a liquidation preference of $50.00 pershare. The Preferred Stock has no stated maturity and is not convertible into any other securities of the Company.The Preferred Stock is redeemable on or after October 15, 2027 at the Company’s option. Net proceeds from theoffering were used to repay borrowings under the Company’s Credit Facilities.
F-41
Notes to Financial Statements (continued)
11. Lease Agreements
The Company is the lessor and sub-lessor of retail stores under operating leases with term expiration dates rangingfrom 2000 to 2018. Most leases are renewable for five years after expiration of the initial term at the lessee’s option.Future minimum lease receipts under non-cancelable operating leases as of December 31, 1999, exclusive ofrenewal option periods, were as follows (in thousands):
In 1987, a Predecessor partnership entered into a lease agreement for property in California. Land was estimated tobe approximately 37% of the fair market value of the property, and accordinglythe portion of the lease attributed toland is classified as an operating lease.The portion attributed to building is classified as a capital lease as the presentvalue of payments related to the building exceeded 90% of its fair value at inception of the lease. The initial leaseterm is 25 years with two options of 5 and 4 1/2 years, respectively. The lease provides for additional rent based onspecific levels of income generated by the property. No additional rental payments were incurred during 1999, 1998or 1997. The Company has the option to cancel the lease upon six months written notice and six months advancepayment of the then fixed monthly rent. If the lease is canceled, the building and leasehold improvements revert tothe lessor. In August 1999, the Company amended its capital lease resulting in a writedown of the asset andobligation of $2.7 million and $6.0 million, respectively. The difference of $3.3 million will be recognized on astraight-line basis over the remaining term of the amended lease which ends December 2004.
Operating Leases
Future minimum rental payments under operating leases for land and administrative offices as of December 31,1999 were as follows (in thousands):
Future minimum payments under the capitalized building lease, including the present value of net minimum leasepayments as of December 31, 1999 are as follows (in thousands):
2000............................................................................................................... $8192001............................................................................................................... 8192002............................................................................................................... 8192003............................................................................................................... 8192004............................................................................................................... 819Total minimum lease payments ................................................................ 4,095Amount representing interest.................................................................... (862)Present value of net minimum capital lease payments ......................... $3,233
12. Commitments and Contingencies
The Company has agreed under a standby facility to provide up to $22 million in limited debt service guarantees forloans provided to Value Retail PLC, an affiliate, to construct outlet centers in Europe. The term of the standbyfacility is three years and guarantees shall not be outstanding for longer than five years after project completion. Asof December 31, 1999, the Company has provided guarantees of approximately $20 million for three projects.
In June 1999, the Company signed a definitive agreement with Mitsubishi Estate Co., Ltd. and Nissho IwaiCorporation to jointly develop, own and operate premium outlet centers in Japan. The joint venture, known asChelsea Japan Co., Ltd. (“Chelsea Japan”) intends to develop its initial project in the city of Gotemba,approximately 60 miles west of Tokyo. Groundbreaking for the 220,000 square-foot first phase took place inNovember 1999, with opening scheduled for mid-2000. In conjunction with the agreement, the Companycontributed $1.7 million in equity. In addition, an equity investee of the Company entered into a 4 billion yen (US$40 million) line of credit guaranteed by the Company and OP to fund its share of construction costs. At December31, 1999, no amounts were outstanding under the loan.
Construction is underway on Orlando Premium Outlets (“OPO”), a 430,000 square foot 50/50 joint venture projectbetween the Company and Simon. OPO is located on Interstate 4, midway between Walt Disney World/EPCOT andSea World in Orlando, Florida and is scheduled to open mid-2000. In February 1999, the joint venture entered intoa $82.5 million construction loan agreement that is expected to fund approximately 75% of the costs of the project.The loan is 50% guaranteed by each of the Company and Simon and as of December 31, 1999, $20.8 million wasoutstanding.
The Company is not presently involved in any material litigation nor, to its knowledge, is any material litigationthreatened against the Company or its properties, other than routine litigation arising in the ordinary course ofbusiness. Management believes the costs, if any, incurred by the Company related to any of this litigation will notmaterially affect the financial position, operating results or liquidity of the Company.
13. Related Party Information
During the second quarter of 1999, the OP established a $6 million secured loan facility for the benefit of certainunitholders. At December 31, 1999, loans made to two unitholders totaled $2.2 million. Each unitholder issued anote that is secured by OP units, bears interest at a rate of LIBOR plus 200 basis points per annum, payablequarterly, and is due June 2004. The carrying amount of such loans approximated fair value at December 31, 1999.
In September 1995, the Company transferred property with a book value of $4.8 million to its former President (acurrent unitholder) in exchange for a $4.0 million note secured by units in the Operating Partnership (the “SecuredNote”) and an $0.8 million unsecured note receivable (the “Unsecured Note”). In January 1999, the Companyreceived $4.5 million as payment in full for the two notes. The remaining $0.3 million write-off was recognized inDecember 1998.
F-43
Notes to Financial Statements (continued)
13. Related Party Information (continued)
On June 30, 1997 the Company forgave a $3.3 million related party note and paid $2.4 million in cash to acquire theremaining 50% interest in Solvang. The Company also collected $0.8 million in accrued interest on the note.
The Company had space leased to related parties of approximately 56,000 square feet during the years endedDecember 31, 1999 and 1998 and 61,000 square feet during the year ended December 31, 1997. Rental incomefrom those tenants, including reimbursement for taxes, common area maintenance and advertising, totaled $1.8million during the years ended December 31, 1999 and 1998 and $1.5 million during the year ended December 31,1997.
At December 31, 1999 the Company had a receivable from an equity investee of $4.0 million that is included inother assets. In January 2000 the Company received payment of $3.0 million on this receivable.
The Company had a consulting agreement with one of its directors from August 1998 through December 31, 1999.The agreement called for monthly payments of $10,000.
Certain Directors and unitholders guarantee Company obligations, which existed prior to the formation of theCompany, under leases for one of the properties. The Company has indemnified these parties from and against anyliability which they may incur pursuant to these guarantees.
14. Dividend Reinvestment Plan
Shareholders who own at least 100 shares of the Company’s common stock are eligible to reinvest dividendsquarterly. Administration costs associated with the plan are paid by the Company.
15. Stock Option Plan
The Company elected Accounting Principles Board Opinion No. 25, Accounting for Stock Issued to Employees(“APB No. 25”) and related Interpretations in accounting for its employee stock options. Under APB No. 25, nocompensation expense is recognized because the exercise price of the Company’s employee stock options equals themarket price of the underlying stock on the date of grant. The alternative fair value accounting provided for underSFAS No. 123, “Accounting for Stock-Based Compensation,” is not applicable because it requires use of optionvaluation models that were not developed for use in valuing employee stock options.
The Company’s 1993 Stock Option Plan provides for an aggregate of 1.4 million authorized shares reserved forissuance. The exercise price per share of initial grants of non-qualified options will be fixed by the CompensationCommittee on the date of grant. The exercise price per share of incentive stock options will not be less than the fairmarket value of the common stock on the date of grant, except in the case of incentive stock options granted toindividuals owning more than 10% of the total voting shares of the Company. Their exercise price will be at least110% of the fair market value at the date of grant. Non-qualified and incentive stock options are exercisable for aperiod of ten years from the date of grant. On the first anniversary of the grant date, 20% of the options may beexercised and an additional 20% may be exercised on or after each of the second through fifth anniversaries.
Pro forma information regarding net income and earnings per share is required by SFAS No. 123, and has beendetermined as if the Company had accounted for its employee stock options under the fair value method. The fairvalue for these options was estimated at the date of grant using a Black-Scholes option pricing model with thefollowing weighted-average assumptions for 1998 and 1997, respectively: risk-free interest rate of 6.00% anddividend yield of 8% for both years; volatility factor of the expected market price of the Company’s common stockbased on historical results of 0.164 and 0.174; and an expected life of the option of four years. The Companygranted no options during 1999.
F-44
Notes to Financial Statements (continued)
15. Stock Option Plan (continued)
The Black-Scholes option valuation model was developed for use in estimating the fair value of traded options thathave no vesting restrictions and are fully transferable. In addition, option valuation models require the input ofhighly subjective assumptions including expected stock price volatility. Because the Company’s employee stockoptions have characteristics significantly different from those of traded options, and changes in the subjective inputassumptions can materially affect the fair value estimate, management believes the existing models do notnecessarily provide a reliable single measure of the fair value of its employee stock options
For purposes of pro forma disclosures, the estimated fair value of the options is amortized to expense over theoptions’ vesting period. The Company’s pro forma information follows (in thousands except for earnings per shareinformation):
1999 1998 1997
Pro forma net income $33,853 $16,884 $27,318Pro forma earnings per share: Basic 2.15 1.09 1.87 Diluted 2.13 1.08 1.84
A summary of the Company’s stock option activity, and related information for the years ended December 31follows:
Outstanding end of year 829.8 $26.16 1,061.6 $28.97 1,009.2 $29.26
Exercisable at end of year 380.8 $24.97 540.2 $25.36 695.2 $26.35
Weighted average fair value of options granted during the year $2.65 $2.35 -
Exercise prices for options outstanding as of December 31, 1999 ranged from $23.38 to $38.69 per share. Theweighted average remaining contractual life of the options was 6.1 years.
16. Employee Stock Purchase Plan
The Company’s Board of Directors and shareholders approved an Employee Stock Purchase Plan (the “PurchasePlan”), effective July 1, 1998. The Purchase Plan covers an aggregate of 500,000 shares of common stock. Eligibleemployees have been in the employ of the Company or a participating subsidiary for five months or more andcustomarily work more than 20 hours per week. The Purchase Plan excludes employees who are “highlycompensated employees” or own 5% or more of the voting power of the Company’s stock. Eligible employees willpurchase shares through automatic payroll deductions up to a maximum of 10% of weekly base pay. The PurchasePlan will be implemented by consecutive three-month offerings (each an “Option Period”). The price at whichshares may be purchased shall be the lower of (a) 85% of the fair market value of the stock on the first day of theOption Period or (b) 85% of the fair market value of the stock on the last day of the Option Period. As of December31, 1999, 48 employees were enrolled in the Purchase Plan and $1,300 expense has been incurred and is included inthe financial statements. The Purchase Plan will terminate after five years unless terminated earlier by the Board ofDirectors.
F-45
Notes to Financial Statements (continued)
17. 401(k) Plan
The Company maintains a defined contribution 401(k) savings plan (the “Plan”), which was established to alloweligible employees to make tax-deferred contributions through voluntary payroll withholdings. All employees of theCompany are eligible to participate in the Plan after completing one year of service and attaining age 21.Employees who elect to enroll in the Plan may elect to have from 1% to 15% of their pre-tax gross pay contributedto their account each pay period. As of January 1, 1998 the Plan was amended to include an employer discretionarymatching contribution in an amount not to exceed 100% of each participant’s first 6% of yearly compensation to thePlan. Matching contributions of approximately $97,000 in 1999 and $150,000 in 1998 are included in theCompany’s general and administrative expense.
18. Extraordinary Item
Deferred financing costs of $0.3 million (net of minority interest of $62,000), and $0.2 million (net of minorityinterest of $48,000) for the years ended December 31, 1998 and 1997, respectively, were expensed as a result ofearly debt extinguishments, and are reflected in the accompanying financial statements as an extraordinary item.
19. Quarterly Financial Information (Unaudited)
The following summary represents the results of operations, expressed in thousands except per share amounts, foreach quarter during 1999 and 1998:
March 31 June 30 September 30 December 311999Base rental revenue.................................................. $24,555 $24,580 $24,687 $25,016Total revenues .......................................................... 36,963 38,880 40,384 46,699Income before extraordinary item to common shareholders........................................ 7,380 7,671 8,540 10,502Net income to common shareholders ................... 7,380 7,671 8,540 10,502Income before extraordinary item per weighted average common share (diluted).... $0.47 $0.48 $0.53 $0.66Net income per weighted average common share (diluted)..................................... $0.47 $0.48 $0.53 $0.661998Base rental revenue.................................................. $19,266 $20,815 $22,561 $23,950Total revenues .......................................................... 28,506 32,068 34,921 43,820Income before extraordinary item to common shareholders........................................ 5,682 2,112 8,104 1,547Net income to common shareholders ................... 5,682 2,112 8,104 1,264Income before extraordinary item per weighted average common share (diluted).... $0.36 $0.13 $0.52 $0.10Net income per weighted average common share (diluted)..................................... $0.36 $0.13 $0.52 $0.08
20. Non-Cash Financing and Investing Activities
In December 1999, 1998 and 1997, the Company declared distributions per unit of $0.72, $0.69 and $0.69 for eachyear, respectively. The limited partners’ distributions were paid in January of each subsequent year.
In June 1997, the Company forgave a $3.3 million related party note receivable as partial consideration to acquirethe remaining 50% interest in Solvang.
F-46
Notes to Financial Statements (continued)
20. Non-Cash Financing and Investing Activities (continued)
Other assets and other liabilities each include $6.2 million and $6.6 million in 1999 and 1998, respectively, relatedto a deferred unit incentive program with certain key officers to be paid in 2002. Also included is $12.0 million in1999 and $16.6 million in 1998 related to the present value of future payments to be received from The MillsCorporation under the Houston non-compete agreement.
During 1997, the Operating Partnership issued units with an aggregate fair market value of $0.5 million to acquireproperties.
During 1997, 1.4 million Operating Partnership units were converted to common shares.
F-20
Chelsea GCA Realty, Inc.Schedule III–Consolidated Real Estate and Accumulated Depreciation
for the year ended December 31, 1999 (in thousands)
Initial Cost to Company
Cost Capitalized(Disposed of) Subsequent
to Acquisition(Improvements)
Step-Up Relatedto Acquisitionof Partnership
Interest (1)
Gross Amount Carriedat Close of PeriodDecember 31, 1999
Life Used toCompute
Depreciation
Description Encum- Buildings,Fixtures and
Buildings,Fixtures and
Buildings,Fixtures and
Buildings,Fixtures and Accumulated Date of
in LatestIncome
Outlet Center Name brances Land Equipment Land Equipment Land Equipment Land Equipment Total Depreciation Construction Statement
The aggregate cost of the land, building, fixtures and equipment for federal tax purposes was approximately $849 million at December 31, 1999.(1) As part of the formation transaction assets acquired for cash have been accounted for as a purchase. The step-up represents the amount of the purchase price that exceeds the net book value of the assets acquired
F-21
Chelsea GCA Realty, Inc.Schedule III–Consolidated Real Estate
and Accumulated Depreciation (continued)(in thousands)
The changes in total real estate:
Year ended December 31,1999 1998 1997
Balance, beginning of period.................... $792,726 $708,933 $512,354Additions...................................................... 59,334 114,342 196,941Dispositions and other ............................... (3,247) (30,549) (362)Balance, end of period................................ $848,813 $792,726 $708,933
The changes in accumulated depreciation:
Year ended December 31,1999 1998 1997
Balance, beginning of period.................... $102,851 $80,244 $58,054Additions...................................................... 35,619 29,176 22,314Dispositions and other ............................... (249) (6,569) (124)Balance, end of period................................ $138,221 $102,851 $80,244
F-21
SIGNATURES
Pursuant to the requirements of Section 13 or 15(d) of the Securities Exchange Act of 1934, the registrant has dulycaused this amendment to the report to be signed on its behalf by the undersigned, thereunto duly authorized on the20th of September 2000.
CHELSEA GCA REALTY, INC.
By: /s/ DAVID C. BLOOM David C. Bloom, Chief Executive Officer
Pursuant to the requirements of the Securities Exchange Act of 1934, this report has been signed below by thefollowing persons on behalf of the registrant and in the capacities and on the dates indicated:
Signature Title Date
/s/ DAVID C. BLOOM Chairman of the Board September 20, 2000David C. Bloom and Chief Executive Officer
/s/ WILLIAM D. BLOOM Vice Chairman September 20, 2000William D. Bloom
/s/ LESLIE T. CHAO President September 20, 2000Leslie T. Chao
/s/ MICHAEL J. CLARKE Chief Financial Officer September 20, 2000Michael J. Clarke
/s/ BRENDAN T. BYRNE Director September 20, 2000Brendan T. Byrne
/s/ ROBERT FROMMER Director September 20, 2000Robert Frommer
/s/ BARRY M. GINSBURG Director September 20, 2000Barry M. Ginsburg
/s/ PHILIP D. KALTENBACHER Director September 20, 2000Philip D. Kaltenbacher
/s/ REUBEN S. LEIBOWITZ Director September 20, 2000Reuben S. Leibowitz