60
Plan Administer Implement ADOPT Finalize Interpret Assessments Iowa TM FORM E FORM E Technical Summary Technical Summary
Pla
nA
dm
iniste
rIm
ple
men
tA
DO
PT
Finalize
Inte
rpre
t
AssessmentsIowa
TM
FORM E
FOR
M E Technical Summary
Technical Summ
ary

Developed at The University of Iowa byIowa Testing Programs
Acknowledgments
PhotographsCover: Photograph titled Earth. Copyright © Stocktrek/Getty Images. (ST000517)
Copyright © 2012 by The University of Iowa. All rights reserved. No part of this work may be reproduced or transmitted in any form or by any means, electronic or mechanical, including photocopying and recording, or by any information storage or retrieval system without the prior written permission of The Riverside Publishing Company unless such copying is expressly permitted by federal copyright law. Address inquiries to Permissions, Riverside, 3800 Golf Rd., Suite 200, Rolling Meadows, IL 60008.
These tests contain questions that are to be used solely for testing purposes. No test items may be disclosed or used for any other reason. By accepting delivery of or using these tests, the recipient acknowledges responsibility for maintaining test security that is required by professional standards and applicable state and local policies and regulations governing proper use of tests and for complying with federal copyright law which prohibits unauthorized reproduction and use of copyrighted test materials.
Table of Contentsvv
v1.0 Contents i
Part 1: About This Guide .......................................................................................... 1
Purpose .......................................................................................................................... 1
Getting More Help ......................................................................................................... 1
Part 2: National Comparisons with the Iowa Assessments ........................................ 3
Benefits of National Comparisons................................................................................... 3
The National Standardization Program........................................................................... 4
Procedures for Selecting the Fall National Comparison Sample ................................... 5
Design for Collecting the Standardization Data .......................................................... 6
Weighting the Samples ............................................................................................... 6
Fall 2010 National Comparison Study ............................................................................. 7 Table 1: Percentage of Students by Type of School, Grades 1–12 Iowa Assessments Form E Fall 2010 National Comparison Study .................................................................................... 7 Table 2: Percentage of Public School Students by Geographic Region, Grades 1–12 Iowa Assessments Form E Fall 2010 National Comparison Study .................................................... 8 Table 3: Percentage of Public School Students by Title I Status, Grades 1–12 Iowa Assessments Form E Fall 2010 National Comparison Study .................................................... 8 Table 4: Percentage of Public School Students by District Enrollment, Grades 1–12 Iowa Assessments Form E Fall 2010 National Comparison Study .................................................... 8 Table 5: Percentage of Catholic Students by Diocese Size and Geographic Region, Grades 1–12 Iowa Assessments Form E Fall 2010 National Comparison Study ....................................... 9 Table 6: Percentage of Private (Non-Catholic) Students by Geographic Region, Grades 1–12 Iowa Assessments Form E Fall 2010 National Comparison Study ........................................... 9
Participation of Students in Special Groups ................................................................. 9 Table 7a: Test Accommodations Provided to English Language Learners (or Limited English Proficiency [LEP] Students), Grades 1–12 Weighted Sample Iowa Assessments Form E Fall 2010 National Comparison Study .......................................................................................... 11 Table 7b: Test Accommodations Provided to IEP and Section 504 Plan Students, Grades 1–12 Weighted Sample Iowa Assessments Form E Fall 2010 National Comparison Study ............. 11
Racial-Ethnic Representation ..................................................................................... 12 Table 8: Grades 1–12 Racial-Ethnic Representation Iowa Assessments Form E Fall 2010 National Comparison Study .................................................................................................. 12
Spring 2011 National Comparison Study ....................................................................... 13
Part 3: Technical Characteristics of the Iowa Assessments ...................................... 15
Accuracy of Scores ........................................................................................................ 15 Table 9: Means, Standard Deviations (SD), Reliability Coefficients (K-R 20), and Standard Errors of Measurement (SEM) for the Weighted Sample, Grades K–12 Iowa Assessments Form E .................................................................................................................................. 16
Difficulty of the Tests ................................................................................................... 30 Table 10: Item Difficulty (Proportion Correct) and Item Discrimination (Item-Total Correlation) Levels 5/6–17/18 (Grades K–12) Iowa Assessments Form E ................................ 31
Ceiling and Floor Effects .............................................................................................. 44 Table 11: Ceiling and Floor Effects, Grades K–8 Iowa Assessments Form E ........................... 45

ii Iowa Assessments Technical Summary

Part 1: About This Guide
About This Guide 1
Purpose The Iowa Assessments™ Technical Summary provides important information about the design of the Fall 2010 National Comparison Study for the Iowa Assessments Form E.
This guide supports the Adopt and Interpret phases of the assessment life cycle. As you consider your purposes for testing, use this guide to learn about the rigor employed in the design of the National Comparison Study. In addition, this guide supports aspects of score interpretation related to technical characteristics of the assessment.
Understand your options and make informed decisions
Get organized and prepare for testing
Administer the tests according to the directions
Prepare answer documents for scoring
Analyze test results and communicate with students, parents, and staff
Getting More Help
•
If you need help beyond the information provided in this guide, please make use of the following resources:
•
Your Riverside Assessment Consultant
Riverside Customer Service E-mail: [email protected] TEL: 1-800-323-9540

2 Iowa Assessments Technical Summary
Part
National Comparisons with the Iowa Assessments 3
2: National Comparisons with the Iowa Assessments
Benefits of National Comparisons
The Iowa Assessments™ are measures of achievement based on national core standards in several key content areas. The unique aspect of an assessment that provides national comparisons is its administration: all the assessments have been administered at each grade level to a representative sample of students from the nation’s public and private schools under uniform or standard conditions. Score distributions obtained from this administration provide a basis for interpreting student performance on the assessments for purposes of national comparisons.
For example, data collected during standardization allow the different subject area tests to be placed on a common score scale, so that a score in one subject area can be compared with scores in other subject areas. Without such comparative data, it would be difficult to determine whether a student performed better in reading than in mathematics; we would not know whether the student’s performance was weaker in mathematics than in reading or whether the mathematics test was simply more difficult than the reading test.
Another important use of comparative data is to provide a frame of reference for interpreting the growth of students in various subject areas. It is very difficult to describe “adequate growth” in an area without knowing how much students typically “grow” from year to year. Comparative data across grades provide this frame of reference.
Finally, data from representative samples allow students to be compared with other students and schools to be compared with other schools. Such comparisons enable a principal to look at the achievement levels of students or grade groups in relation to a nationally representative student population.
The Iowa Assessments measure achievement based on national core standards in several key content areas.
Uses for comparative data:
• to compare scores in different subject areas on a common score scale
• as a frame of reference for interpreting growth
• to compare students with other students and schools with other schools

The National Standardization Program
4 Iowa Assessments Technical Summary
•
Comparative data collected at the time of standardization enable norm-referenced interpretations of student performance in addition to standards-based interpretations. It is through the standardization process that scores, scales, and norms are developed. The procedures used in the standardization of the Iowa Assessments are designed to make the norming sample reflect the national population as closely as possible, ensuring proportional representation of important groups of students.
Many public and non-public schools cooperated in the National Comparison Study, which included the fall 2010 and spring 2011 test administrations and a series of field tests and equating studies.
The standardization program, planned jointly by Iowa Testing Programs and Riverside®, was carried out as a single enterprise. After reviewing earlier national standardization programs, the basic principles and conditions of those programs were adapted to meet the following current specifications:
•
The sample should be selected to represent the national population with respect to ability and achievement. It should be large enough to represent the diverse characteristics of the population, but a carefully selected sample of reasonable size would be preferred over a larger but less carefully selected sample.
•
Sampling units should be chosen primarily on the basis of district size, region of the country, and socioeconomic characteristics as determined by the school’s Title I status and percent of students eligible for free- and reduced-price lunch. A balance between public and non-public schools should be obtained.
•
The sample of attendance centers should be sufficiently large and selected to provide dependable norms for building averages.
•
Attendance centers in each part of the sample should represent the central tendency and variability of the population.
•
To ensure comparability of norms from grade to grade, all grades in a selected attendance center (or a designated fraction thereof) should be tested.
To ensure applicability of norms to all students, testing accommodations for students who require them should be
Many public and non-public schools cooperated in the National Comparison Study.

Procedures for Selecting the Fall National
National Comparisons with the Iowa Assessments 5
a regular part of the standard administrative conditions as designated in a student’s Individual Education Program (IEP) and in the accommodation practices of the participating schools.
Comparison Sample
Public School Sample – Three stratifying variables were used to classify public school buildings across the nation: geographic region, district enrollment, and Title I status (and thereby socioeconomic status). Within each geographic region (Northeast, Midwest, South, and West), school buildings were stratified into nine district-enrollment categories.
Stratification variables for the study design were determined with data from the National Center for Education Statistics (NCES) Common Core of Data (CCD), Public Elementary/Secondary School Universe Survey: School Year 2008–09 (NCES 2010-350 rev., Washington, DC: National Center for Education Statistics). For each combination of geographic region, Title I status, and district size, school buildings were selected at random and designated as first, second, or third choices. Administrators in the selected districts were contacted by Riverside and invited to participate. If a district declined, the next choice was contacted.
Catholic School Sample – The primary source for selecting and weighting the Catholic sample was National Catholic Educational Association (NCEA)/Ganley’s Catholic Schools in America. Within each geographic region used for the public sample, Catholic schools were stratified into five categories on the basis of diocesan enrollment. A two-stage random-sampling procedure was used to select the sample.
In the first stage, dioceses were randomly selected from each of the five enrollment categories. Different sampling fractions were used, ranging from 1.0 for dioceses with total student enrollment above 100,000 (all four were selected) to .07 for dioceses with fewer than 10,000 students (seven of 102 were selected). In the second stage, schools were randomly chosen from each diocese selected in the first stage. In all but the dioceses with the smallest enrollments—where only one school was selected—two schools were randomly chosen. If the selected school declined to participate, the alternate school was contacted. If neither school agreed to participate, additional schools randomly selected from the diocese were contacted.
Private (Non-Catholic) School Sample – The sample of private (non-Catholic) schools was obtained from the Quality Education
Three stratifying variables were used to classify public school buildings across the nation:
1. Geographic region
2. District enrollment
3. Title I status
•
6 Iowa Assessments Technical Summary
Data (QED) data file. Schools within each of the four geographic regions were randomly sampled from the data file until the targeted number of students in each region was reached. For each school selected, an alternate school was chosen to be contacted in the event that the selected school declined to participate.
Summary – The National Comparison Study met current specifications for sampling through the following means:
•
a national probability sample representative of students nationwide
•
a nationwide sample of schools for school-building norms
Design for Collecting the Standardization Data
data for Catholic/private (non-Catholic) norms and other special norms
Weighting the Samples
During the fall 2010 research study, appropriate levels (Levels 5/6 through 17/18) of Form E Complete of the Iowa Assessments were administered to every student. In addition, some students took either Form 7 of the Cognitive Abilities Test™ (CogAT®) or Form A of the Iowa Tests of Basic Skills® (ITBS®). All students in the National Comparison Study for Form E took the Iowa Assessments first, followed by either CogAT Form 7 or ITBS Form A. In approximately half of the grade 3 classrooms, Form E, Level 8 of the Iowa Assessments was administered; in the remaining grade 3 classrooms, Form E, Level 9 was administered.
After materials from the fall research study had been received by Riverside Scoring Service™, the number and percentages of students in each sample (public, Catholic, and private/non-Catholic) and stratification category were determined. The percentages were adjusted by weighting to compensate for missing categories and to correct for schools that tested more or fewer students than required.
Once the optimal weight for each sample was obtained, the stratification variables were simultaneously considered to assign final weights. These weights (integer values 0 through 12, with 3 denoting perfect proportional representation) were assigned to synthesize the characteristics of a missing unit or adjust the frequencies in other units. As a result, the weighted distributions in the three standardization samples closely approximated those of the total student population.
During the fall 2010 research study, appropriate levels (Levels 5/6 through 14) of Form E Complete of the Iowa Assessments were administered to every student.
Fall 2010 National Comparison Study
National Comparisons with the Iowa Assessments 7
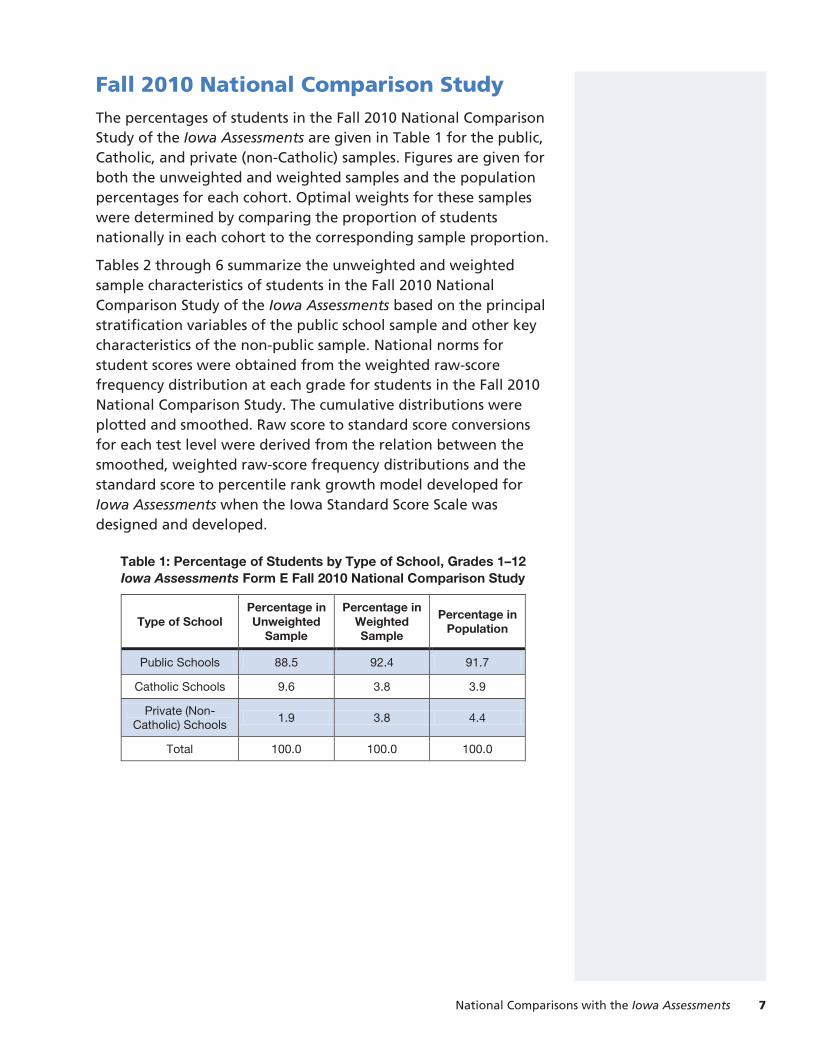
The percentages of students in the Fall 2010 National Comparison Study of the Iowa Assessments are given in Table 1 for the public, Catholic, and private (non-Catholic) samples. Figures are given for both the unweighted and weighted samples and the population percentages for each cohort. Optimal weights for these samples were determined by comparing the proportion of students nationally in each cohort to the corresponding sample proportion.
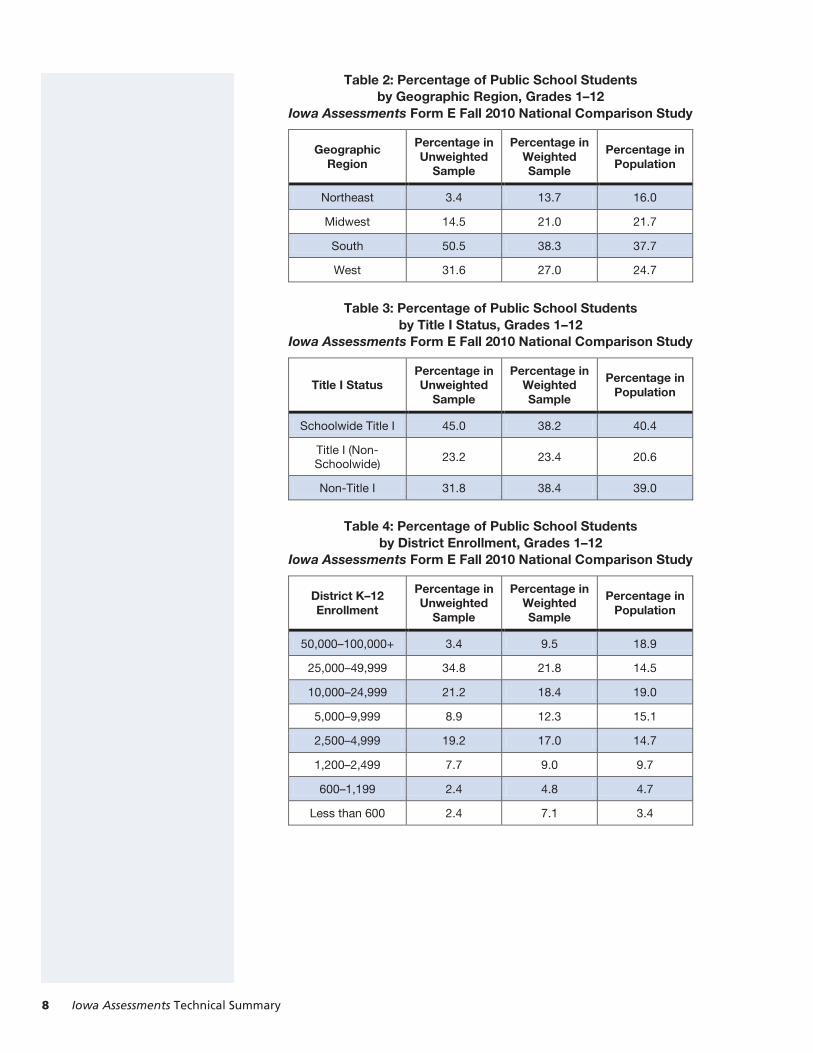
Tables 2 through 6 summarize the unweighted and weighted sample characteristics of students in the Fall 2010 National Comparison Study of the Iowa Assessments based on the principal stratification variables of the public school sample and other key characteristics of the non-public sample. National norms for student scores were obtained from the weighted raw-score frequency distribution at each grade for students in the Fall 2010 National Comparison Study. The cumulative distributions were plotted and smoothed. Raw score to standard score conversions for each test level were derived from the relation between the smoothed, weighted raw-score frequency distributions and the standard score to percentile rank growth model developed for Iowa Assessments when the Iowa Standard Score Scale was designed and developed.
Table 1: Percentage of Students by Type of School, Grades 1–12 Iowa Assessments Form E Fall 2010 National Comparison Study
Type of School Percentage in Unweighted
Sample
Percentage in Weighted Sample
Percentage in Population
Public Schools 88.5 92.4 91.7
Catholic Schools 9.6 3.8 3.9
Private (Non-Catholic) Schools
1.9 3.8 4.4
Total 100.0 100.0 100.0
8 Iowa Assessments Technical Summary
Table 2: Percentage of Public School Students by Geographic Region, Grades 1–12
Iowa Assessments Form E Fall 2010 National Comparison Study
Geographic Region
Percentage in Unweighted
Sample
Percentage in Weighted Sample
Percentage in Population
Northeast 3.4 13.7 16.0
Midwest 14.5 21.0 21.7
South 50.5 38.3 37.7
West 31.6 27.0 24.7
Table 3: Percentage of Public School Students by Title I Status, Grades 1–12
Iowa Assessments Form E Fall 2010 National Comparison Study
Title I Status Percentage in Unweighted
Sample
Percentage in Weighted Sample
Percentage in Population
Schoolwide Title I 45.0 38.2 40.4
Title I (Non-Schoolwide)
23.2 23.4 20.6
Non-Title I 31.8 38.4 39.0
Table 4: Percentage of Public School Students by District Enrollment, Grades 1–12
Iowa Assessments Form E Fall 2010 National Comparison Study
District K–12 Enrollment
Percentage in Unweighted
Sample
Percentage in Weighted Sample
Percentage in Population
50,000–100,000+ 3.4 9.5 18.9
25,000–49,999 34.8 21.8 14.5
10,000–24,999 21.2 18.4 19.0
5,000–9,999 8.9 12.3 15.1
2,500–4,999 19.2 17.0 14.7
1,200–2,499 7.7 9.0 9.7
600–1,199 2.4 4.8 4.7
Less than 600 2.4 7.1 3.4
National Comparisons with the Iowa Assessments 9
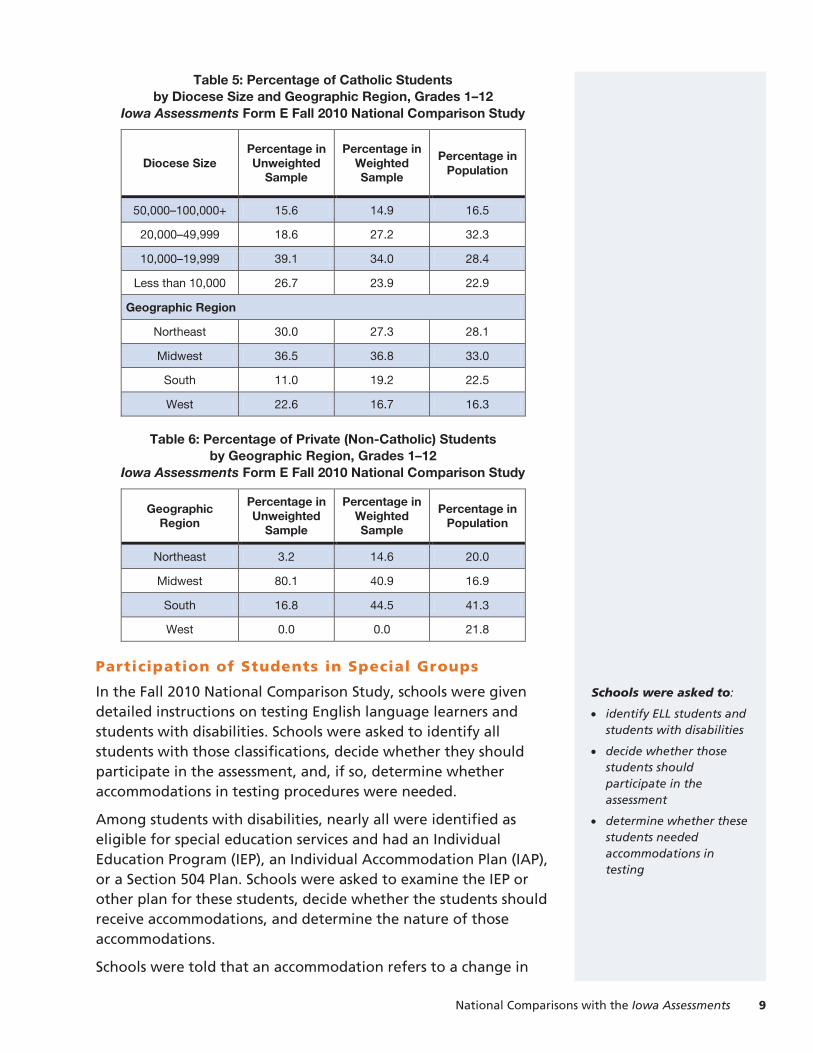
Table 5: Percentage of Catholic Students by Diocese Size and Geographic Region, Grades 1–12
Iowa Assessments Form E Fall 2010 National Comparison Study
Diocese Size Percentage in Unweighted
Sample
Percentage in Weighted Sample
Percentage in Population
50,000–100,000+ 15.6 14.9 16.5
20,000–49,999 18.6 27.2 32.3
10,000–19,999 39.1 34.0 28.4
Less than 10,000 26.7 23.9 22.9
Geographic Region
Northeast 30.0 27.3 28.1
Midwest 36.5 36.8 33.0
South 11.0 19.2 22.5
West 22.6 16.7 16.3
Table 6: Percentage of Private (Non-Catholic) Students
by Geographic Region, Grades 1–12 Iowa Assessments Form E Fall 2010 National Comparison Study
Geographic Region
Percentage in Unweighted
Sample
Percentage in Weighted Sample
Percentage in Population
Northeast 3.2 14.6 20.0
Midwest 80.1 40.9 16.9
South 16.8 44.5 41.3
Participation of Students in Special Groups
West 0.0 0.0 21.8
In the Fall 2010 National Comparison Study, schools were given detailed instructions on testing English language learners and students with disabilities. Schools were asked to identify all students with those classifications, decide whether they should participate in the assessment, and, if so, determine whether accommodations in testing procedures were needed.
Among students with disabilities, nearly all were identified as eligible for special education services and had an Individual Education Program (IEP), an Individual Accommodation Plan (IAP), or a Section 504 Plan. Schools were asked to examine the IEP or other plan for these students, decide whether the students should receive accommodations, and determine the nature of those accommodations.
Schools were told that an accommodation refers to a change in
Schools were asked to:
• identify ELL students and students with disabilities
• decide whether those students should participate in the assessment
• determine whether these students needed accommodations in testing
10 Iowa Assessments Technical Summary
the procedures for administering the assessment and that an accommodation is intended to neutralize, as much as possible, the effect of the student’s disability on the assessment process. Accommodations should not change the kind of achievement being measured, but change how achievement is measured. If chosen appropriately, an accommodation should provide neither too much nor too little help to the student who receives it.
When accommodations were provided, their use was recorded on each student’s answer document by the test administrator. The accommodations most frequently used by students with IEPs or Section 504 Plans were listed on the student answer document; space for indicating other accommodations was included.
For students whose native language was not English and who had been in an English-only classroom for a limited time, two decisions had to be made prior to administering the assessment. First, was English-language acquisition developed sufficiently to warrant participation, and second, should the assessment involve the use of any particular accommodations? In all instances, the guidelines in place in the school district were to be implemented in making decisions about each student.
The test administrators were told that the use of accommodations with English language learners is intended to allow the measurement of skills and knowledge in the curriculum without significant interference from a limited opportunity to learn English. Those just beginning instruction in English were not likely to be able to answer many questions no matter what types of accommodations were used. For those in the second or third year of instruction in an English as a Second Language (ESL) program, accommodations might be warranted to reduce the effect of limited English proficiency on test performance. The types of accommodations sometimes used with such students were listed on the student answer document for coding.
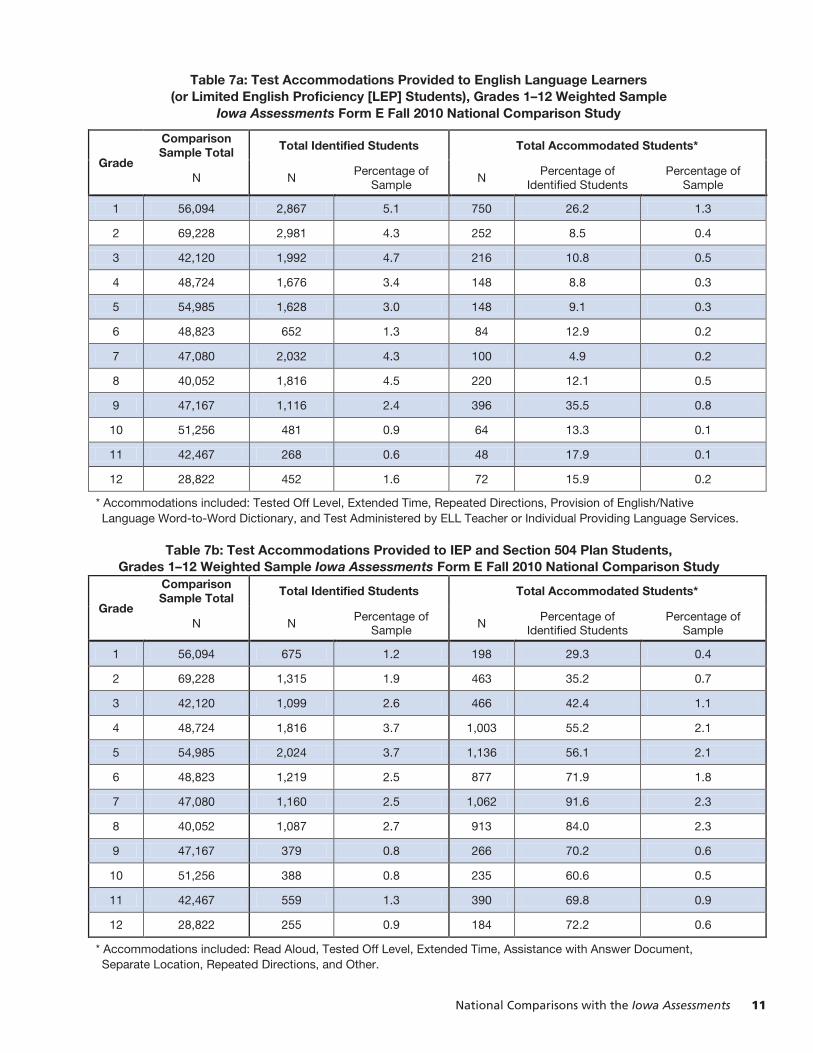
Tables 7a and 7b summarize the use of accommodations with English language learners and students with IEPs or Section 504 Plans during the national data collection. The column in Table 7a labeled “Percentage of Identified Students” shows that in the final distribution of scores from which the national comparison data were obtained, small percentages of English language learners received accommodations, typically about ten percent of the total number of students identified as English language learners. Likewise, the last column in Table 7b shows that in the final distribution of scores from which the national comparison data were obtained, high percentages of students with IEPs or Section 504 Plans received accommodations.
For students whose native language was not English, two decisions were required prior to administering the assessment:
• Was English-language acquisition developed sufficiently to warrant participation?
• Should the assessment involve the use of any accommodations?
National Comparisons with the Iowa Assessments 11
Table 7a: Test Accommodations Provided to English Language Learners (or Limited English Proficiency [LEP] Students), Grades 1–12 Weighted Sample
Iowa Assessments Form E Fall 2010 National Comparison Study
Grade
Comparison Sample Total Total Identified Students Total Accommodated Students*
N N Percentage of
Sample N
Percentage of Identified Students
Percentage of Sample
1 56,094 2,867 5.1 750 26.2 1.3
2 69,228 2,981 4.3 252 8.5 0.4
3 42,120 1,992 4.7 216 10.8 0.5
4 48,724 1,676 3.4 148 8.8 0.3
5 54,985 1,628 3.0 148 9.1 0.3
6 48,823 652 1.3 84 12.9 0.2
7 47,080 2,032 4.3 100 4.9 0.2
8 40,052 1,816 4.5 220 12.1 0.5
9 47,167 1,116 2.4 396 35.5 0.8
10 51,256 481 0.9 64 13.3 0.1
11 42,467 268 0.6 48 17.9 0.1
12 28,822 452 1.6 72 15.9 0.2
* Accommodations included: Tested Off Level, Extended Time, Repeated Directions, Provision of English/Native Language Word-to-Word Dictionary, and Test Administered by ELL Teacher or Individual Providing Language Services.
Table 7b: Test Accommodations Provided to IEP and Section 504 Plan Students, Grades 1–12 Weighted Sample Iowa Assessments Form E Fall 2010 National Comparison Study
Grade
Comparison Sample Total
Total Identified Students Total Accommodated Students*
N N Percentage of
Sample N Percentage of
Identified Students Percentage of
Sample
1 56,094 675 1.2 198 29.3 0.4
2 69,228 1,315 1.9 463 35.2 0.7
3 42,120 1,099 2.6 466 42.4 1.1
4 48,724 1,816 3.7 1,003 55.2 2.1
5 54,985 2,024 3.7 1,136 56.1 2.1
6 48,823 1,219 2.5 877 71.9 1.8
7 47,080 1,160 2.5 1,062 91.6 2.3
8 40,052 1,087 2.7 913 84.0 2.3
9 47,167 379 0.8 266 70.2 0.6
10 51,256 388 0.8 235 60.6 0.5
11 42,467 559 1.3 390 69.8 0.9
12 28,822 255 0.9 184 72.2 0.6
* Accommodations included: Read Aloud, Tested Off Level, Extended Time, Assistance with Answer Document, Separate Location, Repeated Directions, and Other.
Racial
12 Iowa Assessments Technical Summary
-Ethnic Representation
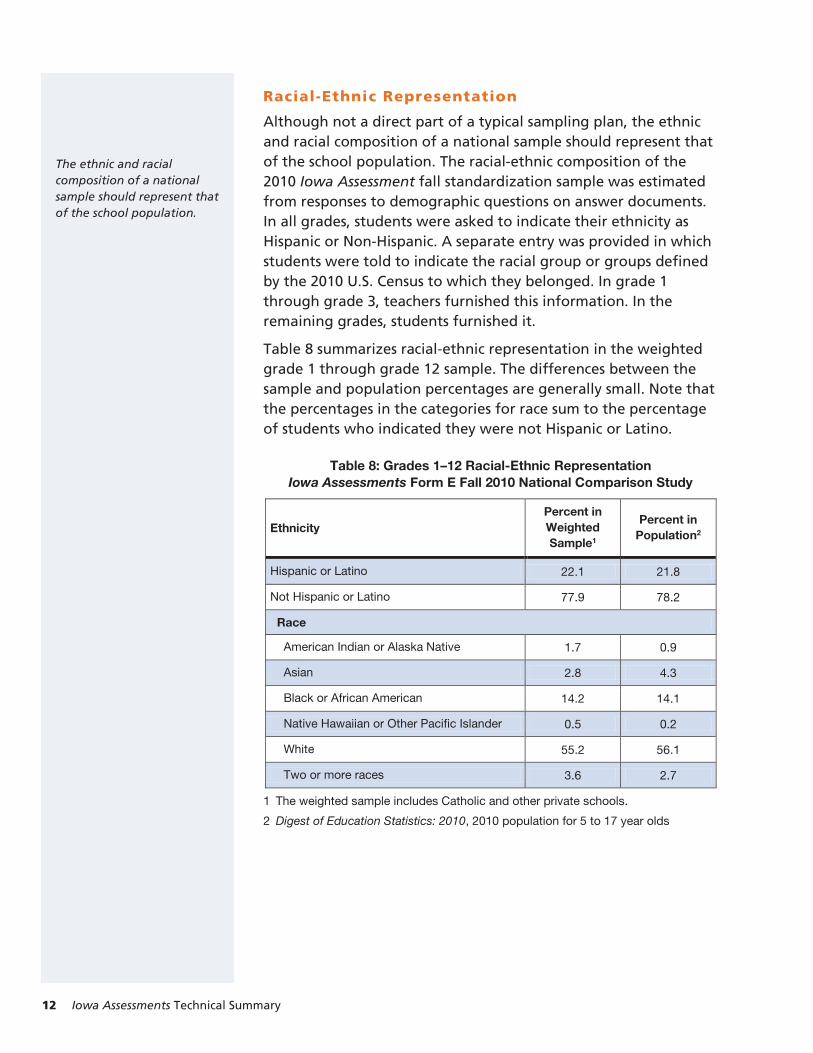
Although not a direct part of a typical sampling plan, the ethnic and racial composition of a national sample should represent that of the school population. The racial-ethnic composition of the 2010 Iowa Assessment fall standardization sample was estimated from responses to demographic questions on answer documents. In all grades, students were asked to indicate their ethnicity as Hispanic or Non-Hispanic. A separate entry was provided in which students were told to indicate the racial group or groups defined by the 2010 U.S. Census to which they belonged. In grade 1 through grade 3, teachers furnished this information. In the remaining grades, students furnished it.
Table 8 summarizes racial-ethnic representation in the weighted grade 1 through grade 12 sample. The differences between the sample and population percentages are generally small. Note that the percentages in the categories for race sum to the percentage of students who indicated they were not Hispanic or Latino.
Table 8: Grades 1–12 Racial-Ethnic Representation Iowa Assessments Form E Fall 2010 National Comparison Study
Ethnicity Percent in Weighted Sample1
Percent in Population2
Hispanic or Latino 22.1 21.8
Not Hispanic or Latino 77.9 78.2
Race
American Indian or Alaska Native 1.7 0.9
Asian 2.8 4.3
Black or African American 14.2 14.1
Native Hawaiian or Other Pacific Islander 0.5 0.2
White 55.2 56.1
Two or more races 3.6 2.7
1 The weighted sample includes Catholic and other private schools.
2 Digest of Education Statistics: 2010, 2010 population for 5 to 17 year olds
The ethnic and racial composition of a national sample should represent that of the school population.
Spring 2011 National Comparison Study
National Comparisons with the Iowa Assessments 13
The Spring 2011 National Comparison Study served three major purposes. The first was to establish empirical spring norms for the assessments standardized in the fall of 2010. The second was to obtain the national item-level data for Form E which was needed for item, skill, and test percentage correct as well as means, standard deviations, and reliability indices. The third was to validate fall to spring changes in student performance in terms of national standard scores for the measurement of growth.
The schools participating in the spring 2011 study were comprised of approximately twenty percent of those that participated in the fall 2010 standardization. Selection procedures were used to ensure representative participation across the stratification categories of public, Catholic, and private (non-Catholic) fall samples. However, because the participating sample was not completely representative of the fall sample, additional schools were contacted to participate.
All schools participating in the spring National Comparison Study administered an appropriate level of the Iowa Assessments. Student records were examined in reference to stratification variables, and distributions of standard scores were obtained on tests and composites. Mean differences between fall and spring standard scores were compared to expected differences based on the standard score growth model.

14 Iowa Assessments Technical Summary
Part
Technical Characteristics of the Iowa Assessments 15
3: Technical Characteristics of the Iowa Assessments
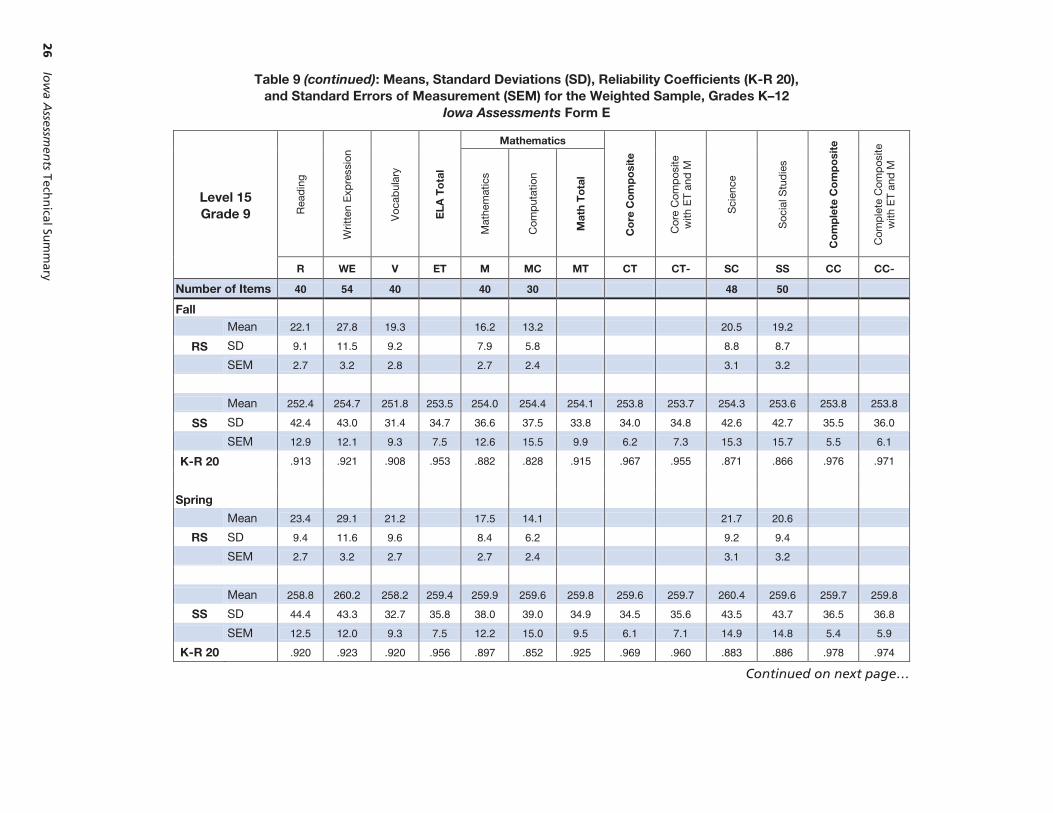
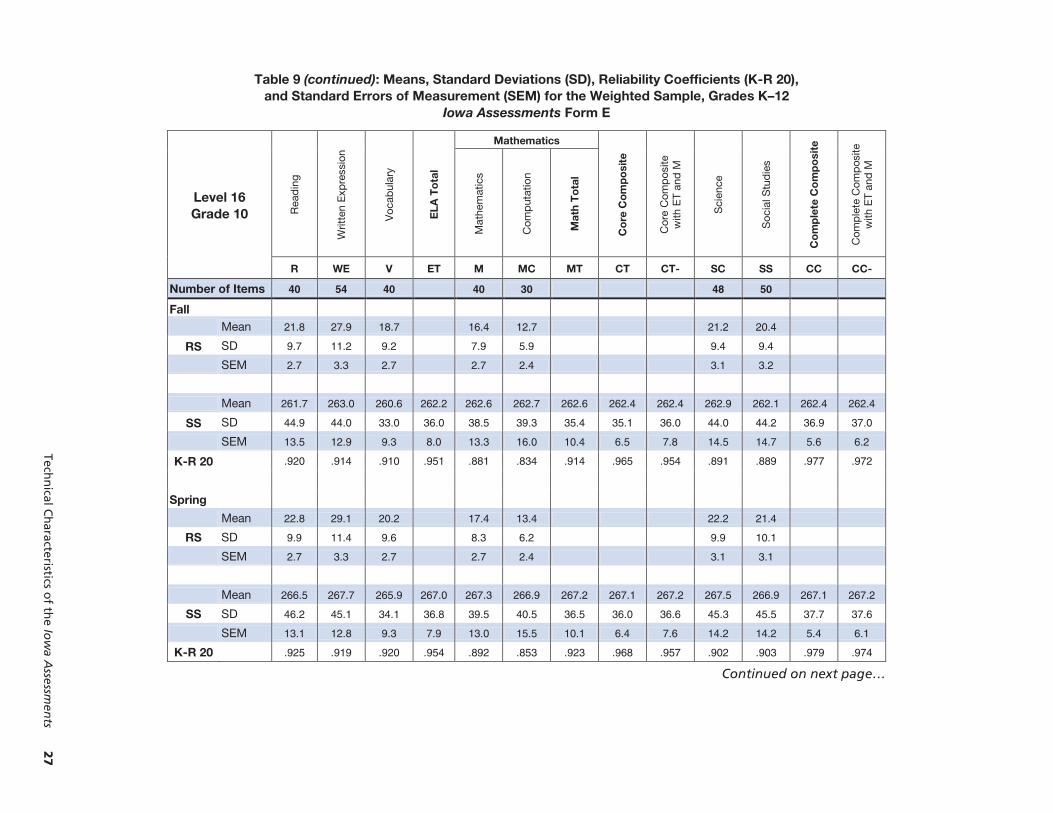
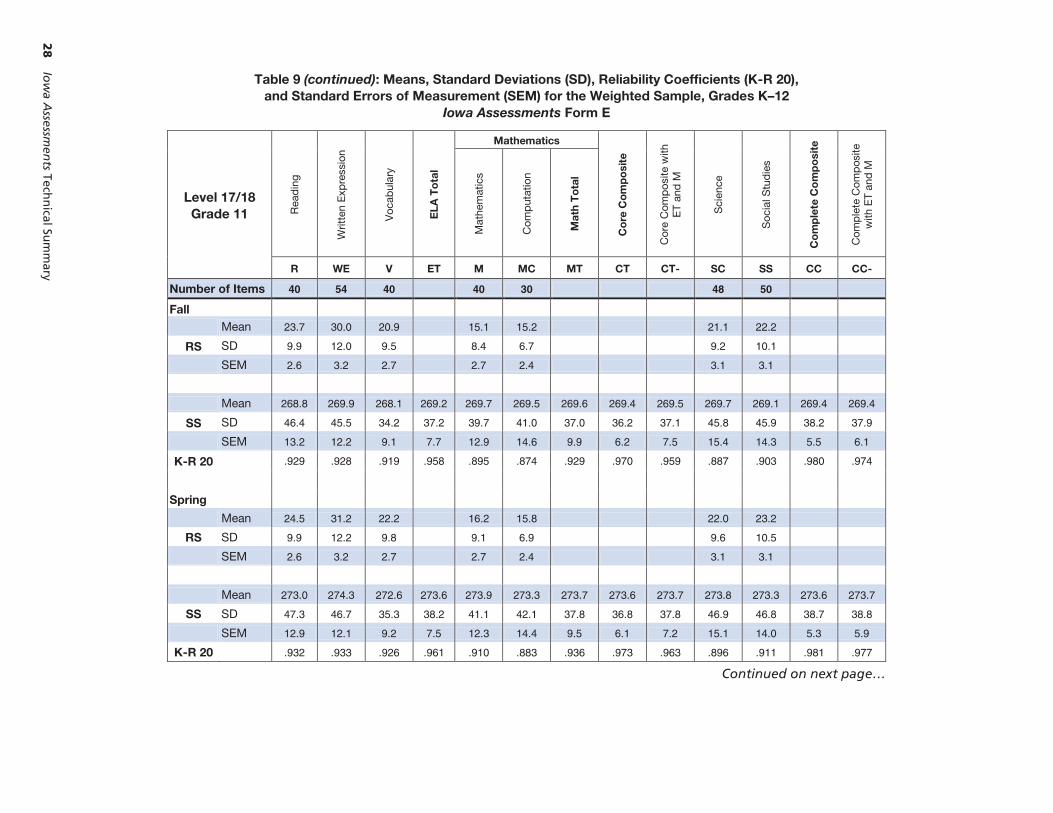
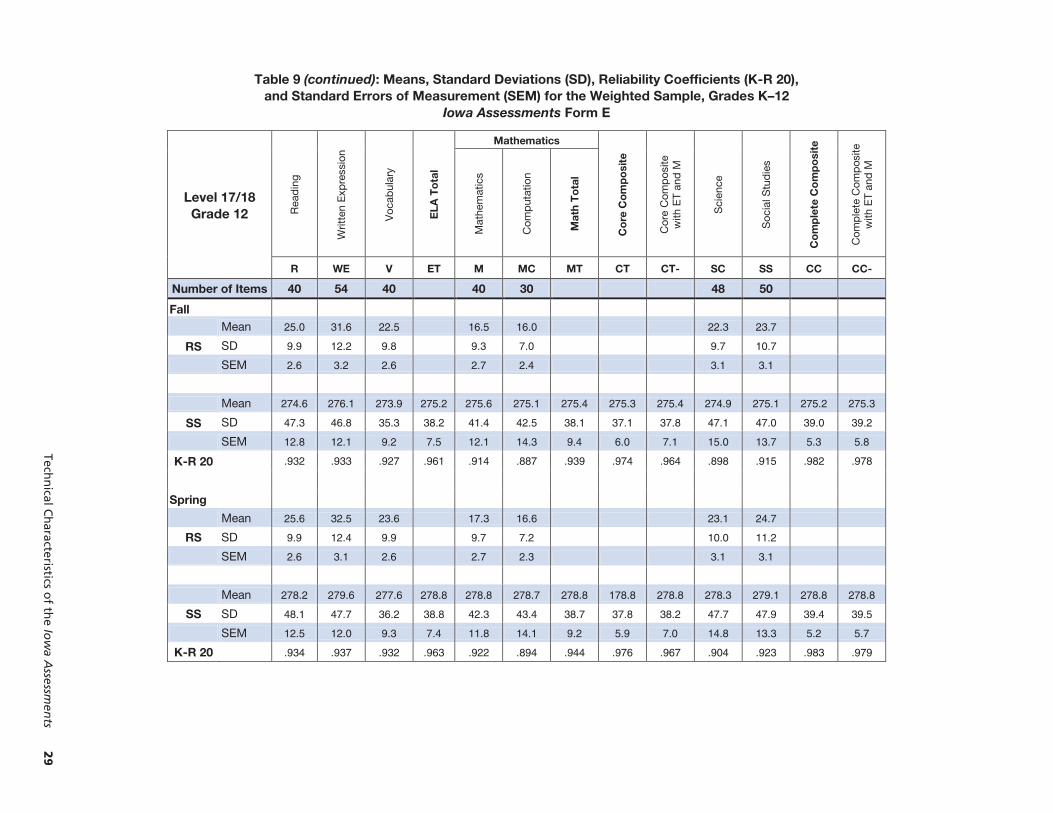
Accuracy of Scores The accuracy or reliability of assessment results can be quantified by a variety of statistical data. The consistency of scores for individuals is described by the reliability coefficient. In numerical value, a reliability coefficient is always between .00 and .99, and generally between .60 and .95. The closer the coefficient approaches the upper limit, the greater the evidence of a well-constructed assessment that produces scores consistent from one measurement occasion to another.
The second statistical index to describe reliability (actually, the unreliability of scores) is the standard error of measurement. This index measures the net effect of all factors leading to inconsistency in student test scores and to inconsistency in score interpretation. The standard error of measurement can be explained by a hypothetical example. Suppose a group of students at the same achievement level in reading were to take the same reading test. Despite their equal reading ability, they would not all get the same score. Instead, their scores would range across an interval. A few would get much higher scores than expected given their achievement level, a few much lower; the majority would get scores quite close to their actual achievement level. Such variation in scores would be attributable to differences in motivation, attentiveness, and other factors. The standard error of measurement is an index of the range or variability of the scores observed for students at the same level of achievement. It tells the degree of precision in placing a student at a point on the score scale used for reporting assessment results.
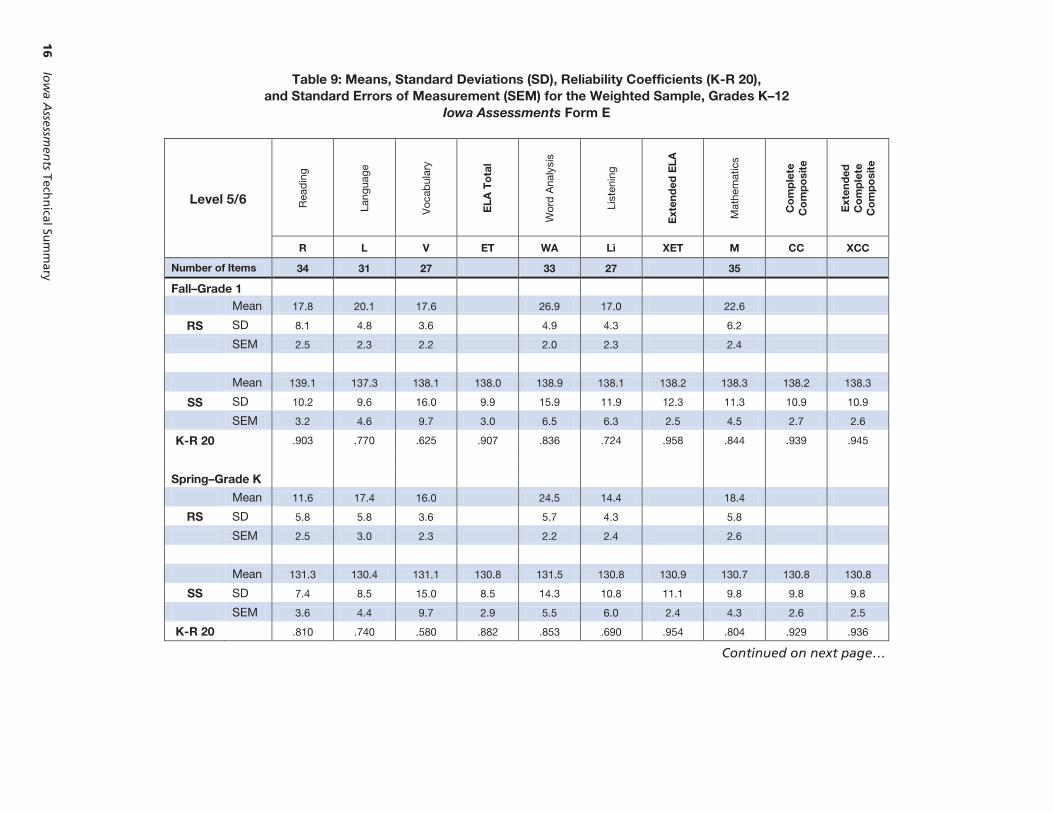
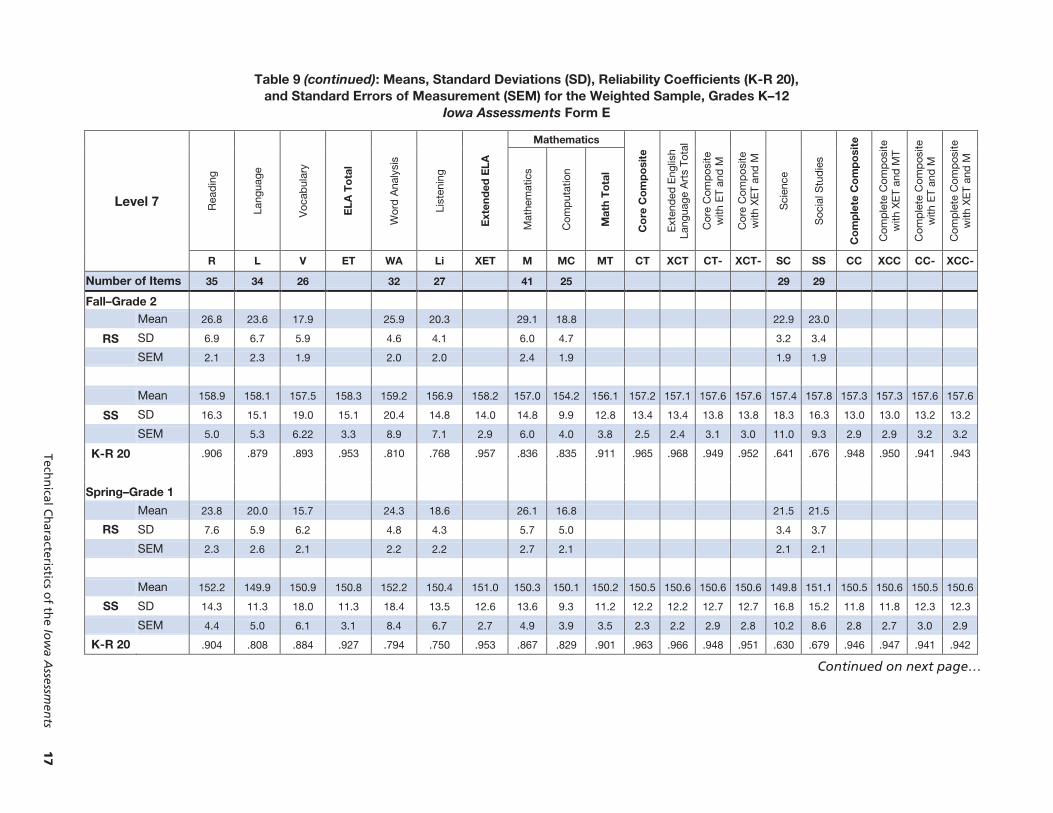
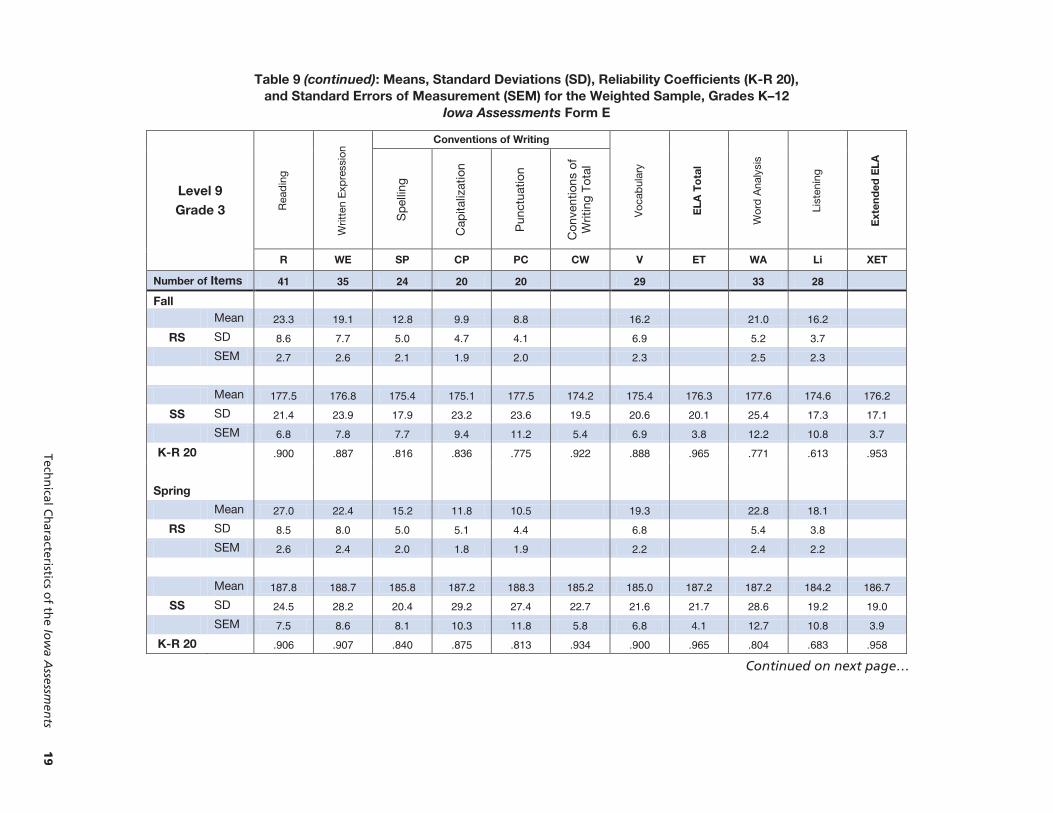
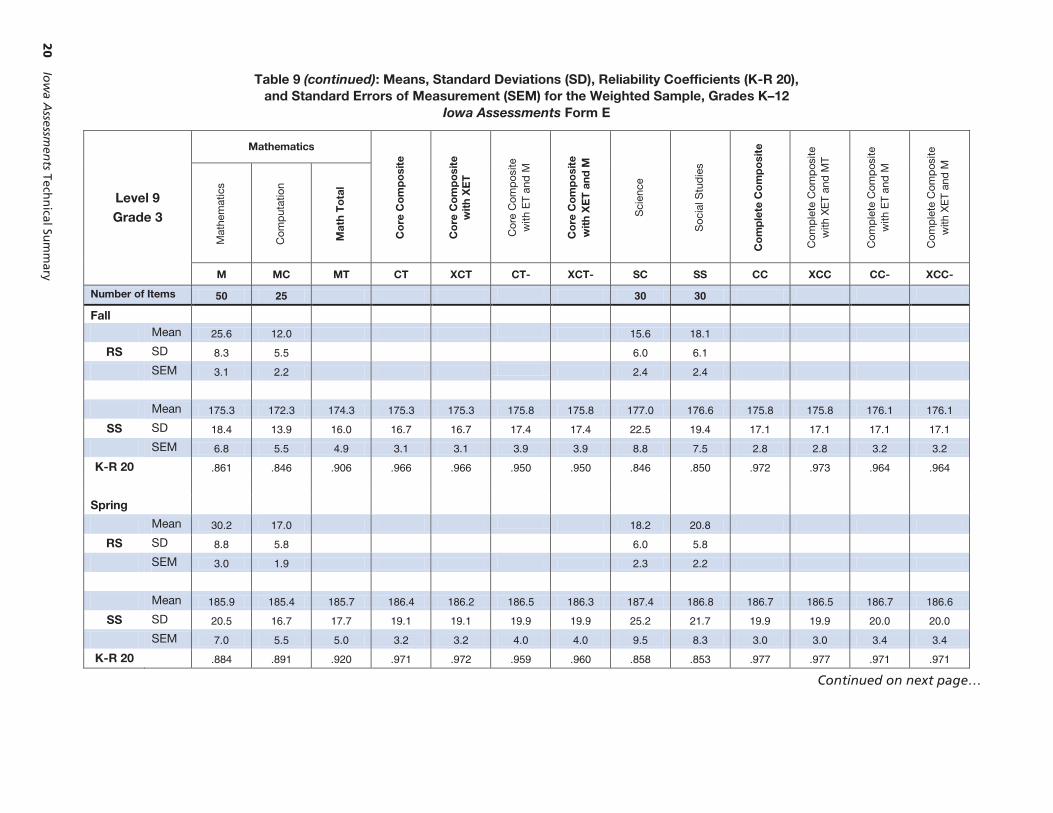
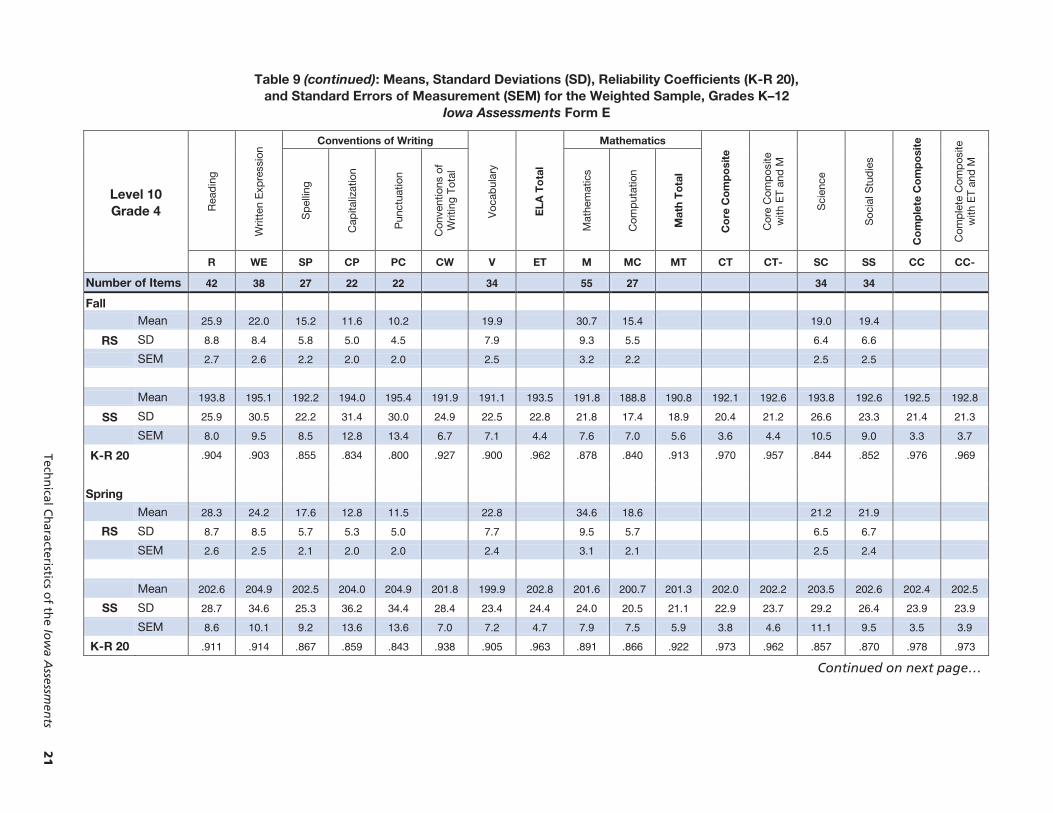
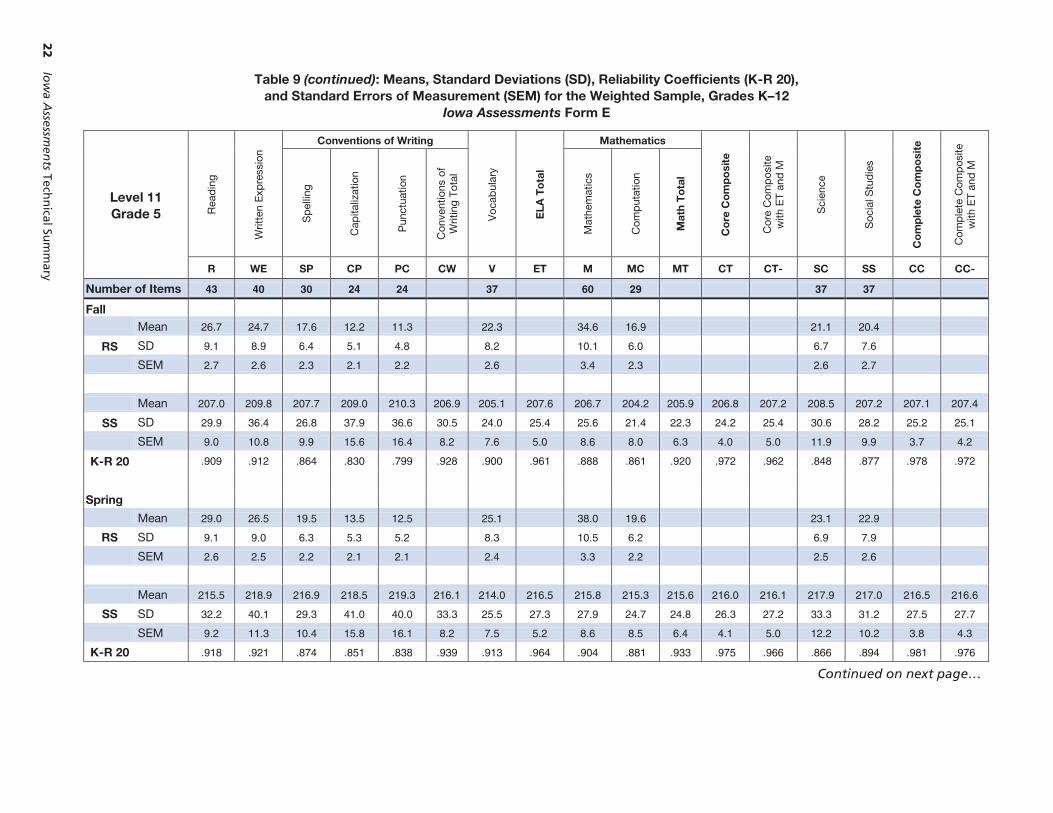
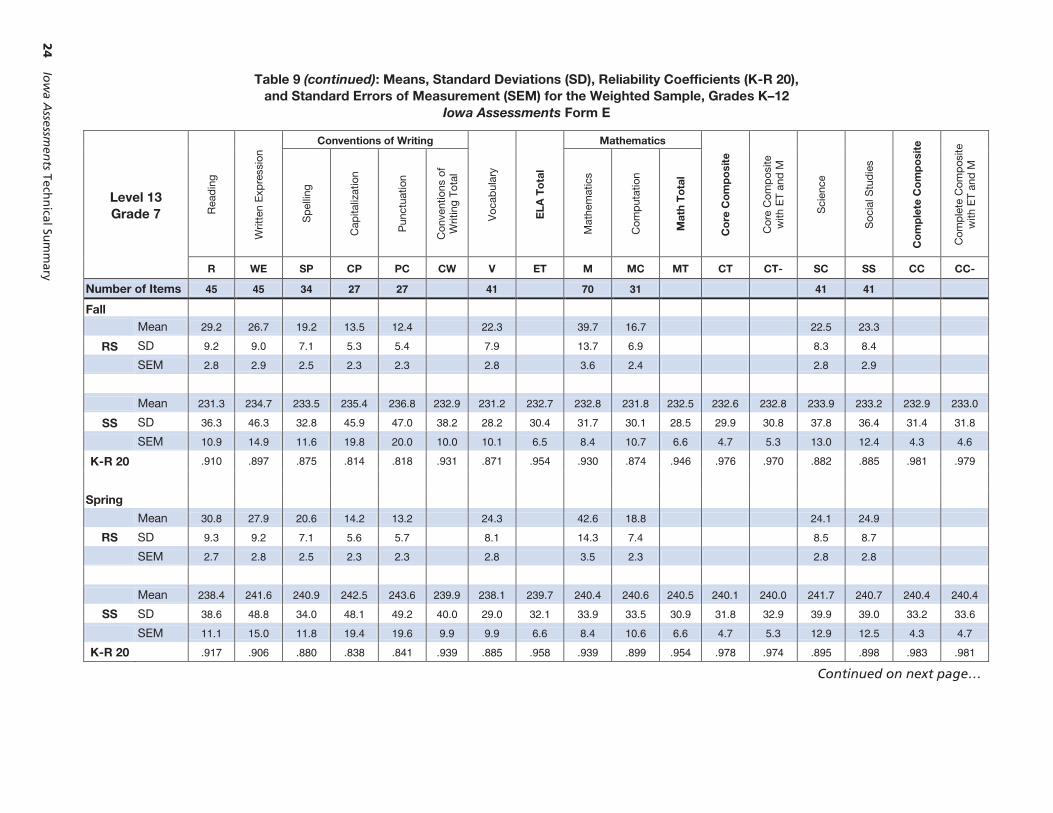
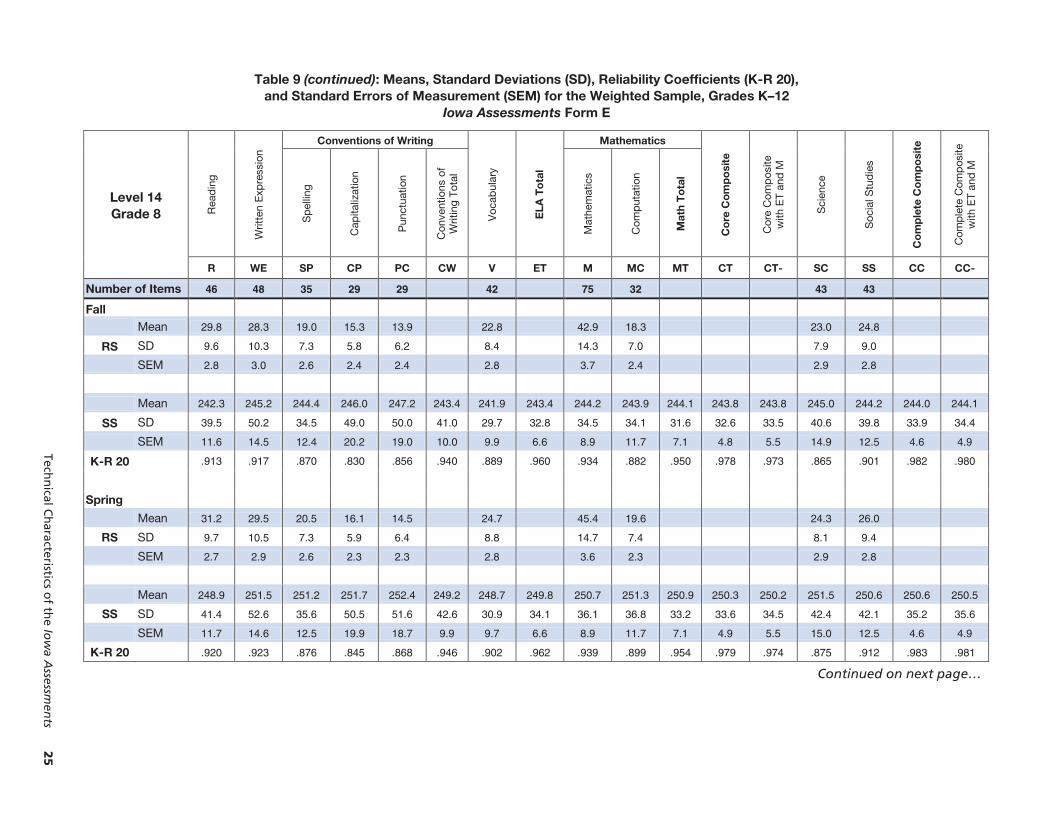
The reliability data presented on the following pages are based on Kuder-Richardson Formula 20 (K-R 20). The means, standard deviations (SD), and standard errors of measurement (SEM) are shown for raw scores (RS) and standard scores (SS) in Table 9 for fall and spring test administrations.
Standard error of measurement is an indicator of the range of variability of scores observed for students at the same level of achievement.
The reliability coefficient describes the consistency of scores for individuals.
16
Io
wa A
ssessmen
ts Techn
ical Sum
mary
Table 9: Means, Standard Deviations (SD), Reliability Coefficients (K-R 20), and Standard Errors of Measurement (SEM) for the Weighted Sample, Grades K–12
Iowa Assessments Form E
Level 5/6 Rea
din
g
Lang
uage
Voc
abul
ary
EL
A T
ota
l
Wor
d A
naly
sis
List
enin
g
Ext
end
ed E
LA
Mat
hem
atic
s
Co
mp
lete
C
om
po
site
Ext
end
ed
Co
mp
lete
C
om
po
site
R L V ET WA Li XET M CC XCC
Number of Items 34 31 27 33 27 35
Fall–Grade 1
Mean 17.8 20.1 17.6 26.9 17.0 22.6
RS SD 8.1 4.8 3.6 4.9 4.3 6.2
SEM 2.5 2.3 2.2 2.0 2.3 2.4
Mean 139.1 137.3 138.1 138.0 138.9 138.1 138.2 138.3 138.2 138.3
SS SD 10.2 9.6 16.0 9.9 15.9 11.9 12.3 11.3 10.9 10.9
SEM 3.2 4.6 9.7 3.0 6.5 6.3 2.5 4.5 2.7 2.6
K-R 20 .903 .770 .625 .907 .836 .724 .958 .844 .939 .945
Spring–Grade K
Mean 11.6 17.4 16.0 24.5 14.4 18.4
RS SD 5.8 5.8 3.6 5.7 4.3 5.8
SEM 2.5 3.0 2.3 2.2 2.4 2.6
Mean 131.3 130.4 131.1 130.8 131.5 130.8 130.9 130.7 130.8 130.8
SS SD 7.4 8.5 15.0 8.5 14.3 10.8 11.1 9.8 9.8 9.8
SEM 3.6 4.4 9.7 2.9 5.5 6.0 2.4 4.3 2.6 2.5
K-R 20 .810 .740 .580 .882 .853 .690 .954 .804 .929 .936
Continued on next page…
Techn
ical Ch
aracteristics of th
e Iow
a Assessm
ents
17
Table 9 (continued): Means, Standard Deviations (SD), Reliability Coefficients (K-R 20), and Standard Errors of Measurement (SEM) for the Weighted Sample, Grades K–12
Iowa Assessments Form E
Level 7 Rea
din
g
Lang
uage
Voc
abul
ary
EL
A T
ota
l
Wor
d A
naly
sis
List
enin
g
Ext
end
ed E
LA
Mathematics
Co
re C
om
po
site
Ext
ende
d E
nglis
h La
ngua
ge A
rts
Tota
l
Cor
e C
omp
osite
w
ith E
T an
d M
Cor
e C
omp
osite
w
ith X
ET
and
M
Sci
ence
Soc
ial S
tud
ies
Co
mp
lete
Co
mp
osi
te
Com
ple
te C
omp
osite
w
ith X
ET
and
MT
Com
ple
te C
omp
osite
w
ith E
T an
d M
Com
ple
te C
omp
osite
w
ith X
ET
and
M
Mat
hem
atic
s
Com
put
atio
n
Mat
h T
ota
l
R L V ET WA Li XET M MC MT CT XCT CT- XCT- SC SS CC XCC CC- XCC-
Number of Items 35 34 26 32 27 41 25 29 29
Fall–Grade 2 Mean 26.8 23.6 17.9 25.9 20.3 29.1 18.8 22.9 23.0
RS SD 6.9 6.7 5.9 4.6 4.1 6.0 4.7 3.2 3.4
SEM 2.1 2.3 1.9 2.0 2.0 2.4 1.9 1.9 1.9
Mean 158.9 158.1 157.5 158.3 159.2 156.9 158.2 157.0 154.2 156.1 157.2 157.1 157.6 157.6 157.4 157.8 157.3 157.3 157.6 157.6
SS SD 16.3 15.1 19.0 15.1 20.4 14.8 14.0 14.8 9.9 12.8 13.4 13.4 13.8 13.8 18.3 16.3 13.0 13.0 13.2 13.2
SEM 5.0 5.3 6.22 3.3 8.9 7.1 2.9 6.0 4.0 3.8 2.5 2.4 3.1 3.0 11.0 9.3 2.9 2.9 3.2 3.2
K-R 20 .906 .879 .893 .953 .810 .768 .957 .836 .835 .911 .965 .968 .949 .952 .641 .676 .948 .950 .941 .943
Spring–Grade 1
Mean 23.8 20.0 15.7 24.3 18.6 26.1 16.8 21.5 21.5
RS SD 7.6 5.9 6.2 4.8 4.3 5.7 5.0 3.4 3.7
SEM 2.3 2.6 2.1 2.2 2.2 2.7 2.1 2.1 2.1
Mean 152.2 149.9 150.9 150.8 152.2 150.4 151.0 150.3 150.1 150.2 150.5 150.6 150.6 150.6 149.8 151.1 150.5 150.6 150.5 150.6
SS SD 14.3 11.3 18.0 11.3 18.4 13.5 12.6 13.6 9.3 11.2 12.2 12.2 12.7 12.7 16.8 15.2 11.8 11.8 12.3 12.3
SEM 4.4 5.0 6.1 3.1 8.4 6.7 2.7 4.9 3.9 3.5 2.3 2.2 2.9 2.8 10.2 8.6 2.8 2.7 3.0 2.9
K-R 20 .904 .808 .884 .927 .794 .750 .953 .867 .829 .901 .963 .966 .948 .951 .630 .679 .946 .947 .941 .942
Continued on next page…

18
Io
wa A
ssessmen
ts Techn
ical Sum
mary
Table 9 (continued): Means, Standard Deviations (SD), Reliability Coefficients (K-R 20), and Standard Errors of Measurement (SEM) for the Weighted Sample, Grades K–12
Iowa Assessments Form E
Level 8 Rea
din
g
Lang
uage
Voc
abul
ary
EL
A T
ota
l
Wor
d A
naly
sis
List
enin
g
Ext
end
ed E
LA
Mathematics
Co
re C
om
po
site
Ext
ende
d E
nglis
h La
ngua
ge A
rts
Tota
l
Cor
e C
omp
osite
w
ith E
T an
d M
Cor
e C
omp
osite
w
ith X
ET
and
M
Sci
ence
Soc
ial S
tud
ies
Co
mp
lete
Co
mp
osi
te
Com
ple
te C
omp
osite
w
ith X
ET
and
MT
Com
ple
te C
omp
osite
w
ith E
T an
d M
Com
ple
te C
omp
osite
w
ith X
ET
and
M
Mat
hem
atic
s
Com
put
atio
n
Mat
h T
ota
l
R L V ET WA Li XET M MC MT CT XCT CT- XCT- SC SS CC XCC CC- XCC-
Number of Items 38 42 26 33 27 46 27 29 29
Fall–Grade 3
Mean 29.1 32.0 17.8 26.6 20.1 34.5 21.2 21.3 22.1
RS SD 6.8 7.5 4.6 4.8 4.1 7.0 3.7 3.9 4.1
SEM 2.3 2.4 2.0 2.0 2.0 2.5 2.0 2.1 2.0
Mean 177.5 177.0 175.4 176.9 177.6 174.6 176.6 175.3 172.3 174.3 175.6 175.5 176.1 176.0 177.0 176.6 176.0 175.9 176.3 176.2
SS SD 21.4 19.5 20.6 20.1 25.4 17.3 17.1 18.4 13.9 16.0 16.7 16.7 17.4 17.4 22.5 19.4 17.1 17.1 17.1 17.1
SEM 7.1 6.4 9.0 4.2 10.4 8.5 3.6 6.0 5.3 4.4 3.1 2.8 3.7 3.5 12.0 9.6 3.3 3.2 3.6 3.5
K-R 20 .890 .893 .808 .955 .833 .761 .956 .892 .857 .925 .967 .971 .955 .959 .714 .757 .963 .965 .957 .958
Spring–Grade 2
Mean 27.0 29.2 16.3 25.4 19.2 32.0 20.3 20.0 20.6
RS SD 7.1 7.9 4.6 5.1 4.3 7.0 3.8 4.0 4.1
SEM 2.4 2.7 2.1 2.1 2.2 2.7 2.1 2.2 2.2
Mean 170.7 169.8 168.6 169.9 171.0 168.2 169.8 168.6 168.3 168.5 169.2 169.1 169.2 169.2 169.7 169.5 169.3 169.3 169.4 169.3
SS SD 19.6 17.2 19.8 17.2 23.7 16.3 16.1 16.9 13.1 14.7 15.3 15.3 15.9 15.9 21.2 17.8 15.0 15.0 15.2 15.2
SEM 6.7 5.8 9.1 4.0 9.8 8.3 3.4 5.9 5.4 4.3 2.9 2.7 3.5 3.4 11.5 9.3 3.2 3.1 3.4 3.4
K-R 20 .883 .886 .791 .947 .828 .745 .955 .879 .834 .914 .964 .968 .950 .954 .708 .727 .955 .957 .949 .951
Continued on next page…
Techn
ical Ch
aracteristics of th
e Iow
a Assessm
ents
19
Table 9 (continued): Means, Standard Deviations (SD), Reliability Coefficients (K-R 20), and Standard Errors of Measurement (SEM) for the Weighted Sample, Grades K–12
Iowa Assessments Form E
Level 9 Grade 3 R
ead
ing
Writ
ten
Exp
ress
ion
Conventions of Writing
Voc
abul
ary
EL
A T
ota
l
Wor
d A
naly
sis
List
enin
g
Ext
end
ed E
LA
Sp
ellin
g
Cap
italiz
atio
n
Pun
ctua
tion
Con
vent
ions
of
Writ
ing
Tota
l
R WE SP CP PC CW V ET WA Li XET
Number of Items 41 35 24 20 20 29 33 28
Fall
Mean 23.3 19.1 12.8 9.9 8.8 16.2 21.0 16.2
RS SD 8.6 7.7 5.0 4.7 4.1 6.9 5.2 3.7
SEM 2.7 2.6 2.1 1.9 2.0 2.3 2.5 2.3
Mean 177.5 176.8 175.4 175.1 177.5 174.2 175.4 176.3 177.6 174.6 176.2
SS SD 21.4 23.9 17.9 23.2 23.6 19.5 20.6 20.1 25.4 17.3 17.1
SEM 6.8 7.8 7.7 9.4 11.2 5.4 6.9 3.8 12.2 10.8 3.7
K-R 20 .900 .887 .816 .836 .775 .922 .888 .965 .771 .613 .953
Spring
Mean 27.0 22.4 15.2 11.8 10.5 19.3 22.8 18.1
RS SD 8.5 8.0 5.0 5.1 4.4 6.8 5.4 3.8
SEM 2.6 2.4 2.0 1.8 1.9 2.2 2.4 2.2
Mean 187.8 188.7 185.8 187.2 188.3 185.2 185.0 187.2 187.2 184.2 186.7
SS SD 24.5 28.2 20.4 29.2 27.4 22.7 21.6 21.7 28.6 19.2 19.0
SEM 7.5 8.6 8.1 10.3 11.8 5.8 6.8 4.1 12.7 10.8 3.9
K-R 20 .906 .907 .840 .875 .813 .934 .900 .965 .804 .683 .958
Continued on next page…
20
Io
wa A
ssessmen
ts Techn
ical Sum
mary
Table 9 (continued): Means, Standard Deviations (SD), Reliability Coefficients (K-R 20), and Standard Errors of Measurement (SEM) for the Weighted Sample, Grades K–12
Iowa Assessments Form E
Level 9 Grade 3
Mathematics
Co
re C
om
po
site
Co
re C
om
po
site
w
ith
XE
T
Cor
e C
omp
osite
w
ith E
T an
d M
Co
re C
om
po
site
w
ith
XE
T a
nd M
Sci
ence
Soc
ial S
tud
ies
Co
mp
lete
Co
mp
osi
te
Com
ple
te C
omp
osite
w
ith X
ET
and
MT
Com
ple
te C
omp
osite
w
ith E
T an
d M
Com
ple
te C
omp
osite
w
ith X
ET
and
M
Mat
hem
atic
s
Com
put
atio
n
Mat
h T
ota
l
M MC MT CT XCT CT- XCT- SC SS CC XCC CC- XCC-
Number of Items 50 25 30 30
Fall
Mean 25.6 12.0 15.6 18.1
RS SD 8.3 5.5 6.0 6.1
SEM 3.1 2.2 2.4 2.4
Mean 175.3 172.3 174.3 175.3 175.3 175.8 175.8 177.0 176.6 175.8 175.8 176.1 176.1
SS SD 18.4 13.9 16.0 16.7 16.7 17.4 17.4 22.5 19.4 17.1 17.1 17.1 17.1
SEM 6.8 5.5 4.9 3.1 3.1 3.9 3.9 8.8 7.5 2.8 2.8 3.2 3.2
K-R 20 .861 .846 .906 .966 .966 .950 .950 .846 .850 .972 .973 .964 .964
Spring
Mean 30.2 17.0 18.2 20.8
RS SD 8.8 5.8 6.0 5.8
SEM 3.0 1.9 2.3 2.2
Mean 185.9 185.4 185.7 186.4 186.2 186.5 186.3 187.4 186.8 186.7 186.5 186.7 186.6
SS SD 20.5 16.7 17.7 19.1 19.1 19.9 19.9 25.2 21.7 19.9 19.9 20.0 20.0
SEM 7.0 5.5 5.0 3.2 3.2 4.0 4.0 9.5 8.3 3.0 3.0 3.4 3.4
K-R 20 .884 .891 .920 .971 .972 .959 .960 .858 .853 .977 .977 .971 .971
Continued on next page…
Techn
ical Ch
aracteristics of th
e Iow
a Assessm
ents
21
Table 9 (continued): Means, Standard Deviations (SD), Reliability Coefficients (K-R 20), and Standard Errors of Measurement (SEM) for the Weighted Sample, Grades K–12
Iowa Assessments Form E
Level 10 Grade 4 R
ead
ing
Writ
ten
Exp
ress
ion
Conventions of Writing
Voc
abul
ary
EL
A T
ota
l
Mathematics
Co
re C
om
po
site
Cor
e C
omp
osite
w
ith E
T an
d M
Sci
ence
Soc
ial S
tud
ies
Co
mp
lete
Co
mp
osi
te
Com
ple
te C
omp
osite
w
ith E
T an
d M
Sp
ellin
g
Cap
italiz
atio
n
Pun
ctua
tion
Con
vent
ions
of
Writ
ing
Tota
l
Mat
hem
atic
s
Com
put
atio
n
Mat
h T
ota
l
R WE SP CP PC CW V ET M MC MT CT CT- SC SS CC CC-
Number of Items 42 38 27 22 22 34 55 27 34 34
Fall
Mean 25.9 22.0 15.2 11.6 10.2 19.9 30.7 15.4 19.0 19.4
RS SD 8.8 8.4 5.8 5.0 4.5 7.9 9.3 5.5 6.4 6.6
SEM 2.7 2.6 2.2 2.0 2.0 2.5 3.2 2.2 2.5 2.5
Mean 193.8 195.1 192.2 194.0 195.4 191.9 191.1 193.5 191.8 188.8 190.8 192.1 192.6 193.8 192.6 192.5 192.8
SS SD 25.9 30.5 22.2 31.4 30.0 24.9 22.5 22.8 21.8 17.4 18.9 20.4 21.2 26.6 23.3 21.4 21.3
SEM 8.0 9.5 8.5 12.8 13.4 6.7 7.1 4.4 7.6 7.0 5.6 3.6 4.4 10.5 9.0 3.3 3.7
K-R 20 .904 .903 .855 .834 .800 .927 .900 .962 .878 .840 .913 .970 .957 .844 .852 .976 .969
Spring
Mean 28.3 24.2 17.6 12.8 11.5 22.8 34.6 18.6 21.2 21.9
RS SD 8.7 8.5 5.7 5.3 5.0 7.7 9.5 5.7 6.5 6.7
SEM 2.6 2.5 2.1 2.0 2.0 2.4 3.1 2.1 2.5 2.4
Mean 202.6 204.9 202.5 204.0 204.9 201.8 199.9 202.8 201.6 200.7 201.3 202.0 202.2 203.5 202.6 202.4 202.5
SS SD 28.7 34.6 25.3 36.2 34.4 28.4 23.4 24.4 24.0 20.5 21.1 22.9 23.7 29.2 26.4 23.9 23.9
SEM 8.6 10.1 9.2 13.6 13.6 7.0 7.2 4.7 7.9 7.5 5.9 3.8 4.6 11.1 9.5 3.5 3.9
K-R 20 .911 .914 .867 .859 .843 .938 .905 .963 .891 .866 .922 .973 .962 .857 .870 .978 .973
Continued on next page…
22
Io
wa A
ssessmen
ts Techn
ical Sum
mary
Table 9 (continued): Means, Standard Deviations (SD), Reliability Coefficients (K-R 20), and Standard Errors of Measurement (SEM) for the Weighted Sample, Grades K–12
Iowa Assessments Form E
Level 11 Grade 5 R
ead
ing
Writ
ten
Exp
ress
ion
Conventions of Writing
Voc
abul
ary
EL
A T
ota
l
Mathematics
Co
re C
om
po
site
Cor
e C
omp
osite
w
ith E
T an
d M
Sci
ence
Soc
ial S
tud
ies
Co
mp
lete
Co
mp
osi
te
Com
ple
te C
omp
osite
w
ith E
T an
d M
Sp
ellin
g
Cap
italiz
atio
n
Pun
ctua
tion
Con
vent
ions
of
Writ
ing
Tota
l
Mat
hem
atic
s
Com
put
atio
n
Mat
h T
ota
l
R WE SP CP PC CW V ET M MC MT CT CT- SC SS CC CC-
Number of Items 43 40 30 24 24 37 60 29 37 37
Fall
Mean 26.7 24.7 17.6 12.2 11.3 22.3 34.6 16.9 21.1 20.4
RS SD 9.1 8.9 6.4 5.1 4.8 8.2 10.1 6.0 6.7 7.6
SEM 2.7 2.6 2.3 2.1 2.2 2.6 3.4 2.3 2.6 2.7
Mean 207.0 209.8 207.7 209.0 210.3 206.9 205.1 207.6 206.7 204.2 205.9 206.8 207.2 208.5 207.2 207.1 207.4
SS SD 29.9 36.4 26.8 37.9 36.6 30.5 24.0 25.4 25.6 21.4 22.3 24.2 25.4 30.6 28.2 25.2 25.1
SEM 9.0 10.8 9.9 15.6 16.4 8.2 7.6 5.0 8.6 8.0 6.3 4.0 5.0 11.9 9.9 3.7 4.2
K-R 20 .909 .912 .864 .830 .799 .928 .900 .961 .888 .861 .920 .972 .962 .848 .877 .978 .972
Spring
Mean 29.0 26.5 19.5 13.5 12.5 25.1 38.0 19.6 23.1 22.9
RS SD 9.1 9.0 6.3 5.3 5.2 8.3 10.5 6.2 6.9 7.9
SEM 2.6 2.5 2.2 2.1 2.1 2.4 3.3 2.2 2.5 2.6
Mean 215.5 218.9 216.9 218.5 219.3 216.1 214.0 216.5 215.8 215.3 215.6 216.0 216.1 217.9 217.0 216.5 216.6
SS SD 32.2 40.1 29.3 41.0 40.0 33.3 25.5 27.3 27.9 24.7 24.8 26.3 27.2 33.3 31.2 27.5 27.7
SEM 9.2 11.3 10.4 15.8 16.1 8.2 7.5 5.2 8.6 8.5 6.4 4.1 5.0 12.2 10.2 3.8 4.3
K-R 20 .918 .921 .874 .851 .838 .939 .913 .964 .904 .881 .933 .975 .966 .866 .894 .981 .976
Continued on next page…

Techn
ical Ch
aracteristics of th
e Iow
a Assessm
ents
23
Table 9 (continued): Means, Standard Deviations (SD), Reliability Coefficients (K-R 20), and Standard Errors of Measurement (SEM) for the Weighted Sample, Grades K–12
Iowa Assessments Form E
Level 12 Grade 6 R
ead
ing
Writ
ten
Exp
ress
ion
Conventions of Writing
Voc
abul
ary
EL
A T
ota
l
Mathematics
Co
re C
om
po
site
Cor
e C
omp
osite
with
E
T an
d M
Sci
ence
Soc
ial S
tud
ies
Co
mp
lete
Co
mp
osi
te
Com
ple
te C
omp
osite
w
ith E
T an
d M
Sp
ellin
g
Cap
italiz
atio
n
Pun
ctua
tion
Con
vent
ions
of
Writ
ing
Tota
l
Mat
hem
atic
s
Com
put
atio
n
Mat
h T
ota
l
R WE SP CP PC CW V ET M MC MT CT CT- SC SS CC CC-
Number of Items 44 43 32 25 25 39 65 30 39 39
Fall
Mean 29.2 26.5 18.9 12.5 12.4 23.4 37.9 17.8 20.6 22.4
RS SD 8.9 8.7 6.9 4.9 4.8 7.8 11.5 6.3 7.2 8.0
SEM 2.7 2.8 2.4 2.2 2.2 2.7 3.5 2.3 2.8 2.8
Mean 220.0 223.3 221.5 223.1 224.0 220.6 219.2 221.0 220.5 219.3 220.1 220.6 220.8 221.8 221.5 221.0 221.1
SS SD 33.4 41.7 30.3 42.1 41.5 34.8 26.3 28.2 28.9 25.7 25.8 27.5 28.2 34.6 32.5 28.5 28.5
SEM 10.0 13.2 10.5 19.1 19.1 9.4 9.0 5.9 8.9 9.4 6.7 4.5 5.3 13.4 11.2 4.2 4.6
K-R 20 .910 .899 .881 .805 .789 .926 .883 .956 .906 .866 .933 .974 .964 .851 .882 .979 .974
Spring
Mean 30.1 27.9 20.5 13.3 13.3 25.5 41.0 19.7 22.4 24.1
RS SD 8.8 9.0 6.8 5.1 5.2 7.9 11.7 6.7 7.5 8.4
SEM 2.6 2.7 2.3 2.2 2.1 2.6 3.4 2.2 2.7 2.7
Mean 227.3 230.8 229.5 231.1 232.4 228.7 226.7 228.6 228.7 228.4 228.6 228.6 228.7 230.7 229.6 229.1 229.2
SS SD 35.3 45.0 32.2 44.6 45.4 36.8 27.5 29.6 30.6 29.3 27.9 28.9 29.8 36.8 35.5 30.4 30.5
SEM 10.3 13.5 11.0 18.6 18.6 9.4 9.0 6.0 9.0 9.8 6.8 4.6 5.4 13.3 11.3 4.2 4.6
K-R 20 .915 .910 .884 .826 .833 .935 .894 .959 .914 .889 .940 .975 .967 .870 .898 .981 .977
Continued on next page…
24
Io
wa A
ssessmen
ts Techn
ical Sum
mary
Table 9 (continued): Means, Standard Deviations (SD), Reliability Coefficients (K-R 20), and Standard Errors of Measurement (SEM) for the Weighted Sample, Grades K–12
Iowa Assessments Form E
Level 13 Grade 7 R
ead
ing
Writ
ten
Exp
ress
ion
Conventions of Writing
Voc
abul
ary
EL
A T
ota
l
Mathematics
Co
re C
om
po
site
Cor
e C
omp
osite
w
ith E
T an
d M
Sci
ence
Soc
ial S
tud
ies
Co
mp
lete
Co
mp
osi
te
Com
ple
te C
omp
osite
w
ith E
T an
d M
Sp
ellin
g
Cap
italiz
atio
n
Pun
ctua
tion
Con
vent
ions
of
Writ
ing
Tota
l
Mat
hem
atic
s
Com
put
atio
n
Mat
h T
ota
l
R WE SP CP PC CW V ET M MC MT CT CT- SC SS CC CC-
Number of Items 45 45 34 27 27 41 70 31 41 41
Fall
Mean 29.2 26.7 19.2 13.5 12.4 22.3 39.7 16.7 22.5 23.3
RS SD 9.2 9.0 7.1 5.3 5.4 7.9 13.7 6.9 8.3 8.4
SEM 2.8 2.9 2.5 2.3 2.3 2.8 3.6 2.4 2.8 2.9
Mean 231.3 234.7 233.5 235.4 236.8 232.9 231.2 232.7 232.8 231.8 232.5 232.6 232.8 233.9 233.2 232.9 233.0
SS SD 36.3 46.3 32.8 45.9 47.0 38.2 28.2 30.4 31.7 30.1 28.5 29.9 30.8 37.8 36.4 31.4 31.8
SEM 10.9 14.9 11.6 19.8 20.0 10.0 10.1 6.5 8.4 10.7 6.6 4.7 5.3 13.0 12.4 4.3 4.6
K-R 20 .910 .897 .875 .814 .818 .931 .871 .954 .930 .874 .946 .976 .970 .882 .885 .981 .979
Spring
Mean 30.8 27.9 20.6 14.2 13.2 24.3 42.6 18.8 24.1 24.9
RS SD 9.3 9.2 7.1 5.6 5.7 8.1 14.3 7.4 8.5 8.7
SEM 2.7 2.8 2.5 2.3 2.3 2.8 3.5 2.3 2.8 2.8
Mean 238.4 241.6 240.9 242.5 243.6 239.9 238.1 239.7 240.4 240.6 240.5 240.1 240.0 241.7 240.7 240.4 240.4
SS SD 38.6 48.8 34.0 48.1 49.2 40.0 29.0 32.1 33.9 33.5 30.9 31.8 32.9 39.9 39.0 33.2 33.6
SEM 11.1 15.0 11.8 19.4 19.6 9.9 9.9 6.6 8.4 10.6 6.6 4.7 5.3 12.9 12.5 4.3 4.7
K-R 20 .917 .906 .880 .838 .841 .939 .885 .958 .939 .899 .954 .978 .974 .895 .898 .983 .981
Continued on next page…
Techn
ical Ch
aracteristics of th
e Iow
a Assessm
ents
25
Table 9 (continued): Means, Standard Deviations (SD), Reliability Coefficients (K-R 20), and Standard Errors of Measurement (SEM) for the Weighted Sample, Grades K–12
Iowa Assessments Form E
Level 14 Grade 8 R
ead
ing
Writ
ten
Exp
ress
ion
Conventions of Writing
Voc
abul
ary
EL
A T
ota
l
Mathematics
Co
re C
om
po
site
Cor
e C
omp
osite
w
ith E
T an
d M
Sci
ence
Soc
ial S
tud
ies
Co
mp
lete
Co
mp
osi
te
Com
ple
te C
omp
osite
w
ith E
T an
d M
Sp
ellin
g
Cap
italiz
atio
n
Pun
ctua
tion
Con
vent
ions
of
Writ
ing
Tota
l
Mat
hem
atic
s
Com
put
atio
n
Mat
h T
ota
l
R WE SP CP PC CW V ET M MC MT CT CT- SC SS CC CC-
Number of Items 46 48 35 29 29 42 75 32 43 43
Fall
Mean 29.8 28.3 19.0 15.3 13.9 22.8 42.9 18.3 23.0 24.8
RS SD 9.6 10.3 7.3 5.8 6.2 8.4 14.3 7.0 7.9 9.0
SEM 2.8 3.0 2.6 2.4 2.4 2.8 3.7 2.4 2.9 2.8
Mean 242.3 245.2 244.4 246.0 247.2 243.4 241.9 243.4 244.2 243.9 244.1 243.8 243.8 245.0 244.2 244.0 244.1
SS SD 39.5 50.2 34.5 49.0 50.0 41.0 29.7 32.8 34.5 34.1 31.6 32.6 33.5 40.6 39.8 33.9 34.4
SEM 11.6 14.5 12.4 20.2 19.0 10.0 9.9 6.6 8.9 11.7 7.1 4.8 5.5 14.9 12.5 4.6 4.9
K-R 20 .913 .917 .870 .830 .856 .940 .889 .960 .934 .882 .950 .978 .973 .865 .901 .982 .980
Spring
Mean 31.2 29.5 20.5 16.1 14.5 24.7 45.4 19.6 24.3 26.0
RS SD 9.7 10.5 7.3 5.9 6.4 8.8 14.7 7.4 8.1 9.4
SEM 2.7 2.9 2.6 2.3 2.3 2.8 3.6 2.3 2.9 2.8
Mean 248.9 251.5 251.2 251.7 252.4 249.2 248.7 249.8 250.7 251.3 250.9 250.3 250.2 251.5 250.6 250.6 250.5
SS SD 41.4 52.6 35.6 50.5 51.6 42.6 30.9 34.1 36.1 36.8 33.2 33.6 34.5 42.4 42.1 35.2 35.6
SEM 11.7 14.6 12.5 19.9 18.7 9.9 9.7 6.6 8.9 11.7 7.1 4.9 5.5 15.0 12.5 4.6 4.9
K-R 20 .920 .923 .876 .845 .868 .946 .902 .962 .939 .899 .954 .979 .974 .875 .912 .983 .981
Continued on next page…
26
Io
wa A
ssessmen
ts Techn
ical Sum
mary
Table 9 (continued): Means, Standard Deviations (SD), Reliability Coefficients (K-R 20), and Standard Errors of Measurement (SEM) for the Weighted Sample, Grades K–12
Iowa Assessments Form E
Level 15 Grade 9 R
ead
ing
Writ
ten
Exp
ress
ion
Voc
abul
ary
EL
A T
ota
l
Mathematics
Co
re C
om
po
site
Cor
e C
omp
osite
w
ith E
T an
d M
Sci
ence
Soc
ial S
tud
ies
Co
mp
lete
Co
mp
osi
te
Com
ple
te C
omp
osite
w
ith E
T an
d M
Mat
hem
atic
s
Com
put
atio
n
Mat
h T
ota
l
R WE V ET M MC MT CT CT- SC SS CC CC-
Number of Items 40 54 40 40 30 48 50
Fall
Mean 22.1 27.8 19.3 16.2 13.2 20.5 19.2
RS SD 9.1 11.5 9.2 7.9 5.8 8.8 8.7
SEM 2.7 3.2 2.8 2.7 2.4 3.1 3.2
Mean 252.4 254.7 251.8 253.5 254.0 254.4 254.1 253.8 253.7 254.3 253.6 253.8 253.8
SS SD 42.4 43.0 31.4 34.7 36.6 37.5 33.8 34.0 34.8 42.6 42.7 35.5 36.0
SEM 12.9 12.1 9.3 7.5 12.6 15.5 9.9 6.2 7.3 15.3 15.7 5.5 6.1
K-R 20 .913 .921 .908 .953 .882 .828 .915 .967 .955 .871 .866 .976 .971
Spring
Mean 23.4 29.1 21.2 17.5 14.1 21.7 20.6
RS SD 9.4 11.6 9.6 8.4 6.2 9.2 9.4
SEM 2.7 3.2 2.7 2.7 2.4 3.1 3.2
Mean 258.8 260.2 258.2 259.4 259.9 259.6 259.8 259.6 259.7 260.4 259.6 259.7 259.8
SS SD 44.4 43.3 32.7 35.8 38.0 39.0 34.9 34.5 35.6 43.5 43.7 36.5 36.8
SEM 12.5 12.0 9.3 7.5 12.2 15.0 9.5 6.1 7.1 14.9 14.8 5.4 5.9
K-R 20 .920 .923 .920 .956 .897 .852 .925 .969 .960 .883 .886 .978 .974
Continued on next page…
Techn
ical Ch
aracteristics of th
e Iow
a Assessm
ents
27
Table 9 (continued): Means, Standard Deviations (SD), Reliability Coefficients (K-R 20), and Standard Errors of Measurement (SEM) for the Weighted Sample, Grades K–12
Iowa Assessments Form E
Level 16 Grade 10 R
ead
ing
Writ
ten
Exp
ress
ion
Voc
abul
ary
EL
A T
ota
l
Mathematics
Co
re C
om
po
site
Cor
e C
omp
osite
w
ith E
T an
d M
Sci
ence
Soc
ial S
tud
ies
Co
mp
lete
Co
mp
osi
te
Com
ple
te C
omp
osite
w
ith E
T an
d M
Mat
hem
atic
s
Com
put
atio
n
Mat
h T
ota
l
R WE V ET M MC MT CT CT- SC SS CC CC-
Number of Items 40 54 40 40 30 48 50
Fall
Mean 21.8 27.9 18.7 16.4 12.7 21.2 20.4
RS SD 9.7 11.2 9.2 7.9 5.9 9.4 9.4
SEM 2.7 3.3 2.7 2.7 2.4 3.1 3.2
Mean 261.7 263.0 260.6 262.2 262.6 262.7 262.6 262.4 262.4 262.9 262.1 262.4 262.4
SS SD 44.9 44.0 33.0 36.0 38.5 39.3 35.4 35.1 36.0 44.0 44.2 36.9 37.0
SEM 13.5 12.9 9.3 8.0 13.3 16.0 10.4 6.5 7.8 14.5 14.7 5.6 6.2
K-R 20 .920 .914 .910 .951 .881 .834 .914 .965 .954 .891 .889 .977 .972
Spring
Mean 22.8 29.1 20.2 17.4 13.4 22.2 21.4
RS SD 9.9 11.4 9.6 8.3 6.2 9.9 10.1
SEM 2.7 3.3 2.7 2.7 2.4 3.1 3.1
Mean 266.5 267.7 265.9 267.0 267.3 266.9 267.2 267.1 267.2 267.5 266.9 267.1 267.2
SS SD 46.2 45.1 34.1 36.8 39.5 40.5 36.5 36.0 36.6 45.3 45.5 37.7 37.6
SEM 13.1 12.8 9.3 7.9 13.0 15.5 10.1 6.4 7.6 14.2 14.2 5.4 6.1
K-R 20 .925 .919 .920 .954 .892 .853 .923 .968 .957 .902 .903 .979 .974
Continued on next page…
28
Io
wa A
ssessmen
ts Techn
ical Sum
mary
Table 9 (continued): Means, Standard Deviations (SD), Reliability Coefficients (K-R 20), and Standard Errors of Measurement (SEM) for the Weighted Sample, Grades K–12
Iowa Assessments Form E
Level 17/18 Grade 11 R
ead
ing
Writ
ten
Exp
ress
ion
Voc
abul
ary
EL
A T
ota
l
Mathematics
Co
re C
om
po
site
Cor
e C
omp
osite
with
E
T an
d M
Sci
ence
Soc
ial S
tud
ies
Co
mp
lete
Co
mp
osi
te
Com
ple
te C
omp
osite
w
ith E
T an
d M
Mat
hem
atic
s
Com
put
atio
n
Mat
h T
ota
l
R WE V ET M MC MT CT CT- SC SS CC CC-
Number of Items 40 54 40 40 30 48 50
Fall
Mean 23.7 30.0 20.9 15.1 15.2 21.1 22.2
RS SD 9.9 12.0 9.5 8.4 6.7 9.2 10.1
SEM 2.6 3.2 2.7 2.7 2.4 3.1 3.1
Mean 268.8 269.9 268.1 269.2 269.7 269.5 269.6 269.4 269.5 269.7 269.1 269.4 269.4
SS SD 46.4 45.5 34.2 37.2 39.7 41.0 37.0 36.2 37.1 45.8 45.9 38.2 37.9
SEM 13.2 12.2 9.1 7.7 12.9 14.6 9.9 6.2 7.5 15.4 14.3 5.5 6.1
K-R 20 .929 .928 .919 .958 .895 .874 .929 .970 .959 .887 .903 .980 .974
Spring
Mean 24.5 31.2 22.2 16.2 15.8 22.0 23.2
RS SD 9.9 12.2 9.8 9.1 6.9 9.6 10.5
SEM 2.6 3.2 2.7 2.7 2.4 3.1 3.1
Mean 273.0 274.3 272.6 273.6 273.9 273.3 273.7 273.6 273.7 273.8 273.3 273.6 273.7
SS SD 47.3 46.7 35.3 38.2 41.1 42.1 37.8 36.8 37.8 46.9 46.8 38.7 38.8
SEM 12.9 12.1 9.2 7.5 12.3 14.4 9.5 6.1 7.2 15.1 14.0 5.3 5.9
K-R 20 .932 .933 .926 .961 .910 .883 .936 .973 .963 .896 .911 .981 .977
Continued on next page…
Techn
ical Ch
aracteristics of th
e Iow
a Assessm
ents
29
Table 9 (continued): Means, Standard Deviations (SD), Reliability Coefficients (K-R 20), and Standard Errors of Measurement (SEM) for the Weighted Sample, Grades K–12
Iowa Assessments Form E
Level 17/18 Grade 12 R
ead
ing
Writ
ten
Exp
ress
ion
Voc
abul
ary
EL
A T
ota
l
Mathematics
Co
re C
om
po
site
Cor
e C
omp
osite
w
ith E
T an
d M
Sci
ence
Soc
ial S
tud
ies
Co
mp
lete
Co
mp
osi
te
Com
ple
te C
omp
osite
w
ith E
T an
d M
Mat
hem
atic
s
Com
put
atio
n
Mat
h T
ota
l
R WE V ET M MC MT CT CT- SC SS CC CC-
Number of Items 40 54 40 40 30 48 50
Fall
Mean 25.0 31.6 22.5 16.5 16.0 22.3 23.7
RS SD 9.9 12.2 9.8 9.3 7.0 9.7 10.7
SEM 2.6 3.2 2.6 2.7 2.4 3.1 3.1
Mean 274.6 276.1 273.9 275.2 275.6 275.1 275.4 275.3 275.4 274.9 275.1 275.2 275.3
SS SD 47.3 46.8 35.3 38.2 41.4 42.5 38.1 37.1 37.8 47.1 47.0 39.0 39.2
SEM 12.8 12.1 9.2 7.5 12.1 14.3 9.4 6.0 7.1 15.0 13.7 5.3 5.8
K-R 20 .932 .933 .927 .961 .914 .887 .939 .974 .964 .898 .915 .982 .978
Spring
Mean 25.6 32.5 23.6 17.3 16.6 23.1 24.7
RS SD 9.9 12.4 9.9 9.7 7.2 10.0 11.2
SEM 2.6 3.1 2.6 2.7 2.3 3.1 3.1
Mean 278.2 279.6 277.6 278.8 278.8 278.7 278.8 178.8 278.8 278.3 279.1 278.8 278.8
SS SD 48.1 47.7 36.2 38.8 42.3 43.4 38.7 37.8 38.2 47.7 47.9 39.4 39.5
SEM 12.5 12.0 9.3 7.4 11.8 14.1 9.2 5.9 7.0 14.8 13.3 5.2 5.7
K-R 20 .934 .937 .932 .963 .922 .894 .944 .976 .967 .904 .923 .983 .979
Difficulty of the Tests
30 Iowa Assessments Technical Summary
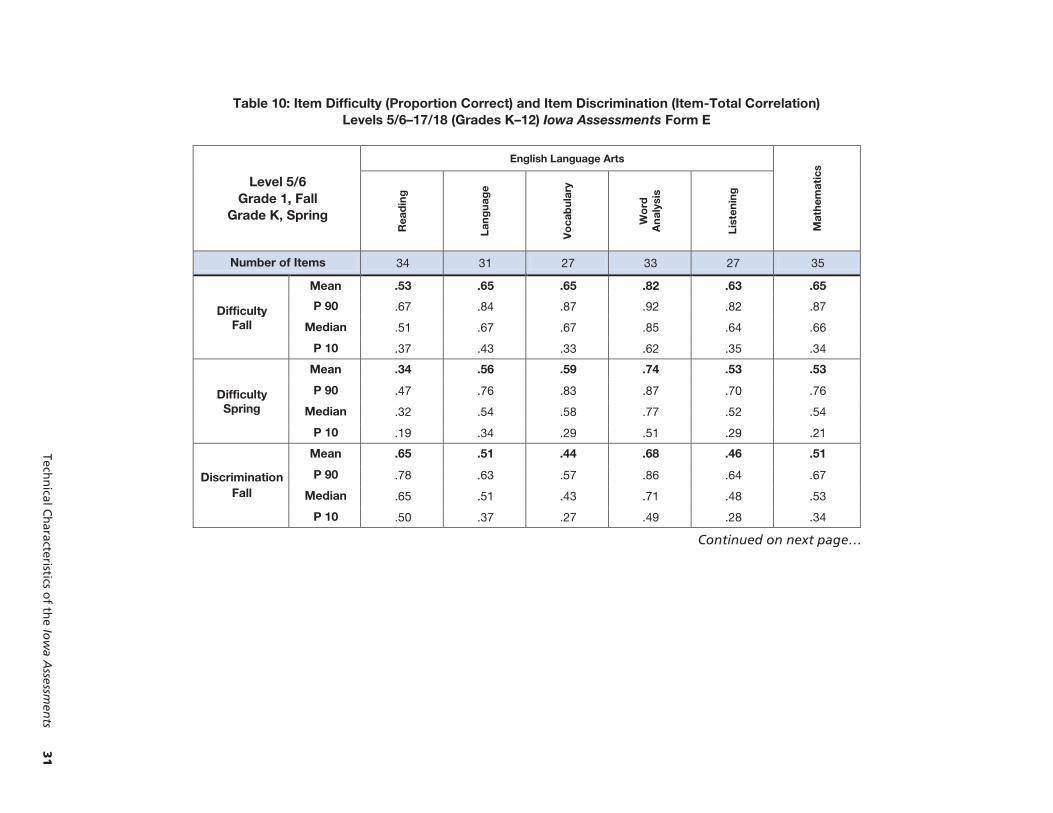
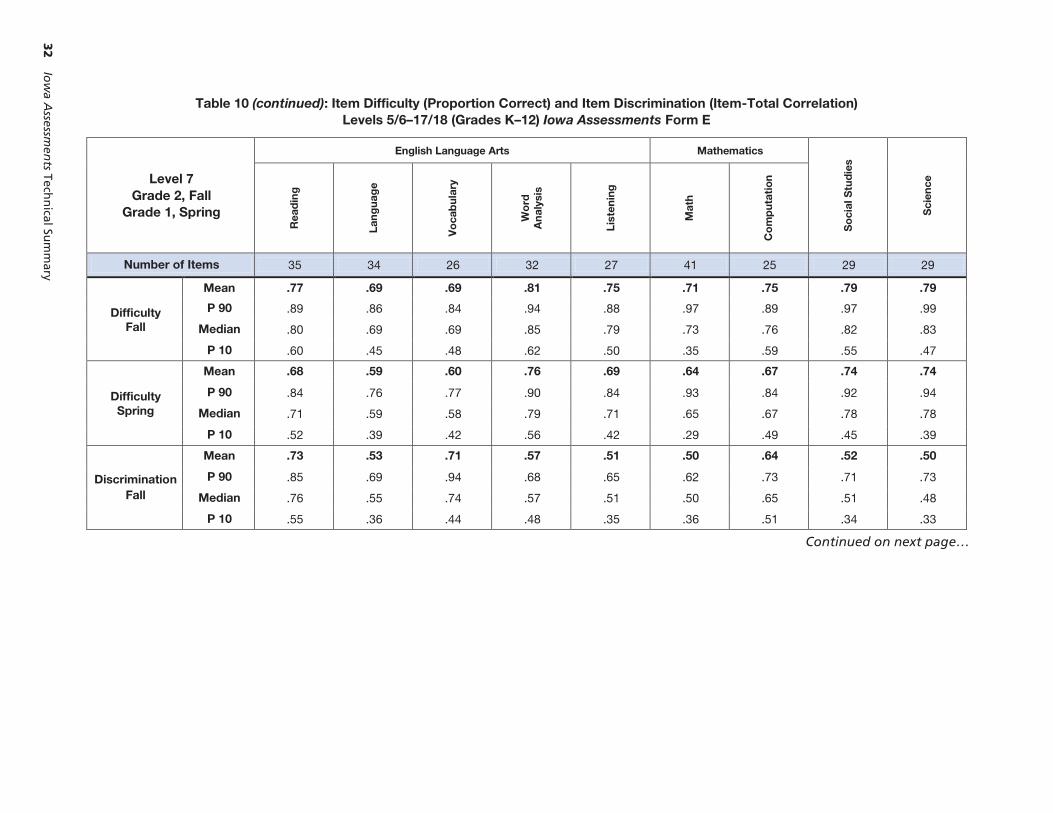
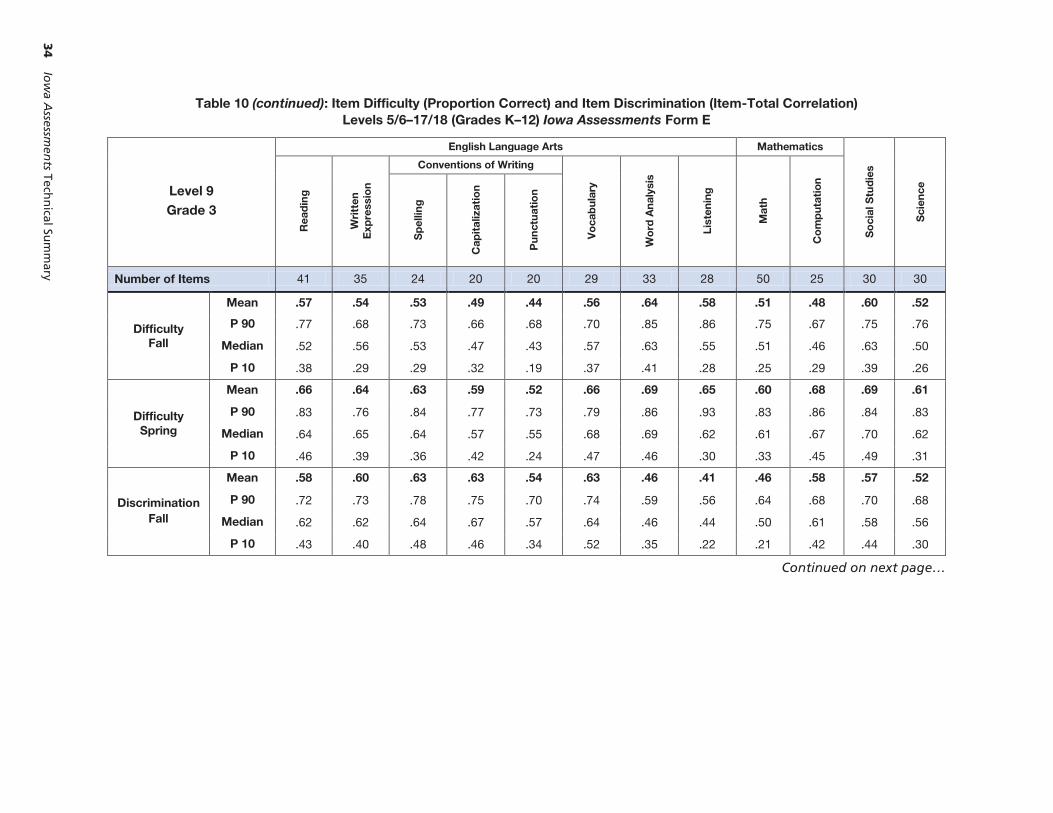
To obtain high reliability of test scores within a group, an assessment must use nearly the entire range of possible scores; the raw scores on the test should range from near zero to the highest possible score. The best way to ensure such a continuum is to conduct one or more preliminary tryouts of items that will determine objectively the difficulty and discriminating power of the items. A few items included in the final test should be so easy that at least 90 percent of students answer them correctly. These allow the assessment to identify the least-able students. Similarly, a few very difficult items should be included to challenge the most-able students. Most items, however, should be of medium difficulty and should discriminate well at all levels of ability. A test constructed in this manner results in the widest possible range of scores and yields the highest reliability per unit of testing time.
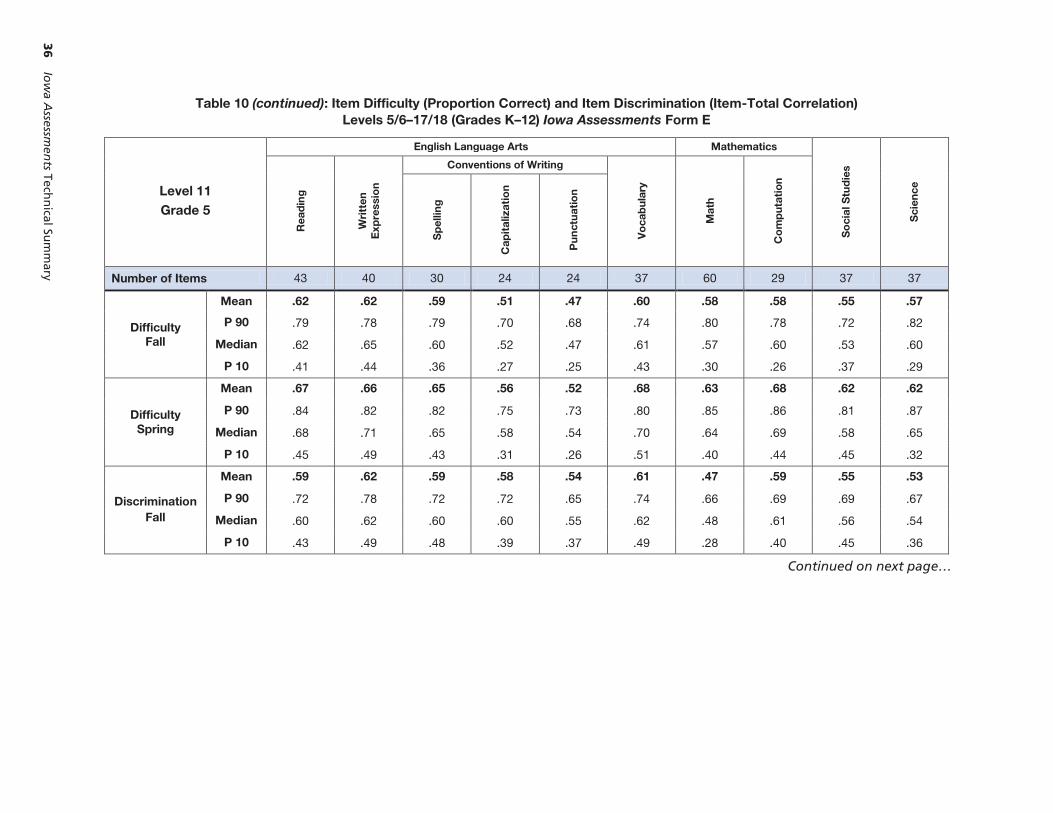
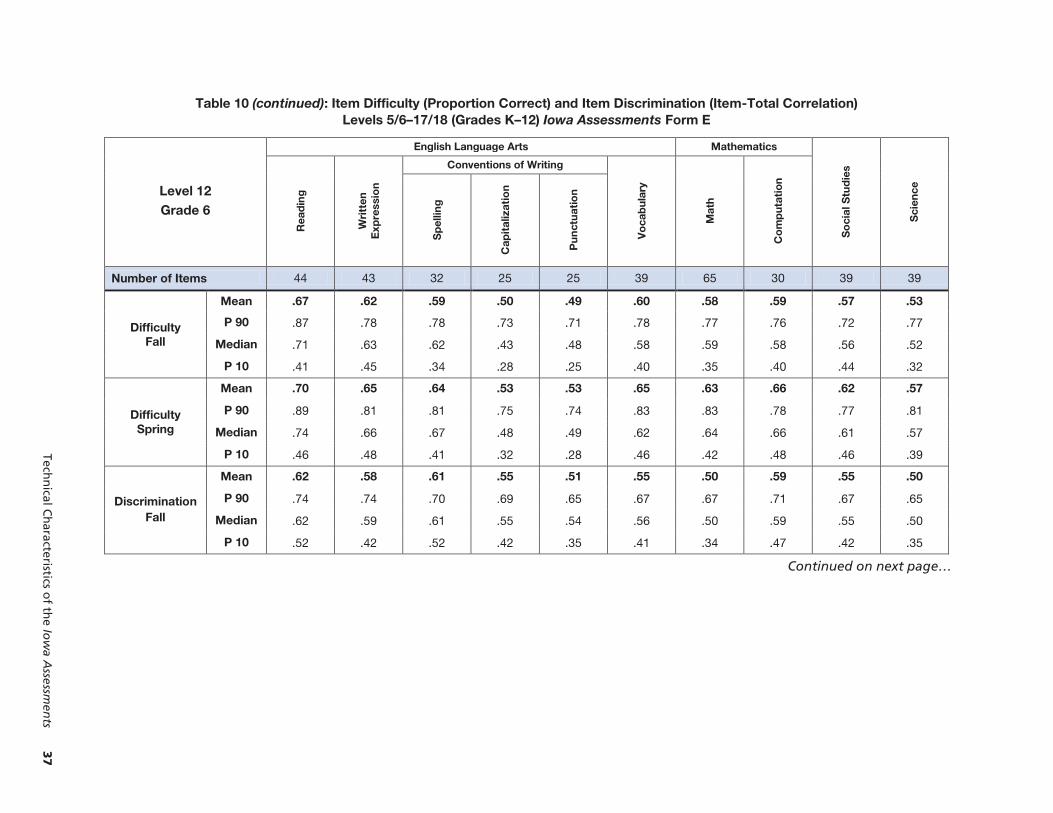
A summary of the difficulty indices for all tests and grades is presented in Table 10. The difficulty indices reported for each grade are item proportions (p-values) rather than percents correct. The mean item proportions correct are shown in bold.
In addition, it is important to know how highly related individual items are to total achievement in a domain. A well-constructed assessment strives for items with strong correlations with total scores. Distributions of item-total correlations (item discrimination indices) are also reported in Table 10.
The raw scores on the test should range from near zero to the highest possible score. The best way to ensure such a continuum is to conduct one or more preliminary tryouts of items that will determine objectively the difficulty and discriminating power of the items.
Techn
ical Ch
aracteristics of th
e Iow
a Assessm
ents
31
Table 10: Item Difficulty (Proportion Correct) and Item Discrimination (Item-Total Correlation) Levels 5/6–17/18 (Grades K–12) Iowa Assessments Form E
Level 5/6 Grade 1, Fall
Grade K, Spring
English Language Arts
Mat
hem
atic
s
Rea
din
g
Lan
gu
age
Vo
cab
ula
ry
Wo
rd
An
alys
is
Lis
ten
ing
Number of Items 34 31 27 33 27 35
Difficulty Fall
Mean .53 .65 .65 .82 .63 .65
P 90 .67 .84 .87 .92 .82 .87
Median .51 .67 .67 .85 .64 .66
P 10 .37 .43 .33 .62 .35 .34
Difficulty Spring
Mean .34 .56 .59 .74 .53 .53
P 90 .47 .76 .83 .87 .70 .76
Median .32 .54 .58 .77 .52 .54
P 10 .19 .34 .29 .51 .29 .21
Discrimination Fall
Mean .65 .51 .44 .68 .46 .51
P 90 .78 .63 .57 .86 .64 .67
Median .65 .51 .43 .71 .48 .53
P 10 .50 .37 .27 .49 .28 .34
Continued on next page…
32
Io
wa A
ssessmen
ts Techn
ical Sum
mary
Table 10 (continued): Item Difficulty (Proportion Correct) and Item Discrimination (Item-Total Correlation) Levels 5/6–17/18 (Grades K–12) Iowa Assessments Form E
Level 7 Grade 2, Fall
Grade 1, Spring
English Language Arts Mathematics
So
cial
Stu
die
s
Sci
ence
Rea
din
g
Lan
gu
age
Vo
cab
ula
ry
Wo
rd
An
alys
is
Lis
ten
ing
Mat
h
Co
mp
utat
ion
Number of Items 35 34 26 32 27 41 25 29 29
Difficulty Fall
Mean .77 .69 .69 .81 .75 .71 .75 .79 .79
P 90 .89 .86 .84 .94 .88 .97 .89 .97 .99
Median .80 .69 .69 .85 .79 .73 .76 .82 .83
P 10 .60 .45 .48 .62 .50 .35 .59 .55 .47
Difficulty Spring
Mean .68 .59 .60 .76 .69 .64 .67 .74 .74
P 90 .84 .76 .77 .90 .84 .93 .84 .92 .94
Median .71 .59 .58 .79 .71 .65 .67 .78 .78
P 10 .52 .39 .42 .56 .42 .29 .49 .45 .39
Discrimination Fall
Mean .73 .53 .71 .57 .51 .50 .64 .52 .50
P 90 .85 .69 .94 .68 .65 .62 .73 .71 .73
Median .76 .55 .74 .57 .51 .50 .65 .51 .48
P 10 .55 .36 .44 .48 .35 .36 .51 .34 .33
Continued on next page…

Techn
ical Ch
aracteristics of th
e Iow
a Assessm
ents
33
Table 10 (continued): Item Difficulty (Proportion Correct) and Item Discrimination (Item-Total Correlation) Levels 5/6–17/18 (Grades K–12) Iowa Assessments Form E
Level 8 Grade 3, Fall
Grade 2, Spring
English Language Arts Mathematics
So
cial
Stu
die
s
Sci
ence
Rea
din
g
Lan
gu
age
Vo
cab
ula
ry
Wo
rd
An
alys
is
Lis
ten
ing
Mat
h
Co
mp
utat
ion
Number of Items 38 42 26 33 27 46 27 29 29
Difficulty Fall
Mean .76 .76 .68 .81 .77 .75 .79 .76 .74
P 90 .92 .87 .94 .94 .92 .93 .87 .95 .95
Median .78 .77 .64 .82 .78 .81 .81 .81 .78
P 10 .59 .62 .45 .59 .61 .41 .66 .47 .44
Difficulty Spring
Mean .71 .70 .63 .77 .71 .70 .75 .71 .69
P 90 .87 .82 .90 .91 .86 .89 .87 .90 .88
Median .71 .71 .56 .80 .69 .77 .77 .76 .74
P 10 .52 .55 .40 .54 .55 .35 .58 .42 .38
Discrimination Fall
Mean .67 .57 .59 .59 .52 .55 .74 .54 .49
P 90 .93 .71 .80 .73 .63 .69 .87 .68 .65
Median .66 .59 .60 .59 .55 .57 .75 .53 .51
P 10 .41 .39 .37 .47 .35 .36 .60 .38 .28
Continued on next page…
34
Io
wa A
ssessmen
ts Techn
ical Sum
mary
Table 10 (continued): Item Difficulty (Proportion Correct) and Item Discrimination (Item-Total Correlation) Levels 5/6–17/18 (Grades K–12) Iowa Assessments Form E
Level 9 Grade 3
English Language Arts Mathematics
So
cial
Stu
die
s
Sci
ence
Rea
din
g
Wri
tten
E
xpre
ssio
n
Conventions of Writing
Vo
cab
ula
ry
Wo
rd A
nal
ysis
Lis
ten
ing
Mat
h
Co
mp
utat
ion
Sp
ellin
g
Cap
ital
izat
ion
Pu
nct
uat
ion
Number of Items 41 35 24 20 20 29 33 28 50 25 30 30
Difficulty Fall
Mean .57 .54 .53 .49 .44 .56 .64 .58 .51 .48 .60 .52
P 90 .77 .68 .73 .66 .68 .70 .85 .86 .75 .67 .75 .76
Median .52 .56 .53 .47 .43 .57 .63 .55 .51 .46 .63 .50
P 10 .38 .29 .29 .32 .19 .37 .41 .28 .25 .29 .39 .26
Difficulty Spring
Mean .66 .64 .63 .59 .52 .66 .69 .65 .60 .68 .69 .61
P 90 .83 .76 .84 .77 .73 .79 .86 .93 .83 .86 .84 .83
Median .64 .65 .64 .57 .55 .68 .69 .62 .61 .67 .70 .62
P 10 .46 .39 .36 .42 .24 .47 .46 .30 .33 .45 .49 .31
Discrimination Fall
Mean .58 .60 .63 .63 .54 .63 .46 .41 .46 .58 .57 .52
P 90 .72 .73 .78 .75 .70 .74 .59 .56 .64 .68 .70 .68
Median .62 .62 .64 .67 .57 .64 .46 .44 .50 .61 .58 .56
P 10 .43 .40 .48 .46 .34 .52 .35 .22 .21 .42 .44 .30
Continued on next page…

Techn
ical Ch
aracteristics of th
e Iow
a Assessm
ents
35
Table 10 (continued): Item Difficulty (Proportion Correct) and Item Discrimination (Item-Total Correlation) Levels 5/6–17/18 (Grades K–12) Iowa Assessments Form E
Level 10 Grade 4
English Language Arts Mathematics
So
cial
Stu
die
s
Sci
ence
Rea
din
g
Wri
tten
E
xpre
ssio
n
Conventions of Writing
Vo
cab
ula
ry
Mat
h
Co
mp
utat
ion
Sp
ellin
g
Cap
ital
izat
ion
Pu
nct
uat
ion
Number of Items 42 38 27 22 22 34 55 27 34 34
Difficulty Fall
Mean .62 .58 .56 .53 .46 .59 .56 .57 .57 .56
P 90 .82 .74 .79 .68 .70 .75 .78 .77 .77 .78
Median .63 .61 .53 .55 .43 .56 .55 .58 .57 .53
P 10 .39 .35 .32 .31 .25 .44 .30 .33 .36 .33
Difficulty Spring
Mean .67 .64 .65 .58 .53 .67 .63 .69 .64 .63
P 90 .84 .78 .85 .73 .78 .81 .84 .84 .82 .84
Median .68 .69 .66 .61 .51 .66 .65 .70 .63 .61
P 10 .43 .42 .41 .35 .29 .53 .38 .52 .43 .38
Discrimination Fall
Mean .60 .60 .60 .60 .56 .62 .49 .58 .54 .54
P 90 .75 .78 .73 .73 .70 .72 .70 .69 .69 .74
Median .62 .63 .60 .65 .59 .64 .49 .63 .54 .53
P 10 .40 .39 .48 .49 .39 .50 .29 .40 .38 .36
Continued on next page…
36
Io
wa A
ssessmen
ts Techn
ical Sum
mary
Table 10 (continued): Item Difficulty (Proportion Correct) and Item Discrimination (Item-Total Correlation) Levels 5/6–17/18 (Grades K–12) Iowa Assessments Form E
Level 11 Grade 5
English Language Arts Mathematics
So
cial
Stu
die
s
Sci
ence
Rea
din
g
Wri
tten
E
xpre
ssio
n
Conventions of Writing
Vo
cab
ula
ry
Mat
h
Co
mp
utat
ion
Sp
ellin
g
Cap
ital
izat
ion
Pu
nct
uat
ion
Number of Items 43 40 30 24 24 37 60 29 37 37
Difficulty Fall
Mean .62 .62 .59 .51 .47 .60 .58 .58 .55 .57
P 90 .79 .78 .79 .70 .68 .74 .80 .78 .72 .82
Median .62 .65 .60 .52 .47 .61 .57 .60 .53 .60
P 10 .41 .44 .36 .27 .25 .43 .30 .26 .37 .29
Difficulty Spring
Mean .67 .66 .65 .56 .52 .68 .63 .68 .62 .62
P 90 .84 .82 .82 .75 .73 .80 .85 .86 .81 .87
Median .68 .71 .65 .58 .54 .70 .64 .69 .58 .65
P 10 .45 .49 .43 .31 .26 .51 .40 .44 .45 .32
Discrimination Fall
Mean .59 .62 .59 .58 .54 .61 .47 .59 .55 .53
P 90 .72 .78 .72 .72 .65 .74 .66 .69 .69 .67
Median .60 .62 .60 .60 .55 .62 .48 .61 .56 .54
P 10 .43 .49 .48 .39 .37 .49 .28 .40 .45 .36
Continued on next page…
Techn
ical Ch
aracteristics of th
e Iow
a Assessm
ents
37
Table 10 (continued): Item Difficulty (Proportion Correct) and Item Discrimination (Item-Total Correlation) Levels 5/6–17/18 (Grades K–12) Iowa Assessments Form E
Level 12 Grade 6
English Language Arts Mathematics
So
cial
Stu
die
s
Sci
ence
Rea
din
g
Wri
tten
E
xpre
ssio
n
Conventions of Writing
Vo
cab
ula
ry
Mat
h
Co
mp
utat
ion
Sp
ellin
g
Cap
ital
izat
ion
Pu
nct
uat
ion
Number of Items 44 43 32 25 25 39 65 30 39 39
Difficulty Fall
Mean .67 .62 .59 .50 .49 .60 .58 .59 .57 .53
P 90 .87 .78 .78 .73 .71 .78 .77 .76 .72 .77
Median .71 .63 .62 .43 .48 .58 .59 .58 .56 .52
P 10 .41 .45 .34 .28 .25 .40 .35 .40 .44 .32
Difficulty Spring
Mean .70 .65 .64 .53 .53 .65 .63 .66 .62 .57
P 90 .89 .81 .81 .75 .74 .83 .83 .78 .77 .81
Median .74 .66 .67 .48 .49 .62 .64 .66 .61 .57
P 10 .46 .48 .41 .32 .28 .46 .42 .48 .46 .39
Discrimination Fall
Mean .62 .58 .61 .55 .51 .55 .50 .59 .55 .50
P 90 .74 .74 .70 .69 .65 .67 .67 .71 .67 .65
Median .62 .59 .61 .55 .54 .56 .50 .59 .55 .50
P 10 .52 .42 .52 .42 .35 .41 .34 .47 .42 .35
Continued on next page…

38
Io
wa A
ssessmen
ts Techn
ical Sum
mary
Table 10 (continued): Item Difficulty (Proportion Correct) and Item Discrimination (Item-Total Correlation) Levels 5/6–17/18 (Grades K–12) Iowa Assessments Form E
Level 13 Grade 7
English Language Arts Mathematics
So
cial
Stu
die
s
Sci
ence
Rea
din
g
Wri
tten
E
xpre
ssio
n
Conventions of Writing
Vo
cab
ula
ry
Mat
h
Co
mp
utat
ion
Sp
ellin
g
Cap
ital
izat
ion
Pu
nct
uat
ion
Number of Items 45 45 34 27 27 41 70 31 41 41
Difficulty Fall
Mean .65 .59 .57 .50 .46 .54 .57 .54 .57 .55
P 90 .83 .77 .77 .72 .67 .72 .73 .70 .69 .68
Median .66 .61 .55 .47 .47 .54 .60 .52 .58 .56
P 10 .47 .35 .36 .28 .25 .37 .32 .36 .39 .36
Difficulty Spring
Mean .68 .62 .61 .53 .49 .59 .61 .61 .61 .59
P 90 .85 .79 .81 .74 .69 .78 .75 .75 .74 .72
Median .69 .63 .60 .50 .49 .58 .65 .60 .62 .61
P 10 .50 .39 .40 .30 .29 .40 .38 .46 .44 .38
Discrimination Fall
Mean .60 .56 .58 .53 .54 .52 .53 .59 .55 .54
P 90 .72 .72 .65 .63 .69 .66 .68 .68 .67 .71
Median .61 .58 .60 .54 .54 .51 .54 .60 .55 .54
P 10 .47 .41 .46 .44 .37 .39 .38 .49 .44 .36
Continued on next page…

Techn
ical Ch
aracteristics of th
e Iow
a Assessm
ents
39
Table 10 (continued): Item Difficulty (Proportion Correct) and Item Discrimination (Item-Total Correlation) Levels 5/6–17/18 (Grades K–12) Iowa Assessments Form E
Level 14 Grade 8
English Language Arts Mathematics
So
cial
Stu
die
s
Sci
ence
Rea
din
g
Wri
tten
E
xpre
ssio
n
Conventions of Writing
Vo
cab
ula
ry
Mat
h
Co
mp
utat
ion
Sp
ellin
g
Cap
ital
izat
ion
Pu
nct
uat
ion
Number of Items 46 48 35 29 29 42 75 32 43 43
Difficulty Fall
Mean .65 .59 .54 .53 .48 .54 .57 .57 .58 .54
P 90 .78 .76 .72 .71 .65 .74 .79 .80 .75 .77
Median .67 .60 .52 .51 .48 .52 .58 .52 .56 .51
P 10 .48 .43 .37 .29 .30 .34 .32 .41 .41 .35
Difficulty Spring
Mean .68 .61 .59 .56 .50 .59 .61 .61 .61 .57
P 90 .80 .79 .75 .73 .67 .77 .83 .83 .78 .78
Median .71 .62 .56 .55 .52 .59 .62 .55 .60 .52
P 10 .51 .44 .41 .30 .31 .38 .36 .47 .43 .39
Discrimination Fall
Mean .60 .59 .55 .54 .57 .55 .55 .60 .57 .50
P 90 .72 .74 .68 .68 .73 .69 .70 .72 .72 .67
Median .61 .61 .56 .56 .60 .57 .58 .60 .58 .52
P 10 .43 .45 .46 .44 .38 .43 .38 .47 .41 .25
Continued on next page…
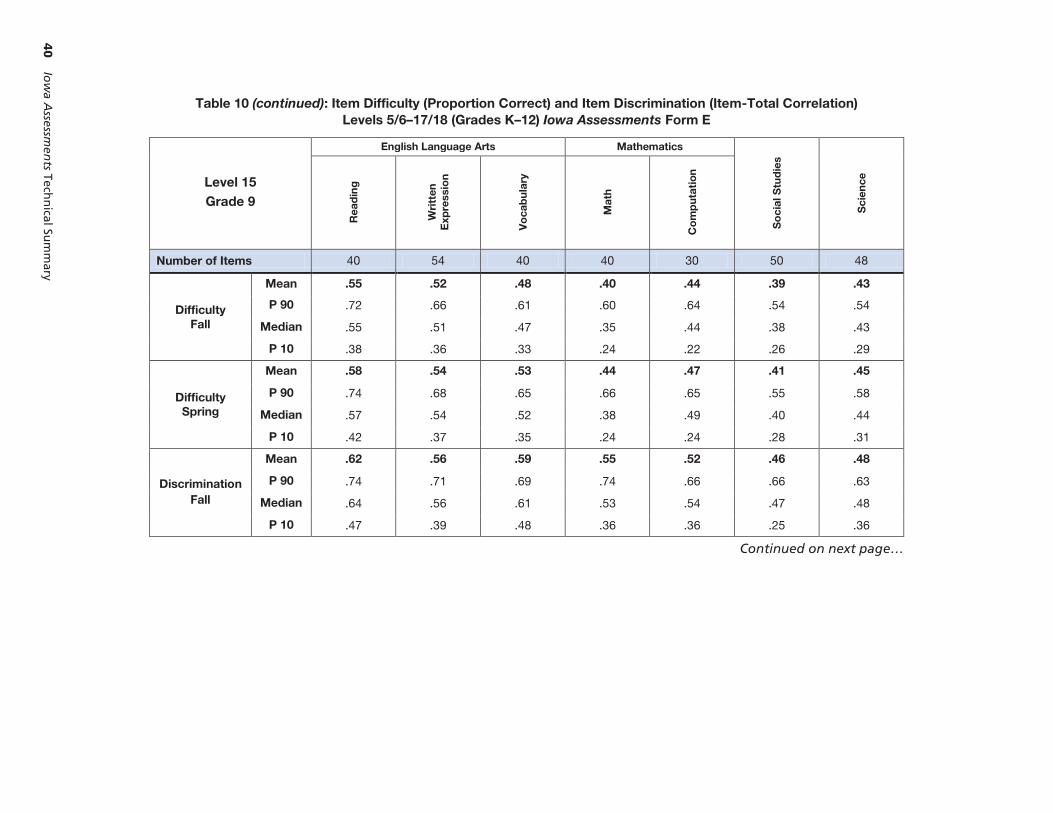
40
Io
wa A
ssessmen
ts Techn
ical Sum
mary
Table 10 (continued): Item Difficulty (Proportion Correct) and Item Discrimination (Item-Total Correlation) Levels 5/6–17/18 (Grades K–12) Iowa Assessments Form E
Level 15 Grade 9
English Language Arts Mathematics
So
cial
Stu
die
s
Sci
ence
Rea
din
g
Wri
tten
E
xpre
ssio
n
Vo
cab
ula
ry
Mat
h
Co
mp
utat
ion
Number of Items 40 54 40 40 30 50 48
Difficulty Fall
Mean .55 .52 .48 .40 .44 .39 .43
P 90 .72 .66 .61 .60 .64 .54 .54
Median .55 .51 .47 .35 .44 .38 .43
P 10 .38 .36 .33 .24 .22 .26 .29
Difficulty Spring
Mean .58 .54 .53 .44 .47 .41 .45
P 90 .74 .68 .65 .66 .65 .55 .58
Median .57 .54 .52 .38 .49 .40 .44
P 10 .42 .37 .35 .24 .24 .28 .31
Discrimination Fall
Mean .62 .56 .59 .55 .52 .46 .48
P 90 .74 .71 .69 .74 .66 .66 .63
Median .64 .56 .61 .53 .54 .47 .48
P 10 .47 .39 .48 .36 .36 .25 .36
Continued on next page…
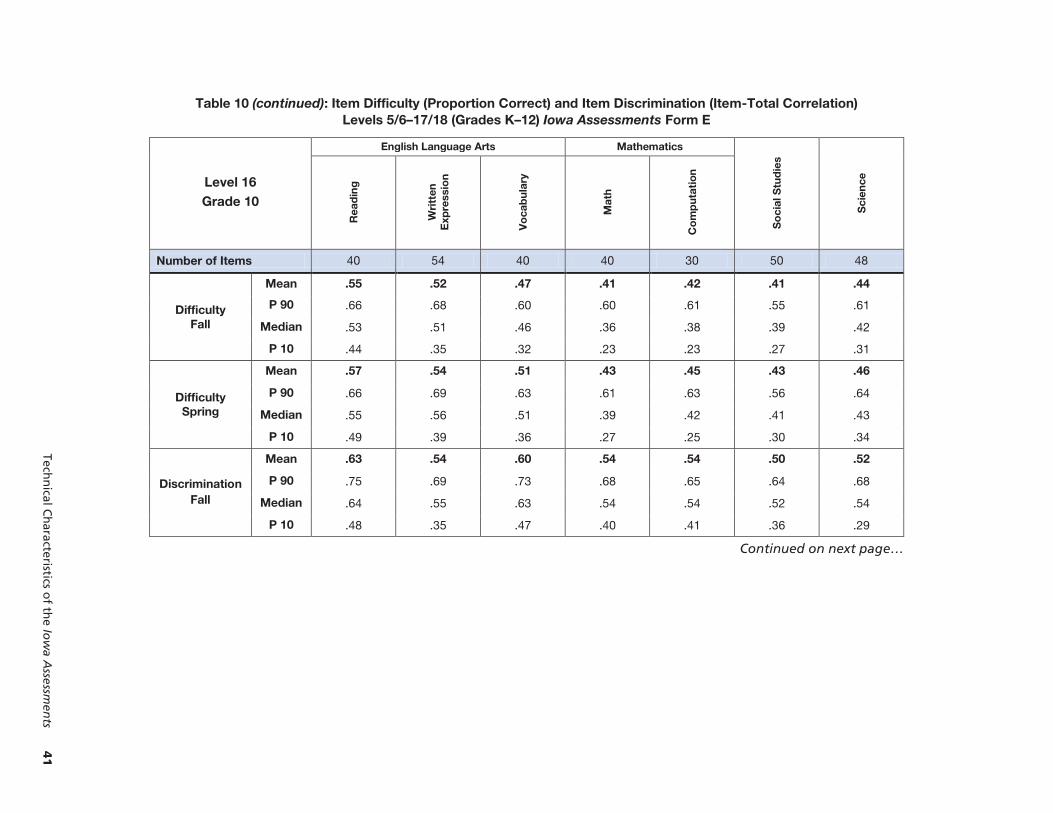
Techn
ical Ch
aracteristics of th
e Iow
a Assessm
ents
41
Table 10 (continued): Item Difficulty (Proportion Correct) and Item Discrimination (Item-Total Correlation) Levels 5/6–17/18 (Grades K–12) Iowa Assessments Form E
Level 16 Grade 10
English Language Arts Mathematics
So
cial
Stu
die
s
Sci
ence
Rea
din
g
Wri
tten
E
xpre
ssio
n
Vo
cab
ula
ry
Mat
h
Co
mp
utat
ion
Number of Items 40 54 40 40 30 50 48
Difficulty Fall
Mean .55 .52 .47 .41 .42 .41 .44
P 90 .66 .68 .60 .60 .61 .55 .61
Median .53 .51 .46 .36 .38 .39 .42
P 10 .44 .35 .32 .23 .23 .27 .31
Difficulty Spring
Mean .57 .54 .51 .43 .45 .43 .46
P 90 .66 .69 .63 .61 .63 .56 .64
Median .55 .56 .51 .39 .42 .41 .43
P 10 .49 .39 .36 .27 .25 .30 .34
Discrimination Fall
Mean .63 .54 .60 .54 .54 .50 .52
P 90 .75 .69 .73 .68 .65 .64 .68
Median .64 .55 .63 .54 .54 .52 .54
P 10 .48 .35 .47 .40 .41 .36 .29
Continued on next page…

42
Io
wa A
ssessmen
ts Techn
ical Sum
mary
Table 10 (continued): Item Difficulty (Proportion Correct) and Item Discrimination (Item-Total Correlation) Levels 5/6–17/18 (Grades K–12) Iowa Assessments Form E
Level 17/18 Grade 11
English Language Arts Mathematics
So
cial
Stu
die
s
Sci
ence
Rea
din
g
Wri
tten
E
xpre
ssio
n
Vo
cab
ula
ry
Mat
h
Co
mp
utat
ion
Number of Items 40 54 40 40 30 50 48
Difficulty Fall
Mean .59 .56 .52 .38 .51 .45 .44
P 90 .74 .70 .66 .51 .67 .59 .64
Median .59 .52 .50 .36 .52 .43 .42
P 10 .47 .42 .34 .28 .30 .28 .28
Difficulty Spring
Mean .61 .58 .56 .40 .53 .46 .46
P 90 .75 .71 .68 .51 .68 .61 .65
Median .59 .55 .56 .38 .52 .44 .43
P 10 .49 .44 .38 .30 .31 .32 .31
Discrimination Fall
Mean .66 .58 .62 .54 .59 .52 .51
P 90 .79 .70 .73 .66 .72 .67 .70
Median .69 .58 .60 .54 .58 .54 .51
P 10 .48 .44 .49 .40 .45 .38 .33
Continued on next page…

Techn
ical Ch
aracteristics of th
e Iow
a Assessm
ents
43
Table 10 (continued): Item Difficulty (Proportion Correct) and Item Discrimination (Item-Total Correlation) Levels 5/6–17/18 (Grades K–12) Iowa Assessments Form E
Level 17/18 Grade 12
English Language Arts Mathematics
So
cial
Stu
die
s
Sci
ence
Rea
din
g
Wri
tten
E
xpre
ssio
n
Vo
cab
ula
ry
Mat
h
Co
mp
utat
ion
Number of Items 40 54 40 40 30 50 48
Difficulty Fall
Mean .63 .59 .56 .41 .53 .47 .46
P 90 .75 .72 .68 .53 .68 .61 .65
Median .61 .57 .56 .39 .54 .46 .43
P 10 .52 .45 .38 .31 .33 .32 .32
Difficulty Spring
Mean .64 .60 .59 .43 .55 .49 .48
P 90 .77 .74 .72 .55 .69 .63 .67
Median .62 .57 .59 .42 .55 .48 .45
P 10 .52 .46 .39 .32 .35 .34 .33
Discrimination Fall
Mean .67 .59 .64 .55 .60 .53 .50
P 90 .78 .72 .75 .66 .72 .68 .70
Median .68 .60 .64 .55 .59 .56 .49
P 10 .51
.46 .53 .42 .48 .39 .31

Ceiling and Floor Effects
44 Iowa Assessments Technical Summary
In schools where all students in a given grade are tested with the same test level, it is important that each test level accurately measure students of all ability levels. For exceptionally able students or students who are challenged in skills development, individualized testing or out-of-level testing with appropriate levels can be used to match test content and item difficulty to student ability levels.
Students at the extremes of the score distributions are of special concern. To measure high-ability students accurately, the test must have enough ceiling to allow such students to demonstrate their skills. If the test is too easy, a considerable proportion of these students will obtain perfect or near-perfect scores, and such scores may have deflated percentile ranks. If the test is too difficult for low-ability students, many will obtain chance scores and such scores may have inflated percentile ranks.
A summary of ceiling and floor effects for kindergarten through grade 8 for fall and spring is shown in Table 11. On the top line of the table for each grade is the number of items in each test (k). Under “Ceiling,” the percentile rank of a perfect score is listed for each test as well as the percentile rank of a score one less than perfect (k – 1).
A “chance” score is frequently defined as the number of items in the test divided by the average number of responses per item. The percentile ranks of these “chance” estimates are listed under “Floor.” Of course, not all students who score at this level do so by chance. However, when a substantial proportion of students in a group score at this level, it is an indication the test may be too difficult and that individualized testing should be considered.
If the test is too easy, a considerable proportion of high-ability students will obtain perfect or near-perfect scores. If the test is too difficult for low-ability students, many will obtain chance scores and such scores may have inflated percentile ranks.
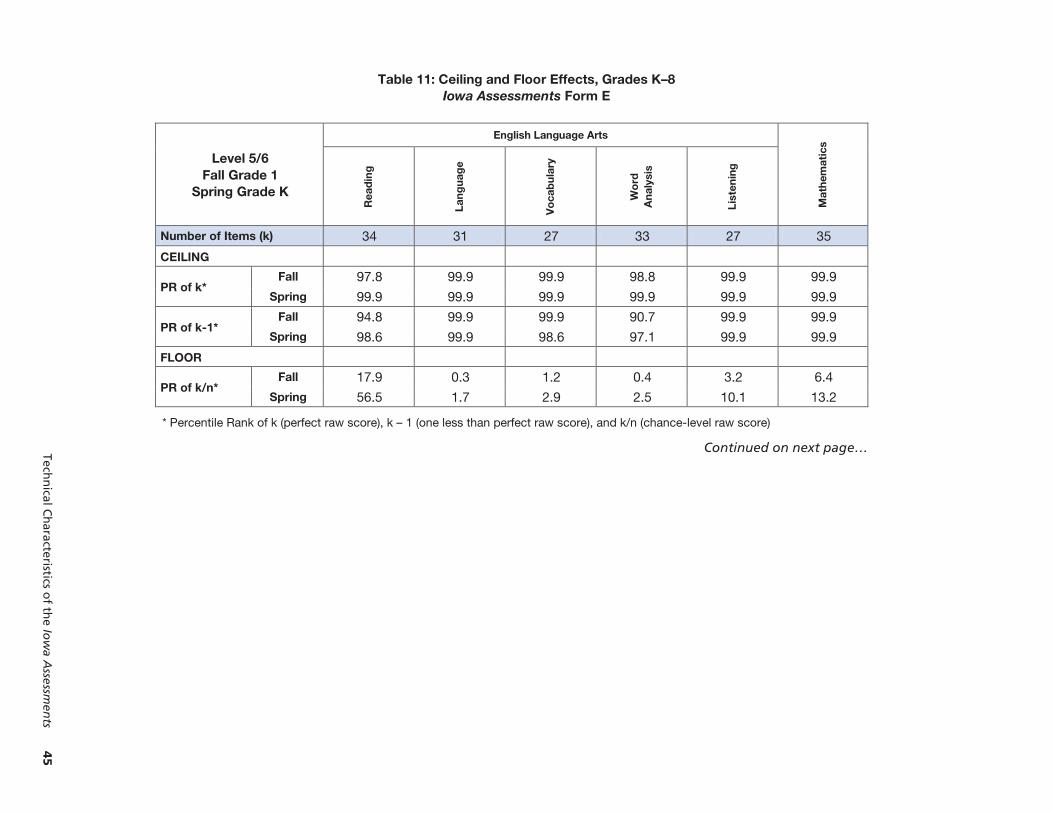
Techn
ical Ch
aracteristics of th
e Iow
a Assessm
ents
45
Table 11: Ceiling and Floor Effects, Grades K–8 Iowa Assessments Form E
Level 5/6 Fall Grade 1
Spring Grade K
English Language Arts
Mat
hem
atic
s
Rea
din
g
Lan
gu
age
Vo
cab
ula
ry
Wo
rd
An
alys
is
Lis
ten
ing
Number of Items (k) 34 31 27 33 27 35
CEILING
PR of k* Fall 97.8 99.9 99.9 98.8 99.9 99.9
Spring 99.9 99.9 99.9 99.9 99.9 99.9
PR of k-1* Fall 94.8 99.9 99.9 90.7 99.9 99.9
Spring 98.6 99.9 98.6 97.1 99.9 99.9
FLOOR
PR of k/n* Fall 17.9 0.3 1.2 0.4 3.2 6.4
Spring 56.5 1.7 2.9 2.5 10.1 13.2
* Percentile Rank of k (perfect raw score), k – 1 (one less than perfect raw score), and k/n (chance-level raw score)
Continued on next page…

46
Io
wa A
ssessmen
ts Techn
ical Sum
mary
Table 11 (continued): Ceiling and Floor Effects, Grades K–8 Iowa Assessments Form E
Level 7 Fall Grade 2
Spring Grade 1
English Language Arts Mathematics
So
cial
S
tud
ies
Sci
ence
Rea
din
g
Lan
gu
age
Vo
cab
ula
ry
Wo
rd
An
alys
is
Lis
ten
ing
Mat
h
Co
mp
utat
ion
Number of Items (k) 35 34 26 32 27 41 25 29 29
CEILING
PR of k* Fall 96.0 94.3 97.7 95.1 99.9 99.9 96.3 99.9 98.7
Spring 98.0 99.9 98.9 98.5 99.9 99.9 98.8 99.9 99.9
PR of k-1* Fall 92.0 91.7 91.9 86.0 96.4 98.1 89.4 94.8 96.9
Spring 95.2 99.9 95.8 93.7 99.1 99.9 95.4 99.0 99.1
FLOOR
PR of k/n* Fall 2.9 3.5 4.1 0.1 0.3 0.1 1.6 0.1 0.1
Spring 6.7 7.5 6.9 0.3 1.4 0.7 3.4 0.1 0.1
* Percentile Rank of k (perfect raw score), k – 1 (one less than perfect raw score), and k/n (chance-level raw score)
Continued on next page…
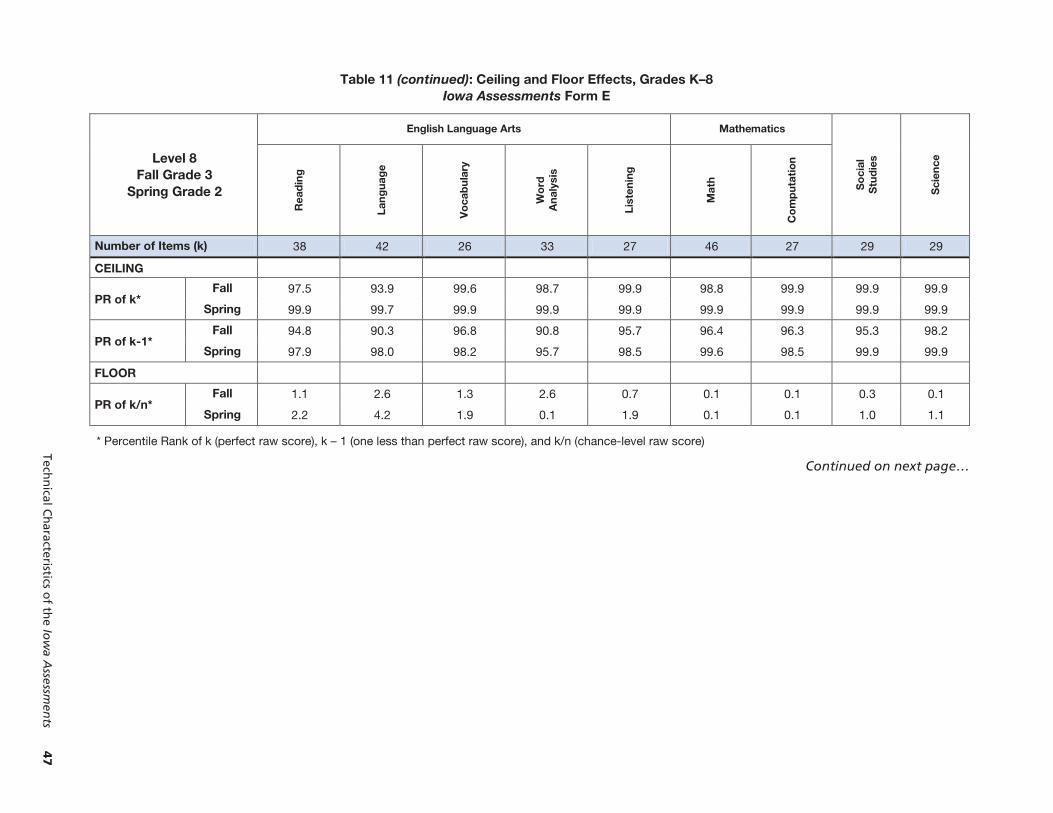
Techn
ical Ch
aracteristics of th
e Iow
a Assessm
ents
47
Table 11 (continued): Ceiling and Floor Effects, Grades K–8 Iowa Assessments Form E
Level 8 Fall Grade 3
Spring Grade 2
English Language Arts Mathematics
So
cial
S
tud
ies
Sci
ence
Rea
din
g
Lan
gu
age
Vo
cab
ula
ry
Wo
rd
An
alys
is
Lis
ten
ing
Mat
h
Co
mp
utat
ion
Number of Items (k) 38 42 26 33 27 46 27 29 29
CEILING
PR of k* Fall 97.5 93.9 99.6 98.7 99.9 98.8 99.9 99.9 99.9
Spring 99.9 99.7 99.9 99.9 99.9 99.9 99.9 99.9 99.9
PR of k-1* Fall 94.8 90.3 96.8 90.8 95.7 96.4 96.3 95.3 98.2
Spring 97.9 98.0 98.2 95.7 98.5 99.6 98.5 99.9 99.9
FLOOR
PR of k/n* Fall 1.1 2.6 1.3 2.6 0.7 0.1 0.1 0.3 0.1
Spring 2.2 4.2 1.9 0.1 1.9 0.1 0.1 1.0 1.1
* Percentile Rank of k (perfect raw score), k – 1 (one less than perfect raw score), and k/n (chance-level raw score)
Continued on next page…
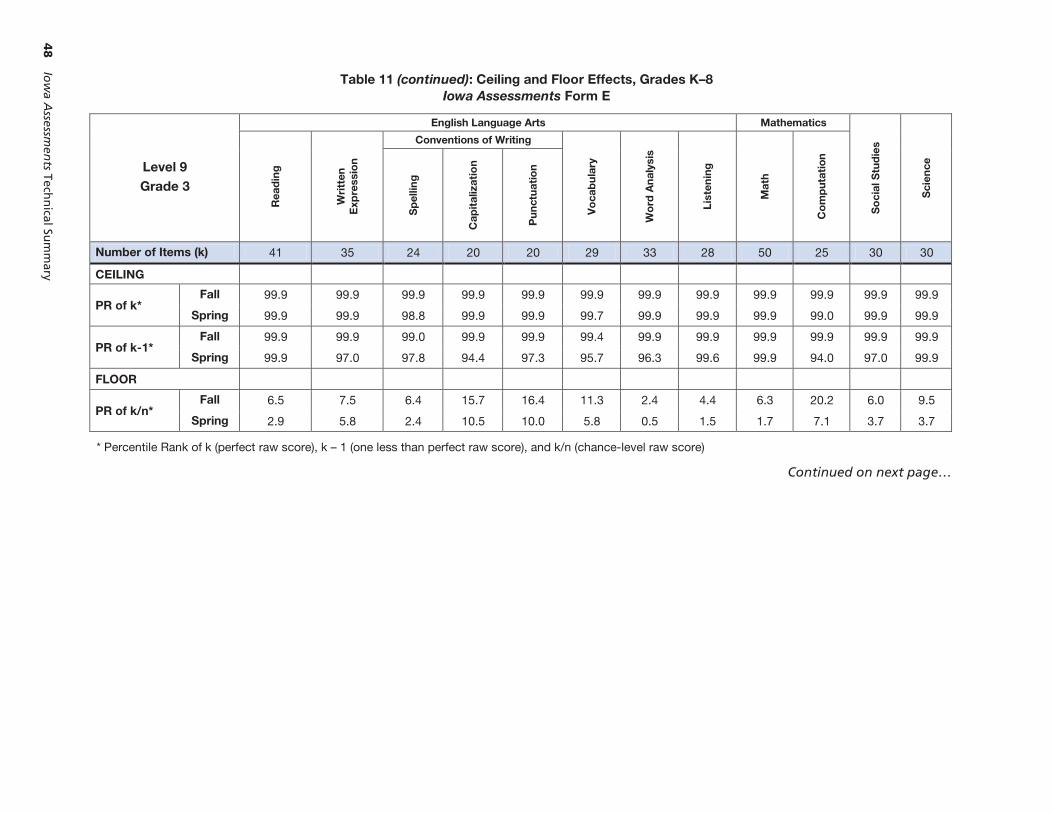
48
Io
wa A
ssessmen
ts Techn
ical Sum
mary
Table 11 (continued): Ceiling and Floor Effects, Grades K–8 Iowa Assessments Form E
Level 9 Grade 3
English Language Arts Mathematics
So
cial
Stu
die
s
Sci
ence
Rea
din
g
Wri
tten
E
xpre
ssio
n
Conventions of Writing
Vo
cab
ula
ry
Wo
rd A
nal
ysis
Lis
ten
ing
Mat
h
Co
mp
utat
ion
Sp
ellin
g
Cap
ital
izat
ion
Pu
nct
uat
ion
Number of Items (k) 41 35 24 20 20 29 33 28 50 25 30 30
CEILING
PR of k* Fall 99.9 99.9 99.9 99.9 99.9 99.9 99.9 99.9 99.9 99.9 99.9 99.9
Spring 99.9 99.9 98.8 99.9 99.9 99.7 99.9 99.9 99.9 99.0 99.9 99.9
PR of k-1* Fall 99.9 99.9 99.0 99.9 99.9 99.4 99.9 99.9 99.9 99.9 99.9 99.9
Spring 99.9 97.0 97.8 94.4 97.3 95.7 96.3 99.6 99.9 94.0 97.0 99.9
FLOOR
PR of k/n* Fall 6.5 7.5 6.4 15.7 16.4 11.3 2.4 4.4 6.3 20.2 6.0 9.5
Spring 2.9 5.8 2.4 10.5 10.0 5.8 0.5 1.5 1.7 7.1 3.7 3.7
* Percentile Rank of k (perfect raw score), k – 1 (one less than perfect raw score), and k/n (chance-level raw score)
Continued on next page…
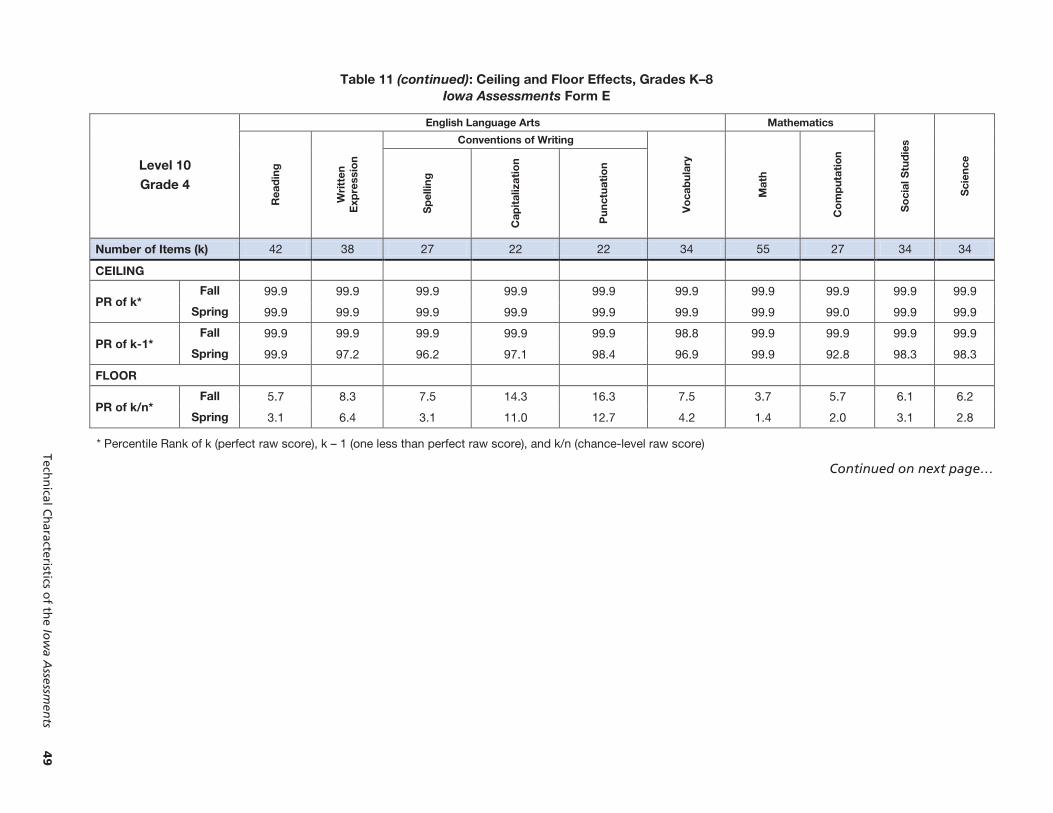
Techn
ical Ch
aracteristics of th
e Iow
a Assessm
ents
49
Table 11 (continued): Ceiling and Floor Effects, Grades K–8 Iowa Assessments Form E
Level 10 Grade 4
English Language Arts Mathematics
So
cial
Stu
die
s
Sci
ence
Rea
din
g
Wri
tten
E
xpre
ssio
n
Conventions of Writing
Vo
cab
ula
ry
Mat
h
Co
mp
utat
ion
Sp
ellin
g
Cap
ital
izat
ion
Pu
nct
uat
ion
Number of Items (k) 42 38 27 22 22 34 55 27 34 34
CEILING
PR of k* Fall 99.9 99.9 99.9 99.9 99.9 99.9 99.9 99.9 99.9 99.9
Spring 99.9 99.9 99.9 99.9 99.9 99.9 99.9 99.0 99.9 99.9
PR of k-1* Fall 99.9 99.9 99.9 99.9 99.9 98.8 99.9 99.9 99.9 99.9
Spring 99.9 97.2 96.2 97.1 98.4 96.9 99.9 92.8 98.3 98.3
FLOOR
PR of k/n* Fall 5.7 8.3 7.5 14.3 16.3 7.5 3.7 5.7 6.1 6.2
Spring 3.1 6.4 3.1 11.0 12.7 4.2 1.4 2.0 3.1 2.8
* Percentile Rank of k (perfect raw score), k – 1 (one less than perfect raw score), and k/n (chance-level raw score)
Continued on next page…

50
Io
wa A
ssessmen
ts Techn
ical Sum
mary
Table 11 (continued): Ceiling and Floor Effects, Grades K–8 Iowa Assessments Form E
Level 11 Grade 5
English Language Arts Mathematics
So
cial
Stu
die
s
Sci
ence
Rea
din
g
Wri
tten
E
xpre
ssio
n
Conventions of Writing
Vo
cab
ula
ry
Mat
h
Co
mp
utat
ion
Sp
ellin
g
Cap
ital
izat
ion
Pu
nct
uat
ion
Number of Items (k) 43 40 30 24 24 37 60 29 37 37
CEILING
PR of k* Fall 99.9 99.9 99.9 99.9 99.9 99.9 99.9 99.9 99.9 99.9
Spring 99.9 99.9 99.9 99.9 99.9 99.9 99.9 99.9 99.9 99.9
PR of k-1* Fall 99.9 99.9 99.9 99.9 99.9 98.4 99.9 99.9 99.9 99.9
Spring 98.3 98.3 96.9 98.0 98.1 95.0 99.9 94.8 98.2 98.3
FLOOR
PR of k/n* Fall 5.4 4.7 3.3 11.0 11.5 6.6 1.7 7.2 8.4 4.8
Spring 3.4 3.7 0.8 8.4 8.9 3.9 0.4 3.9 5.5 2.4
* Percentile Rank of k (perfect raw score), k – 1 (one less than perfect raw score), and k/n (chance-level raw score)
Continued on next page…
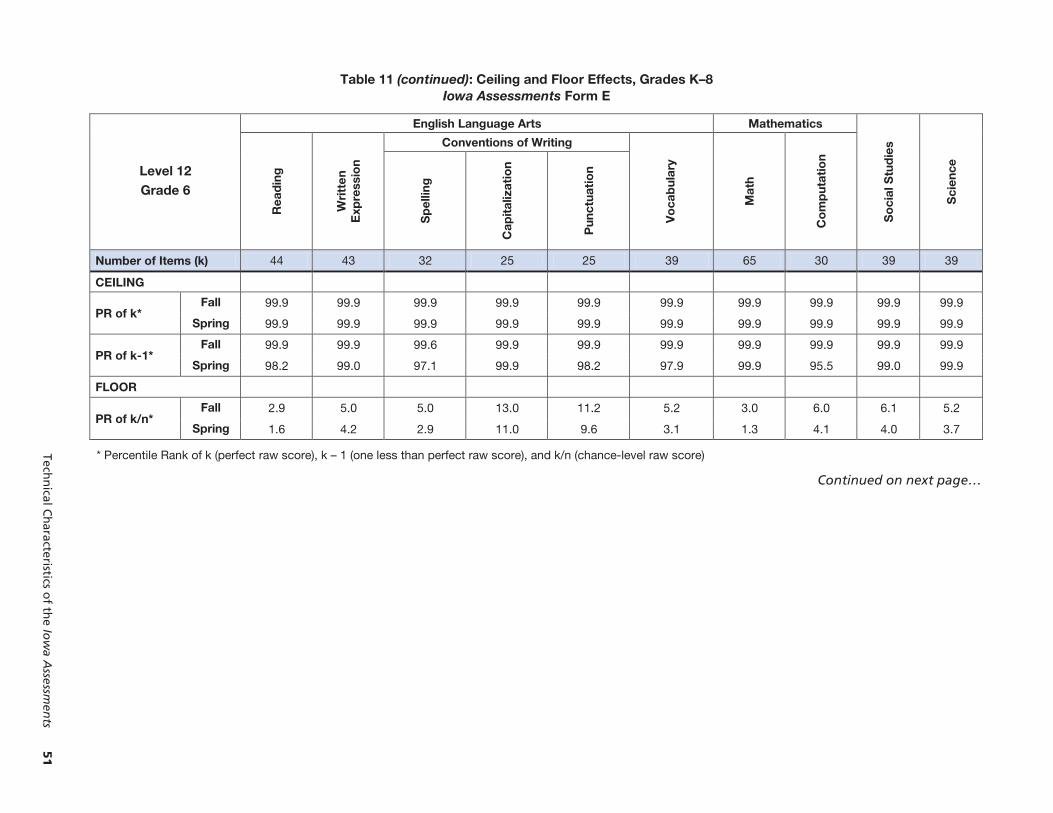
Techn
ical Ch
aracteristics of th
e Iow
a Assessm
ents
51
Table 11 (continued): Ceiling and Floor Effects, Grades K–8 Iowa Assessments Form E
Level 12 Grade 6
English Language Arts Mathematics
So
cial
Stu
die
s
Sci
ence
Rea
din
g
Wri
tten
E
xpre
ssio
n
Conventions of Writing
Vo
cab
ular
y
Mat
h
Co
mp
utat
ion
Sp
ellin
g
Cap
ital
izat
ion
Pun
ctua
tio
n
Number of Items (k) 44 43 32 25 25 39 65 30 39 39
CEILING
PR of k* Fall 99.9 99.9 99.9 99.9 99.9 99.9 99.9 99.9 99.9 99.9
Spring 99.9 99.9 99.9 99.9 99.9 99.9 99.9 99.9 99.9 99.9
PR of k-1* Fall 99.9 99.9 99.6 99.9 99.9 99.9 99.9 99.9 99.9 99.9
Spring 98.2 99.0 97.1 99.9 98.2 97.9 99.9 95.5 99.0 99.9
FLOOR
PR of k/n* Fall 2.9 5.0 5.0 13.0 11.2 5.2 3.0 6.0 6.1 5.2
Spring 1.6 4.2 2.9 11.0 9.6 3.1 1.3 4.1 4.0 3.7
* Percentile Rank of k (perfect raw score), k – 1 (one less than perfect raw score), and k/n (chance-level raw score)
Continued on next page…

52
Io
wa A
ssessmen
ts Techn
ical Sum
mary
Table 11 (continued): Ceiling and Floor Effects, Grades K–8 Iowa Assessments Form E
Level 13 Grade 7
English Language Arts Mathematics
So
cial
Stu
die
s
Sci
ence
Rea
din
g
Wri
tten
E
xpre
ssio
n
Conventions of Writing
Vo
cab
ular
y
Mat
h
Co
mp
utat
ion
Sp
ellin
g
Cap
ital
izat
ion
Pun
ctua
tio
n
Number of Items (k) 45 45 34 27 27 41 70 31 41 41
CEILING
PR of k* Fall 99.9 99.9 99.9 99.9 99.9 99.9 99.9 99.9 99.9 99.9
Spring 99.9 99.9 99.9 99.9 99.9 99.9 99.9 99.9 99.9 99.9
PR of k-1* Fall 99.9 99.9 99.9 99.9 99.9 99.9 99.9 99.9 99.9 99.9
Spring 98.5 99.9 98.2 99.1 99.3 99.1 99.8 96.7 99.9 99.7
FLOOR
PR of k/n* Fall 4.2 5.9 4.4 9.7 14.5 5.8 4.5 9.4 7.4 8.6
Spring 3.5 5.2 2.3 8.6 12.8 4.5 2.7 7.3 5.9 6.9
* Percentile Rank of k (perfect raw score), k – 1 (one less than perfect raw score), and k/n (chance-level raw score)
Continued on next page…
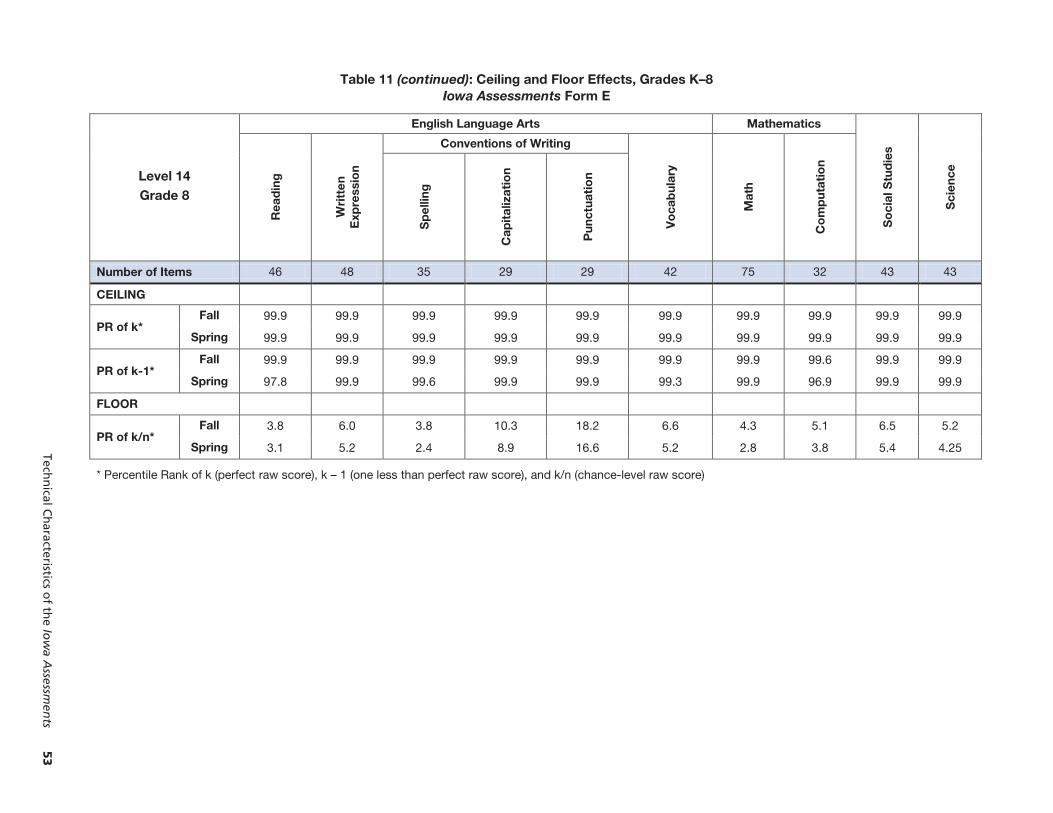
Techn
ical Ch
aracteristics of th
e Iow
a Assessm
ents
53
Table 11 (continued): Ceiling and Floor Effects, Grades K–8 Iowa Assessments Form E
Level 14 Grade 8
English Language Arts Mathematics
So
cial
Stu
die
s
Sci
ence
Rea
din
g
Wri
tten
E
xpre
ssio
n
Conventions of Writing
Vo
cab
ular
y
Mat
h
Co
mp
utat
ion
Sp
ellin
g
Cap
ital
izat
ion
Pun
ctua
tio
n
Number of Items 46 48 35 29 29 42 75 32 43 43
CEILING
PR of k* Fall 99.9 99.9 99.9 99.9 99.9 99.9 99.9 99.9 99.9 99.9
Spring 99.9 99.9 99.9 99.9 99.9 99.9 99.9 99.9 99.9 99.9
PR of k-1* Fall 99.9 99.9 99.9 99.9 99.9 99.9 99.9 99.6 99.9 99.9
Spring 97.8 99.9 99.6 99.9 99.9 99.3 99.9 96.9 99.9 99.9
FLOOR
PR of k/n* Fall 3.8 6.0 3.8 10.3 18.2 6.6 4.3 5.1 6.5 5.2
Spring 3.1 5.2 2.4 8.9 16.6 5.2 2.8 3.8 5.4 4.25
* Percentile Rank of k (perfect raw score), k – 1 (one less than perfect raw score), and k/n (chance-level raw score)

54 Iowa Assessments Technical Summary


AssessmentsIowa
TM


