Page 1
RESEARCH REPORT USDI, U.S. Geological Survey
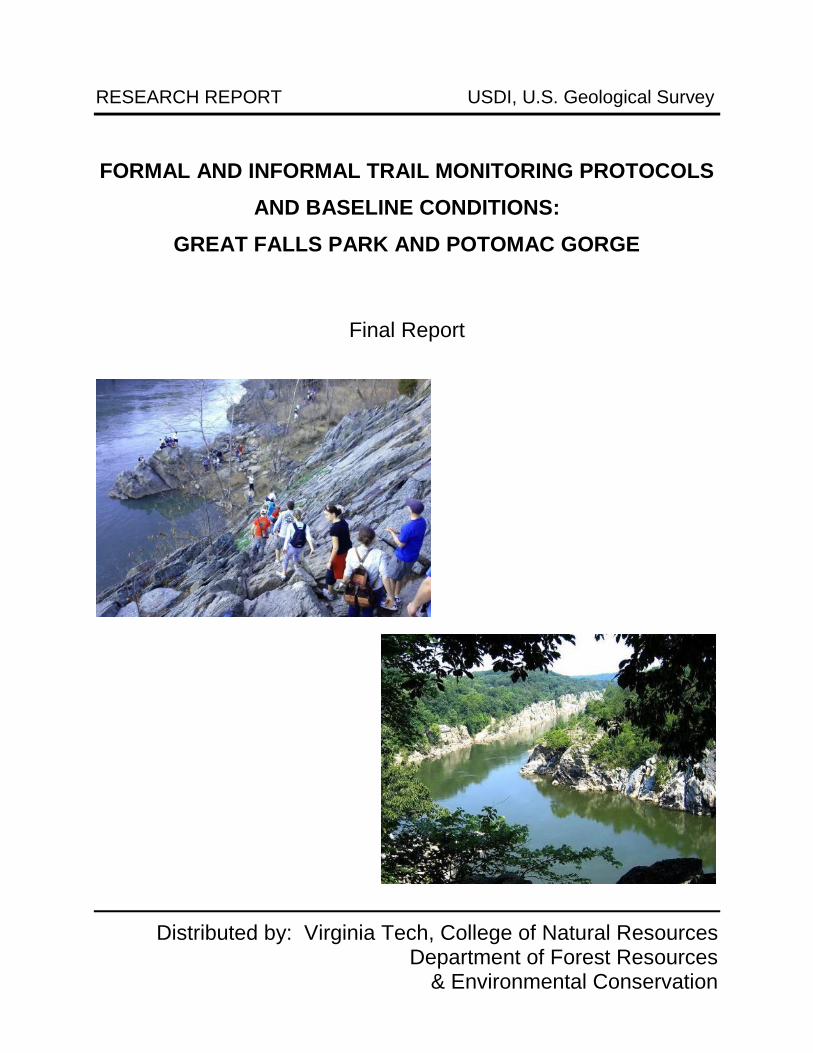
FORMAL AND INFORMAL TRAIL MONITORING PROTOCOLS
AND BASELINE CONDITIONS:
GREAT FALLS PARK AND POTOMAC GORGE
Final Report
Distributed by: Virginia Tech, College of Natural Resources Department of Forest Resources
& Environmental Conservation
Page 2
FORMAL AND INFORMAL TRAIL MONITORING PROTOCOLS
AND BASELINE CONDITIONS:
GREAT FALLS PARK AND POTOMAC GORGE
January 2011
by: Jeremy Wimpey
Postdoctoral Research Associate
Virginia Tech/Department of Forest Resources & Environmental Conservation
Virginia Tech/FREC (0324) Blacksburg, VA 24061
Jeffrey L. Marion
Unit Leader/Adjunct Professor
Virginia Tech Field Unit USGS Patuxent Wildlife Research Center
Virginia Tech/FREC (0324) Blacksburg, VA 24061
Final Report for the USDI, National Park Service
Chesapeake & Ohio Canal National Historical Park George Washington Memorial Parkway
U.S. Geological Survey, Virginia Tech Field Unit
College of Natural Resources & Environment
Department of Forest Resources & Environmental Conservation
& Environmental Conservation Management
Page 3
Page i
TABLE OF CONTENTS
TABLE OF CONTENTS ............................................................................................................................................ I
FIGURES .................................................................................................................................................................. III
TABLES .................................................................................................................................................................... III
ACKNOWLEDGEMENTS ..................................................................................................................................... IV
EXECUTIVE SUMMARY ...................................................................................................................................... IV
INTRODUCTION ....................................................................................................................................................... 8
JUSTIFICATION FOR MONITORING ................................................................................................................ 10
LEGISLATIVE MANDATES ........................................................................................................................................ 10 Agency Organic Act ........................................................................................................................................... 10 Management Policies and Guidelines ................................................................................................................ 11
CARRYING CAPACITY DECISION-MAKING ............................................................................................................... 13 VISITOR PERCEPTIONS OF RESOURCE CONDITIONS ................................................................................................. 15 MONITORING PROGRAM CAPABILITIES ................................................................................................................... 16
LITERATURE REVIEW ......................................................................................................................................... 17
VISITATION-RELATED RESOURCE IMPACTS ............................................................................................................. 17 Formal Trail Impacts ......................................................................................................................................... 17 Informal Trail Impacts ....................................................................................................................................... 19 Trail Management .............................................................................................................................................. 20
INDICATORS AND SELECTION CRITERIA................................................................................................................... 21 Preferred Indicators ........................................................................................................................................... 23
TYPES OF TRAIL IMPACT ASSESSMENT SYSTEMS .................................................................................................... 24 Assessing Informal Trail Networks .................................................................................................................... 25
STUDY AREA ........................................................................................................................................................... 27
METHODS ................................................................................................................................................................. 30
TRAIL ASSESSMENT PROCEDURES ........................................................................................................................... 30 Formal Trails ..................................................................................................................................................... 30 Informal Trails ................................................................................................................................................... 33
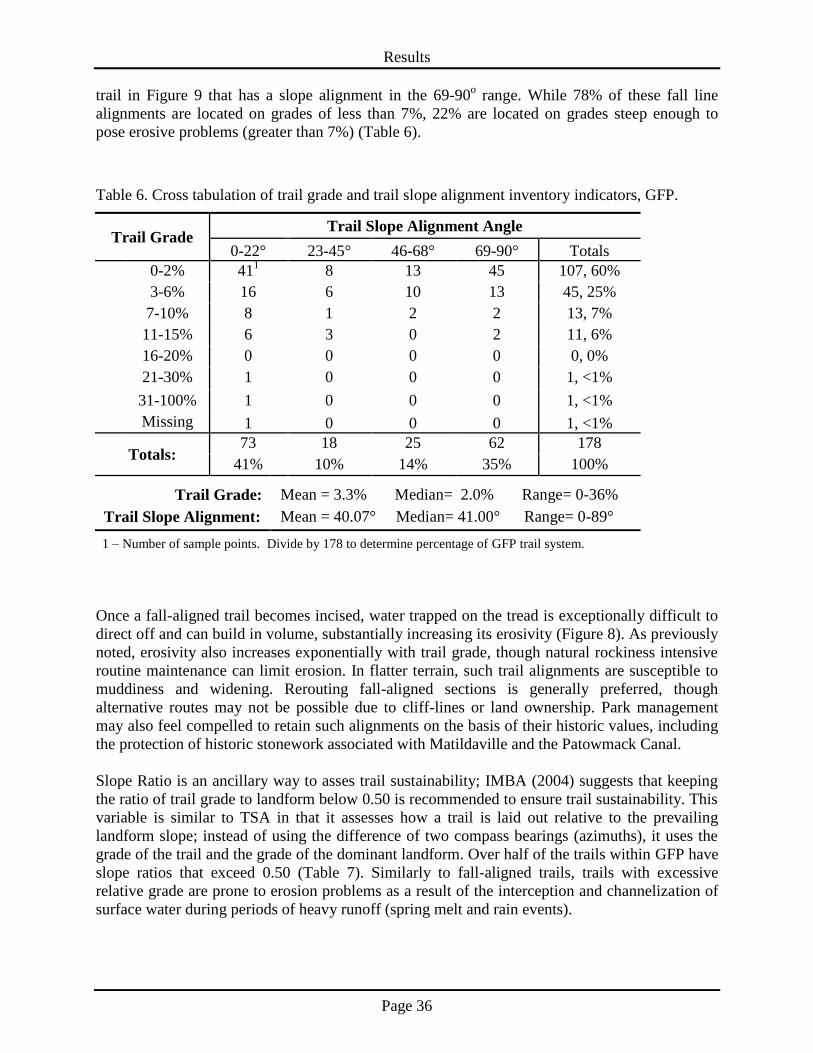
RESULTS ................................................................................................................................................................... 35
GEORGE WASHINGTON MEMORIAL PARKWAY, GREAT FALLS PARK ...................................................................... 35 Formal Trails ..................................................................................................................................................... 35 Trail Design Indicators ...................................................................................................................................... 35 Trail Condition Indicators ................................................................................................................................. 38
C&O CANAL NATIONAL HISTORICAL PARK ............................................................................................................ 42 Formal Trails ..................................................................................................................................................... 42 Trail Design Indicators ...................................................................................................................................... 42 Trail Condition Indicators ................................................................................................................................. 43
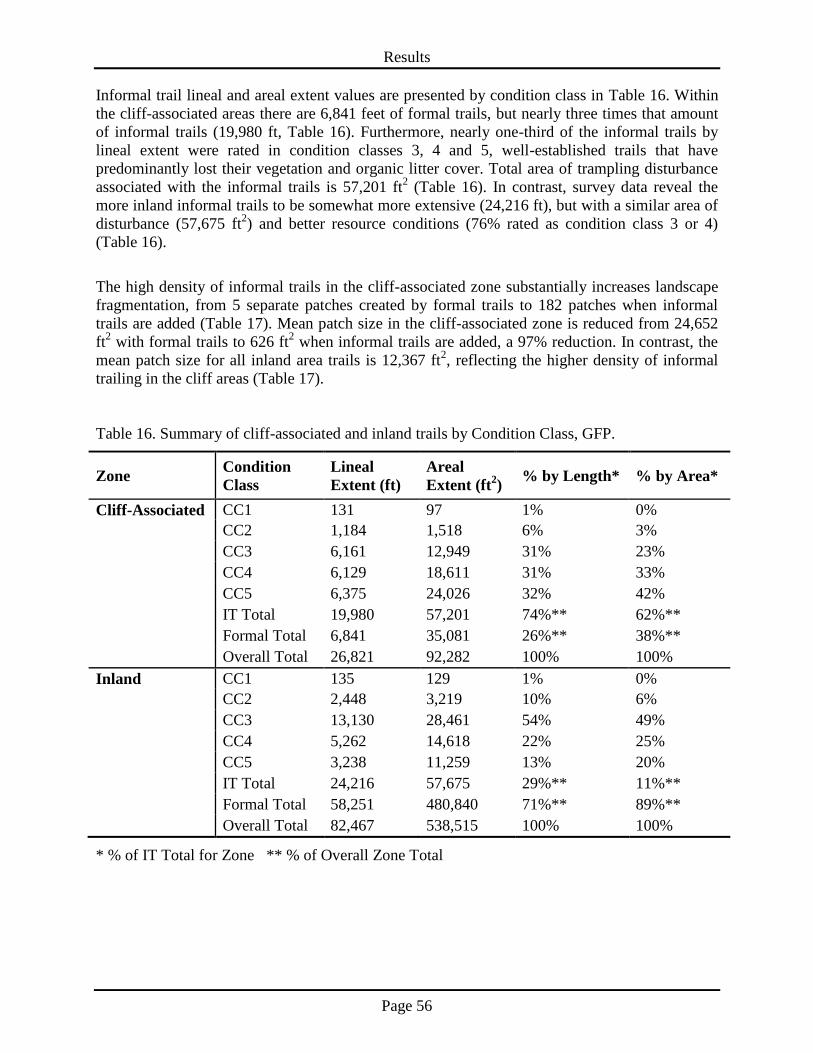
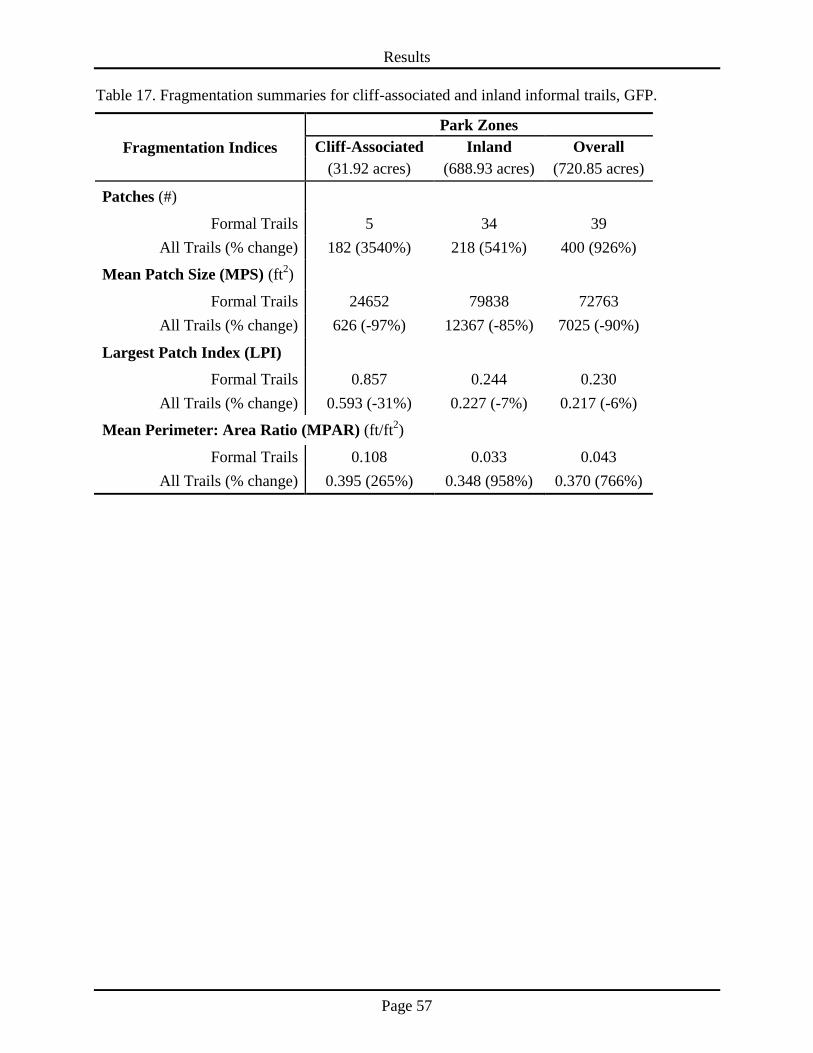
GEORGE WASHINGTON MEMORIAL PARKWAY, GREAT FALLS PARK ...................................................................... 47 Informal Trails ................................................................................................................................................... 47 Quantitative Summary of Informal Trails: GFP ................................................................................................ 47 Spatial Distribution of Informal Trails: GFP .................................................................................................... 50 Fragmentation by Informal Trails: GFP ........................................................................................................... 53 Cliff-Associated Trails: GFP ............................................................................................................................. 55
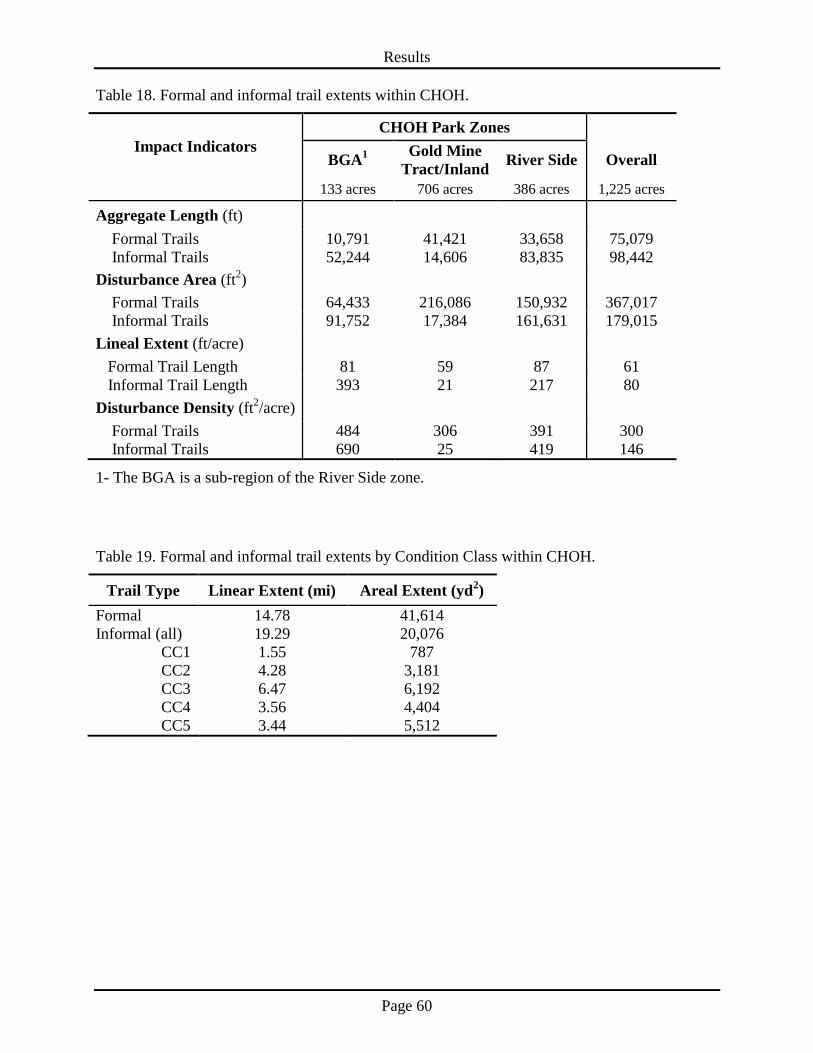
C&O CANAL NATIONAL HISTORICAL PARK ............................................................................................................ 59 Informal Trails ................................................................................................................................................... 59 Quantitative Summary of Informal Trails: CHOH ............................................................................................. 59
Page 4
Page ii
Spatial Distribution of Informal Trails: CHOH ................................................................................................. 62 Fragmentation by Informal Trails: CHOH ........................................................................................................ 66
DISCUSSION AND MANAGEMENT IMPLICATIONS ..................................................................................... 69
REVIEW AND SUMMARY OF FINDINGS ..................................................................................................................... 69 Management Suggestions ................................................................................................................................... 69
LITERATURE CITED ............................................................................................................................................. 74
APPENDIX 1: FORMAL TRAIL MONITORING MANUAL ............................................................................. 82
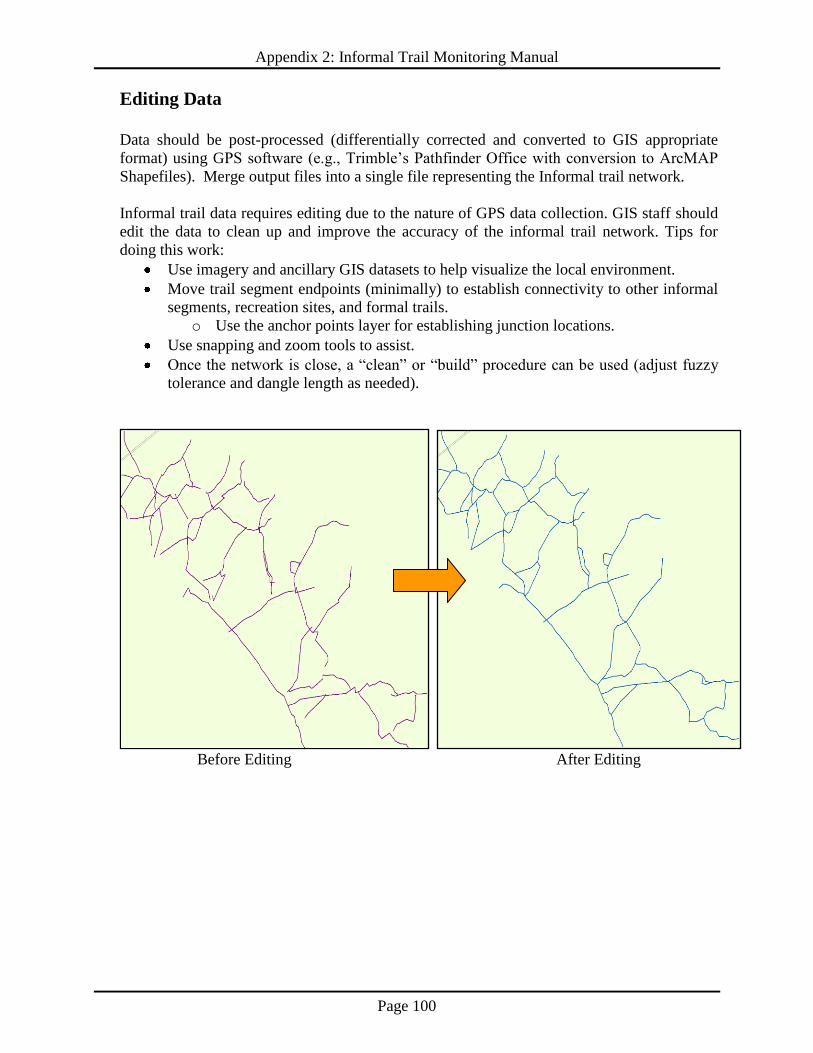
APPENDIX 2: INFORMAL TRAIL MONITORING MANUAL ........................................................................ 95
APPENDIX 3: GUIDANCE FOR MANAGING INFORMAL TRAILS ........................................................... 103
Page 5
Page iii
FIGURES
FIGURE 1. THE NPS VISITOR EXPERIENCE AND RESOURCE PROTECTION FRAMEWORK USED TO ADDRESS CARRYING
CAPACITY DECISION MAKING. ............................................................................................................................. 14 FIGURE 2. CAPABILITIES OF VISITOR IMPACT MONITORING PROGRAMS. ....................................................................... 16 FIGURE 3. A ―SPAGHETTI‖ MAP SHOWING THE COMPLEX NETWORK OF INFORMAL TRAILS BRANCHING OFF THE
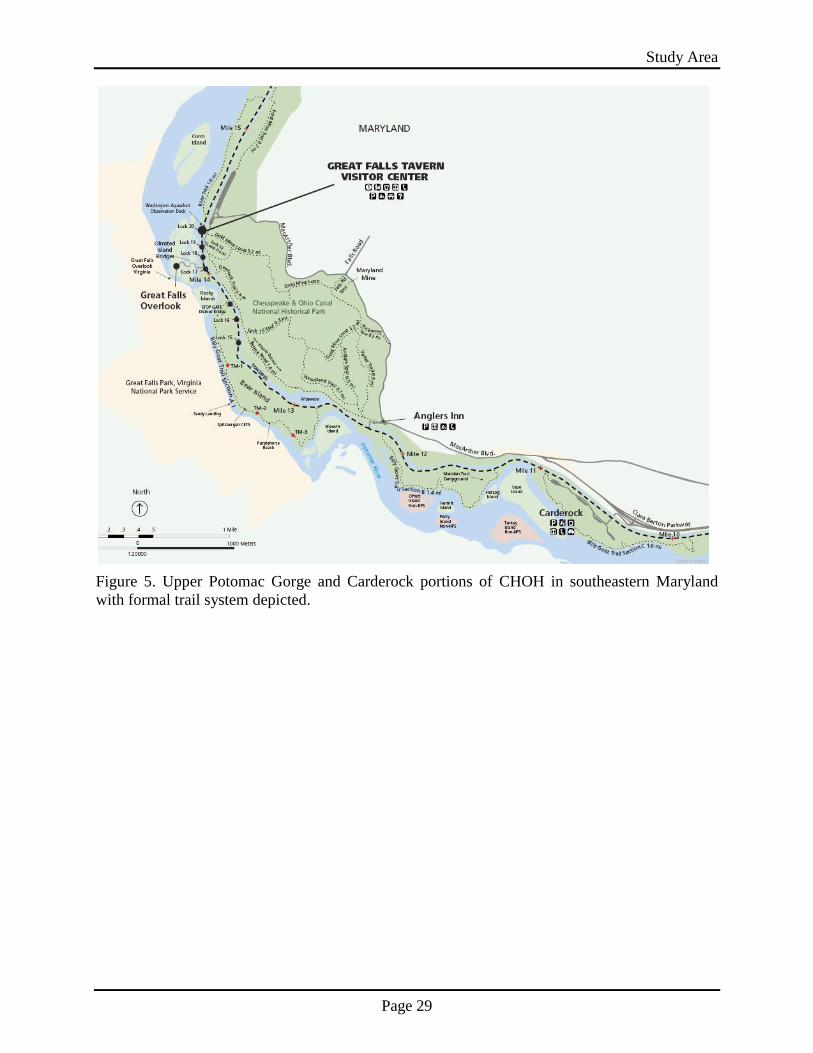
POTOMAC GORGE’S BILLY GOAT TRAIL, CHOH. ............................................................................................... 25 FIGURE 4. GREAT FALLS PARK OF GWMP IN NORTHEASTERN VIRGINIA WITH FORMAL TRAIL SYSTEM DEPICTED. ..... 28 FIGURE 5. UPPER POTOMAC GORGE AND CARDEROCK PORTIONS OF CHOH IN SOUTHEASTERN MARYLAND WITH
FORMAL TRAIL SYSTEM DEPICTED. ...................................................................................................................... 29 FIGURE 6. TRAIL ASSESSMENT AND PAPERLESS DATA RECORDING USING A GPS UNIT AT A TRANSECT ESTABLISHED ON
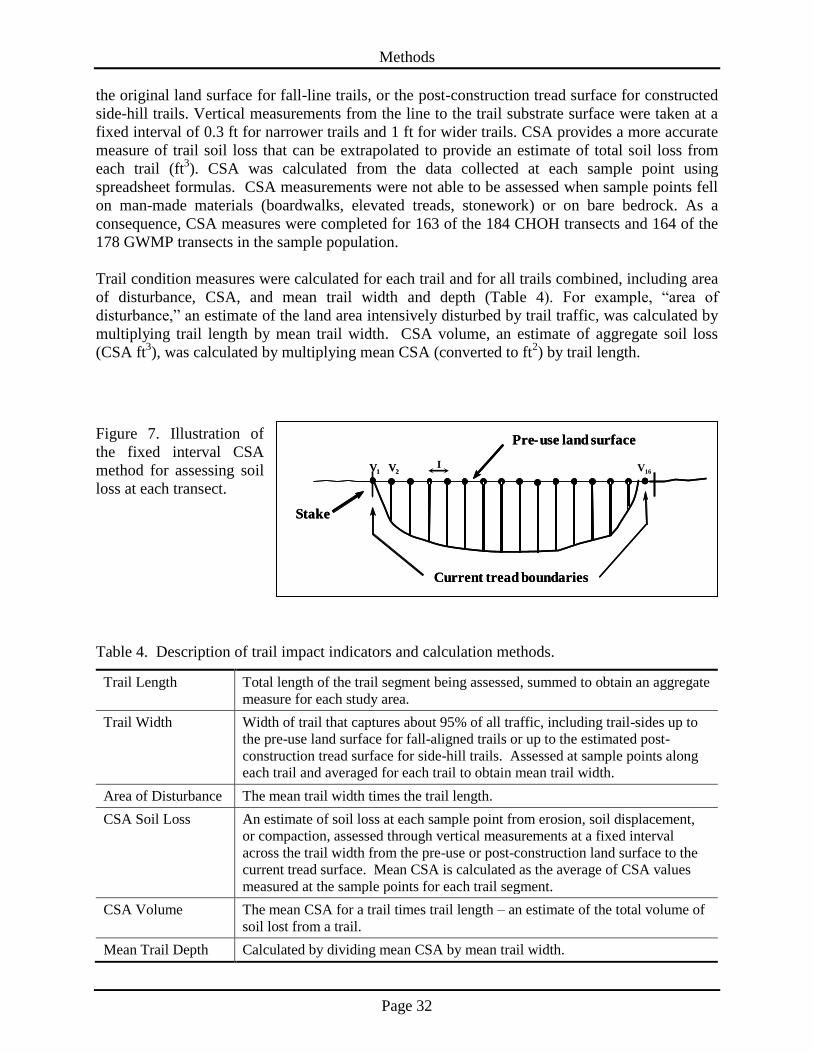
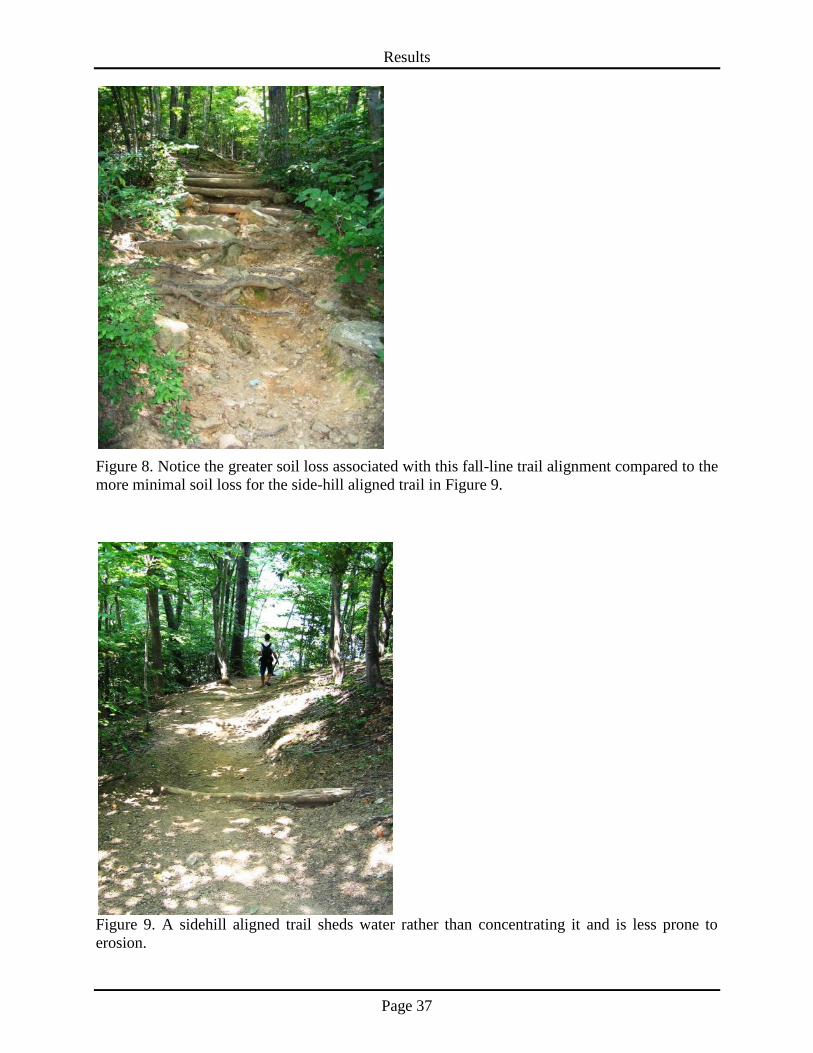
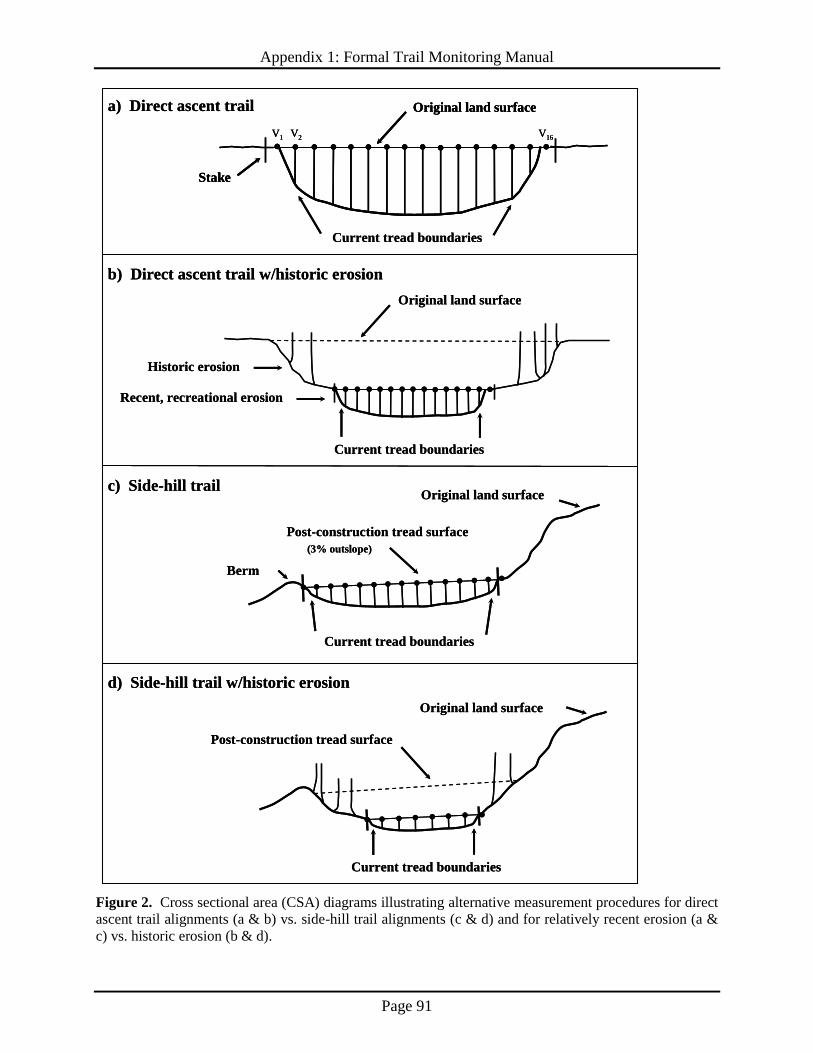
A SAMPLE POINT LOCATED BY PUSHING A MEASURING WHEEL. ........................................................................... 31 FIGURE 7. ILLUSTRATION OF THE FIXED INTERVAL CSA METHOD FOR ASSESSING SOIL LOSS AT EACH TRANSECT. ...... 32 FIGURE 8. NOTICE THE GREATER SOIL LOSS ASSOCIATED WITH THIS FALL-LINE TRAIL ALIGNMENT COMPARED TO THE
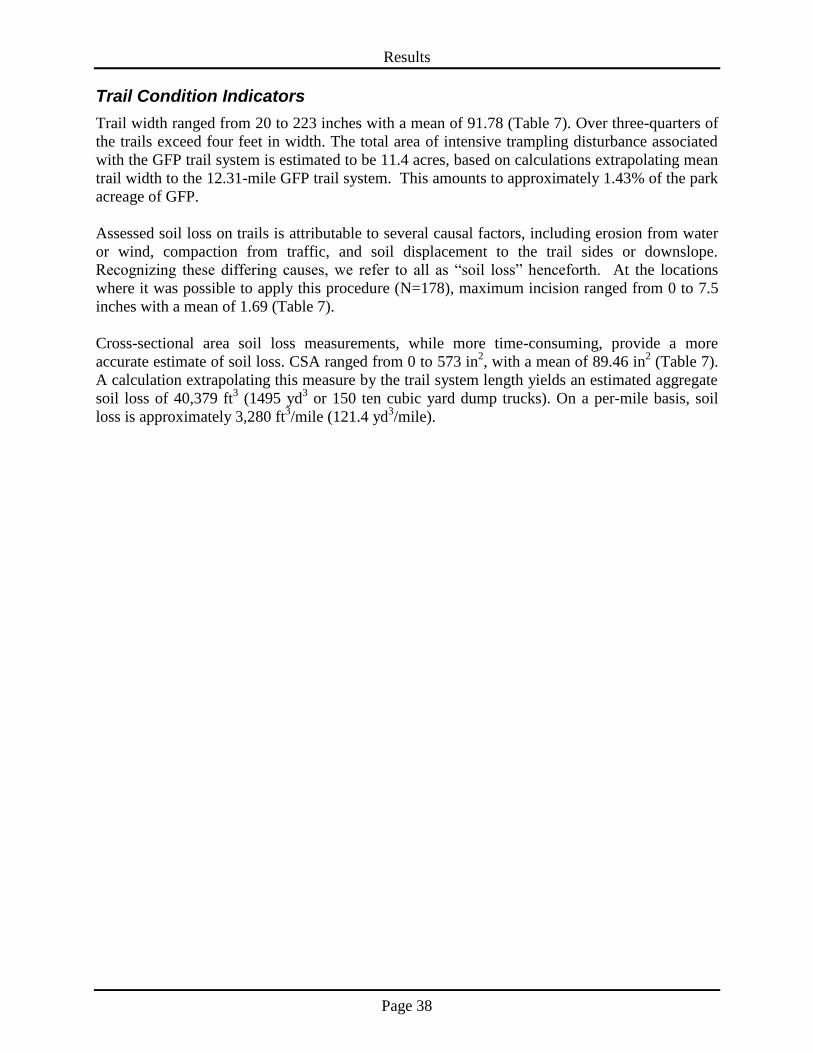
MORE MINIMAL SOIL LOSS FOR THE SIDE-HILL ALIGNED TRAIL IN FIGURE 9. ....................................................... 37 FIGURE 9. A SIDEHILL ALIGNED TRAIL SHEDS WATER RATHER THAN CONCENTRATING IT AND IS LESS PRONE TO
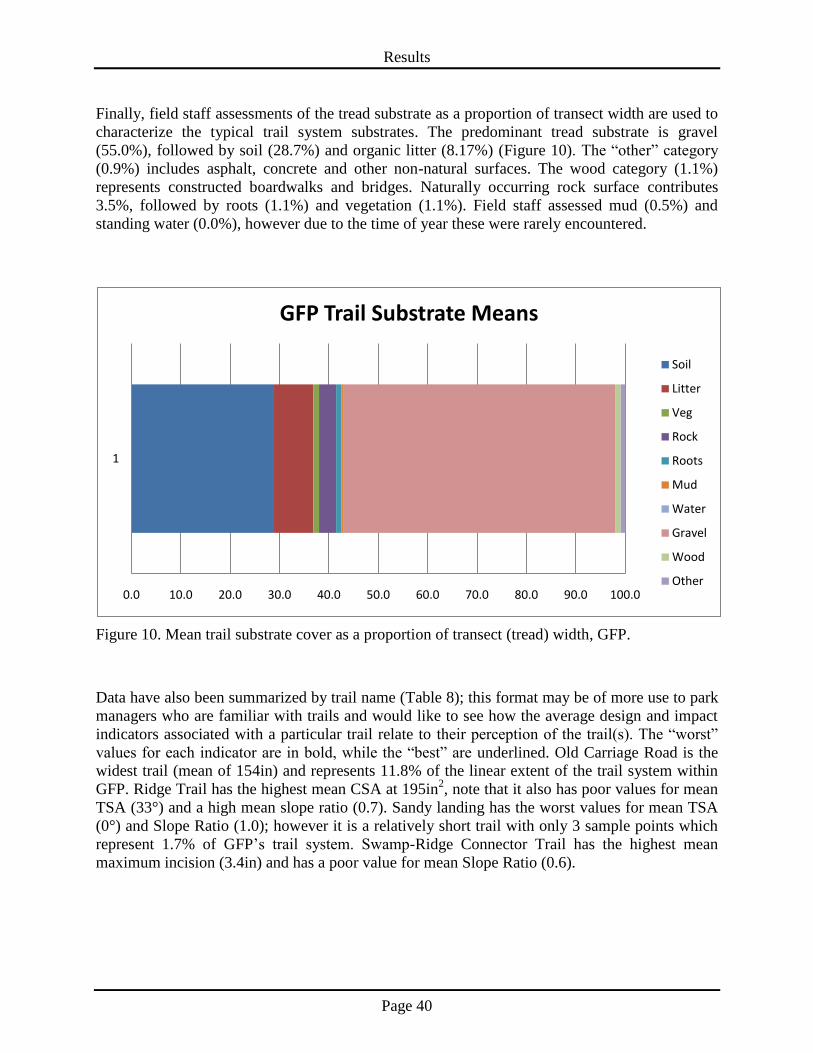
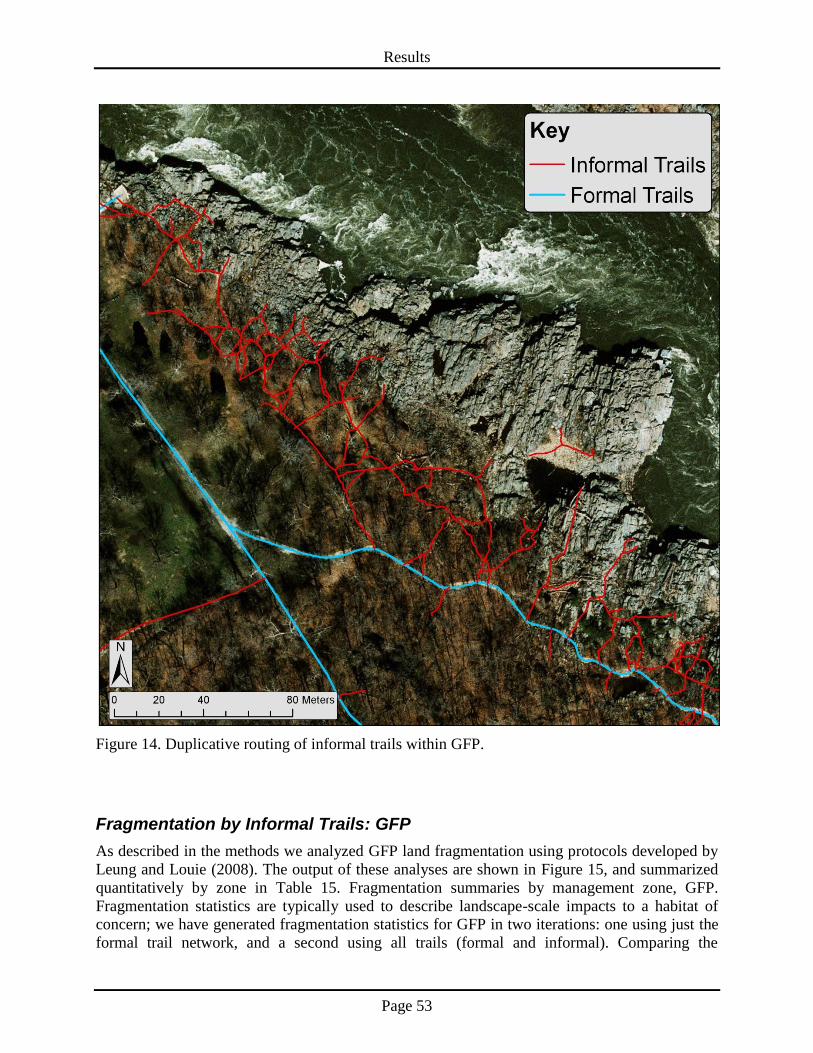
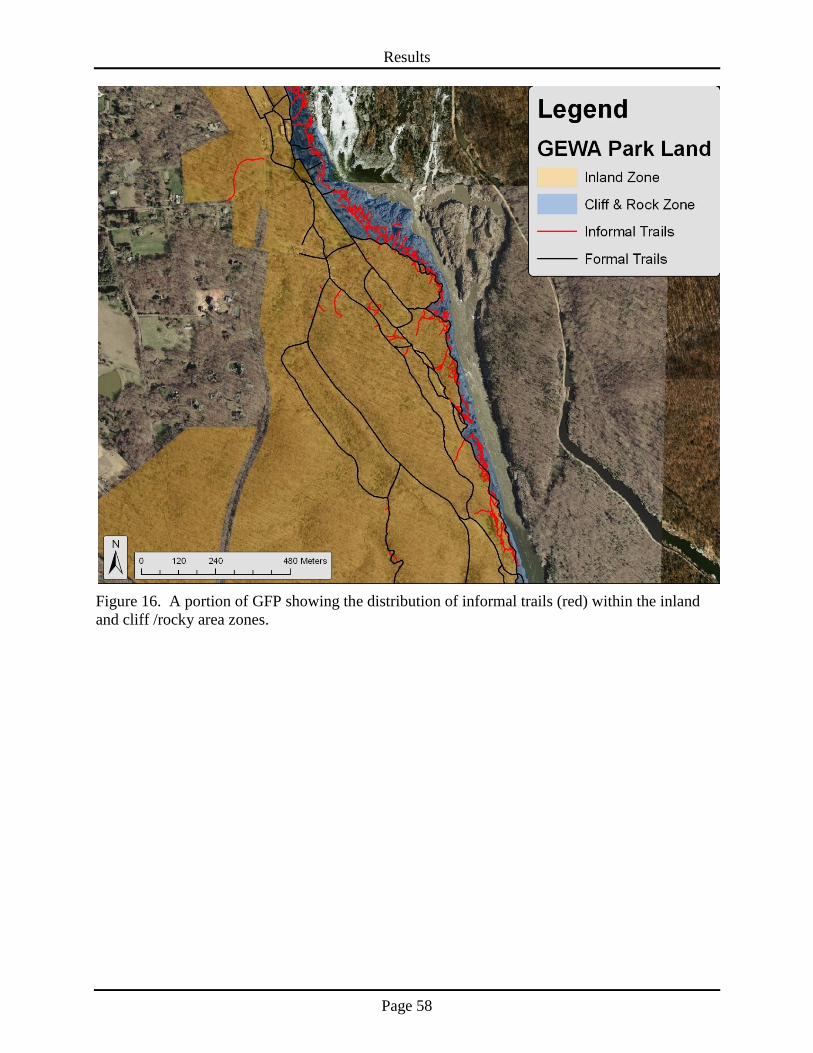
EROSION. ............................................................................................................................................................. 37 FIGURE 10. MEAN TRAIL SUBSTRATE COVER AS A PROPORTION OF TRANSECT (TREAD) WIDTH, GFP. .......................... 40 FIGURE 11. MEAN TRAIL SUBSTRATE COVER AS A PROPORTION OF TRANSECT (TREAD) WIDTH, CHOH. ...................... 45 FIGURE 12. MANAGEMENT ZONES OF GFP. .................................................................................................................. 49 FIGURE 13. LOCATION OF INFORMAL TRAILS WITHIN GFP. .......................................................................................... 52 FIGURE 14. DUPLICATIVE ROUTING OF INFORMAL TRAILS WITHIN GFP. ...................................................................... 53 FIGURE 15. FRAGMENTATION PARCELS WITHIN GFP. .................................................................................................. 54 FIGURE 16. A PORTION OF GFP SHOWING THE DISTRIBUTION OF INFORMAL TRAILS (RED) WITHIN THE INLAND AND
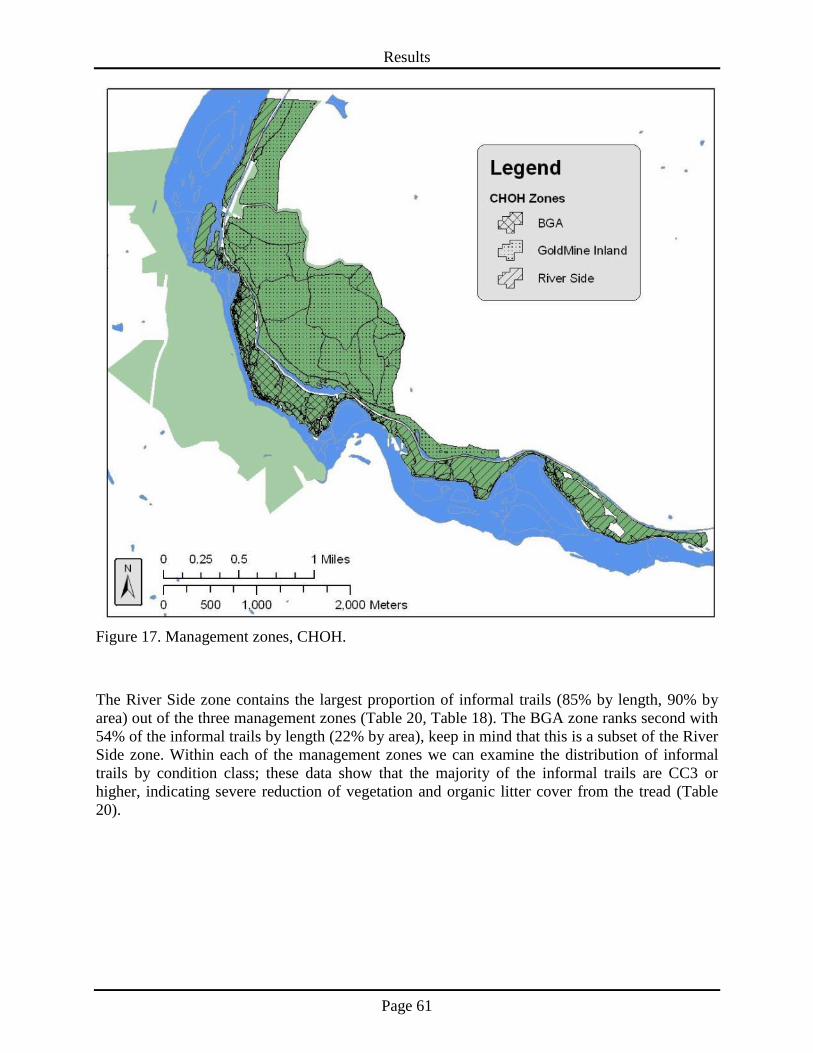
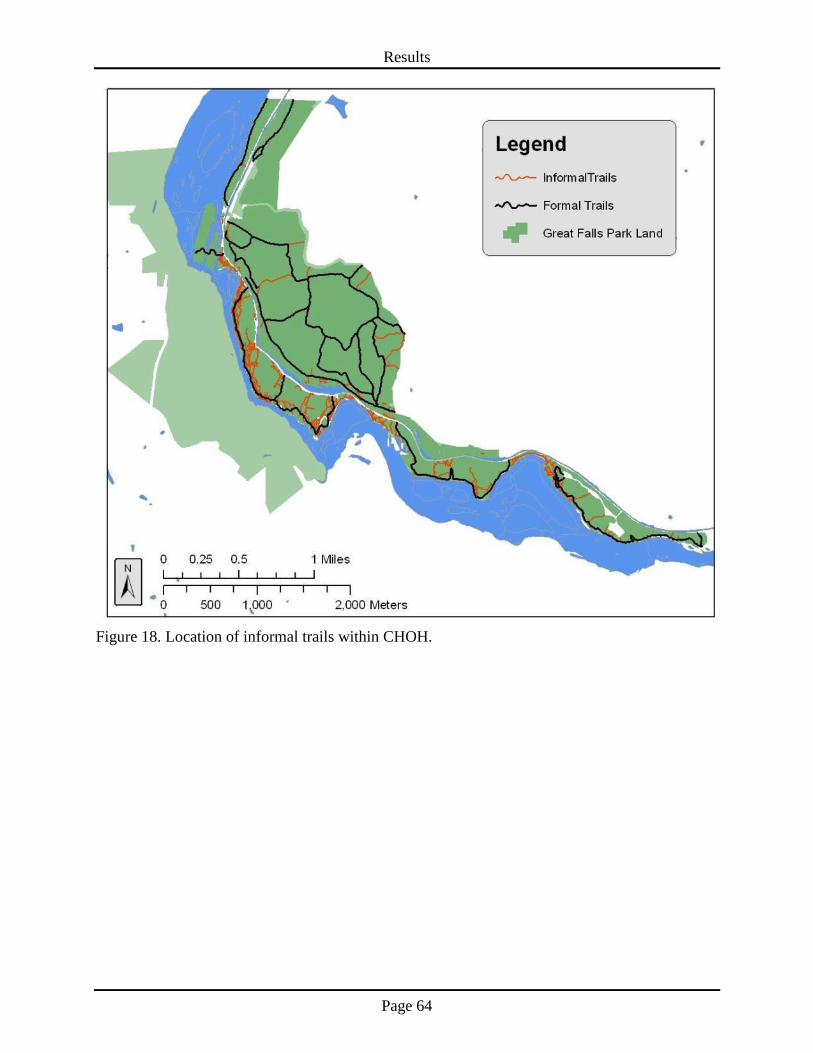
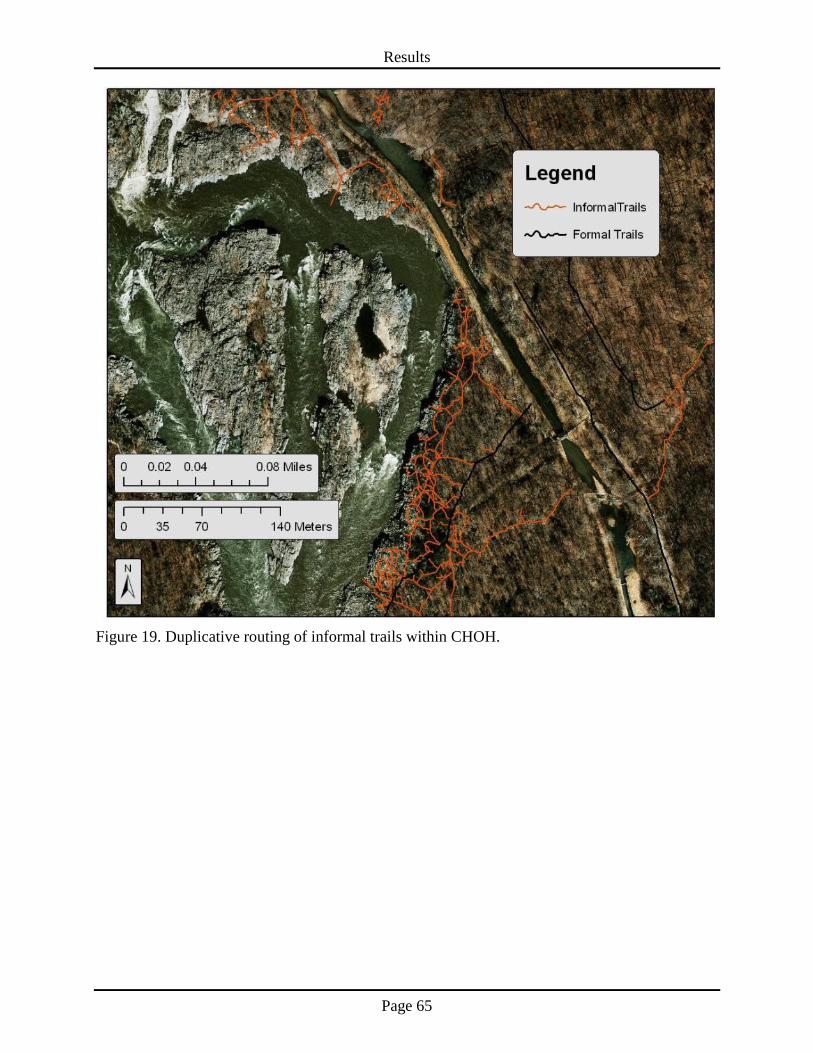
CLIFF /ROCKY AREA ZONES. ................................................................................................................................ 58 FIGURE 17. MANAGEMENT ZONES, CHOH. .................................................................................................................. 61 FIGURE 18. LOCATION OF INFORMAL TRAILS WITHIN CHOH. ...................................................................................... 64 FIGURE 19. DUPLICATIVE ROUTING OF INFORMAL TRAILS WITHIN CHOH. .................................................................. 65 FIGURE 20. FRAGMENTATION PARCELS WITHIN CHOH................................................................................................ 67
TABLES
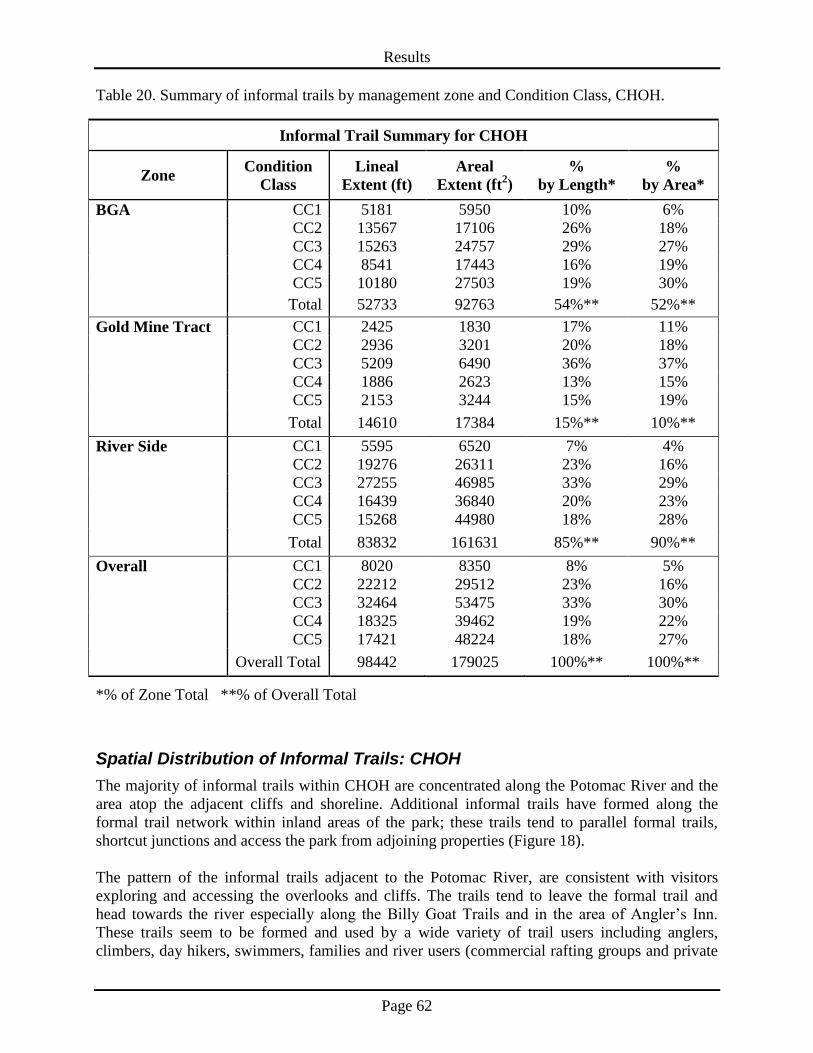
TABLE 1. DIRECT AND INDIRECT EFFECTS OF RECREATIONAL TRAMPLING ON SOILS AND VEGETATION....................... 18 TABLE 2. CRITERIA FOR SELECTING INDICATORS OF RESOURCE CONDITION. ............................................................... 22 TABLE 3. POTENTIAL INDICATORS OF TRAIL CONDITIONS AND MEASUREMENT UNITS. ................................................ 23 TABLE 4. DESCRIPTION OF TRAIL IMPACT INDICATORS AND CALCULATION METHODS. ................................................ 32 TABLE 5. CONDITION CLASS RATING DESCRIPTIONS APPLIED TO INFORMAL TRAILS. .................................................. 33 TABLE 6. CROSS TABULATION OF TRAIL GRADE AND TRAIL SLOPE ALIGNMENT INVENTORY INDICATORS, GFP. .......... 36 TABLE 7. NUMBER AND PERCENT OF SAMPLE POINTS BY IMPACT INDICATOR CATEGORY, GFP.................................... 39 TABLE 8. TRAIL IMPACT AND DESIGN INDICATORS SUMMARIZED BY TRAIL NAME, GFP. ............................................. 41 TABLE 9. CROSS TABULATION OF TRAIL GRADE AND TRAIL SLOPE ALIGNMENT INVENTORY INDICATORS, CHOH. ...... 43 TABLE 10. NUMBER AND PERCENT OF SAMPLE POINTS BY IMPACT INDICATOR CATEGORY, CHOH. ............................. 44 TABLE 11. TRAIL IMPACT AND DESIGN INDICATORS SUMMARIZED BY TRAIL NAME, CHOH. ....................................... 46 TABLE 12. FORMAL AND INFORMAL TRAIL EXTENTS WITHIN GFP. .............................................................................. 48 TABLE 13. FORMAL AND INFORMAL TRAILS OF GFP SUMMARIZED BY CONDITION CLASS. .......................................... 48 TABLE 14. SUMMARY OF INFORMAL TRAILS BY MANAGEMENT ZONE AND CONDITION CLASS, GFP. ........................... 50 TABLE 15. FRAGMENTATION SUMMARIES BY MANAGEMENT ZONE, GFP. .................................................................... 55 TABLE 16. SUMMARY OF CLIFF-ASSOCIATED AND INLAND TRAILS BY CONDITION CLASS, GFP. ................................. 56 TABLE 17. FORMAL AND INFORMAL TRAIL EXTENTS WITHIN CHOH. .......................................................................... 60 TABLE 18. FORMAL AND INFORMAL TRAIL EXTENTS BY CONDITION CLASS WITHIN CHOH. ....................................... 60 TABLE 19. SUMMARY OF INFORMAL TRAILS BY MANAGEMENT ZONE AND CONDITION CLASS, CHOH. ....................... 62 TABLE 20. FRAGMENTATION SUMMARIES BY MANAGEMENT ZONE, CHOH. ................................................................ 68
Page 6
Page iv
ACKNOWLEDGEMENTS
We wish to thank and acknowledge the National Park Service for sponsoring this study and the
staff at C&O Canal National Historical Park and George Washington Memorial Parkway for
their assistance. We are particularly indebted to Logan Park, who provided assistance in
developing field protocols and conducting surveys of the extensive informal trails.
EXECUTIVE SUMMARY
This report presents the results of research on the conditions of formal and informal (visitor-
created) trails conducted within the Great Falls Park (GFP) portion of George Washington
Memorial Parkway (GWMP), Virginia, and the adjacent Maryland portions of the C&O Canal
National Historical Park (CHOH). This research was prompted primarily by concerns about the
impact of extensive informal trail networks within both parks on native vegetation and rare plant
communities, rare flora and fauna, and historic and archaeological resources. Resource
conditions on formal park trails were also assessed to provide information supporting the
development of park planning and management decision-making.
The potential environmental impacts from recreational activities includes the trampling and loss
of vegetation, including rare plants, alteration in vegetation composition, possible introduction
and spread of non-native plants, compaction and loss of soil, and disturbance or displacement of
wildlife. Deterioration of formal park trails and creation and proliferation of informal trails are
significant management problems that can directly impact sensitive plant communities, rare or
endangered flora and fauna, wildlife habitats, and historic/archaeological resources. Even limited
trampling has the potential to significantly affect populations of plants that are small in size and
number. Resource impacts from and on informal trails can be severe, partially because of the
absence of professional design, construction, and maintenance practices. While some degree of
visitor impact is unavoidable, excessive trampling impacts can threaten natural resource
conditions and processes, visitor safety, and the quality of recreational experiences.
This program of research had the following objectives: 1) developing and refining assessment
protocols for monitoring conditions along the park’s formal and informal trail systems, 2)
applying the protocols to collect and summarize baseline data on formal and informal trail
resource conditions and impacts, and 3) providing suggestions on appropriate and effective trail
and visitor management practices to avoid or reduce trail-related resource impacts.
This report contains a review of the relevant scientific literature describing trail impacts, criteria
for selecting appropriate impact indicators, trail impact assessment methods, and a review of the
study area and methods employed in this study. Study implications and suggestions for park
planning, management, and monitoring are presented and discussed in the Discussion section of
this report. This information is useful in selecting and implementing effective site or visitor
management actions. If park staff implement procedures developed from this research as part of
Page 7
Page v
a long-term monitoring program then comparisons to the baseline dataset provided by this study
will allow the detection of trends and evaluation of the effectiveness of management
interventions. Finally, these data support the selection of indicators and standards as part of Cliff
and Trail Management Plans, or other carrying capacity planning based on the National Park
Service Visitor Experience and Resource Protection (VERP) framework (described in this
report).
All formal trails within both park study areas were assessed with point-sampling procedures to
quantitatively characterize trail resource conditions. Field staff sought to apply a census-survey
of all informal trails, which were mapped with accurate GPS units and assessed with descriptive
condition class assessments. Salient findings include the following:
Great Falls Park
12.31 miles of formal trails were assessed; the majority is well-designed and in good
condition.
Less than 2% of the formal trail system have steep grades (>15%) but 60% have grades
of 0-2%, which are susceptible to poor drainage, muddiness, and trail widening. A large
portion (41%) are also aligned close to the fall line (landform grade), a less sustainable
design that increases the difficulty of water drainage and tread susceptibility to tread
muddiness, soil erosion, and widening.
The most common assessed impacts include muddiness (948 ft) and the occurrence of
secondary (parallel) treads (3,314 ft).
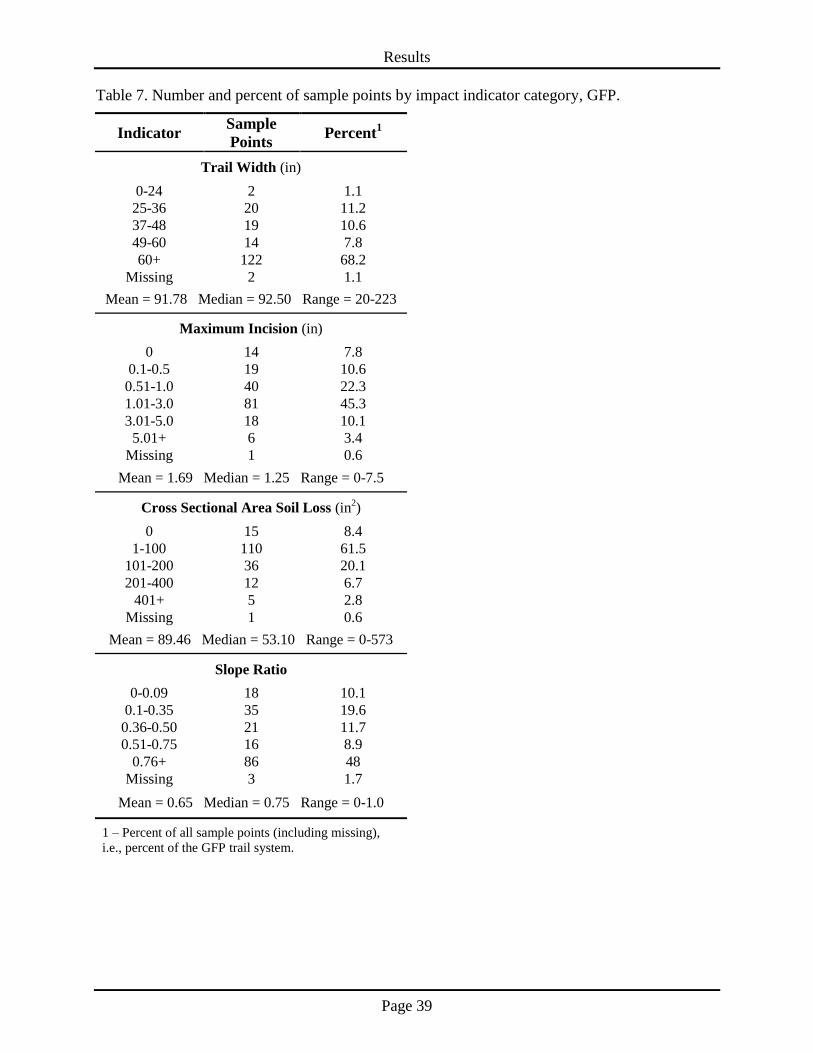
Soil loss was assessed by maximum tread incision (mean = 1.69 inches) and cross
sectional area soil loss (mean = 89.5 in2). Extrapolations of soil loss to the entire trail
system yielded an aggregate soil loss estimate of 40,379 ft3.
A census survey of informal trails located and mapped 8.37 miles, 68% of the formal trail
mileage and 23% of the areal extent of trampling impact.
By lineal extent, 91% of the informal trails were rated condition class 3-5, indicating a
loss of vegetation and organic litter cover from trail treads, with evidence of soil erosion
visible on 49%.
A majority of the informal trails are concentrated along the Potomac River in forested
areas adjacent to the cliff-tops and rocky areas. Most appear to be related to general
exploration and visitors seeking cliff-top vistas.
There is considerable duplication in the distribution of informal trails, i.e., two or more
trails accessing common locations. This represents ―avoidable‖ impact.
Potential landscape and habitat fragmentation impacts are assessed by computation of
several fragmentation indices.
C&O Canal National Historical Park
14.67 miles of formal trails were assessed; the majority is well-designed and in good
condition.
Approximately 10% of the formal trail system has steep grades (>15%) which are
susceptible to erosion, and 37% have grades of 0-2%, which are susceptible to poor
drainage, muddiness, and trail widening. A portion (23%) of formal trails are also aligned
close to the fall line (landform grade), a less sustainable design that increases the
Page 8
Page vi
difficulty of water drainage and tread susceptibility to tread muddiness, soil erosion, and
widening.
Soil loss was assessed by maximum tread incision (mean = 1.61 inches) and cross
sectional area soil loss (mean = 49.0 in2). Extrapolations of soil loss to the entire trail
system yielded an aggregate soil loss estimate of 26,368 ft3.
A census survey of informal trails located and mapped 19.29 miles, 130% of the formal
trail mileage and 48% of the areal extent of trampling impact.
By lineal extent, 69% of the informal trails were rated condition class 3-5, indicating a
loss of vegetation and organic litter cover from trail treads, with evidence of soil erosion
visible on 36%.
A majority of the informal trails are concentrated along the Potomac River in forested
areas adjacent to the cliff-tops and rocky areas. Most appear to be related to general
exploration and visitors seeking cliff-top vistas.
There is considerable duplication in the distribution of informal trails, i.e., two or more
trails accessing common locations. This represents ―avoidable‖ impact.
Potential landscape and habitat fragmentation impacts are assessed by computation of
several fragmentation indices.
The formal trail system mileage within both park study areas was quite limited, and trail
conditions are generally good. Some areas exhibited erosion, muddiness, tread widening, and
the development of secondary trails. The most effective long-term response to these problems is
to relocate the worst sections to side-hill alignments that promote tread drainage and deter trail
widening and secondary tread development. Graveling, when appropriate, can also be an
effective maintenance practice. Other corrective practices, such as construction of grade
reversals to drain water, and low impact educational practices are also described.
The most substantial and significant trail-related impacts in both parks are their extensive
informal trail networks, particularly in the CHOH study area. Given the rare and fragile plant
communities and substantial number of rare plant species in both parks, these extensive networks
of informal trails pose a serious threat to the resource protection mandates of both parks. One
product of these surveys are GIS informal trail data layers that will permit additional analyses to
evaluate their proximity to rare species locations or sensitive historic/cultural sites (unavailable
to our study). Readers are referred to a companion study by Hockett and others (2010) for more
in-depth discussion and presentation of information regarding the causes of informal trail
formation and possible site management and educational responses. Some of that material is also
included in this report to make this document a more complete resource. Potential solutions
include the improvement of visitor communication and low impact practices, improved trail
maintenance and markings, formalizing some informal trails, and informal trail closures and
restoration.
Resolving the substantial informal trail impacts documented by this study will be a significant
and ongoing management challenge for both parks. A collaborative adaptive management
process is suggested, with ongoing monitoring to evaluate resource conditions and management
success over time. Additional research may also be needed. Some individuals, including those
interested in nature study, photography, fishing, and climbing, ―need‖ to engage in off-trail
hiking to fulfill their trip objectives. Some degree off off-trail hiking and trailing is unavoidable,
so management planning and decision-making should seek to incorporate carefully selected
Page 9
Page vii
indicators with quantitative standards representing ―acceptable‖ limits of change, combined with
periodic monitoring to compare conditions to standards. Report Appendices provide protocols
that can be incorporated into formal and informal trail monitoring programs.
Page 10
Page 8
INTRODUCTION
The National Park Service (NPS) accommodates nearly 300 million visitors per year, visitation
that presents managers with substantial challenges at some 392 park units across some 83.6
million acres of protected lands. An increasing number of visitors inevitably contribute negative
effects to fragile natural and cultural resources. Such visitation-related resource impacts can
degrade natural conditions and processes and the quality of recreation experiences. According to
the NPS Management Policies: ―The fundamental purpose of the national park system,
established by the Organic Act and reaffirmed by the General Authorities Act, as amended,
begins with a mandate to conserve park resources and values…The fundamental purpose of all
parks also includes providing for the enjoyment of park resources and values by the people of the
United States.‖ (NPS 2006, Section 1.4.3). However, what might appear to be dual mandates,
visitation and resource protection, are clarified to reveal the primacy of resource protection. The
Management Policies acknowledge that some resource degradation is an inevitable consequence
of visitation, but directs managers to ―ensure that any adverse impacts are the minimum
necessary, unavoidable, cannot be further mitigated, and do not constitute impairment or
derogation of park resources and values‖ (NPS 2006).
The increasing popularity of the national park system presents substantial management
challenges. Too many visitors may cause unacceptable impacts to fragile natural and cultural
resources, and may also cause crowding and other social impacts which can also degrade the
quality of visitor experiences. How many visitors can ultimately be accommodated in a park or
related area? How much resource and social impact should be allowed? These and related
questions are commonly referred to as carrying capacity (Manning 1999, Stankey & Manning
1986, Shelby & Heberlein 1986, Graefe et al. 1984).
Responding to these concerns, NPS managers at C&O Canal National Historical Park (CHOH)
in Maryland and George Washington Memorial Parkway (GWMP) in Virginia supported this
research investigating visitation-related impacts to formal and informal (visitor-created) trails in
Great Falls Park, Virginia, and adjacent sections of CHOH. To better understand the extent and
severity of these resource impacts and identify effective management techniques, this research
develops monitoring protocols, collects baseline data, and identifies suggestions for management
strategies. The study area, extending approximately five miles along the Potomac River from
Great Falls to the downstream end of Carderock, is one of the most biologically significant
natural areas in the eastern United States, supporting more than 400 occurrences of 200 rare
species and communities. Located in a densely populated urban landscape, the Potomac Gorge is
also recognized for its exceptional recreational and scenic features. More than four million
people live within the Washington metro region and the Potomac Gorge is a noted tourist
attraction in the area. This report includes only data from the formal and informal trail
assessment portion of this program of research.
The potential environmental impacts from recreational activities includes the trampling and loss
of vegetation, including rare plants and plant communities, alteration in vegetation composition,
possible introduction and spread of non-native plants, compaction and loss of soil, and
disturbance or displacement of wildlife. Deterioration of formal park trails and creation and
proliferation of informal trails are significant management problems that can directly impact
sensitive plant communities, rare or endangered flora and fauna, and wildlife habitats (Leung et
Page 11
Introduction
Page 9
al. 2002, Wood et al. 2006). Even limited trampling has the potential to significantly affect
populations of plants that are small in size and number. Resource impacts on informal trails can
be severe, partially because of the absence of professional design, construction, and maintenance
practices (Wimpey & Marion 2010). While some degree of visitor impact is unavoidable,
excessive trampling impacts can threaten natural resource conditions and processes, visitor
safety, and the quality of recreational experiences (Leung et al. 2002). These potential impacts
are reviewed more fully in the Literature Review section of this report.
This program of research has the following specific objectives:
1) developing and refining assessment protocols for monitoring conditions along the park’s
formal and informal trail systems,
2) applying the protocols to collect and summarize baseline data on formal and informal
trail resource conditions and impacts, and
3) providing suggestions on appropriate and effective trail and visitor management
practices to avoid or reduce trail-related resource impacts.
This report contains a review of the relevant scientific literature describing trail impacts, criteria
for selecting appropriate impact indicators, trail impact assessment methods, and a review of the
study area and methods employed in this study. Study implications and suggestions for park
planning, management, and monitoring are presented and discussed in the Discussion section of
this report. This information is useful in selecting and implementing effective site or visitor
management actions. If park staff implement procedures developed from this research as part of
a long-term monitoring program then comparisons to the baseline dataset provided by this study
will allow the detection of trends and evaluation of the effectiveness of management
interventions. Finally, these data support the selection of indicators and standards as part of Cliff
and Trail Management Plans, or other carrying capacity planning based on the NPS Visitor
Experience and Resource Protection (VERP) framework (described in the following section).
Page 12
Page 10
JUSTIFICATION FOR MONITORING
Sustaining any type of long-term natural resource monitoring program over time can be
exceptionally challenging for agencies due to changing personnel, management priorities, and
budgets. This section reviews legislative mandates, management policies and guidelines,
carrying capacity, visitor perceptions of recreation resource conditions, and monitoring program
capabilities. The purpose of this review is to describe legislative and management intent
regarding visitor impact monitoring and its role in balancing visitor use and resource protection
objectives. This section is included to assist in justifying implementation of a trail monitoring
program and to describe its utility to enlist organizational support for sustaining such a program
over time.
Legislative mandates challenge managers to develop and implement management policies,
strategies, and actions that permit recreation without compromising ecological and aesthetic
integrity. Furthermore, managers are frequently forced to engage in this balancing act under the
close scrutiny of the public, competing interest groups, and the courts. Managers can no longer
afford a wait-and-see attitude or rely on subjective impressions of deterioration in resource
conditions. Professional land management increasingly requires the collection and use of
scientifically valid research and monitoring data. Such data should describe the nature and
severity of visitor impacts and the relationships between controlling visitor use and biophysical
factors. These relationships are complex and not always intuitive. A reliable information base is
therefore essential to managers seeking to develop, implement, and gauge the success of visitor
and resource management programs.
Although numerous reasons for implementing a visitor impact monitoring program are described
in the following sections, the actual value of these programs is entirely dependent upon the park
staff who manage them. Programs developed with little regard to data quality assurance or
operated in isolation from resource protection decision-making will be short-lived. In contrast,
programs that provide managers with relevant and reliable information necessary for developing
and evaluating resource protection actions can be of significant value. Only through the
development and implementation of professionally managed and scientifically defensible
monitoring programs can we hope to provide legitimate answers to the question, "Are we loving
our parks to death?"
Legislative Mandates
Current legislation and agency documents establish mandates for monitoring (Marion 1991).
Recent legislative mandates allow managers more latitude to make proactive decisions that can
be defended in court if necessary. Managers who make proactive decisions should be prepared to
prove the viability of their strategies, or risk public disapproval or even legal action against the
agency. Survey and monitoring programs provide the means for such demonstrations.
Agency Organic Act
The National Park Service Organic Act of 1916 (16 United States Code (USC) 1) established the
Service, directing it to:
Page 13
Justification for Monitoring
Page 11
"promote and regulate the use…[of parks]…to conserve the scenery and the natural and historic
objects and the wildlife therein and to provide for the enjoyment of the same in such manner
and by such means as will leave them unimpaired for the enjoyment of future generations."
These provisions were supplemented and clarified by the Congress through enactment of the
General Authorities Act in 1970, and through a 1978 amendment expanding Redwood National
Park (16 USC 1a-1):
―the protection, management, and administration of these areas shall be conducted in light of the
high public value and integrity of the National Park System and shall not be exercised in
derogation of the values and purposes for which these various areas have been established…‖
Congress intended park visitation to be contingent upon the National Park Service's ability to
preserve park environments in an unimpaired condition. However, unimpaired does not mean
unaltered or unchanged. Any recreational activity, no matter how infrequent, will cause changes
or impacts lasting for some period of time. What constitutes an impaired resource is ultimately a
management decision, a judgment. The Organic Act's mandate presents the agency with a
management challenge since research demonstrates that resources are inevitably changed by
recreational activities, even with infrequent recreation by conscientious visitors (Cole 1982 1995,
Leung & Marion 2000). If interpreted overly strictly, the legal mandate of unimpaired
preservation may not be achievable, yet it provides a useful goal for managers in balancing these
two competing objectives.
More recently, the National Parks Omnibus Management Act of 1998 established a framework
for fully integrating natural resource monitoring and other science activities into the management
processes of the National Park System. The Act charges the Secretary of the Interior to:
"develop a program of inventory and monitoring of National Park System resources to establish
baseline information and to provide information on the long-term trends in the condition of
National Park System resources."
Congress reinforced the message of the National Parks Omnibus Management Act of 1998 in its
text of the FY 2000 Appropriations bill:
"A major part of protecting [park] resources is knowing what they are, where they are, how they
interact with their environment and what condition they are in. This involves a serious
commitment from the leadership of the National Park Service to insist that the superintendents
carry out a systematic, consistent, professional inventory and monitoring program, along with
other scientific activities, that is regularly updated to ensure that the Service makes sound
resource decisions based on sound scientific data."
Management Policies and Guidelines
Authority to implement congressional legislation is delegated to agencies, which identify and
interpret all relevant laws and formulate administrative policies to guide their implementation. A
document titled Management Policies (NPS 2006) describes these policies to provide more
specific direction to management decision-making. For example, relative to the need for
balancing visitor use and resource impacts, the NPS Management Policies state that:
Page 14
Justification for Monitoring
Page 12
―The ―fundamental purpose‖ of the national park system, established by the Organic Act and
reaffirmed by the General Authorities Act, as amended, begins with a mandate to conserve park
resources and values. This mandate is independent of the separate prohibition on impairment,
and so applies all the time, with respect to all park resources and values, even when there is no
risk that any park resources or values may be impaired. NPS managers must always seek ways
to avoid, or to minimize to the greatest degree practicable, adverse impacts on park resources
and values.
Congress, recognizing that the enjoyment by future generations of the national parks can be
ensured only if the superb quality of park resources and values is left unimpaired, has provided
that when there is a conflict between conserving resources and values and providing for
enjoyment of them, conservation is to be predominant. This is how courts have consistently
interpreted the Organic Act, in decisions that variously describe it as making ―resource
protection the primary goal‖ or ―resource protection the overarching concern‖… (Section 1.4.3)
The impairment that is prohibited by the Organic Act and the General Authorities Act is an
impact that, in the professional judgment of the responsible NPS manager, would harm the
integrity of park resources or values, including the opportunities that otherwise would be
present for the enjoyment of those resources or values. Whether an impact meets this definition
depends on the particular resources and values that would be affected; the severity, duration,
and timing of the impact; the direct and indirect effects of the impact; and the cumulative effects
of the impact in question and other impacts. (Section 1.4.5)
Impacts may affect park resources or values and still be within the limits of the discretionary
authority conferred by the Organic Act. In these situations, the Service will ensure that the
impacts are unavoidable and cannot be further mitigated. Even when they fall far short of
impairment, unacceptable impacts can rapidly lead to impairment and must be avoided. When a
use is mandated by law but causes unacceptable impacts on park resources or values, the
Service will take appropriate management actions to avoid or mitigate the adverse effects.‖
(Section 8.1.1)
Thus, relative to visitor use, park managers must evaluate the types and extents of resource
impacts associated with recreational activities, and determine to what extent they are
unacceptable and constitute impairment. Further, managers must seek to avoid or limit any form
of resource impact, including those judged to fall short of impairment. Visitor impact monitoring
programs can assist managers in making objective evaluations of impact acceptability and
impairment and in selecting effective impact management practices by providing quantitative
documentation of the types and extent of recreation-related impacts to natural resources.
Monitoring programs are also explicitly authorized in Section 4.1 of the Management Policies:
"Natural systems in the national park system, and the human influences upon them, will be
monitored to detect change. The Service will use the results of monitoring and research to
understand the detected change and to develop appropriate management actions". (Section 4.1)
―Further, The Service will:
Identify, acquire, and interpret needed inventory, monitoring, and research, including
applicable traditional knowledge, to obtain information and data that will help park
managers accomplish park management objectives provided for in law and planning
documents.
Page 15
Justification for Monitoring
Page 13
Define, assemble, and synthesize comprehensive baseline inventory data describing the
natural resources under its stewardship, and identify the processes that influence those
resources.
Use qualitative and quantitative techniques to monitor key aspects of resources and
processes at regular intervals.
Analyze the resulting information to detect or predict changes, including interrelationships
with visitor carrying capacities, that may require management intervention, and to provide
reference points for comparison with other environments and time frames.
Use the resulting information to maintain-and, where necessary, restore-the integrity of
natural systems" (Section 4.2.1).
The National Park Service has implemented a strategy designed to institutionalize natural
resource inventory and monitoring on a programmatic basis throughout the agency. A service-
wide Inventory & Monitoring Program has been implemented to ensure that park units with
significant natural resources possess the resource information needed for effective, science-based
managerial decision-making and resource protection. A key component of this effort, known as
the NPS Inventory & Monitoring Program, is the organization of park units into 32 ecoregional
networks to conduct long-term monitoring for key indicators of change, or ―vital signs.‖ Vital
signs are measurable, early warning signals that indicate changes that could impair the long-term
health of natural systems. Early detection of potential problems allows park managers to take
steps to restore ecological health of park resources before serious damage can happen.
Carrying Capacity Decision-Making
Decisions regarding impact acceptability and the selection of actions needed to prevent resource
impairment frequently fall into the domain of carrying capacity decision-making. The 1978
National Parks and Recreation Act (P.L. 95-625) requires the NPS to determine carrying
capacities for each park as part of the process of developing a general management plan.
Specifically, amendments to Public Law 91-383 (84 Stat. 824, 1970) require general
management plans developed for national park units to include ―identification of and
implementation commitments for visitor carrying capacities for all areas of the unit‖ and
determination of whether park visitation patterns are consistent with social and ecological
carrying capacities. Regulations implementing the National Forest Management Act of 1976
(P.L. 94-588) dictate that, in wilderness management planning, provision be made ―for limiting
and distributing visitor use of specific areas in accord with periodic estimates of the maximum
levels of use that allow natural processes to operate freely and that do not impair the values for
which wilderness areas were created.‖
The NPS employs the Visitor Experience and Resource Protection (VERP) planning and
decision-making framework for formal evaluations of the acceptability of visitor impacts and for
establishing carrying capacity limits on visitation (NPS 1997, NPS 2006) (Figure 1). Visitor
impact monitoring programs provide an essential component of such efforts. VERP and other
similar frameworks (e.g., Limits of Acceptable Change, LAC), evolved from, and have largely
replaced, management approaches based on the more traditional carrying capacity model
(Stankey et al. 1985). Under these newer frameworks, numerical standards are set for individual
biophysical or social condition indicators. These limits define the critical boundary between
acceptable and unacceptable change in resource or social conditions, and against which
Page 16
Justification for Monitoring
Page 14
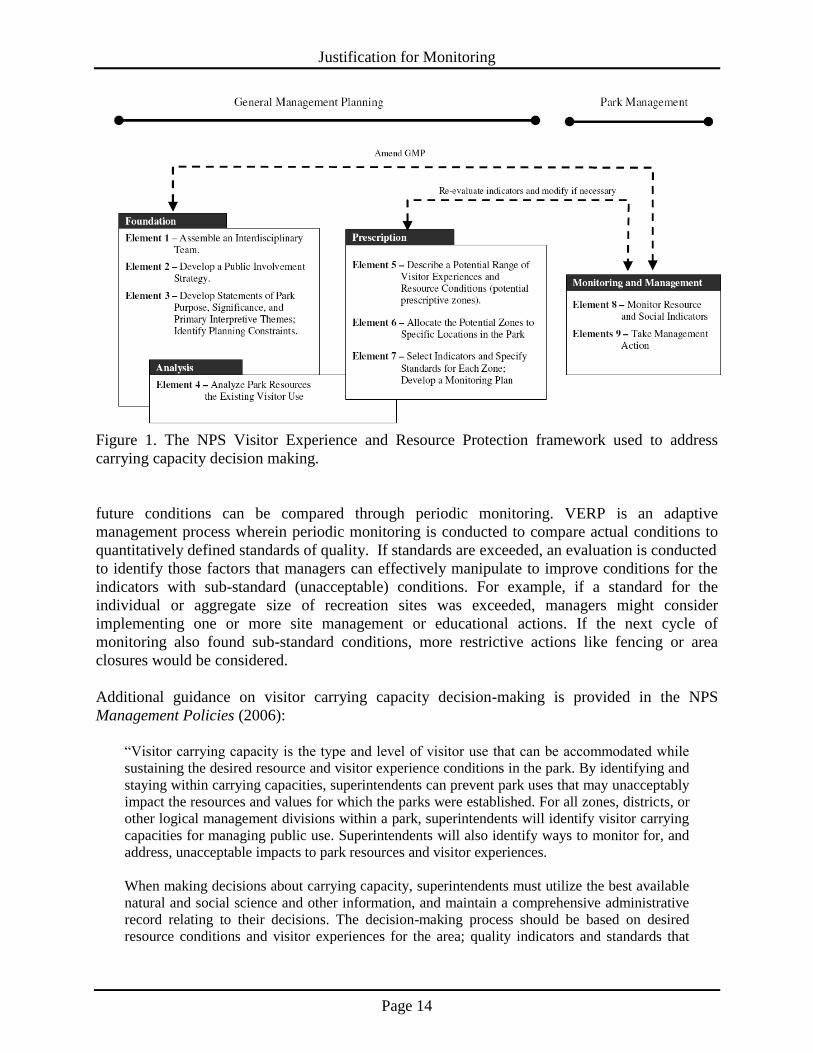
Figure 1. The NPS Visitor Experience and Resource Protection framework used to address
carrying capacity decision making.
future conditions can be compared through periodic monitoring. VERP is an adaptive
management process wherein periodic monitoring is conducted to compare actual conditions to
quantitatively defined standards of quality. If standards are exceeded, an evaluation is conducted
to identify those factors that managers can effectively manipulate to improve conditions for the
indicators with sub-standard (unacceptable) conditions. For example, if a standard for the
individual or aggregate size of recreation sites was exceeded, managers might consider
implementing one or more site management or educational actions. If the next cycle of
monitoring also found sub-standard conditions, more restrictive actions like fencing or area
closures would be considered.
Additional guidance on visitor carrying capacity decision-making is provided in the NPS
Management Policies (2006):
―Visitor carrying capacity is the type and level of visitor use that can be accommodated while
sustaining the desired resource and visitor experience conditions in the park. By identifying and
staying within carrying capacities, superintendents can prevent park uses that may unacceptably
impact the resources and values for which the parks were established. For all zones, districts, or
other logical management divisions within a park, superintendents will identify visitor carrying
capacities for managing public use. Superintendents will also identify ways to monitor for, and
address, unacceptable impacts to park resources and visitor experiences.
When making decisions about carrying capacity, superintendents must utilize the best available
natural and social science and other information, and maintain a comprehensive administrative
record relating to their decisions. The decision-making process should be based on desired
resource conditions and visitor experiences for the area; quality indicators and standards that
Page 17
Justification for Monitoring
Page 15
define the desired resource conditions and visitor experiences; and other factors that will lead to
logical conclusions and the protection of park resources and values…
The general management planning process will determine the desired resource and visitor
experience conditions that are the foundation for carrying capacity analysis and decision-
making. If a general management plan is not current or complete, or if more detailed decision-
making is required, a carrying capacity planning process, such as the Visitor Experience and
Resource Protection (VERP) framework, should be applied in an implementation plan or an
amendment to an existing plan.
As use changes over time, superintendents must continue to decide if management actions are
needed to keep use at acceptable and sustainable levels. If indicators and standards have been
prescribed for an impact, the acceptable level is the prescribed standard. If indicators and
standards do not exist, the superintendent must determine how much impact can be tolerated
before management intervention is required.‖ (Section 8.2.1)
Visitor Perceptions of Resource Conditions
Visitors to wildland environments are aware of resource conditions along trails and at recreation
sites, just as are managers (Lucas 1979, Marion & Lime 1986, Vaske et al. 1982). Legislative
mandates set high standards when they direct managers to keep protected natural areas
―unimpaired‖ and human impacts ―substantially unnoticeable.‖ Seeing trails and recreation sites,
particularly those in degraded condition, reminds visitors that others have preceded them. In
remote areas even the presence of trails and recreation sites reduce perceived naturalness and can
diminish opportunities for solitude. In accessible and popular areas the proliferation and
deterioration of trails and recreation sites present a ―soiled‖ or ―used‖ appearance, in contrast to
the ideal of a pristine natural environment (Leung & Marion 2000).
Degraded resource conditions on trails and recreation sites can have significant utilitarian, safety,
and experiential consequences for visitors (Leung & Marion 2000). Trails serve a vital
transportation function in protected natural areas and their degradation greatly diminishes their
utility for visitors and land managers. For example, excessive tread erosion or muddiness can
render trails difficult and unpleasant to use. Such conditions can also threaten visitor or
packstock safety and prevent or slow rescues, possibly increasing agency liability. Impacts
associated with certain types of uses, such as linear rutting from bikes or vehicles or muddy hoof
prints from horses, can also exacerbate conflicts between recreationists.
Visitors spend most of their time within protected natural areas on trails and recreation sites, so
their perceptions of the area and its naturalness are strongly influenced by trail and site
conditions. Visitors are sensitive to overt effects of other visitors (such as the occurrence of litter,
horse manure, malicious damage to vegetation) and to visually obtrusive examples of impacts
such as tree root exposure, tree felling, and soil erosion. A survey of visitors to four wilderness
areas, three in southeastern states and another in Montana, found that littering and human
damage to recreation site trees were among the most highly rated indicators affecting the quality
of recreational experiences (Roggenbuck et al. 1993). Amount of vegetation loss and exposed
soil around a recreation site were rated as more important than many social indicators, including
number of people seen while hiking and encounters with other groups at recreation sites.
Page 18
Justification for Monitoring
Page 16
Hollenhorst and Gardner (1994) also found vegetation loss and bare ground on recreation sites to
be important determinants of satisfaction by wilderness visitors.
Monitoring Program Capabilities
Visitor impact monitoring programs can be of significant value when providing managers with
reliable information necessary for establishing and evaluating resource protection policies,
strategies, and actions. When implemented properly and with periodic reassessments, these
programs produce a database with significant benefits to protected area managers (Figure 2).
Data from the first application of impact assessment methods developed for a long-term
monitoring program can objectively document the types and extent of recreation-related resource
impacts. Such work also provides information needed to select appropriate biophysical indicators
and formulate realistic standards, as required in VERP or LAC planning and decision-making
frameworks.
Reapplication of impact assessment protocols as part of a monitoring program provides an
essential mechanism for periodically evaluating resource conditions in relation to standards.
Visitor impact monitoring programs provide an objective record of impacts, even though
individual managers come and go. A monitoring program can identify and evaluate trends when
data are compared between present and past resource assessments. It may detect deteriorating
conditions before severe or irreversible changes occur, allowing time to implement corrective
actions. Analysis of monitoring data can reveal insights into relationships with causal or non-
causal yet influential factors. For example, the trampling and loss of vegetation or soils may be
greatly reduced by shifting trails to more resistant and resilient vegetation types or topographic
alignments, instead of more contentious limitations on use. Following the implementation of
corrective actions, monitoring programs can evaluate their efficacy.
Identify and quantify site-specific resource impacts.
Summarize impacts by environmental or use-related factors to evaluate relationships.
Aid in setting and monitoring resource conditions standards of quality.
Evaluate deterioration to suggest potential causes and effective management actions.
Evaluate the effectiveness of resource protection measures.
Identify and assign priorities to maintenance needs.
Figure 2. Capabilities of visitor impact monitoring programs.
Page 19
Page 17
LITERATURE REVIEW
Two primary issues associated with the development of a visitor impact monitoring program are
the selection of indicators that will be monitored and their assessment procedures. Criteria for
selecting indicators of change related to trails are reviewed, and prospective indicators and
measurement units are presented. Common trail impact assessment procedures are also reviewed.
Visitation-Related Resource Impacts
Visitors participating in a diverse array of recreation activities, including hiking, camping,
wildlife viewing, biking, and boating, contribute to an equally diverse array of effects on the
resources of protected natural areas, including vegetation, soils, water, and wildlife. The term
impact is commonly used to denote any undesirable visitor-related change in these resources.
This study was restricted to assessments of trampling-related impacts to vegetation and soil
along trails.
Formal Trail Impacts
The NPS has applied a wide range of tools and techniques to manage visitor use, including the
development of recreation infrastructures that include formal designated trail systems. Well-
designed formal trail networks provide enjoyable recreation experiences for a wide variety of
visitors and allow access to many points of interest within protected areas. Formal trails
accommodate intensive visitor traffic by providing durable treads ―hardened‖ to sustain
substantial traffic. The provision of formal trails is consistent with a ―containment‖ strategy that
minimizes visitor impacts by concentrating traffic on durable tread surfaces that provide access
to a variety of park locations (Hammitt & Cole 1998, Marion & Leung 2004). Confining
trampling impacts to a limited network of formal trails avoids more widespread degradation that
would be caused by less structured patterns of visitor activity and traffic.
Most formal trail systems are designed and maintained to sustain high traffic while minimizing
associated environmental impacts. For example, well-designed trails avoid steep grades and ―fall
line‖ alignments parallel to the landform grade that are difficult to drain and intercept natural
water flows (Marion & Leung 2004, Olive & Marion 2009). Unfortunately, many trails are not
properly located, constructed or maintained to sustain their intended uses. Many formal trails
were originally created by visitors or individuals who lacked trail design expertise, or were
directed by objectives (e.g., fire fighting) that resulted in less sustainable designs (Marion &
Leung 2004). Even well-designed and managed trails are susceptible to the many forms of
degradation.
Resource impacts associated with trampling on trails include an array of direct and indirect
effects (Table 1). Even light traffic can remove protective layers of vegetation cover and organic
litter (Cole 2004, Leung & Marion 1996). Trampling disturbance can alter the appearance and
composition of trailside vegetation by reducing vegetation height and favoring trampling
resistant species. The loss of tree and shrub cover can increase sunlight exposure, which
Page 20
Literature Review
Page 18
promotes further changes in composition by favoring shade-intolerant plant species (Hammitt &
Cole 1998, Leung & Marion 2000).
When a trail is constructed or created from visitor use, the surface vegetation and organic litter
are lost, exposing underlying mineral soil that is shaped and compacted into a durable tread to
support visitor traffic. However, exposure of soil on natural surfaced trails can lead to several
resource impacts, including soil compaction, muddiness, erosion, and trail widening (Hammitt &
Cole 1998, Leung & Marion 1996, Tyser & Worley 1992). The compaction of soils decreases
soil pore space and water infiltration, which in turn increases muddiness, water runoff and soil
erosion. The erosion of soils along trails exposes rocks and plant roots, creating a rutted, uneven
tread surface. Eroded soils may smother vegetation or find their way into water bodies,
increasing water turbidity and sedimentation impacts to aquatic organisms (Fritz 1993). Visitors
seeking to circumvent muddy or badly eroded sections contribute to tread widening and creation
of parallel secondary treads, which expand vegetation loss and the aggregate area of trampling
disturbance (Marion 1994, Liddle & Greig-Smith 1975).
The creation and use of trails can also directly degrade and fragment wildlife habitats, and the
presence of trail users may disrupt essential wildlife activities such as feeding, reproduction and
the raising of young (Knight & Cole 1995). For example, Miller and others (1998) found
decreased presence of nesting birds near trails in grassland ecosystems. Trails can alter
hydrology by intercepting and channeling surface water (Sutherland et al. 2001), and fragment
the landscape with potential barriers to flora and some small fauna (Leung 2002, 2007). Finally,
visitors and livestock can also introduce and transport non-native plant species along trails, some
of which may out-compete undisturbed native vegetation and migrate away from trails
(Benninger-Truax et al. 1992, Adkison & Jackson 1996, Bhuju & Ohsawa 1998, Potito & Beatty
2005, Hill & Pickering 2006)
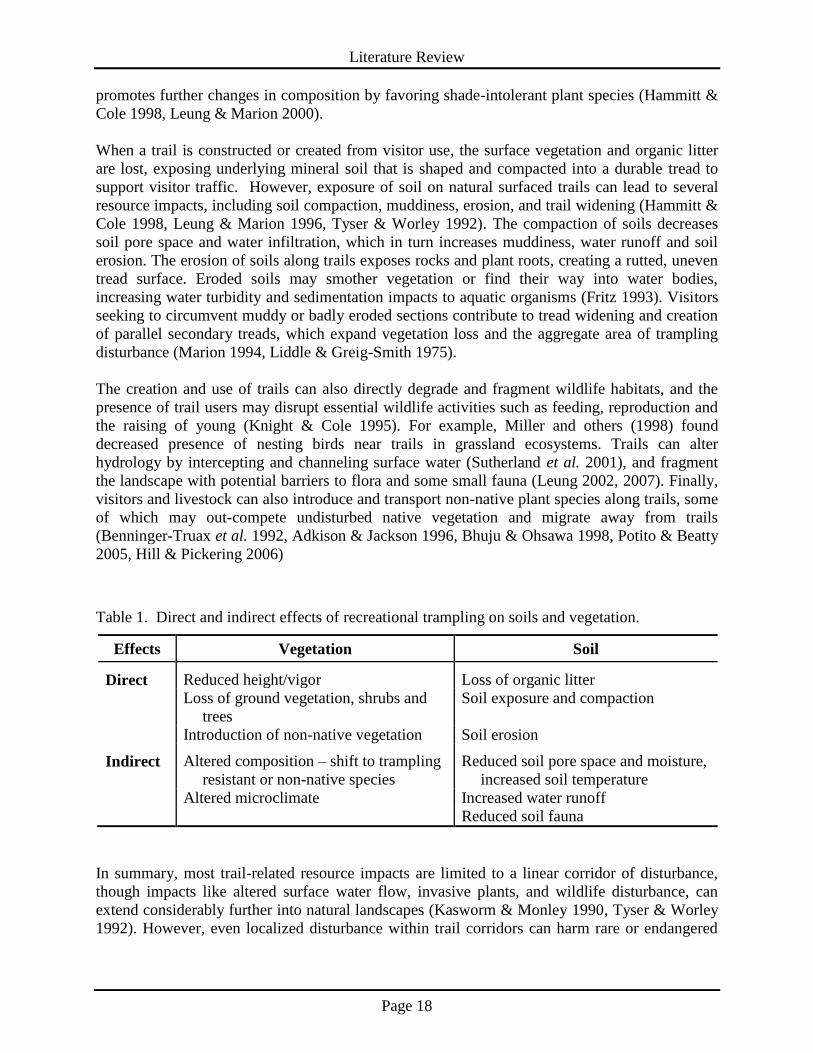
Table 1. Direct and indirect effects of recreational trampling on soils and vegetation.
Effects Vegetation Soil
Direct Reduced height/vigor Loss of organic litter
Loss of ground vegetation, shrubs and
trees
Soil exposure and compaction
Introduction of non-native vegetation Soil erosion
Indirect Altered composition – shift to trampling
resistant or non-native species
Reduced soil pore space and moisture,
increased soil temperature
Altered microclimate Increased water runoff
Reduced soil fauna
In summary, most trail-related resource impacts are limited to a linear corridor of disturbance,
though impacts like altered surface water flow, invasive plants, and wildlife disturbance, can
extend considerably further into natural landscapes (Kasworm & Monley 1990, Tyser & Worley
1992). However, even localized disturbance within trail corridors can harm rare or endangered
Page 21
Literature Review
Page 19
species or damage sensitive plant communities, particularly in environments with slow recovery
rates.
Informal Trail Impacts
When formal trail networks fail to provide visitors the access and experiences they desire,
visitors frequently venture ―off-trail‖ to reach locations not accessible by formal trails. Even
relatively low levels of informal trail traffic can wear down vegetation and organic litter to create
visible informal (visitor-created) trail networks (Weaver & Dale 1978, Thurston & Reader 2001).
The establishment of informal trails is commonplace in national parks and other protected areas,
especially heavily visited areas. Often referred to as social trails, their proliferation in number
and expansion in length over time are perennial management concerns. Furthermore, because
informal trails are not professionally designed, constructed or maintained they can contribute
substantially greater impacts to protected area resources than formal trails. Many of these
impacts are related to their poor design, including alignments parallel to slopes or along
shorelines, multiple trails accessing the same destinations, routes through fragile vegetation,
soils, or sensitive wildlife habitats, and disturbance to rare flora, fauna, or archaeological sites.
These design attributes also make informal trails far more susceptible to tread impacts, including
expansion in width, soil erosion, and muddiness.
Areas previously untrampled by human footprints can become severely degraded when repeated
visitation results in the creation of informal trails. A study by Thurston and Reader (2001) found
an 81% mean loss of vegetation density in the center zone of new informal trails, and a 71%
decline in the species present. Mean soil exposure also increased by 23% in these areas.
Understanding and minimizing the ecological disturbance caused by off-trail hiking is important
to maintaining both the environmental and social aspects of the recreation experience. Research
demonstrates that the quality of a visitor’s experience is likely to decrease if degradation to a trail
is present (Lynn & Brown 2003).
Informal trail proliferation is common in high visitation settings and in some parks is responsible
for extensive areas of impact. A study in Mount Rainier National Park on the impacts of informal
trail use identified 913 degraded sites and attributed 89% of them to the presence of informal
trails (Rochefort & Gibbons 1992). Other studies show that certain landscapes and visitor
motivations might make some areas more susceptible to informal trail proliferation. In areas
such as open moorland in the UK, informal trails and consequent degradation of the landscape
are widely visible (Pearce-Higgins & Yalden 1997). Other areas appear to be more prone to off-
trail hiking because most visitors who wander off the official trail are taking a shorter route to a
site of interest (Keirle & Stephens 2004). Conversely, informal trails are less common in areas
that have more medium-sized trees, topographical elements, and fallen trees that impede the ease
of human access (Lehvavirta 1999). Regardless of an area’s susceptibility to off-trail hiking, this
form of depreciative behavior causes hundreds of thousands of dollars in damage each year
(Christensen & Clark 1983). In an effort to reduce the damage caused by informal trail use,
educational and site management techniques can be evaluated and tested for their effectiveness
in reducing off-trail travel.
Page 22
Literature Review
Page 20
Trail Management
Several studies show that proper trail design and construction principles minimize adverse
impacts to natural resources and reduce the need for trail maintenance (Leung & Marion 1996,
Marion & Leung 2004, Marion 2006, Olive & Marion 2009). The source of many forms of
degradation along formal trails can be related to poor design attributes such as steep grades,
alignments close to the fall line (parallel to landform aspect), or to locations on perennially wet
soils. Some formal trails were originally created by visitors or individuals who lacked trail
design expertise or were directed by objectives in conflict with resource protection goals (Marion
& Leung 2004). Well-designed trails require periodic maintenance, which can be challenging to
sustain under conditions of declining agency budgets. Even well-designed and managed trails are
susceptible to the several forms of degradation when subjected to high use or to high-impact
behaviors or types of use (e.g., horse riding and motorized uses) (Aust et al. 2004).
Common knowledge assumes that informal trails are less ―sustainable‖ than their formal trail
counterparts, because of the lack of professional design and construction associated with their
creation. Visual observation and research also suggests that visitors traveling off-trail often take
the shortest path, cutting switchbacks or directly ascending slopes (Cole 1993), or the path of
least resistance, avoiding dense vegetation or challenging terrain (Bayfield 1973). Finally,
common knowledge assumes that off-trail hikers do not generally recognize or attempt to avoid
sensitive resources (e.g., rare fauna/flora habitats), or select routes that reflect the principles of
sustainable trail design (e.g., side-hill alignments) (Marion & Leung 2004).
The development, deterioration and proliferation of informal trails in protected areas can be a
vexing management issue for land managers. Traveling off-trail is necessary to engage in
activities such as nature study, photography or exploration. Unfortunately, management
experience reveals that informal trail systems are frequently poorly designed, including ―shortest
distance‖ routing with steep grades and fall-line alignments. Such routes are rarely sustainable
under heavy traffic and subsequent resource degradation is often severe. Creation of multiple
routes to common destinations is another frequent problem, resulting in ―avoidable‖ impacts
such as unnecessary vegetation/soil loss and fragmentation of flora/fauna habitats.
Once created, managers have found it difficult to deter their use and even when successful, their
recovery requires long periods of time (Grabherr 1982, Cole 1990, Boucher et al. 1991, Roovers
et al. 2005). Restoration work can hasten recovery but is expensive and generally requires
archeological assessment and compliance work. Informal trails are particularly problematic
because they become more visually obvious as they form, acting as a ―releasor cue‖ that draws
even more visitors off formal trails (Roggenbuck 1992, Brooks 2003). Informal trails are often
indistinguishable from formal trails, except for the lack of formal trail blazes or markings.
Previous research has investigated the deterrence of off-trail hiking through educational
messages (Johnson & Swearingen 1992) and site management (Matheny 1979, Johnson et al.
1987, Sutter et al. 1993, Park et al. 2008). Informal trail proliferation and resource impact is a
problem across all types of protected natural areas as shown by research and monitoring studies
conducted around the globe (Grabherr 1982, Cole 1990, Ferris et al. 1993, Marion & Cahill
2006, Manning et al. 2006, Marion & Hockett 2008a, Wood et al. 2006). However, few studies
have extensively mapped or investigated the resource impacts of informal trail networks within
protected natural areas (Cole et al. 1997, Leung 2002, Marion & Hockett 2008b, Leung 2007),
Page 23
Literature Review
Page 21
although several have collected informal trail counts in conjunction with campsite, recreation
site, or formal trail inventories (Marion 1994, Leung & Marion 1999c, Dixon et al. 2004, Marion
& Cahill 2006, Wood et al. 2006).
Indicators and Selection Criteria
Indicators are measurable physical, ecological, or social variables used to track trends in
conditions caused by human activity so that progress toward goals and desired conditions can be
assessed. An indicator is any setting element that changes in response to a process or activity of
interest (Merigliano 1990). An indicator's condition provides a gauge of how recreation has
changed a setting. Comparison to management objectives or indicator standards reveals the
acceptability of any resource changes. Indicators provide a means for restricting information
collection and analysis to the most essential elements needed to answer management questions.
Examples of questions related to trails include:
Are visitors experiencing an environment where the evidence of human activity is substantially
unnoticeable?
Are trail numbers and conditions acceptable given each management zone’s objectives and
desired conditions?
Are visitor and trail management practices effective in minimizing the establishment of informal
trails or degradation in formal and informal trails?
Before a monitoring program can be developed, appropriate resource indicators must be selected.
A single, direct measurement of a trail’s condition is inappropriate because the overall condition
is an aggregate of many components. Typically, then, monitoring evaluates various soil,
vegetation, or aesthetic elements of a trail that serve as indicators of that facility’s condition.
Cole (1989), Marion (1991) and Merigliano (1990) review criteria for the selection of indicators
(Table 2), which are summarized here. Management information needs, reflected by the
management questions such as the examples above, guide the initial selection of indicators.
Preferred indicators should reflect attributes that have ecological and/or aesthetic significance.
Indicator measures should primarily reflect changes caused by the recreational activity of
interest. For example, measures of soil loss related to trail construction would be inappropriate.
Indicators should be measurable, preferably at an interval or ratio scale where the distances
between numeric values are meaningful, i.e. a 36-inch wide trail is twice the width of an 18-inch
wide trail. In comparison, a categorical ratings system based on subjective assessments rather
than quantitative measures provides data at an ordinal scale. Distance between numeric values
are not meaningful so computing an average or using them in statistical analyses or testing is not
appropriate.
Page 24
Literature Review
Page 22
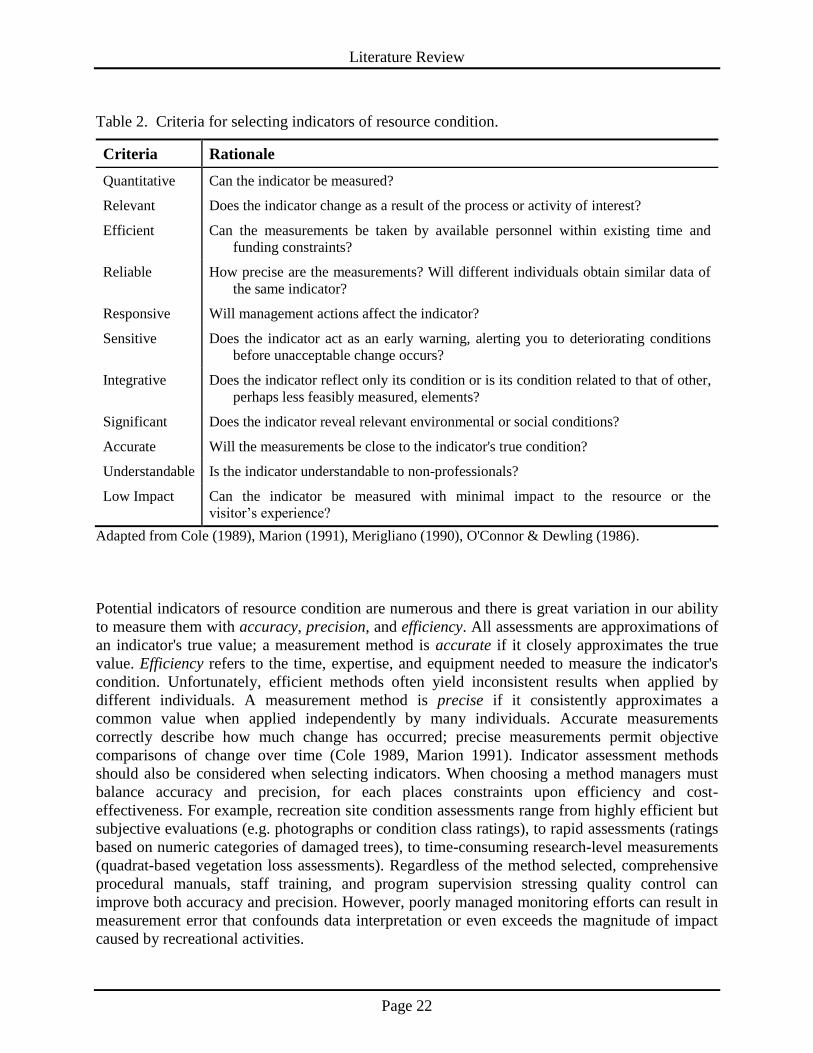
Table 2. Criteria for selecting indicators of resource condition.
Criteria Rationale
Quantitative Can the indicator be measured?
Relevant Does the indicator change as a result of the process or activity of interest?
Efficient Can the measurements be taken by available personnel within existing time and
funding constraints?
Reliable How precise are the measurements? Will different individuals obtain similar data of
the same indicator?
Responsive Will management actions affect the indicator?
Sensitive Does the indicator act as an early warning, alerting you to deteriorating conditions
before unacceptable change occurs?
Integrative Does the indicator reflect only its condition or is its condition related to that of other,
perhaps less feasibly measured, elements?
Significant Does the indicator reveal relevant environmental or social conditions?
Accurate Will the measurements be close to the indicator's true condition?
Understandable Is the indicator understandable to non-professionals?
Low Impact Can the indicator be measured with minimal impact to the resource or the
visitor’s experience?
Adapted from Cole (1989), Marion (1991), Merigliano (1990), O'Connor & Dewling (1986).
Potential indicators of resource condition are numerous and there is great variation in our ability
to measure them with accuracy, precision, and efficiency. All assessments are approximations of
an indicator's true value; a measurement method is accurate if it closely approximates the true
value. Efficiency refers to the time, expertise, and equipment needed to measure the indicator's
condition. Unfortunately, efficient methods often yield inconsistent results when applied by
different individuals. A measurement method is precise if it consistently approximates a
common value when applied independently by many individuals. Accurate measurements
correctly describe how much change has occurred; precise measurements permit objective
comparisons of change over time (Cole 1989, Marion 1991). Indicator assessment methods
should also be considered when selecting indicators. When choosing a method managers must
balance accuracy and precision, for each places constraints upon efficiency and cost-
effectiveness. For example, recreation site condition assessments range from highly efficient but
subjective evaluations (e.g. photographs or condition class ratings), to rapid assessments (ratings
based on numeric categories of damaged trees), to time-consuming research-level measurements
(quadrat-based vegetation loss assessments). Regardless of the method selected, comprehensive
procedural manuals, staff training, and program supervision stressing quality control can
improve both accuracy and precision. However, poorly managed monitoring efforts can result in
measurement error that confounds data interpretation or even exceeds the magnitude of impact
caused by recreational activities.
Page 25
Literature Review
Page 23
Some indicators are less appropriate than others. For example, indicators of depreciative
behavior, such as tree damage, litter, and fire construction in areas were fires are banned, detract
unacceptably from environmental or social conditions. Unfortunately, indicators that reflect
depreciative behavior present difficulties for managers because the resource degradation is often
attributable to a small number of visitors whose actions may be less responsive to traditional
management actions. These, and other indicators that are temporally dynamic, are also difficult
to monitor effectively. For example, the number of fire sites and extent of litter and improperly
disposed human waste can vary considerably from one week or month to the next.
Preferred Indicators
From these indicator criteria and knowledge of how recreation affects soil, vegetation, and
aesthetics, managers select preferred indicators of trail or recreation site conditions. Table 3
includes a listing of commonly employed indicators for assessing resource conditions on trails
and recreation sites using measurement-based approaches. Generally a small number of
indicators are selected for use in LAC or VERP frameworks. However, that does not preclude
monitoring of additional resource condition indicators or from also assessing various inventory
indicators. Travel time to the sampling locations is often the most substantial portion of the time
budget so assessing a few additional indicators can be negligible. A final consideration is the
measurement units employed for reporting results and/or setting standards. Measurement-based
approaches permit the most flexibility in this respect.
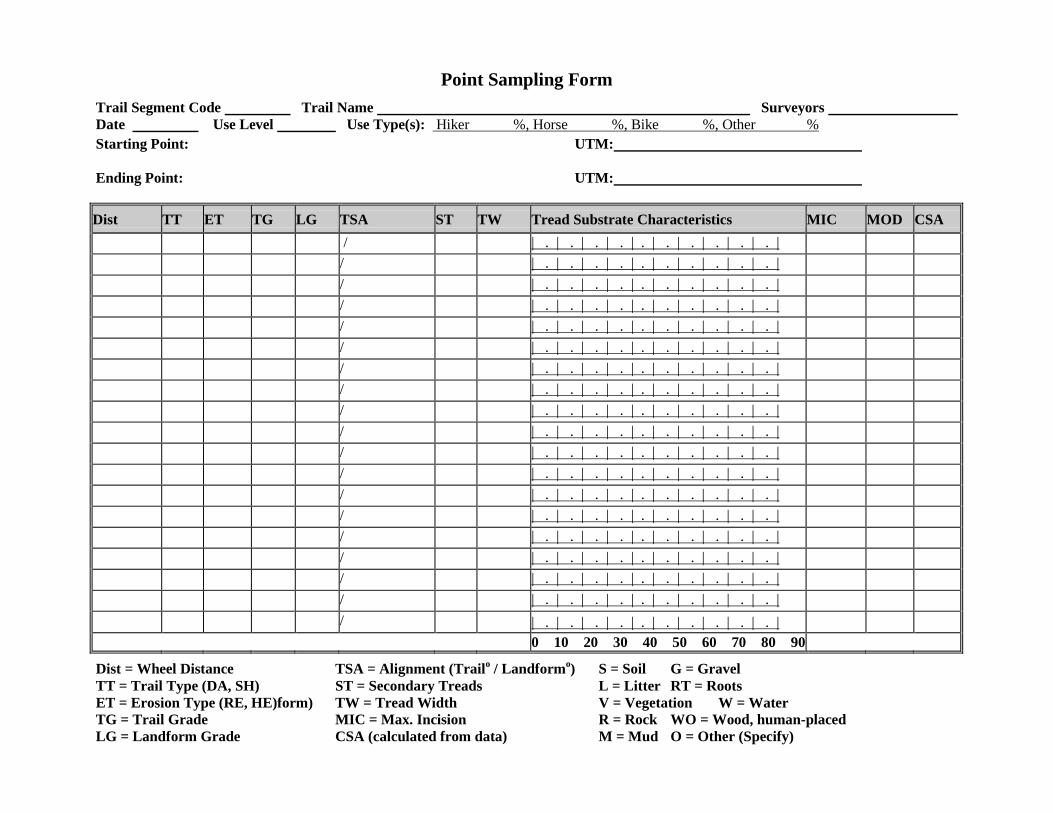
For trails, the number, length, and density of informal trails, along with tread width, are the most
commonly used indicators. Soil loss, the most ecologically significant trail impact, can be
assessed at sample points by measuring maximum incision or cross sectional area. Similarly,
tread muddiness can be assessed at sample points as a percentage of tread width.
Table 3. Potential indicators of trail conditions and measurement units.
Trail Indicators Measurement Units
Informal Trails Length/unit area, % of formal trail length, #/unit length on formal trails Tread Width
Max. value, value/unit length, running avg./unit length
Maximum Incision Max. value, value/unit length, running avg./unit length
Cross Sectional Area Max. value, value/unit length, running avg./unit length
Muddiness Max. % of tread width, avg. %/unit length, running avg. %/unit length
In summary, managers must consider and integrate a diverse array of issues and criteria in
selecting indicators for monitoring impacts on trails. Indicators will rarely score high on all
criteria requiring good judgment as well as area-specific field trials and direct experience.
Indicators that score high on some criteria but low on others may be retained in some instances
or omitted in others. Tradeoffs are also required, such as a necessary reduction in accuracy so
that precision and efficiency may be increased.
Page 26
Literature Review
Page 24
Types of Trail Impact Assessment Systems
Formal trail surveys provide information for a number of important management needs. The
location and lineal extent of formal and informal trails can be documented and monitored. The
number, location and efficacy of trail maintenance features, such as water bars and drainage dips,
can be assessed. Trail conditions may be assessed to identify the location, type and extent of trail
resource impacts. Information on trail conditions can be used to inform the public about trail
resources, justify staffing and funding, evaluate the acceptability of existing resource conditions,
analyze relationships between trail impacts and contributing factors, identify and select
appropriate management actions, and evaluate changes in trail conditions and the effectiveness
of implemented actions.
A variety of efficient methods for evaluating trails and their resource conditions have been
developed and described in the literature, as reviewed and compared by Coleman (1977), Cole
(1983), and Leung and Marion (2000). At the most basic level, a trail inventory may be
employed to locate and map trails and to document trail features such as type of use, segment
lengths, hiking difficulty, and natural and cultural features. Trail location information can be
accurately documented using a Global Positioning System (GPS) device, which can be input to a
Geographic Information System (GIS) for display and analysis of trail attributes (Wolper et al.
1994, Wing & Shelby 1999).
Trail facility and maintenance assessments provide information on existing or needed trail
maintenance features or work. These assessments may be used to develop databases on signs
(e.g., location and text), existing facilities (e.g., bridges) and tread features (e.g., water bars,
steps, bog bridging). Prescriptive trail maintenance work log assessments have also been
developed to describe recommended solutions to existing tread deficiencies, such as installation
of water bars and steps or trail rerouting (Birchard & Proudman 2000, Williams & Marion 1992).
Data can be summarized to provide cost and staffing estimates and to direct work crews.
Trail condition assessments seek to describe resource conditions and impacts for the purpose of
documenting trends in trail conditions, investigating relationships with influential factors, and
evaluating standards or the efficacy of corrective management actions. Leung and Marion (2000)
provide a classification of alternative trail impact assessment and monitoring methods.
Sampling-based approaches employ either systematic point sampling, where tread assessments
are conducted at a fixed interval along a trail (Cole 1983, 1991), or stratified point sampling,
where sampling varies in accordance with various strata such as level of use or vegetation type
(Hall & Kuss 1989). Alternately, census-based approaches employ either sectional evaluations,
where tread assessments are made for entire trail sections (Bratton et al. 1979), or problem
census evaluations, where continuous assessments record every occurrence of predefined impact
problems (Cole 1983, Leung & Marion 1999a, Marion 1994). These two approaches of
assessment have been combined in an integrative survey (Bayfield & Lloyd 1973). More
elaborate and time-consuming methods for accurately characterizing soil loss (Leonard &
Whitney 1977) and vegetation changes (Hall & Kuss 1989) have also been developed.
An evaluation by Marion and Leung (2001) concluded that the point sampling method provides
more accurate and precise measures of trail characteristics that are continuous or frequent (e.g.,
tread width or exposed soil). The problem census method is a preferred approach for monitoring
Page 27
Literature Review
Page 25
trail characteristics that can be easily predefined or are infrequent (e.g., excessive width or
secondary treads), particularly when information on the location of specific trail impact problems
is needed.
Assessing Informal Trail Networks
A comprehensive review of the literature found very few reported examples of research or
monitoring efforts focused on assessing informal trail networks (Marion et al. 2006). While
informal trails likely occur in nearly every protected area, managers have frequently ignored
their presence, limiting monitoring efforts to formal trail systems. Furthermore, conventional
trail condition assessment protocols are often difficult to apply to informal trails due to their
unique spatial characteristics (Marion & Leung 2001). Informal trail segments are often
comparatively numerous, short, and often braided in complex patterns (see Figure 3Figure 3),
creating sampling and assessment difficulties for point sampling or problem assessment methods
(Leung & Marion 1999a).
However, scientists and managers have recently
been focusing greater attention to the impacts of
informal trail networks and to developing methods
for assessing and monitoring their impacts on
protected area resources. Managers seeking to
assess informal trails must first consider two
categories of attributes: spatial and resource
condition. Spatial attributes include the location,
arrangement, and lineal extent of informal trails.
Resource condition attributes include assessed
degradation of vegetation, organic litter, and soils
along informal trails.
It is possible to assess most spatial attributes using
scale-appropriate airborne remote sensing
techniques if trails are not under concealing
vegetation or when they are readily visible in leaf-
off photography (Witztum & Stow 2004). Kaiser
and others (2004) applied the best available techniques, including high spatial resolution
(0.6m/pixel) digital multi-spectral imagery, digital image processing, and visual image analysis
techniques, to detect and delineate new illegal immigrant trails in shrublands along the US-
Mexico border. They found that an automated linear feature extraction routine (Feature Analyst
in ArcView GIS), followed by manual interpretation, delineation, and editing using false color
infrared imagery, yielded the most accurate results. However, this method only resulted in 56%
of the GPS surveyed trail locations matching by length, in part due to shielding overhead
vegetation.
Extending this work, Cao and others (2007) evaluated three trail monitoring approaches and two
types of spectral transformation to aid in locating trails in imagery, procedures designed to
evaluate temporal changes in US-Mexico cross-border trail networks. They found that a map-to-
image differencing approach was the most sensitive and reliable in detecting new trails, though
no ground-based GPS surveys were conducted for comparison. For disturbed areas where the
Figure 3. A ―spaghetti‖ map showing
the complex network of informal trails
branching off the Potomac Gorge’s
Billy Goat Trail, CHOH.
Page 28
Literature Review
Page 26
trail networks were extensive, Principal Component Analysis (PCA) of the image was more
effective at enhancing new trails. For densely vegetated areas, a Normalized Difference
Vegetation Index (NDVI) image yielded more interpreted trails. The authors stress that high
quality, well registered, and radiometrically matched multi-temporal image datasets are needed
for efficient and reliable trail map updating procedures. Imagery from different years must also
be collected at the same phenological time and time of day to minimize errors due to vegetation
seasonality and sun angles.
We conclude that these techniques are impractical for most protected area managers due to the
substantial expense associated with image acquisition, technician expertise and time, and
substantial inaccuracies associated with the methodologies used and concealing vegetation cover.
Ground-based Global Positioning System (GPS) surveys are more accurate, use existing staffing
and resources, and provide more immediate results. Point-based assessment methods include
trailhead and transect surveys. A highly efficient method is to inventory informal trail junctions
with protected area roads, trails, or recreation sites, documenting junction locations with a
recreation or professional grade GPS, odometer, or measuring wheel (Bacon et al. 2006, Marion
& Cahill 2006). Alternately, an approach applying transects at fixed intervals within travel zones
was developed for Zion National Park to document the number and location of intersecting
informal trails (Marion & Hockett 2008a).
Line feature assessment methods provide more comprehensive information on the spatial
distribution and lineal extent of informal trail networks. This method requires a GPS set to
collect line features (tracks) as field staff walk all informal trails within a management unit. Trail
information from the GPS is then input to a Geographic Information System (GIS) for display
and analysis of trail attributes (Wolper et al. 1994). This commonly applied protocol has been
reported in several publications (Bacon et al. 2006, Cole et al. 1997, Leung et al. 2002, Leung &
Louie 2008, Manning et al. 2006, Marion et al. 2006, Marion & Hockett 2008b). Advantages of
census surveys include the ability to produce maps showing the location and spatial
arrangements of informal trail networks, document the number of trail segments and aggregate
lineal extent, perform GIS analyses to investigate proximity to rare flora or fauna or sensitive
environments, evaluate landscape fragmentation, and perform other relational analyses.
Resource conditions along informal trails can also be assessed to document effects on vegetation
and substrates. A common method is to assign a condition class rating, generally five categories
describing increasing levels of trampling impact from a faint trace to a barren and eroded tread
(see examples in Manning et al. 2006 and Marion et al. 2006). Informal trails are broken into
separate segments whenever condition classes change categories. Other tread condition
indicators such as width and depth, and inventory indicators such as trail grade and vegetation
type, can also be assessed using ratings and input as attributes of these segments (Rochefort &
Swinney 2000). Resource condition assessments recorded for trail segments generally employ
―typical‖ or categorical range data representative of the entire segment, resulting in some
inaccuracies because these assessments are generally not measured. Measurements that are more
accurate can be taken using a point sampling approach, generally employing a fixed interval
between points with a random start. This method was employed by Wood and others (2006) to
characterize informal tread width, depth, cross sectional area soil loss, and estimated total area of
disturbance.
Page 29
Page 27
STUDY AREA
The study area for this research extends along the Potomac River from Great Falls downstream
approximately five miles, including all of Great Falls Park on the Virginia side, Mather Gorge,
and Maryland side parklands down to and including the Carderock area. Park lands on the
Virginia side are managed by the George Washington Memorial Parkway (GWMP) (Figure 4);
park lands on the Maryland side are managed by the C&O Canal National Historical Park
(CHOH) (Figure 5). This area is located along a gradient where erosion-resistant Piedmont
bedrock gives way to the softer, sandy deposits of the Atlantic Coastal Plain. Its diverse habitats
of scoured bedrock river terraces, cliffs, flood plain forests, and upland woods include four
globally rare plant communities and many rare plants (Fleming et al. 2004). For example, 28
plant species found within GFP are on the State list of rare, threatened or endangered species,
including the sticky goldenrod (Solidago racemosa), Nantucket shadbush (Amelanchier
nantucketensis), sterile sedge, (Carex straminea), and western sunflower (Helianthus
occidentalis) (Charlie Davis, personal communication, Steury et al. 2008). However, the area is
also easily accessible by more than four million people in the Washington metro region and
offers a wide range of recreational activities including hiking, cycling, horseback riding,
kayaking, rock climbing, photography, fishing, and nature study. The majority of visitors (64%)
come to the area to walk, jog, or hike (Meldrum et al. 2004). The National Park Service and
Fairfax County protected natural areas recorded 2,809,968 visitors in 2007 (NPS, 2009), which
reflects the popularity of the Potomac Gorge.
Great Falls Park (GFP), Virginia is an approximately 800-acre park area managed by GWMP
that attracts both local visitors from the region and tourists from around the world. In 2007, the
NPS estimated annual visitation at just more than one-half million visitors (NPS 2009). Cultural
resources within the park include the historic ruins of George Washington’s ―Patowmack‖ Canal
and the town of Matildaville (NPS 2007). The park has established four management zones: the
Canal, Cultural & Natural, Developed, and Mather Gorge. There are eleven formal trails within
the GFP, a 12.31 mile network that includes 5 miles open to multiple uses to accommodate
mountain biking and horseback riding (Figure 4). The River trail follows the Potomac River
from the falls overlooks downstream along the scenic Mather Gorge. The Patowmack Canal trail
follows the ruins of this historic canal and the ruins of the canal town of Matildaville. The Old
Carriage Road trail, the Ridge trail and Mine Run trail follow upland oak forests and the Swamp
trail follows along a unique swamp habitat and lowland forest.
CHOH park lands include approximately 1211 acres, with 22 formal trails totaling 14.67 miles
(Figure 5). The River and Ford Mine trails provide visitor access to the areas upstream of Great
Falls. The Gold Mine tract includes a network of inland formal trails through upland wooded
terrain. The well-known Billy Goat Trail has three sections: Section A traverses Bear Island
bordering the Mather Gorge cliffs and includes challenging rock scrambles, Sections B and C
pass through floodplain.
Heavy park visitation, primarily on weekends, can lead to crowding at facilities within the park,
including the parking and picnic areas, scenic overlooks, and along trails (NPS 2007). Off-trail
traffic by visitors exploring and accessing a variety of locations not reached by the formal trail
system has led to the development of extensive informal trail networks. Informal trails are so
Page 30
Study Area
Page 28
prevalent and established in portions of the park that many visitors likely believe them to be part
of the park’s formal trail system.
Figure 4. Great Falls Park of GWMP in northeastern Virginia with formal trail system depicted.
Page 31
Study Area
Page 29
Figure 5. Upper Potomac Gorge and Carderock portions of CHOH in southeastern Maryland
with formal trail system depicted.
Page 32
Page 30
METHODS
Given park objectives we emphasized measurement-based procedures in our selection and
development of formal and informal trail monitoring procedures. To maximize flexibility in the
future selection of appropriate trail condition indicators and comparisons to the baseline
conditions documented by this study we developed and applied procedures for an array of
potential indicators.
Impact assessment procedures were developed and applied to all unpaved formal trails,
excluding the more intensively developed C&O Canal Towpath but including natural-surfaced
and graveled woods roads that are included in the formal park trails systems. Separate
procedures were developed and applied to all visitor-created informal trails that were located
based on thorough searches by field staff. However, we note that field staff may have missed a
small number of informal trails that were discontinuous (not connected) to the formal and
informal trail networks, or were located within some cliff areas that would have been too
dangerous to safely assess. Virginia Tech doctoral students Jeremy Wimpey and Logan Park
conducted the majority of the fieldwork for this report during May and June of 2007 and 2008
with limited field assistance from Jeff Marion and William Armstrong. The following sections
describe the sampling design, field methods, and analysis procedures applied to collect and
analyze the impact assessment data.
Trail Assessment Procedures
Formal Trails
Research goals were to develop and apply accurate and precise trail condition monitoring
protocols and provide baseline data for use in selecting environmental indicators and standards
of quality. As concluded by Marion and Leung (2001), point sampling methods provide more
useful and appropriate data for these purposes. Based on the findings of Leung and Marion
(1999b) and the need for an efficient method that NPS staff can replicate as part of a long-term
monitoring program, a 300 ft point-sampling interval was selected. This interval provided 184
sample points on the CHOH portion and 178 sample points on the GWMP portion of the park,
permitting robust statistical analyses and the ability to characterize trail conditions across the
trail networks. In addition, a problem assessment method was applied to document the number,
location, and lineal extent of excessively eroded and muddy trail segments.
A measuring-wheel was pushed along each formal trail, beginning at a randomly selected
location between 0 and 300 feet from the starting point, and stopping every 300 feet thereafter to
establish a transect where indicator assessments were performed (Figure 6). A detailed
description of the condition assessment procedures applied to formal trails is presented in
Appendix 1 and summarized here. At each sample point, a transect was established
perpendicular to the trail tread with endpoints defined by the most visually obvious outer
boundary of trampling-related disturbance. These boundaries are defined by pronounced changes
in ground vegetation height (trampled vs. untrampled), cover, composition, or when vegetation
cover is reduced or absent, by disturbance to organic litter or lichen (intact vs. pulverized). Trail
boundary definitions were illustrated with photographs and a consistent objective was to define
the trail tread that receives the majority (>95%) of traffic. The distance between these
Page 33
Methods
Page 31
Figure 6. Trail assessment and paperless data recording using a GPS unit at a transect established
on a sample point located by pushing a measuring wheel.
disturbance-associated boundaries was measured as trail width. Trail width was coded as ―not
applicable‖ in instances when sample points fell on barren non-vegetated bedrock (ledge).
Averaged GPS locations, differentially corrected to increase point accuracy, were recorded at
each transect to guide field staff in replicating procedures at approximately the same transect
locations during future monitoring cycles.
At each transect, survey staff assessed the grade of the trail and the dominant fall-line (landform
grade). Trail slope alignment angle (TSA) was assessed as the difference in compass bearing
between the prevailing landform slope (aspect) and the trail’s alignment at the sample point
(Leung & Marion 1996). The TSA of a contour-aligned trail would equal 90o while a true ―fall-
line‖ trail (aligned congruent to the landform slope) would have a TSA of 0o. The landform
position of the trail relative to the local topography was determined as side-hill or fall-line. Tread
surface composition was assessed in the following categories: bare soil, vegetation, organic litter,
roots, natural rock, stonework, and man-made materials (wood or gravel). For each category, the
percent of trail width was recorded to the nearest 5%. A count of additional secondary trails that
paralleled the survey trail at each sample point provided a measure of the extent of trail braiding.
The cross sectional area (CSA) of soil loss (in2), from the taut string to the tread surface, was
also measured using a fixed interval method (Cole 1983) (Figure 7, See Appendix 1 for detailed
procedures). Soil loss as assessed by this method includes soil compaction, nearby displacement
of soils (e.g. to trailsides), and soil loss from wind and water erosion. Temporary stakes were
placed at positions that enabled a line to be stretched along what survey staff judged to represent
Page 34
Methods
Page 32
the original land surface for fall-line trails, or the post-construction tread surface for constructed
side-hill trails. Vertical measurements from the line to the trail substrate surface were taken at a
fixed interval of 0.3 ft for narrower trails and 1 ft for wider trails. CSA provides a more accurate
measure of trail soil loss that can be extrapolated to provide an estimate of total soil loss from
each trail (ft3). CSA was calculated from the data collected at each sample point using
spreadsheet formulas. CSA measurements were not able to be assessed when sample points fell
on man-made materials (boardwalks, elevated treads, stonework) or on bare bedrock. As a
consequence, CSA measures were completed for 163 of the 184 CHOH transects and 164 of the
178 GWMP transects in the sample population.
Trail condition measures were calculated for each trail and for all trails combined, including area
of disturbance, CSA, and mean trail width and depth (Table 4). For example, ―area of
disturbance,‖ an estimate of the land area intensively disturbed by trail traffic, was calculated by
multiplying trail length by mean trail width. CSA volume, an estimate of aggregate soil loss
(CSA ft3), was calculated by multiplying mean CSA (converted to ft
2) by trail length.
Figure 7. Illustration of
the fixed interval CSA
method for assessing soil
loss at each transect.
Table 4. Description of trail impact indicators and calculation methods.
Trail Length Total length of the trail segment being assessed, summed to obtain an aggregate
measure for each study area.
Trail Width Width of trail that captures about 95% of all traffic, including trail-sides up to
the pre-use land surface for fall-aligned trails or up to the estimated post-
construction tread surface for side-hill trails. Assessed at sample points along
each trail and averaged for each trail to obtain mean trail width.
Area of Disturbance The mean trail width times the trail length.
CSA Soil Loss An estimate of soil loss at each sample point from erosion, soil displacement,
or compaction, assessed through vertical measurements at a fixed interval
across the trail width from the pre-use or post-construction land surface to the
current tread surface. Mean CSA is calculated as the average of CSA values
measured at the sample points for each trail segment.
CSA Volume The mean CSA for a trail times trail length – an estimate of the total volume of
soil lost from a trail.
Mean Trail Depth Calculated by dividing mean CSA by mean trail width.
V2V1 V16
Pre-use land surface
Stake
Current tread boundaries
V2V1
Pre-use land surface
Stake
Current tread boundaries
I
Page 35
Methods
Page 33
Data were assembled in the attribute table of the transect data shapefile in ArcMap 9.3, and then
exported to Microsoft Excel 2003 and SPSS 16.0 for analyses. The quotient of trail grade and
landform grade was calculated as slope ratio. Trail design guidance recommends a slope ratio of
less than 0.5 to facilitate water removal from trail treads (IMBA 2004). Use of trade, product, or
firm names does not imply endorsement by the U.S. Government.
Informal Trails
Informal trails were mapped as lineal features using Trimble GeoXT and GeoXH GPS’s with
external Hurricane and Zephyr antenna; full procedures are provided in Appendix 2 and
summarized here. All GPS data were post-processed using Trimble’s Pathfinder Office 4.0 and
base station data from nearby Continuously Operating Reference Stations (CORS). The GeoXH
employs carrier-phase processing that uses base data from multiple CORS locations; the GeoXT
data were often incomplete, requiring use of several nearby CORS stations. Informal trail
conditions were assessed during field collection using a condition class (CC) system, as
previously implemented in rapid assessment surveys of formal trails (Marion et al. 2006).
Condition class ranged from 1-5 with an increase in value associated with greater departures
from natural conditions, with regard to the condition or change in relative cover of vegetation,
organic material, and mineral soil (Table 5). A new informal trail segment was designated and
assessed when a change in condition class was noted in the field. Changes in condition class that
were highly localized (< 10m) were not mapped. Point data were collected at formal and
informal trail junctions and at endpoints to aid in the GIS editing process.
Post-processed GPS data were converted to ESRI ArcMAP 9.3 shapefiles for editing and
analysis. Aerial imagery of the park was utilized during editing to improve editing accuracy and
provide spatial context. Due to the nature of GPS data, the shapefiles required positional editing
to create an accurate representation of the trail networks. The majority of this work involved
snapping informal trail segment endpoints to the formal trail network and to other informal trail
end points at junction points. Junction point data greatly improved the accuracy and efficiency of
editing processes by providing anchor points for snapping trail segment endpoints.
Table 5. Condition Class rating descriptions applied to informal trails.
Class 1: Trail distinguishable; slight loss of vegetation cover and /or minimal disturbance of organic
litter.
Class 2: Trail obvious; vegetation cover lost and/or organic litter pulverized in primary use areas.
Class 3: Vegetation cover lost and/or organic litter pulverized within the center of the tread, some bare
soil exposed.
Class 4: Nearly complete or total loss of vegetation cover and organic litter within the tread, bare soil
widespread.
Class 5: Soil erosion obvious, as indicated by exposed roots and rocks and/or gullying.
Page 36
Methods
Page 34
Landscape fragmentation
To analyze landscape fragmentation by formal and informal trails we implemented methods
similar to Leung and Louie’s (2008) Yosemite National Park protocol. The park boundary
polygon was used as a base layer, from which we removed the developed park infrastructure,
including paved roads, parking lots, and buildings to create a ―no roads‖ shapefile representing
natural park land. This left us with a representation of the park’s ―natural areas‖ as a polygon.
For fragmentation analyses we fractured this polygon with trails (including woods roads), and
used the resultant polygons to calculate our fragmentation metrics. Removal of these features
was accomplished by intersecting the features in ArcMAP 9.3 and manually selecting and
deleting polygons that correspond to the infrastructure.
Next we created one-half trail width (TW) buffers on the formal and informal trail segments. The
resultant buffers represent the areal impact associated with the trails within GFP. We used one-
half trail width buffers because this results in the trail center-line being buffered to create a
polygon representing the foot-print of the trail; one half of the trail width is projected to the right
of the line, and one half projected to the left of the line. This results in a polygon that
approximates the trail tread as measured in the field. The buffered trail segments were
intersected with and removed from the ―no roads‖ shapefile to create shapefiles representing the
park’s fragmentation by only formal trails and both formal and informal trails, respectively.
These shapefiles were used to calculate the following landscape fragmentation metrics: Number
of patches (N), Mean Patch Size (MPS), Largest Patch Index (LPI), Mean Perimeter: Area Ratio
(MPAR). The NPS management zone layer was used to summarize and compare these
fragmentation metrics across park sub-regions.
Page 37
Page 35
RESULTS
George Washington Memorial Parkway, Great Falls Park
Formal Trails
The formal trail survey assessed conditions at 179 sample points selected to be representative of
the 12.31-mile formal trail system within Great Falls Park (GFP). While trail condition
assessment surveys are focused on achieving long-term monitoring objectives, they also provide
an opportunity to collect useful data characterizing the current physical attributes of the trail
system. Such data can also be used to evaluate the sustainability of the trails. Three such
inventory indicators assessed in this survey are trail grade, trail slope alignment angle, and slope
ratio. It is common knowledge among trail managers and reported in numerous studies that soil
loss on trails is strongly influenced by trail grade. The speed of surface water runoff intercepted
and carried downhill along trail treads increases exponentially with increasing trail grade
(Dissmeyer & Foster 1984). In contrast, trails located in flatter terrain exacerbate the two other
core trail impact problems, tread muddiness and excessive widening.
Trail Design Indicators
The distribution of trail grade values for GFP trails illustrates their susceptibility for all three
core trail impact problems. Data reveal that trail grades rarely exceed 15% (Table 6). Trail
manuals generally recommend keeping trail grades below 10% (Hooper 1988) or 12%
(Hesselbarth & Vachowski, 2000) to limit soil erosion, with rockwork often needed to harden
and reduce erosion on treads greater than 15%. However, the mean grade of GFP trails is 3.30%
and less than 1% of the GFP system has trail grades exceeding 30%. Of greater concern are data
revealing that approximately 60% of the trail system is located in flatter terrain (0-2% grade)
where treads can be susceptible to widening and muddiness problems (Table 6). Formal trails
within GFP are generally in good condition due to sustainable designs, and intensive
maintenance (including graveling). The most common trail problems encountered during the
survey was muddiness (24 occurrences totaling 948 linear feet) and secondary treads (22
occurrences totaling 3314 linear feet). Muddiness and secondary treads often occur at the same
location, and are typical along flat natural surface trails that see high use and/or use during wet
tread conditions. Muddiness results from water being held on the flat trail tread that is often
difficult to drain due to a lack of grade; secondary treads develop as visitors seek and create
alternate routes around muddy sections of trail. A section later in this report evaluates the
informal (visitor created) trails that have developed in GFP.
A trail’s slope alignment angle, as described in the methods section, is the angle between the
prevailing landform slope and the trail’s alignment extending downhill from the sample point. In
contrast to trail grade, the influence and importance of this indicator is not widely known or
investigated, though recent studies suggest it may be as influential as trail grade (Aust et al.
2005, Marion & Olive 2006). Incredibly, a large portion (41%) of GFP trails are aligned within
22o of the landform aspect or fall line (Table 6), the path naturally taken by water running down
a mountain slope. Fall-aligned trails are particularly susceptible to soil erosion and tread
widening. Figure 8 depicts a fall-line trail with substantial erosion, in comparison to the side-hill
Page 38
Results
Page 36
trail in Figure 9 that has a slope alignment in the 69-90o range. While 78% of these fall line
alignments are located on grades of less than 7%, 22% are located on grades steep enough to
pose erosive problems (greater than 7%) (Table 6).
Table 6. Cross tabulation of trail grade and trail slope alignment inventory indicators, GFP.
Trail Grade Trail Slope Alignment Angle
0-22° 23-45° 46-68° 69-90° Totals
0-2% 411 8 13 45 107, 60%
3-6% 16 6 10 13 45, 25%
7-10% 8 1 2 2 13, 7%
11-15% 6 3 0 2 11, 6%
16-20% 0 0 0 0 0, 0%
21-30% 1 0 0 0 1, <1%
31-100% 1 0 0 0 1, <1%
Missing 1 0 0 0 1, <1%
Totals: 73 18 25 62 178
41% 10% 14% 35% 100%
Trail Grade: Mean = 3.3% Median= 2.0% Range= 0-36%
Trail Slope Alignment: Mean = 40.07° Median= 41.00° Range= 0-89°
1 – Number of sample points. Divide by 178 to determine percentage of GFP trail system.
Once a fall-aligned trail becomes incised, water trapped on the tread is exceptionally difficult to
direct off and can build in volume, substantially increasing its erosivity (Figure 8). As previously
noted, erosivity also increases exponentially with trail grade, though natural rockiness intensive
routine maintenance can limit erosion. In flatter terrain, such trail alignments are susceptible to
muddiness and widening. Rerouting fall-aligned sections is generally preferred, though
alternative routes may not be possible due to cliff-lines or land ownership. Park management
may also feel compelled to retain such alignments on the basis of their historic values, including
the protection of historic stonework associated with Matildaville and the Patowmack Canal.
Slope Ratio is an ancillary way to asses trail sustainability; IMBA (2004) suggests that keeping
the ratio of trail grade to landform below 0.50 is recommended to ensure trail sustainability. This
variable is similar to TSA in that it assesses how a trail is laid out relative to the prevailing
landform slope; instead of using the difference of two compass bearings (azimuths), it uses the
grade of the trail and the grade of the dominant landform. Over half of the trails within GFP have
slope ratios that exceed 0.50 (Table 7). Similarly to fall-aligned trails, trails with excessive
relative grade are prone to erosion problems as a result of the interception and channelization of
surface water during periods of heavy runoff (spring melt and rain events).
Page 39
Results
Page 37
Figure 8. Notice the greater soil loss associated with this fall-line trail alignment compared to the
more minimal soil loss for the side-hill aligned trail in Figure 9.
Figure 9. A sidehill aligned trail sheds water rather than concentrating it and is less prone to
erosion.
Page 40
Results
Page 38
Trail Condition Indicators
Trail width ranged from 20 to 223 inches with a mean of 91.78 (Table 7). Over three-quarters of
the trails exceed four feet in width. The total area of intensive trampling disturbance associated
with the GFP trail system is estimated to be 11.4 acres, based on calculations extrapolating mean
trail width to the 12.31-mile GFP trail system. This amounts to approximately 1.43% of the park
acreage of GFP.
Assessed soil loss on trails is attributable to several causal factors, including erosion from water
or wind, compaction from traffic, and soil displacement to the trail sides or downslope.
Recognizing these differing causes, we refer to all as ―soil loss‖ henceforth. At the locations
where it was possible to apply this procedure (N=178), maximum incision ranged from 0 to 7.5
inches with a mean of 1.69 (Table 7).
Cross-sectional area soil loss measurements, while more time-consuming, provide a more
accurate estimate of soil loss. CSA ranged from 0 to 573 in2, with a mean of 89.46 in
2 (Table 7).
A calculation extrapolating this measure by the trail system length yields an estimated aggregate
soil loss of 40,379 ft3 (1495 yd
3 or 150 ten cubic yard dump trucks). On a per-mile basis, soil
loss is approximately 3,280 ft3/mile (121.4 yd
3/mile).
Page 41
Results
Page 39
Table 7. Number and percent of sample points by impact indicator category, GFP.
Indicator Sample
Points Percent
1
Trail Width (in)
0-24 2 1.1
25-36 20 11.2
37-48 19 10.6
49-60 14 7.8
60+ 122 68.2
Missing 2 1.1
Mean = 91.78 Median = 92.50 Range = 20-223
Maximum Incision (in)
0 14 7.8
0.1-0.5 19 10.6
0.51-1.0 40 22.3
1.01-3.0 81 45.3
3.01-5.0 18 10.1
5.01+ 6 3.4
Missing 1 0.6
Mean = 1.69 Median = 1.25 Range = 0-7.5
Cross Sectional Area Soil Loss (in2)
0 15 8.4
1-100 110 61.5
101-200 36 20.1
201-400 12 6.7
401+ 5 2.8
Missing 1 0.6
Mean = 89.46 Median = 53.10 Range = 0-573
Slope Ratio
0-0.09 18 10.1
0.1-0.35 35 19.6
0.36-0.50 21 11.7
0.51-0.75 16 8.9
0.76+ 86 48
Missing 3 1.7
Mean = 0.65 Median = 0.75 Range = 0-1.0
1 – Percent of all sample points (including missing),
i.e., percent of the GFP trail system.
Page 42
Results
Page 40
Finally, field staff assessments of the tread substrate as a proportion of transect width are used to
characterize the typical trail system substrates. The predominant tread substrate is gravel
(55.0%), followed by soil (28.7%) and organic litter (8.17%) (Figure 10). The ―other‖ category
(0.9%) includes asphalt, concrete and other non-natural surfaces. The wood category (1.1%)
represents constructed boardwalks and bridges. Naturally occurring rock surface contributes
3.5%, followed by roots (1.1%) and vegetation (1.1%). Field staff assessed mud (0.5%) and
standing water (0.0%), however due to the time of year these were rarely encountered.
Figure 10. Mean trail substrate cover as a proportion of transect (tread) width, GFP.
Data have also been summarized by trail name (Table 8); this format may be of more use to park
managers who are familiar with trails and would like to see how the average design and impact
indicators associated with a particular trail relate to their perception of the trail(s). The ―worst‖
values for each indicator are in bold, while the ―best‖ are underlined. Old Carriage Road is the
widest trail (mean of 154in) and represents 11.8% of the linear extent of the trail system within
GFP. Ridge Trail has the highest mean CSA at 195in2, note that it also has poor values for mean
TSA (33°) and a high mean slope ratio (0.7). Sandy landing has the worst values for mean TSA
(0°) and Slope Ratio (1.0); however it is a relatively short trail with only 3 sample points which
represent 1.7% of GFP’s trail system. Swamp-Ridge Connector Trail has the highest mean
maximum incision (3.4in) and has a poor value for mean Slope Ratio (0.6).
0.0 10.0 20.0 30.0 40.0 50.0 60.0 70.0 80.0 90.0 100.0
1
GFP Trail Substrate Means
Soil
Litter
Veg
Rock
Roots
Mud
Water
Gravel
Wood
Other
Page 43
Results
Page 41
Table 8. Trail impact and design indicators summarized by trail name, GFP1.
Trail Name2
Trail Width (in) CSA (in2)
Max. Incision (in)
Trail Slope Alignment (
o)
Slope Ratio
Mean Count Trail System
(%) Mean Mean Mean Mean
Matildaville Trail (North)
81 10 5.6% 46 1.2 67 0.4
Matildaville Trail (South)
49 7 3.9% 36 1.5 60 0.8
Mine Run 38 7 3.9% 33 1.6 45 0.6
North River Trail 111 5 2.8% 25 0.4 33 0.8
Old Carriage Road 154 21 11.8% 110 1.7 53 0.5
Patowmack Canal Trail
132 11 6.2% 88 1.1 22 0.8
Patowmack Canal Trail (North)
97 12 6.7% 73 1.3 54 0.6
Potomac Canal Connectors
116 13 7.3% 106 1.5 25 0.7
Ridge Trail 111 27 15.2% 195 2.5 33 0.7
Ridge Trail Extension 55 3 1.7% 89 2.9 47 0.8
River Trail (North) 61 12 6.7% 54 1.1 36 0.7
River Trail (South) 47 14 7.9% 62 2.0 41 0.6
River Trail Detour 59 3 1.7% 34 0.9 60 0.2
Riverbend Connector 129 6 3.4% 39 0.8 26 1.0
Riverbend Road Trail 39 8 4.5% 40 1.8 37 0.6
Sandy Landing 122 3 1.7% 189 2.2 0 1.0
Swamp Trail 40 10 5.6% 32 1.8 41 0.5
Swamp-Ridge Connector Trail
65 6 3.4% 123 3.4 37 0.6
1 – The ―worst‖ values for each indicator are in bold, the ―best‖ values are underlined.
2 – See trail map, Figure 4.
Page 44
Results
Page 42
C&O Canal National Historical Park
Formal Trails
The formal trail survey assessed conditions at 184 sample points selected to be representative of
the 14.67-mile formal trail system within CHOH. While trail condition assessment surveys are
focused on achieving long-term monitoring objectives, they also provide an opportunity to
collect useful data characterizing the current physical attributes of the trail system. Such data
can also be used to evaluate the sustainability of the trails. Three such inventory indicators
assessed in this survey are trail grade, trail slope alignment angle and slope ratio. It is common
knowledge among trail managers and reported in numerous studies that soil loss on trails is
strongly influenced by trail grade. The speed of surface water runoff intercepted and carried
downhill along trail treads increases exponentially with increasing trail grade (Dissmeyer &
Foster 1984). In contrast, trails located in flatter terrain exacerbate the two other core trail impact
problems, tread muddiness and excessive widening.
Trail Design Indicators
The distribution of trail grade values for CHOH trails illustrates their susceptibility for all three
core trail impact problems. Data reveal that trail grades seldom (10%) exceed 15% (Table 9).
Trail manuals generally recommend keeping trail grades below 10% (Hooper 1988) or 12%
(Hesselbarth & Vachowski, 2000) to limit soil erosion, with rockwork often needed to harden
and reduce erosion on treads greater than 15%. However, the mean grade of CHOH trails is
6.51% and with 3% of the CHOH system has trail grades exceeding 30%. Data also reveal that
approximately 37% of the trail system has very low grades (0-2% grade); alignments that are
susceptible to widening and muddiness problems when located in flatter terrain (Table 9).
Formal trails within CHOH are generally in good condition due to sustainable designs, and
intensive maintenance (including gravelling). The most common trail problems encountered
during the survey were informal trails, secondary treads and excessive width. A section later in
this report evaluates the informal (visitor created) trails that have developed in CHOH.
A trail’s slope alignment angle, as described in the methods section, is the angle between the
prevailing landform slope and the trail’s alignment extending downhill from the sample point. In
contrast to trail grade, the influence and importance of this indicator is not widely known or
investigated, though recent studies suggest it may be as influential as trail grade (Aust et al.
2005, Marion & Olive 2006). A significant portion (23%) of CHOH trails are aligned within 22o
of the landform aspect or fall line (Table 9), the path naturally taken by water running down a
mountain slope. Figure 8 depicts a fall-line trail with substantial erosion, in comparison to the
side-hill trail in Figure 9 that has a slope alignment in the 69-90o range. While 52% of these fall
line alignments are located on grades of less than 7%, 48% are located on grades steep enough to
pose erosive problems (greater than 7%) (Table 9).
Once a fall-aligned trail becomes incised, water trapped on the tread is exceptionally difficult to
direct off and can build in volume, substantially increasing its erosivity (Figure 8). As previously
noted, erosivity also increases exponentially with trail grade, though natural rockiness intensive
routine maintenance can limit erosion. In flatter terrain, such trail alignments are susceptible to
muddiness and widening. Rerouting fall-aligned sections is generally preferred, though
Page 45
Results
Page 43
alternative routes may not be possible due to cliff-lines or land ownership. In addition, park
management may feel compelled to retain most of these alignments on the basis of their historic
values, including the protection of historic stonework associated with ruins in the Gold Mine
Tract and along the C&O Canal.
Table 9. Cross tabulation of trail grade and trail slope alignment inventory indicators, CHOH.
Trail Grade Trail Slope Alignment Angle
0-22° 23-45° 46-68° 69-90° Totals
0-2% 11 5 17 35 68, 37%
3-6% 14 5 19 22 60, 33%
7-10% 3 10 7 3 23, 13%
11-15% 4 3 6 1 14, 8%
16-20% 3 2 2 1 8, 4%
21-30% 3 0 0 2 5, 3%
31-100% 4 0 2 0 6, 3%
Totals 42 25 53 64 184
23% 14% 29% 34% 100%
Trail Grade: Mean = 6.51% Median= 4.00% Range= 0-58%
Trail Slope Alignment: Mean = 48.71° Median= 59.00° Range= 0-90°
1 – Number of sample points. 2- Percentage of CHOH trail system determined using weighted
averages to adjust for differing sample interval.
Slope Ratio is an ancillary way to asses trail sustainability; IMBA (2004) suggests that keeping
the ratio of trail grade to landform below 0.50 is recommended to ensure trail sustainability. This
variable is similar to TSA in that it assesses how a trail is laid out relative to the prevailing
landform slope; instead of using the difference of two compass bearings (azimuths), it uses the
grade of the trail and the grade of the dominant landform. A large portion (40.7%) of the trails
within CHOH has slope ratios that exceed 0.50 (Table 10). Similarly to fall-aligned trails, trails
with excessive relative grade are prone to erosion problems as a result of the interception and
channelization of surface water during periods of heavy runoff (spring melt and rain events).
Trail Condition Indicators
Trail width ranged from 10 to 192 inches with a mean of 47.29 (Table 10). Over one-third (37%)
of the trails exceed four feet in width. The total area of intensive trampling disturbance
associated with the CHOH trail system is estimated to be 7.0 acres, based on calculations
extrapolating mean trail width to the 14.67-mile CHOH trail system. This amounts to slightly
less than 0.005% of total CHOH acreage.
Assessed soil loss on trails is attributable to several causal factors, including erosion from water
or wind, compaction from traffic, and soil displacement to the trail sides or downslope.
Page 46
Results
Page 44
Recognizing these differing causes, we refer to all as ―soil loss‖ henceforth. At the locations
where it was possible to apply this procedure (N=183), maximum incision ranged from 0 to 7.0
inches with a mean of 1.61 (Table 10).
Table 10. Number and percent of sample points by impact indicator category, CHOH.
Indicator Sample Points1
Percent2
Trail Width (in)
0-24 13 7.1
25-36 55 29.9
37-48 48 26.1
49-60 32 17.4
60+ 36 19.6
Missing 0 0
Mean = 47.29 Median = 42.00 Range = 10-192
Maximum Incision (in)
0 25 13.6
0.1-0.5 15 8.2
0.51-1.0 32 17.4
1.01-3.0 97 52.7
3.01-5.0 11 6
5.01+ 3 1.6
Missing 1 0.5
Mean = 1.61 Median = 1.50 Range = 0-7.0
Cross Sectional Area Soil Loss (in2)
0 25 13.6
1-100 134 72.8
101-200 22 12
201-400 2 1.1
401+ 0 0
Missing 1 0.5
Mean = 49.02 Median = 37.35 Range = 0-339
Slope Ratio
0-0.09 32 17.4
0.1-0.35 50 27.2
0.36-0.50 27 14.7
0.51-0.75 24 13
0.76+ 51 27.7
Missing 0 0
Mean = 0.49 Median = 0.42 Range = 0-1.0
1 – Number of sample points. 2- Percentage of CHOH trail system determined using weighted averages to adjust
for differing sample interval.
Page 47
Results
Page 45
Cross-sectional area soil loss measurements, while more time-consuming, provide a more
accurate estimate of soil loss. CSA ranged from 0 to 339 in2, with a mean of 49.02 in
2 (Table
10). A calculation extrapolating this measure by the trail system length yields an estimated
aggregate soil loss of 26,368 ft3 (977 yd
3 or 98 ten cubic yard dump trucks). On a per-mile basis,
soil loss is approximately 1,797 ft3/mile (66.6 yd
3/mile).
Finally, field staff assessments of the tread substrate as a proportion of transect width are used to
characterize the typical trail system substrates depicted in Figure 11. The predominant tread
substrate is bare soil (44.5%), followed by organic litter (36.1%) and rock (14.2%). The man
made category (1.33%) includes asphalt, concrete and other non-natural surfaces such as wooden
boardwalks and bridges. Roots (2.2%) and vegetation (2.2%) account for very little of the tread
substrate by width.
Figure 11. Mean trail substrate cover as a proportion of transect (tread) width, CHOH.
Data have also been summarized by trail name (Table 11); this format may be of more use to
park managers who are familiar with trails and would like to see how the average design and
impact indicators associated with a particular trail relate to their perception of the trail(s). The
―worst‖ values for each indicator are in bold, while the ―best‖ are underlined. Billy Goat A is the
widest trail (mean of 73in) and represents 17.9% of the linear extent of the trail system within
CHOH. Billy Goat A Emergency Access has the highest mean CSA at 74.5in2, note that it also
has poor values for mean TSA (28°) and a high mean slope ratio (0.67). Falls Spur Road has the
worst values for mean TSA (0°) and Slope Ratio (1.0); however it is a relatively short trail with
only 1 sample point which represent 0.5% of CHOH’s trail system. Overlook Trail has the
highest mean maximum incision (2.3 in) yet has acceptable values for slope ratio (0.386) and
TSA (52°).
0.0 20.0 40.0 60.0 80.0 100.0
1.00
CHOH Trail Substrate Means
Soil
Litter
Vegetation
Rock
Roots
Other
Page 48
Results
Page 46
Table 11. Trail impact and design indicators summarized by trail name, CHOH1.
Trail Name2
Trail Width (in) CSA
(in2)
Max.
Incision
(in)
Trail
Slope
Alignment
(o)
Slope
Ratio
Mean Count Trail
System % Mean Mean Mean Mean
Anglers Inn Spur 51 5 2.7% 48.24 1.50 41 0.572
Berma Road 72 1 0.5% 40.50 1.00 85 0.000
BGA Emergency
Access Trail 61 3 1.6% 74.55 1.67 28 0.670
Billy Goat A 73 33 17.9% 71.59 2.02 41 0.539
Billy Goat B 37 25 13.6% 50.42 1.94 56 0.488
Billy Goat C 44 28 15.2% 52.81 1.74 51 0.476
Falls Road Spur 72 1 0.5% 0.00 0.00 0 1.000
Ford Mine Trail 38 15 8.2% 22.75 0.88 63 0.345
Ford Mine Trail
Spur 68 2 1.1% 0.00 0.00 84 0.200
Gold Mine Loop 53 25 13.6% 60.55 1.61 43 0.539
Lock 16 Spur 34 4 2.2% 29.93 1.31 45 0.460
Lock 19 Loop 26 3 1.6% 25.65 1.25 44 0.350
Overlook Trail 36 5 2.7% 40.77 2.30 52 0.386
River Trail 36 17 9.2% 17.90 0.84 68 0.324
Rockwood Spur 24 3 1.6% 8.40 0.50 60 0.277
Valley Trail 38 7 3.8% 57.47 2.04 36 0.740
Woodland Trail 40 7 3.8% 62.29 2.29 43 0.583
1 – The ―worst‖ values for each indicator are in bold, the ―best‖ values are underlined.
2 – See trail map, Figure 5.
Page 49
Results
Page 47
George Washington Memorial Parkway, Great Falls Park
Informal Trails
A GPS census inventory of the informal trails within GFP produced spatial datasets that can be
summarized in a variety of ways; we have selected three types of summaries that lend
themselves to understanding the informal trails within GFP: A quantitative summary of the
extent of informal trails, a description of the spatial distribution of informal trails, and a
summary of park fragmentation by informal trails. In each of these three summaries we make
comparisons to the formal trails within the GFP, in an effort to provide context and an
understanding of the relative level of impacts associated with informal trails.
Quantitative Summary of Informal Trails: GFP
Field staff surveyed 8.37 miles of informal trail within GFP, which is equal to over two-thirds
(68%) of the formal trails within the park by length (Table 12). Informal trails within GFP tend
to be much narrower than their formal trail counterparts; when we examine the areal extent of
informal trails we find that they represent less than one-quarter (23%) of the areal extent of the
formal trail system. Further examination of the extent of informal trails by condition class show
that most (95% by areal extent 91% by lineal extent) of the informal trail system is CC3 or
higher indicating a loss of vegetation and organic litter from the trail (Table 13). Of greater
concern is the fact that much of these informal trails fall into CC4 and CC5 (60% by areal extent
and 49% by lineal extent), condition classes that indicate erosion has or is actively occurring
within the tread.
Table 12 also reveals the distribution of informal trails by park management zones (Figure 12).
These zones are defined and described in the 2007 General Management Plan (GMP). This
permits comparison of the management objectives for each zone to the quantity and distribution
of informal trails within each zone to evaluate where conditions may be in congruence or
contrary to desired conditions.
The Mather Gorge Zone contains the largest proportion of informal trails (41% by length, 44%
by area) out of the four management zones outlined in the 2007 GMP (Table 14). The Canal
Zone ranks second with 35% of the informal trails by length (32% by area). Within each of the
management zones we can look at the distribution of informal trails by condition class; these
data show that the majority of the informal trails are CC3 or higher, indicating severe reduction
of vegetation and organic litter cover from the tread (Table 14).
Page 50
Results
Page 48
Table 12. Formal and informal trail extents within GFP.
Impact
Indicators
GFP Park Zones
Developed Canal Mather
Gorge
Cultural/
Natural Overall
29.86 acres 74.48 acres 40.04 acres 581.53 acres 725.91 acres
High Recreation
Infrastructure Low N/A
Aggregate Length (ft)
Formal Trails 4,951 12,503 6,050 33,753 65,092
Informal Trails 1,453 14,888 18,150 19,072 53,563
Disturbance Area (ft2)
Formal Trails 41,764 117,994 36,048 268,775 497,820
Informal Trails 2,809 42,647 46,662 60,784 152,901
Lineal Extent (ft/acre)
Formal Trail Length 166 168 151 58 90
Informal Trail Length 49 200 453 33 74
Disturbance Density
(ft2/acre)
Formal Trails 1,399 1,584 900 462 686
Informal Trails 94 573 1,165 105 211
Table 13. Formal and informal trails of GFP summarized by Condition Class.
Trail Type Linear Extent (mi) Areal Extent (yd
2)
Formal 12.31 55,313
Informal (all) 8.37 12,765
CC1 0.05 25
CC2 0.69 526
CC3 3.65 4,601
CC4 2.16 3,693
CC5 1.82 3,920
Page 51
Results
Page 49
Figure 12. Management zones of GFP.
Page 52
Results
Page 50
Table 14. Summary of informal trails by management zone and Condition Class, GFP.
Zone Condition
Class
Lineal
Extent (ft)
Areal
Extent (ft2)
% by Length* % by Area*
Developed CC1 0 0 0% 0%
CC2 52 75 4% 2%
CC3 935 2002 71% 68%
CC4 331 883 25% 30%
CC5 0 0 0% 0%
IT Total 1316 2960 3%** 3%**
Canal CC1 105 97 1% 0%
CC2 2,159 2,540 14% 7%
CC3 7,300 15,425 48% 42%
CC4 3,556 10,064 23% 28%
CC5 2,198 8,288 14% 23%
IT Total 15,322 36,425 35%** 32%**
Mather Gorge CC1 151 108 1% 0%
CC2 1,114 1,442 6% 3%
CC3 6,467 14,876 36% 29%
CC4 5,322 15,812 30% 31%
CC5 4,902 18,718 27% 37%
IT Total 17,955 50,956 41%** 44%**
Cultural/Natural CC1 13 11 0% 0%
CC2 308 678 3% 3%
CC3 4,590 9,106 48% 37%
CC4 2,182 6,469 23% 26%
CC5 2,510 8,267 26% 34%
IT Total 9,603 24542 22%** 21%**
Overall CC1 269 226 1% 0%
CC2 3,632 4,736 8% 4%
CC3 19,291 41,409 44% 36%
CC4 11391 33,239 26% 29%
CC5 9,610 35,284 22% 31%
Overall Total 44,196 114,883 100%** 100%**
* % IT Total for Zone ** % of Overall Total
Spatial Distribution of Informal Trails: GFP
The majority of informal trails within GFP are concentrated along the Potomac River and the
area atop the adjacent cliffs. A secondary area where networks of informal trails occur is along
Difficult Run at the south end of GFP’s property. Additional informal trails have formed along
the formal trail network within inland areas of the park; these trails tend to parallel formal trails,
shortcut junctions and access the park from adjoining properties (Figure 13).
Page 53
Results
Page 51
The pattern of the informal trails adjacent to the Potomac River and Mather Gorge, are consistent
with visitors exploring and accessing the overlooks and cliffs. The trails tend to leave the formal
trail and head towards the river especially in the area near Great Falls proper. These trails seem
to be formed and used by a wide variety of trail users including anglers, climbers, day hikers,
swimmers, families and river users (commercial rafting groups and private rafters, canoeists and
kayakers) The majority of these trails have formed because the formal trail network does not
provide the access and/or experience that visitors are seeking; this may be a problem related to
location of the formal trails as well as the carrying capacity of the trails. Along the River Trail
the informal trail network is indicative of shortcutting, exploration and access.
The informal trailing along Difficult Run is primarily access and exploration based; these routes
appear to be used by anglers, kayakers and more dispersed uses such as exploration and nature
study. Trail erosion can be quite a problem along these trails as they descend steep slopes in
some areas to access Difficult Run. Runoff from these trails raises concern over secondary
impacts to water quality from sedimentation.
Informal trails within the inland portion of the park have developed along the formal trail
network for a variety of reasons: parallel trails tend to form when visitors seek to avoid an
undesirable trail condition (e.g. muddiness, crowding), whereas spur trails tend to develop as
shortcuts or to provide access. Several trails around the western perimeter of the park appear to
exist to provide access to the park from adjacent communities and roads. Three distinct
access/shortcut routes cut through the park from Georgetown Pike (Rte. 193) and Difficult Run
Trail (gated road) in the southwest reaches of the park. One informal route leaves the gravel
parking lot on Georgetown pike and ascends the hollow to access the formal trail on the ridge. A
second informal route leaves Difficult Run Trail and ascends steeply around (both sides) of a
quarry and ultimately accesses formal trails atop the ridge. Safety around the quarry area is a
concern as informal trails brings visitors very close to the edge of the quarry walls, where a slip
and fall could prove deadly. The third informal route is a shortcut from the Ridge Trail to
Difficult Run Trail that cuts off about three-quarter of a mile when compared to walking around
the formal trail. All three of these routes have poor alignments and steep grades. Should use level
increase on these trails we expect that erosion and gullying of the trails will occur. We note that
the informal route from the gravel lot on Georgetown Pike to the Ridge Trail appears to receive
the most use, and also has a shallower grade; this informal route also appears to provide access to
many visitors to the park because they seek to avoid the muddy and eroded trail that leads from
the gravel parking lot to Difficult Run Trail, and hiking along Route 193 appears to be unsafe.
With some effort from park managers this informal route could be rerouted and improved to
provide access without incurring additional impacts to the natural resources.
The greatest concerns with regards to informal trails are their duplicative nature (Figure 14) and
their proximity to sensitive communities of rare vegetation. Informal trails are hiked in by users
seeking to fulfill their own individual goals; these goals do not include protection of sensitive
vegetation, or creating a route that can sustain high levels of use. Figure 13 clearly illustrates the
issue of duplicative routes associated with informal trails; multiple spurs (12+ in less than one-
tenth of a mile) to the rocky outcrop leave the formal trail and grass area of the park.
While we were unable to source spatial data showing the locations of sensitive and/or rare plant
communities within the park, we suggest that park management should examine the proximity of
the informal trails (shapefiles provided to NPS with this report) to these features. Informal trails
Page 54
Results
Page 52
with a condition class of 3 or higher represent trails that have removed the majority of the natural
vegetation from within their tread boundary.
Figure 13. Location of informal trails within GFP.
Page 55
Results
Page 53
Figure 14. Duplicative routing of informal trails within GFP.
Fragmentation by Informal Trails: GFP
As described in the methods we analyzed GFP land fragmentation using protocols developed by
Leung and Louie (2008). The output of these analyses are shown in Figure 15, and summarized
quantitatively by zone in Table 15. Fragmentation summaries by management zone, GFP.
Fragmentation statistics are typically used to describe landscape-scale impacts to a habitat of
concern; we have generated fragmentation statistics for GFP in two iterations: one using just the
formal trail network, and a second using all trails (formal and informal). Comparing the
Page 56
Results
Page 54
landscape fragmentation indices generated by these two iterations allows us to quantify the park-
wide impacts associated with informal trails.
We see that the Mather Gorge Zone has the largest increase in the number of parcels (+1900%)
and the biggest decrease in Mean Patch Size (MPS) (-95%) (Table 15). This parcel also sees the
largest changes in both Largest Patch Index (LPI) (-26%) and Mean Perimeter: Area Ratio
(MPAR) (+1211%). At 40.04 acres, this zone represents just 5.5% of the GFP’s park area, but
contains over 40% of the informal trails within the park.
Figure 15. Fragmentation parcels within GFP.
Page 57
Results
Page 55
Table 15. Fragmentation summaries by management zone, GFP.
Fragmentation
Indices
Park Zones
Developed Canal Mather G. Cultural/Natural Overall
29.86 acres 74.48 acres 40.04 acres 581.53 acres 725.91 acres
High Recreation Infrastructure Low N/A
Number of Patches (N)
Formal Trails 15 25 8 22 70
All Trails
(% change) 30 (+100%) 157 (+528%) 160 (+1900%) 96 (+336%) 443 (+533%)
Mean Patch Size (MPS) (ft2)
Formal Trails 56,123 119,426 209,121 1,128,112 433,129
All Trails
(% change) 27,771 (-51%) 18,471 (-85%) 9,914 (-95%) 256,170 (-77%) 67,522 (-84%)
Largest Patch Index (LPI)
Formal Trails 0.35 0.35 0.27 0.16 0.13
All Trails
(% change) 0.30 (-14%) 0.36 (+3%) 0.20 (-26%) 0.17 (+6%) 0.14 (+8%)
Mean Perimeter: Area Ratio (MPAR) (ft/ft2)
Formal Trails 0.17 0.22 0.09 0.15 0.17
All Trails
(% change) 0.44 (+159%) 1.16 (+427%) 1.18 (+1211%) 0.89 (+493%) 1.06 (+524%)
Cliff-Associated Trails: GFP
A Virginia Tech companion study has been investigating recreation impacts to the Potomac
Gorge cliffs and rocky areas, particularly within GFP. To assist in that effort, this section
examines and summarizes data from cliff-associated informal trails. Surveying informal trails
requires the ability to detect and GPS map the trails based on vegetation and soil disturbance, the
visible signs of which become intermittent or impossible to discern as substrates become rocky.
This is clearly evident in the aerial photograph and mapped informal trails depicted in Figure 14,
revealing that most informal trails terminate when they reach the cliffs and rocky areas that
parallel the Potomac River. Trampling and impacts to plants do occur in these rocky
environments, but informal trail assessment protocols are often unable to assess and characterize
them.
GIS software was used to identify a subset of cliff-associated informal trails. A first step marked
the boundary between the cliff-top wooded and rocky areas. From this boundary, buffers of 50,
75, 100, 150, 200 and 250 ft were investigated and a 100 ft buffer was selected for further
analyses. This region, shown in blue in Figure 16, was modified to remove two developed areas
where park staff maintain mowed grass cover.
Page 58
Results
Page 56
Informal trail lineal and areal extent values are presented by condition class in Table 16. Within
the cliff-associated areas there are 6,841 feet of formal trails, but nearly three times that amount
of informal trails (19,980 ft, Table 16). Furthermore, nearly one-third of the informal trails by
lineal extent were rated in condition classes 3, 4 and 5, well-established trails that have
predominantly lost their vegetation and organic litter cover. Total area of trampling disturbance
associated with the informal trails is 57,201 ft2 (Table 16). In contrast, survey data reveal the
more inland informal trails to be somewhat more extensive (24,216 ft), but with a similar area of
disturbance (57,675 ft2) and better resource conditions (76% rated as condition class 3 or 4)
(Table 16).
The high density of informal trails in the cliff-associated zone substantially increases landscape
fragmentation, from 5 separate patches created by formal trails to 182 patches when informal
trails are added (Table 17). Mean patch size in the cliff-associated zone is reduced from 24,652
ft2 with formal trails to 626 ft
2 when informal trails are added, a 97% reduction. In contrast, the
mean patch size for all inland area trails is 12,367 ft2, reflecting the higher density of informal
trailing in the cliff areas (Table 17).
Table 16. Summary of cliff-associated and inland trails by Condition Class, GFP.
Zone Condition
Class
Lineal
Extent (ft)
Areal
Extent (ft2)
% by Length* % by Area*
Cliff-Associated CC1 131 97 1% 0%
CC2 1,184 1,518 6% 3%
CC3 6,161 12,949 31% 23%
CC4 6,129 18,611 31% 33%
CC5 6,375 24,026 32% 42%
IT Total 19,980 57,201 74%** 62%**
Formal Total 6,841 35,081 26%** 38%**
Overall Total 26,821 92,282 100% 100%
Inland CC1 135 129 1% 0%
CC2 2,448 3,219 10% 6%
CC3 13,130 28,461 54% 49%
CC4 5,262 14,618 22% 25%
CC5 3,238 11,259 13% 20%
IT Total 24,216 57,675 29%** 11%**
Formal Total 58,251 480,840 71%** 89%**
Overall Total 82,467 538,515 100% 100%
* % of IT Total for Zone ** % of Overall Zone Total
Page 59
Results
Page 57
Table 17. Fragmentation summaries for cliff-associated and inland informal trails, GFP.
Fragmentation Indices
Park Zones
Cliff-Associated Inland Overall
(31.92 acres) (688.93 acres) (720.85 acres)
Patches (#)
Formal Trails 5 34 39
All Trails (% change) 182 (3540%) 218 (541%) 400 (926%)
Mean Patch Size (MPS) (ft2)
Formal Trails 24652 79838 72763
All Trails (% change) 626 (-97%) 12367 (-85%) 7025 (-90%)
Largest Patch Index (LPI)
Formal Trails 0.857 0.244 0.230
All Trails (% change) 0.593 (-31%) 0.227 (-7%) 0.217 (-6%)
Mean Perimeter: Area Ratio (MPAR) (ft/ft2)
Formal Trails 0.108 0.033 0.043
All Trails (% change) 0.395 (265%) 0.348 (958%) 0.370 (766%)
Page 60
Results
Page 58
Figure 16. A portion of GFP showing the distribution of informal trails (red) within the inland
and cliff /rocky area zones.
Page 61
Results
Page 59
C&O Canal National Historical Park
Informal Trails
A GPS census inventory of the informal trails within CHOH produced spatial datasets that can
be summarized in a variety of ways; we have selected three types of summaries that lend
themselves to understanding the informal trails within CHOH: A quantitative summary of the
extent of informal trails, a description of the spatial distribution of informal trails, and a
summary of park fragmentation by informal trails. In each of these three summaries we make
comparisons to the formal trails within the CHOH, in an effort to provide context and an
understanding of the relative level of impacts associated with informal trails.
Quantitative Summary of Informal Trails: CHOH
Field staff surveyed 19.29 miles of informal trail within CHOH, which is greater (130%) than the
amount of formal trail (excluding the C&O Canal Towpath) found within CHOH by length
(Tables 18 & 19). Informal trails within CHOH tend to be narrower than their formal trail
counterparts; when we examine the areal extent of informal trails we find that they represent less
than one-half (48%) of the areal extent of the formal trail system. Further examination of the
extent of informal trails by condition class show that most (80% by areal extent 69% by lineal
extent) of the informal trail system is CC3 or higher indicating a loss of vegetation and organic
litter from the trail (Table 19). Of greater concern is the fact that much of the informal trails fall
into CC4 and CC5 (49% by areal extent and 36% by lineal extent), condition classes that indicate
erosion has or is actively occurring within the tread.
Table 18 also provides data on the distribution of informal trails within CHOH by park
management zone (Figure 17). These zones were defined with help from park management. The
park is primarily divided into two non-overlapping zones: Gold Mine Tract/Inland and River
Side zones; the BGA zone is a sub region of the River Side zone. Park management can compare
management objectives for each zone to the quantity and distribution of trails within the zone
and infer where conditions may be in congruence or contrary to desired conditions.
Page 62
Results
Page 60
Table 18. Formal and informal trail extents within CHOH.
Impact Indicators
CHOH Park Zones
BGA1
Gold Mine
Tract/Inland River Side Overall
133 acres 706 acres 386 acres 1,225 acres
Aggregate Length (ft)
Formal Trails 10,791 41,421 33,658 75,079
Informal Trails 52,244 14,606 83,835 98,442
Disturbance Area (ft2)
Formal Trails 64,433 216,086 150,932 367,017
Informal Trails 91,752 17,384 161,631 179,015
Lineal Extent (ft/acre)
Formal Trail Length 81 59 87 61
Informal Trail Length 393 21 217 80
Disturbance Density (ft2/acre)
Formal Trails 484 306 391 300
Informal Trails 690 25 419 146
1- The BGA is a sub-region of the River Side zone.
Table 19. Formal and informal trail extents by Condition Class within CHOH.
Trail Type Linear Extent (mi) Areal Extent (yd2)
Formal 14.78 41,614
Informal (all) 19.29 20,076
CC1 1.55 787
CC2 4.28 3,181
CC3 6.47 6,192
CC4 3.56 4,404
CC5 3.44 5,512
Page 63
Results
Page 61
Figure 17. Management zones, CHOH.
The River Side zone contains the largest proportion of informal trails (85% by length, 90% by
area) out of the three management zones (Table 20, Table 18). The BGA zone ranks second with
54% of the informal trails by length (22% by area), keep in mind that this is a subset of the River
Side zone. Within each of the management zones we can examine the distribution of informal
trails by condition class; these data show that the majority of the informal trails are CC3 or
higher, indicating severe reduction of vegetation and organic litter cover from the tread (Table
20).
Page 64
Results
Page 62
Table 20. Summary of informal trails by management zone and Condition Class, CHOH.
*% of Zone Total **% of Overall Total
Spatial Distribution of Informal Trails: CHOH
The majority of informal trails within CHOH are concentrated along the Potomac River and the
area atop the adjacent cliffs and shoreline. Additional informal trails have formed along the
formal trail network within inland areas of the park; these trails tend to parallel formal trails,
shortcut junctions and access the park from adjoining properties (Figure 18).
The pattern of the informal trails adjacent to the Potomac River, are consistent with visitors
exploring and accessing the overlooks and cliffs. The trails tend to leave the formal trail and
head towards the river especially along the Billy Goat Trails and in the area of Angler’s Inn.
These trails seem to be formed and used by a wide variety of trail users including anglers,
climbers, day hikers, swimmers, families and river users (commercial rafting groups and private
Informal Trail Summary for CHOH
Zone Condition
Class
Lineal
Extent (ft)
Areal
Extent (ft2)
%
by Length*
%
by Area*
BGA CC1 5181 5950 10% 6%
CC2 13567 17106 26% 18%
CC3 15263 24757 29% 27%
CC4 8541 17443 16% 19%
CC5 10180 27503 19% 30%
Total 52733 92763 54%** 52%**
Gold Mine Tract CC1 2425 1830 17% 11%
CC2 2936 3201 20% 18%
CC3 5209 6490 36% 37%
CC4 1886 2623 13% 15%
CC5 2153 3244 15% 19%
Total 14610 17384 15%** 10%**
River Side CC1 5595 6520 7% 4%
CC2 19276 26311 23% 16%
CC3 27255 46985 33% 29%
CC4 16439 36840 20% 23%
CC5 15268 44980 18% 28%
Total 83832 161631 85%** 90%**
Overall CC1 8020 8350 8% 5%
CC2 22212 29512 23% 16%
CC3 32464 53475 33% 30%
CC4 18325 39462 19% 22%
CC5 17421 48224 18% 27%
Overall Total 98442 179025 100%** 100%**
Page 65
Results
Page 63
rafters, canoeists and kayakers). The majority of these trails have formed because the formal trail
network does not provide the access and or experience that visitors are seeking; this may be a
problem related to location of the formal trails as well as the carrying capacity of the trails. The
trails can be fit into two primary categories: shortcut/avoidance routes and access/exploration
routes. Access and exploration routes tend to be spurs off of the formal trails to unique features
within the park. These trails are common where access to the river and overlooks is desired.
Shortcut and avoidance routes are often parallel to existing formal trail often leaving and
returning to the same trail. These routes are used to avoid undesirable trail conditions (mud, sun,
insects, other visitors, rocky or difficult terrain) or to shortcut a route. The trails inland of the
traverse section of Billy Goat A trail are clearly developed by visitors looking to avoid the
traverse. They may be seeking to avoid the difficult terrain posed by the traverse, or the delay
associated with crowds on that section of trail.
Informal trails within the inland portion of the park have occurred along the formal trail network
for a variety of reasons: parallel trails tend to form when visitors seek to avoid an undesirable
trail condition (e.g. muddiness), whereas spur trails tend to develop as shortcuts or to provide
access. The informal trailing along the eastern perimeter of CHOH is primarily created by users
seeking access to the river or the trail system from adjacent properties and trails. Many of these
trails terminate along River Road across from housing developments, or on secondary roads in
the developments. One lengthy informal trail exists in the Gold Mine Tract; it leaves the Gold
Mine Loop Trail and descends through a hollow to the north end of Berma Road Trail. This trail
seems to receive heavy use and is situated in the bottom of a swale for much of its path. The poor
design coupled with concentration of run-off surface water will lead to increasing amounts of
erosion and tread damage.
The greatest concerns with regards to informal trails are their duplicative nature (Figure 18) and
their proximity sensitive communities of rare vegetation. Informal trails are hiked in by users
seeking to fulfill their own individual goals; these goals do not include protection of sensitive
vegetation, or creating a route that can sustain high levels of use. Figure 19 clearly illustrates the
issue of duplicative routes associated with informal trails; multiple spurs (14+ in less than one-
tenth of a mile) to the rocky outcrops leave the formal Billy Goat A Trail.
While we were unable to source spatial data showing the locations of sensitive and/or rare plant
communities within the park, we suggest that park management should examine the proximity of
the informal trails (shapefiles provided to NPS with this report) to these features. Informal trails
with a condition class of 3 or higher represent trails that have removed the majority of the natural
vegetation from within their tread boundary.
Page 66
Results
Page 64
Figure 18. Location of informal trails within CHOH.
Page 67
Results
Page 65
Figure 19. Duplicative routing of informal trails within CHOH.
Page 68
Results
Page 66
Fragmentation by Informal Trails: CHOH
As described in the methods we analyzed CHOH land fragmentation using protocols developed
by Leung and Louie (2008). The output of these analyses are shown in Figure 20, and
summarized quantitatively by zone in Table 21. Fragmentation statistics are typically used to
describe landscape-scale impacts to a habitat of concern; we have generated fragmentation
statistics for CHOH in two iterations: one using just the formal trail network and a second using
all trails (formal and informal). Comparing the landscape fragmentation indices generated by
these two iterations allows us to quantify the park-wide impacts associated with informal trails.
We see that the Billy Goat A Zone has the largest increase in the number of parcels (+2367%)
and the biggest decrease in Mean Patch Size (MPS) (-96%) (Table 21). This parcel also sees the
largest changes in both Largest Patch Index (LPI) (-38%) and Mean Perimeter:Area Ratio
(MPAR) (+38,359%). At 133 acres, this zone represents just 10.8% of the CHOH’s park area,
but contains over 53% of the informal trails within the park.
When we examine the River Side and Gold Mine Tract Zones, we find that the vast majority of
informal trails exist on the Potomac River side of the C&O Canal: 85% by length and 90% by
area (Table 21).
Page 69
Results
Page 67
Figure 20. Fragmentation parcels within CHOH.
Page 70
Results
Page 68
Table 21. Fragmentation summaries by management zone, CHOH.
Fragmentation Indices
CHOH Park Zones
BGA Gold Mine
Tract/Inland River Side Overall
(133 acres) (706 acres) (386 acres) (1225 acres)
Number of Patches (N)
Formal Trails 6 11 19 30
All Trails (% change) 148 (+2367%) 20 (82%) 163 (+758%) 183 (+510%)
Mean Patch Size (MPS) (ft2)
Formal Trails 953833 2777627 877323 1574103
All Trails (% change) 3593 (-96%) 141849 (-45%) 9412 (-88%) 23886 (-98%)
Largest Patch Index (LPI)
Formal Trails 0.50077 0.28142 0.17193 0.18208
All Trails (% change) 0.31078 (-38%) 0.28122 (0%) 0.17171 (0%) 0.18252 (0%)
Mean Perimeter: Area Ratio (MPAR) (ft/ft2)
Formal Trails 0.0467 0.0196 0.0585 0.04427
All Trails (% change) 17.9137
(+38359%)
0.4215
(+2051%)
19.825
(+33789%)
17.7044
(+39892%)
Page 71
Page 69
DISCUSSION AND MANAGEMENT IMPLICATIONS
This section of the report reviews and summarizes the study findings and discusses some
implications for management actions that can help avoid or reduce the impacts of visitation on
the park’s formal trail system and informal trails. Discussion dialogue is combined for both
parks as both share similar visitor impact problems and solutions.
Review and Summary of Findings
Park managers operate under legislative mandates to provide appropriate recreational
opportunities while protecting and preserving park resources and natural processes. While a
variety of recreational uses, including trail-related activities, are clearly appropriate, park
managers must also ensure that they avoid significant impairment of natural and cultural
resources. As described in the Introduction section, park managers are charged with applying
their professional judgment in evaluating the type and extent of recreation-related impacts when
judging what constitutes impairment. This report provides useful information for rendering such
determinations and provides a basis for decisions to enhance management of visitors and
resources to avoid or minimize recreation impacts.
This research developed and applied state-of-the-art trail condition assessment and monitoring
procedures and applied them to the park’s formal and informal (visitor-created) trails. A variety
of trail condition indicators were identified in consultation with park staff for potential use in
future park management or VERP carrying capacity planning and decision-making. Protocols
were developed, field-tested and applied with results fully summarized to provide baseline data
to inform managers regarding the current condition of their formal trails, guide potential
selection of indicators and standards, and allow comparison to future condition assessments to
evaluate trends over time. These protocols are included in report appendices for adaptation and
use by park staff.
Management Suggestions
Formal Trails: Both parks have fairly small formal trail systems (GFP: 12.31 mi; CHOH: 14.67
mi) that are in relatively good condition, despite some common design-related problems. For
example, 60% of GFP formal trails are located in flatter terrain where muddiness, trail widening,
and the formation of secondary trails can become common problems, and 41% are aligned within
22o of the fall line. Fall-aligned trails are particularly susceptible to soil loss and tread widening.
At CHOH, 31% of the formal trails are located in flatter terrain, and 23% are aligned within 22o
of the fall line. Trail widening was difficult to assess because some trails are woods roads and
data was unavailable on the design and/or maintenance widths of the various trails. Both formal
trail systems are affected somewhat by muddiness and formation of secondary treads. Soil loss is
greater at GFP than at CHOH (mean CSA soil loss of 89.5 in2 for GFP vs. 49.0 in
2 for CHOH).
This is of particular interest given that trails at GFP are commonly surfaced with gravel (55%),
which effectively deters substrate loss, while none of the CHOH trails are graveled (the C&O
Canal tow path was excluded from our study). The GFP Ridge Trail accounts for much of the
Page 72
Discussion and Management Implications
Page 70
soil loss, largely due to poor trail design. At CHOH, the Bear Island Billy Goat A and
Emergency Access Trails stand out with respect to excessive width and soil loss.
Trail widening appears to be the most common problem affecting formal trails within Potomac
Gorge. Wimpey and Marion (2010) identify six general behaviors that contribute to trail
widening: 1) passing other trail users, 2) side-by-side travel, 3) avoidance of tread problems
(e.g., muddiness, erosion, roughness), 4) inability to remain on the intended tread due to poorly
marked trails or ambiguous tread borders, 5) roaming associated with picking the easiest route
when traversing steep grades, and 6) attraction and avoidance behaviors (e.g., gaining a view or
staying away from a drop-off).
Trail widening behaviors can be substantially modified by a number of environmental and
managerial factors (Wimpey & Marion 2010). Trails in flatter terrain are particularly prone to
widening, unless prevented by dense woody vegetation. Relocation to side-hill alignments is the
most effective permanent solution but is often impractical, so establishing trail borders with
rocks, logs, or fencing can be considered when this form of impact becomes excessive. Managers
can also contain the lateral spread of traffic along trails by adequately addressing tread problems,
such as muddiness, erosion, and excessive rockiness, which visitors will seek to circumvent.
Managers can provide physically challenging trails, but keeping visitors on them requires design
and maintenance practices that ensure the provision of a tread that is more inviting to traffic than
the adjacent trailside terrain. A tread that always appears to the trail user as the most direct or
easiest route will likely be used consistently with minimal lateral dispersal of traffic.
To address tread widening in problem areas trail maintainers can strategically place large rocks
or cut ends of fallen trees placed perpendicular to the tread to force visitors to the center of
widened treads. Low impact education encouraging visitors to walk single file and stay to the
center of the trail can also assist. Wimpey and Marion (2010) provide additional research and
guidance on this topic.
Excessive soil loss is also generally best addressed through sidehill trail relocations that avoid
steep fall line alignments. Trail grades of less than 10-12% and alignments greater than 22o from
the fall line are best (Olive & Marion 2009). Alternate actions include hardening treads through
the application of gravel or rockwork, or installing wooden or rock steps when grades are steep.
Effective trail maintenance solutions include the incorporation of periodic grade reversals
(rolling grade dips) within steeper treads that are carrying water (IMBA 2004). A combination of
water bars and outsloped treads are additional alternatives which reduce soil loss from trails
(Birchard & Proudman 2000, Marion & Leung 2004). Properly designed grade reversals require
no subsequent maintenance but water bars and outsloped treads need to be maintained once or
twice each year or they will fail and allow water to run down treads with increasing erosive
force.
Informal Trails: Protocols for assessing the spatial patterns, lineal extent, and condition of
informal (visitor-created) trail networks were also developed and applied. The creation and
proliferation of informal trails has been a substantial, and common long-term management
problem at both parks, particularly for CHOH. Census surveys of informal trails revealed 8.37
mi of informal trails at GFP and 19.29 mi at CHOH. Given the rare and fragile plant
communities and substantial number of rare plant species in both parks, these extensive networks
of informal trails pose a serious threat to the resource protection mandates of both parks. At GFP,
Page 73
Discussion and Management Implications
Page 71
91% by lineal extent of these informal trails are rated Condition Class 3 or higher, indicating a
more complete loss of tread vegetation and organic litter cover (69% at CHOH). Additional
concerns include the potential dispersal of non-native and invasive plants along informal trails,
habitat fragmentation, and access to sensitive historic or cultural resources.
In the past, very few parks have surveyed or monitored their informal trail networks, though such
surveys are becoming more common recently (Leung & Louie 2008, Marion et al. 2006). The
number, density, and spatial extent of informal trails at these study parks generally exceeds that
of other parks where they have been investigated, though they are comparable to some valley
floor meadows within Yosemite National Park.
Informal trail data from both parks is presented in a variety of formats to document their spatial
extent and distribution, condition, and land fragmentation. Data were presented by park
management zone to facilitate discussion of the appropriateness and acceptability of informal
trail networks relative to differing management zone objectives. GIS informal trail data layers
were also provided to each park to support planning and decision-making. These permit
additional analyses through examination of proximity between the informal trail network and
rare species locations or sensitive historic/cultural sites. Readers are referred to Hockett and
others (2010) for more in-depth discussion and presentation of information regarding the causes
of informal trail formation and possible site management and educational responses. Some of
that material is also included in this report to make this document a more complete resource. In
particular, refer to Appendix 3 for guidance on deterring off-trail hiking and managing informal
trail impacts.
Informal trails may be considered appropriate under some circumstances to provide visitor
access to various park locations not accessed by formal trails. Indeed, many informal trails
appear to have been created because the formal trail networks do not provide access to attraction
features of interest to visitors. Unfortunately, visitors generally lack trail design knowledge, and
often create unsustainable trails that are highly duplicative, creating impacts that could be
avoided by improved trail design and management. Informal trails that pass through areas with
rare or sensitive flora or fauna, or sensitive cultural/archaeological resources, are inappropriate
and unacceptable. Informal trails that directly ascend steep slopes and/or will easily erode are
less acceptable than trails with a side-hill design. Informal trails prone to muddiness and
widening are also less acceptable, as are trails that may contribute eroded soils to water
resources. These and other factors must be evaluated by park managers before selecting and
applying corrective actions. Comprehensive guidance for managing informal trail networks is
provided in Appendix 3.
Readers are referred to results from a companion study at CHOH’s Bear Island that sought to
reduce off-trail hiking rates (Hockett et al. 2010). This study experimentally applied
combinations of site management and educational practices and reduced self-reported off-trail
hiking from 70% of surveyed visitors to 43% along the 1.7 mile Billy Goat Trail A. Observations
at two specific formal trail locations reported a reduction in off-trail hiking from 30% to 0%.
Study treatments were applied in an additive fashion, and included educational signs placed at
formal trailheads, educational messages delivered through personal contact at trailheads,
symbolic prompter signs placed at all formal/informal trail intersections, log barriers and
symbolic fencing, light brushing to hide informal trails, and restoration work and signing. Visitor
surveys also documented off-trail hiking motivations and preferences for alternative management
Page 74
Discussion and Management Implications
Page 72
actions. The most common motivations for hiking off-trail were to get to a scenic vista or take a
photo (50.7%), to avoid or pass others (45.4%), or because of poor or challenging trail conditions
(43.0%). Hikers with a greater knowledge of off-trail hiking impacts were less likely to hike off-
trail than those who had less knowledge.
The Bear Island study was designed to inform managers at both parks of effective practices for
reducing off-trail hiking impacts, particularly within sensitive rare plant communities. We urge
readers to consider the results of that study (Hockett et al. 2010), and include its key
management suggestions here to highlight effective practices for decreasing off-trail travel:
Improve Communication with Visitors: Many visitors do not know about the special and
rare plant and animal communities that live within the Potomac Gorge. Trail stewards are
more effective in communicating educational messages than the trailhead signs, in part
because they are able to contact a greater percentage of visitors. Most visitors simply do
not read signs.
Improve Maintenance and Trail Markings: Some hikers hike off-trail accidentally
because formal trails may be poorly marked or indistinguishable from informal trails.
Managers must ensure that formal trails are maintained to be a better and preferred route
than alternate trail-side terrain or informal trails. During wet periods managers should
identify muddy sections and apply corrective actions so that visitors can remain on them.
Consider Formalizing Some Informal Trails: Some informal trails were created as by-
passes around difficult or crowded trail sections. Others were created to access scenic
vistas or favorite places. Managers should consider if those trails are acceptable. If they
are, they should be formalized, or closed and replaced by formal trails designed by a trail
professional with more sustainable alignments.
Close and Restore Unacceptable Trails: The closure and recovery of all remaining
informal trails will be a formidable management challenge. Trampling impacts and trail
creation occur with limited or low levels of traffic, while unassisted natural recovery
requires little to no use over years for vegetation to return. We suggest use of both
informative trailhead signs and symbolic prompter signs at formal/informal trail
intersections. Brushing the visible portion of all informal trails can further reduce off-
trail travel by removing the ―releasor cue‖ of a path that others have obviously taken.
An array of educational and site management actions is necessary to reach visitors who are
hiking off-trail for different reasons. Trail stewards and educational signs can convey
information about off-trail hiking impacts to reduce the number of visitors who hike off-trail
because they do not know it is harmful. Small symbolic prompter signs can more clearly
communicate where not to hike and provide reminders of appropriate behavior at decision points.
These reminders at the decision points have been shown to be more effective at reducing off-trail
hiking than trailhead signs alone (Park et al. 2008, Bradford & MacIntyre 2007). Brushing the
beginning of an informal trail removes the evidence that many others have taken that path.
Fencing and restoration signs provide additional cues that the park is really concerned about an
area and have been shown to be very effective in this and other studies in keeping visitors from
using informal trails. However, there is a risk that if a fence is applied to a very popular place,
where there is a strong motivation for leaving the trail, visitors might create additional trails to
access the area so such an occurrence must be carefully monitored (Johnson et al. 1987).
Page 75
Discussion and Management Implications
Page 73
An important note of caution: Some individuals, including those interested in nature study,
photography, fishing, and climbing, ―need‖ to engage in off-trail hiking to fulfill their trip
objectives. What will they be told given that their motivations for visiting the trail are in direct
conflict with NPS management objectives? The experiential quality for these individuals is
negatively impacted by management guidance asking visitors to remain on formal trails. The
history of visitors exploring off-trail areas, including off-trail visits to favorite places, fishing
spots, or climbing areas, will make it very challenging to achieve high compliance rates. Local
visitors may also have strong place attachment, which could make them resistant to management
changes.
For visitors or NPS and volunteer staff who must hike off-trail, there are a number of preferred
low impact practices that could be conveyed:
1) remain on formal trails as long as possible and minimize off-trail travel,
2) when hiking off formal trails use well-established informal trails whenever possible;
minimize use of lightly-impacted informal trails to allow their recovery,
3) when hiking off formal and informal trails, travel on rock, non-vegetated substrates, and
grasses; minimize and disperse traffic in all other vegetated areas.
One concern is how such information might be communicated to visitors. If posted on signs or
in printed material it could send potentially confusing mixed messages, or that off-trail hiking is
really ―OK.‖ To address those concerns it may be preferable to communicate these practices only
orally, such as when trail stewards or park staff see visitors going off-trail or when stewards or
park staff are explicitly asked by visitors about off-trail hiking.
If the NPS is able to effectively implement most of the actions suggested above we can expect
conditions to slowly improve on many miles of informal trail and for those most lightly impacted
informal trails to disappear. A long-term monitoring program could prove valuable to document
and evaluate progress. We suggest continuation of the informal trail monitoring protocols
included in this management report. This would provide quantitative data to track management
success and that could also allow managers to set and evaluate standards of quality (see
discussions of VERP and LAC in Appendix 3). Informal trail management requires an ongoing
adaptive management program, where actions are implemented, evaluated periodically, and
findings used to support the selection of additional actions as needed to achieve management
objectives.
Finally, we suggest that a workshop with NPS and various representatives of the public be
convened to discuss these or other general strategies and actions in a collaborative process.
Regardless of what actions are adopted, we suggest that an adaptive management decision-
making process be implemented to evaluate management success and alter actions over time as
needed to best accomplish management objectives.
Page 76
Page 74
LITERATURE CITED
Adkison, G.P. & Jackson, M.T. 1996. Changes in ground-layer vegetation near trails in
Midwestern U.S. forests. Natural Areas Journal 16:14-23.
Aust, M.W., Marion, J.L. & Kyle, K. 2004. Research for the development of best management
practices for minimizing horse trail impacts on the Hoosier National Forest. Virginia Tech
Final Management Report, Dept. of Forestry. Blacksburg, VA 77 p.
Bacon, J., Roche, J., Elliot, C. & Nicholas, N. 2006. VERP: Putting principles into practice in
Yosemite National Park. The George Wright Forum 23(2):73-83.
Bayfield, N.G. 1973. Use and deterioration of some Scottish hill paths. The Journal of Applied
Ecology 10:635-644.
Bayfield, N.G. & Lloyd, R.J. 1973. An approach to assessing the impact of use on a long
distance footpath - the Pennine Way. Recreation News Supplement 8:11-17.
Benninger-Truax, M., Vankat, J.L. & Schaefer, R.L. 1992. Trail corridors as habitat and conduits
for movement of plant species in Rocky Mountain National Park, Colorado, USA. Landscape
Ecology 6(4): 269-278.
Bhuju, D.R. & Ohsawa, M. 1998. Effects of nature trails on ground vegetation and understory
colonization of a patchy remnant forest in an urban domain. Biological Conservation 85:123–
135.
Birchard, W. & Proudman, R.D. 2000. Appalachian Trail Design, Construction, and
Maintenance. (2nd Ed.). Appalachian Trail Conference, Harpers Ferry, WV.
Boucher, D., Aviles, J., Chepote, R., Domínguez Gil, O. & Vilchez, B. 1991. Recovery of
trailside vegetation from trampling in a tropical rain forest. Environmental Management
15:257-262.
Bradford, L.E.A. & McIntyre, N. 2007. Off the beaten track: Messages as a means of reducing
social trail use at St. Lawrence Islands national park. Journal of Park and Recreation
Administration 25:1-21.
Bratton, S.P., Hickler, M.G. & Graves, J.H. 1979. Trail erosion patterns in Great Smoky
Mountains National Park. Environmental Management 3(5):431-445.
Brooks, J.J. 2003. A multi-method assessment of recreation impacts at Rocky Mountain National
Park. In: Visitor Use in Wilderness Study Phase 1. Colorado State University, Fort Collins,
CO.
Page 77
Literature Cited
Page 75
Cao, L., Stow, D., Kaiser, J. & Coulter, L. 2007. Monitoring cross-border trails using airborne
digital multispectral imagery and interactive image analysis techniques. Geocarto
International 22(2):107-125.
Christensen, H.H. & Clark, R.N. 1983. Increasing public involvement to reduce depreciative
behavior in recreation settings. Leisure Sciences 5(4):359-379.
Cole, D.N. 1983. Assessing and monitoring backcountry trail conditions. USDA Forest Service
Research Paper INT-303. 10 p.
Cole, D.N. 1989. Wilderness campsite monitoring methods: A sourcebook. General Technical
Report INT-259. USDA Forest Service, Intermountain Research Station, Ogden, UT. 57p.
Cole, D.N. 1990. Trampling disturbance and recovery of cryptogamic soil crusts in Grand
Canyon National Park. Great Basin Naturalist 50:321-325
Cole, D.N. 1991. Changes on trails in the Selway-Bitterroot Wilderness, Montana, 1978-89.
USDA Forest Service Res. Pap. INT-450. 5 p.
Cole, D.N. 1993. Minimizing conflict between recreation and nature conservation. In: Ecology
of Greenways Design and Function of Linear Conservation Areas. Eds. D.S. Smith, P.C.
Hellmund, University of Minnesota Press, Minneapolis, MN.
Cole, D.N. 2004. Impacts of hiking and camping on soils and vegetation: A review. In:
Environmental Impacts of Ecotourism. R. Buckley (editor). CABI Publishing, Cambridge,
MA.
Cole, D.N., Watson, A.E., Hall, T.E. & Spildie, D.R. 1997. High-use destinations in wilderness:
Social and biophysical impacts, visitor responses, and management options. Research Paper
INT-RP-496. Rocky Mountain Research Station, Ogden, UT.
Coleman, R.A. 1977. Simple techniques for monitoring footpath erosion in mountain areas of
North-West England. Environmental Conservation. 4(2):145-148.
Dissmeyer, G.E. & Foster, G.R. 1984. A Guide for predicting sheet and rill erosion on forest
land. USDA Forest Service, Technical Publication R8 TP 6.
Dixon, G., Hawes, M., & McPherson, G. 2004. Monitoring and modeling walking track impacts
in the Tasmanian Wilderness World Heritage Area, Australia. Journal of Environmental
Management 71:305–320.
Ferris, T.M.C., Lowther, K.A. & Smith, B.J. 1993. Changes in footpath degradation 1983–1992:
A study of the Brandy Pad, Mourne Mountains. Irish Geography 26:133-140.
Fleming, G.P., Coulling, P.P., Patterson, K.D. & McCoy, K.M. 2004. The natural communities
of Virginia: classification of ecological community groups. Second approximation. Virginia
Department of Conservation and Recreation, Division of Natural Heritage, Richmond, VA.
http://www.dcr.virginia.gov/dnh/ncintro.htm.
Page 78
Literature Cited
Page 76
Fritz, J.D. 1993. Effects of trail-induced sediment loads on Great Smoky Mountains National
Park high gradient trout streams. M.S. Thesis. Tennessee Technological University,
Cookville, TN.
Grabherr, G. 1982. The impact of trampling by tourists on a high altitudinal grassland in the
Tyrolean Alps, Austria. Plant Ecology 48:209-217.
Graefe, A.R., Vaske, J.J. & Kuss, F.R. 1984. Social carrying capacity: An integration and
synthesis of twenty years of research. Leisure Sciences 6(4):395-431.
Hall, C.N. & Kuss, F.R. 1989. Vegetation alteration along trails in Shenandoah National Park,
Virginia. Biological Conservation 48:211-227.
Hammitt, W.E. & Cole, D.N. 1998. Wildland Recreation: Ecology and Management (2nd Ed.).
John Wiley and Sons, New York, NY.
Hesselbarth, W., Vachowski, B. & Davies, M.A. 2007. Trail construction and maintenance
notebook. Tech. Rpt. 0723-2806-MTDC, USDA Forest Service, Missoula Technology and
Development Center, Missoula, MT.
Hill, W. & Pickering, C.M., 2006. Vegetation associated with different walking track types in the
Kosciuszko alpine area, Australia. Journal of Environmental Management 78:23–34.
Hockett, K., Clark, A., Leung, Y.F. Marion, J.L., & Park, L. 2010. Deterring off-trail hiking in
protected natural areas: Evaluating options with surveys and unobtrusive observation. Final
Management Report. Virginia Tech, Dept. of Forestry, Blacksburg, VA.
Hollenhorst, S. & Gardner, L. 1994. The indicator performance estimate approach to determining
acceptable wilderness conditions. Environmental Management 18(6):901-906.
Hooper, L. 1983. National Park Service Trails Management Handbook. USD1 National Park
Service, Denver Service Center, Denver, CO. 53p.
IMBA. 2004. Trail Solutions: IMBA’s Guide to Building Sweet Singletrack. The International
Mountain Bike Association, Boulder, CO.
Johnson, B., Bratton, S. & Firth, I. 1987. The feasibility of using brushing to deter visitor use of
unofficial trails at Craggy Gardens Blue Ridge Parkway, North Carolina. National Park
Service, Cooperative Studies Unit, Institute of Ecology, University of Georgia, Athens, GA.
Johnson, D.R. & Swearingen, T.C. 1992. The effectiveness of selected trailside sign texts in
deterring off-trail hiking at Paradise Meadow, Mount Rainier National Park. USDA Forest
Service, Pacific Northwest Research Station.
Johnson, B.R., Bratton, S.P., & Firth, I. 1987. The Feasibility of Using Brushing to Deter Visitor
Use of Unofficial Trails at Craggy Gardens, Blue Ridge Parkway, North Carolina (CPSU
Report No. 43). National Park Service Cooperative Studies Unit, Institute of Ecology,
University of Georgia, Athens, GA.
Page 79
Literature Cited
Page 77
Kaiser, J.V., Stow, D.A. & Cao, L. 2004. Evaluation of remote sensing techniques for mapping
transborder trails. Photogrammetric Engineering & Remote Sensing 70(12):1441–1447.
Kasworm, W.F. & Monley, T.L. 1990. Road and trail influences on grizzly bears and black bears
in northwest Montana. In: L.M. Darling & W.R. Archibald (Eds.), Bears: Their Biology and
Management: Proceedings of the 8th International Conference (pp. 79-84). International
Association for Bear Research and Management, Victoria, BC.
Keirle, I. & Stephens, M. 2004. Do walkers stay on footpaths? An observational study of Cwm
Idwal in the Snowdonia National Park. Countryside Recreation 12(2):7-9.
Knight, R.L. & Cole, D.N. 1995. Wildlife responses to recreationists. In: Knight, R.L. & K.J.
Gutzwiller., eds. Wildlife and Recreationists: Coexistence through Management and
Research. Island Press, Washington, DC. pp. 51-70.
Lehvavirta, S. 1999. Structural elements as barriers against wear in urban woodlands. Urban
Ecosystems 4(1):45-56.
Leonard, R.E. & Whitney, A.M. 1977. Trail transect: A method for documenting trail changes
Research Paper NE-389. USDA Forest Service, Northeastern Forest Experiment Station,
Upper Darby, PA.
Leung, Y.F., 2002. More than a database: Integrating GIS data with the Boston Harbor Islands
visitor carrying capacity study. Applied Geography 19:69-78.
Leung, Y.F., Shaw, N. Johnson, K. & Duhaime, R. 2002. More than a database: Integrating GIS
data with the Boston Harbor Islands visitor carrying capacity study. George Wright Forum,
19(1), 69–78.
Leung, Y.F. & Louie, J. 2008. Visitor Experience and Resource Protection data analysis
protocol: Social trails. p. 17. North Carolina State University, Raleigh, NC.
Leung, Y.F. & Marion, J.L. 1996. Trail degradation as influenced by environmental factors: A
state-of-knowledge review. Journal of Soil and Water Conservation 51(2):130-136.
Leung, Y.F. & Marion, J.L. 1999a. Assessing trail conditions in protected areas: An application
of a problem-assessment method in Great Smoky Mountains National Park, USA.
Environmental Conservation 26: 270-279.
Leung, Y.F. & Marion, J.L. 1999b. The influence of sampling interval on the accuracy of trail
impact assessment. Landscape and Urban Planning 43:167-179.
Leung Y.F., Marion J.L. 2000. Recreation impacts and management in wilderness: A state-of-
knowledge review. In: Cole, D.N., McCool, S.F., Borrie, W.T., O’Loughlin, J. (comps)
Wilderness science in a time of change conference, Vol 5. Wilderness ecosystems, threats
and management. Proceedings RMRS-P-15-Vol-5. USDA Forest Rocky Mountain Research
Station, pp 23–48.
Page 80
Literature Cited
Page 78
Liddle, M.J. & Greig-Smith, P. 1975. A survey of tracks and paths in a sand dune ecosystem, I.
Soils. Journal of Applied Ecology 12:893-908.
Lynn, N.A. & Brown, R.D. 2003. Effects of recreational use impacts on hiking experiences in
natural areas. Landscape and Urban Planning 64(1/2):77-87.
Lucas, R.C. 1979. Perceptions of non-motorized recreational impacts: A review of research
findings. In: Ittner, R.; Potter, D.R.; Agee, J.K.; Anschell, S., eds. Recreational Impact on
Wildlands: Conference Proceedings; Seattle, WA. R-6-001-1979. USDA Forest Service,
Pacific Northwest Forest and Range Experiment Station and USDI National Park Service. pp.
24-31.
Manning, R. 1999. Studies in Outdoor Recreation: Search and Research for Satisfaction (2nd
Edition). Oregon State University Press. Corvallis, OR.
Manning, R., Jacobi, C. & Marion, J.L. 2006. Recreation Monitoring at Acadia National Park.
The George Wright Forum 23(2):59-72.
Marion, J.L. 1991. Developing a natural resource inventory and monitoring program for visitor
impacts on recreation sites: A procedural manual. Natural Resources Report
NPS/NRVT/NRR-91/06. Denver, CO: USDI National Park Service, Natural Resources
Publication Office. 59p.
Marion, J.L. 1994. An Assessment of Trail Conditions in Great Smoky Mountains National Park.
Research/Resources Management Report. USDI National Park Service, Southeast Region.
Atlanta, GA. 155p.
Marion, J.L. & Olive, N. 2006. Assessing and understanding trail degradation: Results from Big
South Fork National River and Recreational Area. National Park Service, Final Research
Report. USDI, U.S. Geological Survey, 80 pp.
Marion, J.L. & Cahill, K. 2006. Monitoring the resource Impacts of visitor use: A protocol for
the long-term Coastal Ecosystem Monitoring Program at Cape Cod National Seashore.
USDI, U.S. Geological Survey, Final Research Rpt., Virginia Tech Field Station,
Blacksburg, VA.
Marion, J.L., Leung, Y.F., & Nepal, S. 2006. Monitoring trail conditions: new methodological
considerations. George Wright Forum 23(2):36-49.
Marion, J.L. & Hockett, K. 2008a. Trail and campsite monitoring protocols: Zion National Park.
USDI, U.S. Geological Survey, Final Research Rpt., Virginia Tech Field Station,
Blacksburg, VA. 65p.
Marion, J.L. & Hockett, K. 2008b. Frontcountry recreation site and trail conditions: Haleakalä
National Park. USDI, U.S. Geological Survey, Final Research Rpt., Virginia Tech Field
Station, Blacksburg, VA. 88p.
Page 81
Literature Cited
Page 79
Marion, J.L. & Leung, Y.F. 2001. Trail resource impacts and an examination of alternative
assessment techniques. Journal of Park & Recreation Administration 19(1):17-37.
Marion, J.L. & Leung, Y.F. 2004. Environmentally sustainable trail management. In: Buckley,
R. (ed.), Environmental Impact of Tourism, Cambridge, MA: CABI Publishing. pp. 229-244.
Marion, J.L., Leung, Y.F. & Nepal, S. 2006. Monitoring trail conditions: new methodological
considerations. George Wright Forum 23(2):36-49.
Marion, J.L. & Lime, D.W. 1986. Recreational resource impacts: Visitor perceptions and
management responses. In: Kulhavy, D.L., Conner, R.N., eds. Wilderness and Natural Areas
in the Eastern United States: A Management Challenge. Stephen F. Austin State University,
School of Forestry, Nacogdoches, TX. pp. 229-235.
Matheny, S.J. 1979. A successful campaign to reduce trail switchback shortcutting. In:
Recreational impacts on wildlands. USDA Forest Service, Portland, OR. pp. 217-221.
Meldrum, B.H., Littlejohn, M.A., Gramann, J., & Hollenhorst, S.J. 2004. Chesapeake and Ohio
Canal National Historic Park visitor study. University of Idaho Park Studies Unit, from
http://psu.uidaho.edu/vsp.profile.htm?ID=0149 [accessed on 2/3/2007]
Merigliano, L.L. 1990. Indicators to monitor wilderness conditions. In: Lime, D.W., ed.
Managing America's Enduring Wilderness Resource. University of Minnesota, Agricultural
Experiment Station and Extension Service. St. Paul, MN. pp. 205-209.
Miller, S.G., Knight, R.L. & Miller, C.K. 1998. Influence of recreational trails on breeding bird
communities. Ecological Applications 8, 162-169.
National Park Service. 1997. The Visitor Experience and Resource Protection (VERP)
framework: A handbook for planners and managers. Publication No. NPS D-1215. USDI
National Park Service, Denver Service Center. Denver, CO.
National Park Service. 2007. Great Falls Park General Management Plan/Environmental Impact
Statement, Final. USDI National Park Service, McLean, VA.
National Park Service. 2006. Management Policies. USDI National Park Service, Washington,
D.C.
National Park Service. 2009. National Park Service Public Use Statistics Office, Washington,
D.C., http://www.nature.nps.gov/stats/
O'Connor, J.S. & Dewling, R.T. 1986. Indices of marine degradation, their utility. Environmental
Management 10:335-343.
Olive, N.D. & Marion, J.L. 2009. The Influence of use-related, environmental and managerial
factors on soil loss from recreational trails. Journal of Environmental Management 90: 1483-
93.
Page 82
Literature Cited
Page 80
Park, L.O., Manning, R.E., Marion, J.L., Lawson, S.R. & Jacobi, C. 2008. Managing visitor
impacts in parks: a multi-method study of the effectiveness of alternative management
practices. Journal of Park and Recreation Administration 26(1):97-121.
Pearce-Higgins, J.W., & Yalden, D.W. 1997. The effect of resurfacing the Pennine Way on
recreational use of blanket bog in the Peak District National Park, England. Biological
Conservation 82(3):337-343.
Potito, A.P. & Beatty, S.W. 2005. Impacts of recreation trails on exotic and ruderal species
distribution in grassland areas along the Colorado Front Range. Environmental Management
36:230-236.
Rochefort, R.M., & S.T. Gibbons. 1992. Mending the meadow: High-altitude meadow
restoration in Mount Rainier National Park. Restoration and Management Notes 10:120-126.
Rochefort, R.M. & Swinney, D.D. 2000. Human impact surveys in Mount Rainier National Park:
Past, present, and future. In: Cole, D.N., McCool, S.F., Borrie, W.T., O’Loughlin,J.,
compilers. Wilderness Science in a Time of Change Conference—Vol. 5: Wilderness
Ecosystems, Threats, and Management. May 23–27, 1999. Missoula, MT. Proceedings
RMRS-P-15-VOL-5. USDA Forest Service, Rocky Mountain Research Station, Ogden, UT.
Roggenbuck, J.W. 1992. Use of persuasion to reduce resource impacts and visitor conflicts. In:
Influencing Human Behavior. ed. M.J. Manfredo, pp. 149-208. Sagamore Publishing
Incorporated, Champaign, IL.
Roggenbuck, J.W., Williams, D.R. & Watson, A.E. 1993. Defining acceptable conditions in
wilderness. Environmental Management 17(2):187-197.
Roovers, P., Bossuyt, B., Gulnick, H. & Hermy, M. 2005. Vegetation recovery on closed paths in
temperate deciduous forests. Journal of Environmental Management 74, 8.
Shelby, B. & Heberlein, T.A. 1986. Carrying capacity in recreation settings. Oregon State
University Press, Corvallis, OR.
Stankey, G.H., Cole, D.N., Lucas, R.C., Peterson, M.E., Frissell, S.S. & Washburne, R.F. 1985.
The Limits of Acceptable Change (LAC) System for wilderness planning. USDA Forest
Service General Technical Report INT-176.
Stankey, G.H. & Manning, R.E. 1986. Carrying Capacity of Recreation Settings. The President's
Commission on Americans Outdoors: A Literature Review. U.S. Government Printing
Office, Washington, D.C., pp. 47-57.
Sutherland, R.A., Bussen, J.O., Plondke, D.L., Evans, B.M. & Ziegler, A.D. 2001.
Hydrophysical degradation associated with hiking-trail use: a case study of Hawai'iloa Ridge
Trail, O'ahu, Hawai'i. Land Degradation & Development 12:71-86.
Page 83
Literature Cited
Page 81
Sutter, R.D., Benjamin, S.E., Murdock, N. & Teague, B. 1993. Monitoring the effectiveness of a
boardwalk at protecting a low heath bald in the southern Appalachians. Natural Areas Journal
13(44):250-255.
Steury, B.W., G.P. Fleming, & M.T. Strong. 2008. An emendation of the vascular flora of Great
Falls Park, Fairfax County, Virginia. Castanea 73(2): 123-149.
The Nature Conservancy. 2005. Retrieved March 19, 2007 from:
http://www.nature.org/wherewework/northamerica/states/maryland/files/pdf_bear_island_bro
chure.pdf
Thurston, E. & Reader, R.J. 2001. Impacts of experimentally applied mountain biking and hiking
on vegetation and soil of a deciduous forest. Environmental Management 27:397-409.
Tyser, R.W. & Worley, C.A. 1992. Alien flora in grasslands adjacent to road and trail corridors
in Glacier National Park, Montana (U.S.A.). Conservation Biology 6(2):253-262.
Vaske, J.J., Graefe, A.R. & Dempster, A. 1982. Social and environmental influences on
perceived crowding. In: Boteler, F.E., ed. Proceedings: Third Annual Conference of the
Wilderness Psychology Group. West Virginia University, Division of Forestry, Morgantown,
WV. pp. 211-227.
Weaver, T. & Dale, D. 1978. Trampling effects of hikers, motorcycles and horses in meadows
and forests. The Journal of Applied Ecology 15:451-457.
Williams, P.B. & Marion, J.L. 1995. Assessing Recreation site Conditions for Limits of
Acceptable Change Management in Shenandoah National Park. Technical Report
NPS/MARSHEN/NRTR-95/071.: USDI National Biological Service, Virginia Tech
Cooperative Park Studies Unit. Blacksburg, VA. 138p.
Wimpey, J., & Marion, J.L. 2010. The influence of use, environmental and managerial factors
on the width of recreational trails. Journal of Environmental Management 91:2028-2037.
Wing, M. & Shelby, B. 1999. Using GIS to integrate information on forest recreation. Journal of
Forestry 97(1):12-16.
Witztum, E.R. & Stow, D.A. 2004. Analyzing direct impacts of recreation activity on coastal
sage scrub habitat with very high resolution multi-spectral imagery. International Journal of
Remote Sensing 25(17): 3477-3496.
Wolper, J., Mohamed, S., Burt, S. & Young, R. 1994. Multisensor GPS-based recreational trail
mapping. In: Proceedings of ION GPS 1994 (Vol 7/V1) pp. 237-244. Institute of Navigation,
Alexandria, VA.
Wood, K.T., Lawson, S.R. & Marion, J.L. 2006. Assessing recreation impacts to cliffs in
Shenandoah National Park: Integrating visitor observation with trail and recreation site
measurements. Journal of Park & Recreation Administration 24(4):86-110.
Page 84
Page 82
APPENDIX 1: FORMAL TRAIL MONITORING MANUAL
Page 85
Appendix 1: Formal Trail Monitoring Manual
Page 83
Formal Trail Condition Monitoring Manual
Great Falls Parks1
(version 4/25/07)
This manual describes standardized procedures for conducting an assessment of resource conditions on
formal (designated) recreation trails within Great Falls and C&O Parks. The principal objective of these
procedures is to document and monitor changes in trail conditions following construction. Their design
relies on a sampling approach to characterize trail conditions from measurements taken at transects
located every 300 feet along randomly selected trail segments. Distances are measured with a measuring
wheel. Measurements are conducted at sample points to document the trail’s width, depth, substrate,
slope, alignment and other characteristics. These procedures take approximately three minutes to apply at
each sample point. Data is summarized through statistical analyses to characterize resource conditions for
each trail segment and for the entire trail system. During future assessments it is not necessary to relocate
the same sample points for repeat measures. Survey work should be conducted during the middle or end
of the primary use season. Subsequent surveys should be conducted at approximately the same time of
year.
Materials
(Check before leaving for the field)
- some on waterproof paper
tape to stakes
Point Sampling Procedures
Trail Segments: During the description of amount and type of use (indicators 5 & 6 below) be sure that
the use characteristics are relatively uniform over the entire trail segment. Sampled trails may have
substantial changes in the type or amount of use over their length. For example, one portion of a trail may
allow horse use or a trail may join the study trail, significantly altering use levels. In these instances
where substantial changes in the type and/or amount of use occur, the trail should be split in two or more
segments and assigned separate names and forms, upon which the differences in use can be described.
This practice will facilitate the subsequent characterization of trail use and statistical analyses.
Also collect and record any other information that is known about the trail’s history, such as original
construction, past uses, type and amount of maintenance, history of use, etc.
1 - Developed by Dr. Jeff Marion, USDI, U.S. Geological Survey, Patuxent Wildlife Research Center,
Virginia Tech Field Station, Dept. of Forestry (0324), Blacksburg, VA 24061 (540/231-6603) Email:
[email protected]
Page 86
Appendix 1: Formal Trail Monitoring Manual
Page 84
General Trail Information
1) Trail Segment Code: Record a unique trail segment code (can be added later).
2) Trail Name: Record the trail segment name(s) and describe the segment begin and end points.
3) Surveyors: Record initials for the names of the rail survey crew.
4) Date: Record the date (mm/dd/yr) the trail was surveyed.
5) Use Level (UL): Record an estimate of the amount of use the trail receives (high, med., low), relative
to other forest trails, from the most knowledgeable staff member. Work with them to quantify use levels
on an annual basis (e.g., low use: about 100 users/wk for the 12 wk use season, about 30 users/wk for the
20 wk shoulder season, about 10 users/wk for the 20 wk off-season = about 2000 users/yr).
6) Use Type (UT): Record estimates for the types of use the trail receives (including any illegal uses)
using percentages that sum to 100%. These should be provided by the most knowledgeable forest staff
member. Categories include: Hiking, Horseback, Biking, Other (specify).
Starting/Ending Point: Record a brief description of the starting and ending point of the trail survey.
Try to choose identifiable locations like intersections with other trails, roads, or permanent trailhead
signs.
Measuring Wheel Procedures: At the trail segment starting point, use a random number table to select a
random number from 0 to 300. Record this number on the first row of the form. This will be the first
sample point, from which all subsequent sample points will be located in 300 foot intervals. This
procedure ensures that all points along the trail segment have an equal opportunity of being selected.
Once you get to the first sample point, reset the wheel counter and use it to stop at 300 foot intervals
thereafter.
Push the measuring wheel along the middle of the tread so that it does not bounce or skip in rough terrain.
Lift the wheel over logs and larger rocks, adding distance manually where necessary to account for
horizontal distances. Your objective is to accurately measure the distance of the primary (most heavily
used) trail tread. Monitor the wheel counter closely and stop every 300 feet to conduct the sampling point
measures. If you go over this distance, you can back the wheel up to the correct distance. If the wheel
doesn’t allow you to take distance off the counter then stop immediately and conduct your sampling at
that point, recording the actual distance from the wheel, not the ―missed‖ distance.
If an indicator cannot be assessed, e.g., is ―Not Applicable‖ code the data as -9, code missing data as -1.
Rejection of a sample point: Given the survey’s objective there will be rare occasions when you may
need to reject a sampling point due to the presence of: 1) bedrock or cobble stone areas that lack defined
trail boundaries, and 2) uncharacteristic settings, like tree fall obstructions, trail intersections, road-
crossings, stream-crossings, bridges and other odd uncommon situations. The data collected at sample
points should be ―representative‖ of the 250 foot sections of trail on either side of the sample point. Do
not relocate a point to avoid longer or common sections of bog bridging, turnpiking, or other trail tread
improvements. Use your judgment but be conservative when deciding to relocate a sample point. The
point should be relocated by moving forward along the trail an additional 30 feet, this removes the bias of
subjectively selecting a point. If the new point is still problematic then add another 30 feet, and so on.
Record the actual distance of the substituted sample point and then push the wheel to the next sample
point using the original 300 foot intervals.
Page 87
Appendix 1: Formal Trail Monitoring Manual
Page 85
7) Distance: In the first column record the measuring wheel distance in feet from the beginning of the
trail segment to the sample point.
8) Trail Type (TT): Record whether the tread at the sample point was assessed as a direct ascent or
side-hill constructed trail (see definitions in #11). Record the letter code in the TT column.
DA – Direct ascent (fall-line), SH – Side-hill trail
9) Erosion Type (ET): Record whether soil erosion at the sample point, if present, appears to be recent
or historic (see definitions in #11). Record the letter code in the ET column.
RE – Recent erosion, HE – Historic erosion
10) Trail Grade (TG): The two field staff should position themselves on the trail 5 ft either side of the
transect. A clinometer is used to determine the grade (% slope) by sighting and aligning the horizontal
line inside the clinometer with a spot on the opposite person at the same height as the first person's eyes.
Note the percent grade (right-side scale in clinometer viewfinder) and record (indicate units used). Note:
if conducted by one person then place clinometer on a clipboard with the window facing you. Orient the
clipboard to be parallel to the trail grade and record degrees off the visible scale in the window. After
data entry convert to percent slope = [tan (degrees)] x 100.
11 Landform Grade (LG): Assess an approximate measure of the prevailing landform slope in the
vicinity of the sample point. Follow the one-person procedure described in #7.
12) Trail Slope Alignment Angle (TSA): Assess the trail’s alignment angle to the prevailing land-form
in the vicinity of the sample point. Position yourself about 5 ft downhill along the trail from the transect
and sight a compass along the trail to a point about 5ft past the transect; record the compass azimuth (0-
360, not corrected for declination) on the left side of the column. Next face directly upslope, take and
record another compass azimuth - this is the aspect of the local landform. The trail’s slope alignment
angle (<900) is computed by subtracting the smaller from the larger azimuth (done after data entry).
13) Secondary Treads (ST): Count the number of trails, regardless of their length, that closely parallel
the main tread at the sample point. Do not count the main tread.
14) Tread Width (TW): From the sample point, extend a line transect in both directions perpendicular
to the trail tread. Identify the endpoints of this trail tread transect as the most pronounced outer boundary
of visually obvious human disturbance created by trail use (not trail maintenance like vegetation
clearing). These boundaries are defined as pronounced trampling-related changes in ground vegetation
height (trampled vs. untrampled), cover, composition, or, when vegetation cover is reduced or absent,
changes in organic litter (intact vs. pulverized) (see photo illustrations in Figure 1). The objective is to
define the trail tread that receives the majority (>95%) of traffic, selecting the most visually obvious outer
boundary that can be most consistently identified by you and future trail surveyors. Include any
secondary parallel treads within the transect only when they are not differentiated from the main tread by
strips of less disturbed (taller) vegetation or organic litter.
Also pay close attention to selecting boundary points that reflect the extent of soil loss representative for
this location along the trail. Soil loss measures will be taken from a line stretched between the endpoints
you select so the line should be unobstructed. Organic litter or small rocks that obstructs the line can be
removed but large rock or root obstructions will necessitate moving the line forward along the trail in one
foot increments until you reach a location where the line is unobstructed. Temporarily place tent stakes at
the boundary points and then step back to verify their horizontal and vertical placement as projected along
the trail in the vicinity of the sample point. Measure and record the length of the transect (tread width) to
the nearest inch (don’t record feet and inches).
Page 88
Appendix 1: Formal Trail Monitoring Manual
Page 86
15) Maximum Incision, Current Tread (MIC): Stretch the fiberglass tape tightly between the two tent
stake pins that define the tread boundaries - any bowing in the middle will bias your measurements. This
transect line should reflect your estimate of the post-construction, pre-use land surface, serving as a datum
to measure tread incision caused by soil erosion, displacement and/or compaction. Measure the
maximum incision (nearest 1/4 inch: record .25, .5, .75) from the string to the deepest portion of the trail
tread. Measure to the surface of the tread's substrate, not the tops of rocks or the surface of mud puddles.
Your objective is to record a measure that reflects the maximum amount of soil loss along the transect
within the tread boundaries. See Figure 2, noting differences in MIC measures for side-hill vs. non-side-
hill trails.
16) Modal Incision, Current Tread (MOD): Record what you judge to be the ―most typical‖ or
―modal‖ incision measure for the entire transect. This measure will be used to compare against ―actual‖
modal incision measures from # 16 to evaluate the accuracy of such judgments for use in new rapid
assessment tread erosion procedures currently under development.
17) Cross-Sectional Area (CSA): The objective of the CSA measure is to estimate soil loss from the
tread at the sample point following trail creation. Soil loss may be due to erosion by water or wind, soil
displacement from trail users, or compaction. Accurate and precise CSA measures require different
procedures based on the type of trail and erosion, some definitions:
Direct-ascent vs. side-hill trails: Trails, regardless of their grade, that more or less directly ascend the
slope of the landform are direct-ascent or ―fall-line‖ trails. Direct-ascent trails involve little or no tread
construction work at their creation – generally consisting of removal of organic litter and/or soils. Trails
that angle up a slope and require a noticeable amount of cut-and-fill digging in mineral soil (generally on
landform slopes of greater than about 10%) are termed side-hill trails. The movement of soil is required
to create a gently out-sloped bench to serve as a tread. Separate procedures are needed for side-hill trails
to avoid including construction-related soil movement in measures of soil loss following construction.
Recent vs. historic erosion: Recreation-related soil loss that is relatively recent is of greater importance to
protected land managers and monitoring objectives. Severe erosion from historic, often pre-recreational
use activities, is both less important and more difficult to reliably measure. Historic erosion is defined as
erosion that occurred more than 10-15 years ago and is most readily judged by the presence of trees and
shrubs growing from severely eroded side-slopes.
Measurement Procedure: On the CSA data form, label a new row with the measuring wheel distance
for the transect (e.g., D=600 ft). Place the transect stakes as described under the appropriate situation (a-d
below). Starting on the left side record a 0 for the 1st mark on the line (V1, at 0 ft), followed by the
measurement for the 2nd mark (V2 at 0.3 ft). The standard interval for these measures is 0.3 ft (3 5/8 in)
but for wide trails alternative intervals can be used (e.g., 0.5 ft or 1.0 ft) – if alternative intervals are used
note the interval value on the CSA form. Take all vertical measures perpendicular to the transect line
down to the ground surface recording values to the nearest 1/4 in (e.g., .25, .5, .75). Record the values on
the data sheet next to their labeled numbers (e.g., V1, V2…Vn). Continue measuring each vertical until
you reach the far side of the trail and obtain a measure of 0 when the original (non-eroded) ground is
reached. Note: The transect line is not likely to be ―level‖ so be cautious in measuring vertical transects
that are perpendicular to the horizontal transect line. Contact Jeff Marion for a spreadsheet that calculates
CSA for this data.
a) Direct-ascent trails, recent erosion: Refer to Figure 2a and follow these procedures. Place two stakes
and the transect line to characterize what you judge to be the pre-trail or original land surface. Place the
left-hand stake so that the ―0‖ mark on the transect tape will fall on what you believe was the ―original‖
ground surface but at the edge of any tread incision, if present (see Figure 2a). The tape has been sewn to
allow two stake placement options to accomplish this. The transect incision value you record for the 1st
Page 89
Appendix 1: Formal Trail Monitoring Manual
Page 87
mark (V1) must be 0. Stretch the transect tape tightly between the two stakes - any bowing in the middle
will bias your measurements. Insert the other stake just beyond the first transect line mark on the other
side of the trail that is on the original ground surface and will be measured as a 0. The transect line
should reflect your estimate of the pre-trail land surface, serving as a datum to measure tread incision
caused by soil erosion and/or compaction.
Note: For this and all other options (b-d), if the line cannot be configured properly at the sample point due
to rocks or obstructing materials that cannot be moved, then move the line forward along the trail in one-
foot increments until you reach a location where the line can be properly configured.
b) Direct-ascent trails w/historic erosion: Refer to Figure 2b – if you judge that some of the erosion is
historic then follow these procedures. Generally you will find an eroded tread within a larger erosional
feature. Place two stakes and stretch the transect line to reflect and allow measurements of the more
recent recreation-related erosion (if present) – see guidance in 16a above. If there is no obvious recent-
erosion tread incision then position the stakes the same as for your tread width measurement and assess
incision between tread boundaries (option not depicted in Figure 2b). The 1st left-side measure (V1) must
be 0. At the right boundary you must also record a transect with a measure of 0.
c) Side-hill trail: Refer to Figure 2c. The objective of this option is to place the transect stakes and line
to simulate the post-construction tread surface, thereby focusing monitoring measuresments on post-
construction soil loss and/or compaction. When side-hill trails are constructed, soil on the upslope side of
the trail is removed and deposited downslope to create a gently out-sloped bench (most agency guidance
specify a 5% outslope) for the tread surface (see Figure 3). Outsloped treads drain water across their
surface, preventing the buildup of larger quantities of water that become erosive. However, constructed
treads often become incised over time due to soil erosion and/or compaction. The extent of this incision
are what these procedures are designed to estimate.
Carefully study the area in the vicinity of the sample point to judge what you believe
to be the post-construction tread surface. Pay close attention to the tree roots, rocks
or more stable portions of the tread to help you judge the post-construction tread
surface. Look in adjacent undisturbed areas to see if roots are exposed naturally or
the approximate depth of their burial. Configure the stakes and transect line to
approximate what you judge to be the post-construction tread surface. Note that
sometimes a berm of soil, organic material and vegetation will form on the
downslope side of the trail that is raised slightly above the post-construction tread
surface (generally less than 6 inches in height). If present, place the stake and line
below the height of the berm as shown in Figure 2c so that it does not influence your
measurements. If erosion is severe and/or if the line placement is subjective, use a
line level with marks on the bubble glass that allow you to level and then configure
the tape as a 3% outslope (a 1 in. drop over 33 in. – see table at right of offset
values from level) to standardize the line placement. A 3% outslope is used because
actual tread construction may have been somewhat less than 5%, and 3% provides a
more conservative estimate of soil loss. It is generally easier and more accurate to
place the downslope stake first and configure the line to a 3% outslope to reveal
where the uphill stake should be placed. Measure the left-hand stake as transect 1 with a 0 measure and
also record a final transect beyond the right-hand stake with a measure of 0.
d) Side-hill trail with historic erosion: Refer to Figure 2d - if you judge that the erosion is historic
then follow these procedures. Generally you will find an eroded tread within a larger erosional
feature. Place two stakes and stretch the transect line to reflect and allow measurements of the
more recent recreation-related erosion (if present). If there is no obvious recent-erosion tread
incision then position the stakes the same as for your tread width measurement and assess
Trail
Width
3%
outslope
offset
20 0.6” 30 0.9”
40 1.2”
50 1.5”
60 1.8”
70 2.1”
80 2.4”
90 2.7”
100 3.0”
110 3.3”
120 3.6”
130 3.9”
140 4.2”
150 4.5”
Page 90
Appendix 1: Formal Trail Monitoring Manual
Page 88
incision between tread boundaries (option not depicted in Figure 2d). The left-hand stake can
serve as vertical transect 1, record a 0 for this. At the right boundary you must also record a
vertical transect with a measure of 0.
Note: If the line cannot be configured properly at the sample point due to rocks or obstructing materials
that cannot be moved, then move the line forward along the trail in one-foot increments until you reach a
location where the line can be properly configured.
18-27) Tread Condition Characteristics: Along the trail tread width transect, estimate to the nearest
10% (5% where necessary) the aggregate lineal length occupied by any of the mutually exclusive tread
surface categories listed below. Be sure that your estimates sum to 100%.
S-Soil:
All soil types including sand and organic soils, excluding organic litter unless
it is highly pulverized and occurs in a thin layer or smaller patches over bare
soil.
L-Litter:
Surface organic matter including intact or partially pulverized leaves,
needles, or twigs that mostly or entirely cover the tread substrate.
V-Vegetation:
Live vegetative cover including herbs, grasses, mosses rooted within the tread
boundaries. Ignore vegetation hanging in from the sides.
R-Rock:
Naturally-occurring rock (bedrock, boulders, rocks, cobble, or natural
gravel). If rock or native gravel is embedded in the tread soil estimate the
percentage of each and record separately.
M-Mud:
Seasonal or permanently wet and muddy soils that show imbedded foot or
hoof prints from previous or current use (omit temporary mud created by a
very recent rain). The objective is to include only transect segments that are
frequently muddy enough to divert trail users around problem.
G-Gravel:
Human-placed (imported) gravel.
RT-Roots:
Exposed tree or shrub roots.
W-Water:
Portions of mud-holes with water or water from intercepted seeps or springs.
WO-Wood:
Human-placed wood (water bars, bog bridging, cribbing).
O-Other:
Specify.
Collect all equipment and move on to the next sample point. Be sure to assess and record information
on the Problem Assessment indicators as you proceed to the next sample point. These indicators are
assessed continuously as pre-defined trail tread problems and when found, surveyors record begin and
end distances (from the start of the survey) on the Problem Assessment Form. Note: after data entry
and before analysis the data for these indicators need to be corrected to add in the 1st randomly
selected interval distance so that location data are accurate. In particular, examine any indicators
that may begin before and end after the first sample point.
Page 91
Appendix 1: Formal Trail Monitoring Manual
Page 89
Problem Assessment Procedures
28) Informal Trails (IT): Record the trail distance form the measuring wheel for each informal (visitor-
created) trail that intersects the survey trail segment. This indicator is intended to provide an
approximation of the extensiveness of unofficial, visitor-created trails associated with survey trail. Do not
count formal trails, roads of any type, extremely faint trails with untrampled vegetation in their treads,
trails <10 ft long, or trails that have been effectively blocked off by managers. Informal trails are trails
that visitors have created to access features such as streams, scenic attraction sites1, cliffs, vistas, cultural
sites, or to cut switchbacks, avoid mud-holes, rutted treads, steep obstacles, or downed trees, or that
simply parallel the main trail. Count both ends of any informal trails ≥10 feet long that loop out and
return to or parallel the survey trail. Include any distinct animal or game trails as these are generally
indistinguishable from human trails and their true origin is likely unknown.
29) Muddy Soil (MS): Sections of tread ( 10 ft) with seasonal or permanently wet and muddy soils that
show imbedded foot or hoof prints ( ½ inch). Omit temporary muddiness created by a recent rain. This
should generally include any longer mud-holes or treads with running water. The objective is to include
only tread segments that are frequently wet or muddy enough to divert trail users around the problem,
often leading to an expansion of trail width.
30) Soil Erosion (SE): Sections of tread ( 10 ft) with soil erosion exceeding 5 inches in depth within
current tread boundaries. Record SE1 for soil loss 5-10 in., SE2 for 10.1-15 in. and SE3 for 15.1-20 in.
Page 92
Appendix 1: Formal Trail Monitoring Manual
Page 90
Figure 1. Photographs illustrating different types of boundary determinations. Trail tread boundaries are
defined as the most pronounced outer boundary of visually obvious human disturbance created by trail
use (not trail maintenance like vegetation clearing). These boundaries are defined as pronounced changes
in ground vegetation height (trampled vs. untrampled), cover, composition, or, when vegetation cover is
reduced or absent, as pronounced changes in organic litter (intact vs. pulverized). The objective is to
define the trail tread that receives the majority (>80%) of traffic, selecting the most visually obvious
boundary that can be most consistently identified by you and future trail surveyors.
Page 93
Appendix 1: Formal Trail Monitoring Manual
Page 91
Figure 2. Cross sectional area (CSA) diagrams illustrating alternative measurement procedures for direct
ascent trail alignments (a & b) vs. side-hill trail alignments (c & d) and for relatively recent erosion (a &
c) vs. historic erosion (b & d).
Post-construction tread surface
(3% outslope)
Original land surface
Berm
Original land surface
Current tread boundaries
Post-construction tread surface
Original land surface
Current tread boundaries
a) Direct ascent trail
b) Direct ascent trail w/historic erosion
c) Side-hill trail
d) Side-hill trail w/historic erosion
V2V1 V16
Original land surface
Stake
Current tread boundaries
Historic erosion
Recent, recreational erosion
Current tread boundaries
Post-construction tread surface
(3% outslope)
Original land surface
Berm
Original land surface
Current tread boundaries
Post-construction tread surface
Original land surface
Current tread boundaries
a) Direct ascent trail
b) Direct ascent trail w/historic erosion
c) Side-hill trail
d) Side-hill trail w/historic erosion
V2V1 V16
Original land surface
Stake
V2V1 V16
Original land surface
Stake
Current tread boundaries
Historic erosion
Recent, recreational erosion
Current tread boundaries
Page 94
Cross Sectional Area Form
Trail Segment Code _________ Trail Name ________________________________
CSA CSA CSA
Transect
(in)
Area
Transect
(in)
Area
Transect
(in)
Area
D=
V1=
Page 95
Point Sampling Form
Trail Segment Code Trail Name Surveyors
Date Use Level Use Type(s): Hiker %, Horse %, Bike %, Other %
Starting Point: UTM:
Ending Point: UTM:
Dist TT ET TG LG TSA ST TW Tread Substrate Characteristics MIC MOD CSA
/ | . | . | . | . | . | . | . | . | . | . |
/ | . | . | . | . | . | . | . | . | . | . |
/ | . | . | . | . | . | . | . | . | . | . |
/ | . | . | . | . | . | . | . | . | . | . |
/ | . | . | . | . | . | . | . | . | . | . |
/ | . | . | . | . | . | . | . | . | . | . |
/ | . | . | . | . | . | . | . | . | . | . |
/ | . | . | . | . | . | . | . | . | . | . |
/ | . | . | . | . | . | . | . | . | . | . |
/ | . | . | . | . | . | . | . | . | . | . |
/ | . | . | . | . | . | . | . | . | . | . |
/ | . | . | . | . | . | . | . | . | . | . |
/ | . | . | . | . | . | . | . | . | . | . |
/ | . | . | . | . | . | . | . | . | . | . |
/ | . | . | . | . | . | . | . | . | . | . |
/ | . | . | . | . | . | . | . | . | . | . |
/ | . | . | . | . | . | . | . | . | . | . |
/ | . | . | . | . | . | . | . | . | . | . |
/ | . | . | . | . | . | . | . | . | . | . |
0 10 20 30 40 50 60 70 80 90
100
Dist = Wheel Distance TSA = Alignment (Trailo / Landform
o) S = Soil G = Gravel
TT = Trail Type (DA, SH) ST = Secondary Treads L = Litter RT = Roots
ET = Erosion Type (RE, HE)form) TW = Tread Width V = Vegetation W = Water
TG = Trail Grade MIC = Max. Incision R = Rock WO = Wood, human-placed
LG = Landform Grade CSA (calculated from data) M = Mud O = Other (Specify)
Page 96
Problem Assessment Form Cross Sectional Area Form
Trail Segment Code _________ Trail Name ________________________________
Informal Trails Muddy Soil Soil Erosion CSA CSA CSA
Distances
Begin
Dist
End
Dist
Begin
Dist
End
Dist
Transect
(in)
Area
Transect
(in)
Area
Transect
(in)
Area
D=
V1=
Page 97
Page 95
APPENDIX 2: INFORMAL TRAIL MONITORING MANUAL
Page 98
Appendix 2: Informal Trail Monitoring Manual
Page 96
Informal Trail Monitoring Manual
Developed by Jeremy Wimpey, Jeff Marion, and Logan Park
Virginia Tech/Dept. of Forestry, Blacksburg, VA
Contact: [email protected] , 540-231-6603
Introduction
The creation and proliferation of informal (visitor-created) trails can directly impact sensitive
plant communities, rare or endangered flora and fauna, and wildlife habitats. For example, a
small patch or population of rare plants may be eliminated by trampling, habitat changes caused
by visitor use, or through competition from non-native species introduced by park visitors.
Recreationists seeking to access scenic overlooks, water resources, or merely to explore, often
trample vegetation sufficiently to create extensive informal trail networks. Such unplanned trail
networks generally receive no environmental reviews and resource degradation is often severe
due to their lack of professional design, construction, and maintenance. While some degree of
visitor impact is unavoidable, excessive trail impacts threaten natural resource values, visitor
safety, and the quality of recreational experiences.
Objectives
These protocols are designed to document the number, lineal extent, spatial distribution, area of
trampling disturbance, and resource condition of all informal trails within a specified study area.
Assessment procedures are efficiently applied through walking surveys that employ sub-meter
accuracy Global Positioning System (GPS) units providing field staff a paperless method for
collecting trail inventory and resource condition data. When periodically collected over time,
these data assist with the monitoring of onsite resource conditions and provide long-term
documentation of the existence, location, and condition of informal trails. The data also provide
supporting information for management decisions, such as to evaluate which informal trails
should be closed or left open, and later to evaluate the success of management efforts to close
selected trails, prevent the creation of new trails, or prevent further deterioration of existing
trails.
Guidance
This collection protocol should be performed at the end of peak season visitation, i.e., mid-
August, when evidence of visitor use is most pronounced and to minimize seasonal variations in
trail conditions. Collection should be done at multi-annual intervals (e.g., every three to five
years). This schedule assists in locating trails that may emerge or change conditions later in the
season. It is important to perform the collection consistently in time across each year to provide
management with comparable data.
Page 99
Appendix 2: Informal Trail Monitoring Manual
Page 97
Materials
Trimble GeoXT GPS1
o Loaded with: 1) Informal Trail (IT) Data Dictionary, and 2) formal trail layer
Contact Dr. Jeffrey Marion, Virginia Tech, Department of Forestry,
[email protected] for replacement layers and data dictionaries
o Stylus
o Hurricane antenna and connecting lead
o Trimble backpack and spare external battery
Tape measure (6ft auto-retracting)
Paper maps showing formal trail system
Pens and notebook
1 – Use the most accurate equipment available. Greater accuracy in data collection translates to
more accurate, objective, and efficient GIS editing work.
Methods
Survey staff should be familiar with study area and its visitor use patterns, particularly where
visitors are most likely to depart formal trails and potential off-trail destinations. Scheduling field
surveys during times of optimal satellite constellations may be necessary for some areas. Begin
work by selecting an area (sub region of the study area) on the paper map to search. Use features
such as trails, roads, and streams, along with prior survey data and personal knowledge, to divide
the area into manageable units. Prior data should be used as a guide but not as an authoritative
catalog of where informal trails will be found and mapped. To ensure that all informal trails are
located, walk all formal trails and search the areas adjacent to each trail for informal trails.
Where possible, do not assess trails created and/or used predominantly by wildlife (e.g., deer).
Such trails are generally narrow and go under low-hanging branches that would obstruct human
traffic. Be spatially aware and thoroughly search along/near formal trails and features for areas
that are likely to draw visitors off the formal trail network (e.g., vistas, water bodies, geographic
features of interest, historic structures). In particular, beware of informal trails that depart a
formal trail on resistance surfaces (e.g., rock, gravel, bare soil, grass) that may hide the
beginning of in informal trail. Some random searching and walking transects across off-trail
areas, particularly near any features of interest, are necessary to locate and map all informal
trails.
When an informal trail is located, begin an informal trail segment using the IT data dictionary.
Use the Condition Class descriptors below to determine and record the appropriate condition
class. Do not begin walking the trail segment until the GPS has successfully recorded its first
position fix. Walk the trail while collecting the feature until it reaches a junction or changes
condition class. Assess and record the segment’s average trail width (see below) and then close
the segment in the GPS.
Trail width is defined as the most visually obvious outer boundary of trampling-related
disturbance that receives the majority (>95%) of traffic. These boundaries are defined by
pronounced changes in ground vegetation height (trampled vs. untrampled), cover, composition,
Page 100
Appendix 2: Informal Trail Monitoring Manual
Page 98
or, when vegetation cover is reduced or absent, by disturbance to organic litter (intact vs.
pulverized) or lichen. Include any secondary parallel treads within this assessment only when
they are not differentiated from the main tread by strips of less disturbed vegetation or organic
matter. See Figure 1 for photographs illustrating these trail boundary definitions.
When in areas or times with poor GPS accuracy, stop at trail junctions to record an averaged IT
trail junction point. These points will improve the accuracy of GIS data editing.
After thoroughly collecting all informal trails within your sub region, make a notation on you
paper map to indicate it has been collected and move on to another sub region.
Decision rules for Collecting Informal Trail segments
A condition class change that occurs for less than 2 meters (approximately 6 feet) can be ignored
(i.e. collect it as one segment and assign the dominant condition class to the segment). Be careful
to try to avoid collecting animal trails. These trails will be narrow and have low hanging
branches/vegetation. Use your judgment and look for signs of human and animal use (footprints,
litter, deer browse, etc.).
Condition Class Structure
Condition Class rating descriptions applied to informal trails.
Surveying Tips
Use the pause and resume (log) capabilities of the GPS to prevent collecting extraneous
points at the beginning and end of a segment. Pause the logger when not moving; restart
it as you resume movement.
Working in pairs or using flagging tape and or pin flags will help when the IT network is
very dense. Flag sub regions on the ground and work through them individually.
o When working a dense network work small sub areas and utilize flags and
landmarks to delineate them; when collection has been completed within one
Class 1: Trail distinguishable; slight loss of vegetation cover and /or minimal disturbance of organic
litter.
Class 2: Trail obvious; vegetation cover lost and/or organic litter pulverized in primary use areas.
Class 3: Vegetation cover lost and/or organic litter pulverized within the center of the tread, some bare
soil exposed.
Class 4: Nearly complete or total loss of vegetation cover and organic litter within the tread, bare soil
widespread.
Class 5: Soil erosion obvious, as indicated by exposed roots and rocks and/or gullying.
Page 101
Appendix 2: Informal Trail Monitoring Manual
Page 99
flagged sub area, establish an adjacent sub area and collect it (e.g., 50-100 m long
on one side of a formal trail).
Collect IT anchor points when needed to aid in tying trail junctions to a specific location.
Use Trimble’s nest feature option.
Use the formal trail layer and paper maps as a reference.
Data Download and Backup
When finished collecting for the day, close the rover file on the Trimble GPS.
Connect the GPS to a computer with Pathfinder Office software (work within the
preexisting project directory for the current collection).
Transfer the rover files to the computer.
If an internet connection is available, download the differential correction files that
correspond to all new rover files and differentially correct them.
o Designate the source base station as the closest available geographically.
o Review the correction report as well as the corrected files for any errors or
processing problems. Open the files in GIS to visually inspect them each day.
o Ensure that the data were not removed during the correction procedure (e.g., due
to missing base station data, high PDOP, etc).
o Correction files that are not immediately available are generally made available
within a week or two.
Backup all data on a separate HDD and document all necessary metadata.
Recharge the GPS and external battery.
Keep a written field notebook record of all fieldwork, including field staff names, search
areas, dates/times, and computer filenames.
Page 102
Appendix 2: Informal Trail Monitoring Manual
Page 100
Editing Data
Data should be post-processed (differentially corrected and converted to GIS appropriate
format) using GPS software (e.g., Trimble’s Pathfinder Office with conversion to ArcMAP
Shapefiles). Merge output files into a single file representing the Informal trail network.
Informal trail data requires editing due to the nature of GPS data collection. GIS staff should
edit the data to clean up and improve the accuracy of the informal trail network. Tips for
doing this work:
Use imagery and ancillary GIS datasets to help visualize the local environment.
Move trail segment endpoints (minimally) to establish connectivity to other informal
segments, recreation sites, and formal trails.
o Use the anchor points layer for establishing junction locations.
Use snapping and zoom tools to assist.
Once the network is close, a ―clean‖ or ―build‖ procedure can be used (adjust fuzzy
tolerance and dangle length as needed).
Before Editing After Editing
Page 103
Appendix 2: Informal Trail Monitoring Manual
Page 101
Figure 1. Trail width is defined as the most visually obvious outer boundary of trampling-related
disturbance that receives the majority (>95%) of traffic. These boundaries are defined by
pronounced changes in ground vegetation height (trampled vs. untrampled), cover, composition,
or, when vegetation cover is reduced or absent, by disturbance to organic litter (intact vs.
pulverized) or lichen.
Page 104
Appendix 2: Informal Trail Monitoring Manual
Page 102
Data Dictionary
Informal Trail:
LineFeature
Label1=Average Width
Condition Class: Menu; Normal, Normal
1 2 3 4 5 Other
Average Width=Numeric, Decimal Places=0
Minimum=1,Maximum=144,DefaultValue=8 Normal, Normal
Segment#:
Numeric, Decimal Places=0
Minimum=0, Maximum=500, Default Value=1, StepValue=1 Normal, Normal
Comment:
Text, Maximum Length=30 Normal, Normal
IT Anchor Point:
Feature
Label1=Number
Label2=Comment
Number=Numeric Decimal Places=0
Minimum=0,Maximum=500, DefaultValue=1, StepValue=1 Normal, Normal
Comment:
Text, Maximum Length=30 Normal, Normal
Page 105
Page 103
APPENDIX 3: GUIDANCE FOR MANAGING INFORMAL TRAILS
Page 106
Appendix 3: Guidance for Managing Informal Trails
Page 104
Guidance for Managing Informal Trails
Jeff Marion, USGS Research Scientist
([email protected] , 540-231-6603)
The development, deterioration and proliferation of visitor-created informal trails in protected
areas can be a vexing management issue for land managers. Formal trail systems never provide
access to all locations required by visitors seeking to engage in a variety of appropriate
recreational activities. Traveling off-trail is necessary to engage in activities such as nature study,
fishing, or camping. Unfortunately management experience reveals that informal trail systems
are frequently poorly designed, including ―shortest distance‖ routing with steep grades and
alignments parallel to the slope. Such routes are rarely sustainable under heavy traffic and
subsequent resource degradation is often severe. Vegetation impacts include trampling damage
leading to changes in species composition, potential introduction and dispersal of non-native
plants, and the loss of vegetation cover. Soil impacts include the pulverization and loss of
organic litter, and exposure, compaction, and erosion of soil. Soil deposition in streams,
disturbance to wildlife, and damage to historic resources are also possible. Creation of multiple
routes to common destinations is another frequent problem, resulting in ―avoidable‖ impacts
such as unnecessary vegetation/soil loss and fragmentation of flora/fauna habitats.
This guidance is provided to assist land managers and volunteer trail maintainer organizations in
evaluating informal trail impacts and in selecting the most appropriate and effective management
responses.
Adopt a Decision-Making Process
The management of informal trail networks can benefit from application of a planning and
decision-making process or framework that includes public dialogue and input. Decisions
regarding impact acceptability and the selection of actions needed to prevent recreation-related
resource impacts fall into the domain of carrying capacity decision-making. The NPS defines
carrying capacity as ―the type and level of visitor use that can be accommodated while sustaining
the desired resource and visitor experience conditions in the park‖ (NPS 2006). The NPS applies
the Visitor Experience and Resource Protection (VERP) decision-making framework (NPS
1997), while the U.S. Forest Service applies the Limits of Acceptable Change (LAC) framework
(Stankey et al. 1985).
These formal frameworks direct managers to prescribe objectives for biophysical and social
conditions they intend to achieve for specific park zones. Numerical standards of quality are
established for each indicator and zone to define the critical boundary line between acceptable
and unacceptable conditions, establishing a measurable reference point against which future
conditions can be compared through periodic monitoring. These frameworks incorporate an
adaptive management decision process, whereby managers can apply actions, evaluate their
success, and when needed, apply alternative actions as a follow-up until management objectives
are achieved. A simplified framework known as Protected Area Visitor Impact Management
(PAVIM) employs an expert panel and problem analysis process (Figure 1) that requires less
data (Farrell & Marion 2002). The problem analysis process, which is particularly applicable and
useful in informal trail management decision-making, is described below.
Page 107
Appendix 3: Guidance for Managing Informal Trails
Page 105
Problem Analysis Process
Assemble a team of knowledgeable and experienced individuals with expertise in recreation
resources management, visitor management, social science, site and trail management, natural
resource management, and interpretation. Visit the site where the impacts or problems are
occurring and apply this problem analysis process to guide discussions.
Identify and Evaluate the Problem
The problem analysis begins by developing the group’s collective knowledge of the area,
amounts and types of recreational uses, and the resource and social problems currently present.
Group members most knowledgeable about these topics are asked to share their knowledge with
the group. The sharing of differing perspectives, land management agency, trail club, recreation
representatives, is encouraged. The significance of the problems and degree to which current
conditions are unacceptable are considered when deciding whether management actions are
needed. Next, participants with the longest experience in the area are asked to relate the history
of the problems or impacts. Previous management actions are described and their effectiveness
discussed and evaluated, including why implemented actions were or were not effective.
The core of a good problem analysis is a thorough evaluation of a problem’s underlying causes
and identification of factors that influence impact severity. For example, substantial off-trail
traffic may be the cause for excessive vegetation loss but fragile ground vegetation and poorly
marked or maintained formal trails may significantly contribute to the creation of unacceptably
extensive or impacted informal trails. The relative influence of three groupings of factors: use-
related, environmental, and managerial, should be examined. An improved understanding of
these causes and factors are essential to evaluating alternative actions and selecting effective
actions.
Identify and Evaluate Strategies and Actions
Step two involves brainstorming by team members to list and then evaluate a diverse array of
management strategies and actions. Following list development, study team discussions should
focus on careful evaluations of the advantages and disadvantages of each action. A number of
important attributes should be considered, including potential effectiveness, management
feasibility, costs to visitor freedom and satisfaction, expected visitor compliance, and others as
appropriate.
The final step is selecting one or more preferred actions suggested for implementation. Careful
consideration of the history of impacts and their management, the desired resource and social
conditions for the area, and factors which either cause or influence impacts can help guide more
objective and effective decision-making. Management objectives or desired condition statements
will suggest the appropriateness of alternative actions relative to the natural, social, and
managerial settings of the zone the area is situated within.
Generally, initial actions are feasible, have a low ―cost‖ to visitors, and are judged to have a good
chance at effecting the desired change in conditions. For example, indirect actions such as
education or site maintenance should be considered before regulatory or site development actions
as they are less obtrusive and do not compromise visitor freedom. More restrictive, expensive,
and/or obtrusive actions are generally deferred until justified by the failure of one or more
Page 108
Appendix 3: Guidance for Managing Informal Trails
Page 106
preceding actions. However, severe or unacceptable impacts may warrant bypassing such light-
handed efforts in favor of actions necessary to achieve more effective or immediate results.
Alternative actions should be identified for potential implementation in the event that initial
actions are ineffective.
For each action, identify likely individuals or organizations responsible for implementing the
action and describe the necessary resources they will require. An implementation schedule
should also be developed and efforts to obtain funding and staff initiated. At this time it is also
useful to consider how a planned action should be monitored for evaluating effectiveness. For
example, an accurate GPS survey of informal trail networks with condition class assessments
provides a baseline for future comparison and should be conducted prior to implementing
corrective actions.
Table 1. Problem analysis for managing resource and social impacts related to visitation. I. Identify and Evaluate the Problem
Describe area and use(s) - provide background information about the area, facilities, and
visitor use.
Describe problem(s) - briefly describe the facility, resource and social impact problems that
are occurring.
Problem significance - consider if and why the impacts are significant or unacceptable to land
managers and protected area visitors
Previous management actions - describe the history of the problems and previous actions;
discuss the effectiveness of these actions and why they did or didn’t work.
Causes and influential factors - discuss the underlying causes for the impacts and the role of
non-causal but influential factors that may intensify impacts. Consider use-related factors
(type and amount of visitor use, visitor behavior and motives, use density), environmental
factors (soil and vegetation type, environmental sensitivity, topography), and managerial
factors (siting, design, construction, and maintenance of facilities, visitor management).
II. Identify and Evaluate Strategies and Actions
List potential strategies and actions - create a comprehensive list of appropriate and
potentially effective management strategies and actions. Strategies are broad approaches (e.g.,
modify visitor behavior, manage sites and facilities) and actions are the specific means used to
implement a strategy (e.g., educate visitors, relocate campsites).
Evaluate strategies and actions - discuss and evaluate the following attributes for each
strategy and action: potential effectiveness, management feasibility (cost, staffing, long-term
maintenance), advantages/disadvantages (e.g., costs to visitor freedom), expected visitor
compliance, etc.
Formulate recommendations - through group discussion, develop and write recommendations
that reflect the group’s consensus views. Describe the recommended action or group of actions
to implement first and what might be tried next if these are ineffective.
Page 109
Appendix 3: Guidance for Managing Informal Trails
Page 107
Problem Definition: For informal trail management decision-making, an inventory of the
informal trail network within an area of management concern is particularly useful. If GPS
devices and expertise is available, a simple inventory technique is to conduct a walking GPS
survey, provided the terrain and forest canopy permit accurate GPS use. GIS software can input,
map and analyze the data, providing a visual display of the informal trail network relative to
designated trails, roads and other resource features. Computation of the lineal extent of the
informal trail network is also possible. If GPS devices cannot be used then an inventory can be
made by hand-sketching informal trails onto large-scale maps with lengths assessed by pacing or
a measuring wheel.
Where possible, managers may also wish to consider various options for assessing the condition
of the informal trails. Many options, ranging from simple condition class evaluations, to trail
width and depth measurements, or detailed assessments of soil and vegetation loss are possible.
Guidance for assessing trail conditions may be found in the scientific literature (Cole 1983,
Leung & Marion 2000, Marion & Leung 2001). Some rapid assessment ―condition class‖ options
are included at the end of this document or contact the author for examples of alternative
monitoring protocols and manuals. An objective assessment of informal trail conditions can
produce quantitative data for indicator variables that can be summarized to characterize current
trail conditions, or when replicated, to monitor changes in trail conditions over time. Such data
can be used in the previously described formal or informal adaptive management decision-
making frameworks.
Evaluate Impact Acceptability: The acceptability of informal trail impacts should be evaluated
according to park or management zone objectives. Informal trails located in pristine areas where
preservation values are paramount are less acceptable than when located in areas that are
intensively developed and managed for recreation use. Trails in areas with sensitive cultural and
archaeological resources are particularly unacceptable if they threaten such irreplaceable
resources.
Environmental factors: Informal trails located in sensitive or fragile plant/soil types, near rare
plants and animals, or in critical wildlife habitats are less acceptable than when located in areas
that are resistant to trampling damage and lack rare species. Informal trails that directly ascend
steep slopes and/or will easily erode are less acceptable than trails with a side-hill design.
Informal trails prone to muddiness and widening are less acceptable, as are trails that may
contribute soils to water resources.
Use-related factors: Why is a trail in a particular location and what are the visitors trying to
access? Which recreation activities are most responsible for creating informal trails? What are
the motives responsible for off-trail hiking? Are some impacts avoidable? For example, informal
trail impacts related to a poorly marked formal trail or that result from visitors trying to
circumvent muddiness or severe erosion are more easily avoided and should be targeted first. It
is not uncommon to find several ―duplicative‖ informal trails in close proximity to each other
accessing a common destination. Impacts caused by visitors seeking to shortcut a longer, more
resistant route are unacceptable, as are impacts caused by visitors who could alternately access
their intended destination by staying on resistant durable surfaces (e.g., rocks or gravel)
(www.LNT.org). Informal trails resulting from illegal or inappropriate types of uses are less
acceptable than if they are caused by permitted uses.
Page 110
Appendix 3: Guidance for Managing Informal Trails
Page 108
A careful consideration of these and other relevant factors (e.g., visitor safety) can assist
managers in making value-laden decisions regarding the acceptability of informal trail impacts.
The acceptability of these impacts, in turn, guides decisions about which trails should be left
open, rerouted, or closed, and selection of appropriate and effective management interventions.
Selection of Management Strategies: The problem analysis process can assist managers in
considering and evaluating a diverse array of potential management strategies and actions. Note
that some degree of degradation to natural resources is an inevitable consequence of recreation
use, requiring managers to balance recreation provision and resource protection mandates. Roads
and formal trails can never provide complete access to the locations visitors wish to see, hence,
some degree of informal trail development is inevitable and must be tolerated. The challenge for
managers is to evaluate the impacts in light of recreation provision and resource protection
objectives, and apply professional judgment to determine which impacts are unacceptable and
require management action.
The following section describes four general strategies for managing informal trail impacts: 1)
Improve management of formal trails, 2) Ignore or formalize informal trails, 3) Maintain
informal trails, and 4) Close and restore unacceptable trails,.
Improve Management of Formal Trails
If formal trail problems are contributing to the development of informal trails, then addressing
such problems is generally one of the more effective and efficient options available to managers.
Four problems are common. Make sure that formal trails are well-marked in some distinctive
fashion so that visitors can clearly distinguish between formal and informal trails – this is often
very confusing to most visitors. In rocky areas, paint blazes may be needed on rocks rather than
trees because the terrain demands constant attention to the immediate trail tread. ―Overblazing‖
or clearly defined trail borders (e.g., spaced rocks, logs, or scree walls) may be necessary in
some tricky areas. Boardwalks, low symbolic fencing, or higher rustic fencing are more effective
but more visually obtrusive and costly. The treads of formal trails should be the most attractive
location for walking, maintained to be free of muddiness or deeply eroded ruts with exposed
roots and rocks. When braided or multiple parallel treads occur managers should define a single
intended tread throughout.
Ignore or Formalize Informal Trails
Some informal trails may have reasonably sustainable design attributes and access locations,
such as vistas or campsites (hikers), water resources (fishermen), or cliffs (climbers) that are
acceptable to land managers. When visitor access to these locations is appropriate, such trails
should generally be left open as informal trails or even designated and managed as formal trails.
They serve an important resource protection function by concentrating visitor traffic on a narrow
tread and protecting adjacent vegetation from trampling damage. Recreation ecology studies
have consistently found a curvilinear relationship between the amount of traffic and trampling
impacts (Leung and Marion 2000). The majority of trampling impact occurs with relatively low
levels of trampling; once a trail is established, further trampling impact is greatly minimized by a
―concentration‖ strategy that focuses all further traffic to its barren tread. An alternate
―dispersal‖ strategy is only effective under conditions of very low use and/or when traffic can be
confined to durable substrates (e.g., rock, gravel) or vegetation (grasses/sedges).
Page 111
Appendix 3: Guidance for Managing Informal Trails
Page 109
Sometimes a portion of such informal trails may require a reroute to improve the sustainability of
an alignment, such as a very steep section aligned with the fall-line (parallel to the landform
slope). An experienced trails professional should conduct a review and provide recommendations
for informal trails left open to use. Generally trail alignments should favor side-hill over fall-line
alignments, avoid grades over 15%, and favor rocky substrates and non-vegetated or grassy
groundcover. As with formal trails, leaving an informal trail with a poor ―impact susceptible‖
alignment is rarely a preferred long-term solution. Site development actions, such as graveling or
installation of water bars and rock steps, could be applied but these are generally less appropriate
on informal trails and would be unnecessary on a well-designed alignment. In most instances,
relocation to an improved alignment will be a more cost-effective and sustainable long-term
solution, even though pristine terrain is affected.
Due to the relatively poor trail design skills of visitors, it may even be necessary to replace
several non-sustainable informal trails with a new well-designed informal or formal trail (with
appropriate environmental reviews). An objective evaluation of the aggregate or cumulative
impacts, including the total area of trampling disturbance and soil loss, will generally support
such a decision. However, this option should only be attempted when managers are relatively
certain of their ability to effectively close the pre-existing informal trails.
Maintain Informal Trails
Historically, most park managers have not maintained informal trail networks. However,
extending maintenance work to those trails with reasonably sustainable designs left open to use
can substantially reduce impacts. For example, managers can piece together a single sustainable
route in an area with numerous braided trails and trim obstructing vegetation, subtly enhance
tread drainage, or install natural-appearing rockwork on steep slopes. These actions will
effectively encourage use and reduce impacts on the sustainable route while reducing use and
encouraging natural recovery on alternate informal trail segments. Additional actions, discussed
in the following section, can be applied to discourage their continued use.
Close and Restore Unacceptable Trails
Informal trails with poor, non-sustainable design attributes, trails that threaten sensitive
resources, or unnecessary trails with duplicative routings should generally be closed and
rehabilitated. Managers should recognize that successful trail closures and restoration are rare
and require substantial and sustained management effort. The principal reason for low success
rates is that while trampling impacts occur rapidly with low levels of use, vegetative and soil
recovery occurs very slowly and complete recovery is prevented unless nearly all traffic is
removed from treads for several consecutive years. A substantial restoration program involving
the addition of soil and plantings of native species, with watering as needed to ensure survival,
can hasten natural recovery. However, care must be taken to apply such intensive work only
when managers are reasonably certain that effective measures are in place to prevent further
trampling of the restoration work.
Selection of Management Actions: An adaptive management program involving education and
site management actions is suggested when implementing strategies. Management experience
and research have demonstrated that integrating site management and educational actions
consistently achieve the highest rates of success. Site management actions are needed to mark
and keep visitors on formal trails or to block or hide informal trails; educational actions are
Page 112
Appendix 3: Guidance for Managing Informal Trails
Page 110
needed to inform visitors of the impacts associated with off-trail traffic and what managers
would like them to do to protect natural and cultural resources. Visitors frequently misunderstand
site management actions that lack signs placed to convey information about impacts of concern
and management intent. In the absence of site management actions, visitors may choose to
disregard a prompter sign if a well-used informal trail branches off to what looks like an
appealing vista.
Educational Actions
An educational component is often critical to communicate a clear rationale for an action – for
example, that significant resource impacts can occur in some areas if visitors travel off
designated trails. A message with a rationale should be followed by a plea for visitors to remain
on formal trails, which need to be clearly designated through site management actions (e.g.,
blazing, symbolic markers, cairns) to distinguish them from informal trails. Social science
research and theory has found that signs with a compelling rationale and clear behavioral plea
are more effective than simple ―do‖ and ―do not‖ messages (e.g., ―Please Stay on Designated
Trails to Preserve Sensitive Vegetation‖) (Cialdini 1996, Cialdini et al. 2006, Johnson &
Swearingen 1992, Marion & Reid 2007, Vande Kamp et al. 1994, Winter 2006). Such literature
should be consulted to improve the efficacy of educational messaging.
Some principal goals that educational efforts seek to communicate include: 1) trampling impacts
represent a significant threat to resource protection in some areas, 2) that off-trail traffic has
created informal trails that managers would like to close and restore, 3) remaining on formal
trails avoids these impacts, 3) formal trails can be distinguished from informal (visitor-created)
trails by distinctive markings, and 4) even small amounts of continued traffic prevents the
recovery of informal trails that managers are seeking to close and restore. Unfortunately, as you
might expect, this is a lengthy and complex educational message that is challenging to
communicate effectively. Research suggests that more complex messages are more effectively
communicated personally, rather than on signed or in brochures. Regardless, examples of signs
that seek to accomplish these objectives and that have received NPS approval for use are
depicted in Figure 1. Note the inclusion of the ―no-step‖ icons that communicate the message
with just a glance and are understandable by children and non-English speaking visitors.
Generally the larger informative signs are placed in conspicuous locations near trailheads and the
more numerous ―prompter‖ signs are placed just beyond junctions with informal trails.
Site Management Actions
A variety of site management actions are available for closing informal trails. Close lightly used
trails by actions that naturalize and hide their tread disturbance, particularly along initial visible
sections where visitors make the decision to venture down them. Effective actions include raking
organic debris such as leaves onto the tread, along with randomly placed local rocks, gravel, and
woody debris designed to naturalize and hide the tread. These actions also lessen soil erosion and
speed natural recovery. On trails that have been effectively closed, transplanting plugs of
vegetation at the beginning of wet seasons can hasten natural recovery. Revegetation work
conducted before successful closure is achieved can be a frustrating waste of time and materials
if visitors continue use of the trail and trample the transplanted vegetation.
Page 113
Appendix 3: Guidance for Managing Informal Trails
Page 111
Figure 1. Examples of informative trailhead sign (left) and trailside prompter signs that can assist
management efforts in closing informal trails.
For well-used trails, such work generally cannot fully disguise the disturbed substrates and
vegetation so additional measures are necessary for effective closures. Construct a visually
obvious border along the main trail, such as a row of rocks or a log, to communicate an implied
blockage for those seeking to access the closed trail. Alternately, embed large rocks or place
large woody materials or fencing to obstruct access at the entrance to closed trails to fully clarify
management intent. Even temporary 2 ft tall post and cord symbolic fences can communicate the
importance of closures and effectively deter traffic (Figure 2) (Park et al. 2006). Taller plastic
fencing (preferably in green or brown) is also easy to transport and install to discourage traffic on
trails that prove more difficult to close. However, fencing is generally perceived as visually
obtrusive and inappropriate in more primitive settings.
Placing rocks or woody debris that physically obstructs traffic beyond the beginning of closed
trails may be ineffective if visitors are able to circumvent these by walking around them. This
can result in new trampling and trails parallel to the ―closed‖ trail – a significant problem in
areas with sensitive or rare vegetation. In such areas it is better for hikers who ignore closures to
remain on the ―closed‖ tread than to create new treads on each side (Johnson et al. 1987). If the
trail is in sloping terrain its closure may require the addition of soil to fill ruts and reestablish the
original surface contour, and organic litter and vegetation to keep the soil from eroding. Finally,
integrating site management work with temporary educational signs may be necessary to obtain a
level of compliance that allows vegetative recovery. Also, consider signs to communicate the
location of a preferred alternate route when visitors are seeking to reach a particular destination
and their only visible access trail is closed.
Conclusions: Informal trail management actions should be implemented as part of an ongoing
adaptive management program Experimentation will be necessary to refine site management
Page 114
Appendix 3: Guidance for Managing Informal Trails
Page 112
procedures that are appropriate in each management zone or location. Some form of periodic
monitoring is critical to program success. A 5-year interval could be sufficient for monitoring
with quantitative procedures, but annual informal evaluations are needed to effectively guide the
application of management actions.
Objective monitoring will be needed if any potentially controversial management actions may be
needed (e.g., use restrictions or high fencing). In exceptionally high use areas with sensitive
resources there is a good probability that such actions will be necessary. For example, a
combination of signs and restoration work may be able to keep 95% of visitors on a designated
trail but 5% of 2000 visitors/day is 100 visitors/day, a level of trampling that is sufficient to both
create and maintain informal trails. Tall fencing or a regulatory sign that prohibits use of the
closed trail and threatens fines may be necessary on trails that are particularly difficult to close.
Such situations also indicate a need for further dialogue with trail users to discover their motives
and a review of whether the formal trail system should be extended or modified.
Figure 2. Low symbolic post and rope fencing (left) and high fencing designed to physically
obstruct access (right).
Regardless, periodic monitoring provides feedback for gauging the success of management
interventions in keeping conditions within acceptable limits. A documented failure of one
intervention can be used to justify the use of a more obtrusive or expensive intervention.
Literature Cited
Cialdini, R.B. 1996. Activating and aligning two kinds of norms in persuasive communications.
Journal of Interpretation Research 1(1): 3-10.
Cialdini, R.B., Demaine, L.J., Sagarin, B.J., Barrett, D.W., Rhoads, K. & Winter, P.L. 2006.
Managing social norms for persuasive impact. Social Influence 1(1): 3-15.
Page 115
Appendix 3: Guidance for Managing Informal Trails
Page 113
Cole, D.N. 1983. Assessing and monitoring backcountry trail conditions. USDA Forest Service
Research Paper INT-303. 10 p.
Johnson, D.R. & Swearingen, T.C. 1992. The effectiveness of selected trailside sign texts in
deterring off-trail hiking, Paradise Meadow, Mount Rainier National park. In: H.H.
Christensen, D.R. Johnson, and M.M. Brooks (eds.) Vandalism: Research, Prevention and
Social Policy (General Technical Report PNW-GTR-293) (pp. 103-119). Portland, OR:
USDA Forest Service, Pacific Northwest Region.
Leung, Y.F. & Marion, J.L. 2000. Recreation impacts and management in wilderness: A state-of-
knowledge review. In D.N. Cole & S.F. McCool (Compilers), Proceedings: Wilderness
science in the time of change (pp. 23-48). Ogden, UT: USDA Forest Service, Rocky
Mountain Research Station.
Marion, J.L. & Leung, Y.F. 2001. Trail resource impacts and an examination of alternative
assessment techniques. Journal of Park & Recreation Administration 19(1):17-37.
Marion, J.L. & Reid, S.E. 2007. Minimising visitor impacts to protected areas: The efficacy of
low impact education programmes. Journal of Sustainable Tourism 15(1): 5-27.
National Park Service. 1997. The Visitor Experience and Resource Protection (VERP)
framework: A handbook for planners and managers. Publication No. NPS D-1215. Denver,
CO:USDI National Park Service, Denver Service Center.
Park, L.O., Marion, J.L., Manning, R.E., Lawson, S.R. & Jacobi, C. 2008. Managing Visitor
Impacts in Parks: A Multi-Method Study of the Effectiveness of Alternative Management
Practices. Journal of Parks and Recreation Administration 26(1): 97-121.
Stankey, G.H., Cole, D.N., Lucas, R.C., Peterson, M.E., Frissell, S.S. & Washburne, R.F. 1985.
The Limits of Acceptable Change (LAC) System for wilderness planning. USDA Forest
Service General Technical Report INT-176.
Vande Kamp M., Johnson, D. & Swearingen, T. 1994. Deterring Minor Acts of Noncompliance:
A Literature Review. Tech Rep. NPS/PNRUN/NRTR-92/08. Cooperative Park Studies unit
College of Forest Resources, AR-10, University of Washington.
Winter, P.L. 2006. What is the best wording to use on signs? The impact of normative message
types on off-trail hiking. Journal of Interpretation Research 11(1): 35-52.