SKYWORKS SOLUTIONS, INC. Pretreatment Methods to Ultrafiltration System Prolonging the Life of the UF membranes Diana Wu Wong 7/17/2015 Internship provided by the University of California, San Diego and Skyworks Solutions, Inc.
Transcript
SKYWORKS SOLUTIONS, INC.
Pretreatment Methods to Ultrafiltration System Prolonging the Life of the UF membranes
Diana Wu Wong
7/17/2015
Internship provided by the University of California, San Diego and Skyworks Solutions, Inc.
W u W o n g | 1
Table of Contents Abstract ........................................................................................................................................................ 3
Data and Analysis ......................................................................................................................................... 4
Data .......................................................................................................................................................... 7
Possible Solutions ...................................................................................................................................... 11
Appendix A ................................................................................................................................................. 27
Appendix B ................................................................................................................................................. 28
Appendix C ........................................................................................................................................... 29-‐38
W u W o n g | 3
Abstract Membrane technology for water filtration has been developing since the 1990’s, and over the past decade it has spread and widely accepted as a feasible alternative to conventional water treatment. This technology is used for a variety of purposes ranging from potable water treatment, pharmaceutical, environmental and in this case semiconductor production between other industry applications. The specific membrane filtration used for drinking water and clean water treatment is the low pressure membranes which includes microfiltration and ultrafiltration systems.
Both technologies provide low carbon foot print, lower cost and better water quality than the conventional system. While the conventional system is highly dependent on the source water quality, the membrane filtration system is able to remove pathogens and other suspended matter independent to the source water conditions. The mechanism for removal of particulate matter in a membrane is a physical sieving process where particulates larger than the pore size of a membrane are physically excluded from the water passing through the membrane surface1. This process does not rely on the performance of a reactor, chemical dosing or any alterations for the operation of the membranes. It is flexible to the flow rates, pH levels and temperature fluctuations of the water source. However, there are limitations: the main concern is the membrane fouling, which is described as the accumulation of particles on the surface and inside the pores of the membrane surface2. The source of membrane fouling may be silt, bacteria, organic fouling or low feed water quality in general. The effect of membrane fouling on the efficiency of the membrane reduces the water quality and membrane lifetime. Furthermore, it reduces the flux, in which requires the system to increase its pumping intensity to maintain a consistent volume of water being treated, hence increasing energy consumption. The specific parameter used to measure the rate of membrane fouling is called SDI (Silt Density Index), in which will be further explained in the next section.
In the specific case of this proposal, the data acquired on the quality of the water from the ultrafiltration system HydraCAP 60 used by the company Skyworks Solutions Inc., Mexicali, shows rapid rate of membrane fouling, requiring the company to frequently change the membranes as the demand of water increases. The goal of the proposal is to explore different sustainable and affordable pretreatment methods for the pre-‐existing ultrafiltration system to improve its feed water quality and prolong the lifetime of the membranes. The methods include the following: Coagulation, Biofiltration, Mechanic Filtration and reuse of the old HydraCAP 60 membranes. The specific parameters in which will be used to compare between each method and to assess their feasibilities will be the following: Energy usage, water usage, speculation on membrane performance, efficiency, and water quality.
The results showed that the most ideal situation would be Case 1 of Amiad SAF 1500, in which most feed water particle sizes are larger than 10 microns. Case 1 Amiad SAF 1500 would save a total of $422,938 USD, an increase of 44.8% in savings. The second most ideal situation would be Case 3 Amiad SAF 1500, in which all particles sizes are equally distributed having an efficiency of 50% and would need 4 replacements of membranes per year. Case 3 Amiad SAF 1500 would save a total of $368,629 USD, an
W u W o n g | 4
increase of 41.5% in savings. Then, in the case of Pre-‐UF, with a projection of 2-‐4 replacements per year, would have a cost saving ranging from $247,463 to $301,773 USD, an increase of 5.8-‐22% in savings. At last Case 2 of the Amiad SAF 1500, in which most particles are smaller than 10 microns, has a projection of 8 replacements per year (only 1 membrane less than the current membrane consumption). The cost saving would be $287,164 USD, an increase of 10.2%.
W u W o n g | 5
Introduction A membrane filtration is a system in which hydrostatic pressure forces a liquid against a
semipermeable membrane composed of materials capable to restrain certain particles and substances. It is mainly used for the removal of bacteria, viruses, pathogens organic and inorganic materials. This technique is mainly used for drinking water treatment, waste water treatment, sea water treatment, agriculture and it continuously expands to other industries. There are 4 main types of membrane: Microfiltration (0.1-‐10 microns), Ultrafiltration (0.01-‐0.5 microns), Nanofiltration (0.001 microns) and Reverse Osmosis (0.0001 microns). Each type of membrane has fundamentally the same functionality. Nevertheless they differ from each other with their different size of pores. Hence, each type can retain different sizes of molecules. This case focuses mainly in the functionality of the ultrafiltration system3.
Ultrafiltration (UF) uses hollow fibers of membrane material and feed waters from inside the shell through the membrane to the outside. Suspended solids and solutes of higher molecular weight are retained, while water with low molecular weight solutes passes through the membrane. Although its pore size is approximately 0.01 micron, it cannot remove dissolved substances as efficiently as the Reverse Osmosis (0.0001 micron). Therefore ultrafiltration is often used as the pretreatment for Reverse Osmosis (R.O) to reduce the membrane fouling rate of the R.O and prolong its membranes’ lives. Similarly, a pretreatment for the UF system is often used in order to prolong its membranes’ lives.
There are two types of ultrafiltration membranes: Ceramic Membranes and Polymeric Membranes. The Polymeric Membrane also referred as the Multibore Membrane includes 7 single capillaries combined into one fiber and it is PES blended with strong hydrophilic polymer. The comparison between the Ceramic Membranes and the Polymeric Membranes is shown below with Table 1. From previous studies, at higher flux numbers the Polymeric Membrane starts fouling prior to the Ceramic Membranes. However, when compared annual cost, the Polymeric Membrane proved to be more cost effective. This paper will specifically focus on the Polymeric Membranes, in which it is used by Skyworks UF system HydraCAP 60.
Ceramic Membranes Polymeric Membranes -‐ Superior mechanical strength -‐ One “piece” per element -‐ Good chemical resistance -‐ High capital costs -‐ Little operational experience
-‐ Subject to mechanical damage -‐ Bundles of hundreds of hollow fibers -‐ Polymer can be attached -‐ low cost/ gpm capacity -‐ Ubiquitous
Table 1: Comparison between Ceramic Membranes and Polymeric Membranes
There are two parameters to measure the quality of water: Turbidity and Silt Density Index. Turbidity refers to the cloudiness or haziness of a fluid caused by large numbers of individual particles that are generally invisible to the naked eye4. The potential causes for turbidity includes growth of phytoplankton or contaminants from agriculture, construction and mining.
W u W o n g | 6
The Silt Density Index, referred as SDI, measures the time required to filter a fixed volume of water through standard 0.45 µm pore size microfiltration membrane with a constant given pressure of 30 psi. Silt is composed by suspended particulates of all types that accumulate on the membrane surface. Sources of silt include organic colloids, iron corrosion products, precipitated iron hydroxide, algae, and fine particular matter5. The meaning for each SDI value is shown in Table 2 below:
SDI < 1 Several years without colloidal fouling SDI < 3 Several months between cleaning SDI 3-‐5 Particular fouling likely a problem frequent cleaning SDI > 5 Unacceptable, additional pre-‐treatment needed. Table 2: SDI value ranges and the estimate life length.
Despite having a similar significance, the SDI and the turbidity differ greatly. The SDI is the fouling potential of suspended solids, whereas the turbidity is the measurement of the amount of suspended solids. There’s no evidence that show the direct correlation between them. However, when feed turbidity <1 NTU, correspondingly the membranes show very low fouling at a feed SDI of less than 56. In this case, both the turbidity and the SDI of the flows will be measured and analyzed. And according to the trend observed either the SDI or the Turbidity will be used as a reference for membrane longevity.
As mentioned before, the ultrafiltration system that Skyworks uses is the HydraCAP 60 as the pretreatment to reverse osmosis. Compared to the conventional pretreatment, HydraCAP allows higher fluxes for RO and NF (Nano Filtration) systems while maintaining longer intervals between cleanings. The HydraCAP 60 is a Capillary Ultrafiltration Module with Hydrophilic Polyuethersulfone as the membrane polymer with a pore size of 0.02 micron. The filtrate flow ranges from 12.1-‐ 29.5 gpm; the filtrate turbidity is less than 0.07 NTU; the typical filtrate flux ranges from 35-‐85 gfd with a maximum applied feed pressure of 73 psig and a maximum transmembrane pressure of 20 psig. The maximum operating temperature 104 °F (40 °C) and the pH operating range is 4.0-‐10.0. It is worthy to note that the backwash flux is 100-‐150 gfd with duration of 30-‐60 seconds for every hour wash. The purpose of the backwash is to clean out the deposits inside the membrane. This is done by using the backwash pump to draw the filtrate from the filtrate tank and force water from outside the membrane to inside to reject. The quantity of water used to backwash is crucial for the measurement for the conservation of water and energy. For further information regarding the HydraCAP 60 visit the “Exhausted HydrCAP 60” in the Possible Solutions section.
This proposal will investigate the 4 different options for the UF system pretreatment (Coagulation, Biofiltration, Mechanical Filtration and reuse of HydraCAP 60 system) using the following parameters to assess the most feasible and sustainable option for Skyworks specific case: Energy usage, water usage, speculation on membrane performance, efficiency, and water quality that is both the Turbidity and SDI test. Furthermore it will analyze previous trends on the behavior of the membranes in order to incorporate the new recommended treatment and optimize the production.
W u W o n g | 7
Data and Analysis Data of Feed Water to the UF system
Skyworks uses two HydraCAP 60 UF systems. The first test performed in June 26th, 2015 (referred as Week 1), the average of the flow was 130 ± 5 gpm feed water with 55 ± 5 NTU from the exhaust water of both the “Sawing” and “Singulado” process as a pretreatment for the Reverse Osmosis. The feed water first went through a basic pre-‐filter of pore size 100 microns prior to the UF system, removing approximately 4 NTU of high weight molecules. Then, it fed into the UF system with around 50± 5 NTU and came out with 0.20 ± 0.10 NTU of product and 120± 10 NTU of exhaust (See Table 3). When the SDI was tested, the SDI-‐15 (500ml) showed a value within an optimal range of 0.6 (see Table 4).
06/26/2015 I II Product (gpm) 127 121 exhaust (gpm) 7 8 Pre-‐filter (NTU) 53 53 Post-‐filter (NTU) 50 50
Total 0.18 0.21 Rechazo 326 160 Table 3: Week 1 UF turbidity data Table 4: Week 1 UF SDI data
On June 29th, the SDI for the UF system was tested over-‐range. Therefore during the second test performed on July 2nd, 2015(referred as Week 2), only the first UF system was operating while the second UF system was being chemical washed. The average of the flow was 150 ± 5 gpm feed water with 57 NTU before the pre-‐filter and 53 NTU when fed into the UF system. The product had a turbidity of 0.23 NTU and an exhaust of 104 NTU (See Table 5). When the SDI was tested, the SDI-‐15 (500ml) showed a value within an acceptable range of 1.9 (see Table 6).
07/02/2015 I II Producto (gpm) 145 N/A Rechazo (gpm) 7 N/A Pre-‐filtro (NTU) 57 N/A Post-‐Filtro (NTU) 53 N/A
Total 0.23 N/A Rechazo 104 N/A Table 5: Week 2 UF turbidity data Table 6: Week 2 UF SDI data
On the third test, performed on July 6th, 2015, both systems were operating. The average of the flow was 130 ± 5 gpm feed water with 60 ± 3 NTU before the pre-‐filter and 58 ± 2 NTU when fed into the UF system. The product had a turbidity of 0.37 NTU and an exhaust of 155 ± 15 NTU (See Table 7). When the SDI was tested, the SDI-‐15 (500ml) showed a value within an acceptable range of 0.9 (see Table 8).
However, when the SDI test for the R.O feed was performed, the results showed over-‐range. Although the SDI test for the UF systems showed to be acceptable value, the turbidity showed otherwise. Skyworks’ engineers concluded to chemically wash both UF system racks.
07/06/2015 I II Producto (gpm) 125 120 Rechazo (gpm) 9 7 Pre-‐filtro (NTU) 58.4 63.1 Post-‐Filtro (NTU) 57 61.3
Total 0.37 0.36 Rechazo 170 138 Table 7: Week 3 I UF Turbidity data Table 8: Week 3 I UF SDI data
On July 10th, a fourth test was taken after the UF systems were washed in hope to show improvement of the water quality. The average of the flow was 130 ± 5 gpm feed water with 71 ± 3 NTU before the pre-‐filter and 70 ± 2 NTU when fed into the UF system. The product had a turbidity of 0.25 NTU and an exhaust of 150 ± 15 NTU (See Table 9). When the SDI was tested, the SDI-‐15 (500ml) showed a value within an acceptable range of 0.7 (see Table 10). After the testing of unusual high turbidity in 4 of the membranes (>0.6 NTU), they were shut down for the rest of the month.
07/10/2015 I II Producto (gpm) 132 128 Rechazo (gpm) 8 7.6 Pre-‐filtro (NTU) 73 72 Post-‐Filtro (NTU) 72 70
Total 0.20 0.30 Rechazo 152 140
Table 9: Week 3 II UF Turbidity data Table 10: Week 3 II UF SDI data
On July 14th, the average of the flow was 120 ± 10 gpm feed water with 71 ± 5 NTU before the pre-‐filter and 64 ± 2 NTU when fed into the UF system. The product had a turbidity of 0.22 NTU and an exhaust of 120 ± 10 NTU (See Table 11). When the SDI was tested, the SDI-‐15 (500ml) showed an optimal value of 0.2 (see Table 12).
07/14/2015 I II Producto (gpm) 132 116 Rechazo (gpm) 8.5 9.3 Pre-‐filtro (NTU) 67.3 76.2 Post-‐Filtro (NTU) 64.9 64
Total 0.23 0.20 Rechazo 117 126
Table 11: Week 4 UF Turbidity data Table 12: Week 4 UF SDI data
As mentioned before, studies have claimed that there is no direct correlation in between SDI and turbidity. Nevertheless, the data from the past three weeks is compared to observe a trend and project the future behaviors of the membrane performance. The turbidity in the product is compared to the SDI value tested. As shown in Table 13 and Figure 1, the average turbidity has been steadily increasing, despite the UF systems being chemically washed during week 2, whereas the SDI shows a more irregular pattern. On week 3, both UF systems were chemically washed, hence it showed a decrease in both the turbidity and SDI.
There were two instances that required chemical washed. As mentioned before, the first time was on week 2 when the R.O feed SDI was tested over-‐range, this might have caused the decrease of SDI from 1.9 to the 0.9 in the first test of week 3. The second instance was when the R.O membrane SDI tested over-‐range in the first Week 3 test. The second test on week 3 resulting a decrease on both the turbidity and SDI. If revise the turbidity record of each membrane from Week 3 II, then 4 of the membranes were operating out of the turbidity range (up to 0.6 NTU). Skyworks reduced to shut down the operation of these 4 membranes for the rest of the month. As a result, the test on week 4 showed a vast improvement in both the turbidity and the SDI, showing that these 4 membranes reaching its saturation. As a conclusion, although the SDI is more directly related to membrane fouling rate, due to its irregularity, the turbidity will be used as reference for the correlation to the membrane life.
Week 1 Week 2 Week 3 I Week 3 II Week 4 Average NTU 0.2 0.23 0.37 0.25 0.22 Average SDI 15(500 mL) 0.6 1.9 0.9 0.7 0.2 Table 13: Turbidity and SDI from the Week 1-‐4.
Figure 1: Turbidity vs SDI over 4 week period
0 0.5 1
1.5 2
2.5
Week 1 (06/25)
Week 2 (07/02)
Week 3 I (07/06)
Week 3 II (07/10)
Week 4 (07/14)
Turbidity
NTU
. SD
I
Turbidity vs SDI
W u W o n g | 10
According to the previous records of the UF system, the membranes were last replaced in May 19th, 2015. From May 19th until July 8th (when the SDI was tested over-‐ranged),the total amount of ~70 NTU water recovered was 31,745 𝑚!, with a daily average of 622 𝑚!.On July 1st, the membranes were chemically washed, helping it to extend its duration. Nevertheless, it can be concluded that it takes 31,745 𝑚! for the membranes to exhaust. Given that water flows with the average of 622 𝑚! the duration is 51 days. However since Skyworks water demand is increasing per month, it is expected that the duration of the membranes will be shortened in the near future (See Table 11). As previously stated, the goal is to find a method that would prolong the life of the membrane, in other words, increase the amount of recovery water the membranes can process. The researched and comparison of the alternative solutions are listed below in Table 14.
PERIOD M3 RECOVERY FROM MAY 19 2015
UNTIL JUN 29 2015 (28 DAYS) M3 DAILY AVERAGE
MAY 7,345 612
JUN 19,078 636
JUL 5,322 665
TOTAL 31,745 622
Table 14: Data of water recovery provided by Skyworks
W u W o n g | 11
Possible Solutions Coagulation Coagulation is the process by which colloidal particles and very fine solid suspensions initially present in a wastewater are combined into larger agglomerates that can be separated via sedimentation, flocculation, filtration centrifugation or other separation methods. It is commonly achieved by adding different types of chemicals (coagulants) to the wastewater to promote destabilization of the colloid dispersion and agglomeration of the resulting individual colloidal particles2. The process of coagulation, often recommended in waste water treatment, is called flocculation. It refers to the process by which destabilized particles conglomerate into larger aggregates so that they can be separated from the wastewater treatment. For instance, when alum and other chemicals are added to water to form tiny sticky particles called “floc” which attracts the dirt particles. The combined weight of the dirt and alum (floc) become heavy enough to sink to the bottom during sedimentation7.
Various sources use alum and ferric chloride (FeCl3) as a common used flocculant for UF pretreatment. Often referred as In-‐line coagulation, it removes organic foulants in the membrane feed water and condition particulate matter to increase the effectiveness of production backwashes. In a study conducted by Marek Ratajczack, a Master’s student from the University of Ontario, shows the effects of the different doses of coagulants injected to the feed water on the membrane fouling rate. Ratajczack, first took samples from two sources of water to determine the optimum coagulation dosages for the removal of natural organic matter (NOM). The dosages would then be used as a baseline for the membrane trials with a hollow fiber bench scale UF unit. Membrane trials were then performed with the coagulants applied at optimal and sub optimal dosages in order to evaluate the integrated process for mitigation or organic fouling. As all trials were conducted at a constant flowrate, membrane fouling was evaluated by monitoring trans-‐membrane pressure over time. The results showed that at the right dose, coagulants improved the quality of water and the decrease of membrane fouling and suggested the possible increase of backwash efficiency. However, if the coagulant is higher than the optimal dose, a re-‐suspension of particles was likely to occur. Similarly, smaller portion of solids in raw water flocculated and more membrane fouling was observed2.
Similar study conducted by Solley et al. concluded that chemical clarification pretreatment of treat water prior to MF/RO provides stable operation of high recovery RO processes. However, the chemical clarification of UF requires design and operation that is outside of normal practice8. In other words, both studies indicate that in order to ensure the decrease of membrane fouling, the feed water needs various chemical tests and constant monitoring, especially under constant change of temperature and conditions.
W u W o n g | 12
Biofiltration
A less common option of pretreatment is Biofiltration. Biofiltration is a pollution control technique using living material such as bacteria to capture and biologically degrade pollutants. Common uses include processing waste water, capturing chemicals or silt from surface runoff and microbiotic oxidation of contaminants in air9. Since it is a relatively uncommon practice in the waste water industry there was only one source of study to be found. Huck et al. explores the effect of biopolymers as foulants for UF membranes. The purpose of the study was to investigate the effect of rapid biofiltration on the fouling of UF membranes. The research was carried at a higher than average Dissolved Organic Carbon (DOC) and significant temperature variation. According to Huck et al., the initial backwash procedure, involving air scour as it is a common chemically assisted filtration, led in some cases to an increase of membrane fouling immediately after the backwash. While and alternative backwash condition is explored. To assist in a full-‐scale implementation of this sustainable and simple pretreatment, similar to coagulation, the design and operation conditions for the biofilters should be optimized for various types of waters. The study concludes that it is expected that biofiltration pretreatment will be of particular interest for small and/or isolated systems where higher initial cost may be acceptable because of operational simplicity and reduced chemical requirements10.
W u W o n g | 13
Mechanical Filtration
Mechanical filtration is a process in which contaminants in a waste stream are filtered or screened out. This method is effective in preventing particles, even very tiny ones like mud and sludge, from moving downstream. Nevertheless, solids build up on the filtering media and restrict the water flow requiring some type of maintenance over short period of time11. In the past decade, Amiad Water Systems has developed a series of self-‐cleaning mechanical filtration systems intended for the drinking, irrigation and the industry. Amiad’s filtration systems fall under the category of Cartridge Filters, in which the filter is placed inside a canister or enclosed tank.
Below is the information provided by Amiad’s website fact sheet regarding its mechanical filter series SAF series (See Figure 4 as reference). Article on “Screen Filtration Technology as applied to Pretreatment of Reverse Osmosis and UF Systems”12
Filter Construction
Filters are rated at flows from 70-‐800 gpm per unit.
Body-‐ The standard filter body is rated at 150 psi and constructed of carbon steel material. The body received 5 coats of epozy on the interior and exterior surfaces.
Screen-‐ The screen construction is the most crucial development which allows mechanical filters to be used as R.O prefilters. Utilizing European technolgy, the screen is manufactured entirely of 316L Stainless Steel. This “working screen” is woven in a 600 mesh square weave pattern. The square weave is a critical factor in maintaing the integrity of filtration. The tight, square weave keeps the screen ridged and wire spacing intact so the screen continues to provide the same particle removal efficiency over its service life. Screens woven in 1:2:5 or 1:5 rectangular patters can distort or serparate over time and allow smaller particles to pass.
Filter Operation Figure 2: Cutside view of SAF
The filter, in which ranges from 10-‐800 micron, has flanged connections and is arranged so that the water flows from inside the screen out: collecting suspended material on the inside screen surface (see Figure 2 above). Under clean conditions, the pressure drop would typically be 1-‐2 psi. As the silt builds on the screen the differential pressure rises to 7psi, and the cleaning cycle is automatically initiated by a differential pressure switch.
The self-‐cleaning mechanism consists of a hollow shaft down the centerline of the filter body. This shaft has nozzles which extend approximately 1/8” from the screen surface. The shaft is sealed on one end and open to an exhaust chamber at the top of the filter. When the exhaust valve is open, the
W u W o n g | 14
differential pressure between the supply pressure and the atmospheric pressure at the outlet of the exhaust chamber create a powerful vacuum effect at the end of each nozzle. This sucks the material from the screen surface, through the shaft and out the exhaust valve.
The start of the cleaning cycle causes the exhaust valve to open to atmosphere and the electric motor to start. The motor simultaneously rotates the shaft at 17rpm and moves the shaft axially so the nozzles cover the entire inner screen surface during each cleaning cycle. The duration of the cleaning cycle, depending the style of the filter.
The recommended model is the Amiad SAF 1500, which can withhold flows from 80-‐350 gpm, in which is suitable for the average flow of the system 130 gpm. For technical specifications inn regards of the Amiad SAF 1500, see Appendix B.
Advantages
Mechanical filters offer many advantages over traditional multimedia systems. First, it offers a relatively inexpensive capital cost of equipment that is 30-‐50% lower than the conventional systems. Secondly, the water required for backwash is estimated to be less than 1% on the mechanical filters compared to the 5-‐7% usage by the conventional multimedia system. Furthermore, these filters require a smaller footprint and less complicated valving arrangements nor requiring any chemical flocculation. At last, it is energy cost efficient with only 2-‐7 psi operating range across a screen filter. As mentioned before, the screen size ranges from 10-‐800 microns, offering a variety of filtration.
Plausible Risks
The mechanical filter is least effective when the suspended particulate is very soft in nature. In a study conducted by Amiad, various water sources are sampled to measure the conditions for the optimal use of the mechanical filter. Water samples from a river, canal, reservoir and well were collected and the turbidities before and after the filtration were measured respectively. The study resulted that the river water approached the worst case scenario in that the particles were not only very soft, but also broke upon impact on the screen surface. They are also highly charged and reagglomerate downstream of the filter. The second characteristic of the softer particles is that they could “extrude” through the screen surface. Rather than being trapped on the screen and increasing the filtration efficiency by bridging the pore opening of the screen, the soft particles were pliable and passed through the screen. Below is a comparison done by measuring the turbidity between the feed water and the product (see Table 15)12.
Table 15: Resulting % turbidity removal from Amiad’s study.
W u W o n g | 15
For this reason, when designing a prefiltration system it is imperative to perform a detailed Particle Size Distribution (PSD) analysis. For water with a fairly consistent source, one PSD is generally adequate, whereas feed water from sources of high variation is recommended to take two PSD lab analyses.
Conclusion
It is advised to perform a preliminary water analysis to determine the suitability of the water particles on the mechanical filtration. The advantages outlined for mechanical filtration systems over traditional pretreatment systems are justified when, evaluated on a capital investment or an operating and maintenance basis, in which will be assessed in the following section.
W u W o n g | 16
Exhausted HydraCAP 60 A suggested option mentioned by the Skyworks personnel is using the exhausted membranes from the UF system as the pretreatment to the newly applied membranes. That is using constructing another UF system (called Pre-‐UF) prior to the existing system in which it is composed by the exhausted, fouled membranes from the original UF system. The idea is that although the Pre-‐UF will not filter an acceptable product for the R.O, it will, however, deliver cleaner feed water for the UF system, hence possibly decreasing the membrane fouling rate and prolonging the UF membranes’ lives. The HydraCAP 60 has pore size of approximately 0.02 micron and it can handle a wide variation of water conditions. The HydraCAP series is produced by Hydranautics, a sector from the Nitto Group, whose mission is to research and improve membrane technology. It is considered one of the leading companies in the membrane industry.
Filter Construction
Although Hydranautics does not release an extensive report regarding the materials used to construct the HydraCAP 60 membrane, it designs the membrane with dimensions that are commonly used in the industry. The membrane technology is a proprietary industry that promotes competition and advancement. Therefore most membrane companies design their systems with little to no alterations from the dimensions shown below in Figure 3.
Figure 3: Dimensions of HydraCAP 60.
Filter Operation
As mentioned before, the HydraCAP 60 operates in two modes: Filtration Mode and Backwash Mode. During the Filtration Mode, feed water flows inside fiver and filtrate is collected in the central core tube. This is known as the inside/out filtration15. See Figure 4 as reference. During the Backwash Mode, the filtrate is pressurized and flow is reversed such that accumulated solids are purged from the filters. Technical Specifications are provided in Appendix A.
Figure 4: HydraCAP 60 membrane
W u W o n g | 17
Advantages
There are several advantages of the HydraCAP 60. As mentioned before the membrane technology provides low carbon foot print, lower cost and better water quality than the conventional system. The HydraCAP 60 also has low fouling hydrophilic polyesthersulfone membrane; it is tolerant to chlorine peroxide and other oxidants and it is resistant to pH extremes. Secondly, it has a 99.999% removal for bacterial, giardia, cryptosporidium, 4 log removal of viruses and reduces turbidity to <0.06 NTU. Furthermore, it has an operating flexibility direct or cross-‐flow filtration. Similar to mechanical filtration, it does not require flocculation nor chemicals in the process.
Plausible Risks
Membrane Technique has little risk. Nevertheless, there is relatively higher energy consumption for its operation. Furthermore, the membranes are single-‐use, hence it requires constant capital investment over the length of the use of the UF system. Regardless of the amount of money spent on the membranes (2000 US dollars per membrane), the amount of money saved on water and energy during this simple process still has a lower annual cost in comparison to other systems. A plausible risk is that after accumulating particles over long period of time, the saturated membranes might dirty the water more than it original was, causing more colloidal damage to the new membranes at the UF system. This method has not seen to be used before. Therefore it is hard to predict its outcome.
Conclusion
Using exhausted HydraCAP 60 is more efficient on lowering the turbidity of the feed water than any other method suggested above. As opposed to mechanical filtration, the PSD won’t be necessary since the pore size of the membranes will be so small such that it can withhold most particles. However it takes more analysis to observe the cost efficiency using this system over long term.
W u W o n g | 18
Comparison Strengths and Weaknesses There are two main categories that classify the 4 given methods: Chemical enhanced and physical filtration. Coagulation and Biofiltration are classified as chemically enhanced in which it requires chemicals or organic organisms to purify the water. Mechanical filtration and the ultra-‐filtration system are physical filtration in which they physically trap bigger particles through some medium (either a screen or a membrane). All four methods possess the ability to process molecules with higher molecular weight. However chemically enhanced methods have smaller range of optimization since they require an “optimal dose” of chemicals/ biological matters that would maximize its efficiency. In order to achieve “optimal dose” the conditions (temperature, pH, chlorine level between others) of the water must be consistently assessed and the dosage might vary with time. The consequence of underdose or overdose is increase rate of membrane fouling. In the other hand, physical filtration methods do not depend on feed water conditions (temperature, pH, chlorine level between others). Therefore it does not require constant maintenance over time. Given that it can achieve the same result with lower maintenance, the physical filtration methods are preferred over the chemical enhanced methods. The following analysis will be focused on the recommended model of mechanical filtration Amiad SAF1500 and the Ultra filtration system HydraCAP 60. Table 16 shows their strengths and weaknesses.
Pre UF Amiad SAF 1500 Strengths
-‐ 100% removal of colloidal material, bacteria and viruses
-‐ Single-‐step treatment reduces operating costs and increases efficiency
-‐ Dramatically reduces use of pretreatment chemicals
-‐ Low pressure feed and backwash operation
-‐ Direct or cross-‐flow service provides operating flexibility and higher recovery rates
-‐ Minimal volume of reject water allows excellent operation in continuous flush mode
-‐ No interruption of downstream flow during flushing
-‐ Inexpensive Capital Cost of equipment
-‐ Self-‐cleaning system requires low maintenance
-‐ backwash is estimated to be less than 1%
-‐ requires a smaller footprint and less complicated valving arrangements
Weaknesses
-‐Single use -‐Constant capital investment -‐Unpredictability
-‐ Larger pore size of 10 micron(smallest screen), hence less particle intake
-‐ Dependent on particle condition. (PSD test needed)
Table 16: Strengths and Weaknesses between the Amiad SAF 1500 and the HydraCAP 60.
W u W o n g | 19
Table 16 is the compiled information mentioned in the section above “Possible solutions.” As seen in the table, in terms of water purification efficiency, the HydroCAP 60 has a much smaller pore size than the screens in Amiad SAF 1500, hence its product has a much lower turbidity than the product from the mechanical filtration. Amiad SAF 1500 is also much dependent on the particle conditions than HydraCAP 60. If the particles in the feed water are softer by nature, regardless of its size, the screens will be less likely to contain them, lowering the efficiency of the treatment. Nevertheless, both methods claim to have high energy efficiency and low carbon foot print, both in which will be compared in the following sections. Although, the mechanical system has a self-‐cleaning system and the HydraCAP 60 membranes are single uses, since the pre-‐UF system will be using exhausted HydraCAP 60 there should be little to no capital investment. The question lies, however, how much maintenance and time will it take until the exhausted membranes become completely saturated and lose its ability to filtrate. Although there are not much studies and research done in this area, this proposal will focus on the future projection based on trends and estimation.
Operation Efficiency Water Consumption
The assessment of water efficiency is based on the amount of water each method consumes during their backwash process. As shown in Table 17 below, the Amiad model shows to use much less water than the Pre-‐UF system. While the Pre-‐UF consumes nearly 6000 gallons per day, Amiad only consumes 50 gallons a day, making it a more water efficient option. Given that the water cost in Mexicali is 36 pesos (2.4 USD) per 𝑚!, the total annual water cost lost on backwashing are $ 16,351 USD and $ 172.8 for the Pre-‐UF and the Amiad model respectively. Furthermore, the Pre-‐UF has a 10% of exhaust, affecting the total quantity of the product delivered per year. According to the data provided by Skyworks, 680𝑚! of feed water flows daily into the UF system in which 10% become exhaust and the 90% become product, that is an approximation of 620 𝑚!daily. Therefore if the Pre-‐UF is installed, then then water product would be reduced to a 550 𝑚! daily of product.
Pre-‐UF Amiad SAF 1500 Time for backwash 120 seconds 15 seconds Flow interruption yes no Backwash water per cycle
250 gallons/ cycle 7 gallons/ cycle
Frequency Per hour When reached 7psi difference Estimate 7 cycles per day
Total water used /day 6000 gallons (22.71 𝑚!)/ day 50 gallons (0.2 𝑚!)/ day Water spent 𝑚!/ year 8289.15 𝑚! 73 𝑚! Water spent / year* USD
$ 19,893 $ 175
Table 17: Backwash Water usage comparison between Pre-‐UF and Amiad *Given that water cost is $2.4 USD per 𝑚!
W u W o n g | 20
Energy Consumption
Previous records provided by Skyworks show an average of nearly 2000 USD/ month of energy consumption and 3,400 USD/ month for service policy for 2 racks of 8 membranes. Given in the scenario of the pre-‐UF that only one rack of 10 membranes will be used, the estimated amount of energy consumed will be 1250 USD/ month for the energy consumption and 2125 USD/ month for service policy fee, that is including chemical and operation fee for maintenance. In the scenario of the Amiad SAF 1500, a ¼ hp motor will run for 24 hours a day. Given that the electricity rate is 0.1906 USD Kwh, the calculated cost per month would be $25.525 USD. See Table 18 for reference.
Pre-‐UF (10 membranes) Amiad SAF 1500 Hours of operation 24 hours 24 hours Time for backwash 120 seconds 15 seconds Flow interruption yes no Energy Consumption $ 1250 USD/ month $ 25.525 USD/ month Service policy fee $ 2125 USD $ 0 USD Total monthly fee $ 3375 USD $ 25.525 USD Total annual fee $ 40,500 USD $ 306.3 USD
Table 18: Energy usage comparison between Pre-‐UF and Amiad
Membrane Efficiency Depending on the Particle Size Analysis, there are various projections. Given that 60 NTU entering 100 micron prefilter has a product of as low as 50 NTU with an 8% improvement, it is reasonable to assume that most particles in the feed water are below 100 microns. There are three scenarios: if most particles are ranged between 100-‐10 microns, Amiad SAF can perform at its maximum efficiency of nearly 90% (Case 1). If most particles range between 10-‐1 micron the Amiad SAF will have little efficiency of 20% (Case 2). At last, if it is equally distributed, then the Amiad SAF will have about 50% efficiency (Case 3). As shown in Table 16, given that the current decaying rate is about 31,745 𝑚!of water per membrane, the decaying rate for case 1, 2 and 3 according to the increase of efficiency would be 174,597.5 𝑚!, 34,919 𝑚! and 58,198 𝑚! respectively. The projected duration of the membranes for each case would be 230 days, 46 days and 76 days, which means that the UF system would need replacement 2, 8 and 5 times a year, respectively.
The exhausted HydraCAP 60, unlike the Amiad SAF 1500, is not dependent on the particle size, since it will be able to trap particles as small as 0.02 micron. Therefore it is assumed that it will have a 85-‐99% efficiency. However, depending to the degree of exhaustion, the rate of saturation varies and the life of the Pre-‐UF system won’t be able to be predicted. Thus the projection of the life of the UF membranes can range from 2 to 4 replacements per year.
Disclaimer: The life projection is based on the most ideal situation where the turbidity has a linear correlation with the life of the membrane. However, there are no studies shown to have turbidity directly correlated with the life if the membrane, nor SDI.
Table 19: Projected Life of the Membrane for Pre-‐UF and Amiad.
Cost Analysis The equipment cost and the installation fee for both the Pre-‐UF and Amiad SAF 1500 are approximately $ 40,000 USD. However, these will not be taken into account in the annual fee since it will only be added to the cost of the first year. The following cost calculation takes into account the annual cost of operation for both the Pretreatment methods and the UF system, it includes: the annual energy consumption and service policy fee of the 2 rack (16 membranes) UF system, the annual energy consumption and service policy fee for each method, the cost of the membrane replaced for each case, the cost saved on recycling water, and the cost lost on backwash water. The current UF system without pretreatment consumes approximately $64,800 USD of electricity and service fee per year. As mentioned before, the current membrane decaying rate requires 8 membrane replacements per year with a total cost of $217,240USD and the cost saved from water recycling is $542,530 USD per year. This gives us a total amount of $260,490 USD saved.
In the case of accounting the Pre-‐UF as the pretreatment, the existing UF system consumes $64,800 USD of energy and service fee per year and the Pre-‐UF consumes $40,500 of energy and service policy fee per year. As mentioned in the section above, the projected rate of annual membrane replacement is about 2-‐4 times with a total cost ranging from $54,310-‐ $108,620 USD annually. Since the Pre-‐UF system consumes 10% of its feed water for exhaust, the total amount of water recovered decreases to 198,709 𝑚! per year, equivalent to $481, 276 USD saved. Taking into account of the cost of backwash water lost, $16,351 USD, the total amount saved by the system ranges from $301,773 to $247,463 USD.
W u W o n g | 22
Accounting the Amiad model as the pretreatment the existing UF system consumes $64,800 USD of energy and service fee per year and the Pre-‐UF consumes $306.3 of energy and service policy fee per year. As mentioned in the section above, there are three cases (projections) depending on the particulate size. For Amiad’s three cases, the projected annual membrane replacement rate are 2, 7, and 4 respectively, this is equivalent to $54,310, $190,085 and $108,620 of cost respectively. Since there is no exhaust water for the Amiad model, the amount of water recycled does not change, hence the cost is $542,530. At last, taking into account the amount of water used to backwash, $ 172.8, the total cost savings are $422,938, $287,164 and $368,629 for the three cases respectively. See Table 17 as reference.
No Pretreatment Pre-‐UF Amiad SAF 1500 Equipment and Installation fee USD
-‐-‐-‐-‐-‐-‐-‐-‐ $ 40,000 $ 40,000
Annual Pretreatment Energy Consumption and Policy fee USD
-‐-‐-‐-‐-‐-‐-‐-‐ $ 40,500 $ 306.3
Annual UF Energy Consumption and Operation fee USD
$ 64,800 $ 64,800 $ 64,800
Cost of 16 membranes USD
$ 27,155 $ 27,155 $ 27,155
Membranes replaced per year USD
8 2-‐4 Case 1: 2 Case 2: 7 Case 3: 4
Cost of UF membranes per year USD
$ 217,240 $54,310 -‐$ 108,620 Case 1: $ 54,310 Case 2: $ 190,085 Case 3: $108,620
Case 1:-‐ $422,938 Case 2: -‐$287,164 Case 3: -‐$368,629
Table 20: Total Cost of each case of Pretreatment and UF system
W u W o n g | 23
Conclusion The goal of this paper was to investigate the optimal treatment of feed water prior to entering
the current UF system in order to prolong the life of the UF membranes. The following conclusions were drawn from an extensive investigation of the behavior of the current UF membranes, the current methods of pretreatment in the market, and the comparison between the methods. Turbidity tests and SDI tests were performed in order to observe a trend on the rate of the membrane fouling of the UF system HydraCAP 60. As shown in the “Data Analysis” section Figure 1 and 2, while the Turbidity is consistently increasing, the SDI might vary. For this reason, the turbidity was used as a reference for the membrane fouling rate, despite of studies showing that the SDI is the more accurate measurement for membrane fouling rate. Skyworks provided the current total amount of water recycled per cycle of membranes (226,054 𝑚!) in which is used as the reference for membrane fouling rate for the rest of the paper.
All methods were evaluated in hope to provide a well-‐rounded analysis for the Skyworks specific situation. The parameters for the evaluation include: energy and water consumption, the maintenance cost and feasibility, the purification efficiency, membrane longevity of the UF and at last the total cost for each case. Looking at the complete analysis of the total cost at Table 20, all pretreatment will be able to increase the cost saving and improve the membranes longevity of the UF systems. The main difference that distinguishes the Pre-‐UF from the Amiad model is the energy and water consumption. The Pre-‐UF loses up to $19,893 USD of water cost on exhaust annually, and $40,500 USD of energy consumption and service fee. The Amiad model, in the other hand, consumes a significantly less amount of energy and water with a total cost of $481 USD annually.
In terms of membrane longevity the Pre-‐UF has much higher chance to prolong the life of the UF membranes with approximately 2-‐4 replacements per year, in spite of the different cases of the Amiad model. As mentioned before, the projection of the life of the membrane is based on an ideal behavior in which membrane fouling has a linear correlation with the turbidity of the feed water. Therefore, there is no concrete evidence to support the projection of the life of the membrane if the turbidity for the feed water of the UF decreases. Nevertheless, previous studies do observe, in most cases, lower membrane fouling rate with decrease of the feed water turbidity. See Table 21 below.
Pre-‐UF Amiad SAF 1500 Water purification More effective Depending on case Energy consumption More Less Water consumption More Less UF Membrane longevity longer shorter Installation cost Same Same Maintenance cost More expensive Cheaper Overall Cost Depending on case Depending on case
Table 21: Pre-‐UF and Amiad SAF comparison
W u W o n g | 24
Taking the consumption and the membrane replacement cost into consideration, the most ideal situation would be Case 1 of Amiad SAF 1500, in which most feed water particle sizes are larger than 10 microns. Case 1 Amiad SAF 1500 would save a total of $422,938 USD, an increase of 44.8% in savings. The second most ideal situation would be Case 3 Amiad SAF 1500, in which all particles sizes are equally distributed having an efficiency of 50% and would need 4 replacements of membranes per year. Case 3 Amiad SAF 1500 would save a total of $368,629 USD, an increase of 41.5% in savings. Then, in the case of Pre-‐UF, with a projection of 2-‐4 replacements per year, would have a cost saving ranging from $247,463 to $301,773 USD, an increase of -‐5.8-‐22% in savings. At last Case 2 of the Amiad SAF 1500, in which most particles are smaller than 10 microns, has a projection of 8 replacements per year (only 1 membrane less than the current membrane consumption). The cost saving would be $287,164 USD, an increase of 10.2%.
Recommendation It is recommended to perform a Particle Size Distribution Test to assess the particle sizes. The followings are recommendation for three potential test results.
1. If the particles are either mostly bigger than 10 micron (smallest filter size from Amiad SAF 1500) or equally distributed, then it is advised to use the Amiad SAF 1500 as pretreatment. However, the potential risk lies on the consistency of the individual particles. If the particles are soft, regardless of its size, the filter will be less efficient and the rate of membrane fouling will not decrease significantly.
2. If the particles are mostly smaller than 1 micron, it is recommended to use the Pre-‐UF. Although the Pre-‐UF system requires a significantly higher energy and water consumption, it is not dependent to the particle sizes and it will effectively retain particles as small as 0.2 microns. However, the potential risk lies on the rate of the membrane saturation.
3. If the particles are equally distributed, it is recommended to use the Amiad SAF 1500 as pretreatment. However, as mentioned before the potential risk lies on the consistency of the individual particles. If the particles are soft, regardless of its size, the filter will be less efficient and the rate of membrane fouling will not decrease significantly.
W u W o n g | 25
Acknowledgement I would like to thank my mentors Luis A. Robledo and Edgar Osvaldo Velazquez who have
inspired me throughout my internship period to become more knowledgeable, hardworking and patient. I would also like to thank my coworkers from Facilities for being kind to me.
I’d like to thank my internship advisor Professor Farhat Beg for being encouraging and supportive throughout my internship.
At last, I would like to thank Skyworks and UCSD for giving me the opportunity to explore my career options and learn all I hoped to learn.
W u W o n g | 26
Sources 1 Crozes, G., Hugaboom, D., & Grooters, S. (2003, February ). “ Demonstration of Low Pressure Membrane Technology on Lake Michigan.” Retrieved July 13, 2015
2 Ratakczak, M. (2007). “The Use of Coagulation as a Pre-treatment to Ultra-filtration Membranes.” Retrieved July 13, 2015.
3 APEC Water(2007). “What is Ultrafiltraiton in the Terms of Membrane Technology?” Retrieved July 13, 2015.
4 KCI. (2010). “Turbidity Testing.” Retrieved July 13, 2015.
5 Lenntech. (2004). “Silt Density Index.” Retrieved July 13, 2015
6 Water Treatment Guide. (2005). “Silt Density Index Measurement and Testing. “ Retrieved July 13, 2015.
8 Solley, D., Rhodes, B., Hordern, M., & Roux, A. (2013). “Pretreatment for micro- or ultra-filtration/reverse osmosis water reuse: Experience from Mid-Eastern Australia.” Retrieved July 13, 2015.
9 Joseph S. Devinny, Marc A. Deshusses and Todd S. Webster (1999). “Biofiltration for Air Pollution Control.” Lewis Publishers.
10 Huck, P. M.; Peldszus, S.; Hallé, C.; Ruiz, H.; Jin, X.; Van Dyke, M.; Amy, G.; Uhl, W.; Theodoulou, M.; Mosqueda-Jimenez, D. B. (2011). “Pilot scale evaluation of biofiltration as an innovative pre-treatment for ultrafiltration membranes for drinking water treatment.” Water Science & Technology: Water Supply . 2011, Vol. 11 Issue 1, p23-29. 7p
11 Water Maze. (2015). “Mechanical Filtration Is Still the Wastewater Technology of Choice for Many Industries.” Retrieved July 13, 2015.
12 Hamilton, T. (2015).” Screen Filtration Technology as Applied to Pretreatment of Reverse Osmosis and Ultra-Filtration Systems.” Retrieved July 13, 2015.
13 Hydranautics “HYDRAcap Ultrafiltration.”(2015)
16 Amiad. “SAF 1500.” (2015)
W u W o n g | 27
Appendix A Technical Specifications: HydraCAP 60 Membrane15
Maximum Chlorine Exposure 200,000 ppm-‐hrs Maximum Instantaneous Feed Turbidity 100 NTU
Maximum Operating Temperature 104°F (40°C) pH Operating Range 4.0-‐10.0 Cleaning pH Range 1.5-‐13.0
Operating Mode Inside to Outside Filtration Direct flow or Crossflow
Typical Process Conditions
Backwash Flux 100-‐150 gfd (170-‐255 l/𝑚!/h) Backwash Duration 30-‐60 seconds Backwash Frequency 20-‐60 minutes Chemical Enhanced Backwash Frequency 0-‐4 times per day Chemical Enhanced Backwash Duration 1-‐30 minutes
Rated operation voltage 3 phase, 220/380/440 VAC 50/60 Hz Electric motor ¼ HP Current consumption 0.6 Amp Control voltage 24 VAC 12V or 24 VDC upon request
W u W o n g | 29
Appendix C
Pretreatment Methods to Ultrafiltration System
Prolonging the Life of the UF membranes
Diana Wu Wong
W u W o n g | 30
Data of Feed Water to the UF system and feed R.O
Week 1 Skyworks uses two HydraCAP 60 UF systems. The first test performed in June 26th, 2015
(referred as Week 1), the average of the flow was 130 ± 5 gpm feed water with 55 ± 5 NTU from the exhaust water of both the “Sawing” and “Singulado” process as a pretreatment for the Reverse Osmosis. The feed water first went through a basic pre-‐filter of pore size 100 microns prior to the UF system, removing approximately 4 NTU of high weight molecules. Then, it fed into the UF system with around 50± 5 NTU and came out with 0.20 ± 0.10 NTU of product and 120± 10 NTU of exhaust (See Table 1). When the SDI was tested, the SDI-‐15 (500ml) showed a value within an optimal range of 0.6 (see Table 2). The membrane in Figure 1 was relatively clean however, it was showing mild discoloration, implying soiling in the UF system.
06/26/2015 I II Product (gpm) 127 121 exhaust (gpm) 7 8 Pre-‐filter (NTU) 53 53 Post-‐filter (NTU) 50 50
Total 0.18 0.21 Rechazo 326 160
Table 1: Week 1 UF turbidity data
Figure 1: Week 1 SDI membrane result UF system Table 2: Week 1 UF SDI data UF system
The R.O feed was tested to be over-‐ranged at 10 minutes of the SDI test (See Table 3). The membrane in the Figure 2 shows a mild yellow off coloring, an indication of soiling.
Figure 2: Week 1 SDI membrane result from R.O feed Table 3: Week 1 R.O SDI data.
Week 2 On June 29th, the SDI for the R.O feed was tested over-‐range, see Table 4.
Figure 3: Week 2 SDI membrane for the R.O feed system Table 4: Week 2 R.O feed SDI test
Therefore during the second test performed on July 2nd, 2015(referred as Week 2), only the first UF system was operating while the second UF system was being chemical washed. The average of the flow was 150 ± 5 gpm feed water with 57 NTU before the pre-‐filter and 53 NTU when fed into the UF system. The product had a turbidity of 0.23 NTU and an exhaust of 104 NTU (See Table 5). When the SDI was tested, the SDI-‐15 (500ml) showed a value within an acceptable range of 1.9 (see Table 6). However it was significantly higher than Week 1’s result.
07/02/2015 I II Producto (gpm) 145 N/A Rechazo (gpm) 7 N/A Pre-‐filtro (NTU) 57 N/A Post-‐Filtro (NTU) 53 N/A
Total 0.23 N/A Rechazo 104 N/A
Table 5: Week 2 UF turbidity data Table 6: Week 2 UF SDI data
Week 3 On the third test, performed on July 6th, 2015, both systems were operating. The average of the
flow was 130 ± 5 gpm feed water with 60 ± 3 NTU before the pre-‐filter and 58 ± 2 NTU when fed into the UF system. The product had a turbidity of 0.37 NTU and an exhaust of 155 ± 15 NTU (See Table 7). When the SDI was tested, the SDI-‐15 (500ml) showed a value within an acceptable range of 0.9 (see Table 8). However, looking at Table 7 membrane 1, 2 and 4 were already showing signs of failure, and membrane 5 and 6 were producing water with relatively high turbidity. The overall results shows mild saturation of the membrane. Therefore, Skyworks’ engineers concluded to chemically wash both UF system racks.
07/06/2015 I II Producto (gpm) 125 120 Rechazo (gpm) 9 7 Pre-‐filtro (NTU) 58.4 63.1 Post-‐Filtro (NTU) 57 61.3
Total 0.37 0.36 Rechazo 170 138 Table 7: Week 3 I UF Turbidity data
Figure 4: Week 3 I SDI membrane result UF system Table 8: Week 3 I UF SDI data The results of the SDI test from the R.O system showed improvement from Week 2’s result. Recall, that Week 2 result over-‐ranged at 10 minutes. This week over-‐ranged at 15 minutes. This is consistent with the improvement of the SDI of the UF system in which improved from 1.9 to 0.9. The results indicate the effect of UF system SDI on the overall R.O feed water SDI. In hope to continue the
improvements of the R.O feed SDI. Looking at the SDI membrane result from Figure 5, the color is considerably darker yellow than the SDI membrane from the UF system, yet lighter color thank Week 2’s R.O SDI membrane. This indicates higher soiling than the UF system, yet
Figure 5: Week 3 I R.O membrane SDI result Table 8: Week 3 I R.O SDI data
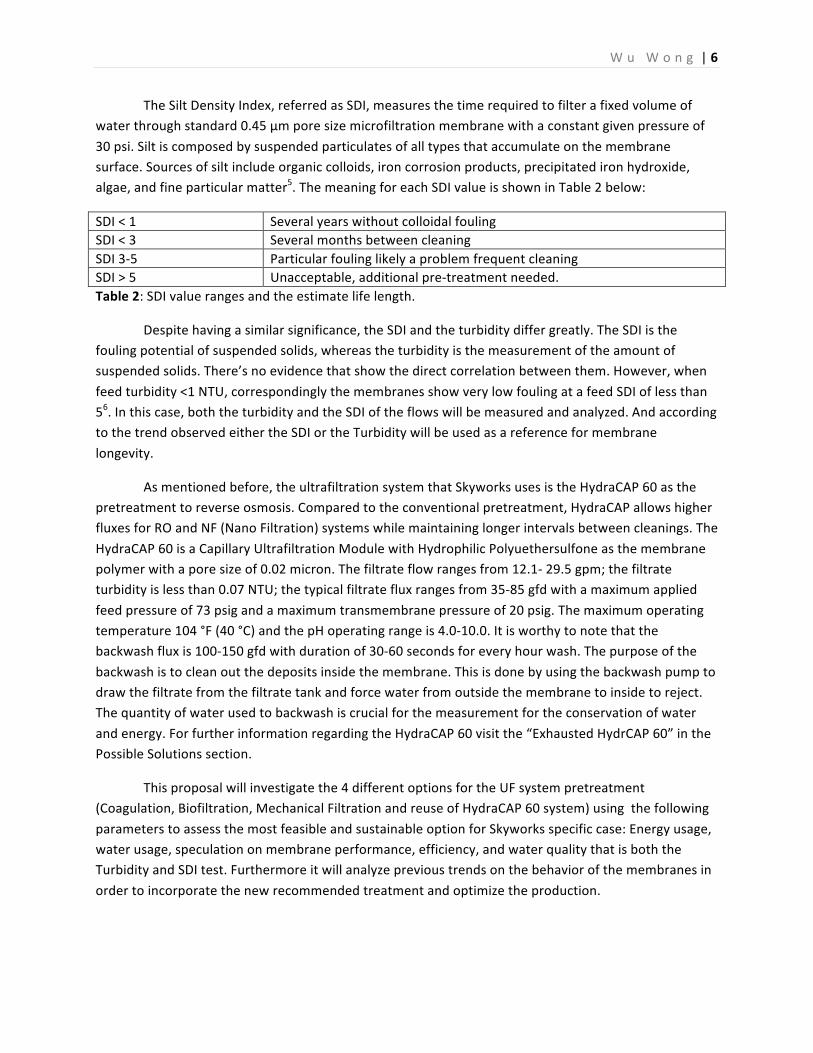
On July 10th, a fourth test was taken after the UF systems were washed in hope to show improvement of the water quality after both racks were chemically washed. The average of the flow was 130 ± 5 gpm feed water with 71 ± 3 NTU before the pre-‐filter and 70 ± 2 NTU when fed into the UF system. The product had a turbidity of 0.25 NTU and an exhaust of 150 ± 15 NTU (See Table 9). Despite being chemically washed, the results showed failure on membrane 1, 2 and 4 from rack 2. When observing the backwash tanks for both racks, rack 2 showed a considerably larger amount of precipitated solids at the bottom of in rack 1 tank (as seen in Figure 6 and 7), showing that rack 2 is the main source of higher turbidity water. The Skyworks team concluded that these membranes have reached their capacity to filter water and shut down 1-‐4 of rack 2.
07/10/2015 I II Producto (gpm) 132 128 Rechazo (gpm) 8 7.6 Pre-‐filtro (NTU) 73 72 Post-‐Filtro (NTU) 72 70
Figure 6: Backwash Tank from UF rack 1 Figure 7: Backwash Tank from UF rack 1
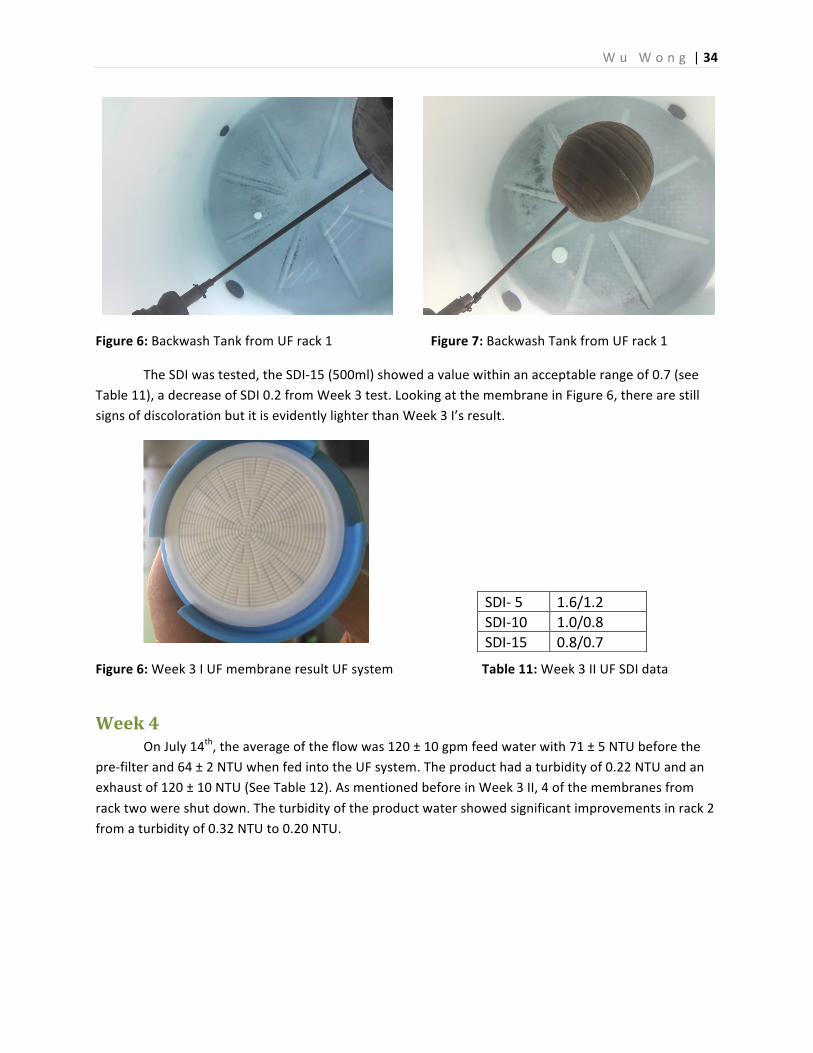
The SDI was tested, the SDI-‐15 (500ml) showed a value within an acceptable range of 0.7 (see Table 11), a decrease of SDI 0.2 from Week 3 test. Looking at the membrane in Figure 6, there are still signs of discoloration but it is evidently lighter than Week 3 I’s result.
Figure 6: Week 3 I UF membrane result UF system Table 11: Week 3 II UF SDI data
Week 4 On July 14th, the average of the flow was 120 ± 10 gpm feed water with 71 ± 5 NTU before the
pre-‐filter and 64 ± 2 NTU when fed into the UF system. The product had a turbidity of 0.22 NTU and an exhaust of 120 ± 10 NTU (See Table 12). As mentioned before in Week 3 II, 4 of the membranes from rack two were shut down. The turbidity of the product water showed significant improvements in rack 2 from a turbidity of 0.32 NTU to 0.20 NTU.
When the SDI was tested, the SDI-‐15 (500ml) showed an optimal value of 0.2 (see Table 13), a considerable drop from the SDI from the previous week 0.7. The membrane in Figure 7 shows little to no signs of soiling, and it has been by far, one of the cleanest results.
Figure 7: Week 4 UF membrane result UF system Table 13: Week 4 UF SDI data
Analysis As mentioned before, studies have claimed that there is no direct correlation in between SDI and turbidity. Nevertheless, the data from the past three weeks is compared to observe a trend and project the future behaviors of the membrane performance. The turbidity in the product is compared to the SDI value tested. As shown in Table 14 and Figure 8, the average turbidity has been steadily increasing, despite the UF systems being chemically washed during week 2, whereas the SDI shows a more irregular pattern. On week 3, both UF systems were chemically washed, hence it showed a decrease in both the turbidity and SDI.
There were two instances that required chemical washed. As mentioned before, the first time was on week 2 when the R.O feed SDI was tested over-‐range, this might have caused the decrease of SDI from 1.9 to the 0.9 in the first test of week 3. The second instance was when the R.O membrane SDI tested over-‐range in the first Week 3 test. The second test on week 3 resulting a decrease on both the turbidity and SDI. If revise the turbidity record of each membrane from Week 3 II, then 4 of the membranes were operating out of the turbidity range (up to 0.6 NTU). Skyworks reduced to shut down the operation of these 4 membranes for the rest of the month. As a result, the test on week 4 showed a vast improvement in both the turbidity and the SDI, showing that these 4 membranes reaching its saturation.
Week 1 Week 2 Week 3 I Week 3 II Week 4 Average NTU 0.2 0.23 0.37 0.25 0.22 Average SDI 15(500 mL) 0.6 1.9 0.9 0.7 0.2 Table 14: Turbidity and SDI from the Week 1-‐4.