Formation and Structural Characteristics of Porous Ethylene Glycol Dimethacrylate Networks OGUZ OKAY',* and ClGDEM CURUN' 'Eastern Mediterranean University, Department of Chemistry, P.O. Box 95, Gazimagusa, Mersin 10, Turkey; 'TUBITAK Marmara Research Center, Department of Chemistry, P.O. Box 21, Gebze, Kocaeli, Turkey SYNOPSIS The relationships between the synthesis conditions and the morphology of ethylene glycol dimethacrylate (EGDM) networks were investigated. EGDM networks were prepared by free-radical polymerization in toluene as a diluent. The networks were characterized by swelling, porosity, and pendant vinyl group content measurements. The accessibility of pendant vinyls to low molecular weight compounds was tested using pyrrolidine as a model reactant. The results show that the polymerization of EGDM in toluene is accompanied by a phase separation in the system. The networks thus obtained are heterogeneous and exhibit an inhomogeneity in the porosity and swelling distributions. Both the weight swelling ratio and the pore volume of the networks increase with increasing monomer dilution. It was also found that the accessibility of pendant vinyls increases as the cross-linking density of the network decreases or as its porosity increases. The results can be explained with the formation of highly cross-linked microgels as the intermediates in the network formation processes. Two equations were derived to predict the equilibrium weight swelling ratio and the pore volume of heterogeneous networks. Satisfactory agreement of the results of mea- surements with the predictions of the equations was observed. INTRODUCTION Ethylene glycol dimethacrylate ( EGDM ) has been widely used as a cross-linking agent in the synthesis of hydrophilic or hydrophobic copolymer networks. The most common combination from the viewpoint of application is its copolymers with glycidyl meth- acrylate ( GMA) or 2-hydroxyethyl methacrylate (HEMA) .' For instance, GMA-EGDM copolymer networks can be used as carriers in the immobili- zation of enzymes. Moreover, their epoxy groups also offer a possibility to obtain various functional groups by additional modification^.^^^ A drawback of using such carriers is that only a small fraction of functional groups is accessible for the active sites of enzymes or reagents in the aqueous media. Our research has shown that, even in highly porous GMA-EGDM networks, only 1-3 mol ?6 of the epoxy groups are accessible to the thiosulfate * To whom correspondence should be addressed. Journal of Applied Polymer Science, Val. 46, 421-434 (1992) 0 1992 John Wiley & Sons, Inc. CCC 0021-8995/92/030421-l4$04.00 anions, as determined by the thiosulfate m e t h ~ d . ~ This poor performance of GMA-EGDM networks probably originates from the steric hindrance of the cross-linked structure as well as from the hydro- phobic nature of the networks. To overcome this, a delayed charge of functional monomers to the par- tially prepolymerized EGDM was suggested.6 Our attention has been directed to the polymer- ization of EGDM alone, due to the fact that, after the reaction was complete, various amounts of pen- dant vinyl groups remained in the network structure. These vinyls may be subsequently copolymerized with functional monomers yielding reactive surfaces or star-shaped macrogels. In this case, however, the reactivity of pendant vinyls is important, which, in turn, depends on the morphology of EGDM gel par- ticles. The objective of this study is to investigate the relationships between the synthesis conditions and the morphology of EGDM networks. For this pur- pose, a number of EGDM networks were prepared by free-radical polymerization. Toluene was used as the diluent in the polymerization system. The effect 42 1
Transcript
Formation and Structural Characteristics of Porous Ethylene Glycol Dimethacrylate Networks
OGUZ OKAY',* and ClGDEM CURUN'
'Eastern Mediterranean University, Department of Chemistry, P.O. Box 95, Gazimagusa, Mersin 10, Turkey; 'TUBITAK Marmara Research Center, Department of Chemistry, P.O. Box 21, Gebze, Kocaeli, Turkey
SYNOPSIS
The relationships between the synthesis conditions and the morphology of ethylene glycol dimethacrylate (EGDM) networks were investigated. EGDM networks were prepared by free-radical polymerization in toluene as a diluent. The networks were characterized by swelling, porosity, and pendant vinyl group content measurements. The accessibility of pendant vinyls to low molecular weight compounds was tested using pyrrolidine as a model reactant. The results show that the polymerization of EGDM in toluene is accompanied by a phase separation in the system. The networks thus obtained are heterogeneous and exhibit an inhomogeneity in the porosity and swelling distributions. Both the weight swelling ratio and the pore volume of the networks increase with increasing monomer dilution. It was also found that the accessibility of pendant vinyls increases as the cross-linking density of the network decreases or as its porosity increases. The results can be explained with the formation of highly cross-linked microgels as the intermediates in the network formation processes. Two equations were derived to predict the equilibrium weight swelling ratio and the pore volume of heterogeneous networks. Satisfactory agreement of the results of mea- surements with the predictions of the equations was observed.
INTRODUCTION
Ethylene glycol dimethacrylate ( EGDM ) has been widely used as a cross-linking agent in the synthesis of hydrophilic or hydrophobic copolymer networks. The most common combination from the viewpoint of application is its copolymers with glycidyl meth- acrylate ( GMA) or 2-hydroxyethyl methacrylate (HEMA) .' For instance, GMA-EGDM copolymer networks can be used as carriers in the immobili- zation of enzymes. Moreover, their epoxy groups also offer a possibility to obtain various functional groups by additional modification^.^^^
A drawback of using such carriers is that only a small fraction of functional groups is accessible for the active sites of enzymes or reagents in the aqueous media. Our research has shown that, even in highly porous GMA-EGDM networks, only 1-3 mol ?6 of the epoxy groups are accessible to the thiosulfate
* To whom correspondence should be addressed. Journal of Applied Polymer Science, Val. 46, 421-434 (1992) 0 1992 John Wiley & Sons, Inc. CCC 0021-8995/92/030421-l4$04.00
anions, as determined by the thiosulfate m e t h ~ d . ~ This poor performance of GMA-EGDM networks probably originates from the steric hindrance of the cross-linked structure as well as from the hydro- phobic nature of the networks. To overcome this, a delayed charge of functional monomers to the par- tially prepolymerized EGDM was suggested.6
Our attention has been directed to the polymer- ization of EGDM alone, due to the fact that, after the reaction was complete, various amounts of pen- dant vinyl groups remained in the network structure. These vinyls may be subsequently copolymerized with functional monomers yielding reactive surfaces or star-shaped macrogels. In this case, however, the reactivity of pendant vinyls is important, which, in turn, depends on the morphology of EGDM gel par- ticles.
The objective of this study is to investigate the relationships between the synthesis conditions and the morphology of EGDM networks. For this pur- pose, a number of EGDM networks were prepared by free-radical polymerization. Toluene was used as the diluent in the polymerization system. The effect
42 1
422 OKAY AND GURUN
of the polymerization parameters such as the reac- tion time and the EGDM concentration on the net- work properties was studied using measurements of swelling, porosity, and pendant vinyl group content of the networks. The accessibility of pendant vinyls in the network structure was tested using pyrrolidine as a model reactant.
As is well known, monovinyl-divinyl monomer copolymerization cross-linking reactions in the presence of a diluent lead to the formation of ex- panded ( preswollen ) or porous structures, depending on the synthesis conditions.' Porous structures are obtained as a result of a phase separation during the polymerization process. Many studies have been re- ported in the literature on the synthesis-property relations of porous networks, especially those of styrene-divinylbenzene copolymer^.^-'^ It is also a well known fact that the porosity of the networks increases as the concentration of the divinyl mono- mer or the diluent increases or as the solvating power of the diluent decreases. However, there is no quan- titative correlation available to predict the charac- teristics of the networks, such as swelling, porosity, pore size, and pore-size distribution, from their syn- thesis conditions. In this paper, we also attempt to derive general porosity-swelling-dilution relations from the experimental data to provide greater insight into the phenomenon of network formation pro- cesses.
EXPERIMENTAL
Materials
EGDM (Merck) was freed from the inhibitor by shaking with a 10% aqueous KOH solution, washing, and drying over sodium sulfate. It was then distilled under reduced pressure over copper ( I ) chloride as a polymerization inhibitor. The GC analysis of EGDM gave the following results: 98% EGDM and 1% HEMA. The initiator, 2,2'-azobisisobutyronitrile ( AIBN, Merck) was recrystallized from methanol. Toluene (Merck) was used as received (> 99% pu- rity).
Polymerization
The radical polymerization of EGDM was performed at 80°C in bulk or in toluene solution. AIBN as an initiator ( 0.43 wt % of the monomer) was dissolved in the selected monomer-toluene mixture, and this was divided and transferred into a series of glass tubes of 5 mm internal diameter and about 250 mm
long. The glass tubes were degassed, sealed under vacuum, and placed in a thermostat at 80 k 0.5"C for a predetermined polymerization time. The re- actions were stopped by cooling the tubes with liquid nitrogen. Homologous series of EGDM networks were prepared in this way, allowing systematic vari- ation of the EGDM concentration and the reaction time.
Extraction of the Sol Fraction
Toluene was chosen as the extraction solvent and employed at room temperature. The crude gels were cut into samples of 10-25 mm length. To remove the sol fraction, each sample was placed in an excess of toluene containing a small amount of 1,4-ben- zoquinone as an inhibitor. After 5 days with occa- sional shaking, benzoquinone-containing toluene was replaced with pure toluene and the extraction was continued for 1 day further. The networks after extraction were carefully deswollen in a series of toluene-methanol mixtures with increasing meth- anol contents. They were then washed with meth- anol and dried at room temperature under vacuum to constant weight.
The gel conversion was calculated as the ratio of the weight of the extracted network to that of the initial monomer.
Methods
The apparent density of the networks, do, was de- termined by the mercury pycnometric method. Po- rosity, p%, and pore volume, V,, were calculated from do as
P % = 1-- X100% ( 3 where d2 is the homogeneous polymer density, taken as 1.20 g/cm3 (Table 11). Here, P% and V, represent the total volume of pores in 100 mL or in 1 g of dry polymer, respectively.
The swelling measurements were carried out in toluene at room temperature. To reach the equilib- rium degree of swelling, the networks were immersed in toluene for at least 1 week; the swelling equilib- rium was tested by weighing the samples. To achieve good precision, four measurements were carried out on samples of different weight taken from the same gel. The networks were then weighed in the swollen state and dried under vacuum to constant weight.
FORMATION OF POROUS EGDM NETWORKS 423
The weight swelling ratio, q w , was calculated using the equation
Pendant Vinyl Groups
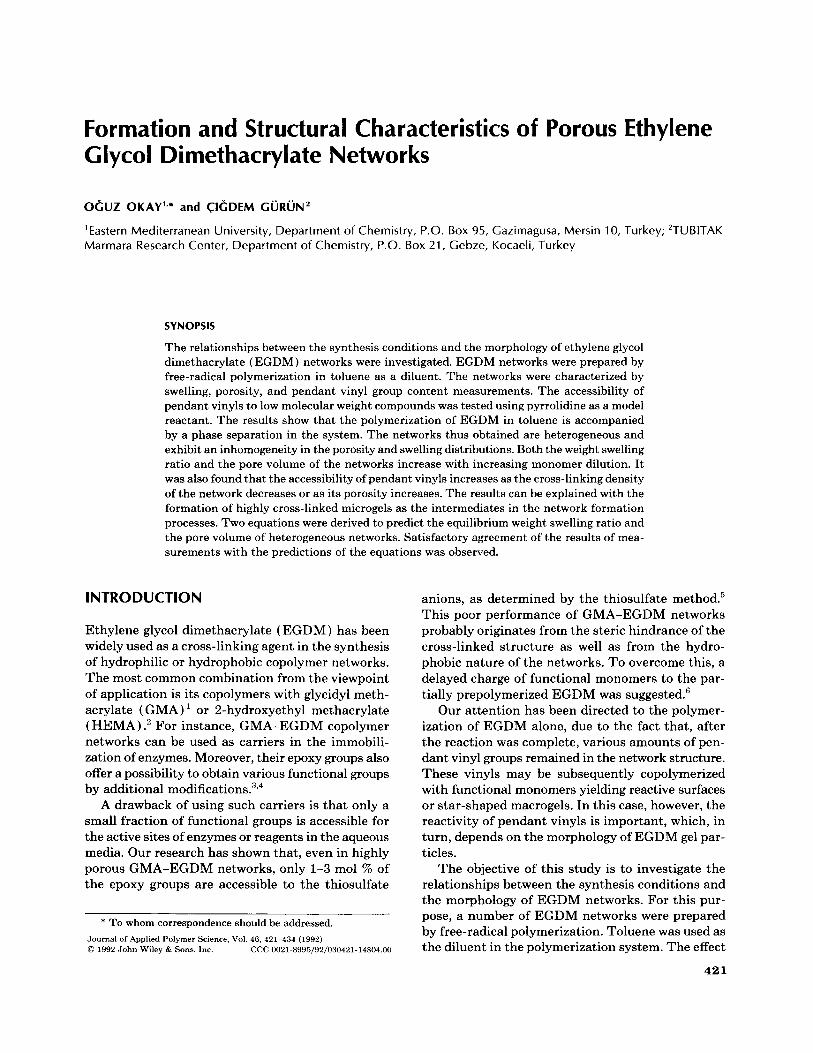
The pendant vinyl groups in the polymer accessible to low molecular weight reactants were determined using the pyrrolidine The method is based on the reaction of vinyl groups with pyrroli- dine ( I ) , and titration of the formed tert-amine (11) with a standard acid solution:
( 3 )
where w, and w d are the swollen and initial weights of the polymer, respectively.
qw = ws/wd
(8 : POLYMERI
Prior to the acid titration, the excess of pyrrolidine is deactivated using acetic acid anhydride:
CH3- C = 0 '0 / \,I+ C H3-C= 0
H
In the present study, the original method was modified by taking toluene instead of benzene as the solvent in order to increase the reaction temperature. Preliminary experiments showed that the vinyl groups in the EGDM monomer react quantitatively with pyrrolidine after a reaction time of 2 h. For the gel samples, the reaction time was increased to 6 h. The following procedure was applied throughout this study:
About 150 mg of the polymer was weighed in a 100 mL flask containing a Teflon-covered magnetic stirring bar. To this, toluene (50 mL) , pyrrolidine ( 3 mL, Merck), and acetic acid (0.5 mL, Merck) were added and the mixture was refluxed for 6 h under stirring. The solution was then cooled to room temperature, and after addition of 6 mL of acetic acid anhydride (Merck), it was stirred for 1 h at room temperature. The mixture was then trans- ferred into a beaker with 5 mL of methanol and titrated potentiometrically with 0.1N methanolic HC1 using glass electrodes ( Metrohm E 536 Poten- tiograph, 655 Dosimat) .
The fraction of units in the polymer bearing ac- cessible pendant vinyls, PV,, was calculated as
N X ( X - Y ) m / M
PV, = (4)
I
I c =o
C H 3
where N is the normality of the standard HC1 so- lution, X and Y are its volumes consumed in the presence and absence of a polymer sample, respec- tively (both in mL) , m is the sample weight in mg, and M is the molecular weight of the EGDM units (198 g/mol). According to eq. (4) , if PV,, = 1, each monomeric unit in the polymer carries one accessible pendant vinyl group.
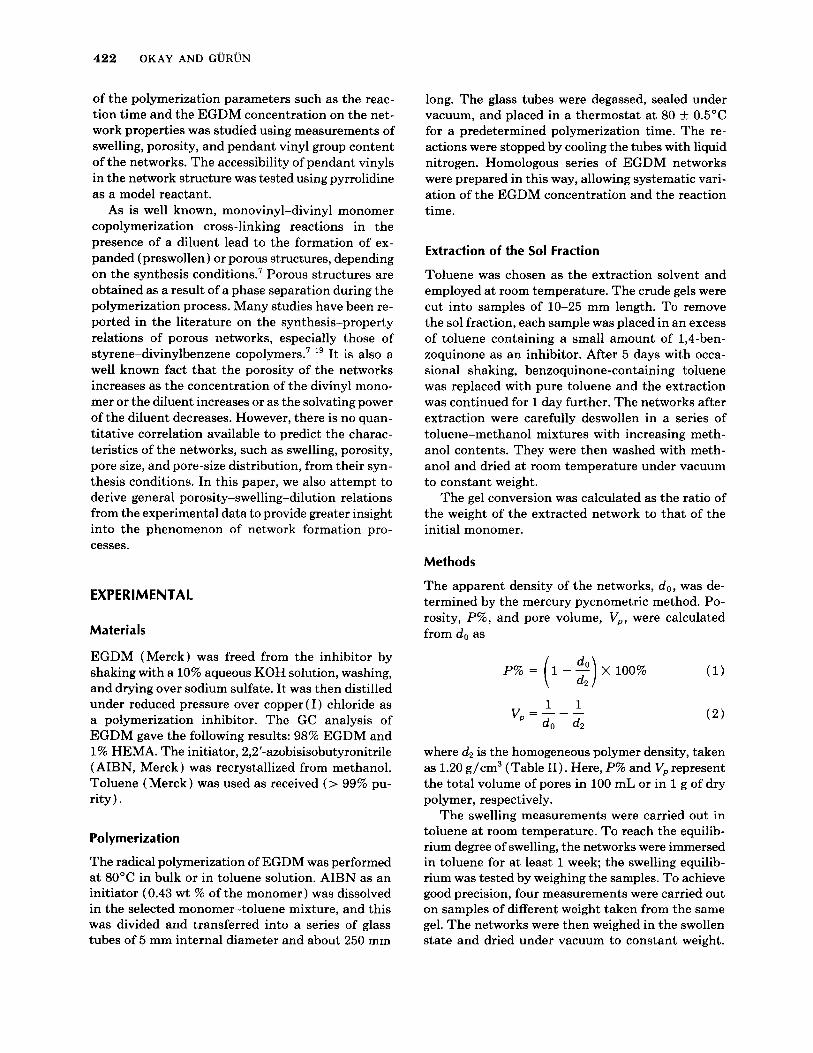
The total content of pendant vinyls in the net- work, PV,, was estimated from IR spectra. The IR spectra of the networks in KBr pellets were recorded on a Perkin-Elmer 983 spectrophotometer. A typical spectrum of the EGDM networks is shown in Figure 1. The absorption peaks of unreacted vinyl groups are shown at 1640 cm-' due to the C = C stretching vibration and at 950 cm-' arising from = CH2 wag- ging vibration. The peak at 1640 cm-' was influenced by traces of water. Therefore, the peak at 950 cm-' was used in the calculations and it was normalized using the peak of methyl groups at 1390 cm-'. The calculation of the absorbances was performed using the base-line method" (Fig. 1). PV, was estimated as
A950
A1390 PV, = -
424 OKAY AND GURUN
3000 2600 2200 1800 1 L a ) no0 0
Wavenumber (an-') Figure 1 IR spectrum of an EGDM network in the KBr pellet. Polymerization time = 20 h. Initial monomer concentration = 50 ~ 0 1 % . The calculation of absorbance is shown schematically at 950 cm-'
where A950 and A13w are the absorbances at 950 cm-' and 1390 cm-', respectively.
RESULTS AND DISCUSSION
Network Formation
In the literature, very few studies deal with the EGDM polymerization. Aso investigated the course of radical EGDM polymerization and proposed a ki- netic scheme of the reacti0ns.2~ Funke and co-work- ers studied the anionic EGDM p o l y m e r i ~ a t i o n . ~ ~ , ~ ~ They observed the formation of intramolecularly cross-linked polymer particles with diameters smaller than 60 nm, called reactive microgels, as the intermediates of the reaction. Reactive EGDM mi- crogels were also isolated by Galina and co-workers in the radical polymerization in benzene.26 Fifty to seventy percent of the EGDM units in the microgels bore pendant vinyl groups.
In this section, we have attempted to investigate the properties of EGDM networks depending on the extent of the polymerization and cross-linking re-
actions. The polymerization was carried out at 80°C in toluene and at an initial monomer concentration 50 vol %.
Visual observation showed that the reaction mix- ture becomes turbid after a polymerization time of 1.5 min, indicating the occurrence of a phase sepa- ration in the system. Since EGDM-toluene mixtures are good solvents for the formed polymer, a phase separation may only occur due to the increasing cross-linking density of the p01ymer.~ Accordingly, the maximum swelling of the polymer gel will de- crease during the course of the EGDM polymeriza- tion until it reaches the concentration of the residual monomer-diluent mixture. At this point, as the maximum swelling cannot be smaller than the de- gree of dilution, the originally homogeneous system must separate into two phases, resulting in the ap- pearance of a turbidity in the reaction mixture.
The gel conversion and the equilibrium weight swelling ratio of the EGDM networks, qw, are shown in Figure 2 as a function of the polymerization time. In Figure 3, the time dependence of the reciprocal qw values is given. By extrapolating the curves to zero gel conversion or to infinite swelling (4;' = 0 ) ,
NO
80
6C
to
20
0
FORMATION OF POROUS EGDM NETWORKS 425
1
I
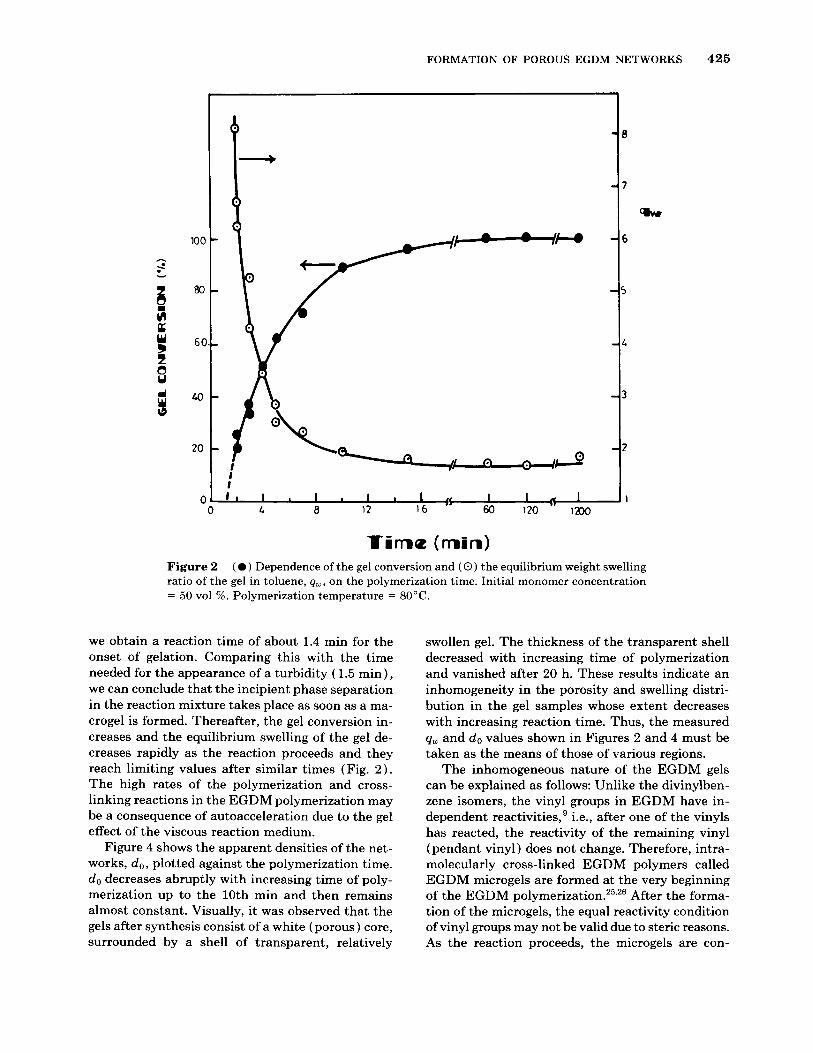
Figure 2 ( 0 ) Dependence of the gel conversion and ( 0 ) the equilibrium weight swelling ratio of the gel in toluene, qw, on the polymerization time. Initial monomer concentration = 50 vol %. Polymerization temperature = 80°C.
we obtain a reaction time of about 1.4 min for the onset of gelation. Comparing this with the time needed for the appearance of a turbidity ( 1.5 min), we can conclude that the incipient phase separation in the reaction mixture takes place as soon as a ma- crogel is formed. Thereafter, the gel conversion in- creases and the equilibrium swelling of the gel de- creases rapidly as the reaction proceeds and they reach limiting values after similar times (Fig. 2 ) . The high rates of the polymerization and cross- linking reactions in the EGDM polymerization may be a consequence of autoacceleration due to the gel effect of the viscous reaction medium.
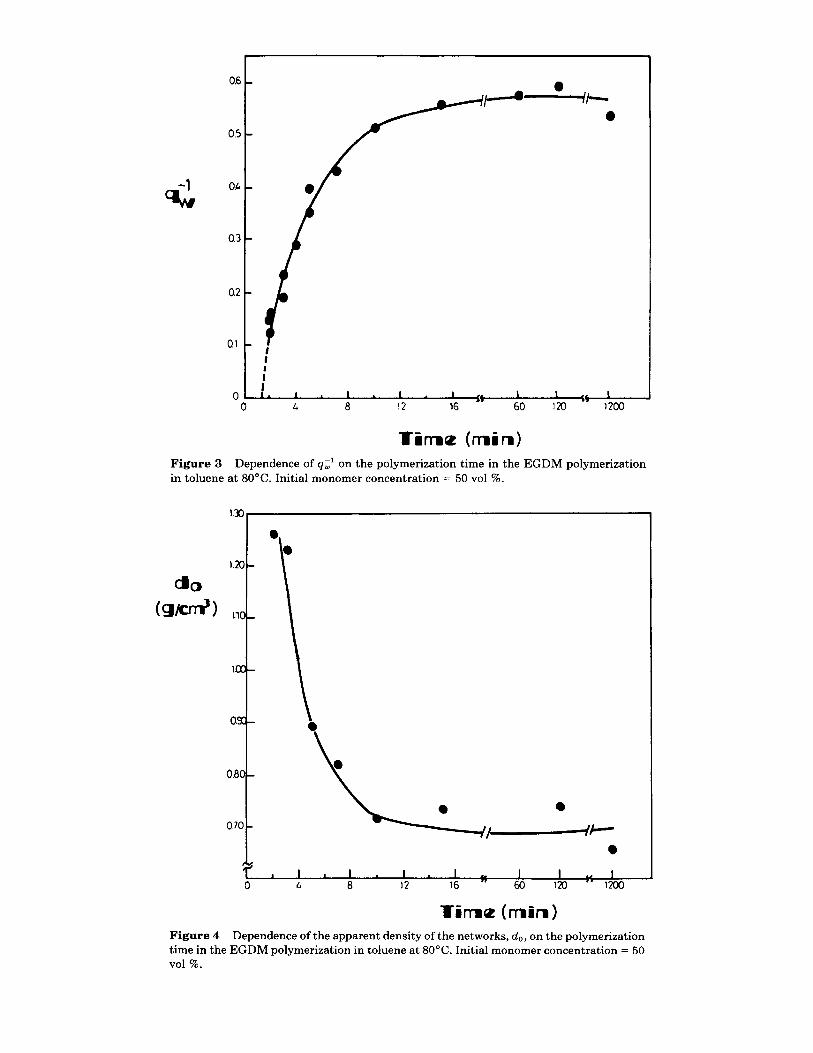
Figure 4 shows the apparent densities of the net- works, d o , plotted against the polymerization time. do decreases abruptly with increasing time of poly- merization up to the 10th min and then remains almost constant. Visually, it was observed that the gels after synthesis consist of a white (porous) core, surrounded by a shell of transparent, relatively
swollen gel. The thickness of the transparent shell decreased with increasing time of polymerization and vanished after 20 h. These results indicate an inhomogeneity in the porosity and swelling distri- bution in the gel samples whose extent decreases with increasing reaction time. Thus, the measured qw and do values shown in Figures 2 and 4 must be taken as the means of those of various regions.
The inhomogeneous nature of the EGDM gels can be explained as follows: Unlike the divinylben- zene isomers, the vinyl groups in EGDM have in- dependent reactivities,' i.e., after one of the vinyls has reacted, the reactivity of the remaining vinyl (pendant vinyl) does not change. Therefore, intra- molecularly cross-linked EGDM polymers called EGDM microgels are formed at the very beginning of the EGDM p ~ l y m e r i z a t i o n . ~ ~ , ~ ~ After the forma- tion of the microgels, the equal reactivity condition of vinyl groups may not be valid due to steric reasons. As the reaction proceeds, the microgels are con-
q;:
0.6
05
oc.
0.3
0.2
QI
0 0
- 0 -
-
-
-
I I I I I
-
I . I . I . L 8 I2 16 ' +-k-+i? llzoo
1 .
t i m ~ (min) Figure 3 in toluene at 80°C. Initial monomer concentration = 50 vol %.
Dependence of qL1 on the polymerization time in the EGDM polymerization
I I I I . I u I I u
0 L 8 12 16 " 60 120 " 1200
Figure 4 Dependence of the apparent density of the networks, do, on the polymerization time in the EGDM polymerization in toluene a t 80°C. Initial monomer concentration = 50 vol %.
FORMATION OF POROUS EGDM NETWORKS 427
nected to a macrogel through their peripheral pen- dant vinyls and radical ends, whereas those in their interior remain intact. At the onset of the phase separation, a dilute solution phase containing EGDM, toluene, and free microgels separates out of the network phase and the network collapses. Thereafter, the reaction in the solution phase can be expected to proceed at a slower rate than that in the network phase due to the low monomer concen- tration as well as due to the absence of a gel effect, leading to the formation of less porous and more swellable regions in the network at insufficient re- action times.
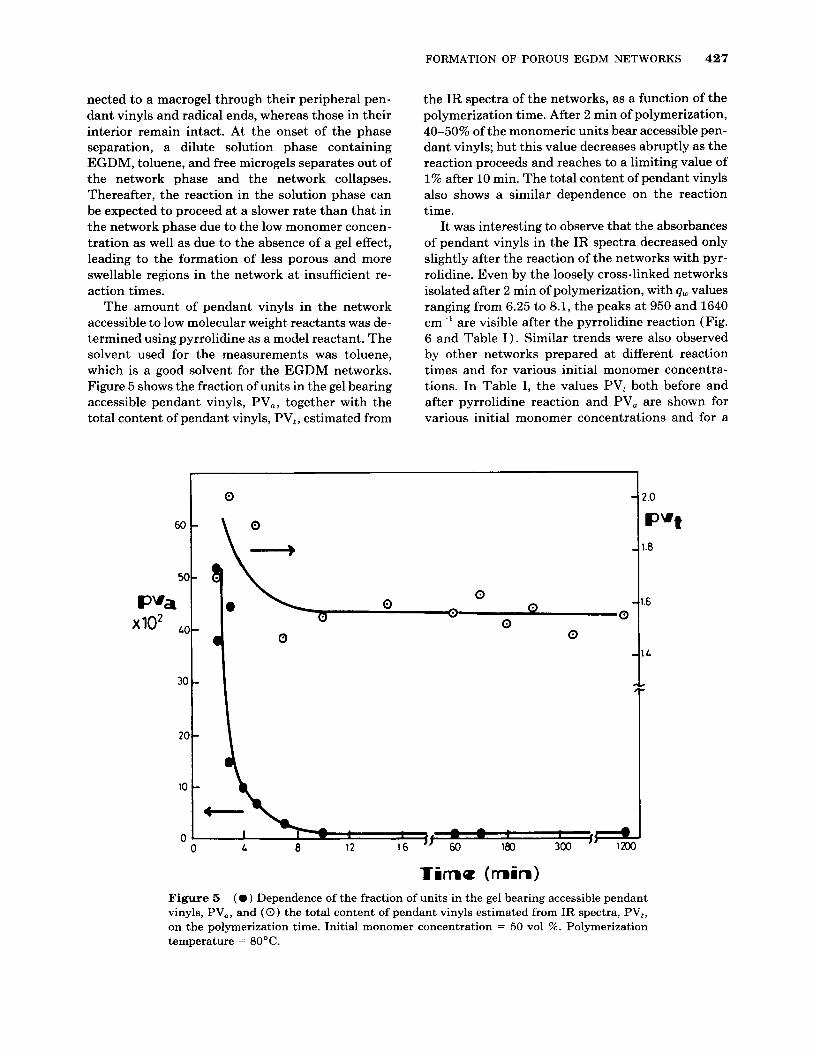
The amount of pendant vinyls in the network accessible to low molecular weight reactants was de- termined using pyrrolidine as a model reactant. The solvent used for the measurements was toluene, which is a good solvent for the EGDM networks. Figure 5 shows the fraction of units in the gel bearing accessible pendant vinyls, PV,, together with the total content of pendant vinyls, PV,, estimated from
60
5(
PVa x102 ,/(
3c
2(
1C
0
the IR spectra of the networks, as a function of the polymerization time. After 2 min of polymerization, 40-50% of the monomeric units bear accessible pen- dant vinyls; but this value decreases abruptly as the reaction proceeds and reaches to a limiting value of 1% after 10 min. The total content of pendant vinyls also shows a similar dependence on the reaction time.
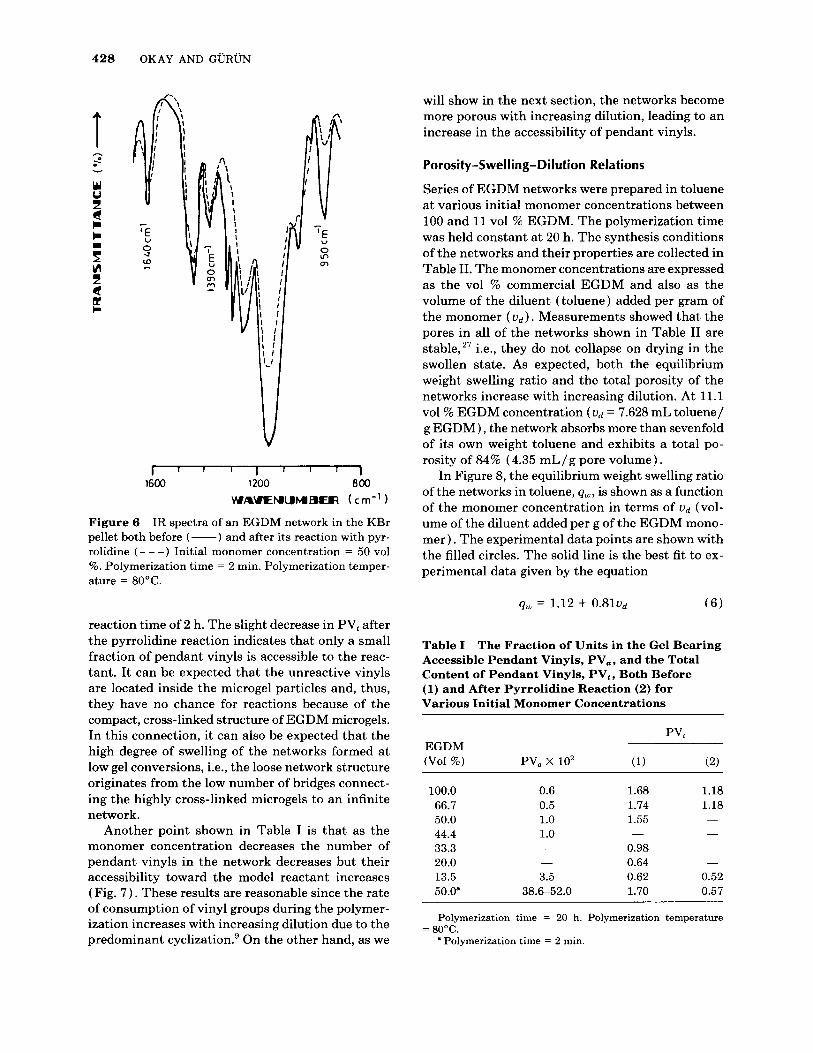
It was interesting to observe that the absorbances of pendant vinyls in the IR spectra decreased only slightly after the reaction of the networks with pyr- rolidine. Even by the loosely cross-linked networks isolated after 2 min of polymerization, with qW values ranging from 6.25 to 8.1, the peaks at 950 and 1640 cm-’ are visible after the pyrrolidine reaction (Fig. 6 and Table I ) . Similar trends were also observed by other networks prepared at different reaction times and for various initial monomer concentra- tions. In Table I, the values PV, both before and after pyrrolidine reaction and PV, are shown for various initial monomer concentrations and for a
0
0 0 \\ I
2 .o
pvt 1.8
1.6
l.L
Figure 5 ( 0 ) Dependence of the fraction of units in the gel bearing accessible pendant vinyls, PV,, and ( 0 ) the total content of pendant vinyls estimated from IR spectra, PV,, on the polymerization time. Initial monomer concentration = 50 vol %. Polymerization temperature = 80°C.
428 OKAY AND GURUN
T I.
V r r l 1 1 I I I
1600 1200 BOO WAVENUMBER ( c m - l )
Figure 6 IR spectra of an EGDM network in the KBr pellet both before (-) and after its reaction with pyr- rolidine ( - - -) Initial monomer concentration = 50 vol %. Polymerization time = 2 min. Polymerization temper- ature = 80°C.
reaction time of 2 h. The slight decrease in PV, after the pyrrolidine reaction indicates that only a small fraction of pendant vinyls is accessible to the reac- tant. It can be expected that the unreactive vinyls are located inside the microgel particles and, thus, they have no chance for reactions because of the compact, cross-linked structure of EGDM microgels. In this connection, it can also be expected that the high degree of swelling of the networks formed at low gel conversions, i.e., the loose network structure originates from the low number of bridges connect- ing the highly cross-linked microgels to an infinite network.
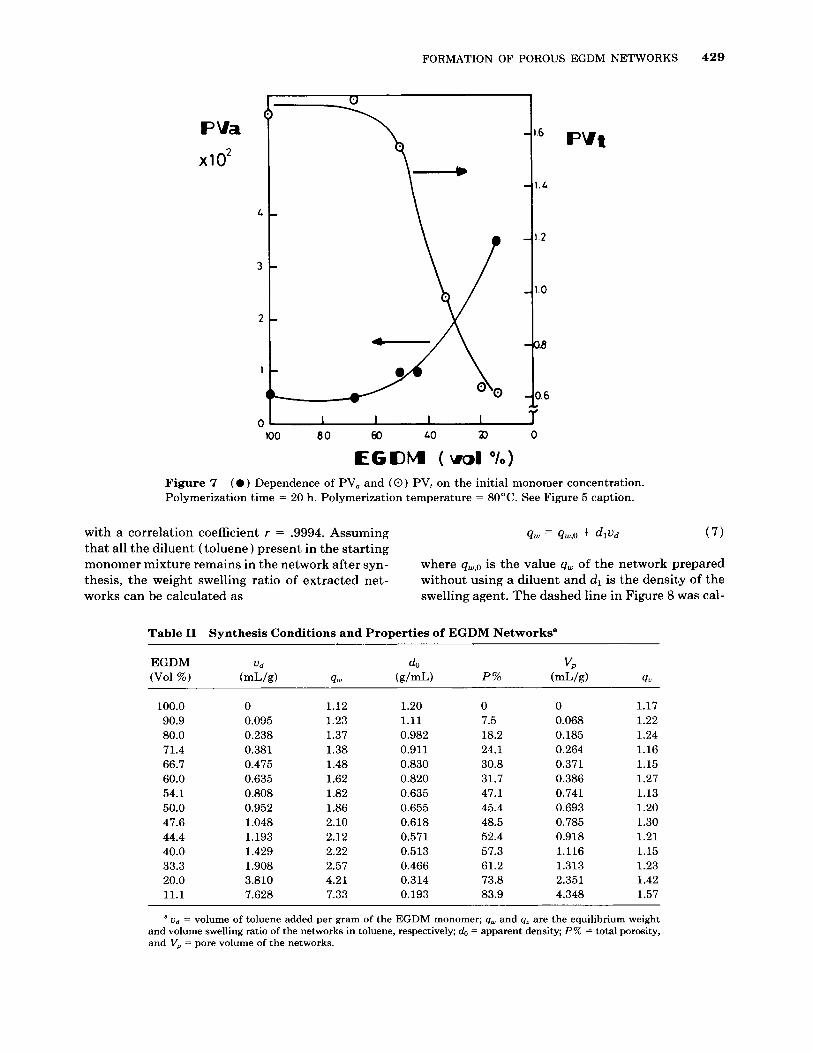
Another point shown in Table I is that as the monomer concentration decreases the number of pendant vinyls in the network decreases but their accessibility toward the model reactant increases (Fig. 7) . These results are reasonable since the rate of consumption of vinyl groups during the polymer- ization increases with increasing dilution due to the predominant cycli~ation.~ On the other hand, as we
will show in the next section, the networks become more porous with increasing dilution, leading to an increase in the accessibility of pendant vinyls.
Porosity-Swelling-Dilution Relations
Series of EGDM networks were prepared in toluene at various initial monomer concentrations between 100 and 11 vol % EGDM. The polymerization time was held constant at 20 h. The synthesis conditions of the networks and their properties are collected in Table 11. The monomer concentrations are expressed as the vol % commercial EGDM and also as the volume of the diluent (toluene) added per gram of the monomer ( v d ) . Measurements showed that the pores in all of the networks shown in Table I1 are stable,27 i.e., they do not collapse on drying in the swollen state. As expected, both the equilibrium weight swelling ratio and the total porosity of the networks increase with increasing dilution. At 11.1 vol % EGDM concentration (vd = 7.628 mL toluene/ g EGDM) , the network absorbs more than sevenfold of its own weight toluene and exhibits a total po- rosity of 84% (4.35 mL/g pore volume).
In Figure 8, the equilibrium weight swelling ratio of the networks in toluene, q,,,, is shown as a function of the monomer concentration in terms of vd (vol- ume of the diluent added per g of the EGDM mono- mer). The experimental data points are shown with the filled circles. The solid line is the best fit to ex- perimental data given by the equation
Table I Accessible Pendant Vinyls, PV, , and the Total Content of Pendant Vinyls, PVt, Both Before (1) and After Pyrrolidine Reaction (2) for Various Initial Monomer Concentrations
The Fraction of Units in the Gel Bearing
100.0 66.7 50.0 44.4 33.3 20.0 13.5 50.0"
0.6 0.5 1.0 1.0
3.5 38.6-52.0
1.68 1.74 1.55
0.98 0.64 0.62 1.70
-
1.18 1.18 -
0.52 0.57
Polymerization time = 20 h. Polymerization temperature
a Polymerization time = 2 min. = 80°C.
FORMATION OF POROUS EGDM NETWORKS 429
PVa
xlO2
00 80 60 LO P 0
EGDM ( v d ' 1 0 )
PVt
.L
. 2
.O
IE
). 6
Figure 7 Polymerization time = 20 h. Polymerization temperature = 80°C. See Figure 5 caption.
( 0 ) Dependence of PV, and (0) PV, on the initial monomer concentration.
with a correlation coefficient r = .9994. Assuming q w = qw,O -k dlud ( 7 )
where qw,o is the value qw of the network prepared without using a diluent and dl is the density of the swelling agent. The dashed line in Figure 8 was cal-
that all the diluent (toluene) present in the starting monomer mixture remains in the network after syn- thesis, the weight swelling ratio of extracted net- works can be calculated as
Table I1 Synthesis Conditions and Properties of EGDM Networks'
a ud = volume of toluene added per gram of the EGDM monomer; qw and q. are the equilibrium weight and volume swelling ratio of the networks in toluene, respectively; do = apparent density; P% = total porosity, and V, = pore volume of the networks.
430 OKAY AND GURUN
0 1.0 2 0
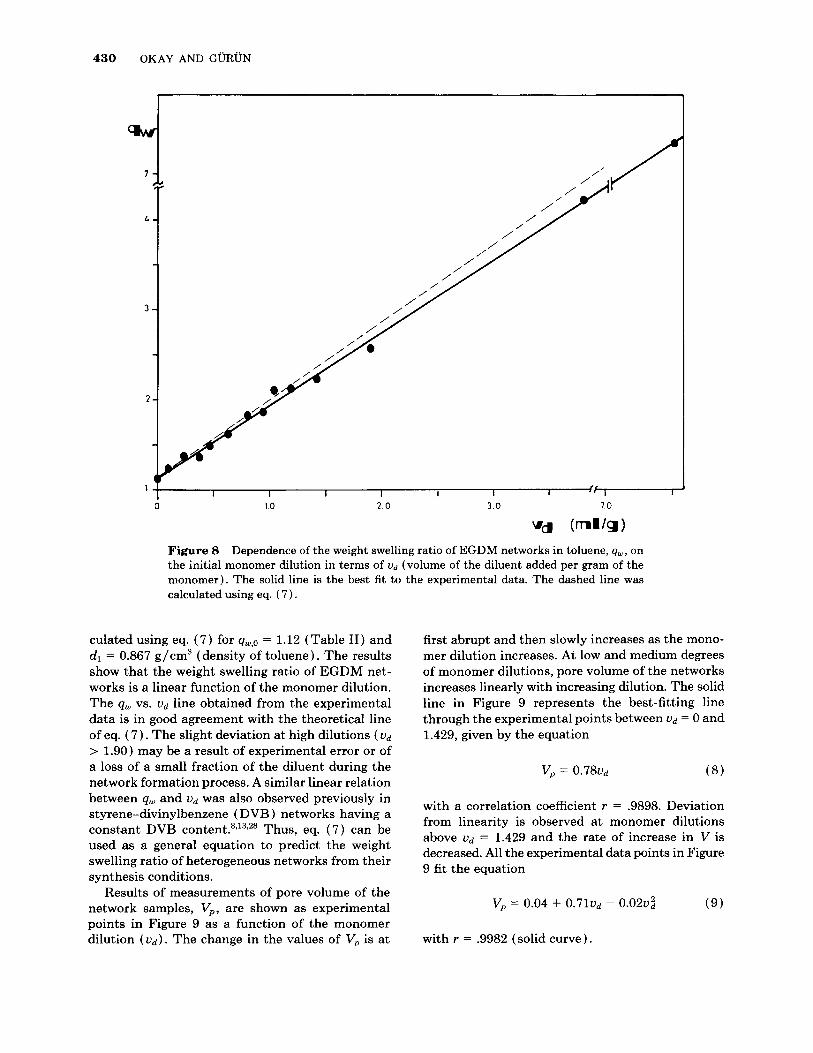
Figure 8 Dependence of the weight swelling ratio of EGDM networks in toluene, q w , on the initial monomer dilution in terms of ud (volume of the diluent added per gram of the monomer). The solid line is the best fit to the experimental data. The dashed line was calculated using eq. ( 7 ) .
culated using eq. ( 7) for qw,o = 1.12 (Table 11) and dl = 0.867 g/cm3 (density of toluene). The results show that the weight swelling ratio of EGDM net- works is a linear function of the monomer dilution. The qw vs. vd line obtained from the experimental data is in good agreement with the theoretical line of eq. (7 ) . The slight deviation at high dilutions ( v d
> 1.90) may be a result of experimental error or of a loss of a small fraction of the diluent during the network formation process. A similar linear relation between qw and vd was also observed previously in styrene-divinylbenzene ( DVB ) networks having a constant DVB c ~ n t e n t . ' ~ ' ~ ~ ~ ~ Thus, eq. (7) can be used as a general equation to predict the weight swelling ratio of heterogeneous networks from their synthesis conditions.
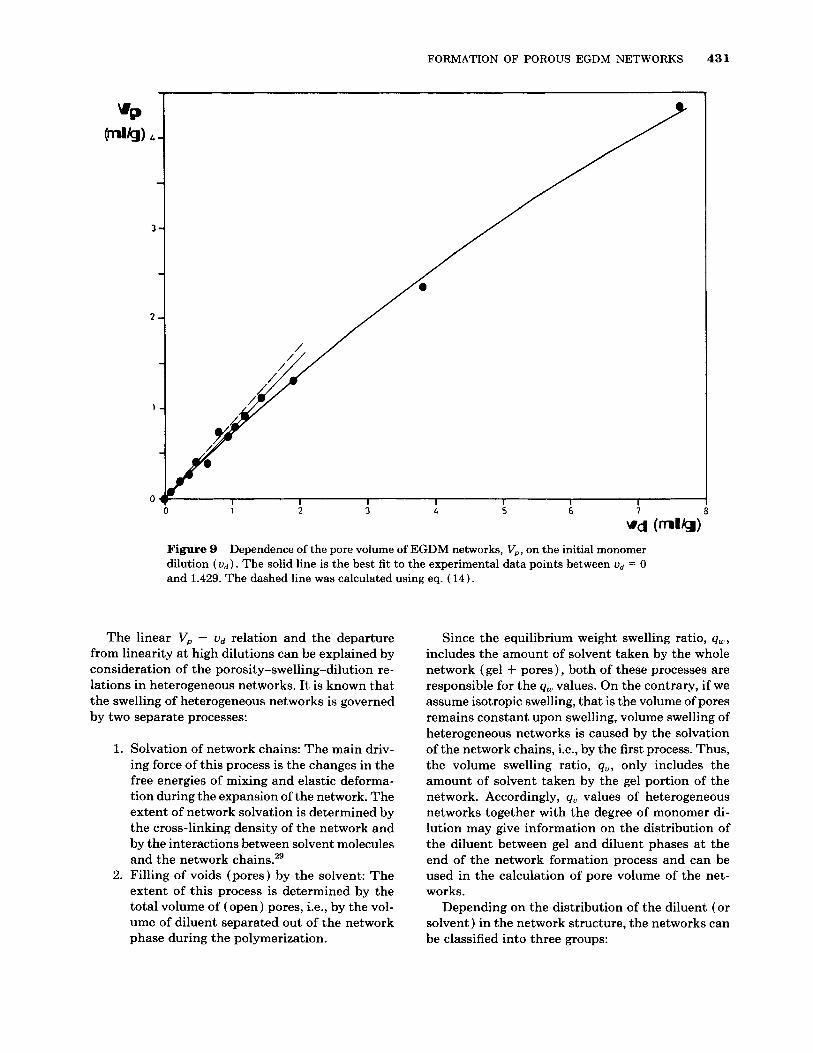
Results of measurements of pore volume of the network samples, V,, are shown as experimental points in Figure 9 as a function of the monomer dilution ( v d ) . The change in the values of V, is at
first abrupt and then slowly increases as the mono- mer dilution increases. At low and medium degrees of monomer dilutions, pore volume of the networks increases linearly with increasing dilution. The solid line in Figure 9 represents the best-fitting line through the experimental points between vd = 0 and 1.429, given by the equation
with a correlation coefficient r = .9898. Deviation from linearity is observed at monomer dilutions above vd = 1.429 and the rate of increase in v is decreased. All the experimental data points in Figure 9 fit the equation
V, = 0.04 + 0.71vd - 0 .02~2 ( 9 )
with r = .9982 (solid curve).
FORMATION OF POROUS EGDM NETWORKS
Figure 9 Dependence of the pore volume of EGDM networks, V,, on the initial monomer dilution ( u d ) . The solid line is the best fit to the experimental data points between ud = 0 and 1.429. The dashed line was calculated using eq. ( 14).
13 1
The linear V, - ud relation and the departure from linearity at high dilutions can be explained by consideration of the porosity-swelling-dilution re- lations in heterogeneous networks. It is known that the swelling of heterogeneous networks is governed by two separate processes:
1. Solvation of network chains: The main driv- ing force of this process is the changes in the free energies of mixing and elastic deforma- tion during the expansion of the network. The extent of network solvation is determined by the cross-linking density of the network and by the interactions between solvent molecules and the network chains.29
2. Filling of voids (pores) by the solvent: The extent of this process is determined by the total volume of (open) pores, i.e., by the vol- ume of diluent separated out of the network phase during the polymerization.
Since the equilibrium weight swelling ratio, qw , includes the amount of solvent taken by the whole network (gel + pores) , both of these processes are responsible for the qw values. On the contrary, if we assume isotropic swelling, that is the volume of pores remains constant upon swelling, volume swelling of heterogeneous networks is caused by the solvation of the network chains, i.e., by the first process. Thus, the volume swelling ratio, qu, only includes the amount of solvent taken by the gel portion of the network. Accordingly, qu values of heterogeneous networks together with the degree of monomer di- lution may give information on the distribution of the diluent between gel and diluent phases at the end of the network formation process and can be used in the calculation of pore volume of the net- works.
Depending on the distribution of the diluent (or solvent) in the network structure, the networks can be classified into three groups:
432 OKAY AND GURUN
1. Expanded ( preswollen ) networks: Expanded network structures are obtained if the diluent present during the network formation re- mains in the gel throughout the polymeriza- tion. Expanded networks are thus nonporous. During the removal of the diluent and drying, the expanded network collapses, but revers- ibly, so that on addition of a good solvent, it reexpands to its earlier state. Both the weight and volume degrees of swelling of expanded networks increase with increasing dilution due to the increasing solvation of the network chains.
2. Heterogeneous dry networks: The diluent separates totally out of the network phase during the polymerization and acts only as a pore-forming agent. The increase in the weight swelling ratio with increasing dilution is due to the increasing volume of pores, which are filled with solvent. Since the dil- uent exists as a separate phase during the polymerization, the effects of cyclization and change in the contents of trapped entangle- ments on the network structure can be ne-
glected. Thus, the volume degree of swelling does not change with the degree of dilution.
3. Heterogeneous swollen networks: The diluent separates partially out of the network phase during the polymerization. Thus, it distrib- utes between network and diluent phases af- ter synthesis. A part of the diluent acts as a pore-forming agent, whereas the other part remains in the network structure and in- creases its volume degree of swelling.
Assuming isotropic swelling, the volume swelling ratio of the networks, qu, can be calculated from their weight swelling ratio, qw, and apparent density, do, as follows:
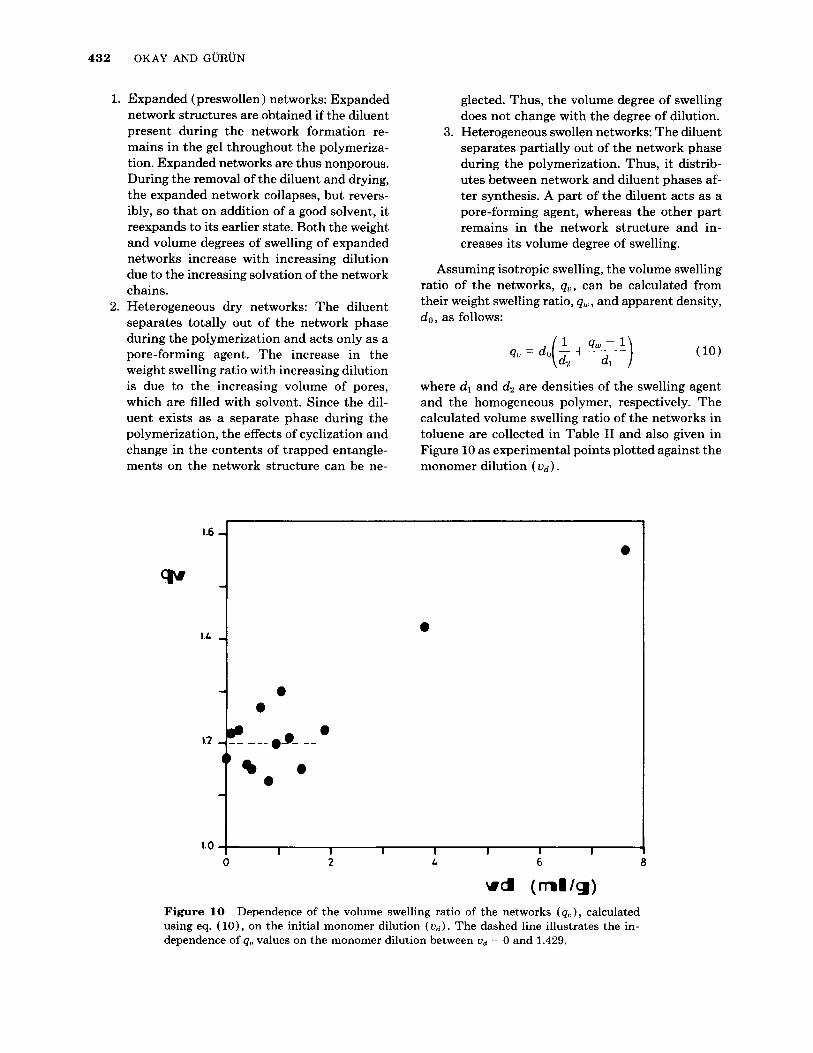
where dl and d2 are densities of the swelling agent and the homogeneous polymer, respectively. The calculated volume swelling ratio of the networks in toluene are collected in Table I1 and also given in Figure 10 as experimental points plotted against the monomer dilution ( u d ) .
0
8 1.0
0 2 L 6
vd (ml/g) Figure 10 Dependence of the volume swelling ratio of the networks ( q ” ) , calculated using eq. ( l o ) , on the initial monomer dilution ( u d ) . The dashed line illustrates the in- dependence of qu values on the monomer dilution between ud = 0 and 1.429.
FORMATION OF POROUS EGDM NETWORKS 433
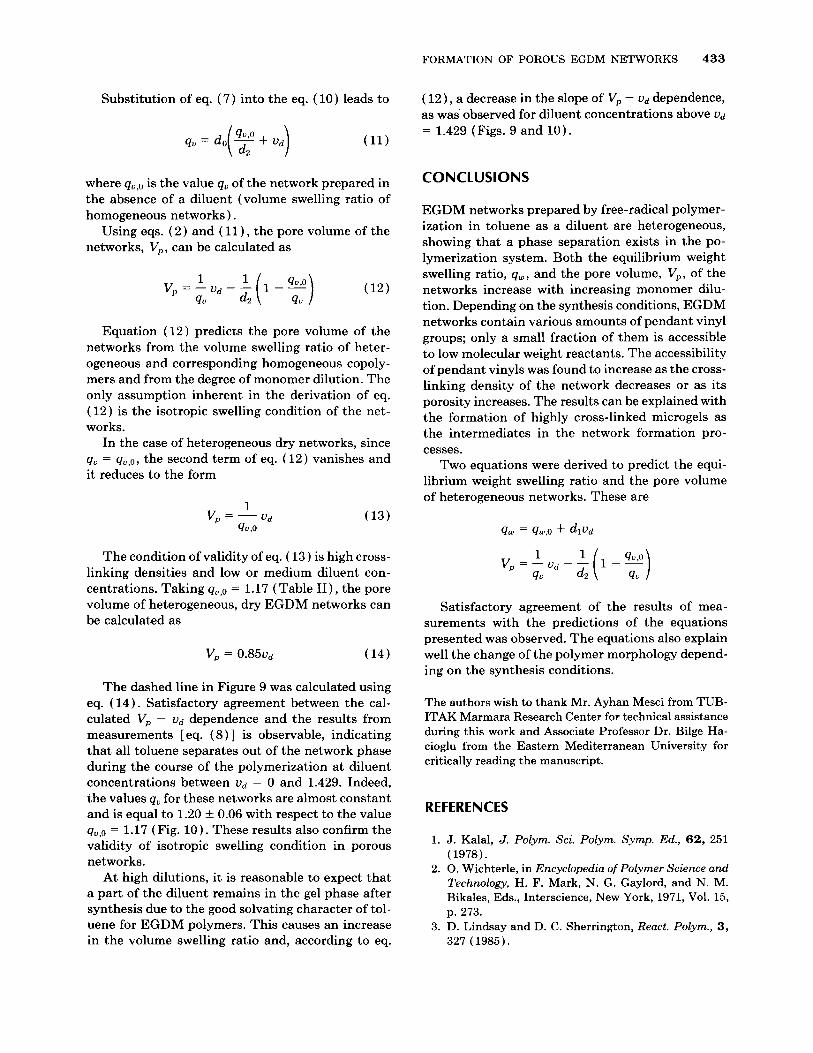
Substitution of eq. ( 7 ) into the eq. ( 10) leads to
where qu,o is the value qu of the network prepared in the absence of a diluent (volume swelling ratio of homogeneous networks).
Using eqs. ( 2 ) and ( 11 ) , the pore volume of the networks, V,, can be calculated as
Equation (12) predicts the pore volume of the networks from the volume swelling ratio of heter- ogeneous and corresponding homogeneous copoly- mers and from the degree of monomer dilution. The only assumption inherent in the derivation of eq. (12) is the isotropic swelling condition of the net- works.
In the case of heterogeneous dry networks, since qu = qu,o, the second term of eq. ( 12) vanishes and it reduces to the form
The condition of validity of eq. ( 13) is high cross- linking densities and low or medium diluent con- centrations. Taking qu,o = 1.17 (Table 11), the pore volume of heterogeneous, dry EGDM networks can be calculated as
The dashed line in Figure 9 was calculated using eq. ( 14). Satisfactory agreement between the cal- culated V, - u d dependence and the results from measurements [ eq. (8) 3 is observable, indicating that all toluene separates out of the network phase during the course of the polymerization at diluent concentrations between u d = 0 and 1.429. Indeed, the values qu for these networks are almost constant and is equal to 1.20 k 0.06 with respect to the value qu,o = 1.17 (Fig. 10). These results also confirm the validity of isotropic swelling condition in porous networks.
At high dilutions, it is reasonable to expect that a part of the diluent remains in the gel phase after synthesis due to the good solvating character of tol- uene for EGDM polymers. This causes an increase in the volume swelling ratio and, according to eq.
( 12), a decrease in the slope of V, - u d dependence, as was observed for diluent concentrations above u d = 1.429 (Figs. 9 and 10).
CONCLUSIONS
EGDM networks prepared by free-radical polymer- ization in toluene as a diluent are heterogeneous, showing that a phase separation exists in the po- lymerization system. Both the equilibrium weight swelling ratio, q w , and the pore volume, V,, of the networks increase with increasing monomer dilu- tion. Depending on the synthesis conditions, EGDM networks contain various amounts of pendant vinyl groups; only a small fraction of them is accessible to low molecular weight reactants. The accessibility of pendant vinyls was found to increase as the cross- linking density of the network decreases or as its porosity increases. The results can be explained with the formation of highly cross-linked microgels as the intermediates in the network formation pro- cesses.
Two equations were derived to predict the equi- librium weight swelling ratio and the pore volume of heterogeneous networks. These are
Satisfactory agreement of the results of mea- surements with the predictions of the equations presented was observed. The equations also explain well the change of the polymer morphology depend- ing on the synthesis conditions.
The authors wish to thank Mr. Ayhan Mesci from TUB- ITAK Marmara Research Center for technical assistance during this work and Associate Professor Dr. Bilge Ha- cioglu from the Eastern Mediterranean University for critically reading the manuscript.
REFERENCES
1. J. Kalal, J. Polym. Sci. Polym. Symp. Ed., 62, 251 ( 1978).
2. 0. Wichterle, in Encyclopedia of Polymer Science and Technology, H. F. Mark, N. G. Gaylord, and N. M. Bikales, Eds., Interscience, New York, 1971, Vol. 15, p. 273.
3. D. Lindsay and D. C. Sherrington, React. Polym., 3, 327 ( 1985).
434 OKAY AND GURUN
4. M. Jelinkova, L. K. Shataeva, G. A. Tischenko, and F. Svec, React. Polym., 11, 253 (1989).
5. L. Sundberg and J. Porath, J. Chromutogr., 90, 89 (1974).
6. Y. Ohtsuka, H. Kawaguchi, and T. Yamamoto, J. Appl. Polym. Sci., 27, 3279 (1982).
7. J. Seidl, J. Malinsky, K. Dusek, and W. Heitz, Adu. Polym. Sci., 5, 113 (1967).
8. J. R. Millar, D. G. Smith, W. E. Marr, and T. R. E. Kressman, J. Chem. SOC. fLond.1, 218, 218 (1963).
9. K. Dusek, in Developments in Polymerization 3, R. N. Haward, Ed., Applied Science, London, 1982, p. 143.
10. H. Jacobelli, M. Bartholin, and A. Guyot, Angew. Makromol. Chem., 80,31 (1979).
11. P. P. Wieczorek, B. N. Kolarz, and H. Galina, Angew. Makromol. Chem., 126,39 ( 1984).
12. H. Galina, B. N. Kolarz, and M. Wojczynska, Br. Polym. J., 17 ,215 (1985).
13. 0. Okay, E. Soner, A. Gungor, and T. I. Balkas, J. Appl. Polym. Sci., 30, 2065 (1985).
14. 0. Okay, J. Appl. Polym. Sci., 32,5533 (1986). 15. S. Dragan, D. Csergo, I. Manolescu, and A. Carpov,
16. I. G. C. Poinescu and A. Carpov, Rev. Roum. Chim., React. Polym., 6 , 123 (1987).
34 ,1081 (1989).
17. Y. Jun, X. Rongnan, andY. Juntan, J. Appl. Polym. Sci., 3 8 , 4 5 (1989).
18. F. M. B. Coutinho and R. C. A. Cid, Eur. Polym. J., 26,1185 (1990).
19. K. J. Shea, G. J. Stoddard, D. M. Shavelle, F. Wakui, and R. M. Choate, Macromolecules, 23,4497 ( 1990).
20. M. Bachmann and R. Dagon, Chimia, 26,262 (1972). 21. W. Beer, Thesis, University of Stuttgart, 1973. 22. J. E. Stewart, Infrared Spectroscopy, Experimental
Methods and Techniques, Marcel Dekker, New York, 1970, p. 524.
23. C. Aso, J. Polym. Sci., 39, 475 (1959). 24. R. Spang, Diplomarbeit, University of Stuttgart, 1974. 25. W. Straehle and W. Funke, Makromol. Chem., 179,
26. H. Galina, K. Dusek, Z. Tuzar, M. Bohdanecky, and
27. 0. Okay, Angew. Makromol. Chem., 157, 15 (1988). 28. 0. Okay, Angew. Makromol. Chem., 157, l (1988) . 29. P. J. Flory, Principles of Polymer Chemistry, Cornell