Formation, Characteristics and Electrocatalytic Properties of Nanoporous
Metals Formed by Dealloying of Ternary-Noble Alloys
Adrián Alberto Vega Zúñiga
Doctor of Philosophy
Department of Chemical Engineering and Applied Chemistry University of Toronto
2014
Abstract
Nanoporous metals formed by electrochemical dealloying of silver from Ag-Au-Pt
alloys, with 77 at.% silver and platinum contents of 1, 2 and 3 at.%, have been studied. The
presence of platinum, which is immobile relative to gold, refine the ligament size and
stabilized the nanostructure against coarsening, even under experimental conditions that
would be expected to promote coarsening (e.g., exposure to high temperature, longer
dealloying times). By adding only 1 at.% Pt to the alloy precursor, the ligament/pore size
was reduced by 50% with respect to that in nanoporous gold (NPG), which was formed on a
Ag-Au alloy with the same silver content as ternary alloys. A further decrease in the
ligament size was observed by increasing the platinum content of the precursor; however,
most of the improvement occurred with 1 at.% Pt.
The adsorbate-induced surface segregation of platinum was also investigated for
these nanoporous metals. By exposing freshly-dealloyed nanostructures to moderate
temperatures in the presence of air, platinum segregated to the ligament surface; in
contrast, in an inert atmosphere (Ar-H2), platinum mostly reverted to the bulk of the
ligaments. This thermally activated process was thermodynamically driven by the interaction
iii
between platinum and oxygen; however, at the desorption temperature of oxygen, platinum
de-segregated from the surface. Moreover, the co-segregation of platinum and oxygen
hindered the thermal coarsening of the ligaments.
Finally, the electrocatalytic abilities of these nanostructures were studied towards
methanol and ethanol electro-oxidation, in alkaline and acidic media, showing significantly
improved response in comparison to that observed in NPG. The synergistic effect between
gold and platinum atoms and the smaller feature size of the nanostructures were directly
associated with this behaviour. In alkaline electrolyte, the nanostructure formed on the alloy
with 1 at.% Pt showed higher catalytic response than the other two ternary nanostructures,
which could be associated with the platinum/gold ratio on the surface of the structure. In
acidic electrolyte, the nanostructure with the highest platinum content displayed the highest
electrocatalytic response. Furthermore, the presence of platinum changed the selectivity of
both reactions: the concentrations of carbonate produced increased by increasing the
platinum content in the alloy precursor.
iv
Acknowledgements
My sincere gratitude is due toward my supervisor, Dr. Roger C. Newman for his
continuous guidance, support, encouragement, and valuable feedback throughout this
research work. His support, generosity and guidance gave me the chance to overcome
many of the challenges that I faced during this process.
I also thank Dr. Donald W. Kirk and Dr. Edgar J. Acosta for serving on my Ph.D
committee and providing valuable feedback to strengthen my project. I am also thankful to
Dr. Doug Perovic and Dr. Joey Kish for agreeing to be examiners in the dissertation
defence. Thanks very much to all of them for their valuable comments and suggestions.
I am grateful to Mariusz A. Brik, Jaganathan Ulaganathan, Dorota Artymowicz and
Anatolie Carcea for providing lengthy and valuable discussions generating excellent ideas. I
am especially grateful to Nick Senior for his help, advise, constant support and friendship
during most of this process. Certainly all of them have contributed to achieve my goals
during my Ph.D.
My thanks are also extended to Ilya Gourevich, Peter Brodersen, Neil Coombs,
George Kretchmann, Joel Tang and Sal Boccia for sharing their expertise on specific topics
and for providing their time and minds to solve technical issues.
Special thanks also to the faculty and staff of the Department of Chemical Engineering
and Applied Chemistry for their support and for the friendly environment that I found here. I
would like to acknowledge also the generous funding contributed by NSERC.
v
Lastly, I would like to express my deepest appreciation and respect to my family,
especially my parents, Willy and Giselle, my wife Olga and my son Sebastián for giving me
hope, courage and an amazing support throughout this process.
vi
Dedication
To Olga and Sebastián
vii
Co-Authorship Statement
All manuscript-based chapters of this thesis were co-authored with my research
supervisor, Dr. Roger C. Newman. My contribution was the planning and execution of the
experiments, the collection and analysis of the experimental data and the writing of the
manuscripts. Dr. Roger. C. Newman largely contributed to the improvement of experimental
plans, the discussion of the results, and the revision of the manuscript drafts.
viii
Quote
The victory of success is half won when one gains the habit of setting goals and achieving them. Even the most tedious chore will become endurable as you parade through each day convinced that every task, no matter how menial or boring, brings you closer to fulfilling your dreams.
Og Mandino
ix
Table of Contents
Abstract ....................................................................................................................................... ii
Acknowledgements.................................................................................................................... iv
Dedication .................................................................................................................................. vi
Co-Authorship Statement ......................................................................................................... vii
Quote ........................................................................................................................................ viii
Table of Contents ...................................................................................................................... ix
List of Tables............................................................................................................................ xiv
List of Figures ........................................................................................................................... xv
List of Appendices .................................................................................................................. xxvi
Table 2.1 Real compositions of Ag-Au and Ag-Au-Pt alloys. The numbers in brackets represent the 95% confidence interval (CI) calculated from at least seven measurements randomly chosen along the alloys. ............................................ 76
Table 2.2 Physical characteristics and developed surface area of different nanoporous structures. The numbers in brackets represent the 95% CI. ............................. 79
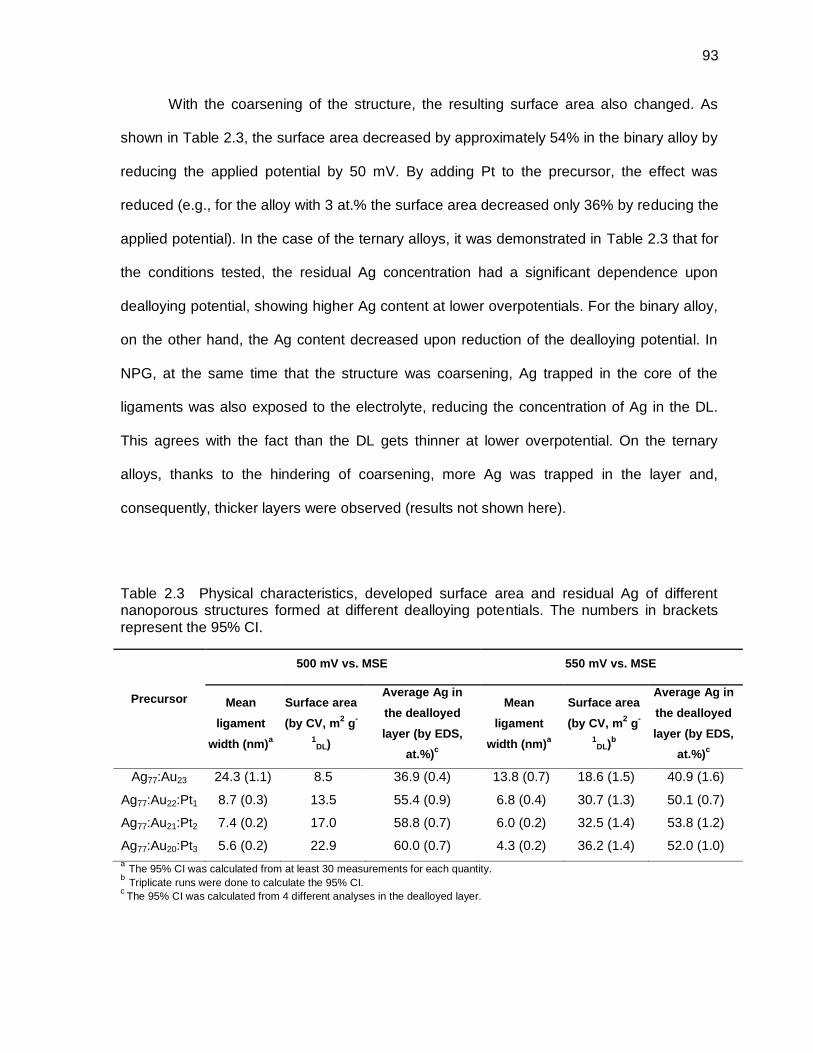
Table 2.3 Physical characteristics, developed surface area and residual Ag of different nanoporous structures formed at different dealloying potentials. The numbers in brackets represent the 95% CI. ....................................................... 93
Table 4.1 Physical characteristics, residual silver and roughness factor of the nanoporous structures developed at 25 °C and 0.55 V vs. MSE in 0.77 M HClO4. Charge density: 5 C cm-2. The number in brackets represents the 95% confidence interval (CI). ........................................................................... 142
Table A.1 Experimental data for the calculation of the mass of the dealloyed layer in NPG grown in 0.77 M HClO4 at 0.55 V vs. MSE and 25 °C. ........................... 225
xv
List of Figures
Figure 1.1 Nanoporous structure formed by dealloying of silver from Ag77:Au23 alloy in 0.77 M HClO4 solution at 40 °C. ........................................................................... 3
Figure 1.2 Schematic illustration of the electrochemical behavior of binary alloys. Adapted from Pickering [33]. ................................................................................ 9
Figure 1.3 NPG and its various structural variations ranging from microfabrication (adapted with permission from Biener et al. [53]. Copyright 2006 American Chemical Society), tunable pore and ligament size, hierarchical structures based on templating techniques (adapted from Erlebacher and Seshadri [12] with permission of Cambridge University Press) and its chemical variations, ranging from decoration of the surface of the ligaments with metals such as platinum (adapted with permission from Ding et al. [54]. Copyright 2004 American Chemical Society), molecular entities (adapted from Pareek et al. [55] with permission of Royal Society of Chemistry) or even metal oxides, such as TiO2 (adapted with permission from Jia et al.[56]. Copyright 2009 American Chemical Society). ....................................... 13
Figure 1.4 Snapshots taken from Monte Carlo simulations performed on Ag-Au alloys: (a) initial stage of dissolution of silver and formation of terrace island; (b) formation of mounts. Single steps of dealloying mechanism are depicted in (c), where the yellow balls represent gold and the grey balls silver. (a) and (b) are adapted from Erlebacher and Seshadri [12] with permission of the Cambridge University Press. .............................................................................. 19
Figure 1.5 (a) The coordination of atoms depends on their location. The stability of the atoms decreases with the coordination number (CN). (b) Percentage of atoms as a function of the length scale. This is shown for a straight ligament as a simple example (numbers are based on a geometric consideration). Reprinted with permission from Wittstock [157] – Copyright 2010 A. Wittstock. ............................................................................................... 35
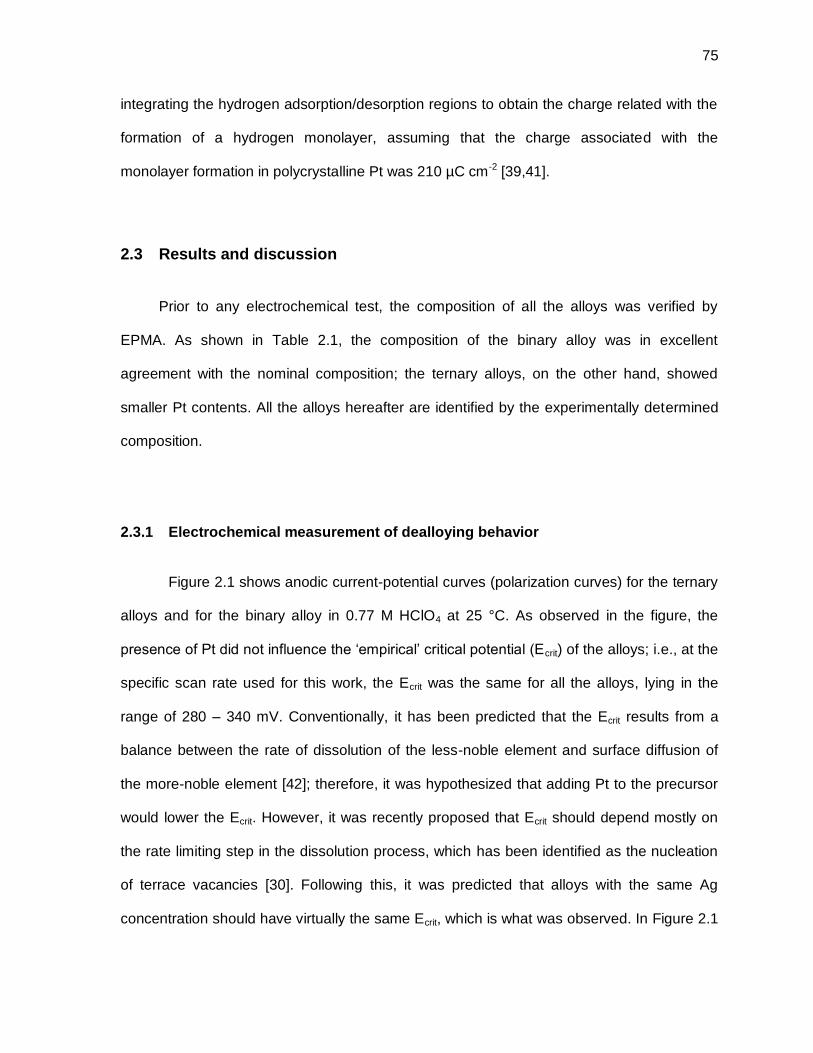
Figure 2.1 Results of negative to positive potential scan on Ag-Au and Ag-Au-Pt alloys, recorded at a scan rate of 0.5 mV s-1 at 25 °C. The absolute value of the current density is plotted in this figure: current densities below ~ -0.3 V are cathodic; everything else is anodic. .................................................................... 76
Figure 2.2 Interconnected ligament/pore structure of the Ag77:Au23 after passing 5 C cm-2 at 25 °C and 550 mV vs. MSE. ................................................................... 77
xvi
Figure 2.3 SEM images of freshly-formed nanoporous structures at 550 mV vs. MSE and 25 °C: (a) Ag77:Au23, (b) Ag77:Au22:Pt1, (c) Ag77:Au21:Pt2, (d) Ag77:Au20:Pt3. In all cases 5 C cm-2 were passed. .............................................. 79
Figure 2.4 BET pore size distribution of freshly-formed nanoporous structures. The dealloying conditions for all alloys were the same - temperature: 25 °C, dealloying potential: 550 mV vs. MSE, charge passed: 5 C cm-2. ..................... 80
Figure 2.5 TEM images of freshly-formed nanoporous structures: (a) Ag77:Au23, (b) Ag77:Au22:Pt1. The dealloying conditions for both alloys were the same - temperature: 25 °C, potential: 550 mV vs. MSE, charge passed: 5 C cm-2. ..... 81
Figure 2.6 XRD patterns of (a) Ag77:Au23 and (b) Ag77:Au20:Pt3 before and after dealloying. The as-annealed material in both cases is represented with a solid line, and the as-dealloyed material with a dotted line. The dealloying conditions for both alloys were the same - temperature: 25 °C, potential: 550 mV vs. MSE, charge passed: 5 C cm-2. ...................................................... 82
Figure 2.7 (a) Ultramicrotomed sample; the insert shows a higher magnification of the region close to the dealloying front. (b) Residual Ag profile across the dealloyed layer of freshly-formed nanoporous structures. The Ag content was determined by TEM – EDS of ultramicrotomed samples, and 100% represents the original surface of the sample (SS); 0 % is the dealloying front (DF). Error bars represent 95% CI calculated from at least 3 different measurements across the dealloyed layer. ........................................................ 85
Figure 2.8 Cyclic voltammograms of the Ag-Au-Pt alloys after dealloying at 550 mV vs. MSE, 25 °C and passing a charge density of 5 C cm-2. In all cases, CV profiles were obtained in 1 M H2SO4 solution at 20 mV s-1 and 25 °C. The original Pt content is shown in the figure. The insert shows the fraction of Pt on the surface of the nanostructure, obtained by H-UPD and XPS analyzes, with respect to Pt content of the precursors. The error bars represent 95% CI calculated from triplicate runs. .............................................. 86
Figure 2.9 SEM images of freshly-formed nanoporous structures: (a) Ag77:Au23 dealloyed at 10 °C; (b) Ag77:Au23 dealloyed at 60 °C; (c) Ag77:Au22:Pt1 dealloyed at 10 °C; (d) Ag77:Au22:Pt1 dealloyed at 60 °C; (e) Ag77:Au20:Pt3 dealloyed at 10 °C; (e) Ag77:Au20:Pt3 dealloyed at 60 °C. In all cases, the SEM images were taken approximately in the middle of the DL. ...................... 89
Figure 2.10 Ligament width, normalized surface area, thickness of DL and residual Ag in the DL of freshly-formed nanoporous structures at different temperatures: (□) Ag77:Au23, (●) Ag77:Au23:Pt1, (■) Ag77:Au21:Pt2, (▲) Ag77:Au20:Pt3. Error bars represent 95% CI calculated from triplicate runs in the case of surface area, from at least 30 measurements in the case of the ligament size, from ca. 15 measurements for the thickness of the layer and from 4 different measurements across the dealloyed layer in the case of
xvii
the Ag content. In all cases, the Ag content was measured approximately in the middle of the DL. ....................................................................................... 90
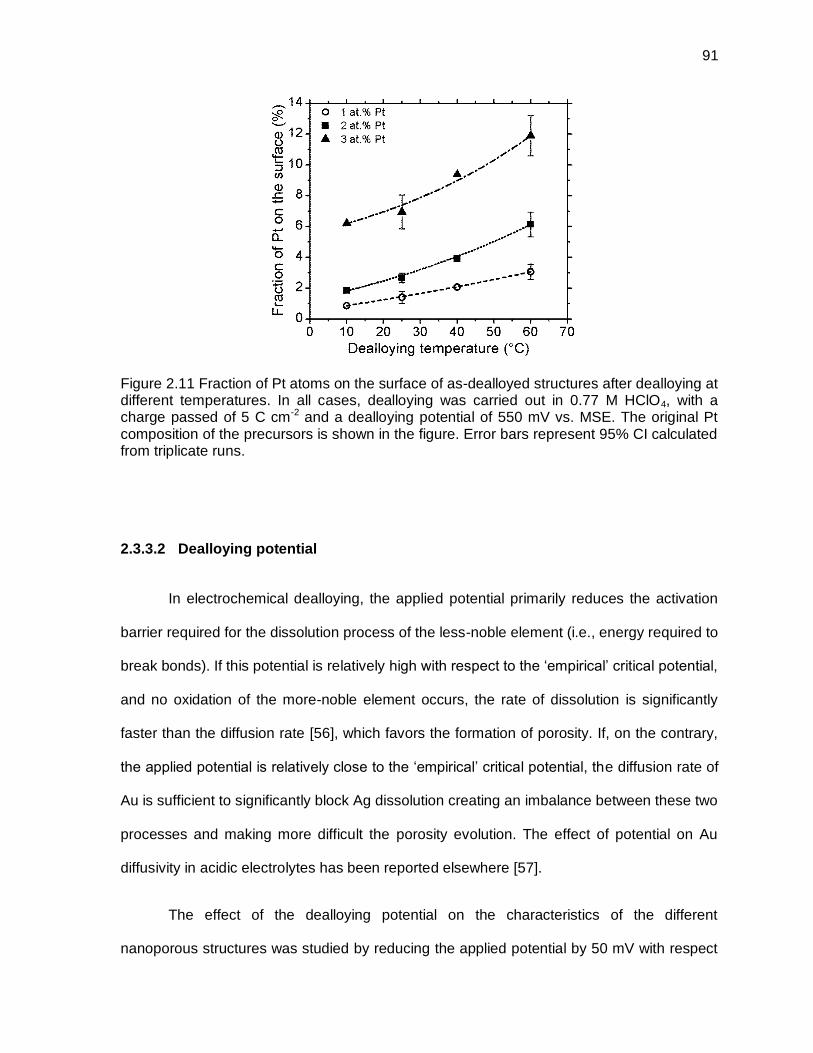
Figure 2.11 Fraction of Pt atoms on the surface of as-dealloyed structures after dealloying at different temperatures. In all cases, dealloying was carried out in 0.77 M HClO4, with a charge passed of 5 C cm-2 and a dealloying potential of 550 mV vs. MSE. The original Pt composition of the precursors is shown in the figure. Error bars represent 95% CI calculated from triplicate runs. ...................................................................................................... 91
Figure 2.12 SEM images of freshly-formed nanoporous structures at different dealloying potentials: (a) Ag77:Au23 at 500 mV, (b) Ag77:Au23 at 550 mV, (c) Ag77:Au22:Pt1 at 500 mV (d) Ag77:Au22:Pt1 at 550 mV, (e) Ag77:Au20:Pt3 at 500 mV, (f) Ag77:Au20:Pt3 at 550 mV. In all cases the charge density passed was 5 C cm-2. All SEM images were taken approximately in the middle of the DL. ................................................................................................. 92
Figure 2.13 SEM images of freshly-formed nanoporous structures after passing different dealloying charges: (a) Ag77:Au23 passing 2.5 C cm-2; (b) Ag77:Au23 passing 40 C cm-2; (c) Ag77:Au22:Pt1 passing 2.5 C cm-2; (d) Ag77:Au22:Pt1 passing 40 C cm-2; (e) Ag77:Au20:Pt3 passing 2.5 C cm-2; (f) Ag77:Au20:Pt3 passing 40 C cm-2. In all cases, the SEM images were taken approximately in the middle of the DL. ....................................................................................... 95
Figure 2.14 Average ligament width, normalized surface area, thickness of DL and average residual Ag in the DL of freshly-formed nanoporous structures at different dealloying charges: (□) Ag77:Au23, (●) Ag77:Au22:Pt1, (■) Ag77:Au21:Pt2, (▲) Ag77:Au20:Pt3. In all cases, the surface area was measured by CV in 1M HClO4 at 25 ºC. Error bars represent 95% CI calculated from triplicate runs in the case of surface area, from at least 30 measurements in the case of the ligament size, from ca. 15 measurements for the thickness of the layer and from 4 different measurements in the case of the average Ag content of the layer. In all cases, the Ag content was measured approximately in the middle of the DL. ...................................... 96
Figure 3.1 (a) SEM image of the freshly-developed nanoporous structure obtained by dealloying of Ag77:Au22:Pt1. (b) Dealloyed layer after ultramicrotoming a sample; in this case, the dealloyed layer rolled as a consequence of the low cutting velocity used during the process. The insert shows a TEM image of the nanoporous structure. The dealloying conditions in all cases were the same – dealloying charge density: 5 C cm-2, temperature: 25 °C and dealloying potential: 550 mV vs. MSE. ...................................................... 111
Figure 3.2 (a) Fraction of Pt atoms on the outermost surface of the ligaments. (b) Pt content across the dealloyed layer obtained by TEM – EDS in ultramicrotomed samples. (c) Ultramicrotomed sample; the insert shows a TEM image of the dealloyed layer showing a highly dense porous structure. For Figures (a) and (b) error bars represent the 95% confidence
xviii
interval (CI): in the case of (a) the CI was obtained by triplicate runs, for (a) the CI was obtained from at least 3 points across the dealloyed layer - 0 % represents the dealloying front (DF) and 100 % represents the original surface of the sample (SS). The nomenclature in the case of (b) is based on the original composition of the alloys. ......................................................... 113
Figure 3.3 (a) Fraction of Pt on the surface of the nanoporous structures after exposure to different temperatures for 2 h; (b) roughness factor (Rf) of the nanostructures; (c) time dependence of the segregation phenomenon at 425 °C; (d) roughness factor (Rf) as a function of exposure time at 425 °C. The different alloys, based on their original composition, are represented as follows: (●) Ag77:Au22:Pt1, (○) Ag77:Au21:Pt2, (♦) Ag77:Au20:Pt3. In all cases, laboratory air was used. Error bars represent 95% CI calculated from triplicate runs. ........................................................................................... 115
Figure 3.4 SEM images of the nanoporous structures formed from Ag77:Au22:Pt1 alloy (a, b, c) and from Ag77:Au20:Pt3 alloy (d, e, f). Images (a) and (d) show the structures right after dealloying; images (b) and (e) show the structures after annealing at 425 °C in the presence of laboratory air; images (c) and (f) show the structures after annealing at 500 °C in the presence of laboratory air. For all the annealed structures, the exposure time was 2 h. .... 117
Figure 3.5 Fraction of Pt on the surface of the nanoporous structure formed on Ag77:Au20:Pt3 after exposure to 300 °C for different times. The dealloying conditions were the following: charge passed 5 C cm-2 at 25 °C and 550 mV vs. MSE. In all cases, laboratory air was used. The error bar represents 95% CI calculated from triplicate runs. .......................................... 118
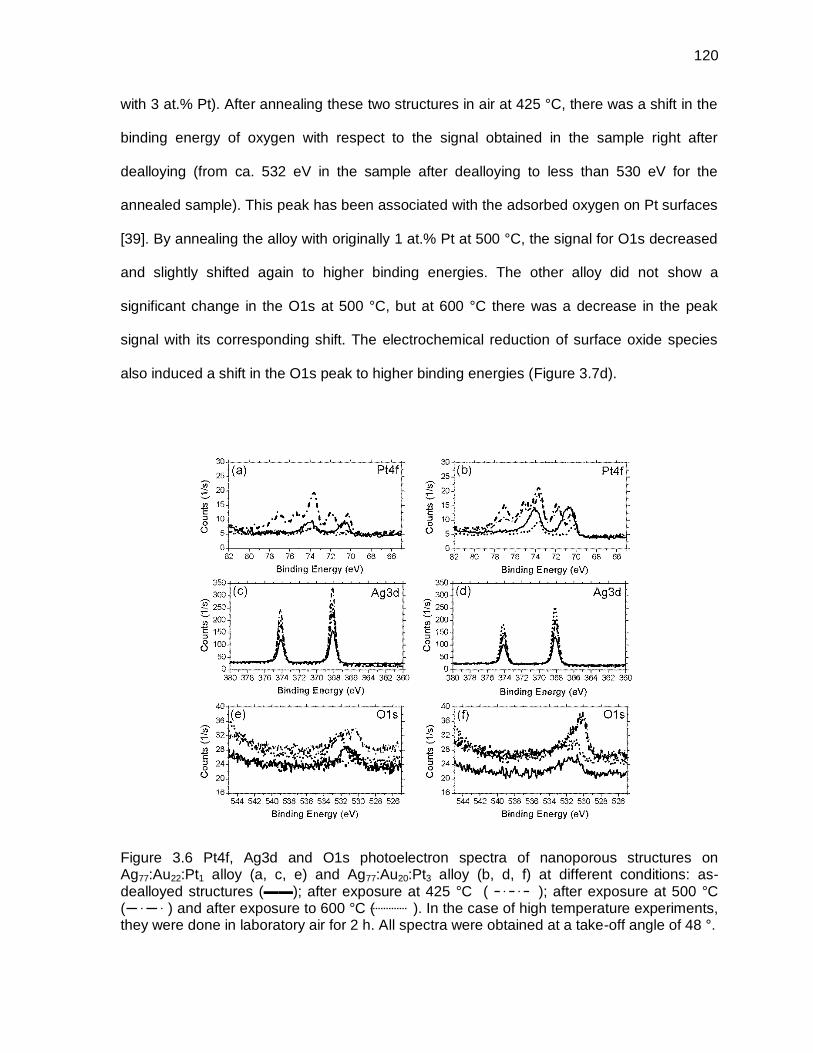
Figure 3.6 Pt4f, Ag3d and O1s photoelectron spectra of nanoporous structures on Ag77:Au22:Pt1 alloy (a, c, e) and Ag77:Au20:Pt3 alloy (b, d, f) at different conditions: as-dealloyed structures (▬▬); after exposure at 425 °C ( ); after exposure at 500 °C ( ) and after exposure to 600 °C ( ). In the case of high temperature experiments, they were done in laboratory air for 2 h. All spectra were obtained at a take-off angle of 48 °. ... 120
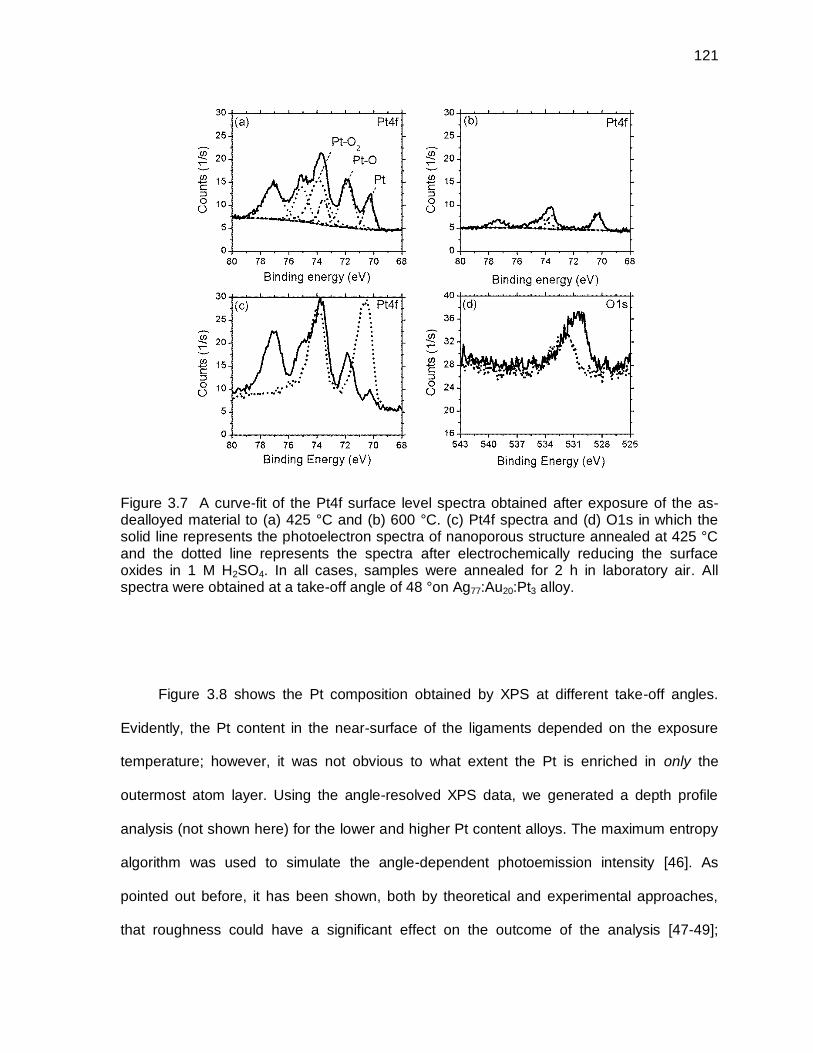
Figure 3.7 A curve-fit of the Pt4f surface level spectra obtained after exposure of the as-dealloyed material to (a) 425 °C and (b) 600 °C. (c) Pt4f spectra and (d) O1s in which the solid line represents the photoelectron spectra of nanoporous structure annealed at 425 °C and the dotted line represents the spectra after electrochemically reducing the surface oxides in 1 M H2SO4. In all cases, samples were annealed for 2 h in laboratory air. All spectra were obtained at a take-off angle of 48 °on Ag77:Au20:Pt3 alloy. ......... 121
Figure 3.8 XPS Pt4f composition with respect to the take-off angle for (a) Ag77:Au22:Pt1 and (b) Ag77:Au20:Pt3 and for different experimental conditions: (◊) right after dealloying, (●) after exposure at 425 °C, (○) after exposure at 500 °C and (▲) after exposure to 600 °C. In the case of all high temperature conditions, laboratory air was used for an exposure time of 2 h. .................... 122
xix
Figure 3.9 (a) LEIS general survey for the highest platinum content alloy before and after exposure to moderately high temperature; in this case, the surface of the samples was bombarded with 3 keV 4He+ ions. (b) Au-Pt spectra after bombarding the surface of the samples with 5 keV 20Ne+ ions; the insert in this figure shows the Au-Pt spectra after bombarding the surface with 5 keV 40Ar+ ions to improve the sensitivity of the analysis. The signals for Au and Pt standards are also included in the figure. The details about the different experimental conditions are shown in the figure. For all high temperature experiments, samples were exposed for 2 h in the presence of laboratory air unless otherwise state. In all cases, analyses were done without any surface cleaning to avoid any ion-induced mixing of the noble metals. ............................................................................................................... 124
Figure 3.10 Fraction of Pt on the surface of the ligaments and average ligament size of the nanoporous structure formed on Ag77:Au20:Pt3 alloy with respect to temperature. Ar-H2 was used in all cases with an exposure time of 2 h. The insert shows the roughness factor (Rf) with respect to temperature. The error bars represent 95% CI calculated from triplicate runs in the case of the fraction of Pt and from at least 20 measurements in the case of the ligament size. .................................................................................................... 126
Figure 3.11 SEM images of the resulting structures formed after annealing in Ar-H2 atmosphere the nanoporous structure obtained by dealloying Ag77:Au20:Pt3 alloy. (a) Sample annealed at 200 °C; (b) sample annealed at 300 °C; (c) sample annealed at 425 °C, (d) sample annealed at 500 °C. In all cases, the annealing time was 2 h. .............................................................................. 126
Figure 3.12 SEM images of the resulting structures formed after annealing in NPG in (a) Ar-H2 atmosphere and (b) laboratory air. In both cases the exposure temperature was 425 °C and the the annealing time was 2h. ......................... 127
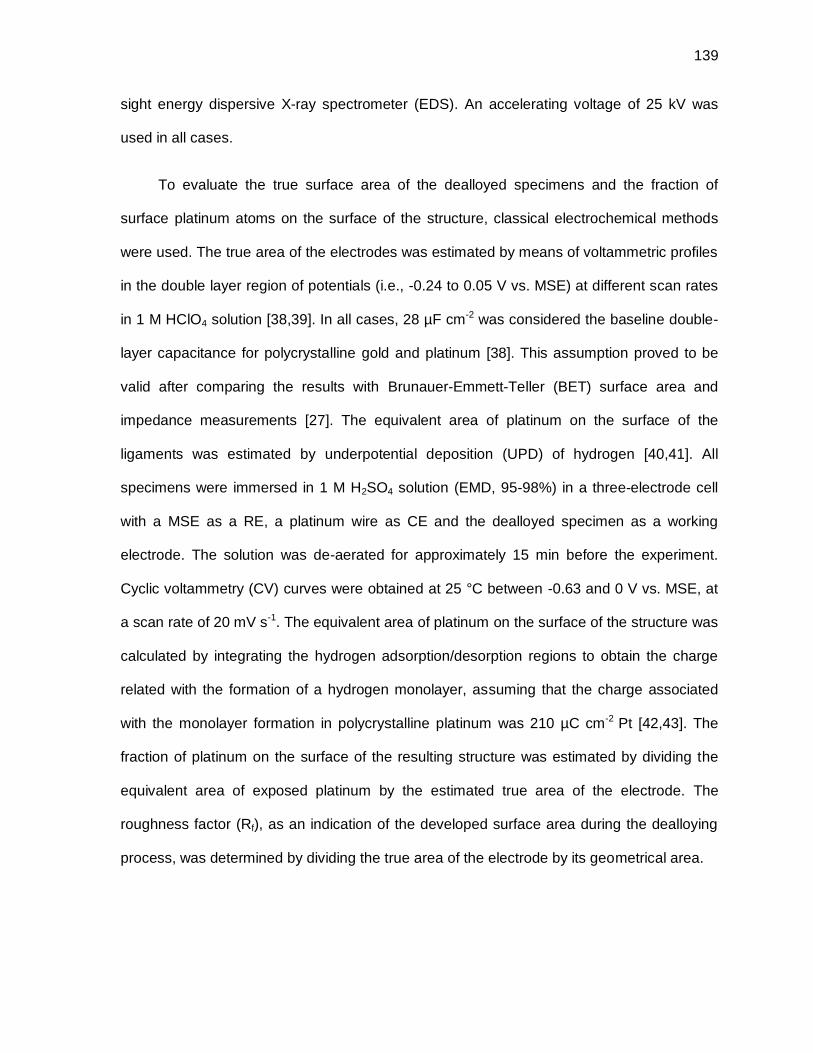
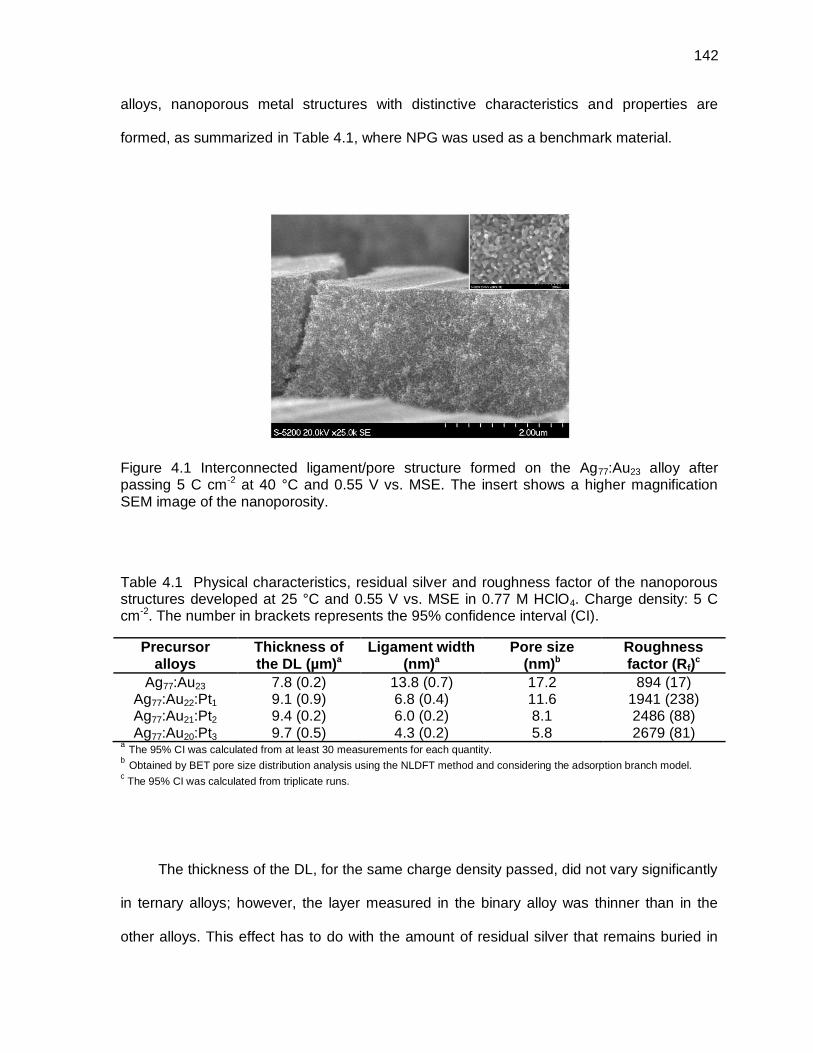
Figure 4.1 Interconnected ligament/pore structure formed on the Ag77:Au23 alloy after passing 5 C cm-2 at 40 °C and 0.55 V vs. MSE. The insert shows a higher magnification SEM image of the nanoporosity. ................................................ 142
Figure 4.2 (a) CV profiles of the different nanoporous structures in 5 M KOH; (b) CV profiles of NPG and of the nanoporous structures formed on the alloy with 1 at.% Pt in 5 M KOH - 1 M CH3OH solution. The insert in (b) shows the CV profile of polycrystalline Pt in 5 M KOH - 1 M CH3OH solution. In (a) and (b) the current density was normalized by the geometrical area of the electrodes. The original platinum content is shown in the figures. All CV profiles were obtained at 10 mV s-1 and 25 °C. ................................................ 145
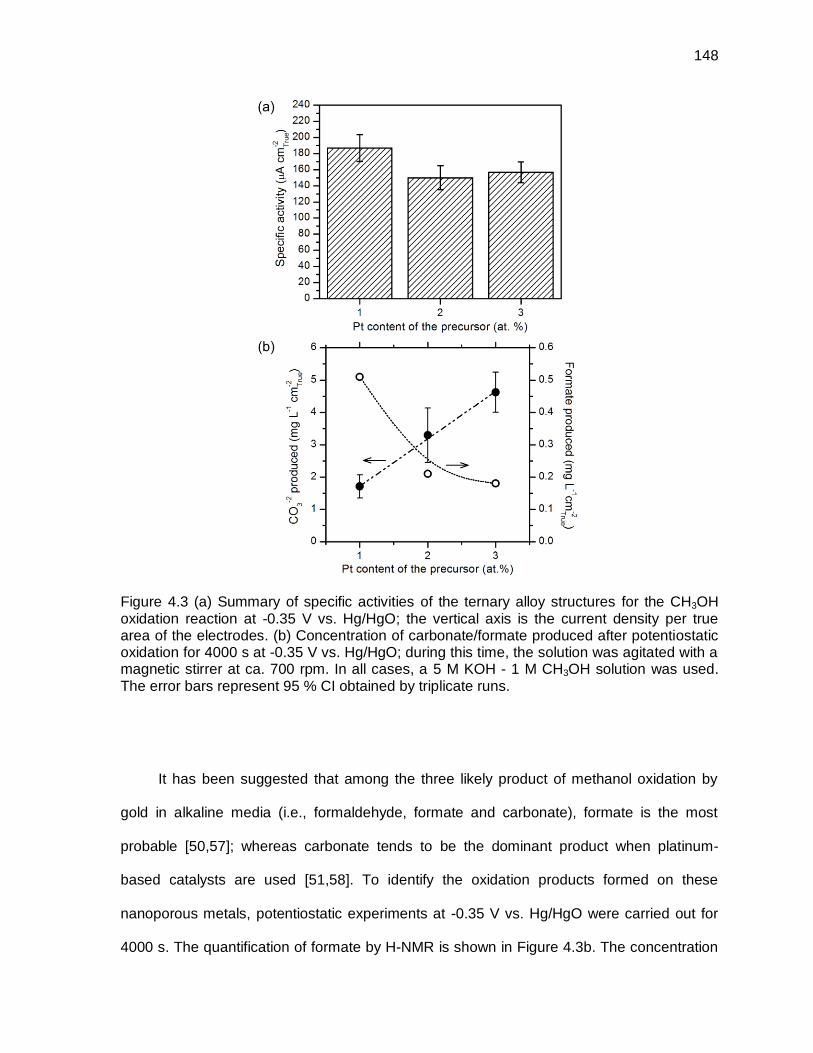
Figure 4.3 (a) Summary of specific activities of the ternary alloy structures for the CH3OH oxidation reaction at -0.35 V vs. Hg/HgO; the vertical axis is the current density per true area of the electrodes. (b) Concentration of carbonate/formate produced after potentiostatic oxidation for 4000 s at -0.35 V vs. Hg/HgO; during this time, the solution was agitated with a
xx
magnetic stirrer at ca. 700 rpm. In all cases, a 5 M KOH - 1 M CH3OH solution was used. The error bars represent 95 % CI obtained by triplicate runs. .................................................................................................................. 148
Figure 4.4 CV profiles for the electrooxidation of CH3OH solution in 5 M KOH on the nanoporous structure formed on the ternary structure developed on the alloy with 1 at.% Pt: (a) effect of the scan rates, (b) agitation speeds, (c) scan limit and (d) methanol concentration. For figures (a) to (c), the methanol concentration was 1 M; for figures (b) to (d), the scan rate was 10 mV s-1. Temperature: 25 °C. Details about the scan rates, agitation speeds, scan limit and methanol concentrations are given in the figures. In all cases, the current was normalized by the true area of the electrodes. ...... 151
Figure 4.5 CV profiles for the electrooxidation of CH3OH solution in 5 M KOH on the nanoporous structure formed on the alloy with 1 at.% platinum. In all cases the scan rate was 10 mV s-1 and the temperature 25 °C. Details about the number of scan cycles are indicated in the figures. ......................... 152
Figure 4.6 Effect of the dealloying temperature and dealloying charge density on the main characteristics of the resulting nanoporous structures: (a) effect of dealloying temperature on the size of the ligaments; the insert in this figure shows the average thickness of the DL; (b) fraction of platinum on the surface of the ligaments after dealloying at different temperatures; (c) ligament size of the different structures after passing different charge densities; the insert shows the average thickness of the DL; (d) fraction of platinum on the surface of the ligaments after passing different charges. Details about the dealloying temperature are indicated in the figures (b) and (d). The error bars represent 95 % CI obtained by triplicate runs. ........... 154
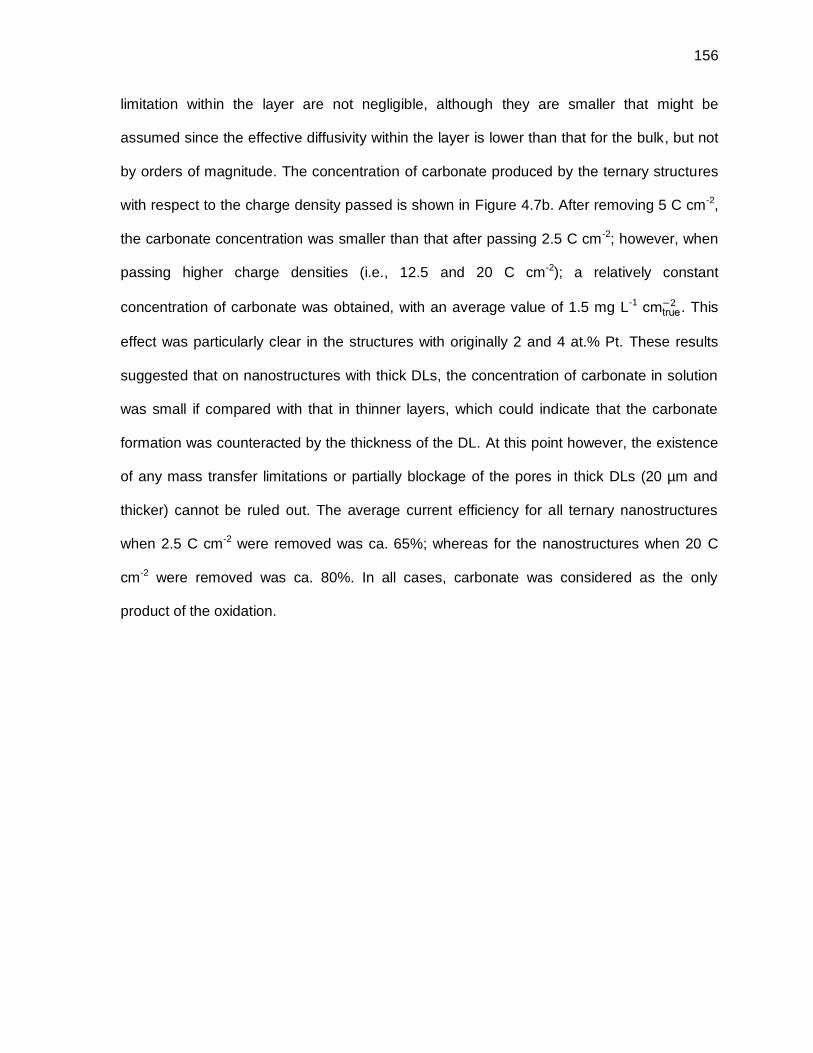
Figure 4.7 (a) Summary of specific activities for the CH3OH oxidation reaction of the ternary alloy nanostructures developed under different conditions; the vertical axis is the current density per true area of the electrodes. (b) Concentration of carbonate produced on nanoporous structures dealloyed after passing different charge densities after potentiostatic oxidation for 4000 s; during this time, the solution was agitated with a magnetic stirrer at ca. 700 rpm. The insert in (b) corresponds to concentration of carbonate produced on nanostructures dealloyed at different temperatures. In all cases, the potential was fixed at -0.35 V vs. Hg/HgO. The different dealloying conditions are shown in the figures. The error bars represent 95 % CI obtained by triplicate runs. ....................................................................... 157
Figure 4.8 (a) Ligament size and fraction of platinum on the surface of the ligaments for all ternary structures after exposure to 425 °C for 2 h in the presence of laboratory air; (b) CV profiles in 5 M KOH - 1 M CH3OH solution for the nanoporous structure formed on the alloy with 1 at.% Pt structures before and after segregation of Pt, the CV profiles were obtained at 10 mV s-1 and 25 °C and the current density was normalized by the geometrical area of the electrodes; (c) Summary of specific activities of the ternary alloy nanostructures for the CH3OH oxidation reaction at -0.35 V vs. Hg/HgO;
xxi
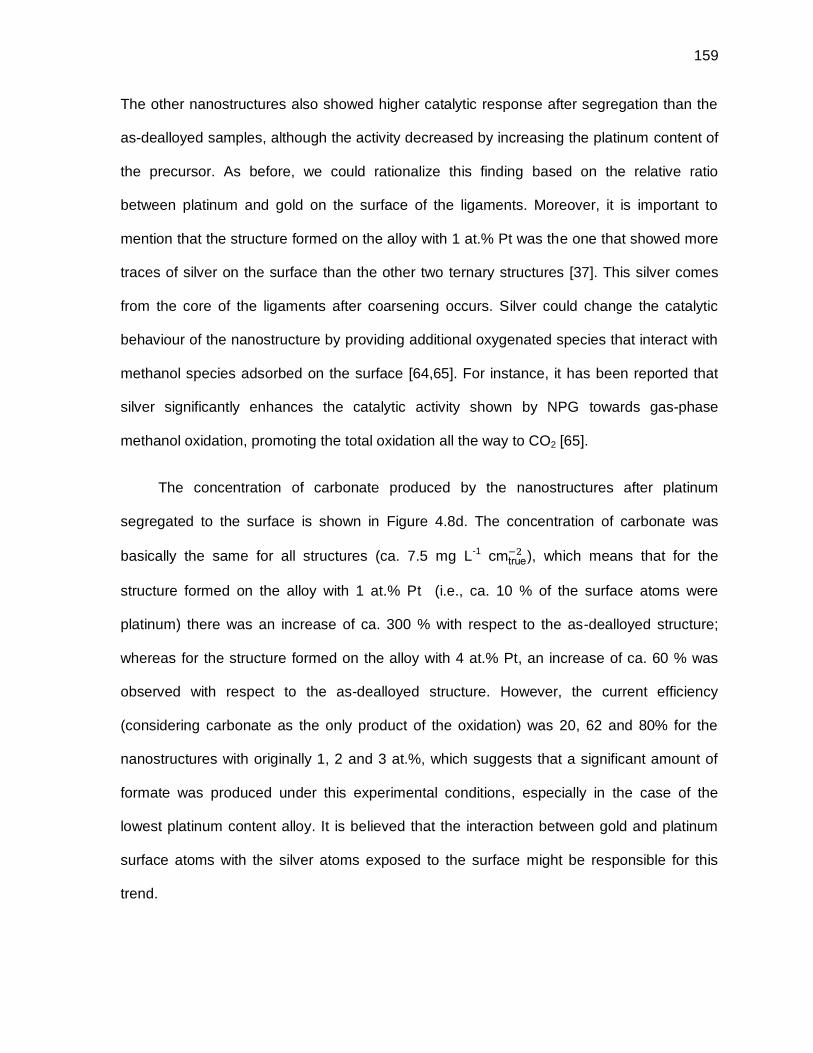
the vertical axis is the current density per true area of the electrodes; (d) Concentration of carbonate produced after potentiostatic oxidation for 4000 s at -0.35 V vs. Hg/HgO; during this time, the solution was agitated with a magnetic stirrer at ca. 700 rpm. The error bars represent 95 % CI obtained by triplicate runs. ............................................................................................... 160
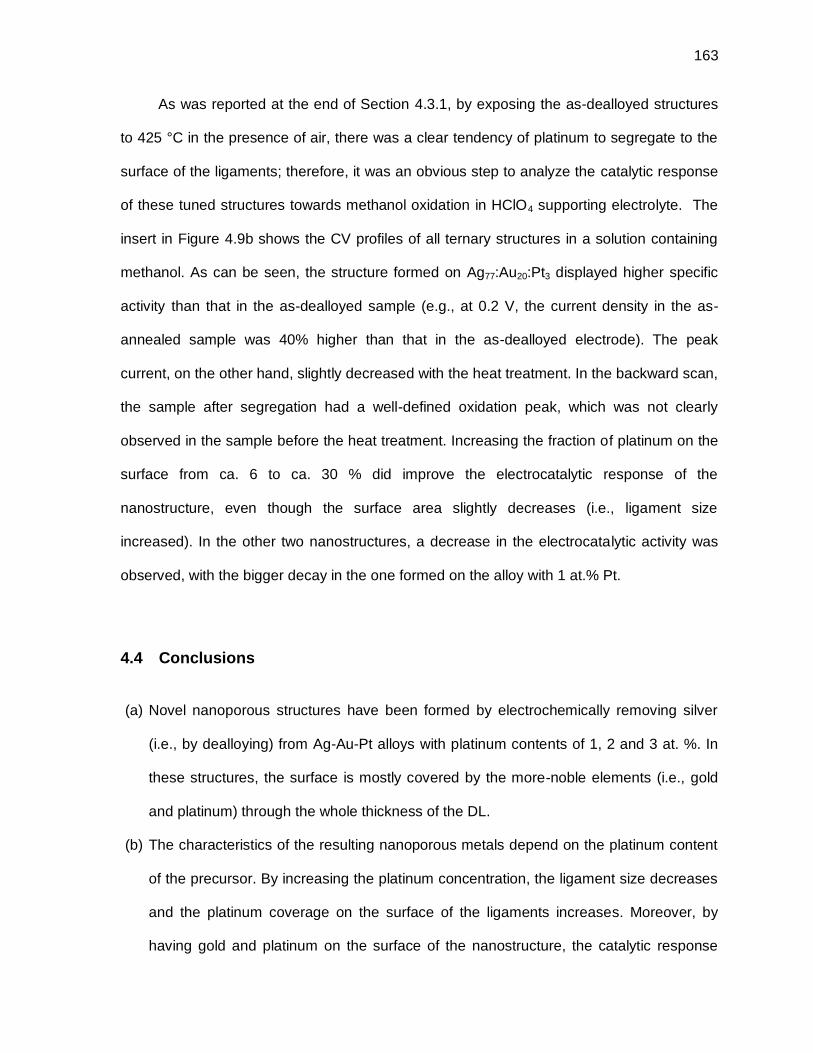
Figure 4.9 (a) CV profiles of the different nanoporous structures in 0.5 M HClO4; (b) CV profiles of the nanoporous structures in 0.5 M HClO4 - 1 M CH3OH solution. The insert in (b) corresponds to the CV profiles in 0.5 M HClO4 - 1 M CH3OH solution after segregation of platinum at 425 °C in laboratory air for 2 h. The original platinum composition is shown in (a). All CV profiles were obtained at 10 mV s-1. The temperature in all cases was 25 °C. ............ 162
Figure 5.1 SEM images of the freshly-developed nanoporous structure at 0.55 V vs. MSE and 25 °C in 0.77 M HClO4: (a) Ag77:Au23 (b) Ag77:Au22:Pt1. In all cases, 5 C cm-2 were passed. Inserts in (a) and (b) are TEM image of the same structures. ............................................................................................... 180
Figure 5.2 Average ligament size of the freshly-formed nanoporous structures formed at 0.55 V vs. MSE and 25 °C in 0.77 M HClO4. The insert shows the roughness factor (Rf) as a function of the platinum content of the precursor. Error bars represent 95% confidence interval (CI) calculated from at least 30 measurements in the case of the ligament size, and triplicate runs for Rf. ...................................................................................................................... 181
Figure 5.3 (a) CV profiles of the different nanoporous structures in 4 M KOH; (b) CV profiles of NPG and of the nanoporous structures formed on the alloy with 1 at.% Pt in 4 M KOH - 1 M C2H5OH solution. The insert in (b) shows the CV profile of polycrystalline Pt in 4 M KOH - 1 M C2H5OH solution. In all cases the vertical axis corresponds to the nominal current density. The original platinum composition is shown in (a). All CV profiles were obtained at 10 mV s-1 and 25 °C. .................................................................................... 183
Figure 5.4 CV profiles for the electro-oxidation of ethanol in 4 M KOH – 1 M C2H5OH solution. The insert shows the summary of specific activities (S.a) of the ternary alloy structures for the C2H5OH oxidation reaction at -0.6 V vs. Hg/HgO and of the binary structure taken at -0.1 V vs. Hg/HgO; the vertical axis is the current density per true area of the electrodes. Details about the structures and the number of scan cycles are indicated in the figures. All CV profiles were recorded at 10 mV s-1 and 25 °C. ......................................... 185
Figure 5.5 Current density observed during a prolonged oxidation of 1 M C2H5OH in 4 M KOH solution at -0.6 V vs. Hg/HgO in the case of ternary nanostructures and at -0.1 V vs. Hg/HgO in the case of NPG. In all cases, the solution was de-aerated by high-purity nitrogen and agitated with a magnetic stirrer at ca. 700 rpm. The insert shows the concentration of carbonate produced after 4000 s with respect to the platinum content of the precursor. ................. 186
xxii
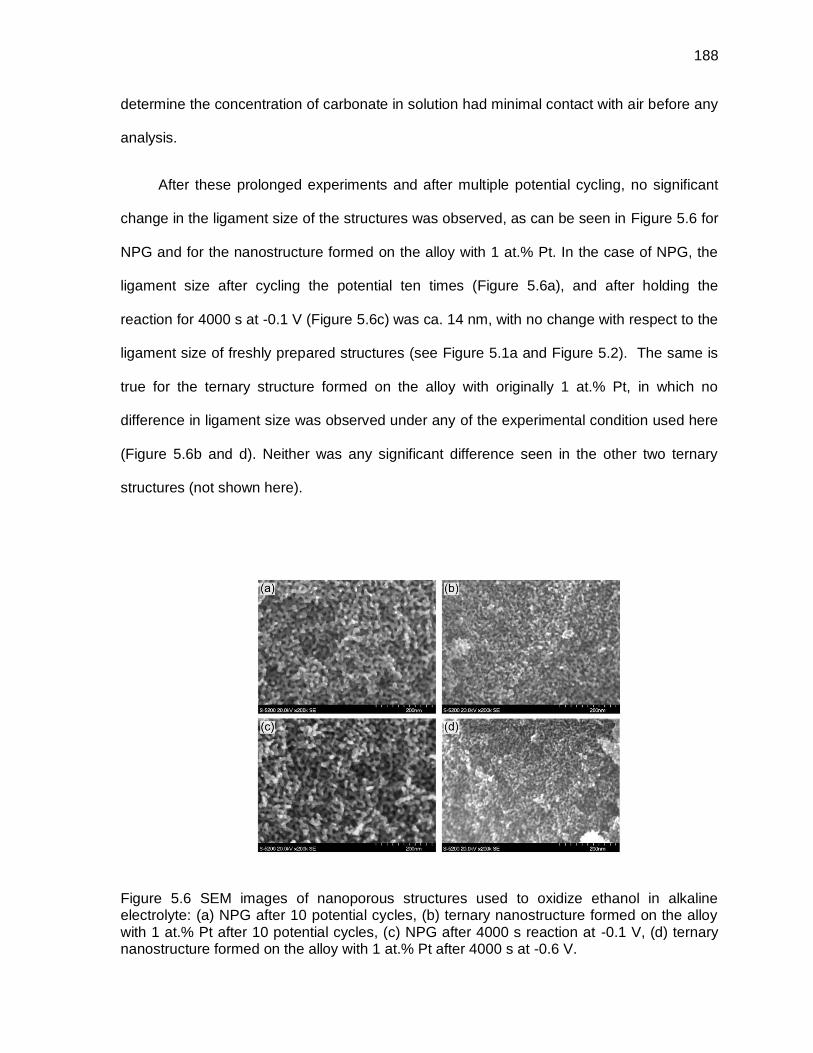
Figure 5.6 SEM images of nanoporous structures used to oxidize ethanol in alkaline electrolyte: (a) NPG after 10 potential cycles, (b) ternary nanostructure formed on the alloy with 1 at.% Pt after 10 potential cycles, (c) NPG after 4000 s reaction at -0.1 V, (d) ternary nanostructure formed on the alloy with 1 at.% Pt after 4000 s at -0.6 V. ................................................................ 188
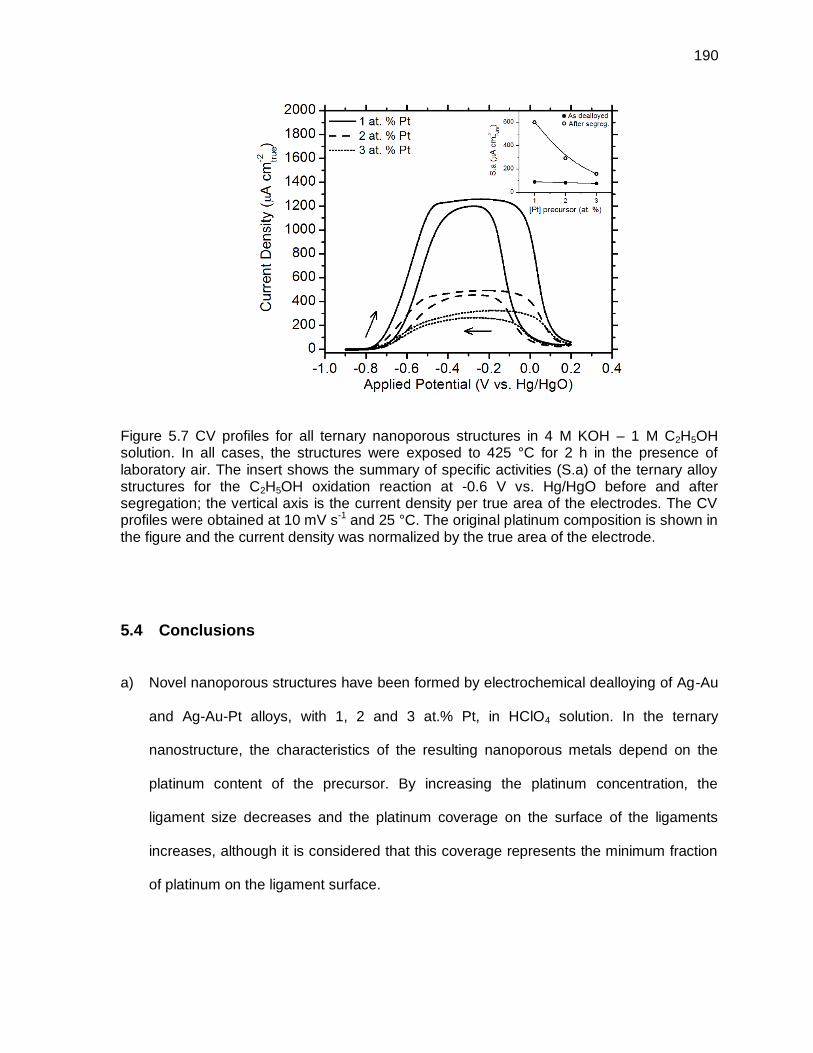
Figure 5.7 CV profiles for all ternary nanoporous structures in 4 M KOH – 1 M C2H5OH solution. In all cases, the structures were exposed to 425 °C for 2 h in the presence of laboratory air. The insert shows the summary of specific activities (S.a) of the ternary alloy structures for the C2H5OH oxidation reaction at -0.6 V vs. Hg/HgO before and after segregation; the vertical axis is the current density per true area of the electrodes. The CV profiles were obtained at 10 mV s-1 and 25 °C. The original platinum composition is shown in the figure and the current density was normalized by the true area of the electrode. ........................................................................................ 190
Figure A.1 Dealloying current of the binary and ternary alloys recorded at 0.55 V vs. MSE and 25 °C in 0.77 M HClO4. The charge density passed was 5 C cm-2 in all cases. Details about the alloys are shown in the figure. ......................... 218
Figure A.2 Negative polarization sweep (1 mV s-1) of freshly dealloyed Ag77:Au23 specimen (0.7 V for approximately 25 s at 25 °C and removing 5 C cm -2) in the dealloyed solution. Insert: linear current density axis plot of the same data ................................................................................................................... 219
Figure A.3 Impedance measurements for all alloys studied in this investigation: (a) Ag77:Au23, (b) Ag77:Au22:Pt1, (c) Ag77:Au21:Pt2, (d) Ag77:Au20:Pt3. In all cases, the charge density passed was 5 C cm-2 and the dealloying potential was 0.55 V vs. MSE. Dealloying temperature: 25 °C. ............................................. 221
Figure A.4 Voltammograms obtained from -0.24 to 0.05 V vs. MSE in 1 M HClO4 solution: (a) NPG, (b) Nanoporous structure formed on the alloy with the lowest platinum content. The insert in both cases shows the dependence of the double layer current at -0.1 V vs. scan rate. The scan rates used are shown in the figures. ......................................................................................... 223
Figure A.5 Representation of the dealloyed specimen, in which the dealloyed layer is identified with the inclined lines. ....................................................................... 224
Figure A.6 (a) Thickness of the dealloyed layer in NPG measured from a cross-sectional metallographic specimen and (b) from a fracture surface using a low magnification SEM image. In both cases, different samples of Ag-Au alloy were dealloyed at 0.55 V vs. MSE at 25 °C and passing a total charge of 5 C cm-2. The metallographic specimen was polished to 0.05 µm
xxiii
using alumina powder; the fracture surface was obtained after manually breaking the dealloyed sample in air. ............................................................... 224
Figure A.7 Dealloying current of all the alloys investigated: (a) Ag77:Au23; (b) Ag77:Au22:Pt1; (c) Ag77:Au21:Pt2; (d) Ag77:Au20:Pt3. In all cases, the current was recorded at 0.55 V vs. MSE in 0.77 M HClO4 at different electrolyte temperatures. The charge density passed was 5 C cm-2 in all cases. Details about the electrolyte temperatures are shown in the figure. ............... 228
Figure A.8 Nitrogen adsorption/desorption isotherms at 77.35 K for all the nanoporous structures. All nanoporous metals were grown in 0.77 M HClO4 at 0.55 V vs. MSE and 25 °C. Dealloying charge: 5 C cm-2. De-gas conditions: 100 °C for 60 min. Details about the alloys are shown in the figure. ...................... 230
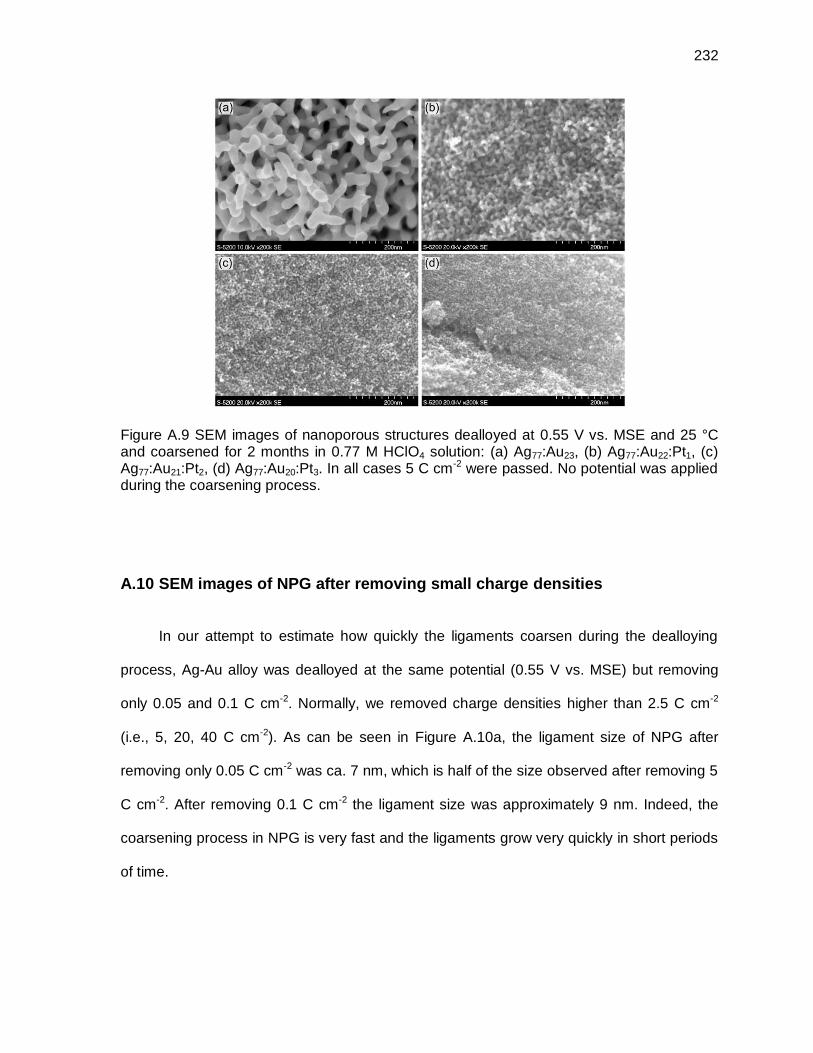
Figure A.9 SEM images of nanoporous structures dealloyed at 0.55 V vs. MSE and 25 °C and coarsened for 2 months in 0.77 M HClO4 solution: (a) Ag77:Au23, (b) Ag77:Au22:Pt1, (c) Ag77:Au21:Pt2, (d) Ag77:Au20:Pt3. In all cases 5 C cm-2 were passed. No potential was applied during the coarsening process. ................. 232
Figure A.10 SEM images of NPG dealloyed at 0.55 V vs. MSE and 25 °C: (a) and (b) after removing 0.05 C cm-2, (c) and (d) after removing 0.1 C cm-2. ................. 233
Figure A.11 XPS compositions with respect to the take-off angle for different nanoporous structures: (a) Pt4f for Ag77:Au22:Pt1; (b) Pt4f for Ag77:Au20:Pt3; (c) Ag3d for Ag77:Au22:Pt1; (d) Ag3d for Ag77:Au20:Pt3; (e) Au4f for Ag77:Au22:Pt1; (f) Au4f for Ag77:Au20:Pt3. The experimental conditions for different sets of data are the following: (◊) right after dealloying, (●) after exposure at 425 °C, (○) after exposure at 500 °C and (▲) after exposure to 600 °C. In the case of all high temperature conditions, laboratory air was used for an exposure time of 2 h. ..................................................................... 237
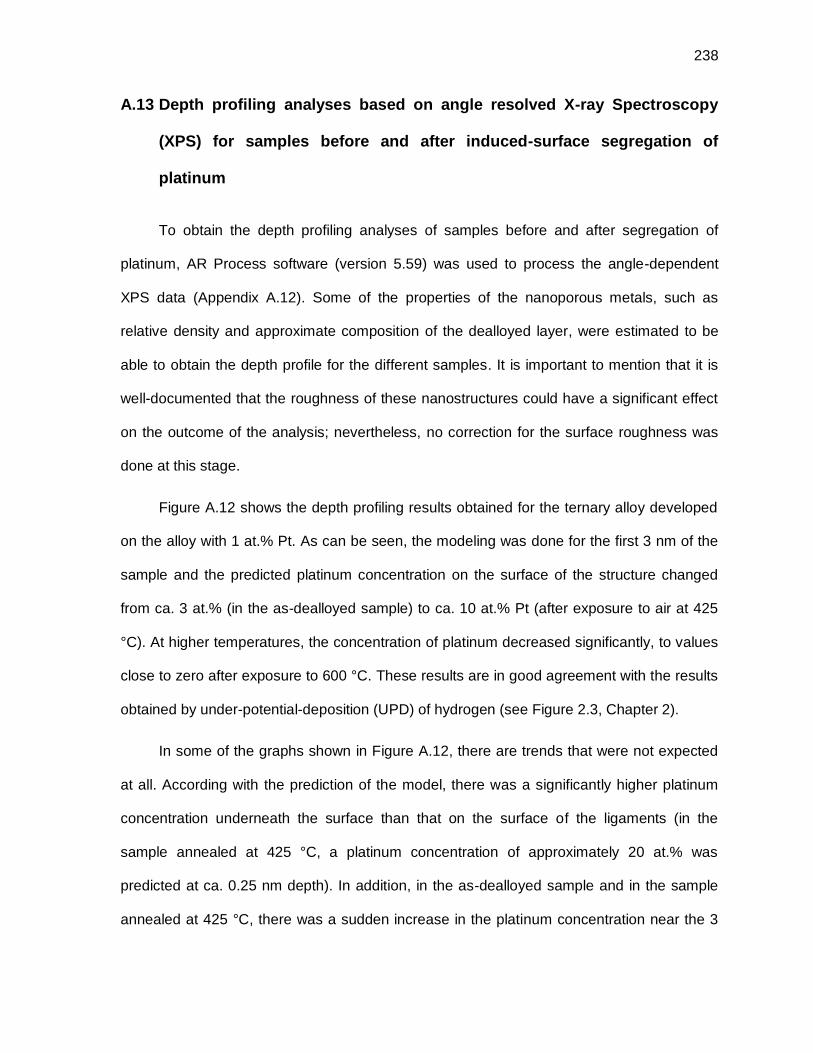
Figure A.12 Depth profile analysis for the lowest platinum content nanostructure (1 at.% Pt) generated from angle-resolved XPS and using the Maximum Entropy algorithm. Details about the elements and the experimental conditions are shown in the figures. ................................................................. 239
Figure A.13 Depth profile analysis for the lowest platinum content nanostructure (3 at.% Pt) generated from angle-resolved XPS and using the Maximum Entropy algorithm. Details about the elements and the experimental conditions are shown in the figures. ................................................................. 241
Figure A.14 (a) CV profiles of the nanostructures formed on Ag-Au and Ag-Au-Pt alloys after dealloying at 0.55 V vs. MSE, 25 °C and passing a charge density of 5 C cm-2; (b) CV profiles for the nanostructure formed on the alloy with 3 at.% Pt after exposure of the as-dealloyed structure to different temperatures in the presence of laboratory air. In all cases, CV profiles
xxiv
were obtained in 1 M H2SO4 at 20 mV s-1 and 25 °C. The original platinum content is shown in (a) and the exposure temperature is shown in (b). .......... 242
Figure A.15 CV profiles for the electro-oxidation of CH3OH solution in 5 M KOH on nanoporous structures formed on ternary alloys: (a) effect of the scan rates on the structure formed on Ag77:Au22:Pt1; (b) effect of the external agitation speed on the structure formed on Ag77:Au22:Pt1; (c) effect of the scan rates on the structure formed on Ag77:Au21:Pt2; (d) effect of the external agitation speed on the structure formed on Ag77:Au21:Pt2; (e) effect of the scan rates on the structure formed on Ag77:Au20:Pt3; (f) effect of the external agitation speed on the structure formed on Ag77:Au20:Pt3. In all cases 5 C cm-2 were passed at 0.55 V vs. MSE and 25°C. ............................................................... 244
Figure A.16 CV profiles of the nanoporous structures formed on (a) the alloy with 1 at.% platinum and (b) the alloy with 3 at.% platinum. In all cases, dealloying was carried out in 0.77 M HClO4 at 0.55 V vs. MSE and at different temperatures. All CV profiles were obtained in 5 M KOH - 1 M CH3OH solution at 10 mV s-1 and 25 °C. Details about the dealloying temperatures are given in the figures. In all cases, the current was normalized by the true area of the electrodes. ................................................. 246
Figure A.17 Effect of the dealloying charge density in the electro-oxidation of methanol on as-dealloyed Ag77:Au22:Pt1. In all cases the nanoporous structure were dealloyed at 25 °C but passing different dealloying charges. All CV profiles were obtained at 10 mV s-1 and 25 °C. The different charge densities are shown in the figure. ........................................................................................... 247
Figure A.18 Current density observed during a prolonged oxidation of 1 M CH3OH in 5 M KOH solution at -0.35 V vs. Hg/HgO in the case of ternary alloys and at -0.05 V vs. Hg/HgO in the case of the binary alloy. In all cases, nanostructures were formed after dealloying the precursors at 0.55 V vs. MSE at 25 °C and with a charge density of 5 C cm-2. The label of the different nanostructures is shown in the figure. ............................................... 248
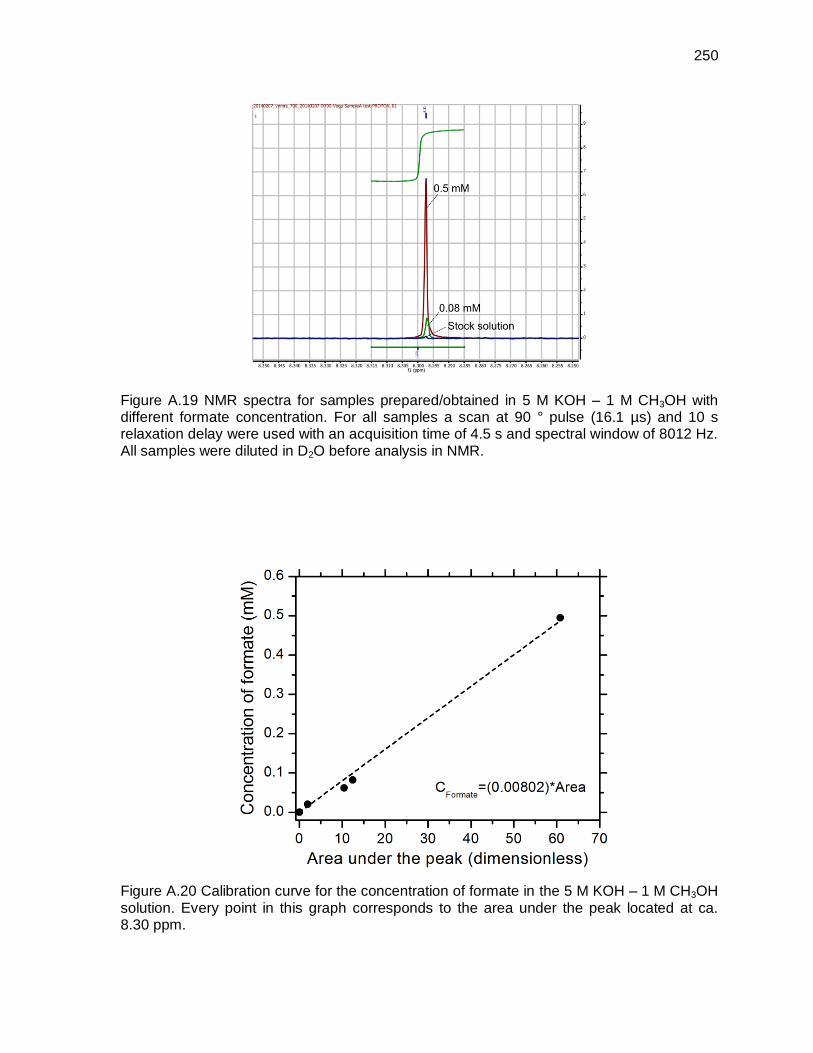
Figure A.19 NMR spectra for samples prepared/obtained in 5 M KOH – 1 M CH3OH with different formate concentration. For all samples a scan at 90 ° pulse (16.1 µs) and 10 s relaxation delay were used with an acquisition time of 4.5 s and spectral window of 8012 Hz. All samples were diluted in D2O before analysis in NMR..................................................................................... 250
Figure A.20 Calibration curve for the concentration of formate in the 5 M KOH – 1 M CH3OH solution. Every point in this graph corresponds to the area under the peak located at ca. 8.30 ppm. .................................................................... 250
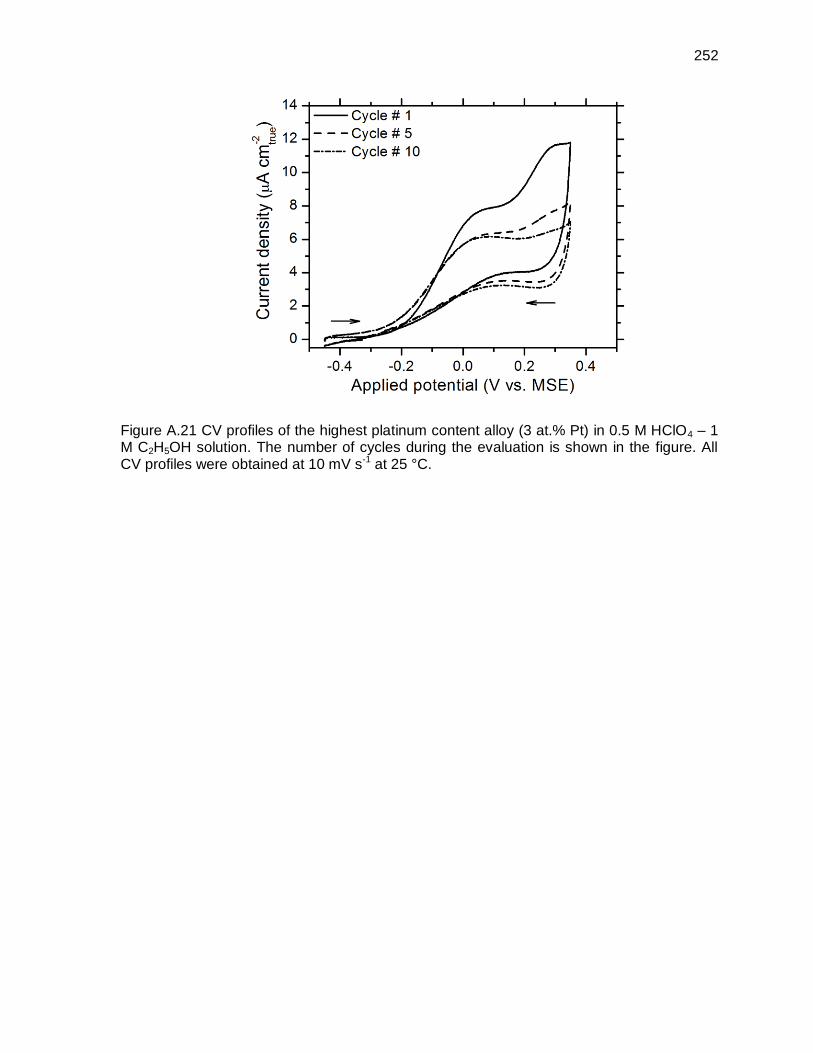
Figure A.21 CV profiles of the highest platinum content alloy (3 at.% Pt) in 0.5 M HClO4 – 1 M C2H5OH solution. The number of cycles during the evaluation is shown in the figure. All CV profiles were obtained at 10 mV s-1 at 25 °C. ....... 252
xxv
Figure B.1 Orientation of the simulation cell with respect to the orthogonal FCC cubic cell. The sides of the simulation cell are of {111} family and the edges are <110>. Red vertices of the simulation cell coincide with the dace centers of the orthogonal FCC cubic cell. ......................................................................... 255
Figure B.2 Comparison between dealloying of a binary (Ag75Au25) and ternary (Ag75Au20Pt5) alloys: (a) anodic current density, (b) charge density passed, (c) thickness of the dealloyed layer and (d) surface increase. These results were obtained by KMC simulation of the dealloying process carried out for a maximum time of 300 s at 1000 mV vs. SHE. Dealloying temperature: 25 °C. The dealloying process in the binary and ternary alloy stopped at 300 s and 200 s respectively. ..................................................................................... 257
Figure B.3 Simulated structures of the nanoporous layer for Ag75:Au25 (a and c) and Ag75:Au20:Pt5 (b and d). In all cases, KMC simulations were used. The color code in these structures is as follows: gray atoms represent silver atoms, yellow atoms represent gold atoms that have not diffused; brown atoms represent gold atoms that diffused; green atoms represent platinum atoms that have not diffused and blue atoms represent platinum atoms that diffused. The green lines in (a) show the outline of the simulation cell and the red arrow is the cell’s side surface. ............................................................ 258
Figure B.4 Cross-sectional view of the dealloyed simulated structures of the nanoporous layer for Ag75:Au25 (a and c) and Ag75:Au20:Pt5 (b and d). In all cases, KMC simulations were used. The color code in these structures is the same as described in Figure B.3. ............................................................... 259
Figure B.5 Content of residual silver trapped in the dealloyed layer formed on the binary and ternary alloy (Ag75:Au25 and Ag75:Au20:Pt5 respectively) after simulating the dealloying process at 1000 mV vs. SHE and 25 °C. The dealloying process in the binary and ternary alloy stopped at 300 s and 200 s respectively. ................................................................................................... 260
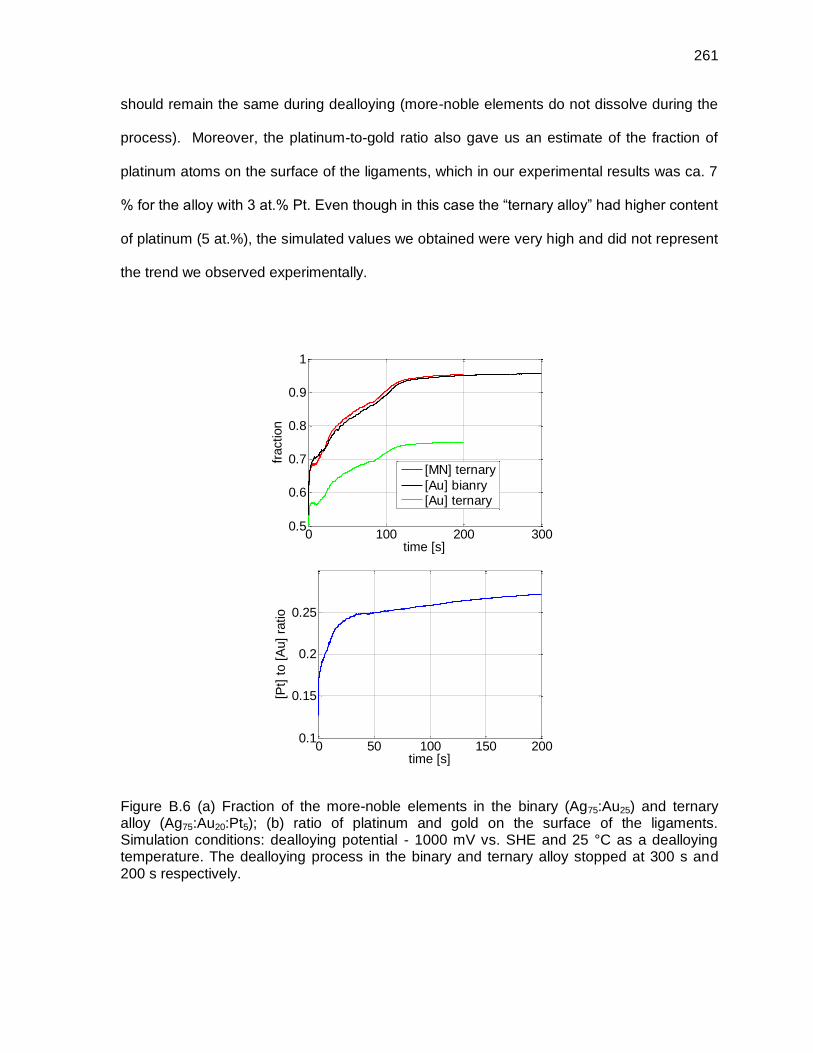
Figure B.6 (a) Fraction of the more-noble elements in the binary (Ag75:Au25) and ternary alloy (Ag75:Au20:Pt5); (b) ratio of platinum and gold on the surface of the ligaments. Simulation conditions: dealloying potential - 1000 mV vs. SHE and 25 °C as a dealloying temperature. The dealloying process in the binary and ternary alloy stopped at 300 s and 200 s respectively. .................. 261
xxvi
List of Appendices
Appendix A. Supplementary Data ..................................................................................... 218
A.1 Potentiostatic dealloying: comparison between binary and ternary alloys .. 218
A.2 Formation of surface oxides during dealloying ............................................. 219
A.3 Electrochemical Impedance spectroscopy (EIS) of dealloyed samples ...... 220
A.4 Alternative method to determine the developed surface area in
The development of new and more robust materials for applications in chemical
processes, sustainable energy, remediation of the environment and many other fields is one
of the biggest challenges in the 21st century. Porous materials, such as zeolites or aerogels,
offer versatile properties and characteristics (e.g., pore sizes and morphology) that have
been found very useful in a variety of fields [1,2]. Amongst all the different porous materials,
porous metals have gained a lot of interest due to their high electrical conductivity,
mechanical properties and broad application spectrum [3-8]. In recent decades, the
significant growth of nanotechnology, the development of powerful characterization
techniques such as scanning electron microscopes (SEM) and transmission electron
microscopes (TEM), and the remarkable properties displayed by nanomaterials, such as
nanowires, nanotubes and metal clusters [9-11], increase the interest of the scientific
community in the formation and characterization of nanoporous materials. These materials
possess unique characteristics that underline their relevance in fields of great technological
importance such as catalysis, sensors, energy harvesting and optics. According to the
International Union of Pure and Applied Chemistry (IUPAC), materials with a pore size in the
range between 2 and 50 nm should be referred to mesoporous; materials with larger pores
are referred as macroporous and materials with smaller pores are known as microporous.
Hence, from IUPAC’s standpoint, the term “nanoporous” is meaningless; however, the prefix
nano brings out a intrinsic size scale that goes from 1 to 100 nm [12]. One subgroup of
nanoporous materials is nanoporous metals (NPMs). NPMs can be synthesized by a variety
of techniques such as template synthesis [13-15], surfactant mediated synthesis [16-18],
and dealloying. Some of these techniques provide poor control over size and extent of
porosity; furthermore, while in some methods there is control over these parameters, but
2
only porous metals in the form of thin films can be prepared which have insufficient
mechanical stability. Dealloying or selective dissolution is, among these techniques, an
easy, flexible and economical strategy to produce NPMs [12,19,20]. During dealloying, the
less-noble element is removed from a metallic solid solution (i.e., parent alloy) by electrolytic
dissolution, leaving behind an interconnected structure with remarkable characteristics such
as high surface-to-volume ratio, good mechanical integrity, near-theoretical strength in
compression, and size-scale dependent elastic modulus [20-22].
Although NPMs seem to be rather new, they are not. Gold purification by selective
dissolution can be traced back over 2500 years to the reign of King Croesus (560-547 B.C.)
of Lydia, in present day Turkey [23]. Using a partially refined Ag-Au-Cu alloy (termed
electrum) as a starting material, a process was developed where, under the application of
heat, the silver and copper were converted to metal chlorides, leaving behind gold [24].
Many centuries later, the pre-Columbian civilizations of Central and South America, such as
the Incas, used a superficial dealloying of Au-Cu alloys to generate a shiny gold surface,
giving the work piece the allure of pure gold. They subsequently developed a process that
enabled the selective dissolution of silver from Ag-Au alloys that was remarkably similar to
that used in Croesus’ time, although they were able to modify the process to remove the
requirement of heat [25,26]. Also, in the middle of the Italian Renaissance, even Leonardo
da Vinci discussed in the Codex Atlanticus (ca. 1508) that parting silver from Ag-Au alloys is
possible using potassium nitrate [27].
NPMs, as demonstrated in Figure 1.1, generally display a remarkable consistency in
the ligament and pore widths; moreover, the feature size of the nanostructures could range
over several orders of magnitude, from nanometers, up to microns in diameter under the
right experimental conditions. In addition, it is fair to say that dealloyed materials have an
intrinsic structural, dimensional and compositional complexity of their own: the thickness of
3
the resulting nanoporous sponge may be of several millimeters in depth, while the width of
the ligaments and pores, at the smaller size, is typically only of the order of a few
nanometers; furthermore, while dealloying is progressing, the less-noble element is
removed not only from the dealloying front (i.e., interface between unattached alloy and fully
formed porosity), but also it could be removed from the already formed ligaments inducing a
compositional gradient along the dealloyed layer. This process is closely associated with the
coarsening of the structure (as discussed later).
These, and many other properties, place NPMs in the front line of nanotechnology
research today. In fact, the number of research groups dealing, at least in principle, with
these nanoporous structures has grown drastically in the last few years. Therefore, it is
expected that a lot more will be made of these materials in the near future.
Figure 1.1 Nanoporous structure formed by dealloying of silver from Ag77:Au23 alloy in 0.77 M HClO4 solution at 40 °C.
4
1.1 Formation of nanoporous metals by dealloying
Historically, dealloying has been primarily recognized, within the corrosion community,
for its role in stress-corrosion cracking of different industrial alloys (e.g., dezincification of
brass, nickel-aluminum-bronze alloys) [28,29], although other corrosion phenomena (i.e.,
corrosion pitting) has been associated with dealloying of technologically important alloys
such as the aluminum 2024-T3 alloy [30]. It is only relatively recently that dealloying has
been identified as a route to produce NPMs. Two dealloying techniques have been mostly
used to form NPMs: free-corrosion (or simple-immersion) dealloying and electrochemical
dealloying. The former one refers to the process in which the alloy is submerged in an
oxidizing electrolyte (typically aqueous nitric acid - HNO3) that facilitates the dissolution of
the less-noble component(s). In electrochemical dealloying, on the other hand, the selective
removal of the less-noble element is facilitated by introducing an electric potential to the
system; conventionally, a three-electrode electrochemical cell is used: it consists of an
anode (i.e., the precursor alloy), a counter-electrode, a reference electrode and an
electrolyte (aqueous perchloric acid – HClO4 is commonly used). Even though this
technique requires a more sophisticated set-up, it provides superior process control.
As briefly described before, dealloying consists in the removal of the less-noble
element from a metallic solid solution (i.e., binary or ternary parent alloy) and the
reorganization of the remaining element(s) by surface diffusion. The parent alloy however,
has to meet some basic requirements to be able to facilitate the development of an
interconnected structure such as the one shown in Figure 1.1. Those basic requirements
are the following [31]: (i) the reduction potential of the alloy components must be well-
separated such that one component is soluble in its oxidized state (i.e., so that the element
dissolves); in other words, one component (or possibly more than one) is thus more noble
than the other one; (ii) in the majority of the cases, the composition of the alloy must be
5
neither too rich nor too poor in the more noble components; if the alloy is too rich in the
more-noble species, no dealloying will occur; conversely, if there is too little noble species, it
is very difficult to maintain porosity evolution through the material; (iii) the alloy must be
sufficiently homogeneous with no phase separation prior to dealloying and ideally stress-
free, and (iv) surface diffusion of the more-noble atoms at the alloy/electrolyte interface must
be sufficiently fast to move from their original lattice sites and agglomerate into the
backbone of the nanoporous sponge (see details below).
In ideal solid solutions (i.e., ApB1-p in which B is the more-noble element), each
component has individual thermodynamic properties; thus, it is expected that the anodic
dissolution of A is related to the chemical composition of the solid solution. The partial Gibbs
free energy of A is given by )ln( AA nRTG , where nA is the mole fraction of A. As
AA EyFG , where EA is the difference between the equilibrium electrode potential of
A in the alloy and the corresponding potential of A in the individual phase, y is the number of
electrons transferred and F is the Faraday constant (i.e., 96 458 C mol-1); therefore, the
following relation is obtained:
)ln( AA nyF
RTE (1.1)
By definition nA is always less than 1, so that ∆EA > 0, which means that the partial
potential of the alloy component (i.e., A) is always more positive than the corresponding
individual metal. Consequently, dissolution of metals from alloys should also start at more
positive potentials, as can be seen in Figure 1.2 (explanation below). Considering now the
6
difference in the free energy between the two components (A and B), one can write the
following relations:
)ln(00
A
BABAB
n
nRTGGG
(1.2)
ABAB EyFG (1.3)
where again ni (i = A, B) is the mole fraction of the components of the solid solution, ( ) is
the free energy of the respective component in the standard state, R is the universal gas
constant, T is the absolute temperature and E is the difference in potential.
By substituting the relation given in 1.3 into 1.2 and making the necessary
simplifications, we obtain the following relation:
)ln(0
A
BABABAB
n
n
yF
RTEEEE (2.4)
This relation shows the existence of a difference in the electrochemical potential of
each component of the alloy (i.e., the dealloying potential), which depends on the difference
in their standard reversible potential, and the composition of the solid solution. Moreover, it
7
is also clear that the fraction of less-noble element cannot become zero and that dealloying
cannot proceed to 100%.
A typical example of a solid solution is the Ag-Au alloy. In this case, silver is less-noble
than gold, as observed by comparing their standard potentials ( = +1.68 VNHE;
= +0.80 VNHE) [32]; therefore, when this solid solution is dealloyed, only silver is
selectively removed leaving behind mostly a gold structure with a significant porosity.
Nevertheless, some silver is always trapped in the core of the nanostructure. This
nanoporous metal is typically called nanoporous gold (NPG). More importantly, based on
the difference in the standard potentials, one can easily prepare NPG by dealloying either
Ag-Au or Cu-Au alloys, but not from Au-Pt alloys.
Besides the thermodynamic considerations described before, two additional
parameters are essential for dealloying, the so-called critical potential and the composition
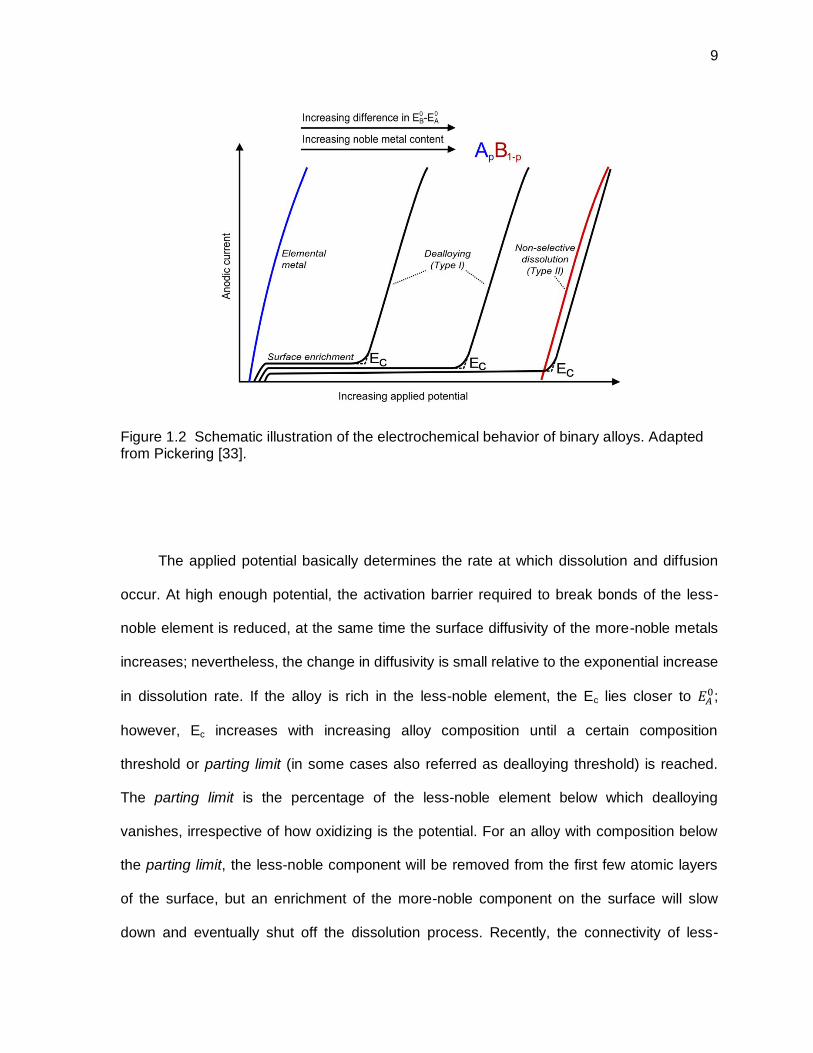
threshold or parting limit. Pickering, in his pioneering work [33,34], was the first one to
introduce the relation between the applied potential and the dissolution rate that
characterizes the electrochemical dealloying process (Figure 1.2). This behavior can be
reproduced by scanning the potential in the positive direction from the standard reversible
potential ( ) of the less-noble metal of the alloy (e.g., A in the case of ApB1-p alloy). At low
overpotentials relative to , the alloy displays passive-like behavior due to the surface
enrichment and blocking influence of the more-noble metal, B. Up to now, it is not
completely clear what is the origin of this passivation; nevertheless, fundamental research in
NPG has shown that at very low overpotentials, there is a formation of monolayer patches of
gold-rich film that after growing to a thickness of two or three monolayers has an
unexpected inverted stacking sequence; by increasing the overpotential, almost pure gold
islands (10-15 monolayers) appears inheriting the inverted stacking sequence. At sufficiently
8
high overpotential, a new substrate oriented gold structure appears and the initial stacking-
inverted layer vanishes, forming the templates for the growth of nanoporous metals. [35].
This passive-like behavior results in a relatively potential-independent current with no
development of bulk porosity. At a certain potential (i.e., empirical critical potential - Ec), the
current quickly rises with the subsequent formation of porosity. This dealloying behaviour
was termed by Pickering as Type I dissolution. At this point, the less-noble element(s) are
removed from the parent alloy and the more-noble element(s) undergo a self-organization
process (i.e., by surface diffusion) producing a three-dimensional bicontinuous porous
network of interconnected ligaments or pillars (i.e., dealloyed layer). In simple terms, Ec
represents a transition between surface smoothening and severe roughening leading to bulk
dealloying and porosity evolution [36,37]. More recently, an intrinsic critical potential was
proposed to exist; this potential does not depend on any adjustable experimental parameter,
such as the scan rate or the electrolyte temperature, and it is a critical point inherent in the
system, corresponding only to the necessity of dissolving the less-noble metal to create a
surface with very high curvature [31,38]. For Ag-Au alloys, it was demonstrated that the
intrinsic critical potential (determined potentiostatically after long periods of time) lies
approximately 100 mV below those determined potentiodynamically (i.e., Ec) [39,40]. This
effect is basically due to the electrode not being at equilibrium during the potentiodynamic
measurement.
9
Figure 1.2 Schematic illustration of the electrochemical behavior of binary alloys. Adapted from Pickering [33].
The applied potential basically determines the rate at which dissolution and diffusion
occur. At high enough potential, the activation barrier required to break bonds of the less-
noble element is reduced, at the same time the surface diffusivity of the more-noble metals
increases; nevertheless, the change in diffusivity is small relative to the exponential increase
in dissolution rate. If the alloy is rich in the less-noble element, the Ec lies closer to ;
however, Ec increases with increasing alloy composition until a certain composition
threshold or parting limit (in some cases also referred as dealloying threshold) is reached.
The parting limit is the percentage of the less-noble element below which dealloying
vanishes, irrespective of how oxidizing is the potential. For an alloy with composition below
the parting limit, the less-noble component will be removed from the first few atomic layers
of the surface, but an enrichment of the more-noble component on the surface will slow
down and eventually shut off the dissolution process. Recently, the connectivity of less-
10
noble metal atoms has been the focus of attention to explain the parting limit [41]; therefore,
in simple terms, below the parting limit there will not be enough interconnected channels of
the less-noble constituent to allow dissolution and to proceed through the thickness of the
material. According with the basic percolation theory, the percolation threshold (i.e.,
composition of silver below which silver atoms do not connect through the thickness of the
alloy) for FCC alloys (e.g., Ag-Au) is 20 at.% silver [42]. However, experimental data
suggest that the parting limit for dealloying Ag-Au is approximately 55 at.% silver [33,43,44].
To solve this discrepancy, ‘high-density percolation’ (HDP) concepts have been used
[41,42]. The idea behind this is that for a cluster of the less-noble element to be dissolvable
in an electrolyte, it must have sufficient width so that anions in the electrolyte can solvate it.
Kinetic Monte Carlo (KMC) simulations confirmed this concept by allowing silver (for the Ag-
Au alloy) to dissolve or not, depending on its local coordination; specifically, it was found
that when 10- and 11- coordinated silver atoms were not allowed to dissolve, the effective
percolation threshold changed to the observed 55 at.% [42]. In some FCC alloys such as
brass, the parting limit for dealloying is actually 20 at.%; in these materials, this threshold
can be accessed if the more noble metal can be exchanged between the electrolyte and the
surface (i.e., it is at or near its equilibrium potential with its aquo-ions) [42]. At the parting
limit, and unless the electrolyte that has been used can also dissolve the more-noble
component of the alloy (e.g., B), a passivating oxide will form (Type II as shown in Figure
1.2).
The component B in the ApB1-p alloy (i.e., the more noble component) will also be
oxidized if the difference between the standard reversible potential between A and B ( -
)
is too small. Under these circumstances, not sufficient overpotential is allowed for the
selective dissolution of the less-noble metal (A in this case); nevertheless, it is worth noting
11
that under these conditions, the significantly differing elemental dissolution rates are still
capable of forming porous material, as in the case of α-brass [36].
1.2 NPG: formation, characteristics and surface modifications
Amongst the different NPMs that can be produced by dealloying, NPG has clearly
dominated in the literature. In recent years the number of publications concerning NPG
steadily increased from ~25 papers in thirteen years (from 1992–2005) [45] to more than
110 publications in 2013 alone (Thompson Reuters - Web of Knowledge, 2014). As
discussed before, NPG can be generated by dealloying of a gold alloy containing silver,
copper or aluminium as less-noble constituents. Besides the remarkable properties and
characteristics of NPG, it is probably accurate to say that most of the development of NPG
and other gold nanomaterials has been driven not only for the fascination that people have
developed for gold (it has been generally viewed as an immutable, non-changing element
and as the ultimate statement of wealth and beauty), but also for the remarkable properties
that gold displays when its feature size decreases down to the nanoscale (e.g.
nanoparticles) [46-48]. Some of the highly positive characteristics of NPG are the following:
a) uniform open porosity; b) very high surface area; c) conductive bicontinuous network with
characteristic length (i.e., width of the ligaments) easily tunable from a few nanometers to
micrometers; d) biocompatible surface to which can be attached all sorts of functional
biomolecules, amongst many others. Some of those characteristics are depicted in Figure
1.3.
In the case of Ag-Au alloys, as precursors for NPG, silver and gold are both metals
with identical face-centered cubic (FCC) lattice structure and almost identical atomic radii,
resulting in alloys with unlimited solid solubility; however, their electrochemical properties
12
are significantly different from each other (i.e., standard reversible potential), which allow the
removal of silver and formation of well-defined structures with open porosity [36,42]. Since
the 1960s, corrosion of gold alloys (i.e., dealloying) has been systematically investigated
[32,34,42,49]. In fact, in the 1980s and 1990s, many researchers studied the corrosion
process of Ag-Au alloys showing the growing interest of the scientific community to
understand the mechanism of dealloying in gold alloys [50,51]. However, it was not until the
development of nanotechnology, in the late 1990s and the early 2000s, that it was revealed
that nano-sized gold can have a remarkable role in technologies such as water purification,
fuel cells, biomedicine, therapeutics and others [52]. Nonetheless, it seems counterintuitive
that an inert material such as gold can be used in applications where the chemical activity of
its surface plays a key role; however, it is the unique combination of gold and its
nanostructure that makes it possible, as will be discussed in Section 1.4.
The mechanical properties of NPG have also been extensively studied [20,57,58].
Amongst many interesting characteristics, it has been determined that the yield stress within
an individual ligament may be as high as 1.45 GPa, which approaches the theoretical shear
strength of the material [59]. Moreover, it was found that by decreasing the ligament size of
NPG enhances the yield strength and stiffness of the material [53,60]. This suggests that
the dislocation activity, which is responsible for the plastic deformation of metals, is strongly
affected by the nanoporous structure. For more details about the mechanical properties of
NPG, refer to the review done by Dou and Derby [58].
13
Figure 1.3 NPG and its various structural variations ranging from microfabrication (adapted
with permission from Biener et al. [53]. Copyright 2006 American Chemical Society), tunable
pore and ligament size, hierarchical structures based on templating techniques (adapted
from Erlebacher and Seshadri [12] with permission of Cambridge University Press) and its
chemical variations, ranging from decoration of the surface of the ligaments with metals
such as platinum (adapted with permission from Ding et al. [54]. Copyright 2004 American
Chemical Society), molecular entities (adapted from Pareek et al. [55] with permission of
Royal Society of Chemistry) or even metal oxides, such as TiO2 (adapted with permission
from Jia et al.[56]. Copyright 2009 American Chemical Society).
1.2.1 Overview of proposed dealloying mechanisms of NPG
A fundamental question regarding the formation of porous metals is the mechanism by
which dealloying is maintained over more than a few atomic layers leading to the three-
dimensional structure shown in Figure 1.1. Historically, different mechanisms have been
proposed to explain how two alloying constituents, intermixed on an atomic scale, can be
separated so effectively by electrolytic action. The majority of the work done towards the
14
development of these mechanisms has been based on NPG; however, the principle behind
this is applicable to other NPMs.
A key aspect of any dealloying mechanism, besides the dissolution of the less-noble
component(s), is the fact that the more-noble metal atoms in the alloy must physically move
from original lattice sites, as occupied in the non-dealloyed material, and reposition
themselves on a highly porous skeleton during the selective dissolution. Typically, however,
the driving force for atomic diffusion follows a concentration gradient or follows a direction
so as to lower the overall surface area (i.e., surface energy), which clearly is not what
happens during the formation of nanoporosity. One might think that knowing the fact that the
more-noble alloy component moves, they might arrange themselves on a surface to form a
dense monolayer, protecting the bulk of the alloy from further dissolution (i.e., passive-like
behavior), which does occur below Ec; however, above Ec the more-noble atoms move in
such a way as to both agglomerate (moving against a concentration gradient as they diffuse
from the base of the pits, where exists a surface with locally bulk alloy composition, to the
noble element-rich pillars of the porous skeleton) and also increase the surface area of the
material as it becomes nanoporous [61]. Clearly, the driving force that moves more-noble
metal atoms during dealloying is counterintuitive. Some of the mechanisms that have been
proposed to explain the whole phenomenon are described below.
One of the first mechanisms to explain the observed enrichment of more-noble atoms
on the porous skeleton was called the Volume Diffusion model and it was postulated by
Pickering and Wagner [34] in the late 60s. In this model, it was suggested that the near-
surface region becomes depleted of the less-noble component, which creates a gradient
perpendicular to the alloy/electrolyte interface position, driving bulk diffusion of the less-
noble component to the surface where it can be dissolved away (this obviously creates an
accumulation of the more-noble adatoms on the surface of the electrode due to the
15
formation of surface vacancies created by preferential removal of the less-noble
component). However, volume diffusion in the unattacked alloy was found to be quite slow;
in fact, at the time this mechanism was proposed, even surface diffusion was considered too
slow (only a few measurements of the surface self-diffusion coefficient had been measured,
and only in vacuum [61]). Therefore, this mechanism also proposed that the injection into
the bulk of vacancies and divacancies (i.e., faster-moving defects) maintains the transport of
the less-noble components to the surface, thereby permitting the propagation of the
dealloying process. This mechanism however did not get enough experimental support.
The Surface diffusion mechanism was, according with Dursun [39], originally proposed
by Gerischer in 1962 and it involves the nucleation and growth of nuclei of the pure, or
almost pure, more-noble component via a surface diffusion process. As the less-noble
element is selectively dissolved from the surface of the alloy, the remaining more-noble
element, which is in a highly disordered state, begins to reorder by surface diffusion
resulting in a nucleation and growth of gold-rich islands. This model, in contrast with the
Volume Diffusion model, establishes that there is no transport of the less-noble atoms to the
electrode surface via volume diffusion. In this model however, it was expected that after the
initial stages of the dissolution of the less-noble element, the alloy becomes completely
passivated when all the surface sites are occupied by more-noble elements. This was
clearly in opposition to practical experience in which formation of nanoporosity was
observed.
Following the work done by Gerischer, Forty et al. [32,42,62] proposed that the
selective dissolution of the less-noble element should lead to the creation of surface
vacancies or adatoms, which migrate across the surface to form pits, steps and other
surface roughening features, or they can assist the migration of the residual more-noble
atoms which leads to the island growth. The coalescence of these islands by migration of
16
the more-noble atoms exposes fresh alloy to the corrosive environment where further
dissolution will occur. The main argument against this new model was also that the
mechanism for sustained three-dimensional porosity development was not clear
(enrichment at the surface of the more-noble element would also shut off the dealloying
process). Nevertheless, this model was later extended by incorporating percolation theory,
using Monte Carlo simulations of dealloying, in order to include the importance of the
placement of atoms, in a randomly packed way, in a solid to account for the appearance of
porous structures [41]. In this way, it was shown that for a randomly packed matrix of gold
and silver atoms (again in the case of NPG), two fundamental processes were necessary to
reproduce the electrochemical behaviour and the morphology of the material: silver
dissolution and gold surface diffusion, in which the driving force was the high curvature of
the initial porosity (Gibbs-Thompson effect) resulting in the coarsening of the structure (see
below). In this model, the transport of the less-noble component to the surface by volume
diffusion was not necessary for dealloying; moreover, the selective dissolution process is
only possible if a continuous path of the more electrochemically active component
(percolation cluster) exists throughout the thickness of the material.
Based on this model, for dealloying systems in which large silver dissolution
overpotentials could be applied without gold oxidation (see Figure 1.2), silver could be
selectively removed from highly coordinated sites (initially silver dissolves from a terrace),
forming neighboring ledges that would continually dissolve until the entire layer was stripped
of suitable silver, clearly resulting in a three dimensional dissolution. The more-noble metal
atoms that are left behind could, at least in principle, stay in place as adatoms, populating
the layer of the material and slowing down further dissolution, but the thermodynamics of
the alloy/electrolyte interface predicts that such a condition would place the surface far out
of equilibrium, thus the adatoms will tend to agglomerate and eventually coarsen. The
17
kinetics of surface diffusion of more-noble metal atoms cannot be accurately described by
simple Fickian diffusion, mainly because the concentration gradient of the more-noble metal
component increases in the growing islands (which again is expected due to the highly non-
equilibrium state of the adatoms on the surface). To adequately describe this phenomenon,
the Cahn-Hilliard diffusion equation, incorporating a concentration dependent mobility, has
been proven very successful [19].
The surface diffusion mechanism was later experimentally verified by Oppenheim et
al. [50], who not only demonstrated, via in situ electrochemical scanning tunneling
microscopy (STM) of alloy dissolution, that surface diffusivities of FCC metal adatoms were
many orders of magnitude faster in the presence of the electrolyte than in air or vacuum,
exceeding the threshold value for nanoporosity formation (i.e., a minimum surface diffusion
coefficient on the order of 10-14 cm2 s-1 was needed for the noble atoms to diffuse on the
order of 1 nm in about 1 s and agree with experimental observations), but also
demonstrated that a terrace atom dissolution of silver from gold-rich alloys require a
significant overpotential, which clearly agrees with the simulations [31]. Moffat et al. [63]
independently confirmed the faster surface diffusivities of gold in an electrolyte after
studying Cu3Au by STM. This model, even though it is based on simplified dissolution and
diffusion rules, successfully predicts many of the aspects associated with the formation of
nanoporous metals formed by dealloying, including the critical potential, parting limit (the 20
% parting limit), formation of unconnected porosity below Ec, etc.
Recently, Erlebacher further developed this Monte Carlo model by introducing kinetic
function to both, silver dissolution/diffusion and gold diffusion [19,36]. By doing that, it was
possible to simulate a “real-time” dealloying that was controlled through alloy composition
and applied potential. The rates of dissolution and diffusion were based on a nearest
neighbour bond-breaking model, where surface atoms were chosen at random with the
18
dissolution/diffusional probabilities calculated for specific circumstances. The rates of
dissolution and diffusion are shown in equations 1.5 and 1.6 respectively:
Tk
Ek
B
bEdiss
exp (1.5)
Tk
Ek
B
bDdiff
exp (1.6)
where α represents the number of nearest neighbouts, Eb the bond energy, which is
considered equivalent for both gold and silver and given initially as 0.15 eV, and was the
applied potential (1.75 eV). kB and T were the Boltzmann constant and absolute temperature
respectively. The E was obtained after fitting experimental results of the dissolution of pure
silver ( E = 1x10⁴ s-1); D is an attempt of frequency of the order of the Debye frequency
and set equal to 1x10¹³ s-1. Silver dissolution rates were reported to be consistent with the
Butler-Volmer equation in the high overpotential Tafel regime.
Figure 1.4 shows an example of the KMC simulations done for Ag-Au alloys. Figure
1.4a shows the terrace island formed after silver atoms were preferentially removed from
the first atomic layer. Initially, dissolution of silver from a terrace (which is the rate-limiting
step of the process – Figure 1.4c) creates a terrace vacancy. The atoms surrounding the
created vacancy are more susceptible to dissolution, because they have fewer nearest
neighbours, and are removed faster than the initiation step to create a terrace island. The
19
terrace is thus largely stripped of silver, leaving behind the bulk fraction of gold adatoms
(Figure 1.4a, cii). Due to their low co-ordination states and because the sample is immersed
in an electrolyte, the gold adatoms display a very high surface self-diffusion coefficient, and
quickly agglomerate to form islands that also contain residual silver (Figure 1.4ciii). The
selective removal of silver from the underlying layer again creates a high concentration of
gold adatoms that diffuse to the gold islands created from the previous terrace (Figure 1.4b,
civ). This process can thus repeat until the porosity is formed.
Figure 1.4 Snapshots taken from Monte Carlo simulations performed on Ag-Au alloys: (a) initial stage of dissolution of silver and formation of terrace island; (b) formation of mounts. Single steps of dealloying mechanism are depicted in (c), where the yellow balls represent gold and the grey balls silver. (a) and (b) are adapted from Erlebacher and Seshadri [12] with permission of the Cambridge University Press.
20
Even though this improved Monte Carlo model has been remarkably successful to
reproduce/predict the main dealloying characteristics, direct comparison between real
dealloyed structures and those formed by simulation (e.g., ligament size) is not yet possible.
Several simplifications were made to the model to reduce its computational cost. Some of
those simplifications included the removal of the electrolyte by vacuum, which once again
has implications for the relaxation of the metal surfaces [64-67], the assumption that gold
surface self-diffusion was considered to be constant, amongst others. It is expected
however, that these simplifications will be eliminated in the near future as the cost of
computer power falls.
1.2.2 Coarsening of the nanoporous structure
1.2.2.1 Overview
While dealloying of Ag-Au progresses, the size of recently created pores and
ligaments keeps increasing. At the same time that ligaments grow in size, more original
alloy is exposed to the electrolyte allowing removal of silver from the already formed
ligaments, which constitutes the second stage of silver dissolution. Furthermore, even after
most of the silver has been removed from the ligaments, the feature size in the structure
continues to increase as long as NPG is exposed to the electrolyte thanks to the high
surface self-diffusivity of gold in the electrolyte. This process is typically referred as
electrochemical coarsening, post-porosity coarsening or simply coarsening. Even though
coarsening happens quite fast when the material is immersed in the electrolyte, coarsening
happens throughout the entire life of the material, even when it is taken out from solution.
21
NPG is, from the thermodynamic point of view, intrinsically unstable, i.e., its
nanostructure has a very high surface energy. This instability provides the driving force
behind coarsening, which is the Gibbs-Thompson effect or curvature-driven growth [12,36].
During coarsening, the migration of material goes from higher to lower energy sites;
therefore, as smaller ligaments contribute more to the surface energy (on a per volume
basis) than large ligaments, the thermodynamic driving force is larger for their elimination or
incorporation into larger ligaments. As a result, the distance between adjacent ligaments
increases and a significant growth of both ligaments and pore diameters is observed [68].
In order to rationalize the coarsening phenomenon in nanoporous metals, it was
necessary to look at the growth of larger clusters at the expense of smaller clusters
(typically known as Ostwald ripening). This theory was formally developed by Lifshitz and
Slyozov [69] and Mullins [70] through a self-consistent mean-field theory, showing that the
cluster growth asymptotically following the relation:
31
ktRav (1.7)
where Rav is the average cluster radius, k a proportional constant and t is the time. The
number of cluster/islands was likewise predicted to decrease with t-1. After complex
calculations, it was determined that this result was independent of both dimensionality and
surface coverage, which has shown to be correct in two and three dimensions for solid/liquid
[71], and solid/solid systems [72] under mean-field conditions [73]. However, in two
dimensions, the equation that governs the cluster radius was only valid under the adatom
diffusion limited ripening [73] and the time dependence decreases to t0.2-0.25 under conditions
22
where the islands themselves migrate [74]. Moreover, the mean-field approach has been
shown to be inaccurate through shielding effects on islands [75], and the simulated
exponents never reached the asymptotic limit of 1/3.
A different approach considered a two-dimensional growth of static spherical-cap
islands, in mass conservative systems, showing that the average radius increases with t1/4
[76,77]. Simplistically, the ripening process on an atomic level can be considered as the
detachment of atoms from an island or grain boundaries, kinks and ledges; these atoms
then diffuse across the metal surface as adatoms, and eventually coalescence with another
island. Therefore by monitoring the change in surface area (i.e., ripening) of
thermodynamically destabilized metals (i.e., gold and platinum atoms), one can determine
the surface self-diffusion coefficient of metals in contact with an electrolyte. Therefore,
continuing the work done by Chakraverty [76], Alonso et al. [77] and Vazquez et al. [78]
developed a rounded-cap cylindrical column model that enabled the calculation of the
diffusion coefficient, as shown in the following relation:
kT
tDarr s
44
0
4 2 (1.8)
where the average cylinder radius is given by r (r0 at t=0 is given as 1x10⁻⁶ cm [78]), is the
surface tension, a is the metal lattice constant and Ds the surface self-diffusion coefficient.
With this equation, a prediction of the growth of the average cylinder radius with time was
possible. In addition, the following relation was derived to make this result even more useful:
23
4
1
0
41 23
)(
r
kT
tDa
Mq
zFtR s
(1.9)
R(t) is the surface roughness at time t and can be experimentally determined as the ratio of
charge passed for the formation of an oxide monolayer between the electrodispersed state
and the initial state, i.e., 0)()( qtqtR . In equation 2.9 the quantity in the first parentheses
represents the roughness and dimensions of the rounded-cap cylindrical columns used to
approximate the surface, M is the molecular weight of the hydrous metal oxide layer (i.e.,
Au2O3), q the electroreduction charge density of the oxide layer at t=0, z the number of
electrons passed per elementary reaction, F is Faraday’s constant, and is the density of
the oxide film. Literature concerning the measurement of Ds clearly demonstrates the validity
of the t1/4 relationship [65-67,77,79].
An obvious question at this point is whether or not this model developed by Alonso,
Vazquez and coworkers would be applicable to nanoporous structures. Graphical
extrapolation from the experimental data recorded by Kelly et al. [80], showed some
variability in the time dependency with respect to the predicted relation (i.e., t0.19-0.31 instead
of the t0.25); Corcoran et al. [81], on the other hand, showed that coarsening of NPG (formed
from Ag70:Au30) under potential control was surface-diffusion dominated and displays t1/4
kinetics at long times. Dursun et al. [82] also confirmed the validity of the Equation 1.8 for
NPG developed under potential control. It is important to say however, that originally this
model allows for random surface diffusion in a surface with negligible curvature, so the
thermodynamic driving force is isotropic. In nanoporous metals, the presence of positive and
negative curvatures generate anisotropic surface diffusion fluxes that, for example, eliminate
smaller ligaments at a faster rate than those with a larger radius [83]. Moreover, this model
24
is based on the surface diffusion-limited scenario, where the electro-dispersed islands are
limited to emit adatoms only from their edges; in the case of nanoporous metals, the entire
surface can be considered ‘edge’ as every surface atom is capable of diffusion. Despite
those arguments, the model developed by Alonso, Vazquez and coworkers seems to
represent the general behaviour followed by the coarsening of nanoporous metals. Later on,
Pugh [84] re-derived Equation 1.8 in its entirely from Fick’s Second Law, and showed that
the surface self-diffusion coefficients obtained from his relation agreed very well with values
reported in literature; nevertheless, he concluded that the most appropriate means of
understanding the coarsening mechanism was through atomistic simulations. Recently,
Kolluri and Demkowicz [85], using atomistic modeling, argued that surface diffusion alone
does not accurately describe the characteristics observed in nanoporous metals after
coarsening (e.g., volume reduction, enclosed voids); in fact, they proposed the existence of
phenomena such as ligaments collapsing and localized plasticity to accurately reproduce
the characteristics observed in coarsened NPG. Nevertheless, and as described since the
beginning of this section, up to now, coarsening is a phenomenon that depends mostly on
surface diffusivity.
Coarsening of the nanoporous structure clearly has a direct impact in the potential
applications of materials such as NPG. The reduction of the surface area in time is not a
desirable property for applications like catalysis and electrocatalysis; nevertheless,
coarsening could be beneficial in applications where the feature size of NPG needs to be
adjusted for particular purposes. Some of the most common strategies that have been
tested/implemented to produce NPG with smaller ligaments (i.e., minimization of coarsening
in solution or ex-situ) are briefly discussed in the next two sections.
25
1.2.2.2 Reduction of coarsening in NPG
Among the different alternatives that have been evaluated, the selection/control of
some of the dealloying parameters, such as temperature and the nature of the electrolyte,
have been found useful. Qian and Chen [86] demonstrated that ultrafine nanoporous gold,
with pore size of about 5 nm (typically the pore sizes could be between 15 – 20 nm), can be
produced by reducing the dealloying temperature of the HNO3 electrolyte from 25 °C to -20
°C in simple immersion procedures. By reducing the temperature, the surface self-diffusivity
of gold was decreased by approximately two orders of magnitude. Snyder et al. [87], on the
other hand, showed that by dealloying Ag-Au in neutral pH silver nitrate solution,
significantly smaller pores and ligaments were obtained if compared with those obtained in
an acidic environment (e.g., HNO3); this observation can be explained by the formation of a
silver oxide layer behind the dissolution front, which reduces the post-porosity coarsening of
the structure. Even though these two approaches are effective to minimize the immediate
coarsening of the structure, they will not prevent coarsening of the structure once the
sample is taken out from the electrolyte.
A different strategy was to deposit small amounts of ternary elements, with lower
surface diffusivity than gold (e.g., platinum), onto the surface of NPG [88-90]. By depositing
platinum on the surface of the ligaments it was observed that no platinum aggregation or
significant coarsening was found after exposure to ambient temperature for two months, or
even after annealing at high temperature conditions. The platinum overlayers typically
adopted a layer-islanding (also called Stranski-Krastanov, SK) growth mode where platinum
atoms grow epitaxially on NPG surfaces. At early stages, platinum forms a ‘wetting layer’
uniformly coating the NPG substrate; however, after a few monolayers platinum starts
forming three-dimensional islands. Moreover, compared with NPG, platinum-plated samples
exhibit a relatively smooth surface morphology, suggesting a preferential growth over
26
ligament sites with high radial curvatures. Even though this technique has proven to be
effective, it requires an extra step in the formation of stable and robust nanoporous
structures. Alternatively, the addition of a ternary element (e.g., platinum) to the Ag-Au
precursor, has emerged as a possible way forward to create stable nanostructures, in one
step process and with extraordinary characteristics.
1.2.2.2.1 Nanoporous metals formed by dealloying of ternary-noble alloys (Ag-Au-Pt)
Bengough and May [91] first reported that adding less than 0.05 wt.% of arsenic to α-
brass helped to protect it from dealloying (i.e., improving its dezincification resistance). Later
on, Newman [92] suggested that pinning of mobile copper step edges by arsenic might
explain this phenomenon. Therefore, it was thought that a similar effect should be seen if
platinum was added to Ag-Au alloys. Surface self-diffusivity of gold, at potentials near the
standard critical potentials (i.e., 0.4 V vs. standard calomel electrode – SCE – for Ag80:Au20
in H2SO4 solution) was on the order of 10-14 cm2 s-1, reaching the benchmark for dealloying;
moreover, it rises further with increasing potential [67]. In contrast, platinum does not have
surface diffusivity more than the order of 10-18 cm2 s-1 at moderate applied potentials in a
variety of electrolytes [93,94]. Therefore, platinum, which does not dissolve, is basically
immobile relative to gold blocking step edges, and slowing down the surface diffusion of
gold, with the subsequent refinement of porosity.
Snyder et al. [95] was the first one to report that adding 6 at.% of platinum to the
‘white-gold’ type of Ag-Au alloy (i.e., Au content of 35 at.%) creates a porous structure with
a smaller length scale, if compared with NPG, and with more stability towards coarsening.
Later, Jin et al. [96] reported on the mechanical properties of nanoporous Au-Pt structures,
formed from (Au1-xPtx)25Ag75 with x ranging from 0.1 to 0.5, and showed that this structures
27
had ligament sizes around 5 nm. Xu et al. [97], also obtained smaller feature sizes after
dealloying Cu-Au-Pt alloys with platinum contents between 4 and 16 at.%.
Clearly, addition of platinum to a binary precursor has practical importance towards the
development of more stable and functional nanoporous metals. This Ph.D project takes
further this idea of adding platinum to the Ag-Au alloy, and focuses on the understanding of
the role of platinum on the formation and most relevant characteristics/properties of the
resulting nanostructures. For that purpose, nanoporous structures formed by
electrochemical dealloying of Ag-Au-Pt alloys, with systematic variation of the platinum
content, and with a maximum platinum concentration of 3 at.%, were studied, as discussed
in more detail in Section 1.5.
1.2.3 Surface modifications of NPG
One of the most remarkable aspects of NPG (as shown in Figure 1.3) is the flexibility
and tunability of the structure. It has been reported, for example, that by changing the initial
composition of the Ag-Au alloy, nanoporous structures with different morphologies can be
produced; i.e., the higher the initial silver content of the precursor, the higher the porosity
that is formed [98]. By allowing NPG to coarsen in acid environment, the size of the
ligaments/pores changes [68]; moreover, post-dealloying treatment with concentrated acids
(e.g., HCl) leads to the formation of peculiar prismlike structures with nanoporosity
coarsened to 300-500 nm [99]. Thermally-induced coarsening has been also studied
showing that it can give an additional degree of freedom in terms of the tunability of NPG
[45,99-105]. As a result of the exposure of NPG to high temperature, structures with pores
and ligaments in the size regimen between a few nanometers and several micrometers can
be formed without changing the connectivity, ligament and/or pore shape; in fact, by
28
alternating annealing and dealloying, structures with a well-controlled multimodal pore size
distribution can be formed [106]. In addition, the use of casting procedures, analogous to
slip-casting of ceramics, have been used to form nanoporous structures on hollow Ag-Au
particles [107]. Moreover, the use of metals, as mentioned in the case of platinum
deposition, organic compounds, metal oxides or even enzymes, can be used to modify the
surface of NPG, expanding its use in fields like electrochemistry, catalysis and many others
[55,56,89,108-111].
As shown in the case of the ultrafine NPG formed by reducing the dealloying
temperature and/or by using a different electrolyte, the characteristics of the NPG strongly
depend on the dealloying conditions. For example, it has been reported that in free
corrosion dealloying, the size of the ligaments and the amount of residual silver highly
depend in the immersion time and on the concentration of the etchant [68,112]. The
presence of halides (i.e., KCl, KBr, KI) in the electrolyte has also been proven to have a
significant impact in the dealloying characteristics (e.g., critical potential) and nanoporous
morphology [82]. It was observed that the size scale of pores increased with the addition of
halides, with almost an order of magnitude increase thanks to the increase in surface
diffusivity of gold.
The tunability and flexibility of NPG is one of its greatest advantages, and definitely
has contributed to the fascination that the scientific community has developed for NPG.
More examples of modification of NPG can be found in the literature.
29
1.3 Beyond NPG: Other nanoporous metals
The potential applications of NPMs in various fields of science and technology, and the
interest in studying and understanding the dealloying mechanism, has provide great deal of
motivation for studying the formation and characteristics of different systems, some of which
are summarized here. The purpose of this section is just to put in perspective the
importance and flexibility that dealloying has, as a tool to form nanomaterials; therefore, and
because the focus of this work is in NPG and in the nanoporous metals formed from Ag-Au-
Pt alloys, this is not an exhaustive review of all the other alloys that have been dealloyed.
For more details about a particular system, please refer to the references herein.
Nanoporous platinum: Dealloying of platinum-based systems has been virtually
unexplored. Only a few works (if compared with the Ag-Au system) have been focused
on these alloys, mainly because platinum-based alloys are difficult to produce and, in
some cases, intermetallics may complicate the formation of nanoporous metals. For
instance, the Al-Pt system shows multiple intermetallic phases that could complicate
fundamental studies on the dealloying process; however, dissolution of α-Al from the
Al88Pt12 has been reported to result in the formation of nanoporous platinum ribbons
with bimodal channel size distribution [113-115]. Pickering and Kim [116], investigated
the dealloying of Co-Pt and Fe-Pt alloys exposed to HCl/H2 at elevated temperatures
(900–1300 K) and confirmed the presence of porosity; however, due to the elevated
temperatures required for the dealloying in this system, only macroporous platinum was
observed (likely bulk diffusion played also a role here). Dealloying Cu-Pt and Ag-Pt
alloys has been reported, showing pore sizes of between 3 and 4 nm, thanks to the low
surface diffusivity of platinum [117-119]. Nickel has also been electrochemically
dealloyed from the Ni-Pt system in NiSO4 solution showing pore sizes of about 2 nm
30
and a typical core-shell structure with approximately 30 at.% Ni retained in the core of
the structure [120]. Moreover, ternary alloys (i.e., Pt-Ru-Al), with different ratios
between platinum and ruthenium and 80 at.% aluminum, have been dealloyed in 2 M
NaOH showing ligament sizes between 5 and 7 nm and with a pore size distributed
around 4 nm [121].
Nanoporous silver: Nanoporous silver has been formed by dealloying of Al75:Ag25 and
Ag22:Zn78 alloys [113,122]. In the case of the Ag22:Zn78 alloy, dealloying in H2SO4 was
analyzed showing that the resulting nanostructure undergoes a significant coarsening,
with pore sizes that range between 38 and 112 nm, depending on the dealloying
temperature; in addition, it was determined that the surface diffusivity of silver is faster
than that in gold. Dealloying of Al75:Ag25 in HCl at room temperature also gives ligament
size between 100 and 120 nm, which is in some agreement with the results obtained
from Ag22:Zn78 alloy.
Nanoporous palladium: Dealloying of palladium-containing alloys, to fabricate
nanoporous palladium, has been recently investigated using alloys with iron, cobalt and
nickel as sacrificial element [123-125]. As implied from the dealloying theory, the reason
for using those alloying elements is because the standard electrode potentials of these
elements are much lower than that of palladium, and these elements forms single-
phase solid solutions when alloyed with palladium. In the specific case of the Co-Pd
system, which is a FCC alloy, the porosity can be easily tuned by altering the
composition of the precursor, which is one of the advantages of this system.
Nanoporous palladium has been also formed by dealloying Al-Pd alloys in alkaline
solution [113,126], and by dealloying multi-component systems (i.e., Pd30Ni50P20
ribbons), although these alloys have intermetallic and glass phases respectively [127].
31
In these multi-component systems, pore sizes between 30 – 60 nm were observed;
nevertheless, the dealloying process in these systems has not been fully understood;
however, it has been suggested that the mechanism of formation of nanoporosity is
analogous to that in the crystalline systems, such as Au-Ag alloys (i.e., as the less
noble atoms continuously dissolve into the solution, the noble atoms will be driven to
agglomerate into clusters and gradually evolve into a 3D network structure). Dealloying
of Cu-Pd has been studied using single crystals to try to understand the initial steps
during the dealloying process, as well as Cu-Au single crystals [128,129].
Nanoporous Nickel: Nanoporous nickel and nickel-copper have been formed by
dealloying manganese from the Ni-Mn and Ni-Cu-Mn alloys [130]. Nickel-manganese
and nickel-copper-manganese form single-phase solid solutions under the proper
conditions; therefore, these two systems were easily dealloyed. Ligament sizes of 10-20
nm were observed after dealloying under potential control in (NH4)2SO4 solution.
Thermal treatment of these nanoporous structures (preferably under reducing
atmosphere) increases the ligament size to approximately 300 nm.
Nanoporous copper: Nanoporous copper has been formed by dealloying of Mn-Cu with
different copper contents (Mn50:Cu50, Mn25:Cu75, Mn70:Cu30) [131,132], Incrumet (Cu,
43-51 at.% Mn and 3-5 at.% Al) [133] and Cu-Al alloys [113,134,135]. Under the
appropriate dealloying conditions and alloy preparation, Mn-Cu can be effectively
dealloyed either by free-corrosion or potentiostatically control dealloying. Ligament
sizes between 15 nm to 120 nm can be easily formed. Nanoporous copper can also be
fabricated by dealloying Cu-Al alloys in HCl, which results in the formation of ribbons
with ligament size between 100-300 nm.
32
As mentioned before, these are just few common examples of dealloying systems that
have been studied recently; more examples can be found in the open literature.
Furthermore, variations of the typical dealloying process are also reported. For example, it
has been shown that in some cases the more-noble metal is the component that is
dissolved while the less-noble one remains in the structure. A standard example is the Ni-
Cu system, in which nickel films were formed by a process involving electrodeposition of Ni-
Cu alloy followed by dealloying of copper from the alloy in the same solution (1.6 M
Ni(H2NSO3)24H2O and 0.1 M CuSO45H2O). The formation of a passive oxide film on nickel
allows the selective electrochemical etching of copper, which is thermodynamically more
stable than nickel. This approach suggests that is possible to passivate the more-active
component on an alloy to make it kinetically favorable rather than thermodynamically stable
[136].
1.4 Applications of nanoporous metals
As suggested in this review, the flexibility, cleanliness, simplicity and versatility that
dealloying, as a preparation method, offers and the large inventory of NPMs, each of them
with unique mechanical, physical, and chemical properties, suggest that these materials
could be used in a variety of important technological applications such as catalysis, fuel
cells, sensors, actuators, supercapacitors, amongst many more. NPG, for example, has
been used as a heat exchanger [137], as an actuator [138,139], in sensors [102,140,141],
as a catalyst and electrocatalyst [56,88,90,118,142-145] of different reactions and even in
fuel cell applications [54].
33
As discussed in Section 1.5, one of the main goals of this research project was to
evaluate the catalytic/electrocatalytic properties of the nanoporous metals formed from Ag-
Au-Pt alloys. Therefore, to keep this review as relevant as possible, an overview of the most
relevant discoveries of the catalytic/electrocatalytic abilities of NPMs is presented.
Applications such as sensors, actuators, etc., are not included here but can be easily found
in the open literature.
1.4.1 Catalytic abilities of NPMs
Somorjai and McCrea [146] have accurately pointed out that one of the biggest
challenges of the 21st century is to produce catalysts that provide very high selectivity for
catalyst-based chemical processes. However, the knowledge of selectivity is much poorer
than the understanding of what controls the activity or the turnover rate of the catalyst;
nonetheless, there are four main aspects of selectivity that are considered very important: 1)
the surface structure of the metal surface, 2) the selective site blocking, 3) the bifunctional
catalyst, and 4) the oxide metal interface sites. In that regard, nanoporous metal catalysts
could be indeed a step forward towards a 21st century catalyst thanks to their structure,
properties and cleanliness. They offer unique characteristics if compared with other
catalysts (e.g., supported catalysts): (i) they are bulk in nature yet nanoscale in
microstructure, which means they can be easily employed and recovered; (ii) their
preparation methodology is very simple and thus reproducible; (iii) their structural unit is
tuneable in a wide range from a few nanometers to many microns, which allows the study of
the size dependence very easily; (iv) particle agglomeration is not a real concern and (v)
they have extremely clean nanostructured surfaces, because in most cases they are
produced in concentrated acidic media (e.g. nitric acid) [143,147].
34
Catalysis by nanoscale gold has been attracting rapidly growing interest, not only
because of its relatively high activity, but also because of its high selectivity towards many
oxidation reactions. Furthermore, it has been reported that the number of papers has grown
from more or less five per year in the 1980s to approximately 700 in 2005 [148] and to more
than 1200 publications in 2013-2014 (Thompson Reuters - Web of Knowledge, 2014). This
interest in gold has increased because platinum group metals often suffer from poisoning by
strongly chemisorbed carbonaceous intermediates such as carbon monoxide, and gold has
been proven to be highly effective for CO oxidation, which of course opens promising
alternatives for many applications [90]. In fact, nowadays, the three major streams in terms
of gold catalysis are the expansion of new applications, especially to liquid-phase organic
reactions, discussion on the active states of gold, and exploration of new forms of gold
catalysts [148]. Among all the new forms of gold catalyst, NPG is definitively an interesting
candidate.
Despite the extensive research in gold as a catalyst, the catalytic nature of gold
catalysts is not fully understood yet. Zeis et al. [149] suggested that the primary reason that
bulk planar gold is not particularly active is the absence of active sites. It has been found
that the catalytic sites in gold are often crystal surface defect sites, such as step edges. At
these sites, gold atoms with lower coordination number dominate (see Figure 1.5);
therefore, dangling bonds may help with the adsorption of reactants through two main ways:
the electronic (adsorption enthalpy) and the geometric interaction (activation barrier) [150].
In reality, these two effects are hardly separated. Nørskov and co-workers were the first to
introduce the concept of d-band centre to explain the electronic effects on the interaction of
gases with metallic surfaces [151]. The d-band centre is defined as the first moment of the
density of d-states. The position of the d-band centre relative to the Fermi Level is the main
factor controlling adsorption. For example, transition metals tend to have higher d-states in
35
case of low coordination numbers (kinks, steps – Figure 1.5); therefore, these atoms interact
more strongly with adsorbates than atoms in a closed packed surfaces [152]. Additionally,
the geometry of the substrate provides specific adsorption sites, playing a crucial role for
activation of adsorbed molecules. In fact, in the case of gold, the presence of low
coordination atoms even determines whether the surface shows any catalytic activity [153].
This observation leads to the hypothesis that gold surfaces roughed artificially (e.g.,
induced by ion beams) should be more active than planar gold. If crystalline step edges are
helpful for enhancing the catalytic activity of gold, then it seems likely that forms of gold with
a significant number of step sites (e.g. nanoparticle-based gold, NPG) should be good
catalysts. Fujita and co-workers [154] recently provided a detailed study of the surface
atomic structure of NPG, showing that in the curve regions of the ligaments, the surface has
a very high density of atomic steps and kinks. Additional, other authors suggested that some
of the reasons nanosized gold is catalytically active is related to a quantum size effect, the
strain effect, and even a charge transfer effect in the case of supported nanoparticles
[155,156].
Figure 1.5 (a) The coordination of atoms depends on their location. The stability of the
atoms decreases with the coordination number (CN). (b) Percentage of atoms as a function
of the length scale. This is shown for a straight ligament as a simple example (numbers are
based on a geometric consideration). Reprinted with permission from Wittstock [157] –
Copyright 2010 A. Wittstock.
36
Gold has been used as a catalyst for a variety of reactions: low temperature CO
oxidation [46], selective oxidation of benzyl alcohol [158,159], selective oxidation of glycerol
to sodium glycerate [160], the water gas shift reaction [161], among many other reactions,
some of which were summarized elsewhere [162,163]. In most of these cases however,
gold has been used as a supported catalyst. In fact, it was believed that catalytic activity of
this noble metal only occurs when it is in the form of nanometer sized particles supported on
a suitable metal oxide support. In supported gold catalysts, many factors have been
correlated with the catalytic activity, including preparation methods of the catalyst, nature of
the support, pre-treatment conditions, the presence of water in the feed and many others
[142,147]. Among these factors, the catalyst support is usually considered crucial to
determining the catalytic activity. Therefore, “active” and “inert” supports have been
classified in accordance with the reducibility [164] or semiconducting properties of transition
metal oxides [165]. In that regard, using -Fe2O3 and TiO2, as well as CeO2, results in highly
active catalysts, whereas catalysts prepared on other oxides, such as Al2O3 and SiO2,
showed usually low or no activity [166].
NPG, on the other hand, seems to be best described as an inversely supported gold
catalyst or a bimetallic catalyst where the high catalytic activity can be accounted for by the
presence of silver residues left over from the dealloying process [148]. Iizuka et al. [167],
reported in detail the effect of silver contamination and of pre-treatments on the catalytic
activity of gold particles with diameters of 20 to 250 nm and with surface silver
concentrations of 0.2 to 40 wt%. In fact, it was observed that the catalytic activity was more
enhanced by silver contamination (more than three orders of magnitude) than by a decrease
in particle size of gold. In addition, recent experiments on CO oxidation demonstrate that
silver, even if present only in traces (< 1 at %), plays an active role [142,157]. Later on,
Moskaleva et al. [168], modeled different gold surfaces showing that the presence of silver
37
atoms can facilitate the adsorption and dissociation of molecular oxygen and with that
increase the catalytic activity towards carbon monoxide oxidation. NPG always contains
traces of silver, and although one can reduce the overall silver content of NPG to well below
1 at %, there is always a significant amount of Ag at the ligaments surfaces [169]. Fujita et
al. [154], demonstrated that surface reconstruction (i.e., {111} dynamic faceting) in NPG
samples with high concentrations of silver was significantly suppressed; whereas the
reconstruction in similar NPG samples, but with lower concentration of silver was more
pronounced. More importantly, samples with high concentrations of silver exhibits higher
catalytic activity towards CO oxidation than low silver content NPG. Therefore, it was
concluded that the presence of silver not only suppressed the surface reconstruction
dynamics in NPG, but also provided more active silver sites for dissociative O2 adsorption.
NPG has been used to catalyze a significant variety of reactions: Zielasek et al. [144]
and Xu et al. [155] reported on the abilities of NPG to oxidize carbon monoxide at
remarkable low temperatures. Xu et al. [147], showed strong evidence that the metallic gold
atoms on NPG are the intrinsic active sites at which carbon monoxide and oxygen reacts;
moreover, a kinetic study found that the reaction rate of carbon monoxide oxidation on NPG
depends significantly on the CO concentration but only slightly on the oxygen concentration,
suggesting that carbon monoxide adsorption plays a decisive role as the rate-limiting step.
Wittstock et al. [170], recently reported that NPG can catalyze selective oxidative coupling of
methanol to methyl formate with a selectivity above 97% and high turnover frequencies.
Gas-phase selective oxidation of benzyl alcohol to benzaldehyde, with 95% selectivity under
ambient reaction conditions, has also been reported by Han et al. [171]. In addition, NPG
has been used to catalyze aerobic oxidation of D-Glucose to D-gluconic acid with a 99%
selectivity [143] and the oxidation of organosilane compounds with water [172].
38
1.4.2 Electrocatalytic applications of NPMs
Electrocatalysis has been another key area of research in NPG. In view of the global
energy demands, fuel cells have gained a significant relevance. Currently, platinum remains
the more investigated noble metal catalyst and also has the best performance in fuel cells;
however, platinum suffers from poisoning by carbonaceous compounds. Therefore,
exploring the use of NPG as a potential electrocatalyst for applications like fuel cells has
become very important, especially from the point of view that NPG could play an unique role
in the preparation of novel highly efficient electrocatalysts.
Besides all the different materials used to form NPG, it was recently reported that by
dealloying white gold leaves could have remarkable advantages for the use of NPG in
applications such as fuel cells [68,106]. Electroless plating of platinum onto the NPG leaf
substrate has shown remarkable catalytic activities, showing that using platinum-plated
NPG as an electrode material for hydrogen fuel cells is feasible [173]. These Pt - NPG
leaves typically contain less than 50 g cmleaf of platinum and it can be easily integrated into
a membrane electrode assembly in H2/O2 fuel cells. It was reported that upon optimization,
the Pt - NPG nanocatalyst could generate a specific power as high as 4.5 kW g-1 of Pt,
which is close to the US Department of Energy target of 2015 for platinum utilization.
Although it is widely accepted that the highest platinum utilization can be achieved only on
monolayer (or submonolayer) type of structures, to which these NPG-based nanostructures
are close, the most important characteristic of decorated NPG is the easy accessibility to
almost all surface precious-metal atoms by target molecules. Considering the structure
flexibility of NPG and the strong synergistic effect between gold and platinum, decorated
NPG may represent an alternative ultralow precious-metal loading catalyst to traditional
ones.
39
Electro-oxidation of methanol has been also studied using NPG as a catalyst. Zhang
et al. [90] has reported that NPG has a very good catalytic activity towards methanol electro-
oxidation, particularly in alkaline solution; however, it was shown that after long-time
potential cycling the structure significantly coarsens. It is well-known that methanol oxidation
proceeds independently in two potential regions; at lower potentials, methanol is oxidized to
formate/formic acid, whereas at higher potentials, methanol is oxidized to carbonates/CO2
[174]. It has been suggested by some researchers that pre-oxidation species such as Au-
OHads(1-)- ( is the charge transfer coefficient , 0 < <1) play a governing role in the
electrochemistry of gold in alkaline media [175]. More importantly, NPG could react with the
reaction intermediates to further oxidize them, eliminating any possible catalyst poisoning.
Decorating NPG with Pt, on the other hand, offers a real possibility not only to minimize
coarsening, but also to enhance the oxidation of methanol and increase the poisoning
resistance if compared with pure platinum [90,176]. DFT (Density Function Theory)
calculations on Au-Pt catalyst have shown the possible mechanism for the reaction [177]:
the first step in this reaction is the adsorption of methanol on platinum active sites, followed
by dehydrogenation; intermediates like formaldehyde and formates are then present in the
system; COads species can be also identified as an intermediate of the process on platinum
atoms with the subsequent transfer of CO from platinum sites to neighbouring gold sites,
which is possible in view of the favourable adsorption of CO on gold; finally, reactions of Pt-
COads and Au-COads with Au-OHads are expected to happen towards the final product (i.e.
CO32-). Of course, the presence of silver might alter the reaction pathway.
Electro-oxidation of formic acid has also been studied using NPG decorated with
platinum [178]. It was observed that electrooxidation of formic acid was highly sensitive to
the catalyst surface structure; in fact, it was noticed that the least plated structure (i.e., less
platinum on the surface of NPG) exhibited unusually high activity towards FA, which could
40
be related to the nearly ideal platinum utilization. Oxidation of formaldehyde and ethanol in
acidic media was also reported by the authors, showing again that the activity of the
decorated NPG, normalized by the mass of platinum on the nanostructure, was much higher
than that of the commercial Pt/C catalyst. Wang et al. [179] successfully fabricated a
sandwich-type nanostructures electrocatalyst (i.e., NPG-Pt-Au) by depositing a monolayer
of platinum onto the ligament surfaces of NPG by in situ redox replacement of PtCl42- with a
monolayer of Cu deposited by UPD, then, an adequate amount of gold was deposited onto
the platinum overlayer using the same method. It was observed that a greatly enhanced
catalytic activity was achieved by changing the reaction pathway by using gold surface
clusters, which at the same time contributed to the stabilization of the catalyst.
Besides NPG, other nanoporous metals have been used as catalysts for different
electrochemical reactions. Nanoporous Pt-Ru and Au-Pt structures were tested for methanol
and formic acid oxidation, showing remarkable activities (per mass of platinum or per true
area of the electrocatalyst - determined by CO-stripping charge) even higher than the
commercial PtRu/C catalyst (same as before) [97,121]. It was believed that this
enhancement could be due to the nanoscale bicontinuous porous structure that allows good
mass transport and electron conductivity, besides the fact that alloying ruthenium/gold with
platinum effectively modifies the electronic structure of platinum, enhancing the catalytic
activities under appropriate conditions facilitating the removal of species such as carbon
monoxide. Shao et al. [180] reported on the synthesis of a core-shell catalyst consisting of a
platinum monolayer as the shell and porous/hollow Pd-Cu alloy nanoparticles as the core
(these porous nanoparticles were fabricated by electrochemical dealloying of copper via
cyclic voltammetry in 0.1 M HClO4). The catalytic ability of these platinum decorated-
nanoparticles was evaluated towards the oxygen reduction reaction (ORR), showing a
significant enhancement in the activity, which can be explained by the lower oxygen binding
41
energy to the surface. Snyder et al. [120] also showed that a catalytic enhancement towards
ORR can be achieved by using a composite nanoporous Ni-Pt alloy (obtained by
electrochemically dealloying nickel from the Ni-Pt structure in NiSO4 solution) impregnated
with a hydrophobic, high-oxygen-solubility, protic ion liquid. Liu and coworkers [181-183]
reported on the fabrication of nanoporous Pt-Co, Pt-Ni and Pt-based multimetallic alloy
nanowires through the combination of electrodeposition into AAO templates with dealloying.
It was shown that these nanowires exhibit distinctly enhanced electrocatalytic activities
(normalized by the effective area of platinum) towards methanol oxidation as compared with
current state-of-the-art Pt/C and PtCo/C catalyst (also normalized by the effective area of
platinum in the catalyst).
1.5 Thesis scope
The overall objective of this research was to investigate the formation, and principal
characteristics of nanoporous metals formed by electrochemical dealloying of ternary-noble
alloys (i.e., Ag-Au-Pt). More importantly, we aimed to unveil the effect that the ternary
element (i.e., platinum) has on the resulting nanoporous structures, which is the reason why
alloys with a systematic variation in the platinum content (i.e., 1, 2 and 3 at.%) were
evaluated. As shown in section 1.3.2.2.1, previous studies have proven that having platinum
in the dealloying precursor is beneficial to: a) reduce the feature size of the structure, b)
increase the resistance to coarsening and c) increase the catalytic performance of the
resulting structure; however, the field lacked a fundamental study regarding the real effect of
platinum on the main characteristics and properties of the resulting nanostructures. In this
project, all alloys had 77 at.% silver and 23 at.% of more-noble metals, and the nanoporous
structure formed from the binary alloy (Ag-Au) was used as a benchmark nanostructure,
which is a nanostructure that has a more open and compliant structure than other alloys
42
with higher gold content. This study included an in-depth characterization of the resulting
nanostructures, using electrochemical and surface sensitive techniques; moreover, the
effect of different dealloying conditions and experimental protocols were carefully evaluated,
allowing us to create a general understanding of the effect of having a more-noble ternary
element in the precursor material. In addition, an assessment of the catalytic abilities of the
resulting nanostructures towards technologically important electrochemical reactions (e.g.,
methanol and ethanol oxidation) was included.
In summary, our general motivation to pursue this research was to give the field a
better understanding of the role of ternary elements, platinum in this case, in the formation
and characteristics (e.g., ligament size, composition, morphology) of nanoporous metals,
which undoubtedly will have a tremendous impact in science and technology.
1.6 Thesis objectives
Within the thesis scope, the specific objectives of this research were to:
1. Determine the most appropriate experimental conditions to electrochemically dealloying
Ag-Au-Pt alloys in perchloric acid (HClO4) to form clean and well-defined nanoporous
metals.
2. Investigate the effect of platinum, as a ternary element in the Ag-Au-Pt alloys, in the
formation, characteristics and resistance to electrochemical coarsening of the resulting
nanoporous metals. This evaluation was done on the following metrics:
morphology of the nanoporous metals,
ligament and pore sizes of the nanoporous structure,
43
developed surface area as a function of the platinum content on the precursors,
thickness and shrinkage of the dealloyed layer,
silver content that has been retained in the dealloyed layer,
platinum coverage of the surface of the ligaments.
3. Examine the effect of the dealloying temperature, charge density passed and dealloying
potential on the following metrics for each alloy:
resistance to electrochemical coarsening (i.e., ligament size),
true surface area of the resulting structures,
thickness of the dealloyed layer,
amount of retained silver in the dealloyed layer,
concentration of platinum on the surface of the ligaments.
4. Investigate the stability (i.e., resistance to coarsening) of the different nanoporous
structures under more aggressive conditions. Specifically, exposure of the freshly
dealloyed samples to high temperatures and after immersion for extended periods of time
in solution (e.g., dealloying electrolyte). This evaluation was done on the following
metrics:
ligament/pore size of the different nanostructures,
composition of the dealloyed layer,
concentration of platinum on the surface of the ligaments.
44
5. Evaluate the electrocatalytic abilities of all the nanoporous metals, with and without
platinum, towards methanol and ethanol electro-oxidation, in acidic and alkaline
electrolytes, considering the following aspects:
evaluation of the catalytic response of the different nanostructures after dealloying
under different conditions (e.g., temperature, charge density),
investigate the effect of parameters such as the supporting electrolyte
concentration, scan rate, etc., in the catalytic response of these structures,
identify the reaction products for at least the experiments run in alkaline electrolyte
(i.e., amount of carbonate formed).
1.7 Thesis layout
This thesis presents the results, analyses, and conclusions obtained throughout the
course of this research in the form of four manuscripts. Each manuscript constitutes one of
the following four chapters and contributes to meeting one (or more) of the thesis objectives.
The following is a detailed description of how each of the abovementioned objectives has
been met with respect to their presentation in the chapters and/or appendices.
Chapter 2 contributes to meeting Objectives 1, 2 and 3. This manuscript reported a
detailed study on the formation of nanoporous metals from Ag-Au and Ag-Au-Pt alloys in
acidic media (i.e., perchloric acid). The presence of platinum limited the ability of gold to
diffuse on the surface, reducing the ligament size of the structure and increasing its stability
and resistance to coarsening. Aspects such as the ligament and pore size, pore size
distribution, thickness of the dealloyed material, resulting surface area and composition
across the dealloyed layer were reported for all the different nanostructures after
45
characterization by SEM, TEM, X-ray photoelectron spectroscopy (XPS), Brunauer-Emmett-
Teller (BET) surface area, and electrochemical methods such as cyclic voltammetry.
Furthermore, the effect of adjusting dealloying parameters such as the temperature, charge
density and dealloying potential on the characteristics of the resulting structures was also
reported.
Chapter 3 contributes to meeting Objective 4. As a result of the experimental work
done to evaluate the stability of the different structures at high temperatures, it was
observed that under specific conditions (i.e., moderate temperature in the presence of
laboratory air), platinum was induced to segregate to the surface of the ligaments due to its
preferential interaction with oxygen. Moreover, it was found that the co-segregation of
platinum and oxygen hinders the thermal coarsening of the ligaments. A detailed evaluation
of the ligament size, composition of the surface of the ligaments, and roughness factor was
done by SEM, TEM, XPS, low energy ion scattering (LEIS), in addition to electrochemical
methods such as underpotential deposition (UPD) of hydrogen and cyclic voltammetry. This
adsorbate-induce surface segregation phenomenon, to the best of our knowledge, was not
reported in prior studies for nanoporous metals.
Chapter 4 contributes to meeting Objective 5. In this chapter, the electrocatalytic
abilities of these novel nanoporous metals were assessed towards methanol electro-
oxidation in acidic and alkaline electrolytes. In the case of the electrocatalytic experiments
ran in alkaline electrolyte, it was found that the selectivity of the reaction changes with the
platinum content of the precursor – the concentration of carbonate increases with the
platinum content of the precursor, while formate is favored by the nanostructure with the
lowest platinum content. Moreover, it was determined that the most active nanostructure in
alkaline electrolyte was the nanostructure formed on the alloy with 1 at.% Pt; whereas in
acidic media the one formed on the alloy with 3 at.% Pt was the most active one. Aspects
46
such as the influence of the dealloying temperature and charge density passed in the
electrocatalytic response of these materials, as well as the effect of inducing segregation of
platinum to the surface of the ligaments were assessed. The influence of methanol
concentration, scan rate, supporting electrolyte concentration was also examined.
Chapter 5 also contributes to meeting Objective 5. This chapter reports on the
catalytic abilities of ternary-noble nanostructures towards ethanol electro-oxidation in
alkaline electrolyte. Similar to the case of methanol electro-oxidation, evaluation of the
amount of carbonate produced during the reaction was carried out, showing that ternary
nanostructures had a spectacular activity to cleave the C-C bond and produce carbonate as
the dominant product of the reaction. In NPG, no significant amount of carbonate was
detected. Evaluation of the stability of the nanostructure after running the reaction for long
periods of time was performed by SEM of the nanoporous layer.
In Appendix A, supplementary data that, in most cases, was implicit within the
manuscripts is presented. This collection of data includes dealloying/electrochemical data
(e.g., impedance measurements, anodic current vs. time for specific dealloying conditions),
characterization data like the voltammograms in the double layer region of the nanoporous
structure used to determine the resulting area after dealloying, BET adsorption/desorption
isotherms, under-potential-deposition (UPD) of hydrogen, various SEM images, etc.
Additionally, data related to the surface characterization techniques such as the depth
profile analysis obtained by applying the Maximum Entropy algorithm, XPS data, etc. are
also included.
Appendix B provides preliminary results in terms of the simulation of these
nanoporous metals by a modified simulation code called MESOSIM, which is based on a
Kinetic Monte Carlo (KMC) algorithm. This effort was initiated from the beginning of this
47
research; however, discrepancies between the experimental data and the model were not
possible to solve; nevertheless, we believe this work can be carried on by future
researchers.
Finally, Appendix C includes the complete list of contributions (publications and
presentations) done during the course of this research.
1.8 Reproducibility of experiments
Most of the experimental evaluations carried out in this research were done in
triplicate. For most of the dealloying conditions explored in this research, three different
samples were dealloyed under identical conditions to assess the variability of the anodic
current density, impedance measurements, developed surface area, etc. In terms of the
ligament/pore size, at least fifteen measurements of the feature size from different SEM
images of the same sample were done. This strategy was chosen as the best way forward
after confirming that the variability within a sample was similar to the variability between
samples. The same was true for the compositional analysis (by EDS or EPMA) of the as-
dealloyed material and of the as-received material; in some specific cases, three different
samples were evaluated, but in other cases analyses at different points along the material
surface were carried out. For the determination of platinum on the surface of the ligaments,
under-potential-deposition of hydrogen was run in three different samples prepared under
exactly the same conditions. With respect to the catalytic evaluation of the nanoporous
structures, triplicate runs were done for most of the cyclic voltammetry and potentiostatic
evaluations. The amount of carbonate produced during catalytic oxidations was at least run
in duplicate; however, in the case of methanol oxidation, triplicate samples were tested and
evaluated.
48
In the case of potentiodynamic curves, nuclear magnetic resonance tests, BET
surface area and pore size distribution, LEIS and XPS evaluations, duplicate runs were
done in most of the cases to confirm the trend/result without calculating any standard
deviation or confidence interval.
Throughout this work, all error bars represent the confidence interval (95% CI), as
defined by Cummings et al. [184].
1.9 References
1. X. S. Zhao. (2006). Novel porous materials for emerging applications, J. Mater.
Chem., 16, 623.
2. M. E. Davis. (2002). Ordered porous materials for emerging applications, Nature, 417,
813.
3. D. C. Dunand. (2004). Processing of titanium foams, Adv. Eng. Mater., 6, 369.
4. A. Montillet, J. Comiti and J. Legrand. (1993). Applications of metallic foams in
electrochemical reactors of filter-press type. Part I: Flow characterization, J. Appl.
Electrochem., 23, 1045.
5. K. M. Kulinowski, P. Jiang, H. Vaswani and V. L. Colvin. (2000). Porous metals from
colloidal templates, Adv.Mater., 12, 833.
6. S. M. Banhart. (2001). Manufacture, characterization and application of cellular metals
and metals foams, Prog. Mater Sci., 46, 559.
7. H. Gleiter. (1989). Nanocrystalline materials, Prog. Mater Sci., 33, 223.
49
8. H.-C. Shin and M. Liu. (2004). Copper foam structures with highly porous
nanostructured walls, Chem. Mater., 16, 5460.
9. T. Hyeon, J. Lee and S. Han. (2004). Synthesis of new nanoporous carbon materials
using nanostructured silica materials as templates, J. Mater. Chem., 14, 478.
10. C. N. R. Rao, G. Gundiah, F. L. Deepak, A. Govindaraj and A. K. Cheetham. (2004).
Carbon-assisted synthesis of inorganic nanowires, J. Mater. Chem., 14, 440.
11. U. Heiz and E. L. Bullock. (2004). Fundamental aspects of catalysis on supported
metal clusters, J. Mater. Chem., 14, 564.
12. J. Erlebacher and R. Seshadri. (2009). Hard materials with tunable porosity, MRS
Bull., 34, 561.
13. H. J. Shin, R. Ryoo, Z. Liu and O. Terasaki. (2001). Template synthesis of
asymmetrically mesostructured platinum networks, J. Am. Chem. Soc., 123, 1246.
14. Y. Yamauchi, N. Suzuki, L. Radhakrishnan and L. Wang. (2009). Breakthrough and
future: nanoscale controls of compositions, morphologies, and mesochannel
179. R. Y. Wang, C. Wang, W. B. Cai and Y. Ding. (2010). Ultralow-platinum-loading high-
performance nanoporous electrocatalysts with nanoengineered surface structures,
Adv. Mater., 22, 1845.
180. M. H. Shao, K. Shoemaker, A. Peles, K. Kaneko and L. Protsailo. (2010). Pt mono
layer on porous Pd-Cu alloys as oxygen reduction electrocatalysts, J. Am. Chem.
Soc., 132, 9253.
181. L. Liu, E. Pippel, R. Scholz and U. Gosele. (2010). Nanoporous Pt-Co alloy nanowires:
Fabrication, characterization, and electrocatalytic properties, Nano Lett., 9, 4352.
182. L. F. Liu, Z. P. Huang, D. A. Wang, R. Scholz and E. Pippel. (2011). The fabrication of
nanoporous Pt-based multimetallic alloy nanowires and their improved
electrochemical durability, Nanotechnology, 22.
183. L. F. Liu, R. Scholz, E. Pippel and U. Gosele. (2010). Microstructure, electrocatalytic
and sensing properties of nanoporous Pt46Ni54 alloy nanowires fabricated by mild
dealloying, J. Mater. Chem., 20, 5621.
184. G. Cumming, F. Fidler and D. L. Vaux. (2007). Error bars in experimental biology, J.
Cell. Biol., 177, 7.
1 A version of this chapter has been published.
Vega, A. A., and Newman, R. C. Nanoporous metals fabricated through electrochemical dealloying of Ag-Au-Pt with systematic variation of Au:Pt ratio, Journal of the Electrochemical Society 2014, 161(1), C1.
69
Chapter 2. Nanoporous Metals Fabricated through Electrochemical
Dealloying of Ag-Au-Pt Alloys with Systematic Variation of
Au:Pt Ratio1
2.1 Introduction
The development of new and more robust materials for applications in chemical
processes, sustainable energy, remediation of the environment and many other fields is one
of the biggest challenges in the 21st century. Porous materials, such as zeolites or aerogels,
offer versatile properties and characteristics (e.g., pore sizes and morphology) that have
been found very useful in a variety of fields [1-2]. Porous metals, another important
subgroup of porous materials, have gained a lot of interest due to their high electrical
conductivity, mechanical properties and broad application spectrum [3-8]. Particularly,
porous precious metals, with pore size distribution below 10 nm, are useful in
electrocatalysis, catalysis, sensing and other applications.
A common strategy to make nanoporous metals is using template growth methods, in
which the metals are plated into the interstices of a porous phase that is later removed [9].
However, these techniques are generally difficult to implement and are time consuming. An
alternative method – dealloying – has proven to be a very effective technique to produce
nanoporous metals. In the dealloying process, one starts with a monolithic alloy in any form
(e.g., bulk or thin film) and selectively dissolves one or more less-noble elements from the
alloy, forming high surface area materials with an interconnected ligament/pore structure
[10-13].
70
Amongst the different nanoporous metals, nanoporous Au (NPG), typically formed by
dealloying of Ag-Au alloys, has been extensively investigated because the starting alloys
display single-phase solid solubility across the entire range of compositions, and produce a
beautiful structure with open porosity [11,12,14,15]. Furthermore, research in NPG has been
motivated by the prospect of applying this material as a heat exchanger [16], actuator
[17,18], sensor [19,20], catalyst [21-25] and electrocatalyst [26-28] that can be used in
applications such as fuel cells [29]. Unfortunately, NPG suffers from a major limitation:
coarsening of the porosity by surface self-diffusion of Au. This coarsening can be a limiting
factor for long term functionality in some applications such as catalysis [28]. Recently,
however it has been reported that adding a third species (i.e., Pt) to the Ag-Au precursor is
beneficial in keeping the structural integrity of the nanoporous layer (i.e., reducing the
coarsening effect) [30]. Pt, which does not dissolve, is immobile relative to Au and blocks
step edges, creating a porous structure with a smaller length scale. Furthermore, it has
been reported that the presence of Pt induces distinctive catalytic properties in the NPG
[31].
The main objective of the present study is to understand and characterize the effect of
Pt on the nanoporous structure. For that purpose, a comparison between the nanoporous
structure formed from binary (Ag-Au) and ternary (Ag-Au-Pt) precursors, with a systematic
variation in Pt content, is made. The main aspects examined are the quantitative
morphology of the nanoporous structure, its composition, and the amount of exposed Pt on
the ligament surfaces, as revealed by underpotential deposition (UPD) of hydrogen. The
effect of dealloying potential, temperature, and charge density on the characteristics of the
resulting nanostructure are examined.
71
2.2 Experimental procedures
2.2.1 Materials and dealloying procedures
Ag-Au alloy with 23 at.% Au was obtained as cold-rolled 200 µm sheet from
Goodfellow Metals, Cambridge, UK. Ag-Au-Pt alloys with nominal Pt contents of 1, 2 and 4
at.% and 77 at.% Ag were obtained as cold-rolled 200 µm sheet from Ames National
Laboratory - US Department of Energy, Iowa, USA. For all experiments, specimens of
approximately 4 mm by 10 mm were cut before annealing at 975 °C for 15 h in the case of
the ternary alloys and at 900 °C for 5 h in the case of the binary alloy. In all cases, the
annealing was performed in H2-Ar atmosphere (2.5 % H2; balance Ar). All the specimens
were used in the as-annealed condition without any further surface preparation. Each strip
of alloy was attached to a copper wire for electrical connection, using lacquer (SPI
Miccroshield) to mask the junction. In all cases, dealloying was done from both sides of the
sample.
Anodic current-potential (polarization) curves and the dealloying itself were
performed in 0.77 M HClO4 solution prepared from Analar grade HClO4 (Alfa-Aesar, 62%).
All solutions were prepared with 18 MΩ∙cm de-ionized water and de-aerated by high-purity
nitrogen purging (min. purity: 99.998%). The electrochemistry was performed using a Gamry
Reference 600TM potentiostat, using an electrochemical cell with a volume of approximately
500 mL; a Pt wire was used as a counter electrode (CE) and mercury/mercury sulfate (MSE,
640 mV vs. SHE) was used as a reference electrode. The reference electrode was housed
in a separate compartment and connected to the electrochemical cell via a Luggin probe.
Most of the specimens were dealloyed at 25 °C, passing an anodic charge density of 5 C
cm-2 at 550 mV vs. MSE.
72
The effects of the dealloying temperature, charge density, and dealloying potential
on the characteristics of the dealloyed layer were systematically studied for all alloys. For
the temperature-controlled experiments, the electrochemical cell was built with a water
jacket to help stabilize the temperature of the electrolyte; a temperature range of 10 – 60 °C
was evaluated. The effect of charge density was analyzed by varying charges from 2.5 to 40
C cm-2 during dealloying at room temperature. Two different dealloying potentials (500 and
550 mV vs. MSE) were selected to study the effect of the applied overpotential on the main
characteristics of the nanoporous structure.
2.2.2 Material characterization
The compositions of the binary and ternary alloys were verified by an electron probe
spectrometers (WDS) and operated at 20 kV and 30 nA. Calibration with proper standards
(i.e., Ag80Au20 alloy and elemental Pt) was done prior to any measurement. Probe for EPMA
software (Probe Software Inc.) was used for data analysis. For the microstructural
characterization (e.g., ligament size), dealloyed samples from all alloys were manually
broken under tension in air and the fracture surface was photographed using a scanning
electron microscope (SEM – Hitachi S-5200) with an accelerating voltage of 20 kV. The
SEM pictures were later analyzed with the Image Tool software (provided by The University
of Texas Health Science Centre in San Antonio, USA) to accurately determine the ligament
size (here equivalent to the average width perpendicular to the ligament edge). Cross-
sectional metallographic specimens were prepared for the determination of the dealloyed
layer (DL) thickness and its shrinkage. In all cases, specimens were polished to 0.05 µm
using alumina powder. The cross sectional view of those specimens was photographed
73
using an Olympus PME3 Optical Microscope and the DL thickness was measured using
Clemex Vision Professional software. For the shrinkage of the layer, a section of selected
samples was masked with lacquer (MiccroshieldTM) prior to dealloying; a comparison
between the thickness of the dealloyed and non-dealloyed sections was carried out to
determine the shrinkage of the DL. The relative shrinkage was calculated with respect to the
theoretical thickness of the DL.
X-ray diffraction (XRD) was done on selected samples before and after dealloying.
All the samples were run on a Bruker AXS D8 Discovery Microdiffraction system with a Cu
K point-focus X-ray source operating at 40 kV/40 mA. The system is equipped with a
curved primary graphite monochromator and 2D proportional detector (GADDS). The
experimental data were collected in three frames, each of 400 – 480 s exposure, that cover
the range of 25 ° - 92° (2-theta). The 2D diffraction images were then integrated with the
step size of 0.005° 2-theta and converted to standard I vs. 2-theta diffraction patterns. The
phase identification was done by Diffrac PlusTM data processing software EvaTM v. 8.0 and
Search/MatchTM routine. The profile fitting applications (e.g., Rietveld refinement) were
performed using TopasTM v. 3.0.
The composition of the DL was determined by several methods. Using the
metallographic specimens, the average chemical composition was characterized on the
SEM (JEOL JSM6610-Lv) complemented by an Oxford INCA X-sight energy dispersive X-
ray spectrometer (EDS). An accelerating voltage of 25 kV was used in all cases. The
composition profile across the layer was determined on a transmission electron microscope
(TEM – Hitachi HD-2000) complemented by an Oxford INCA X-sight EDS. For that purpose,
selected samples were embedded in low viscosity resin (SPI-PON 812) and
ultramicrotomed to 30 – 50 nm thickness using the Leica UltraCut R instrument equipped
with a diamond knife. An accelerating voltage of 200 kV was used. Additionally, the surface
74
composition of the dealloyed layer was analyzed using an X-ray photoelectron spectrometer
(XPS – Thermo Scientific K-Alpha) with monochromatized Al K X-ray as excitation source.
AdvantageTM software was used for the elemental quantification.
The true surface area of the electrodes was determined by means of voltammetric
profiles in the double layer region of potentials at different scan rates [32,33]. After the
samples were dealloyed, they were taken from the solution and rinsed with de-ionized
water; CV was then performed in the potential range from -240 to 50 mV vs. MSE in 1 M
HClO4 solution. Scan rates of 20, 50, 100, 200, 300 and 500 mV s-1 were used. In all cases,
28 µF cm-2 was used as the baseline double-layer capacitance for polycrystalline flat metal
surfaces [32]. The surface area was normalized by dividing the true area of the electrode by
the mass of the DL, estimated from the amount of charge passed – Ag removed – and the
thickness of the layer, to account for the real increase in surface area after dealloying.
Brunauer-Emmet-Teller (BET) surface area and pore size distribution was carried out using
the Autosorb-1 Analyzer (Quantachrome Instruments). Nitrogen adsorption/desorption
isotherms were obtained at 77 K after degassing at 100 °C for at least 3 h. For the pore size
distribution calculation, the non-local density functional theory (NLDFT) method/kernel was
used considering the adsorption branch model [34,35]. The BET surface area was also
normalized by the mass of DL.
In order to determine the fraction of Pt on the surface of the nanoporous structure,
UPD of hydrogen was used [36-40]. Immediately after the specimen was dealloyed and
rinsed with de-ionized water, it was immersed in 1 M H2SO4 de-aerated solution (EMD, 95-
98%) in a three-electrode cell with an MSE reference electrode, a Pt wire as a CE and the
dealloyed specimen as a working electrode. CV was also run using a Gamry Reference
600TM potentiostat. The CV curves were obtained at 25 °C between -630 and 0 mV vs. MSE,
at a scan rate of 20 mV s-1. The fraction of the surface with Pt atoms was calculated by
75
integrating the hydrogen adsorption/desorption regions to obtain the charge related with the
formation of a hydrogen monolayer, assuming that the charge associated with the
monolayer formation in polycrystalline Pt was 210 µC cm-2 [39,41].
2.3 Results and discussion
Prior to any electrochemical test, the composition of all the alloys was verified by
EPMA. As shown in Table 2.1, the composition of the binary alloy was in excellent
agreement with the nominal composition; the ternary alloys, on the other hand, showed
smaller Pt contents. All the alloys hereafter are identified by the experimentally determined
composition.
2.3.1 Electrochemical measurement of dealloying behavior
Figure 2.1 shows anodic current-potential curves (polarization curves) for the ternary
alloys and for the binary alloy in 0.77 M HClO4 at 25 °C. As observed in the figure, the
presence of Pt did not influence the ‘empirical’ critical potential (Ecrit) of the alloys; i.e., at the
specific scan rate used for this work, the Ecrit was the same for all the alloys, lying in the
range of 280 – 340 mV. Conventionally, it has been predicted that the Ecrit results from a
balance between the rate of dissolution of the less-noble element and surface diffusion of
the more-noble element [42]; therefore, it was hypothesized that adding Pt to the precursor
would lower the Ecrit. However, it was recently proposed that Ecrit should depend mostly on
the rate limiting step in the dissolution process, which has been identified as the nucleation
of terrace vacancies [30]. Following this, it was predicted that alloys with the same Ag
concentration should have virtually the same Ecrit, which is what was observed. In Figure 2.1
76
the high anodic current densities on the right-hand side of the figure correspond to the
formation of interconnected nanoporosity by dealloying of Ag (Figure 2.2).
Table 2.1 Real compositions of Ag-Au and Ag-Au-Pt alloys. The numbers in brackets represent the 95% confidence interval (CI) calculated from at least seven measurements randomly chosen along the alloys.
Figure 2.1 Results of negative to positive potential scan on Ag-Au and Ag-Au-Pt alloys, recorded at a scan rate of 0.5 mV s-1 at 25 °C. The absolute value of the current density is plotted in this figure: current densities below ~ -0.3 V are cathodic; everything else is anodic.
77
Figure 2.2 Interconnected ligament/pore structure of the Ag77:Au23 after passing 5 C cm-2 at 25 °C and 550 mV vs. MSE.
2.3.2 Formation and characterization of nanoporous metals
The porosity evolution in nanoporous metals, as originally described by Forty and
others [15,43,44], is the result of the selective dissolution of the less-noble element (i.e., Ag
in the case of the Ag-Au alloys) and the surface diffusion of the more-noble element (e.g.,
Au atoms) at the alloy/electrolyte interface. Consequently, by controlling these two
processes, a tunable nanoporosity can be obtained. Moreover, the presence of Pt in ternary
alloys, slows down the surface diffusion of Au and with that reduces the ligament/pore size
of the resulting structure. Figure 2.3 shows the nanoporous structures formed on the binary
and ternary alloys. In all cases, the dealloying potential was kept constant at 550 mV vs.
MSE. At this potential, rapid dissolution of Ag was permitted while Au oxide formation was
avoided. The oxidation of Au during dealloying would limit its surface diffusion kinetics,
hindering the initial ligament coarsening (i.e., postporosity coarsening) that establishes the
morphology and allows the second stage of Ag elimination. Senior and Newman [45]
reported that a large cathodic peak at ~520 mV vs. MSE was found when potential
backscans were carried out from the dealloying potential (i.e., ~700 mV vs. MSE) on
78
Ag77:Au23, associating the location of this peak with that reported for reversible monolayer
oxidation of pure polycrystalline Au to AuOH. At higher applied potentials (~800 mV vs.
MSE) a monolayer of Au2O3 started to form [46,47]. Therefore, to confirm that at 550 mV
neither hydroxide nor oxide were formed, backscans were also carried out from the
dealloying potential on the ternary alloys and on Ag77:Au23 (figures not shown here). As
expected, no cathodic peak was found using this sequence.
As demonstrated in Figure 2.3, the ligament size decreased with increasing Pt
content in the precursor material (see Table 2.2). In the case of NPG, the average ligament
size was ca. 14 nm whereas for the alloys with 1, 2 and 3 at.% Pt the ligament size was ca.
6.8, 6 and 4.3 nm respectively. The pore size distribution, on the other hand, showed
additional features, as shown in Figure 2.4. NPG had a much wider pore size distribution
than the ternary alloys, with a mean pore size of 17 nm. With the presence of Pt, the pore
size was significantly reduced (e.g., the alloy with 1 at. % Pt had a mean pore size of ca. 11
nm). As Pt has a much lower surface diffusion rate than Au, during dealloying the Pt
embedded in exposed terraces should segregate to the edges of the growing Au-rich
islands and stabilize them, ultimately reducing the length scale of porosity. [30] All
nanoporous structures were also observed by TEM (Figure 2.5 for NPG and the ternary
alloy with 1 at.% Pt) showing that the pore sizes (light regions) were ca. 18 and 8 nm for the
binary and ternary alloys respectively, in agreement with the BET analysis.
79
Figure 2.3 SEM images of freshly-formed nanoporous structures at 550 mV vs. MSE and 25 °C: (a) Ag77:Au23, (b) Ag77:Au22:Pt1, (c) Ag77:Au21:Pt2, (d) Ag77:Au20:Pt3. In all cases 5 C cm-2 were passed.
Table 2.2 Physical characteristics and developed surface area of different nanoporous structures. The numbers in brackets represent the 95% CI.
a,b The 95% CI was calculated from at least 30 measurements for each quantity. c The relative shrinkage of the layer was determined with respect to the theoretical thickness of the DL. d
Triplicate runs were done to calculate the 95% CI. e The BET surface area was obtained at P/Po = 0.05-0.1.
80
Figure 2.4 BET pore size distribution of freshly-formed nanoporous structures. The dealloying conditions for all alloys were the same - temperature: 25 °C, dealloying potential: 550 mV vs. MSE, charge passed: 5 C cm-2.
XRD patterns on the as-annealed and as-dealloyed samples are shown in Figure
2.6. As observed, the binary and the ternary alloy with the highest Pt content are both
polycrystalline materials with a face-centered-cubic (fcc) structure. In the case of the binary
alloy (Figure 2.6a), the as-annealed material was mainly oriented to the (220) plane,
whereas in the ternary alloy (Figure 2.6b), the precursor was mainly oriented to the (200)
plane. More importantly, for both alloys, the initial crystal face orientation was preserved
during dealloying. Additionally, there were some texture effects evident in the patterns, but
no foreign phases. The peak shifts that were observed in both alloys, but especially in the
case of the ternary alloy, are not fully understood at this point.
81
Figure 2.5 TEM images of freshly-formed nanoporous structures: (a) Ag77:Au23, (b) Ag77:Au22:Pt1. The dealloying conditions for both alloys were the same - temperature: 25 °C, potential: 550 mV vs. MSE, charge passed: 5 C cm-2.
82
Figure 2.6 XRD patterns of (a) Ag77:Au23 and (b) Ag77:Au20:Pt3 before and after dealloying. The as-annealed material in both cases is represented with a solid line, and the as-dealloyed material with a dotted line. The dealloying conditions for both alloys were the same - temperature: 25 °C, potential: 550 mV vs. MSE, charge passed: 5 C cm-2.
As observed in Table 2.2, there was not a significant difference in the thickness of
the DL in the ternary alloys; the binary alloy, on the other hand, showed a thinner layer that
could be explained based on the smaller amount of residual Ag that remained in the
ligaments. The elemental composition profiles across the DL were determined by TEM –
EDS on ultramicrotomed samples. Figure 2.7a shows an image of an ultramicrotomed
sample, in which the dealloyed layer and non-dealloyed material are clearly visible; the
insert in this figure shows more clearly the porosity of the DL. Figure 2.7b presents the Ag
compositional gradient for all alloys, showing that the ternary alloys always have a higher Ag
content than the binary alloy. Additionally, the Ag profile in the ternary alloys remained
rather constant with the different Pt concentrations. In NPG the Ag content increased from
ca. 28 at.% at the edge of the sample to around 57 at.% close to the dealloying front. For
83
the ternary alloys, on the other hand, the profile was less pronounced, increasing from ca.
47 at.% at the edge of the sample to ca. 56 at.% in the region close to the dealloying front.
This retained Ag must exist buried in the core of the ligaments, with a shell comprised of Au
and Pt. While dealloying was progressing and Ag was removed from the dealloying front,
the Ag removal from the already formed ligaments continued; however, because Pt reduces
Au mobility, the post-porosity coarsening was hindered, resulting in higher Ag contents. In
other words, the smaller Ag content in the NPG was due to exposure of buried Ag to the
electrolyte during coarsening behind the dissolution front. Consequently, the dealloyed layer
was thicker in the ternary alloys. Coincidently perhaps, the Ag content in the vicinity of the
dealloying front was close to the classical parting limit of ca. 55 at. % in NPG [48].
Associated with the thickness of the DL, the relative shrinkage of the layer is also shown in
Table 2.2. It was determined that there was no measurable difference between the
shrinkage in the different alloys; in other words, even though Pt did help in stabilizing the
structure (i.e., reducing the coarsening of the ligaments), it did not have a clear effect on the
shrinkage of the DL.
The changes in ligament size and thickness of the layer have an impact on the
developed surface area. As shown in Table 2.2, the surface area increased with Pt
concentration, with the largest increment occurring at the lowest Pt addition. The
nanoporous structure with 1 at. % Pt in the precursor had a surface area of 30.7 m2 g-1DL,
whereas NPG had a surface area of 17.3 m2 g-1DL. The structure formed from the alloy with
3 at. % Pt showed an increase of 15 % in surface area with respect to the lowest Pt content
alloy. The surface area measured by electrochemical means (i.e., CV in acidic media)
showed very good agreement with the BET surface area. Moreover, equally good
agreement was obtained with the capacitance ratio calculated from impedance
measurements before and after dealloying (results not shown here).
84
In the formation of nanoporous metals from Ag-Au-Pt alloys, the surface coverage of
Pt is another significant factor to evaluate. Hydrogen UPD, measured from CV using
standard procedures from the literature, was used to estimate the concentration of Pt on
ligament surfaces in 1 M H2SO4 (see Figure 2.8). Different scan rates were tested to confirm
that there were no significant mass transport (diffusional) limitations during the process. As
shown in Figure 2.8, the CV profiles showed obvious adsorption and desorption regions in
the potential region between -630 mV and -400 mV vs. MSE. As expected, the current
density in these regions increased with the Pt content of the precursor. By integrating the
charge associated with the hydrogen adsorption minus the contribution from the double
layer charging, Pt surface areas of approximately 1.4, 2.7 and 6.9 % of the real surface area
of the nanoporous structure (e.g., BET surface area in Table 2.2) were obtained for the
alloys with 1, 2 and 3 at. % of Pt respectively (see insert in Figure 2.8). XPS analyses in the
near-the-surface region of the ligaments yielded Pt contents similar to the ones obtained by
H-UPD analysis (see also insert in Figure 2.8).
The presence of Pt not only stabilized the structure against electrochemical
coarsening, but also conferred stability even in high-temperature environments. Treatment
of NPG at 400 °C in the presence of laboratory air for 2 h, increased the ligament size to
292 nm (immediately after dealloying the ligament size was ca. 14 nm). In similar conditions,
structures with Pt displayed much better resistance to coarsening: the alloy with 1 at. % Pt
coarsened to 33 nm whereas the ligament size of the alloy with 3 at. % Pt increased to 9
nm. Nevertheless, it was recently found that the presence of oxygen is a determinant
parameter in the thermal stability and main characteristics of nanoporous metals formed
from Ag-Au-Pt [49]. Coarsening after long periods in solution was also evaluated, showing
that the average ligament size for NPG was 30 nm after 2 months in HClO4 solution (no
85
potential applied). For ternary alloys, the ligament size increased to ca. 9, 7 and 5 nm for the
alloys with 1, 2 and 3 at. % Pt respectively.
Figure 2.7 (a) Ultramicrotomed sample; the insert shows a higher magnification of the region close to the dealloying front. (b) Residual Ag profile across the dealloyed layer of freshly-formed nanoporous structures. The Ag content was determined by TEM – EDS of ultramicrotomed samples, and 100% represents the original surface of the sample (SS); 0 % is the dealloying front (DF). Error bars represent 95% CI calculated from at least 3 different measurements across the dealloyed layer.
86
Figure 2.8 Cyclic voltammograms of the Ag-Au-Pt alloys after dealloying at 550 mV vs. MSE, 25 °C and passing a charge density of 5 C cm-2. In all cases, CV profiles were obtained in 1 M H2SO4 solution at 20 mV s-1 and 25 °C. The original Pt content is shown in the figure. The insert shows the fraction of Pt on the surface of the nanostructure, obtained by H-UPD and XPS analyzes, with respect to Pt content of the precursors. The error bars represent 95% CI calculated from triplicate runs.
2.3.3 Influence of dealloying parameters on the characteristics of the layer
In electrochemical dealloying, there are multiple parameters that affect the
nanoporosity formation and the characteristics of the resulting nanoporous structure. These
parameters include the dealloying potential, temperature and the dealloying charge density,
which includes an effect of time as well as depth. By adjusting these parameters, the
nanoporous structure is tunable in terms of the residual Ag in the nanoporous layer, the size
of the ligaments/pores, the depth of the dealloyed layer, and, consequently, the developed
surface area. Therefore, these parameters were examined through a series of controlled
experiments (see Section 2.2.1), in order to understand their influence on the characteristics
of the dealloyed layer. A detailed discussion is presented below.
87
2.3.3.1 Dealloying temperature
Simultaneously with the dissolution of the less-noble element in the alloy and the
nanoporosity formation, there is a coarsening process of the microstructure. This coarsening
is significantly obvious in NPG; in fact, Dursun et al. [50] estimated, based on theoretical
percolation considerations, that the initial pore size for Ag70Au30 dealloyed in HClO4 is ca.
1.6 nm, even though its typical final pore size is higher than 10 nm. This coarsening has
been described as a surface-diffusion dominated process at the alloy/electrolyte interface
that depends, among other parameters, in the surface diffusivity of Au and the temperature
of the electrolyte [50,51]. All this is in agreement with the literature for the relaxation of
roughened Au surfaces [52-54]. Recently, Qian and Chen [55] demonstrated that ultrafine
nanoporous Au, with a pore size of about 5 nm, can be produced by reducing the
temperature of HNO3 electrolyte from 25 to -20 °C in simple immersion exposures; it was
estimated that by this reduction in the dealloying temperature, the surface diffusivity of Au
was decreased by approximately two orders of magnitude. Conversely, by increasing the
dealloying temperature, more significant coarsening is expected.
Figure 2.9 shows SEM images for the binary alloy and the ternary alloys with ca. 1
and 3 at. % Pt, dealloyed at 10 and 60 °C. As expected, NPG exhibited significant
temperature dependence: after dealloying at 10 °C, the ligament size was ca. 12 nm,
whereas after dealloying at 60 °C, it increased to 28 nm (see also Figure 2.10a). The
presence of Pt in the ternary alloys minimized the effect that the electrolyte temperature has
on the coarsening of the nanostructure. The alloy with 1 at.% Pt in the precursor showed
only a 25 % increase in the ligament size for the same temperature range (from ca. 5.8 nm
at 10 °C to ca. 7.4 nm at 60 °C). A similar tendency was observed for the alloys with 2 and 3
at.% Pt. The thickness of the DL also changed with the dealloying temperature. In the case
of ternary alloys, it was observed that the thickness increased with temperature, whereas for
88
the binary alloy it decreased (Figure 2.10b). The changes in the depth of the layer were
associated with the residual Ag content of the layer (Figure 2.10c) in order to account for the
total charge passed. The average residual Ag content in the layer was obtained by SEM –
EDS assuming that the incident electron beam did not penetrate through the dealloyed
layer, exciting the substrate. Unfortunately, the beam penetration profile in porous materials
has not been well documented; however, the mean free path is likely to be larger than that
corresponding to a void-free metal. As shown in Figure 2.10c, the average residual Ag in the
dealloyed layer tended to increase with the dealloying temperature for the ternary alloys,
showing values between 52 and 55 at.%. It was hypothesized that this behaviour has to do
with the mobility of Pt at different temperatures: at 10 °C Pt is so immobile that it just sits
there and has to be dragged along by the step edges, whereas at 60 °C it starts to get some
limited mobility, so it more easily forms an efficient decoration of the step edges. NPG, on
the other hand, showed a decrease in the Ag content (from approximately 42 at.% at 10 °C
to 26 at.% at 60 °C), which was consistent with the observed tendency of the DL
morphology (i.e., reduction of the thickness with higher temperatures). These changes in
ligament sizes and thickness of the layer had a direct impact in the developed surface area
of the structure (Figure 2.10d). By increasing the temperature from 10 to 60 °C the surface
area of NPG decreased 60 % (from approximately 24 m2 g-1DL to 10 m2 g-1
DL). On the ternary
alloys, the surface area was always higher than in the binary alloys, although they also
showed a reduction with temperature.
By changing the dealloying conditions, not only can the ligament size be modified,
but moreover, by increasing the dealloying temperature the fraction of Pt atoms on the
surface of the ligaments increased. Figure 2.11 shows the fraction of Pt atoms on the
surface of the ligaments after dealloying at different temperatures. It is clear that by
increasing the dealloying temperature from 10 °C to 60 °C, the fractional coverage of Pt
89
atoms steadily increased for all alloys, doubling the Pt coverage at the upper temperature.
This increase in the Pt coverage on the surface could be associated with the dealloying
mechanism itself and/or other processes that were favored under these experimental
conditions (e.g., preferential adsorption of OH groups on Pt atoms).
Figure 2.9 SEM images of freshly-formed nanoporous structures: (a) Ag77:Au23 dealloyed at 10 °C; (b) Ag77:Au23 dealloyed at 60 °C; (c) Ag77:Au22:Pt1 dealloyed at 10 °C; (d) Ag77:Au22:Pt1 dealloyed at 60 °C; (e) Ag77:Au20:Pt3 dealloyed at 10 °C; (e) Ag77:Au20:Pt3 dealloyed at 60 °C. In all cases, the SEM images were taken approximately in the middle of the DL.
90
Figure 2.10 Ligament width, normalized surface area, thickness of DL and residual Ag in the
DL of freshly-formed nanoporous structures at different temperatures: (□) Ag77:Au23, (●)
from triplicate runs in the case of surface area, from at least 30 measurements in the case of the ligament size, from ca. 15 measurements for the thickness of the layer and from 4 different measurements across the dealloyed layer in the case of the Ag content. In all cases, the Ag content was measured approximately in the middle of the DL.
91
Figure 2.11 Fraction of Pt atoms on the surface of as-dealloyed structures after dealloying at different temperatures. In all cases, dealloying was carried out in 0.77 M HClO4, with a charge passed of 5 C cm-2 and a dealloying potential of 550 mV vs. MSE. The original Pt composition of the precursors is shown in the figure. Error bars represent 95% CI calculated from triplicate runs.
2.3.3.2 Dealloying potential
In electrochemical dealloying, the applied potential primarily reduces the activation
barrier required for the dissolution process of the less-noble element (i.e., energy required to
break bonds). If this potential is relatively high with respect to the ‘empirical’ critical potential,
and no oxidation of the more-noble element occurs, the rate of dissolution is significantly
faster than the diffusion rate [56], which favors the formation of porosity. If, on the contrary,
the applied potential is relatively close to the ‘empirical’ critical potential, the diffusion rate of
Au is sufficient to significantly block Ag dissolution creating an imbalance between these two
processes and making more difficult the porosity evolution. The effect of potential on Au
diffusivity in acidic electrolytes has been reported elsewhere [57].
The effect of the dealloying potential on the characteristics of the different
nanoporous structures was studied by reducing the applied potential by 50 mV with respect
92
to the benchmark potential (i.e., 550 mV). As observed in Figure 2.12, the ligament size in
NPG increased by reducing the overpotential, which was due to the longer time available for
coarsening at a lower current density and fixed charge density. The ligament width in NPG
increased from 14 nm at 550 mV to approximately 24 nm at 500 mV (see also Table 2.3).
For the ternary alloys, the SEM images (Figure 2.12c-f) showed that the the ripening
process is less significant. For instance, the ligament size for the alloy with 1 at.% Pt
increased from approximately 7 nm to 9 nm. Table 2.3 shows a comparison between all the
alloys.
Figure 2.12 SEM images of freshly-formed nanoporous structures at different dealloying potentials: (a) Ag77:Au23 at 500 mV, (b) Ag77:Au23 at 550 mV, (c) Ag77:Au22:Pt1 at 500 mV (d) Ag77:Au22:Pt1 at 550 mV, (e) Ag77:Au20:Pt3 at 500 mV, (f) Ag77:Au20:Pt3 at 550 mV. In all cases the charge density passed was 5 C cm-2. All SEM images were taken approximately in the middle of the DL.
93
With the coarsening of the structure, the resulting surface area also changed. As
shown in Table 2.3, the surface area decreased by approximately 54% in the binary alloy by
reducing the applied potential by 50 mV. By adding Pt to the precursor, the effect was
reduced (e.g., for the alloy with 3 at.% the surface area decreased only 36% by reducing the
applied potential). In the case of the ternary alloys, it was demonstrated in Table 2.3 that for
the conditions tested, the residual Ag concentration had a significant dependence upon
dealloying potential, showing higher Ag content at lower overpotentials. For the binary alloy,
on the other hand, the Ag content decreased upon reduction of the dealloying potential. In
NPG, at the same time that the structure was coarsening, Ag trapped in the core of the
ligaments was also exposed to the electrolyte, reducing the concentration of Ag in the DL.
This agrees with the fact than the DL gets thinner at lower overpotential. On the ternary
alloys, thanks to the hindering of coarsening, more Ag was trapped in the layer and,
consequently, thicker layers were observed (results not shown here).
Table 2.3 Physical characteristics, developed surface area and residual Ag of different nanoporous structures formed at different dealloying potentials. The numbers in brackets represent the 95% CI.
a The 95% CI was calculated from at least 30 measurements for each quantity. b Triplicate runs were done to calculate the 95% CI. c
The 95% CI was calculated from 4 different analyses in the dealloyed layer.
94
2.3.3.3 Dealloying charge
Even though it is recognized that the diffusion of the more-noble element(s) and the
dissolution of the less-noble ones are altered by changes in electrolyte temperature and
applied potential, the charge passed has an indirect impact in the ligament width and on the
resulting surface area. By increasing the charge density, which is directly proportional to the
amount of Ag removed from the alloy, there is more time for coarsening of the ligaments
behind the dealloying front. This was especially true in the case of NPG in which the
average ligament size after removing 2.5 C cm-2 was 12 nm, but when removing 40 C cm-2
the average ligament size increased to 21 nm (see SEM pictures in Figure 2.13a,b and
Figure 2.14a). In this particular case, the time ratio between the higher and lower charge
was approximately 25. The presence of Pt, on the other hand, suppressed the relative
coarsening of the ligaments (Figure 2.13). The average ligament size for all ternary alloys
was below 10 nm.
Figure 2.14b shows the relation between the amount of charge passed during
dealloying and the thickness of the DL. It was observed that the thickness of the layer in
ternary alloys was always thicker than in the NPG, which could be explained due to the
higher retained Ag content of the layer (Figure 2.14c). In all cases, the Ag content tended to
decrease when the dealloying charge increased, but the binary alloy had much lower Ag left
in the layer. For instance, when removing 20 C cm-2, the average retained Ag in the binary
alloys was ca. 28 at.%, while the alloy with 1 at.% Pt has approximately 45 at.% of Ag left.
SEM – EDS line scans across the dealloyed layers (results not shown here) confirmed that
the concentration gradient in the ternary alloys is not as pronounced as it is in the Ag-Au
alloy.
95
Figure 2.13 SEM images of freshly-formed nanoporous structures after passing different dealloying charges: (a) Ag77:Au23 passing 2.5 C cm-2; (b) Ag77:Au23 passing 40 C cm-2; (c) Ag77:Au22:Pt1 passing 2.5 C cm-2; (d) Ag77:Au22:Pt1 passing 40 C cm-2; (e) Ag77:Au20:Pt3 passing 2.5 C cm-2; (f) Ag77:Au20:Pt3 passing 40 C cm-2. In all cases, the SEM images were taken approximately in the middle of the DL.
The developed surface areas for all alloys, at different dealloying charges, are
shown in Figure 2.14d. Even though the thickness of the layer increased by increasing the
dealloying charge, the coarsening effect gained importance, reducing the surface area of
the nanoporous structure. The normalized surface area of NPG decreased by approximately
40% when the charge density increased from 2.5 C cm-2 to 40 C cm-2. For the alloy with 1
at.% Pt, the surface area only decreased by 19 % (from 32 m2 g-1DL when 2.5 C cm-2 were
passed to 26 m2 g-1DL when 40 C cm-2 were passed). The other two ternary alloys had
similar trends, but they displayed slightly higher surface area. Approximately 70 C cm -2 were
needed to dealloy the sample all the way through.
96
Figure 2.14 Average ligament width, normalized surface area, thickness of DL and average residual Ag in the DL of freshly-formed nanoporous structures at different dealloying
charges: (□) Ag77:Au23, (●) Ag77:Au22:Pt1, (■) Ag77:Au21:Pt2, (▲) Ag77:Au20:Pt3. In all cases,
the surface area was measured by CV in 1M HClO4 at 25 ºC. Error bars represent 95% CI calculated from triplicate runs in the case of surface area, from at least 30 measurements in the case of the ligament size, from ca. 15 measurements for the thickness of the layer and from 4 different measurements in the case of the average Ag content of the layer. In all cases, the Ag content was measured approximately in the middle of the DL.
In summary, by changing the dealloying charge, especially in the case of the Ag-Au
alloy, characteristics such as the retained Ag content and the thickness of the dealloyed
layer can be modified. For the ternary alloys however, it was found that even when large
97
charges are removed, the main characteristics of the dealloyed material (e.g., Ag content,
ligament size) remain relatively constant.
2.4 Conclusion
(a) The ‘empirical’ critical potential does not show any significant dependence on the Pt
content of the alloy.
(b) The addition of Pt to the Ag-Au precursor, thanks to the lower surface diffusivity of Pt
with respect to Au, refines the ligament size and stabilizes the nanoporous structure
against coarsening, even under experimental conditions that promote coarsening of the
structure (e.g., exposure to air at elevated temperature). By adding less than 1 at. % Pt
to the precursor, the ligament width reduces in 51% with respect to the binary
counterpart.
(c) Dealloyed layers formed from ternary alloys have higher Ag contents than those formed
from NPG. This is associated with the hindered post-porosity coarsening of the
structure thanks to the presence of low-mobility Pt. Moreover, the Ag content across the
dealloyed layer in ternary alloys shows a less pronounced gradient than in the binary
alloy.
(d) By controlling parameters like the dealloying temperature, charge density and
dealloying potential, the morphology and characteristics of the nanoporous structure
can be modified either by changing the ligament size, surface area and/or the
composition of the dealloyed layer.
98
2.5 Acknowledgements
The authors would like to acknowledge the Natural Sciences and Engineering
Research Council (NSERC) of Canada for financial support, the Centre of Nanostructure
Imaging at the University of Toronto for their help imaging the nanoporous structures, and
Ames National Laboratory - US Department of Energy for preparing most of the alloys used
in this research.
2.6 References
1. X. S. Zhao. (2006). Novel porous materials for emerging applications, J. Mater.
Chem., 16, 623.
2. M. E. Davis. (2002). Ordered porous materials for emerging applications, Nature, 417,
813.
3. D. C. Dunand. (2004). Processing of titanium foams, Adv. Eng. Mater., 6, 369.
4. A. Montillet, J. Comiti and J. Legrand. (1993). Applications of metallic foams in
electrochemical reactors of filter-press type. Part I: Flow characterization, J. Appl.
Electrochem., 23, 1045.
5. K. M. Kulinowski, P. Jiang, H. Vaswani and V. L. Colvin. (2000). Porous metals from
colloidal templates, Adv.Mater., 12, 833.
6. S. M. Banhart. (2001). Manufacture, characterization and application of cellular metals
and metals foams, Prog. Mater Sci., 46, 559.
7. H. Gleiter. (1989). Nanocrystalline materials, Prog. Mater Sci., 33, 223.
8. H.-C. Shin and M. Liu. (2004). Copper foam structures with highly porous
nanostructured walls, Chem. Mater., 16, 5460.
99
9. A. Huczko. (2000). Template-based synthesis of nanomaterials, Appl. Phys. A, 70,
365.
10. R. C. Newman, in Shreir's Corrosion, 4th ed., R. A. Cottis, M. Graham, R. Lindsay, S.
Lyon, T. Richardson, D. Scantlebury and H. Stott Editors, p. 802, Elsevier, Amsterdam
(2010).
11. J. Erlebacher and K. Sieradzki. (2003). Pattern formation during dealloying, Scr.
Mater., 49, 991.
12. A. J. Forty. (1979). Corrosion Micro-Morphology of Noble-Metal Alloys and Depletion
Gilding, Nature, 282, 597.
13. H. W. Pickering. (1983). Characteristic Features of Alloy Polarization Curves, Corros.
Sci., 23, 1107.
14. H. W. Pickering and C. Wagner. (1967). Electrolytic Dissolution of Binary Alloys
Containing a Noble Metal, J. Electrochem. Soc., 114, 698.
15. A. J. Forty and P. Durkin. (1980). A micro-morphological study of the dissolution of
silver-gold alloys in nitric-acid, Philos. Mag. A, 42, 295.
16. R. W. Ertenberg, B. Andraka and Y. Takano. (2000). Prospects of porous gold as a
low-temperature heat exchanger for liquid and solid helium, Physica B, 284, 2022.
17. J. Weissmuller, R. N. Viswanath, D. Kramer, P. Zimmer, R. Wurschum and H. Gleiter.
(2003). Charge-induced reversible strain in a metal, Science, 300, 312.
18. D. Kramer, R. N. Viswanath and J. Weissmuller. (2004). Surface-stress induced
macroscopic bending of nanoporous gold cantilevers, Nano Lett., 4, 793.
19. L. H. Qian, X. Q. Yan, T. Fujita, A. Inoue and M. W. Chen. (2007). Surface enhanced
Raman scattering of nanoporous gold: Smaller pore sizes stronger enhancements,
Appl. Phys. Lett., 90, 153120.
100
20. F. Yu, S. Ahl, A. M. Caminade, J. P. Majoral, W. Knoll and J. Erlebacher. (2006).
Simultaneous excitation of propagating and localized surface plasmon resonance in
nanoporous gold membranes, Anal. Chem., 78, 7346.
21. A. Wittstock, B. Neumann, A. Schaefer, K. Dumbuya, C. Kübel, M. M. Biener, V.
Zielasek, H.-P. Steinrück, J. M. Gottfried, J. Biener, A. Hamza and M. Baümer. (2009).
Nanoporous Au: an unsupported pure gold catalyst?, J. Phys. Chem. C, 113, 5593.
22. H. Yin, C. Zhou, C. Xu, P. Liu, X. Xu and Y. Ding. (2008). Aerobic oxidation of D-
glucose on support-free nanoporous gold, J. Phys. Chem. C, 112, 9673.
23. C. C. Jia, H. M. Yin, H. Y. Ma, R. Y. Wang, X. B. Ge, A. Q. Zhou, X. H. Xu and Y.
Ding. (2009). Enhanced photoelectrocatalytic activity of methanol oxidation on TiO2-
decorated nanoporous gold, J. Phys. Chem. C, 113, 16138.
24. V. Zielasek, B. Jurgens, C. Schulz, J. Biener, M. M. Biener, A. V. Hamza and M.
46. H. Angerstein-Kozlowska and B. E. Conway. (1987). Elementary steps of
electrochemical oxidation of single-crystal planes of Au, J. Electroanal. Chem., 228,
429.
47. D. J. Trevor, C. E. D. Chidsey and D. N. Loiacono. (1989). In situ scanning-tunneling-
microscope observation of roughening, annealing, and dissolution of gold (111) in an
electrochemical cell, Phys. Rev. Lett., 62, 929.
48. D. M. Artymowicz, J. Erlebacher and R. C. Newman. (2009). Relationship between the
parting limit for de-alloying and a particular geometric high-density site percolation
threshold, Philos. Mag., 89, 1663.
49. A. A. Vega and R. C. Newman. (2014). Benefitial effects of surface segregation of Pt
in nanoporous metals fabricated by dealloying of Ag-Au-Pt alloys, J. Electrochem.
Soc., 161, C11.
103
50. A. Dursun, D. V. Pugh and S. G. Corcoran. (2003). Dealloying of Ag-Au alloys in
halide-containing electrolytes - Affect on critical potential and pore size, J.
Electrochem. Soc., 150, B355.
51. J. Erlebacher and R. Seshadri. (2009). Hard materials with tunable porosity, MRS
Bull., 34, 561.
52. G. Andreasen, M. Nazzarro, J. Ramirez, R. C. Salvarezza and A. J. Arvia. (1996).
Kinetics of particle coarsening at gold electrode/electrolyte solution interfaces followed
by in situ scanning tunneling microscopy, J. Electrochem. Soc., 143, 466.
53. J. M. Doña and J. González-Velasco. (1993). Mechanism of surface diffusion of gold
adatoms in contact with an electrolytic solution, J. Phys. Chem., 97, 4714.
54. M. P. Garcia, M. M. Gomez, R. C. Salvarezza and A. J. Arvia. (1993). Effect of the
solution composition and the applied potential on the kinetics of roughness relaxation
at gold electrodes in slightly acid electrolytes, J. Electroanal. Chem., 347, 237.
55. L. H. Qian and M. W. Chen. (2007). Ultrafine nanoporous gold by low-temperature
dealloying and kinetics of nanopore formation, Appl. Phys. Lett., 91.
56. J. Erlebacher. (2004). An atomistic description of dealloying - Porosity evolution, the
critical potential, and rate-limiting behavior, J. Electrochem. Soc., 151, C614.
57. J. M. Doña and J. González-Velasco. (1992). The dependance of the surface diffusion
coefficients of gold atoms on the potential: its influence on reconstruction of metal
lattices, Surf. Sci., 274, 205.
2 A version of this chapter has been published.
Vega, A. A., and Newman, R. C. Beneficial effects of the surface segregation of Pt in nanoporous metals fabricated by dealloying of Ag-Au-Pt alloys, Journal of the Electrochemical Society 2014, 161(1), C11.
104
Chapter 3. Beneficial Effects of the Surface Segregation of Platinum in
Nanoporous Metals Fabricated by Dealloying of Ag-Au-Pt
Alloys2
3.1 Introduction
For our present purposes, nanoporous metals may be defined as bulk nanostructured
materials that are formed by electrochemical selective dissolution or dealloying of
homogeneous alloys. During dealloying, the less-noble element is removed from the alloy,
at the same time that the remaining element (or elements) undergoes a self-organization
process (i.e., driven by surface diffusion), forming a three dimensional bicontinuous porous
metallic network with fully interconnected channels. Among the different nanoporous metals
that can be made, nanoporous gold (NPG), typically formed by dealloying of Ag-Au alloys,
has a very distinctive structure and remarkable properties that have caught the attention of
the scientific community since experimental work on the precursor alloy, and on the
corrosion-derived nanoporous Au, was done to study the mechanism of alloy corrosion [1-
8]; however, coarsening of the porosity by surface self-diffusion of Au becomes a major
problem and a potential limiting factor for long term functionality [9-10]. In the past, it has
been shown that the presence of small amounts of ternary elements (e.g., arsenic in α-
brass) slows down the surface diffusion of copper improving the dezincification resistance of
the material [11,12]; therefore, the idea of adding a ternary element to the NPG to improve
the coarsening resistance seems reasonable. Snyder et al. [13] first reported that by adding
Pt (~6 at.%) to the ‘white-gold’ type of Ag-Au alloy (i.e., Au content of 35 at.%), the
coarsening of the nanoporous layer is significantly reduced. Pt, which does not dissolve, is
105
immobile relative to Au and blocks step edges, creating a porous structure with a smaller
length scale and higher stability. Moreover, the presence of Au and Pt on the surface of the
nanostructure may have synergistic effects that can lead to superior properties if compared
with the pure metals [14]. Recently, we have characterized Ag-Au-Pt alloys with 77 at. % Ag
and Pt contents of ca. 1, 2 and 3 at.%, with the idea of understanding better the real role of
Pt on the characteristics of the resulting nanoporous structures [15].
In nanoporous metals, as well in many other nanometre scale materials, in which the
distinction between surface and bulk regions becomes indistinct, changes in the
reaction/environment conditions can induce changes in the structure and/or composition of
the surface. Under specific conditions, it is possible that one or more of the alloy
components enriches in the surface region, and not necessary in accordance with the
behaviour of a flat alloy crystal. This (possibly modified) form of surface segregation has a
significant impact in a number of technologically important applications such as
heterogeneous catalysis. Among different metallic nanomaterials, surface segregation
studies in Au-based bimetallic/multimetallic systems have been done recently; for instance,
in Au-Pt nanoparticles it has been found that Au is thermodynamically favored to segregate
to the surface of the alloy thanks to the slightly larger size of Au, and lower surface energy
relative to Pt [16-18]. The same trend has been also observed in Au-Pt flat alloy surfaces
[19-21]. The presence of an adsorbed layer however, can induce significant changes with
respect to the underlying trends. Recently, Dhouib and Guesmi [22] reported, based on
Density Functional Theory (DFT) calculations, that Ni, Pt and Pd should segregate to the
surface of M-Au alloys in the presence of oxygen. Experimental data on such phenomena
are scarce; however, Wang et al. [23] reported that Pt can even segregate to the surface of
multimetallic Au/FePt3 nanoparticles thanks to the adsorption of oxygen and/or OH- groups.
106
In this article, we report on the thermally-activated Pt surface segregation
phenomenon seen in nanoporous structures formed from Ag-Au-Pt alloys. It is shown that
by exposing nanoporous metals to surprisingly low temperatures in the presence of
laboratory air, there is a clear tendency of Pt to segregate to the surface of the ligaments.
Some of the results included here are obtained from underpotential deposition - UPD - of
hydrogen, X-ray photoelectron spectroscopy (XPS) and low energy ions scattering (LEIS),
besides the comparison with the equivalent thermally driven process in absence of oxygen.
Our focus is the interplay of surface composition and nanoscale morphology: surface
segregation in nanoporous metals modifies the thermally induced coarsening of the
ligaments as well as their surface chemical composition.
3.2 Materials and methods
Ag-Au-Pt alloys with Pt contents of ca. 1, 2 and 3 at.% Pt and 77 at.% Ag were
obtained as cold-rolled 200 µm sheet from Ames National Laboratory - US Department of
Energy, Iowa, USA. The composition of all alloys was determined by an electron probe X-
ray microanalyzer (EPMA – CAMECA SX-50/51) equipped with 3 wavelength dispersive
spectrometers (WDS) and operated at 20 kV and 30 nA. Calibration with proper standards
(i.e., Ag80Au20 alloy, and elemental Pt) was done prior to any measurement. Probe for EPMA
software (Probe Software Inc.) was used for data analysis. Before any electrochemical
experiment, all specimens were annealed in Ar-H2 (2.5 % H2; balance Ar) at 975 °C for
approximately 15 h. All specimens were then used in the as-annealed condition without any
further surface preparation. Each sample (approximately 4 mm by 10 mm strips) was
attached to a copper wire for electrical connection, using lacquer (SPI Miccroshield) to mask
the junction. In all cases, dealloying was done from both sides of the sample.
107
The dealloying process was carried out in 0.77 M HClO4 solution prepared from
Analar grade HClO4 (Alfa-Aesar, 62%). All solutions were prepared with 18 MΩ∙cm de-
ionized water and de-aerated by high-purity nitrogen purging (min. purity: 99.998%). All
electrochemistry was performed using a Gamry Reference 600TM potentiostat, using an
electrochemical cell with a volume of approximately 500 mL; a Pt wire was used as a
counter electrode (CE) and mercury/mercury sulfate (MSE, 640 mV vs. SHE) was used as a
reference electrode. The reference electrode was housed in a separate compartment and
connected to the electrochemical cell via a Luggin probe. All of the specimens were
dealloyed at 25 °C, passing an anodic charge density of 5 C cm-2 at 550 mV vs. MSE.
Immediately after dealloying, the connecting wire of selected samples was removed
and the specimens were thoroughly rinsed with de-ionized water and dried with air before
exposed them to moderately elevated temperature (200 – 600 °C). In the majority of the
cases, samples were heated in laboratory air; however, analysis of some samples heated in
Ar-H2 mixture (2.5 % H2; balance Ar) was done to study the effect of oxygen on the surface
composition evolution of the nanoporous material.
After the exposure to temperature, each sample was reconnected to a copper wire (as
described before) to measure the true area of the specimen and the fraction of Pt atoms on
the surface by classical electrochemical methods. The true area of the electrodes was
estimated by means of voltammetric profiles in the double layer region of potentials (i.e., -
240 to 50 mV vs. MSE) at different scan rates in 1 M HClO4 solution [24,25]. In all cases, 28
µF cm-2 was considered the baseline double-layer capacitance for polycrystalline Au and Pt
[24]. This assumption proved to be valid after comparing the results with BET surface area
and impedance measurements [15]. The equivalent area of Pt on the surface of the
ligaments was estimated by UPD of hydrogen [26,27]. All specimens were immersed in 1 M
H2SO4 solution (EMD, 95-98%) in a three-electrode cell with a MSE reference electrode, a
108
Pt wire as CE and the dealloyed specimen as a working electrode. The solution was de-
aerated for approximately 15 min before the experiment. Cyclic Voltammetry (CV) curves
were obtained at 25 °C between -630 and 0 mV vs. MSE, at a scan rate of 20 mV s-1. The
equivalent area of Pt on the surface of the structure was calculated by integrating the
hydrogen adsorption/desorption regions to obtain the charge related with the formation of a
hydrogen monolayer, assuming that the charge associated with the monolayer formation in
polycrystalline Pt was 210 µC cm-2 [28,29]. The fraction of Pt on the surface of the resulting
structure was estimated by dividing the equivalent area of exposed Pt by the estimated true
area of the electrode. The roughness factor (Rf) was determined by dividing the true area of
the electrode by its geometrical area. For some specific samples, an electrochemical
reduction of any oxidized species on the surface was carried out at ~-300 mV vs. MSE in 1
M H2SO4 solution right after the heat treatment. A qualitative determination of Ag on the
surface of the ligaments was done by means of CV in 1 M NaOH solution (Alfa-Aesar, 97%)
between -200 mV and 600 mV vs. mercury/mercury oxide (Hg/HgO – 20% KOH, 100 mV
vs. SHE) at a scan rate of 50 mV s-1 [30].
For the microstructural characterization of the nanoporous layer (e.g., ligament size),
dealloyed samples from all alloys were manually broken under tension in air and the fracture
surface was photographed using a scanning electron microscope (SEM – Hitachi S-5200)
with an accelerating voltage of 20 kV. The SEM pictures were later analyzed with the Image
Tool software (provided by The University of Texas Health Science Centre in San Antonio,
USA) to accurately determine the ligament size (here equivalent to the average width
perpendicular to the ligament edge). The composition profile across the layer was
determined on a transmission electron microscope (TEM - Hitachi HD-2000) complemented
with an Oxford INCA X-sight energy dispersive X-ray spectrometer (EDS). For that purpose,
selected samples were embedded in low viscosity resin (SPI-PON 812) and microtomed to
109
30 – 50 nm thickness using the Leica UltraCut R instrument equipped with a diamond knife.
An accelerating voltage of 200 kV was used.
For some selected samples, X-ray photoelectron spectrometer (XPS – Thermo
Scientific Theta Probe) and high sensitivity low energy ion scattering (HS-LEIS – Qtac100)
were used for surface characterization. For both techniques, dealloyed/heat-treated
samples were placed in the XPS/LEIS chamber without any additional surface treatment.
For the XPS, a monochromatized Al K X-ray (h = 1486.68 eV) was used as an excitation
source and the analyzer pass energy was fixed at 30 eV. The calibration of the equipment
was done with elemental Au, Cu and Ag to cover the full energy spectrum. Thermo
AdvantageTM software (version 4.78) was used for the elemental quantification and for peak
fitting estimation. Angle-resolved XPS analysis was done to generate a non-destructive
depth profile of the composition of the near-surface region in the nanoporous structure. AR
Process software (version 5.59) was used to process the angle-dependent XPS data. LEIS
experiments were performed using three different ions depending on the required
information: for the general survey of the surface, 4He+ was used with an energy of 3 keV
and with a target current of 5 nA; for the better resolution of the Au-Pt spectra, 20Ne+ was
used with an energy of 5 keV and a target current of 1 nA, and for the separation of the Au
and Pt signal, 40Ar+ was used to improve the sensitivity of the analysis with an energy of 5
keV and with a target current of 1 nA. In all cases, the analyzed area was approximately 1
mm2 and the measurement time was 45 s.
3.3 Results and discussion
Figure 3.1a shows a SEM image of the nanoporous metal formed by dealloying of Ag-
Au-Pt alloy with ca. 1 at.% Pt. In our previous work [15], we reported that the average
110
ligament size of these nanostructures was ca. 6.8 nm, whereas the ligament size formed on
the Ag-Au alloy with the same Ag content was ca. 14 nm. As Pt has a much lower surface
diffusion rate than Au, during dealloying the Pt embedded in exposed terraces should
segregate to the edges of the growing Au-rich islands and stabilize them, ultimately
reducing the length scale of the resulting structure. As a result, the ligament size decreased
with increasing Pt content in the precursor (e.g., the ligament size obtained from the
precursor with 3 at.% Pt was ca. 4.3 nm). In Figure 3.1b, a lower magnification image of the
nanoporous layer is shown, in which the interconnected pore/ligament structure is evident.
In the insert of this figure, a TEM image suggests that the mean pore size of this structure
was about 8 nm. The pore size also decreased with increasing the Pt content in the
precursor.
111
Figure 3.1 (a) SEM image of the freshly-developed nanoporous structure obtained by dealloying of Ag77:Au22:Pt1. (b) Dealloyed layer after ultramicrotoming a sample; in this case, the dealloyed layer rolled as a consequence of the low cutting velocity used during the process. The insert shows a TEM image of the nanoporous structure. The dealloying conditions in all cases were the same – dealloying charge density: 5 C cm-2, temperature: 25 °C and dealloying potential: 550 mV vs. MSE.
In accordance with the dealloying mechanism [2,31,32], the surface of nanoporous
dealloyed metals (i.e., the ligament surfaces) should be almost entirely covered with the
more-noble metal (s). In the case of nanoporous metals formed from Ag-Au-Pt alloys, the
surface of the ligaments should be mostly covered with Au and Pt; therefore, one
particularly interesting aspect of these nanostructures is the concentration of Pt atoms on
the surface, as well as the Pt content across the dealloyed layer. It was expected that the
112
higher the Pt content of the precursors, the higher the coverage of Pt on the surface of the
ligaments. In agreement with this expectation, for simple dealloying without any post-
treatment, the fraction of Pt on the surface of the ligaments increased from 1.6 % to 3.0 %
when the Pt content of the precursor increased from 1 at.% to 2 at.% (Figure 3.2a). The
highest Pt content alloy had 6.6 % of Pt on the surface. The Pt composition profiles across
the dealloyed layer (Figure 3.2b) were determined by TEM – EDS on ultramicrotomed
samples (see Figure 3.2c). In Figure 3.2c, the substrate (i.e., non-dealloyed region) and the
dealloyed layer are clearly visible; the insert in this figure shows evidence of the porosity of
the layer. Figure 3.2b shows that the Pt compositional concentration remained relatively
constant across the dealloyed layer for all alloys. In the case of the lowest Pt content alloy,
the Pt content in the region close to the surface of the sample was ca. 3 at.%, whereas in
the vicinity of the dealloying front it was ca. 2 at.%. In the case of the highest Pt content
material, the average composition across the layer was ca. 8.5 at. %. In all cases, the ratio
Au to Pt was nominally the same as the original alloy, confirming that only Ag was removed
during the corrosion process. The average amount of retained Ag in the layer was ca. 50 at.
% for the alloy with originally 1 at. % Pt; whereas for the alloy with the highest Pt content it
was ca. 52 at. % [15].
113
Figure 3.2 (a) Fraction of Pt atoms on the outermost surface of the ligaments. (b) Pt content across the dealloyed layer obtained by TEM – EDS in ultramicrotomed samples. (c) Ultramicrotomed sample; the insert shows a TEM image of the dealloyed layer showing a highly dense porous structure. For Figures (a) and (b) error bars represent the 95% confidence interval (CI): in the case of (a) the CI was obtained by triplicate runs, for (a) the CI was obtained from at least 3 points across the dealloyed layer - 0 % represents the dealloying front (DF) and 100 % represents the original surface of the sample (SS). The nomenclature in the case of (b) is based on the original composition of the alloys.
3.3.1 Surface chemistry of nanoporous metals after heat treatment
The presence of Pt on the surface of the ligaments impacts not only the resistance to
coarsening of the structure, but it might also have an effect on its reactivity. These two
114
factors would have a major role in the potential applications of these materials in areas as
demanding as catalysis and sensing.
It was observed that the content of Pt on the surface of the ligaments can be tuned by
exposing freshly-prepared nanoporous metals to moderately elevated temperature (< 500
°C) in the presence of air (see Figure 3.3a). When nanoporous structures were exposed to
elevated temperature, there was a mixing between the top surface of the ligaments and the
layers underneath; during that process, Pt was pinned on the surface of the resulting
structure due to its strong interaction with oxygen. It was surprising that this segregation
occurred at such relatively low temperatures, where the lattice diffusion is quenched;
however, there may be analogous phenomena in nanoparticles systems. As suggested in
literature [22], and shown below in section 3.3.3, if oxygen was not present, Pt did not
segregate to the surface. This adsorbate-induced surface segregation phenomenon, to the
best of our knowledge, has not been reported before for nanoporous metals. Besides the
clear tendency of Pt to segregate to the surface at temperatures lower than 500 °C, CV in 1
M NaOH solution suggested that Ag was also exposed to the surface of the ligaments,
which is a phenomenon that has been previously reported in NPG [33]. This was concluded
after comparing a distinctive cathodic peak (located at ~150 mV vs. Hg/HgO) between the
different nanoporous structures and a pure Ag electrode (these voltammograms were
consistent with studies done specifically on Ag electrodes in NaOH solutions [30]).
Moreover, it was observed that the tendency of Ag to segregate to the surface of the
ligaments was minimized in the alloys with higher Pt content in the precursor.
115
Figure 3.3 (a) Fraction of Pt on the surface of the nanoporous structures after exposure to different temperatures for 2 h; (b) roughness factor (Rf) of the nanostructures; (c) time dependence of the segregation phenomenon at 425 °C; (d) roughness factor (Rf) as a function of exposure time at 425 °C. The different alloys, based on their original composition, are represented as follows: (●) Ag77:Au22:Pt1, (○) Ag77:Au21:Pt2, (♦) Ag77:Au20:Pt3. In all cases, laboratory air was used. Error bars represent 95% CI calculated from triplicate runs.
As shown in Figure 3.3a, the maximum coverage of Pt was obtained in the
temperature range between 425 °C and 475 °C showing values of ca. 10%, 19% and 32%
for the alloys with ca. 1, 2 and 3 at.% Pt in the precursors, respectively. These maximum
concentrations of Pt atoms on the surface of the ligaments were supported by our
calculations regarding the maximum coverage of Pt that was possible in accord with the
concentration of Pt on the bulk of the ligaments (Figure 3.3b). At slightly higher
temperatures (i.e., 500 °C and 600 °C), the fraction of Pt significantly decreased. At 600 °C,
for instance, it was determined that the maximum fraction of Pt was ca. 4.0 % for the alloy
116
with 3 at.% of Pt in the precursor. In this range of temperatures, the desorption of oxygen
from surface Pt atoms was responsible for the reduction of Pt coverage [34-36], reverting to
the usual Au-enrichment behaviour of binary Au-Pt in vacuum [16-18]. The roughness factor
(Rf), indicative of the amount of thermal coarsening of the nanoporous structure, decreased
for all alloys with increasing temperature, as shown in Figure 3.3b; nevertheless, it was
observed that the resistance to coarsening increased with the Pt content of the precursor.
SEM pictures of some selected samples are shown in Figure 3.4. The ligament width
in the alloy with 1 at.% Pt (Figure 3.4a, b and c) increased from ca. 7 nm to 38 nm when
exposed to 425 °C; at 500 °C however, the ligament width increased to ca. 380 nm. In the
case of the alloy with 3 at.% Pt in the precursor (Figure 3.4d, e and f), the ligament size only
increased from 4 nm to 9 nm at 425 °C. After exposure to 500 °C, the average ligament
width increased to ca. 14 nm. As a comparison, and in order to see the ability of NPG to
coarsen, the ligament size in the binary alloy after annealing for 2 h at 425 °C in air was ca.
370 nm (see later in the discussion). This is in agreement with coarsening trends for NPG
under similar experimental conditions [37].
As demonstrated in Figure 3.3c, the segregation of Pt to the surface of the ligaments
happened very quickly at 425 °C. In the first 30 minutes of exposure the Pt concentration on
the surface increased by a factor of four; at longer times, small changes were obtained with
no further significant changes after 2 h of exposure. The same was true for the change in
the Rf (Figure 3.3d). It was also determined that nanoporous structures exposed for almost
70 h at 300 °C (see Figure 3.5 for the higher Pt content alloy) did not show any significant
difference in the Pt composition with respect to the fraction obtained after 2 h (i.e., ca. 17
%). This result suggested that the structure was in equilibrium at even lower temperatures
than the temperature that showed the maximum Pt coverage (i.e., 425 °C). At this moment,
117
however, the transport mechanism that these Pt atoms follow is still unknown for us,
especially because at these temperatures the lattice diffusion coefficients are very small.
Figure 3.4 SEM images of the nanoporous structures formed from Ag77:Au22:Pt1 alloy (a, b, c) and from Ag77:Au20:Pt3 alloy (d, e, f). Images (a) and (d) show the structures right after dealloying; images (b) and (e) show the structures after annealing at 425 °C in the presence of laboratory air; images (c) and (f) show the structures after annealing at 500 °C in the presence of laboratory air. For all the annealed structures, the exposure time was 2 h.
118
Figure 3.5 Fraction of Pt on the surface of the nanoporous structure formed on Ag77:Au20:Pt3 after exposure to 300 °C for different times. The dealloying conditions were the following: charge passed 5 C cm-2 at 25 °C and 550 mV vs. MSE. In all cases, laboratory air was used. The error bar represents 95% CI calculated from triplicate runs.
3.3.2 XPS and LEIS characterization of the surface of nanoporous metals
XPS analysis was done on samples with 1 and 3 at.% Pt in the precursor before and
after different heat treatments. XPS spectra were taken at a number of different take-off
angles to increase the relative surface sensitivity; nevertheless, Figure 3.6 only shows the
spectra taken at approximately 48 ° as an example. It was estimated that with this take-off
angle we were probing skin depths of < 5 nm. A more detailed surface composition of
ligaments with micro-XPS will be beneficial for the characterization of this phenomenon; this
constitutes part of our future work with these materials. As demonstrated in Figure 3.6a and
Figure 3.6b, after heat treatment at 425 °C for 2 h in the presence of laboratory air, there
was a stronger signal for Pt in the lower and higher Pt content structure than that
immediately after dealloying. In both structures, it was observed that the Pt4f spectral region
has at least five strong peaks; these peaks disappeared after annealing the lower Pt content
119
sample at 500 °C, but remained in the case of the other alloy (Figure 3.6b). These peaks
were due to the formation of different adsorption states of Pt-O on the surface. Figure 3.7a
shows the curve fitting for those Pt peaks showing slightly different binding energies than
previously reported in literature [38-42]. These differences could be due to the presence of
Au and/or Ag and the high concentration of step Pt atoms on the surface [43-45]. At high
enough temperature, oxygen desorbed (presumably between 500 and 600 °C) allowing the
surface to partially regain its metallic form, which was particularly evident after annealing the
higher Pt content structure at 600 °C (see Figure 3.7b). At this temperature, a peak at ca.
70.6 eV and another one at ca. 74.0 eV were in close agreement with the binding energies
for metallic Pt; however, there was still some evidence that after exposure to this
temperature some other species still remained on the surface of the nanostructure (peak at
77.5 eV). A similar effect was observed after electrochemically reducing the surface oxides
(at ~-300 mV vs. MSE in H2SO4 solution) from the as-annealed sample (at 425 °C). Right
after the sample was annealed at the pre-selected temperature, it was carefully reconnected
to a copper wire and immersed in 1 M H2SO4 solution; immediately after the electrochemical
reduction, the sample was analyzed in XPS showing only two strong peaks with binding
energies ca. 70.6 eV and ca. 74.0 eV (Figure 3.7c).
Figure 3.6c and Figure 3.6d show the XPS spectra for Ag3d in both alloys. As the
temperature increased, the intensity of the signal increased suggesting that Ag also tended
to segregate towards the surface of the structures, but without a specific interaction with
oxygen. In the lower Pt content alloy there was a stronger signal for Ag than in the other
alloy, in agreement with the tendency determined by our qualitative determination of Ag on
the surface (CV in NaOH solution). No chemical shift was observed in the Ag3d, or Au4f
spectra (not shown here), under any of the experimental conditions used here. The O1s
spectra are shown in Figure 3.6e (for the alloy with 1 at.% Pt) and Figure 3.6f (for the alloy
120
with 3 at.% Pt). After annealing these two structures in air at 425 °C, there was a shift in the
binding energy of oxygen with respect to the signal obtained in the sample right after
dealloying (from ca. 532 eV in the sample after dealloying to less than 530 eV for the
annealed sample). This peak has been associated with the adsorbed oxygen on Pt surfaces
[39]. By annealing the alloy with originally 1 at.% Pt at 500 °C, the signal for O1s decreased
and slightly shifted again to higher binding energies. The other alloy did not show a
significant change in the O1s at 500 °C, but at 600 °C there was a decrease in the peak
signal with its corresponding shift. The electrochemical reduction of surface oxide species
also induced a shift in the O1s peak to higher binding energies (Figure 3.7d).
Figure 3.6 Pt4f, Ag3d and O1s photoelectron spectra of nanoporous structures on Ag77:Au22:Pt1 alloy (a, c, e) and Ag77:Au20:Pt3 alloy (b, d, f) at different conditions: as-dealloyed structures (▬▬); after exposure at 425 °C ( ); after exposure at 500 °C ( ) and after exposure to 600 °C ( ). In the case of high temperature experiments, they were done in laboratory air for 2 h. All spectra were obtained at a take-off angle of 48 °.
121
Figure 3.7 A curve-fit of the Pt4f surface level spectra obtained after exposure of the as-dealloyed material to (a) 425 °C and (b) 600 °C. (c) Pt4f spectra and (d) O1s in which the solid line represents the photoelectron spectra of nanoporous structure annealed at 425 °C and the dotted line represents the spectra after electrochemically reducing the surface oxides in 1 M H2SO4. In all cases, samples were annealed for 2 h in laboratory air. All spectra were obtained at a take-off angle of 48 °on Ag77:Au20:Pt3 alloy.
Figure 3.8 shows the Pt composition obtained by XPS at different take-off angles.
Evidently, the Pt content in the near-surface of the ligaments depended on the exposure
temperature; however, it was not obvious to what extent the Pt is enriched in only the
outermost atom layer. Using the angle-resolved XPS data, we generated a depth profile
analysis (not shown here) for the lower and higher Pt content alloys. The maximum entropy
algorithm was used to simulate the angle-dependent photoemission intensity [46]. As
pointed out before, it has been shown, both by theoretical and experimental approaches,
that roughness could have a significant effect on the outcome of the analysis [47-49];
122
nonetheless, no correction for the surface roughness was done at this stage. It was found
that indeed, the predicted Pt compositions on the top surface of the structure agreed very
well with our hydrogen UPD values; however, at this moment we cannot make any definitive
conclusion about the Pt enrichment in the outermost atom layer.
Figure 3.8 XPS Pt4f composition with respect to the take-off angle for (a) Ag77:Au22:Pt1 and (b) Ag77:Au20:Pt3 and for different experimental conditions: (◊) right after dealloying, (●) after exposure at 425 °C, (○) after exposure at 500 °C and (▲) after exposure to 600 °C. In the case of all high temperature conditions, laboratory air was used for an exposure time of 2 h.
In addition to the XPS analysis, a LEIS analysis performed on the higher Pt content
alloy is shown in Figure 3.9. This analysis was done in specimens before (right after
dealloying) and after segregation of Pt (at temperatures > 200 °C). Figure 3.9a shows a
general survey of the surface, indicating the positions of the peaks for O (ca. 1100 eV), Ag
(ca. 2550 eV) and Au-Pt (ca. 2700 eV). Evidently, the signal for oxygen got stronger after
exposure of the as-dealloyed samples to the heat treatment; moreover, the Ag peak
increased with increasing temperature. In the absence of oxygen (sample exposed to 425
123
°C in Ar-H2), the signal for Au-Pt was very weak (see Section 3.3.3 below), whereas the
sample exposed to 425 °C in air had the strongest Au-Pt signal. It is important to mention
however, that this analysis was done without any surface cleaning to avoid any damage to
the surface; therefore, the presence of hydrocarbons on the surface masked some of the
signal for the analysis (especially for Pt and Au). Figure 3.9b shows the signal of Au-Pt for a
different set of sample after targeting the surface with 20Ne+ ions to obtain better resolution;
as expected, the as-dealloyed sample and the sample exposed to 425 °C had the stronger
signal, whereas a sample exposed at 500 °C showed a very weak signal (this sample had a
very disruptive layer of hydrocarbons on the surface). The insert in this figure shows a better
sensitivity analysis of the Au-Pt spectra, which allowed us to separate the two signals: in the
as-dealloyed sample, the signal consisted mainly of Au; the surface of the sample after
exposure to 425 °C, on the other hand, contained mainly Pt. In both cases, a comparison
with appropriate standards was made (see figure). In general, all these results are in
agreement with our main findings; nevertheless, a gentle cleaning of the surface will be
beneficial to have a better signal to noise ratio.
124
Figure 3.9 (a) LEIS general survey for the highest platinum content alloy before and after exposure to moderately high temperature; in this case, the surface of the samples was bombarded with 3 keV 4He+ ions. (b) Au-Pt spectra after bombarding the surface of the samples with 5 keV 20Ne+ ions; the insert in this figure shows the Au-Pt spectra after bombarding the surface with 5 keV 40Ar+ ions to improve the sensitivity of the analysis. The signals for Au and Pt standards are also included in the figure. The details about the different experimental conditions are shown in the figure. For all high temperature experiments, samples were exposed for 2 h in the presence of laboratory air unless otherwise state. In all cases, analyses were done without any surface cleaning to avoid any ion-induced mixing of the noble metals.
3.3.3 Surface segregation in the absence of oxygen
The absence of oxygen severely reversed the segregation of Pt to the surface of the
ligaments. Figure 3.10 shows the fraction of Pt on the surface of the ligaments after
125
exposure of Ag77:Au20:Pt3 samples to an Ar-H2 atmosphere at different temperatures.
Clearly, the concentration of Pt on the surface was much smaller than the one observed in
the presence of air (i.e., there was de-segregation of Pt in Ar-H2 atmosphere, as expected
from literature studies on binary Au-Pt alloys [17,20]). For example, after 2 h at 425 °C, the
fraction of Pt was ca. 2 at. % whereas at the same temperature but in the presence of air
the fraction of platinum was ca. 32 % (see Figure 3.3a). This tendency was also confirmed
after doing the LEIS analysis on one sample exposed to 425 °C in the absence of oxygen,
showing practically no indication of Pt being on the surface of the nanostructure (Figure
3.9a). In addition, the ligament size in these samples was massively bigger than the
ligament size of samples coarsened in air (see Figure 3.11): the ligament size of samples
exposed at 425 °C in Ar-H2 was almost 90 nm whereas samples annealed at the same
temperature, in air, showed an average ligament size of ca. 10 nm. At higher temperature
(i.e., 500 °C), the ligament size in the Ar-H2 atmosphere was ca. 170 nm (Figure 3.11d); in
air the ligament width was 14 nm (Figure 3.4f). These ligament widths had the expected
effect on the roughness factors of these structures (insert Figure 3.10). Again, using NPG as
a reference, it was observed that the ligament size in the binary alloy was approximately
360 nm when exposed to 425 °C for 2 h in Ar-H2 (Figure 3.12a). As discussed before, the
ligament size of NPG after annealing in air (Figure 3.12b) was basically the same as in the
case of Ar-H2 annealing. Therefore, it was evident that the co-segregation of Pt and O
hindered the coarsening process in these nanostructures produced from ternary Ag-Au-Pt
alloys.
126
Figure 3.10 Fraction of Pt on the surface of the ligaments and average ligament size of the nanoporous structure formed on Ag77:Au20:Pt3 alloy with respect to temperature. Ar-H2 was used in all cases with an exposure time of 2 h. The insert shows the roughness factor (R f) with respect to temperature. The error bars represent 95% CI calculated from triplicate runs in the case of the fraction of Pt and from at least 20 measurements in the case of the ligament size.
Figure 3.11 SEM images of the resulting structures formed after annealing in Ar-H2 atmosphere the nanoporous structure obtained by dealloying Ag77:Au20:Pt3 alloy. (a) Sample annealed at 200 °C; (b) sample annealed at 300 °C; (c) sample annealed at 425 °C, (d) sample annealed at 500 °C. In all cases, the annealing time was 2 h.
127
Figure 3.12 SEM images of the resulting structures formed after annealing in NPG in (a) Ar-H2 atmosphere and (b) laboratory air. In both cases the exposure temperature was 425 °C and the the annealing time was 2h.
In summary, the co-segregation of Pt and O on these nanoporous metals offers an
interesting way of engineering these nanostructures. Through being able to modify the
composition of the ligament surfaces, and thanks to the stability of the structures, it is
evident that these materials have great flexibility, and have potential applications in fields
like catalysis, in which the surface composition and structure are crucial.
128
3.4 Conclusions
(a) The Pt coverage on the surface of the nanoporous dealloyed structure formed from
ternary Ag-Au-Pt alloys can be tuned by exposing nanoporous metals to surprisingly
modest temperature (< 500 °C) in the presence of air, with a maximum coverage
obtained in the temperature range between 425 °C and 475 °C. At higher temperatures,
there is a decrease in the fraction of Pt on the surface due to desorption of oxygen from
Pt atoms and consequent de-segregation of Pt.
(b) In the absence of oxygen, a de-segregation of Pt is evident in the range of temperatures
studied (200 – 500 °C). The presence of oxygen is the driving force to bring Pt to the
surface of the ligaments thanks to its strong interaction with Pt. Moreover, it was found
that the co-segregation of Pt and O hinders the coarsening process in nanoporous
metals.
(c) The co-segregation of O and Pt is a very quick process. It was observed that in
approximately 30 min, almost maximum coverage is achieved with no changes after 2
hours of exposure at 425 °C. Even prolonged experiments at lower temperatures than
the optimum segregation temperature suggests that the structure is in equilibrium.
(d) We still do not understand the transport mechanism that these Pt atoms follow for the
lower temperatures in the range studied. In the range of temperatures that were
studied, lattice diffusion coefficients are very small and should not make a significant
contribution to this process.
3.5 Acknowledgements
The authors wish to thank P. Brodersen, from the Surface Interface Ontario at the
University of Toronto, for his help in the performance and analysis of the XPS/LEIS
129
experiments. The authors wish also to acknowledge R. ter Veen, from TASCON GmbH –
Münster, Germany, and T. Grehl, from ION-TOF GmbH – Munster, Germany, for their help
running the LEIS experiments. The financial support from Natural Science and Engineering
Research Council (NSERC) of Canada is also gratefully acknowledged.
3.6 References
1. E. Seker, M. L. Reed and M. R. Begley. (2009). Nanoporous gold: fabrication,
characterization, and applications, Materials, 2, 2188.
2. J. Erlebacher, M. J. Aziz, A. Karma, N. Dimitrov and K. Sieradzki. (2001). Evolution of
nanoporosity in dealloying, Nature, 410, 450.
3. A. Mathur and J. Erlebacher. (2007). Size dependence of effective Young's modulus
of nanoporous gold, Appl. Phys. Lett., 90, 061910.
4. J. Weissmüller, R. C. Newman, H.-J. Jin, A. M. Hodge and J. W. Kysar. (2009).
Nanoporous metals by alloy corrosion: formation and mechanical properties, MRS
Bull., 34, 577.
5. A. J. Forty. (1979). Corrosion micro-morphology of noble-metal alloys and depletion
gilding, Nature, 282, 597.
6. A. J. Forty and P. Durkin. (1980). A micro-morphological study of the dissolution of
silver-gold alloys in nitric acid, Philos. Mag. A, 42, 295.
7. A. M. Hodge, J. R. Hayes, J. A. Caro, J. Biener and A. V. Hamza. (2006).
Characterization and mechanical behavior of nanoporous gold, Adv. Eng. Mater., 8,
853.
8. C. A. Volkert, E. T. Lilleodden, D. Kramer and J. Weissmüller. (2006). Approaching the
theoretical strength in nanoporous Au, Appl. Phys. Lett., 89, 061920.
130
9. Y. Ding, Y.-J. Kim and J. Erlebacher. (2004). Nanoporous gold leaf: "Ancient
technology", Adv.Mater., 16, 1897.
10. J. Zhang, P. Liu, H. Ma and Y. Ding. (2007). Nanostructured porous gold for methanol
electro-oxidation, J. Phys. Chem. C, 111, 10382.
11. R. C. Newman. (1992). A theory of secondary alloying effects on corrosion and stress-
corrosion Cracking, Corros. Sci., 33, 1653.
12. J. D. Bengough and R. May. (1924). Seventh report to the Corrosion Research
Committee of the Institute of Metals, J. Inst. Met., 32, 81.
13. J. Snyder, P. Asanithi, A. B. Dalton and J. Erlebacher. (2008). Stabilized nanoporous
metals by dealloying ternary alloy precursors, Adv. Mater., 20, 4883.
14. D. Mott, J. Luo, P. N. Njoki, Y. Lin, L. Wang and C.-J. Zhong. (2007). Synergistic
activity of gold-platinum alloy nanoparticle catalysts, Catal. Today, 122, 379.
15. A. A. Vega and R. C. Newman. (2014). Nanoporous metals fabricated through
electrochemical dealloying of Ag-Au-Pt with systematic variation of Au to Pt ratio, J.
Electrochem. Soc., 161, C1.
16. L.-L. Wang and D. D. Johnson. (2009). Predicted trends of core-shell preferences for
132 late transition-metal binary-alloy nanoparticles, J. Am. Chem. Soc., 131, 14023.
17. B. N. Wanjala, J. Luo, B. Fang, D. Mott and C.-J. Zhong. (2011). Gold-platinum
nanoparticles: alloying and phase segregation, J. Mater. Chem., 21, 4012.
18. L. Deng, W. Hu, H. Deng and S. Xiao. (2010). Surface segregation and structural
features of bimetallic Au-Pt nanoparticles, J. Phys. Chem. C, 114, 11026.
19. P. A. Dowben, A. H. Miller and R. W. Vook. (1987). Surface segregation from gold
alloys, Gold Bull., 20, 54.
20. A. V. Ruban, H. L. Skriver and J. K. Nørskov. (1999). Surface segregation energies in
transition-metal alloys, Phys. Rev. B, 59, 15990.
131
21. L. Vitos, A. V. Ruban, H. L. Skriver and J. Kollar. (1998). The surface energy of
metals, Surf. Sci., 411, 186.
22. A. Dhouib and H. Guesmi. (2012). DFT study of the M segregation on MAu alloys (M =
Ni, Pd, Pt) in presence of adsorbed oxygen O and O2, Chem. Phys. Lett., 521, 98.
23. C. Wang, D. van der Vliet, K. L. More, N. J. Zaluzec, S. Peng, S. H. Sun, H. Daimon,
G. F. Wang, J. Greeley, J. Pearson, A. P. Paulikas, G. Karapetrov, D. Strmcnik, N. M.
Markovic and V. R. Stamenkovic. (2011). Multimetallic Au/FePt3 nanoparticles as
3 A version of this chapter has been submitted for publication. Vega, A. A., and Newman, R. C. Methanol electro-oxidation on nanoporous metals formed by dealloying of Ag-Au-Pt alloys.
134
Chapter 4. Methanol Electro-oxidation on Nanoporous Metals Formed
by Dealloying of Ag-Au-Pt Alloys3
4.1 Introduction
For centuries, gold has been recognized for its beauty and rarity, but also for its
nobleness and inability to corrode. Historically, gold is an element that has been considered
as a poor catalyst towards many technologically important reactions like methanol electro-
oxidation or CO oxidation; however, relatively recently it was observed that when this
element is subdivided down to the nanoscale, it becomes a very reactive material [1-3].
Thus, the rapid development of nanotechnology and nanoscience has stimulated the
application of gold in disciplines like sensing and catalysis. Some of the reactions that have
been catalyzed by nano-sized gold are low temperature CO oxidation [1], selective oxidation
of benzyl alcohol [4,5], the water gas shift reaction [2,6] and many other reactions, some of
which have been summarized elsewhere [7-9]. Among the different alternatives to study
gold as a catalyst, gold nanoparticles have been commonly used. These nanoparticles,
typically on a support, show a superior chemical stability, which enable them to act as
superior material for catalysis; however, small particles may suffer from shape stability
issues and sintering over time, which reduces their active surface area and limits their long-
term functionality [10-12]. Additionally, their processing usually involves relatively
complicated preparation and assembly procedures [13-15]. Moreover, in supported gold
catalysts, many factors have been correlated with the catalytic activity, including preparation
methods of the catalyst, nature of the support, pre-treatment conditions, presence of water
and others [15-17].
135
Another alternative to produce nano-sized gold is to dealloy Ag-Au alloys to form
nanoporous gold (NPG). By selectively leaching the silver from the Ag-Au alloy, highly
porous nanostructures are formed, in which the interconnected interstices and channels
extend in three dimensions. NPG has a desirable structure for catalysis, not only because of
its high surface area, but also because of it does not require a support. Moreover, it has
been reported that the remarkable catalytic properties of NPG, which are also applicable to
gold nanoparticles, are related to the high density of atomic steps and kinks on the surface
of the ligaments, which act as active sites for catalysis [18]. In addition, it has been
suggested that the residual silver in NPG played a significant role in its catalytic abilities, not
only helping for adsorption/dissociation of molecules during chemical/electrochemical
reactions, but also stabilizing the surface steps and kinks [18-20]. Furthermore, NPG is
relatively easy to produce and its feature size is tunable from a few to hundreds of
nanometers by post-heat treatment. Unfortunately, NPG is prone to coarsening, reducing its
functionality due to loss of surface area [21]. It has been shown that the microscopic surface
diffusion kinetics of gold along the alloy/electrolyte interface are not only responsible for
porosity evolution during dealloying but also for the post-fabrication coarsening of the
structure [22]. To minimize this coarsening, it has been reported that small amounts of
platinum can be deposited onto the NPG film, with the resulting material having better
stability even at high temperature conditions [21,23-25]; however, this technique is time
consuming and represents an extra step during the catalyst preparation process. Another
alternative is to add platinum to the precursor material, as shown by Snyder et. al. [26] after
adding approximately 6 at. % of platinum to the ‘white-gold’ type of Ag-Au alloy (i.e., gold
content of 35 at.%). Moreover, we recently probed that by adding as little as 1 at. % of
platinum to the alloy precursor, the coarsening of the structure is significantly minimized
[27]. In addition to the beneficial effect of platinum towards the stabilization of the
nanostructure, it is expected that the presence of platinum and gold on the surface of the
136
nano-structure will offer unique catalytic properties thanks to the synergy between these two
elements [28-35]. It is believed that the strong chemisorption of oxygen species onto the
porous gold will provide many reactive oxygenated species which may promote further
oxidation of carbonaceous intermediates typically absorbed on the platinum surface, which
may also reduce the typical poisoning effect [36]. Thus, exploring the electrocatalytic
properties of nanoporous structures with small amounts of platinum has a significant
importance, not only to have a better understanding of the effect of platinum in the catalytic
response of these novel nanostructures, but also in the steps towards the optimization and
characterization of potentially robust nanocatalysts.
In this article, the electrocatalytic abilities of dealloyed multi-component alloy systems
are reported. Specifically, alloys of Ag-Au-Pt have been selected with a maximum platinum
content of 3 at.%. By selectively removing some of the silver from the ternary alloys, porous
nanostructures were formed with well-controlled length scales and morphologies. The effect
of some dealloying conditions (i.e., dealloying temperature and charge density passed) are
evaluated in terms of the catalytic response of the resulting nanostructures. In addition,
nanoporous structures with a platinum-enriched surface, obtained by an adsorbate-induced
surface segregation mechanism, are also investigated. Methanol electro-oxidation in basic
medium was selected as our target system; however, some preliminary data of methanol
oxidation in acidic media are also shown. NPG formed by dealloying of Ag-Au alloys (with
the same silver content as the ternary systems) is used as a control material.
137
4.2 Experimental procedures
4.2.1 Materials and dealloying procedures
Ag-Au alloy with 77 at.% silver was obtained from as cold-rolled 200 m sheet from
Goodfellow Metals, Cambridge, UK. Ag-Au-Pt alloys with platinum content of 1, 2 and 3
at.% and 77 at.% silver were obtained as cold-rolled sheet from Ames National Laboratory –
US Department of Energy, Iowa, USA. For all the experiments, specimens were cut into
strips of approximately 4 mm by 10 mm before annealing at 900 °C for 5 h in the case of the
binary alloy and at 975 ºC for 15 h in the case of the ternary alloys. In all cases, the
annealing was performed in H2-Ar atmosphere (2.5 % H2; balance Ar). All the specimens
were used in the as-annealed condition without any further surface preparation. Each strip
of alloy was attached to a copper wire for electrical connection, using lacquer (SPI
Miccroshield) to mask the junction and the isolated copper wire. In all cases, dealloying was
done from both sides of the sample.
Dealloying was carried out potentiostatically in a three-electrode electrochemical cell,
with platinum coil as the counter electrode (CE) and mercury/mercurous sulphate (MSE,
0.64 V vs. SHE) as the reference electrode (RE). The reference electrode was housed in a
separate compartment and connected to the electrochemical cell via a Luggin probe. In all
cases 0.77 M HClO4 solution, prepared from Analar grade HClO4 (Alfa-Aesar, 62%), was
used. All solutions were prepared with 18 MΩ∙cm de-ionized water and de-aerated by high-
purity nitrogen purging (min. purity: 99.998%). The electrochemistry was performed using a
Gamry Reference 600TM potentiostat. Most of the specimens were dealloyed at 25 °C,
passing an anodic charge density of 5 C cm-2 at 0.55 V vs. MSE; however, to study the
effect of dealloying temperature and charge density in the catalytic abilities of the
nanoporous metals, different conditions were used. A dealloying temperature range of 25 –
138
60 °C was evaluated (for the same charge density passed), whereas the effect of charge
density was analyzed by varying charges from 2.5 to 20 C cm-2 during dealloying at 25 °C.
For some selected samples, the fraction of platinum exposed on the surface of the
ligaments was tuned by the adsorbate-induce surface segregation phenomenon at 425 °C in
the presence of laboratory air. For that purpose, the connecting wire was removed
immediately after dealloying and the specimens were thoroughly rinsed with de-ionized
water and dried with air before exposed them to the target temperature. This phenomenon
has been recently reported by the authors [37].
4.2.2 Materials characterization
A detailed description of characterization of these nanoporous structures has been
given previously [27]. In summary, for the microstructural characterization (e.g., ligament
size), dealloyed samples were manually broken under tension in air and the fracture surface
was photographed using a scanning electron microscope (SEM – Hitachi S-5200) with an
accelerating voltage of 20 kV. The SEM pictures were later analyzed with the Image Tool
software (provided by The University of Texas Health Science Centre in San Antonio, USA)
to accurately determine the ligament size (here equivalent to the average width
perpendicular to the ligament edge). The thickness of the dealloyed layer (DL) was
determined after analyzing cross-sectional metallographic specimens. In all cases,
specimens were polished to 0.05 µm using alumina powder. The cross sectional view of
those specimens was photographed using an Olympus PME3 Optical Microscope and the
DL thickness was measured using Clemex Vision Professional software. The composition of
the DL was determined by SEM (JEOL JSM6610-Lv) complemented by an Oxford INCA X-
139
sight energy dispersive X-ray spectrometer (EDS). An accelerating voltage of 25 kV was
used in all cases.
To evaluate the true surface area of the dealloyed specimens and the fraction of
surface platinum atoms on the surface of the structure, classical electrochemical methods
were used. The true area of the electrodes was estimated by means of voltammetric profiles
in the double layer region of potentials (i.e., -0.24 to 0.05 V vs. MSE) at different scan rates
in 1 M HClO4 solution [38,39]. In all cases, 28 µF cm-2 was considered the baseline double-
layer capacitance for polycrystalline gold and platinum [38]. This assumption proved to be
valid after comparing the results with Brunauer-Emmett-Teller (BET) surface area and
impedance measurements [27]. The equivalent area of platinum on the surface of the
ligaments was estimated by underpotential deposition (UPD) of hydrogen [40,41]. All
specimens were immersed in 1 M H2SO4 solution (EMD, 95-98%) in a three-electrode cell
with a MSE as a RE, a platinum wire as CE and the dealloyed specimen as a working
electrode. The solution was de-aerated for approximately 15 min before the experiment.
Cyclic voltammetry (CV) curves were obtained at 25 °C between -0.63 and 0 V vs. MSE, at
a scan rate of 20 mV s-1. The equivalent area of platinum on the surface of the structure was
calculated by integrating the hydrogen adsorption/desorption regions to obtain the charge
related with the formation of a hydrogen monolayer, assuming that the charge associated
with the monolayer formation in polycrystalline platinum was 210 µC cm-2 Pt [42,43]. The
fraction of platinum on the surface of the resulting structure was estimated by dividing the
equivalent area of exposed platinum by the estimated true area of the electrode. The
roughness factor (Rf), as an indication of the developed surface area during the dealloying
process, was determined by dividing the true area of the electrode by its geometrical area.
140
4.2.3 Electro-oxidation of methanol
In the case of the electrocatalytic studies in basic media, dealloyed specimens were
immersed in a solution containing methanol (Caledon, 99.8%) in 5 M KOH (Aldrich, 90%).
Methanol concentrations of 0.3, 1 and 3 M were used for the analysis. The KOH/CH3OH
solution was prepared by diluting/dissolving the reactants with de-ionized water with a
resistivity of 18 MΩ∙cm. Prior to any measurement, the solution was de-aerated by high-
purity nitrogen purging (min. purity: 99.998%). A Gamry Reference 600TM potentiostat was
used to perform CV between -0.9 and 0.2 V vs. mercury/mercury oxide RE (Hg/HgO – 20%
KOH, 0.1 V vs. SHE). The effect of the positive scan limit was evaluated by changing it from
0 to 0.4 V vs. Hg/HgO. Scan rates of 3, 10, 30 and 100 mV s-1 were used. To assess
qualitatively the presence of any mass transfer effects during reaction, a magnetic stirrer
was used. The approximate rotation velocity of the stirrer was measured with a digital laser
tachometer (Fieldpiece, HP2234C). All current densities were normalized by the true area of
the electrodes unless otherwise stated. Polycrystalline platinum was used as a control
material.
Additionally, potentiostatic experiments at -0.35 V vs. Hg/HgO (in the case of the
ternary alloys) and at 0.05 V vs. Hg/HgO (for the binary alloy) were carried out for 4000 s in
the 5 M KOH – 1 M CH3OH solution. During these experiments, the solution was agitated
with a magnetic stirrer with an approximated rotation velocity of 700 rpm. An evaluation of
the products obtained as a result of the oxidation was done. The formation of formate was
evaluated by nuclear magnetic resonance spectroscopy (H-NMR – Agilent DD2 500 MHz).
For this analysis, 50 µL of solution was diluted in 5 mL of deuterium oxide (D2O - Cambridge
Isotope Laboratories, 99.9%). Samples were then run using a scan at 90 ° pulse (16.1 µs)
and 10 s relaxation delay, with an acquisition time of 4.5 s and spectral window of 8012 Hz.
Standards with different formate contents were prepared for calibration purposes. The
141
quantification of carbonate was done by titrating 5 mL of resulting solution with 1.2 M BaCl2
solution (ACP, 99%). To avoid the precipitation of Ba(OH)2, the pH was brought down from
ca. 15.0 to ca. 10.0 by adding 2 mL of concentrated HCl (BioShop, 36.5-38%) and a few
drops of 2 M HCl solution. The HCl was added as quickly as possible to minimize the
unnecessary exposure of the solution to air. Right after that, a solution of BaCl2 was added
drop wise while the pH was kept between 10.0 and 10.5 to avoid the dissolution of BaCO3,
which occurs at pH values around 6 [44-46]. Filtration of the obtained precipitate was done
using a 0.45 µm membrane filter (PALL) followed by a gravimetric determination. The
contribution to the carbonate content from original slight carbonation of the KOH was
measured by titrating the solution prior to the reaction.
For the electrocatalytic experiments in acidic media, selected specimens were
immersed in a solution of 0.5 M HClO4 (Alfa-Aesar, 60-62%) and 1 M methanol (Caledon,
99.8%). The HClO4/CH3OH solution was prepared by diluting the reactants with de-ionized
water with a resistivity of 18 MΩ∙cm. Prior to any measurement, the solution was de-aerated
by high-purity nitrogen purging (min. purity: 99.998%). A Gamry Reference 600TM
potentiostat was again used to perform CV between -0.45 and 0.35 V vs. MSE.
4.3 Results and discussion
The catalytic and electrocatalytic properties of nanoporous metals have received a lot
of attention in recent years, not only because of the high surface area and interconnected
nanoporosity of these structures (see Figure 4.1 as an example), but also because of the
potential synergistic effect between the alloying elements, which is particularly true for the
nanoporous structures formed on Ag-Au-Pt precursor alloys. By dealloying these ternary
142
alloys, nanoporous metal structures with distinctive characteristics and properties are
formed, as summarized in Table 4.1, where NPG was used as a benchmark material.
Figure 4.1 Interconnected ligament/pore structure formed on the Ag77:Au23 alloy after passing 5 C cm-2 at 40 °C and 0.55 V vs. MSE. The insert shows a higher magnification SEM image of the nanoporosity.
Table 4.1 Physical characteristics, residual silver and roughness factor of the nanoporous structures developed at 25 °C and 0.55 V vs. MSE in 0.77 M HClO4. Charge density: 5 C cm-2. The number in brackets represents the 95% confidence interval (CI).
a The 95% CI was calculated from at least 30 measurements for each quantity. b Obtained by BET pore size distribution analysis using the NLDFT method and considering the adsorption branch model. c The 95% CI was calculated from triplicate runs.
The thickness of the DL, for the same charge density passed, did not vary significantly
in ternary alloys; however, the layer measured in the binary alloy was thinner than in the
other alloys. This effect has to do with the amount of residual silver that remains buried in
143
the core of the ligaments, which was smaller in the binary alloy due to exposure of buried
silver to the electrolyte during coarsening in solution, driven by surface diffusion of gold [27].
The ligament size, on the other hand, decreased with the platinum content of the alloy
because the presence of platinum reduced gold surface mobility, hindering the coarsening
of the structure. In the case of the binary alloy, the average ligament size was ca. 14 nm
whereas for the alloy with 1 at.% Pt the ligament size drops to ca. 7 nm. By increasing the
amount of platinum in the precursor, the size of the ligaments kept decreasing to a value of
ca. 4 nm. The median pore size of NPG was ca. 17 nm; in the ternary alloys, by increasing
the platinum content, the median pore size decreased from ca. 12 to ca. 6 nm. The fraction
of platinum on the surface of the ligaments was 1.4, 3.0 and 6.6 % for the alloys with 1, 2
and 3 at.% Pt in the precursor respectively [27]. According with the platinum content of the
precursor, and the estimated distance between surface platinum atoms on the ligaments, it
is believed that this fraction of platinum represents the minimum platinum coverage of the
ligaments [47,48]. Therefore, we recognize that this is an important area for further
development, which could be critical for better understanding of the catalytic properties of
these nanomaterials. It is important to mention that at this temperature, the surface platinum
content is in accord with the fraction of silver removed, which is not the case for higher
dealloying temperatures. The roughness factor (see also Table 1) showed that by reducing
the ligament size of the structure, the increase in surface area was substantial.
Figure 4.2a shows the CV profiles of all the nanoporous structures in the supporting
electrolyte (5 M KOH). This concentration of the KOH was experimentally determined for the
methanol oxidation reaction after observing that at lower concentrations, the reaction was
limited by depletion of OH- owing to the extremely high nominal current density (see Figure
4.2b). As shown in this figure, NPG had an extended double-layer region between -0.9 V
and 0.25 V vs. Hg/HgO. At 0.25 V an oxidation peak started that was ascribed to the
144
formation of a monolayer of gold surface oxides [49]. A reduction peak at 0.1 V was
associated with the electrochemical reduction of those oxides. For the ternary alloys, the
oxidation of gold started at a potential 0.1 V less than that of NPG. The reduction peak was
also slightly shifted to less positive potential if compared with that for NPG. The magnitude
of this reduction peak decreased with increasing platinum content of the alloy. At ca. -0.5 V
there are also reduction peaks that were attributed to the presence of oxidized platinum in
the structure (no influence of silver was detected at this potential).
145
Figure 4.2 (a) CV profiles of the different nanoporous structures in 5 M KOH; (b) CV profiles of NPG and of the nanoporous structures formed on the alloy with 1 at.% Pt in 5 M KOH - 1 M CH3OH solution. The insert in (b) shows the CV profile of polycrystalline Pt in 5 M KOH - 1 M CH3OH solution. In (a) and (b) the current density was normalized by the geometrical area of the electrodes. The original platinum content is shown in the figures. All CV profiles were obtained at 10 mV s-1 and 25 °C.
Figure 4.2b shows the CV profiles for the methanol oxidation reactions of NPG and of
the nanostructure formed on the ternary alloy with originally 1 at.% Pt. In both cases, the
vertical axis corresponds to the nominal current density (i.e., normalized by the geometrical
area of the electrode), and the positive scan limit was fixed at 0.2 V to avoid the region in
which gold and silver oxides started forming. Both nanostructures, but particularly the
ternary one, had very high current density (the peak current in the binary structure was at
146
ca. 8 times smaller than that in the ternary nanostructure). In NPG, the rising current in the
forward scan (approximately at -0.2 V) can be ascribed to the characteristic methanol
oxidation on the surface (see Figure 4.2a for NPG). The pre-oxidation species such as Au-
OHads(1-)- ( is the charge transfer coefficient , 0 < <1) are considered by some authors to
play a governing role in the electrochemistry of Au in alkaline media [50]. Eventually, the
gradual exhaustion of Au-OHads(1-)- species slows down and eventually stops the methanol
oxidation reaction at about 0.15 V vs. Hg/HgO. This potential was very close to the potential
at which the gold oxide monolayer started forming. In the case of the ternary alloy, there
was a sharp increase in current at more negative potentials than in the binary alloy
(approximately at -0.75 V). This increase in the current density was again related to the
characteristic methanol oxidation on the surface (see Figure 4.2a for ternary alloys). The
peak potential in the forward scan was observed at -0.2 V; whereas another oxidation peak
was observed at ca. -0.3 V during the backward sweep, which represents the reaction
resuming after whatever was blocking it at higher potentials dissolved off or was reduced.
The insert in Figure 4.2b shows that a polycrystalline platinum electrode had oxidation
peaks, in the forward and backward scans, that agreed very well with those observed in the
ternary nanostructures, and with those reported elsewhere for porous platinum electrodes
[51]. Moreover, it was observed that the peak current density in the ternary nanostructure
was ca. 40 times higher than that with the platinum electrode. The catalytic response of
these ternary nanoporous metals was also significantly higher than that reported for
platinum decorated NPG under relatively similar experimental conditions [21,52].
Dealloying, by definition, dramatically increases the surface area of the material, which
depends, among other things, on the size of the ligaments. As shown in Table 4.1, the Rf
increased by increasing the platinum content of the precursor. Therefore, to account for that
effect, the current density was normalized by the true area of the electrode. Following this
147
approach, it was observed that the CV profiles of all ternary nanostructures, under the same
experimental conditions, showed the same trend (see Figure 4.2b). However, it was found
that the nanostructure formed on the alloy with 1 at.% Pt had slightly higher true methanol
oxidation current density than the other two, as observed after comparing the specific
activities (taken at -0.35 V vs. Hg/HgO) of the three ternary alloys (Figure 4.3a). We
rationalized this result based on the relative ratio of platinum and gold atoms on the surface
of the ligaments. As pointed out before, gold and platinum have been reported to display a
synergistic effect that enhances their catalytic activity towards many reactions, including
methanol electrooxidation [52-54]; however, as suggested elsewhere [28,52,55,56], in
alkaline electrolytes, where gold becomes a very active element, there is an optimum
fraction of platinum atoms surrounded by gold atoms that maximizes the yield of the
reaction. Gold atoms are believed to play an important role providing oxygenated species
(e.g., adsorption sites for OH groups and/or chemisorption of HO2- intermediates) in the
methanol oxidation process; therefore, this relative ratio between elements represents a
compromise balance of activation of platinum sites and promotion of gold sites by
adsorption of OH groups. We are not suggesting, of course, that the nanoporous structure
with originally 1 at.% Pt, represents that optimum composition; however, having most of the
platinum atoms surrounded by gold atoms, in a highly porous structure, could have a
significant role in the observed behaviour. Mott and coworkers [28] predicted, by DFT
calculations, that a bifunctional electrocatalytic property may be operative in the case of Au-
Pt nanoparticles in alkaline electrolyte, where adsorption of CO and OH- on gold and
dehydrogenation of methanol on platinum sites are involved. In acidic electrolytes, on the
other hand, the most active structure was the one with higher platinum content (see Section
4.3.2 below).
148
Figure 4.3 (a) Summary of specific activities of the ternary alloy structures for the CH3OH oxidation reaction at -0.35 V vs. Hg/HgO; the vertical axis is the current density per true area of the electrodes. (b) Concentration of carbonate/formate produced after potentiostatic oxidation for 4000 s at -0.35 V vs. Hg/HgO; during this time, the solution was agitated with a magnetic stirrer at ca. 700 rpm. In all cases, a 5 M KOH - 1 M CH3OH solution was used. The error bars represent 95 % CI obtained by triplicate runs.
It has been suggested that among the three likely product of methanol oxidation by
gold in alkaline media (i.e., formaldehyde, formate and carbonate), formate is the most
probable [50,57]; whereas carbonate tends to be the dominant product when platinum-
based catalysts are used [51,58]. To identify the oxidation products formed on these
nanoporous metals, potentiostatic experiments at -0.35 V vs. Hg/HgO were carried out for
4000 s. The quantification of formate by H-NMR is shown in Figure 4.3b. The concentration
149
of formate decreased with increasing platinum content of the precursor. No indication of
formaldehyde has been found; nevertheless, disproportionation of formaldehyde in highly
basic media, according with Cannizzaro’s reaction, would occur readily under the current
experimental conditions [59]. Carbonate, on the other hand, could easily be determined by
titration with barium solution. As shown also in Figure 4.3b, the concentration of carbonate
produced during the oxidation increased with increasing platinum content of the alloys,
which could be a consequence of the higher platinum coverage on the surface of the
ligaments. These results suggest that the ratio between the oxidation products could be
modified by changing the platinum content of the structure. The low amount of carbonation
that occurred during the titration procedure was demonstrated by the nearly zero carbonate
analysis obtained for the binary alloy (not shown in Figure 4.3b). The overall current
efficiency for the nanostructures with originally 1, 2 and 3 at.% was 85, 94 and 98 %
respectively, indicating that no significant losses occurred during the electrocatalytic
process.
The effects of different potential scan rates, different agitation speed of the solution
(by a magnetic stirrer), different potential scan limits and methanol concentrations were
assessed for all ternary structures. NPG was not considered further as ternary alloys were
always more catalytic. Figure 4.4 shows the effect of those parameters for the alloy with 1
at. % Pt; similar trends were observed for the other ternary alloys. As shown in Figure 4.4a,
the oxidation current was dependent on the potential scan rate (); in fact, the peak current
was linear with 0.5 for all nanostructures. This clearly indicated a diffusion controlled
process for methanol oxidation in the bulk solution boundary layer. The oxidation current
density associated with the half peak potential (i.e., -0.4 V vs. Hg/HgO) is nearly linear with
0.5 for the alloys with 2 and 3 at.% Pt, but independent of the scan rate in the case of the
lower platinum content alloy (see Figure 4.4a). In the case of the different agitation speeds
150
(i.e., between ca. 200 rpm and 970 rpm) it was observed that the peak current increased
with the agitation speed. For example, in the case of the ternary alloy with 1 at.% Pt (Figure
4.4b), the peak current increased from ca. 200 µA cmtrue (no agitation) to 550 µA cmtrue
at
800 rpm (at 970 rpm there were no further changes with respect to 800 rpm). These
changes in the peak current were entirely related to the diffusion limitation at the top surface
of the catalyst. No changes were found in the oxidation current below ca. -0.3 V. Similar
trends were observed for the other two ternary alloys (results not shown here). In terms of
the effect of the scan limit (Figure 4.4c), it was clear that the oxidation peak in the reverse
scan was first observed when the scan limit was 0.2 V; at less positive limits, no oxidation
peak was shown, but instead a hysteresis was found. This hysteresis could be associated to
the blocking of active sites during that stage of the oxidation process. At more positive scan
limit (i.e., 0.4 V), two main features were observed in the reverse scan: a smaller oxidation
peak at ca. -0.4 V and a cathodic peak at ca. 0.1 V. This cathodic peak was related to the
reduction of gold oxide formed on the anodic scan, which also confirmed that gold surface
oxide formation occurs at potentials higher than 0.2 V. In terms of the effect of the methanol
concentration (Figure 4.4d), it was observed that the oxidation current increased linearly
with the increasing concentration of methanol; moreover, it was observed that the peak
potential moved to less negative potentials while increasing the methanol concentration.
151
Figure 4.4 CV profiles for the electrooxidation of CH3OH solution in 5 M KOH on the nanoporous structure formed on the ternary structure developed on the alloy with 1 at.% Pt: (a) effect of the scan rates, (b) agitation speeds, (c) scan limit and (d) methanol concentration. For figures (a) to (c), the methanol concentration was 1 M; for figures (b) to (d), the scan rate was 10 mV s-1. Temperature: 25 °C. Details about the scan rates, agitation speeds, scan limit and methanol concentrations are given in the figures. In all cases, the current was normalized by the true area of the electrodes.
One method to test the electrochemical performance of these nanoporous metals was
by repeated potential cycling. Figure 4.5 shows the effect of different cycles in the ternary
structure with originally 1 at.% platinum showing a very stable activity towards methanol
oxidation, i.e., the specific activity at -0.35 V decreased from 192 µA cmtrue to 130 µA cmtrue
after 40 continuous cycles. During the backward sweep the oxidation peak height was
reduced with subsequent scans, which could be associated with small changes in the
nanoporous structure. Similar behaviours were observed in the other ternary structures. The
binary alloy (not shown here) showed an 80% reduction in the peak current after 40 cycles.
152
Figure 4.5 CV profiles for the electrooxidation of CH3OH solution in 5 M KOH on the nanoporous structure formed on the alloy with 1 at.% platinum. In all cases the scan rate was 10 mV s-1 and the temperature 25 °C. Details about the number of scan cycles are indicated in the figures.
4.3.1 Effect of dealloying parameters and tunability of the resulting nanoporous
structures
One of the main advantages of nanoporous metals is that they are highly tunable. By
changing the composition of the precursor and/or dealloying conditions, changes in the
ligament size, the surface composition (i.e., fraction of platinum exposed on the surface of
the ligaments), and other characteristics were observed [27]. The effect of the dealloying
temperature and charge density are some of the characteristics of the dealloyed layer that
are summarized in Figure 4.6. By increasing the dealloying temperature, the rate of gold
surface diffusion increased, accelerating the coarsening of the ligaments (Figure 4.6a). This
agreed well with the literature associated with the relaxation of roughened gold surfaces [60-
153
62]. The average ligament width in NPG changed from ca. 14 nm at 25 °C to almost 28 nm
at 60 °C. In ternary alloys, a much smaller increase of approximately 10% was found for the
nanostructure with originally 1 at. % Pt (from ca. 6.8 nm at 25 °C to 7.4 nm at 60 °C).
Variations in the dealloying temperature also induced changes in the depth of the layer
(insert in Figure 4.6a); in general, the thickness of the layer, for a constant charge density,
increased with temperature on the ternary alloys, whereas in the binary alloy it tended to
decrease. These tendencies were related to the fraction of silver retained in the layer (not
shown here but discussed in [27]). Moreover, by increasing the dealloying temperature, the
fraction of platinum atoms on the surface of the ligaments increased, as it is shown in Figure
4.6b. By changing the dealloying temperature from 10 °C to 60 °C, the fractional coverage
of platinum atoms increased for all ternary structures, doubling the platinum coverage at the
upper temperature. This increase in the platinum coverage on the surface could be
associated with the dealloying mechanism itself and/or other processes that were favored
under the experimental conditions used here (e.g., preferential adsorption of OH groups on
platinum atoms as suggested before for multimetallic nanoparticles [63]).
154
Figure 4.6 Effect of the dealloying temperature and dealloying charge density on the main characteristics of the resulting nanoporous structures: (a) effect of dealloying temperature on the size of the ligaments; the insert in this figure shows the average thickness of the DL; (b) fraction of platinum on the surface of the ligaments after dealloying at different temperatures; (c) ligament size of the different structures after passing different charge densities; the insert shows the average thickness of the DL; (d) fraction of platinum on the surface of the ligaments after passing different charges. Details about the dealloying temperature are indicated in the figures (b) and (d). The error bars represent 95 % CI obtained by triplicate runs.
Changing the dealloying time (for a given potential) changed the charge density, which
is directly proportional to the amount of silver removed from the alloy. Moreover, the
dealloying time affects the porosity of the structure, because through extended exposure,
the ligaments eventually coarsen. Figure 4.6c shows the changes in ligament size for all the
alloys with respect to charge density. The average ligament width in the case of the binary
alloy changed from ca. 12 nm (while passing 2.5 C cm-2) to almost 17 nm when the charge
density increased to 20 C cm-2. The presence of platinum clearly reduced the coarsening
effect; for all ternary alloys, the ligament widths were below 10 nm for all the charge
155
densities studied. The thickness of the layer increased with the charge density and the
platinum content (insert in Figure 4.6c). The average retained silver tended to decrease
when the dealloying charge increased, with the binary alloy showing the lowest silver
content in the layer; however, this effect saturated and the residual silver never decreased
beyond a certain point (results not shown here). The platinum coverage of the surface of the
ligaments tended also to increase with the charge density (Figure 4.6d); however no
obvious difference was observed between samples in which the dealloying charges were
2.5 and 5 C cm-2; at higher charge densities (i.e., 12.5 and 20 C cm-2) higher coverage of
platinum was detected. Once again, this effect could be related to the dealloying mechanism
itself, and/or with the extended dealloying time, i.e., longer exposure of the dealloyed layer
to the electrolyte, where preferential adsorption of OH groups on platinum might induce
platinum to segregate to the surface, either by surface diffusion mechanism or simple place
exchange between atoms.
All these characteristics had an impact in the electrocatalytic response of the
nanoporous structures. Figure 4.7a shows the specific activity (taken from cyclic
voltammograms at -0.35 V vs. Hg/HgO – not shown here) for the three ternary
nanostructures developed under different experimental conditions (i.e., temperature, charge
density passed). As observed, the current density significantly increased by decreasing the
dealloying charge density. For the experimental conditions reported here, the highest
specific activity was obtained for structures where 2.5 C cm-2 were passed; conversely, the
sample in which 20 C cm-2 were removed showed the lowest specific current density.
Initially, it was assumed that thicker layer (i.e., higher charge densities) could give higher
current densities; however, the abovementioned trend suggested otherwise. In fact, these
results also suggested that the oxidation reaction might happen mostly in the vicinity of the
top surface of the structure. It is important to mention that the effects of mass transport
156
limitation within the layer are not negligible, although they are smaller that might be
assumed since the effective diffusivity within the layer is lower than that for the bulk, but not
by orders of magnitude. The concentration of carbonate produced by the ternary structures
with respect to the charge density passed is shown in Figure 4.7b. After removing 5 C cm-2,
the carbonate concentration was smaller than that after passing 2.5 C cm-2; however, when
passing higher charge densities (i.e., 12.5 and 20 C cm-2); a relatively constant
concentration of carbonate was obtained, with an average value of 1.5 mg L-1 cmtrue . This
effect was particularly clear in the structures with originally 2 and 4 at.% Pt. These results
suggested that on nanostructures with thick DLs, the concentration of carbonate in solution
was small if compared with that in thinner layers, which could indicate that the carbonate
formation was counteracted by the thickness of the DL. At this point however, the existence
of any mass transfer limitations or partially blockage of the pores in thick DLs (20 µm and
thicker) cannot be ruled out. The average current efficiency for all ternary nanostructures
when 2.5 C cm-2 were removed was ca. 65%; whereas for the nanostructures when 20 C
cm-2 were removed was ca. 80%. In all cases, carbonate was considered as the only
product of the oxidation.
157
Figure 4.7 (a) Summary of specific activities for the CH3OH oxidation reaction of the ternary alloy nanostructures developed under different conditions; the vertical axis is the current density per true area of the electrodes. (b) Concentration of carbonate produced on nanoporous structures dealloyed after passing different charge densities after potentiostatic oxidation for 4000 s; during this time, the solution was agitated with a magnetic stirrer at ca. 700 rpm. The insert in (b) corresponds to concentration of carbonate produced on nanostructures dealloyed at different temperatures. In all cases, the potential was fixed at -0.35 V vs. Hg/HgO. The different dealloying conditions are shown in the figures. The error bars represent 95 % CI obtained by triplicate runs.
The effect of the dealloying temperature was studied by comparing the electrocatalytic
response of nanostructures developed at different temperatures but at constant dealloying
charge density (i.e., 5 C cm-2 as shown also in Figure 4.7a). By increasing the temperature
of the electrolyte, the specific activity of the nanostructures tended to increase. The
158
concentration of carbonate in solution (see insert in Figure 4.7b) increased by increasing the
dealloying temperature, which could be associated with the higher platinum coverage of the
structures (Figure 4.6b). The current efficiency for the ternary nanostructures developed at
60°C was 85, 93 and 98% for the alloys with 1, 2 and 3 at.% Pt respectively. Once again, for
this analysis carbonate considered the only product of the oxidation.
Besides the effect of the abovementioned dealloying parameters, the effect of
platinum enrichment on the surface of the ligaments (i.e., induced surface segregation of
platinum) had a role in the catalytic response of the resulting structures. As shown in Figure
4.8a, after exposure of the as-dealloyed structures to 425 °C in the presence of laboratory
air, the ligament size increased in all alloys (in the case of the structure formed on the alloy
with 1 at. % Pt, the ligament size increased from ca. 7 nm right after dealloying to 37 nm
after annealing); nevertheless, the nanostructure developed on the alloy with 4 at.% Pt had
the lowest increment in ligament size. More importantly, by exposing the as-dealloyed
structures to air at moderately elevated temperatures, the fraction of platinum on the surface
of the structures increased (see also Figure 4.8a) if compared with the results of as-
dealloyed specimens (minimum coverage) [37]. Figure 4.8b shows a comparison between
the CV profiles of the nanostructures formed on the 1 at.% alloy before and after exposure
to 425 °C. In both cases, the vertical axis corresponds to the nominal current density. Even
after exposure to this moderate temperature, the electrode showed a very high activity, e.g.,
at -0.3 V the difference in the nominal current density was only 20% with respect to the
nominal current in as-dealloyed samples. However, to account for the effect of surface area,
the specific activity (normalized by the true area of the electrodes) was plotted in Figure
4.8c, showing that inducing segregation of platinum induced a very significant increase in
the activity of the electrocatalyst. The nanostructure developed on the alloy with 1 at.% Pt
displayed the highest increment (ca. 400%) with respect to the as-dealloyed nanostructure.
159
The other nanostructures also showed higher catalytic response after segregation than the
as-dealloyed samples, although the activity decreased by increasing the platinum content of
the precursor. As before, we could rationalize this finding based on the relative ratio
between platinum and gold on the surface of the ligaments. Moreover, it is important to
mention that the structure formed on the alloy with 1 at.% Pt was the one that showed more
traces of silver on the surface than the other two ternary structures [37]. This silver comes
from the core of the ligaments after coarsening occurs. Silver could change the catalytic
behaviour of the nanostructure by providing additional oxygenated species that interact with
methanol species adsorbed on the surface [64,65]. For instance, it has been reported that
silver significantly enhances the catalytic activity shown by NPG towards gas-phase
methanol oxidation, promoting the total oxidation all the way to CO2 [65].
The concentration of carbonate produced by the nanostructures after platinum
segregated to the surface is shown in Figure 4.8d. The concentration of carbonate was
basically the same for all structures (ca. 7.5 mg L-1 cmtrue ), which means that for the
structure formed on the alloy with 1 at.% Pt (i.e., ca. 10 % of the surface atoms were
platinum) there was an increase of ca. 300 % with respect to the as-dealloyed structure;
whereas for the structure formed on the alloy with 4 at.% Pt, an increase of ca. 60 % was
observed with respect to the as-dealloyed structure. However, the current efficiency
(considering carbonate as the only product of the oxidation) was 20, 62 and 80% for the
nanostructures with originally 1, 2 and 3 at.%, which suggests that a significant amount of
formate was produced under this experimental conditions, especially in the case of the
lowest platinum content alloy. It is believed that the interaction between gold and platinum
surface atoms with the silver atoms exposed to the surface might be responsible for this
trend.
160
Figure 4.8 (a) Ligament size and fraction of platinum on the surface of the ligaments for all ternary structures after exposure to 425 °C for 2 h in the presence of laboratory air; (b) CV profiles in 5 M KOH - 1 M CH3OH solution for the nanoporous structure formed on the alloy with 1 at.% Pt structures before and after segregation of Pt, the CV profiles were obtained at 10 mV s-1 and 25 °C and the current density was normalized by the geometrical area of the electrodes; (c) Summary of specific activities of the ternary alloy nanostructures for the CH3OH oxidation reaction at -0.35 V vs. Hg/HgO; the vertical axis is the current density per true area of the electrodes; (d) Concentration of carbonate produced after potentiostatic oxidation for 4000 s at -0.35 V vs. Hg/HgO; during this time, the solution was agitated with a magnetic stirrer at ca. 700 rpm. The error bars represent 95 % CI obtained by triplicate runs.
4.3.2 Methanol electro-oxidation in acidic media
To better understand the electrocatalytic properties of these novel nanoporous metals,
a preliminary assessment of their catalytic response in an acidic electrolyte has been
performed. Figure 4.9a shows the CV profiles of all the nanoporous structures in 0.5 M
HClO4. As for the basic solutions, the concentration of the supporting electrolyte was also
experimentally determined choosing the concentration at which the highest current density
161
was observed (results not shown here). As can be seen in this figure, the double-layer
region in NPG extended from -0.45 V to 0.10 V vs. MSE. At 0.10 V an increase in the
current density was observed, which could be associated with the beginning of the oxidation
of gold. No reduction peaks were observed in the range of potentials under investigation. At
higher scan limits, an oxidation peak, with the subsequent reduction peak, were associated
with gold. For the ternary alloys, reversible waves caused by hydrogen
adsorption/desorption at potentials lower than 0.3 V were observed. An increase in the
oxidation current was detected for all ternary alloys at potentials higher than 0.10 V, with the
alloy with 3 at.% Pt showing the increase in current density at slightly more negative
potentials than the other two ternary alloys. A characteristic reduction peak around 0 V was
associated with the reduction of platinum oxides that were formed during the anodic scan
[51,66].
Figure 4.9b shows the CV profiles for the methanol oxidation reactions of all
nanostructures in acid. The positive scan limit was fixed at 0.35 V to minimize the impact of
surface oxides, and evaluate the catalytic response of these nanostructures mostly in a
region below the empirical critical potential of these alloys (i.e., ca. 0.35 V in 0.77 M HClO4)
[27]. In NPG, there was basically no catalytic response in this region of potentials; at higher
potentials however, it has been reported that gold becomes a relatively active catalyst for
methanol oxidation [57]. In the case of the ternary alloys, there was an obvious increase in
current at -0.10 V; this increase in the current density was related to the characteristic
methanol oxidation on the surface (see Figure 4.9a). The peak potential in the case of the
nanostructure formed on the alloy with 1 at.% Pt was located at ca. 0.23 V; whereas in the
case of the nanostructure formed on the 4 at.% Pt alloy, the peak potential shifted to more
positive potential (ca. 0.32 V). The peak current was ca. 2.5 times higher in the 3 at.% Pt
alloy than in the 1 at.% Pt. In contrast with the results obtained in alkaline electrolyte, the
162
highest platinum content nanostructure was the most active catalyst; nevertheless, it is clear
that these nanostructures displayed higher electrocatalytic response in alkaline media. This
result agreed well with the observations made on supported gold-platinum nanoparticles
when evaluated as electrocatalysts for methanol oxidation in acidic electrolyte, where high
contents of platinum were required to maximize the activity of the catalyst [28,55,56].
Figure 4.9 (a) CV profiles of the different nanoporous structures in 0.5 M HClO4; (b) CV profiles of the nanoporous structures in 0.5 M HClO4 - 1 M CH3OH solution. The insert in (b) corresponds to the CV profiles in 0.5 M HClO4 - 1 M CH3OH solution after segregation of platinum at 425 °C in laboratory air for 2 h. The original platinum composition is shown in (a). All CV profiles were obtained at 10 mV s-1. The temperature in all cases was 25 °C.
163
As was reported at the end of Section 4.3.1, by exposing the as-dealloyed structures
to 425 °C in the presence of air, there was a clear tendency of platinum to segregate to the
surface of the ligaments; therefore, it was an obvious step to analyze the catalytic response
of these tuned structures towards methanol oxidation in HClO4 supporting electrolyte. The
insert in Figure 4.9b shows the CV profiles of all ternary structures in a solution containing
methanol. As can be seen, the structure formed on Ag77:Au20:Pt3 displayed higher specific
activity than that in the as-dealloyed sample (e.g., at 0.2 V, the current density in the as-
annealed sample was 40% higher than that in the as-dealloyed electrode). The peak
current, on the other hand, slightly decreased with the heat treatment. In the backward scan,
the sample after segregation had a well-defined oxidation peak, which was not clearly
observed in the sample before the heat treatment. Increasing the fraction of platinum on the
surface from ca. 6 to ca. 30 % did improve the electrocatalytic response of the
nanostructure, even though the surface area slightly decreases (i.e., ligament size
increased). In the other two nanostructures, a decrease in the electrocatalytic activity was
observed, with the bigger decay in the one formed on the alloy with 1 at.% Pt.
4.4 Conclusions
(a) Novel nanoporous structures have been formed by electrochemically removing silver
(i.e., by dealloying) from Ag-Au-Pt alloys with platinum contents of 1, 2 and 3 at. %. In
these structures, the surface is mostly covered by the more-noble elements (i.e., gold
and platinum) through the whole thickness of the DL.
(b) The characteristics of the resulting nanoporous metals depend on the platinum content
of the precursor. By increasing the platinum concentration, the ligament size decreases
and the platinum coverage on the surface of the ligaments increases. Moreover, by
having gold and platinum on the surface of the nanostructure, the catalytic response
164
towards methanol oxidation is significantly enhanced showing an onset of the reaction
at more negative potentials, higher current densities and longer stability and
electrocatalytic activity.
(c) Based on the original platinum content of the ternary alloy precursors and the estimated
distance between platinum atoms in the nanoporous material, it is believed that the
fraction of platinum obtained by UPD of hydrogen represents the minimum platinum
coverage of the ligaments. This clearly becomes an important area for further
development to better understand the catalytic properties of these and other
nanomaterials. Low energy ion scattering (LEIS) and X-ray photoelectron spectroscopy
(XPS) could be critical tools to understand this phenomenon.
(d) Among all the three ternary nanostructures, the one developed on the alloy with 1 at.%
Pt shows the highest activity towards methanol electrooxidation in alkaline electrolyte.
Gold and platinum clearly display a remarkable synergistic effect, however, the ratio
gold to platinum seems to play an important role in alkaline electrolytes.
(e) In alkaline media, formate and carbonate were identified as the main products of the
oxidation reaction. In the case of NPG, mostly formate was detected (the amount of
carbonate formed during the reaction was minimal), whereas a combination of the two
products was detected when the ternary nanostructures were used. More importantly,
by increasing the platinum content of the ternary precursor, the ratio of the reaction
products can be modified.
(f) By changing dealloying parameters like temperature and charge density passed, the
characteristics of the resulting nanoporous structures change (e.g., platinum coverage
on the surface and ligament size). Moreover, the catalytic performance towards
methanol oxidation also changes. By increasing the dealloying temperature, the specific
activity of all nanostructures increases; whereas by increasing the charge density, the
specific activity decreases for all structures. The concentration of carbonate produced
165
increases also with the dealloying temperature and decreases with an increase in the
charge density.
(g) By inducing segregation of platinum to the surface of the ligaments (after exposure to
425 °C in the presence of air), there is a significant increase in the current density in all
ternary structures in alkaline media, especially in the one formed on the alloy with 1
at.% Pt.
(h) In the presence of an acidic electrolyte (HClO4), the highest platinum content alloy is the
one showing the highest specific activity, in contrast with the tendency observed in
alkaline electrolyte; nonetheless, these nanostructures displayed higher electrocatalytic
abilities in alkaline electrolyte.
4.5 Acknowledgements
The authors wish to thank D. Burns and J. A. Tang, from the Nuclear Magnetic
Resonance Facility at the Department of Chemistry - University of Toronto, for their help in
the performance of the NMR experiments. The authors wish also to acknowledge the
financial support from Natural Sciences and Engineering Research Council (NSERC) of
Canada.
4.6 References
1. M. Haruta, T. Kobayashi, H. Sano and N. Yamada. (1987). Novel gold catalysts for the
oxidation of carbon monoxide at a temperature far below 0 degrees C, Chem. Lett.,
16, 405.
2. G. C. Bond, C. Louis and D. T. Thompson, Catalysis by gold, Imperial College Press,
London (2006).
166
3. R. Meyer, C. Lemire, S. K. Shaikhutdinov and H.-J. Freund. (2004). Surface chemistry
of catalysis by gold, Gold Bull., 37, 72.
4. N. Dimitratos, J. A. Lopez-Sanchez, D. Morgan, A. Carley, L. Prati and G. J.
Hutchings. (2007). Solvent free liquid phase oxidation of benzyl alcohol using Au
supported catalysts prepared using a sol immobilization technique, Catal. Today, 122,
317.
5. C. Della Pina, E. Falletta and M. Rossi. (2008). Highly selective oxidation of benzyl
alcohol to benzaldehyde catalyzed by bimetallic gold-copper catalyst, J. Catal., 260,
384.
6. A. Abd El-Moemen, G. Kučerová and R. J. Behm. (2010). Influence of H2, CO2 and
H2O on the activity and deactivation behavior of Au/CeO2 catalysts in the water gas
shift reaction at 300 °C, Appl. Catal. B, 95, 57.
7. N. Dimitratos and L. Prati. (2005). Gold based bimetallic catalysts for liquid phase
applications, Gold Bull., 38, 73.
8. J. S. McPherson and D. T. Thompson. (2009). Selectivity of gold catalysts for
applications of commercial interest, Top. Catal., 52, 743.
9. A. Corma and H. Garcia. (2008). Supported gold nanoparticles as catalysts for organic
reactions, Chem. Soc. Rev., 37, 2096.
10. J. A. Moulijn, A. E. van Diepen and F. Kapteijn. (2001). Catalyst deactivation: is it
predictable? What to do?, Appl. Catal. A, 212, 3.
11. C. T. Campbell, S. C. Parker and D. E. Starr. (2002). The effect of size-dependent
nanoparticle energetics on catalyst sintering, Science, 298, 811.
12. K. Koga, T. Ikeshoji and K. Sugawara. (2004). Size- and temperature-dependent
structural transitions in gold nanoparticles, Phys. Rev. Lett., 92, 115507.
13. Y. C. Yeh, B. Creran and V. M. Rotello. (2012). Gold nanoparticles: preparation,
properties, and applications in bionanotechnology, Nanoscale, 4, 1871.
167
14. M. C. Daniel and D. Astruc. (2004). Gold nanoparticles: Assembly, supramolecular
chemistry, quantum-size-related properties, and applications toward biology, catalysis,
and nanotechnology, Chem. Rev., 104, 293.
15. M. Haruta. (2002). Catalysis of gold nanoparticles deposited on metal oxides, Cattech,
6, 102.
16. M. M. Schubert, S. Hackenberg, A. C. van Veen, M. Muhler, V. Plzak and R. J. Behm.
(2001). CO oxidation over supported gold catalysts-"inert" and "active" support
materials and their role for the oxygen supply during reaction, J. Catal., 197, 113.
17. M. Comotti, W. C. Li, B. Spliethoff and F. Schuth. (2006). Support effect in high activity
gold catalysts for CO oxidation, J. Am. Chem. Soc., 128, 917.
18. T. Fujita, P. F. Guan, K. McKenna, X. Y. Lang, A. Hirata, L. Zhang, T. Tokunaga, S.
Arai, Y. Yamamoto, N. Tanaka, Y. Ishikawa, N. Asao, Y. Yamamoto, J. Erlebacher
and M. W. Chen. (2012). Atomic origins of the high catalytic activity of nanoporous
gold, Nat. Mater., 11, 775.
19. J. Biener, A. Wittstock, T. F. Baumann, J. Weissmüller, M. Bäumer and A. V. Hamza.
(2009). Surface chemistry in nanoscale materials, Materials, 2, 2404.
20. M. Haruta. (2007). New generation of gold catalysts: nanoporous foams and tubes—Is
64. A. Wittstock, B. Neumann, A. Schaefer, K. Dumbuya, C. Kübel, M. M. Biener, V.
Zielasek, H.-P. Steinrück, J. M. Gottfried, J. Biener, A. Hamza and M. Baümer. (2009).
Nanoporous Au: an unsupported pure gold catalyst?, J. Phys. Chem. C, 113, 5593.
65. A. Wittstock, V. Zielasek, J. Biener, C. M. Friend and M. Bäumer. (2010). Nanoporous
gold catalysts for selective gas-phase oxidative coupling of methanol at low
temperature, Science, 327, 319.
66. A. V. Tripkovic, S. L. Gojkovic, K. D. Popovic and J. D. Lovic. (2006). Methanol
oxidation at platinum electrodes in acid solution: comparison between model and real
catalysts, J. Serb. Chem. Soc., 71, 1333.
4 A version of this chapter has been submitted for publication. Vega, A. A., and Newman, R. C. Electro-oxidation of ethanol on highly porous nanostructures obtained by dealloying of binary and ternary noble-metal alloys.
173
Chapter 5. Electro-oxidation of Ethanol on Highly Porous
Nanostructures Obtained by Dealloying of Binary and
Ternary Noble-metal Alloys4
5.1 Introduction
Numerous studies have dealt with the electro-oxidation of low molecular weight
alcohols, like methanol and ethanol, with the ultimate goal of using them in fuel cells [1-7].
Amongst the possible electrocatalysts, platinum seems to be the most active metal for
dissociative adsorption of most low molecular weight alcohols (e.g., methanol), although it is
well-known that platinum is readily poisoned by strongly adsorbed species; this
disadvantage of platinum has forced the scientific community to shift to binary and/or ternary
platinum-based electrocatalysts (e.g., Pt-Ru, Pt-Ru-W) to minimize the poisoning effect [8-
12]. Gold, on the other hand, has been generally recognized as a poor catalyst; however, it
was recently reported that when this element is subdivided down to the nanoscale, it
becomes a very reactive material [13-15]. In addition, gold has proven to have higher
resistance to poisoning than platinum [16]. Gold electrocatalysis has been mainly studied
using nanoparticles, typically on a support [17-19]; however, nanoparticles may suffer from
shape stability issues and sintering over time, which reduces their active surface area and
with that their functionality [20,21]. Another alternative is to use nanoporous gold (NPG),
which is typically formed by dealloying Ag-Au alloys. During dealloying, one starts with a
monolithic alloy in any form (e.g., bulk or thin film) and selectively dissolves the less-noble
element from the alloy (silver in the case of Ag-Au alloys) leaving an interconnected
ligament/pore structure with a very good control of porosity and size [22-24]. Clearly, NPG
174
has a desirable structure for catalysis, not only because of its high surface area, but also
because it does not require a support.
The catalytic/electrocatalytic properties of NPG, and of gold nanoparticles, are related
to the high density of atomic steps and kinks on the surface, which act as active sites for
catalysis [25]. Moreover, the residual silver in NPG (mostly retained in the core of the
ligaments) could play a significant role in its catalytic abilities, not only helping during the
adsorption/dissociation of molecules during chemical/electrochemical reactions, but also
stabilizing the surface steps and kinks [25-27]. Unfortunately, NPG is prone to coarsening of
the structure by the rapid surface diffusion kinetics of gold along the alloy/electrolyte
interface, which reduces its functionality due to loss of surface area [28,29]. Adding small
amounts of platinum to the Ag-Au master alloy efficiently suppresses the coarsening of the
structure, thanks to the lesser surface diffusivity of platinum with respect to gold [30,31]. The
presence of platinum and gold on the surface of the nanostructure may offer unique catalytic
properties thanks to the synergy between these two elements [32-39]. Furthermore, the
presence of gold, and its strong interaction with oxygen species, may also reduce the
poisoning effect of platinum [32,40].
The main objective of the present study is to evaluate the electrocatalytic abilities of
nanoporous metals towards ethanol electro-oxidation in alkaline electrolyte. Specifically,
nanoporous structures formed on Ag-Au and on Ag-Au-Pt alloys, with a systematic variation
in the platinum content and the same silver content as in the binary alloy, were studied. By
selectively removing some of the silver from the alloy precursors, porous nanostructures
were formed with well-controlled length scale and morphologies. The effect of the platinum-
enriched nanoporous structures, obtained by adsorbate-induced surface segregation
mechanism, towards the electro-oxidation of ethanol was also evaluated.
175
5.2 Experimental
5.2.1 Materials, dealloying procedures and nanoporous characterization
Ag-Au alloy with 77 at.% silver was obtained from as cold-rolled 200 m sheet from
Goodfellow Metals, Cambridge, UK. Ag-Au-Pt alloys with platinum content of 1, 2 and 3
at.% and 77 at.% silver were obtained as cold-rolled sheet from Ames National Laboratory –
US Department of Energy, Iowa, USA. For all the experiments, specimens were cut into
strips of approximately 4 mm by 10 mm before annealing at 900 °C for 5 h in the case of the
binary alloy and at 975 ºC for 15 h in the case of the ternary alloys. In all cases, the
annealing was performed in H2-Ar atmosphere (2.5 % H2; balance Ar). All the specimens
were used in the as-annealed condition without any further surface preparation. Each strip
of alloy was attached to a copper wire for electrical connection, using lacquer (SPI
Miccroshield) to mask the junction and the isolated copper wire. In all cases, dealloying was
done from both sides of the sample.
Dealloying was carried out potentiostatically in a three-electrode electrochemical cell,
with platinum coil as the counter electrode and mercury/mercurous sulphate (MSE, 0.64 V
vs. SHE) as the reference electrode. The reference electrode was housed in a separate
compartment and connected to the electrochemical cell via a Luggin probe. In all cases
0.77 M HClO4 solution, prepared from Analar grade HClO4 (Alfa-Aesar, 62%), was used. All
solutions were prepared with 18 MΩ∙cm de-ionized water and de-aerated by high-purity
nitrogen purging (min. purity: 99.998%). The electrochemistry was performed using a Gamry
Reference 600TM potentiostat. All specimens were dealloyed at 25 °C, passing an anodic
charge density of 5 C cm-2 at 0.55 V vs. MSE. For some selected samples, the fraction of
platinum exposed on the surface of the ligaments was tuned by the adsorbate-induce
surface segregation phenomenon at 425 °C in the presence of laboratory air. For that
176
purpose, the connecting wire was removed immediately after dealloying and the specimens
were thoroughly rinsed with de-ionized water and dried with air before exposed them to the
target temperature. This phenomenon has been previously reported by the authors [41].
A detailed description of characterization of these nanoporous structures has been
given elsewhere [30]. For the microstructural characterization (e.g., ligament size),
dealloyed samples were manually broken under tension in air and the fracture surface was
photographed using a scanning electron microscope (SEM – Hitachi S-5200) with an
accelerating voltage of 20 kV. The SEM pictures were later analyzed with the Image Tool
software (provided by The University of Texas Health Science Centre in San Antonio, USA)
to accurately determine the ligament size (here equivalent to the average width
perpendicular to the ligament edge). Transmission electron microscope (TEM – Hitachi HD-
2000) was also used for the nanoporous characterization; for this purpose, selected
samples were embedded in low viscosity resin (SPI-PON 812) and untramicrotomed to 30 –
50 nm thickness using Leica UltraCut R instrument equipped with a diamond knife. An
accelerating voltage of 200 kV was used.
The true area of the electrodes was estimated by means of voltammetric profiles in the
double layer region of potentials (i.e., -0.24 to 0.05 V vs. MSE) at different scan rates in 1 M
HClO4 solution [42-43]. In all cases, 28 µF cm-2 was considered the baseline double-layer
capacitance for polycrystalline gold and platinum [42]. This assumption proved to be valid
after comparing the results with Brunauer-Emmett-Teller (BET) surface area and impedance
measurements [30].
The equivalent area of platinum on the surface of the ligaments was estimated by
underpotential deposition (UPD) of hydrogen [44-45]. All specimens were immersed in 1 M
H2SO4 solution (EMD, 95-98%) in a three-electrode cell with a MSE as a reference
177
electrode, a platinum wire as counter electrode and the dealloyed specimen as a working
electrode. The solution was de-aerated for approximately 15 min before the experiment.
Cyclic voltammetry (CV) curves were obtained at 25 °C between -0.63 and 0 V vs. MSE, at
a scan rate of 20 mV s-1. The equivalent area of platinum on the surface of the structure was
calculated by integrating the hydrogen adsorption/desorption regions to obtain the charge
related with the formation of a hydrogen monolayer, assuming that the charge associated
with the monolayer formation in polycrystalline platinum was 210 µC cm-2 Pt [46-47]. The
fraction of platinum on the surface of the resulting structure was estimated by dividing the
equivalent area of exposed platinum by the estimated true area of the electrode. The
roughness factor (Rf), as an indication of the developed surface area during the dealloying
process, was determined by dividing the true area of the electrode by its geometrical area.
5.2.2 Electro-oxidation of ethanol
In all cases dealloyed specimens were immersed in 4 M KOH (Aldrich, 90%) - 1 M
ethanol (Aldrich, ≥ 99.5%) solution. The KOH/C2H5OH solution was prepared by
diluting/dissolving the reactants with de-ionized water with a resistivity of 18 MΩ∙cm. Prior to
any measurement, the solution was de-aerated by high-purity nitrogen purging (min. purity:
99.998%). A Gamry Reference 600TM potentiostat was used to perform CV between -0.9
and 0.2 V vs. mercury/mercury oxide (Hg/HgO – 20% KOH, 0.1 V vs. SHE) reference
electrode. All current densities were normalized by the true area of the electrodes unless
otherwise stated. Polycrystalline platinum was used as a control material.
Additionally, potentiostatic experiments at -0.6 V vs. Hg/HgO (in the case of the
ternary alloys) and at -0.1 V vs. Hg/HgO (for the binary alloy) were carried out for 4000 s in
the KOH/C2H5OH solution. During these experiments, the solution was agitated with a
178
magnetic stirrer with an approximated rotation velocity of 700 rpm. The carbonate
concentration in the reaction medium after the oxidation was determined by titrating 5 mL of
resulting solution with 1.2 M BaCl2 solution (ACP, 99%). To avoid the precipitation of
Ba(OH)2, the pH was brought down from ca. 15.0 to ca. 10.0 by adding ca. 2 mL of
concentrated HCl (BioShop, 36.5-38%) and a few drops of 2 M HCl solution. The HCl was
added as quickly as possible to minimize the unnecessary exposure of the solution to air.
Right after that, a solution of BaCl2 was added drop wise while the pH was kept between
10.0 and 10.5 to avoid the dissolution of BaCO3, which occurs at pH values around 6 [48-
50]. Filtration of the obtained precipitate was done using a 0.45 µm membrane filter (PALL)
followed by a gravimetric determination. The contribution to the carbonate content from
original slight carbonation of the KOH was measured by titrating the solution prior to the
reaction.
5.3 Results and discussion
The ligament size (here defined as the average width perpendicular to the ligament
edge) for some selected samples is shown in Figure 5.1. As can be seen, the ligament size
decreased by increasing the platinum content of the alloy. The presence of platinum in the
alloy reduced gold mobility, hindering the electrochemical coarsening of the structure – in
the binary alloy (Figure 5.1a) the average ligament size was ca. 14 nm, whereas for the
nanostructure formed on the alloy with only 1 at.% Pt (Figure 5.1b) the ligament size
dropped to ca. 7 nm (see also Figure 5.2). The inserts in Figure 5.1 showed TEM images of
the two structures suggesting that the pore sizes (light regions) were ca. 17 nm and 8 nm for
the binary and ternary alloy respectively, which agrees well with the pore size distribution
analysis done by the Brunauer-Emmett-Teller (BET) method (not shown here but reported
179
elsewhere [30]). With higher concentrations of platinum in the precursor, the size of the
ligaments kept decreasing to a value of ca. 4 nm when the precursor had 3 at.% Pt (see
Figure 5.2). The fraction of platinum on the surface of the ligaments was 1.4, 3.0 and 6.6 %
for the alloys with 1, 2 and 3 at.% Pt. Maroun et al., [51] and Bergbreiter et al. [52] found
that individual Pt atoms did not readily participate in the UPD of hydrogen, but that small
domains rich in platinum were required; therefore, after estimating the minimum distance
between platinum atoms on the surface of the ligaments, it is believed that the fraction of
platinum reported here only represents the minimum coverage of the ligament surface.
Further research has to be done to understand/resolve this issue. The roughness factor (Rf,
insert in Figure 5.2) increased with the platinum content of the structure, showing that by
reducing the ligament size, the increase in surface area was substantial.
180
Figure 5.1 SEM images of the freshly-developed nanoporous structure at 0.55 V vs. MSE and 25 °C in 0.77 M HClO4: (a) Ag77:Au23 (b) Ag77:Au22:Pt1. In all cases, 5 C cm-2 were passed. Inserts in (a) and (b) are TEM image of the same structures.
181
Figure 5.2 Average ligament size of the freshly-formed nanoporous structures formed at 0.55 V vs. MSE and 25 °C in 0.77 M HClO4. The insert shows the roughness factor (Rf) as a function of the platinum content of the precursor. Error bars represent 95% confidence interval (CI) calculated from at least 30 measurements in the case of the ligament size, and triplicate runs for Rf.
As mentioned before, ethanol electro-oxidation was evaluated in alkaline electrolyte (4
M KOH). The concentration of the supporting electrolyte was experimentally selected after
observing that at lower concentrations, the reaction was limited by depletion of OH- owing to
the extremely high nominal current density of the nanostructures (see below). Figure 5.3a
shows the CV profiles of all the nanoporous structures in the supporting electrolyte, showing
that NPG had an extended double-layer region between -0.9 V and 0.25 V vs. Hg/HgO. At
0.25 V an oxidation peak started that was ascribed to the formation of a monolayer of gold
surface oxides in highly basic solutions; a reduction peak at 0.1 V was associated with the
electrochemical reduction of those oxides. For ternary alloys, the oxidation of gold started at
~0.15 V and the reduction peaks were slightly shifted to less positive potentials, if compared
with that for NPG. The magnitude of this reduction peak decreased with increasing platinum
182
content of the alloy. The reduction peaks at ca. -0.5 V, which also change with the platinum
content of the alloy, were attributed to the presence of oxidized platinum in the structure (no
influence of silver was detected at this potential). Figure 5.3b shows the CV profiles for the
ethanol oxidation reaction of NPG and of the nanostructure formed on the ternary alloy with
1 at.% Pt. In both cases, the vertical axis corresponds to the nominal current density (i.e.,
normalized by the geometrical area of the electrode), and the positive scan limit was fixed at
0.2 V to avoid the region in which gold and silver oxides might form. Clearly, both
nanostructures, but particularly the ternary one, had very high anodic current densities. In
NPG, the rising current in the forward scan (at ca. -0.4 V) can be ascribed to the
characteristic ethanol oxidation on the surface of the structure; a peak potential at 0 V
corresponded to a current density of ca. 2.5 x 10⁵ µA cm . In the case of the
nanostructure formed on the ternary alloy, there was a sharp increase in current at much
more negative potential than in the binary nanostructure (ca. -0.82 V), which agrees well
with the fact that small organic compounds (e.g., formaldehyde, methanol, ethanol) had
been oxidized on Au-Pt electrodes at lower potentials than on gold [53,54]. The broad peak
potential in the forward scan started at -0.5 V and finished at 0.05 V, and corresponded to a
current density of ca. 3.0 x 10⁵ µA cm . During the backward scan at least two not-well
defined oxidation peaks were observed at ca. 0 and -0.35 V (better resolved peaks were
identified when the positive scan limits were set at higher values - e.g., 0.4 V vs. Hg/HgO,
results not shown here). These two peaks represent the reaction resuming after whatever
was blocking the surface of the nanostructure at higher potentials dissolves off or was
reduced. The same behaviour was followed by the other two ternary nanostructures. The
insert in Figure 5.3b shows the CV of polycrystalline platinum electrode in the same solution
containing ethanol. The oxidation peaks in forward and backward scans were located at ca.
-0.3 V; which is in agreement with the general trend reported for platinum electrodes in the
183
literature [55,56]. The nominal current density in the ternary nanostructure was more than
50 times higher than that on the platinum electrode.
Figure 5.3 (a) CV profiles of the different nanoporous structures in 4 M KOH; (b) CV profiles of NPG and of the nanoporous structures formed on the alloy with 1 at.% Pt in 4 M KOH - 1 M C2H5OH solution. The insert in (b) shows the CV profile of polycrystalline Pt in 4 M KOH - 1 M C2H5OH solution. In all cases the vertical axis corresponds to the nominal current density. The original platinum composition is shown in (a). All CV profiles were obtained at 10 mV s-1 and 25 °C.
184
Figure 5.4 shows the CV profiles of all ternary nanostructures in KOH - C2H5OH
solution. The vertical axis in this figure corresponds to the true current density (i.e.,
normalized by the true area of the electrode) of the reaction. As can be seen, there was no
significant difference in the oxidation current density among ternary nanostructures at
potentials lower than 0.6 V; however, at higher potentials the nanostructure formed on the
alloy with 1 at.% Pt had slightly higher ethanol oxidation current density than the other two
nanoporous metals. A similar trend was observed by the authors when oxidizing methanol in
alkaline electrolyte [57]. It is hypothesized that the relative surface concentration (ratio
between platinum and gold) and the fact that the reaction was run in alkaline media are
mostly responsible for this trend [58]. The insert in Figure 5.4 shows the specific activities
(taken at -0.6 V vs. Hg/HgO) of all ternary nanostructures after multiple cycles. For all the
ternary nanostructures, there was a decrease in the specific activity after the first cycle;
however, no significant differences were observed after the following cycles. On the binary
nanostructure, the specific activity significantly decreased with every cycle.
In agreement with the trend observed by Beltowska-Brzezinska and Luczak [59], the
electrocatalytic activity of ternary nanostructures towards ethanol oxidation was higher than
that towards methanol oxidation under similar experimental conditions (reported previously
by the authors [57]). In the case of the ethanol oxidation, the reaction started at ca. -0.82 V,
which was approximately 0.12 V more negative than in the case of methanol, and
significantly higher true current densities were recorded at potentials lower than -0.5 V. As
discussed in detailed by Beltowska-Brzezinska and Luczak, by increasing the length of the
aliphatic carbon chain, the free-enthalpy of adsorption of alcohol molecules increased,
resulting in larger oxidation currents; in addition, the decrease in the α C–H bond energy in
the secondary alcohol (e.g., ethanol), lead to lower values of the apparent activation energy
than in primary alcohols. In simple words, secondary alcohols are more easily oxidized than
185
primary ones on gold-rich catalyst. A similar trend was observed for NPG: the ethanol
oxidation reaction started at ca. -0.4 V, whereas methanol oxidation started at ca. -0.15 V.
Additionally, it was observed that NPG showed higher maximum true oxidation current
density than ternary nanostructures; nevertheless, the onset of the reaction on NPG started
at ca. 0.4 V more positive than in the ternary nanostructures.
Figure 5.4 CV profiles for the electro-oxidation of ethanol in 4 M KOH – 1 M C2H5OH solution. The insert shows the summary of specific activities (S.a) of the ternary alloy structures for the C2H5OH oxidation reaction at -0.6 V vs. Hg/HgO and of the binary structure taken at -0.1 V vs. Hg/HgO; the vertical axis is the current density per true area of the electrodes. Details about the structures and the number of scan cycles are indicated in the figures. All CV profiles were recorded at 10 mV s-1 and 25 °C.
Potentiostatic oxidation of ethanol on all nanostructures is shown in Figure 5.5. As
can be seen in this figure, for the ternary structures the current density dropped from ca. 90
µA cmtrue to ca. 40 µA cmtrue
in approximately 200 s and then remained constant; while for
NPG the current dropped from 170 µA cmtrue and steadily decreased up to the end of the
186
experiment. These trends agreed well with the predictions made from their respective
voltammograms (e.g., Figure 5.4 for ternary nanostructures). Although NPG initially
displayed higher oxidation current density, after 1500 s the electrocatalytic activity of ternary
nanostructures increased in relation to NPG, i.e., there was a pronounced deactivation of
NPG with respect to the other alloys. This deactivation could be related to the formation of a
“passive” layer that blocks the active sites of the catalyst, as has been reported before for
gold nanoparticles and other catalytic materials [6,60]. No significant difference was
observed in the catalytic activity between ternary nanostructures.
Figure 5.5 Current density observed during a prolonged oxidation of 1 M C2H5OH in 4 M KOH solution at -0.6 V vs. Hg/HgO in the case of ternary nanostructures and at -0.1 V vs. Hg/HgO in the case of NPG. In all cases, the solution was de-aerated by high-purity nitrogen and agitated with a magnetic stirrer at ca. 700 rpm. The insert shows the concentration of carbonate produced after 4000 s with respect to the platinum content of the precursor.
187
In alkaline solution, different mechanisms have been proposed to explain how the
ethanol oxidation reaction proceeds on gold, identifying acetate (that could eventually being
converted to a ketone) as the main product of the oxidation [60-62]. The same product have
been identified when platinum is used as a catalyst [63]; however, it has been reported that
by using platinum-based electrocatalysts (e.g., Pt-Rh), the selectivity for carbonate over the
other products increases [64]. According with the work done by Beltowska-Brzezinska in Au-
Pt electrodes, the oxidation of secondary alcohols such as ethanol in alkaline electrolyte
would proceed as follows: initially, there is an interaction between pre-adsorbed OH- groups
and the alcohol molecules to initiate the cleavage of the C-H bond, then the intermediate
that is formed would react further with additional adsorbed OH- groups to end up with two
OH- groups directly linked to the α-carbon; finally, this second intermediate would react with
hydroxyl groups in solution (similar to a Eley-Rideal step) until the acetate ion is formed [54].
In our case however, analyses done in the solution after the potentiostatic oxidation
experiments showed that ethanol was oxidized to carbonate when the reaction was
catalyzed by the ternary nanostructures, with a carbonate concentration that increased by
increasing the platinum content of the alloy precursor (insert in Figure 5.5). The low amount
of carbonation that occurred during the titration procedure was demonstrated by the nearly
zero carbonate analysis obtained for NPG. More importantly, the current efficiency analysis
(considering carbonate as the only product) suggested that carbonate was the only product
of the oxidation. This result clearly implies that ternary nanoporous structures (with a small
amount of platinum) are sufficiently active to cleave the C-C bond in ethanol, which
undoubtedly is the most difficult step in the reaction. It is important to mention that in the
case of the nanostructures formed on the alloy with initially 2 and 3 at.% Pt, the current
efficiency was higher than 100%, which we cannot rationalize at the moment. All
experiments were conducted in a well de-aerated system, and the sample used to
188
determine the concentration of carbonate in solution had minimal contact with air before any
analysis.
After these prolonged experiments and after multiple potential cycling, no significant
change in the ligament size of the structures was observed, as can be seen in Figure 5.6 for
NPG and for the nanostructure formed on the alloy with 1 at.% Pt. In the case of NPG, the
ligament size after cycling the potential ten times (Figure 5.6a), and after holding the
reaction for 4000 s at -0.1 V (Figure 5.6c) was ca. 14 nm, with no change with respect to the
ligament size of freshly prepared structures (see Figure 5.1a and Figure 5.2). The same is
true for the ternary structure formed on the alloy with originally 1 at.% Pt, in which no
difference in ligament size was observed under any of the experimental condition used here
(Figure 5.6b and d). Neither was any significant difference seen in the other two ternary
structures (not shown here).
Figure 5.6 SEM images of nanoporous structures used to oxidize ethanol in alkaline electrolyte: (a) NPG after 10 potential cycles, (b) ternary nanostructure formed on the alloy with 1 at.% Pt after 10 potential cycles, (c) NPG after 4000 s reaction at -0.1 V, (d) ternary nanostructure formed on the alloy with 1 at.% Pt after 4000 s at -0.6 V.
189
The fraction of platinum atoms on the surface of the ligaments can be modified not
only by adjusting the dealloying conditions (e.g., temperature, charge density passed)
[30,57], but also by inducing surface segregation of platinum at moderate temperature in the
presence of oxygen [41]. Changing the surface composition of the structure will have an
impact on the catalytic response of these nanoporous metals. Figure 5.7 shows the CV
profiles of all ternary nanostructures after inducing segregation of platinum at 425 °C. As
observed in the figure, the modified structure formed on the alloy 1 at.% Pt displayed the
highest current density with a broad peak current of ca. 1300 µA cmtrue , which represents an
increase of almost 900% with respect to the current density of the equivalent freshly
dealloyed structures. The insert in Figure 5.7 shows a comparison between the specific
activities (taken also at -0.6 V) of as-dealloyed structures and structures after segregation.
The ternary nanostructure formed on the alloy with 1 at.% Pt showed a specific activity that
was more than 6 times higher after segregation of platinum than the as-dealloyed
nanostructures. The other two ternary nanostructures also showed higher specific activity
towards ethanol oxidation; however, the increase with respect to the as-dealloyed structures
was much lower. In all cases, broad and well-defined oxidation peaks at -0.3 V were
observed during the backward sweep. It is believed that the relative ratio between gold and
platinum on the surface of the ligaments, and the traces of silver identified on the surface of
the structures right after segregation had a role in the observed trend [41]. It is well-known
that traces of silver could significantly change the catalytic behaviour of nanoporous metals
[25,65,66].
190
Figure 5.7 CV profiles for all ternary nanoporous structures in 4 M KOH – 1 M C2H5OH solution. In all cases, the structures were exposed to 425 °C for 2 h in the presence of laboratory air. The insert shows the summary of specific activities (S.a) of the ternary alloy structures for the C2H5OH oxidation reaction at -0.6 V vs. Hg/HgO before and after segregation; the vertical axis is the current density per true area of the electrodes. The CV profiles were obtained at 10 mV s-1 and 25 °C. The original platinum composition is shown in the figure and the current density was normalized by the true area of the electrode.
5.4 Conclusions
a) Novel nanoporous structures have been formed by electrochemical dealloying of Ag-Au
and Ag-Au-Pt alloys, with 1, 2 and 3 at.% Pt, in HClO4 solution. In the ternary
nanostructure, the characteristics of the resulting nanoporous metals depend on the
platinum content of the precursor. By increasing the platinum concentration, the
ligament size decreases and the platinum coverage on the surface of the ligaments
increases, although it is considered that this coverage represents the minimum fraction
of platinum on the ligament surface.
191
b) Nanoporous metals formed on ternary alloys displayed a very high electrocatalytic
response towards ethanol oxidation in alkaline electrolyte. In all ternary nanostructures,
the onset of the oxidation reaction started at approximately 0.4 V more negative than
that in NPG, with the nanostructure formed on the alloy with 1 at.% Pt displaying the
highest current density at potentials higher than 0.6 V (no significant difference was
observed at lower potentials).
c) Compared with the methanol electro-oxidation reaction, NPG displayed significantly
higher true activity towards ethanol electro-oxidation (i.e., in alkaline electrolyte
secondary alcohols are more easily oxidized than primary ones on gold). A similar effect
was also observed in ternary nanostructures where the onset of ethanol electro-
oxidation was 0.12 V more negative than that in methanol oxidation.
d) The concentration of carbonate detected after potentiostatic oxidation of ethanol
increased with the platinum content of the alloy precursor. More importantly, based on
the current efficiency of the process (considering carbonate as the only product), it was
determined that carbonate was the only product of the oxidation, suggesting that the
activity of ternary nanostructures was so spectacular that the C-C bond was easily
cleaved. No detectable concentration of carbonate was found when the reaction was
catalyzed by NPG.
e) The ligament size in all nanostructures did not significantly change after running the
ethanol electro-oxidation reaction through multiple cycles or after relatively long
potentiostatic experiments; nevertheless, NPG displayed a constant decrease in
specific activity in time; whereas ternary nanostructures showed much higher stability.
The blockage of the active catalytic sites, especially on NPG, due to the formation of a
“passive” layer during the reaction has been considered as a possible reason for the
electrocatalytic activity to decay.
192
f) The effect of enriching the surface of the ligaments with platinum (after inducing
segregation at moderate temperatures in air) showed that, once again, the structure
formed on the alloy with 1 at.% Pt displayed the highest true current density amongst
the other ternary nanostructures, with a 900% increase with respect to the current
density of freshly-dealloyed structures. The other two ternary nanostructures also
showed an increase in the specific activity towards ethanol oxidation; however, the
increase with respect to the as-dealloyed structures was much lower.
5.5 Acknowledgment
The authors thank I. Gourevich, from the Center for Nanostructure Imaging at the
University of Toronto for his help imaging the nanoporous structures. The financial support
of NSERC is also gratefully acknowledged.
5.6 References
1. F. Delime, J. M. Leger and C. Lamy. (1998). Optimization of platinum dispersion in Pt-
PEM electrodes: Application to the electrooxidation of ethanol, J. Appl. Electrochem.,
28, 27.
2. F. Delime, J. M. Leger and C. Lamy. (1999). Enhancement of the electrooxidation of
ethanol on a Pt-PEM electrode modified by tin. Part I: Half cell study, J. Appl.
Electrochem., 29, 1249.
3. M. R. Tarasevich, Z. R. Karichev, V. A. Bogdanovskaya, A. V. Kapustin, E. N. Lubnin
and M. A. Osina. (2005). Oxidation of methanol and other low-molecular-weight
193
alcohols on the RuNi catalysts in an alkaline environment, Russ. J. Electrochem., 41,
736.
4. T. J. Schmidt, H. A. Gasteiger and R. J. Behm. (1999). Methanol electrooxidation on a
stability was observed by increasing the platinum content of the precursor.
Direct comparison between the characteristics of real nanoporous metals, and
simulated nanostructures obtained by Kinetic Monte Carlo algorithm (i.e., MESOSIM)
was not possible. After modifying the original MESOSIM code to include a ternary-
noble element in the structure, it was concluded that the characteristics of simulated
nanostructures (e.g., ligament size, composition of the less-noble element retained
inside the layer) did not agree with the experimental results; moreover, it was
observed that in all simulated structures, but particularly in NPG, the lack of realistic
coarsening in the simulations could be partyially responsible for this disagreement.
Even though this KMC algorithm has been remarkably successful in reproducing the
electrochemical and morphological behaviours of dealloyed systems, the
simplifications that were made to this algorithm to reduce its computational cost
significantly limited its use.
204
Effect of dealloying parameters on the most relevant characteristics of the dealloyed
material
Increasing the temperature of the electrolyte (from 25 °C to 60 °C) increased the
tendency of the nanoporous structures to coarsen; however, the presence of
platinum significantly minimized that effect, with the highest resistance to coarsening
observed in the structure with the highest platinum content in the precursor. The
thickness of the dealloyed layer (for the same charge density passed) increased with
the dealloying temperature in all the nanostructures formed on ternary alloys;
whereas for the binary nanostructures it steadily decreased. This is again related to
the amount of silver retained in the dealloyed layer. In NPG, due to the accelerated
coarsening of the structure, the amount of silver in the layer was significantly
reduced; whereas in ternary nanostructures the amount of silver was much greater
and close to the classical parting limit of 55 at.%. This tendency could be related with
the mobility of platinum at different temperatures: an increase in the electrolyte
temperature induced an easier and more efficient decoration of the step edges,
retaining more silver on the structure and, therefore, increasing the thickness of the
layer.
The platinum coverage on the surface of the ligaments increased with the dealloying
temperature. Although the actual mechanism through which that change occurred is
unknown, it was hypothesized that it could be associated with the dealloying
mechanism itself (where more-noble metals cover almost entirely the surface of the
ligaments) and/or parallel processes (e.g., segregation of platinum atoms to the
surface of the ligaments due to preferential adsorption of OH groups) that were
favored under such experimental conditions. The same tendency was observed
205
when higher charge densities were removed: by increasing the charge density, the
platinum coverage on the ligaments increased.
All nanoporous metals formed on ternary alloys, but particularly the nanostructure
with the highest platinum content, displayed more stability and higher coarsening
resistance at lower dealloying potentials. Reducing the dealloying potential
significantly increased the dealloying time of all alloys, and with that the possibility of
significantly coarsening the ligaments, as happened in the case of NPG.
Increasing the dealloying time increased the charge density during dealloying, and
with that the tendency of the ligaments to coarsen. However, the average ligament
size in the nanostructures formed on ternary alloys did not drastically change with
the charge density; moreover, higher coarsening resistance was obtained by
increasing the platinum content of the alloy precursor. In the binary alloy, on the
other hand, the higher the charge density, the bigger the ligament size. The
thickness of the dealloyed layer increased with the charge density in all
nanostructures, but more so in the case of ternary alloys; the average concentration
of silver retained in the layer evidently decreased in the binary structure (due to
coarsening), whereas in ternary alloys the reduction in silver content is less
pronounced.
Adsorbate-induced surface segregation of platinum to the surface of the ligaments
Exposure of as-dealloyed ternary nanostructures to moderately elevated
temperature (< 500 °C), in the presence of air, induced an increase in the platinum
coverage on the surface of the ligaments, with a maximum (approximately 20% with
respect to the as-dealloyed coverage) obtained at 425 – 475 °C. It is believed that
206
the strong interaction between oxygen and platinum atoms promoted that
enrichment, in contrast with the reported gold-enrichment behavior of binary Au-Pt
system in vacuum. At higher temperatures (> 500 °C), the fraction of platinum on the
surface decreased, which agreed well with the temperature at which oxygen
desorbed from surface platinum atoms.
Even thought the actual transport mechanism of platinum during segregation is not
clear, it is recognized that lattice diffusion is virtually quenched in the studied range
of temperatures (< 500 °C). We hypothesized that there may be analogous
phenomena in nanoparticle systems to explain this phenomenon.
By exposing nanoporous metals to air, different adsorption states of Pt-O were
formed on the surface of the ligaments. Small differences in the binding energies of
those Pt-O compounds with respect to the values reported in literature were
associated with the presence of gold and/or silver and the high concentration of
steps on the surface. More importantly, after exceeding the experimentally
determined temperature threshold (ca. 500 °C), platinum tended to regain its metallic
state. The same result was obtained after electrochemically reducing the surface
oxides in H2SO4 solution right after the heat treatment.
The roughness factor (Rf) of the nanoporous structures, here used as an indication
of the thermal coarsening of the nanostructure, decreased for all alloys with
increasing exposure temperature; nevertheless, the resistance to coarsening
increased by increasing the platinum content of the precursor. A significant drop of
the Rf was observed at ca. 500 °C exposure in air, which agreed well with the
reduction of platinum coverage on the surface of the ligaments.
The platinum enrichment on the surface of the nanostructure in air was a process
that occurred in a very short time. An almost maximum coverage was observed in
207
only thirty minutes of exposure to the appropriate temperature, with small changes at
longer times: after more than seventy hours under the effect of temperature in the
presence of air, no changes in the platinum content of the sample or the R f (i.e.,
ligament size) was detected. An apparent equilibrium condition was observed even
at lower temperatures than that at which the maximum coverage occurred.
In the absence of oxygen (i.e., heat treatment in an inert atmosphere, Ar-H2), no
segregation of platinum was detected at any temperature; in fact it desegregated as
already known for binary Au-Pt systems . More importantly, in the absence of
oxygen, a massive coarsening of the structure was observed (i.e., the ligament size
was significantly bigger than that observed in the presence of air). NPG, on the other
hand, did not show any significant difference if annealed at moderate temperature in
air or in an inert atmosphere. Clearly, the co-segregation of platinum and oxygen
hindered the coarsening process in these nanoporous metals.
Besides the clear tendency of platinum to segregate to the surface of the ligaments,
it was determined that silver was also exposed to the surface of the ligaments after
the exposure of as-dealloyed samples to moderate temperatures. Considering the
fact that significantly higher silver concentrations were retained inside the ligaments
in ternary nanostructures, and that the relatively higher mobility that gold and
platinum had at the studied temperatures (i.e., coarsening), it was expected that
silver was exposed on the surface of the ligaments; nevertheless, it was observed
that this tendency was minimized by increasing the platinum content of the
precursor, which decreased the coarsening of the structure.
208
Electro-oxidation of methanol in alkaline and acidic media on nanoporous metals
Much higher activity towards methanol electro-oxidation in alkaline electrolyte was
observed on ternary nanostructures than in NPG: the onset of the reaction started at
more negative potentials in all ternary structures, with a peak potential that at. 300
mV more negative than the binary nanostructure and with a peak current that was at
least four times higher than that in NPG. The strong synergistic effect between gold
and platinum, and the smaller feature sizes on ternary nanoporous metals could be
associated with this increase in activity.
Among the three ternary nanostructures, the one formed on the alloy with 1 at.% Pt
showed the highest electrocatalytic activity in alkaline electrolyte. The relative ratio of
platinum and gold atoms on the surface of the ligaments was most likely associated
with this trend. On the contrary, in acidic electrolyte, ternary nanostructures
displayed increasing activity with increasing platinum content of the precursor (the
most active nanostructure under this conditions was the one formed on the alloy with
3 at.% Pt), which is in agreement with the literature concerning Au-Pt bimetallic
catalysts in acidic media. NPG only showed limited electrocatalytic activity in alkaline
electrolyte, but virtually none in acidic electrolyte in the range of potentials under
investigation.
Increasing the platinum content of the nanostructures changed the selectivity of the
reaction in alkaline electrolyte: the higher the platinum content on the nanoporous
metal, the higher the concentration of carbonate and the lower the concentration of
formate in solution. For NPG, only formate was detected as a major product of the
oxidation. In none of the cases, was formaldehyde detected, possibly due to the
disproportionation of formaldehyde in highly basic media (i.e., Cannizzaro’s
reaction).
209
After characterizing the methanol electro-oxidation reaction by cyclic voltammetry at
different scan rates, it was concluded that this reaction was diffusion controlled in the
bulk solution boundary layer near the peak current density. The same conclusion
was obtained after studying the effect of the external agitation on the system.
The electrocatalytic response of all ternary nanostructures changed by changing
their dealloying conditions: samples dealloyed at higher temperatures showed higher
specific activity than those dealloyed at room temperature, moreover, samples in
which small charge densities were passed showed higher specific activity than
samples in which large charge densities were removed. Increasing the temperature
of the dealloying electrolyte increased the relative platinum coverage of the
ligaments, without changing much the ligament size, which correlate with the higher
specific activities and a higher amount of carbonate produced during the oxidation.
Higher charge densities increased the thickness of the layer, but decreased the
specific activity of the catalyst. The effect of mass transport limitations within the
layer are not negligible and could have a role in these trends.
By inducing segregation of platinum to the surface of the ligaments by heating in air,
it was found that the electrocatalytic response in alkaline electrolyte was enhanced,
particularly in the nanostructure developed on the alloy with only 1 at.% Pt. The
relative surface composition of the nanostructure (silver was detected in the surface
of the nanostructures) could contribute to the observed enhancement. The
concentration of carbonate produced for these nanostructures remained constant
between them, but significantly higher than the amounts produced by as-dealloyed
structures. The current efficiency analysis suggest that a significant amount of
formate was produced on the nanostructure formed on the alloy with originally 1 at.%
Pt after segregation; whereas carbonate was the dominant product on the
nanostructure with the highest platinum content. In acidic electrolyte, the most active
210
nanostructure after segregation was again the one developed on the alloy with 3
at.% Pt.
Ethanol electro-oxidation on nanoporous metals in alkaline electrolyte
Nanoporous metals formed on ternary alloys displayed a very high electrocatalytic
response towards ethanol oxidation in alkaline electrolyte. In all ternary
nanostructures, the onset of the oxidation reaction started at approximately 0.4 V
more negative than that in NPG, with the nanostructure formed on the alloy with 1
at.% Pt displaying the highest current density at potentials higher than 0.6 V (no
significant difference was observed at lower potentials).
Compared with the methanol electro-oxidation reaction, NPG displayed significantly
higher true activity towards ethanol electro-oxidation. As has been well documented
in literature, in alkaline electrolyte secondary alcohols are more easily oxidized than
primary ones on gold. The increase in the free-enthalpy of adsorption and the
decrease in the C-H bond energy in secondary alcohols lead to higher oxidation
currents than in the case of primary alcohols. A similar effect was also observed in
ternary nanostructures where the onset of ethanol electro-oxidation was 0.12 V
more negative than that in methanol oxidation.
The concentration of carbonate detected after potentiostatic oxidation of ethanol
increased with the platinum content of the alloy precursor. More importantly, based
on the current efficiency of the process (considering carbonate as the only product),
it was determined that carbonate was the only product of the oxidation, suggesting
that the activity of ternary nanostructures was so spectacular that the C-C bond was
easily cleaved. No detectable concentration of carbonate was found when the
reaction was catalyzed by NPG.
211
The ligament size in all nanostructures did not significantly change after running the
ethanol electro-oxidation reaction through multiple cycles or after relatively long
potentiostatic experiments; nevertheless, NPG displayed a constant decrease in
specific activity in time; whereas ternary nanostructures showed much higher
stability. The blockage of the active catalytic sites, especially on NPG, due to the
formation of a “passive” layer during the reaction has been considered as a possible
reason for the electrocatalytic activity to decay.
The effect of enriching the surface of the ligaments with platinum (after inducing
segregation at moderate temperatures in air) showed that, once again, the structure
formed on the alloy with 1 at.% Pt displayed the highest true current density
amongst the other ternary nanostructures, with a 900% increase with respect to the
current density of freshly-dealloyed structures. The other two ternary nanostructures
also showed an increase in the specific activity towards ethanol oxidation; however,
the increase with respect to the as-dealloyed structures was much lower.
6.2 Significance and contribution of the research
Although in the last few decades, the development and characterization of all kinds of
nanomaterials has gained a lot of attention from the scientific community, the search for
new, more efficient and more robust nano-sized materials is a very active field. The
formation, characterization and tunability of nanoporous metals from Ag-Au-Pt alloys, with
small platinum content, and with proven stability and flexibility, contribute to this field by
offering a fundamental understanding of the role of ternary elements in nanoporous metals;
moreover, it confirms the fact that dealloying is an pliable, clean and relatively easy way of
producing a new class of nanomaterials with remarkable properties.
212
To the best of our knowledge, this research is the first comprehensive study to look in
depth in the effect that ternary elements have on the characteristics of the nanoporous
metals formed by electrochemical dealloying. The selection of the alloy precursors, with a
systematic variation of the platinum content and with the same silver content as the control
material (Ag-Au alloy with 77 at.% silver, which is an structure that has been characterized
for its more open and compliant structure) allowed us to identify not only small changes in
the nanoporous structures as a result of the presence of platinum, but also general trends
regarding the development and characteristics of the resulting dealloyed layers. In addition,
the detailed characterization carried out during this investigation, covering aspects such as
the ligament size, composition across the dealloyed layer, pore size distribution, changes in
the thickness of the dealloyed layer, etc., provide the field with a well-supported data that
can establish the base on which related research regarding the effect of ternary components
in nanoporous metals can be done. Moreover, the evaluation of some of the dealloying
parameters (temperature, potential and charge density) in the characteristics of these novel
nanoporous metals significantly enhanced the contribution of this research. In the past,
similar studies have been done for binary alloys (especially NPG) but, in the best of our
knowledge, this has never been done for ternary nanostructures. Through this
characterization, it was possible not only to confirm the higher stability that platinum induced
in the nanoporous metals, but also to identify alternative ways to change the platinum
coverage on the surface of the ligaments. All this clearly confirms the extraordinary flexibility
of these nanostructures.
In addition to the contributions made to the field of dealloying and formation of
nanoporous metals, the findings obtained in this research can also applied to fields like
surface science (i.e., adsorbate-induced surface segregation of platinum in nanoporous
metals) and catalysis (i.e., methanol and ethanol electro-oxidation). The preference of
213
platinum to segregate to the surface of Au-Pt structures (and nanostructures) in the
presence of air has been predicted and reported before; however, this has never been
reported for nanoporous metals, and its kinetic effects are extraordinary. Through this
research we unveiled the experimental conditions in which the platinum content on the
surface of nanoporous metals could be modified and up to what extent. However, even
though there are still aspects of this phenomenon that are not completely clear for us (in
particular, transport mechanism of platinum to the surface of the ligaments), the importance
of the observed trends could be vast, and potentially open new research clusters within the
surface science and corrosion community. In terms of the catalytic abilities of these
nanomaterials, the fact that very high activities towards methanol and ethanol oxidation
reactions were obtained with very small platinum contents significantly helps to support the
search for new nanocatalysts with applications in clean energy and other fields. The
synergistic effect between the elements in these nanostructures was evident; more
importantly, it was determined that the selection of parameters such as the supporting
electrolyte, depending on the composition of the nanoporous structure, is essential to
maximize the yield of the reaction.
Undoubtedly, the observations made in this research will significantly contribute not
only to general understanding of dealloying, but also to the research and development
activities being done towards formation of robust nanomaterials and towards the use of
nanoporous metals in applications like electrocatalysis.
6.3 Potential applications of findings
As indirectly pointed out before, the observations and findings obtained during this
investigation could be relevant for on-going research in the field of metal nanostructures for
214
applications in batteries, fuel-cells, sensors, membranes, among many others. Nowadays,
there is a constant effort to find not only a catalyst that is relatively cheap but, more
importantly, efficient and stable. Nanoporous metals, especially those fabricated on Pt-
based alloys, have been proven as potential good candidates for those applications;
however, platinum is an expensive metal and it suffers from drawbacks like deactivation due
to poisoning. The development of robust bimetallic-nanoporous metals, with minimal
platinum content, is indeed an attractive proposition for applications like catalysis and
electrocatalysis where, besides exploiting the remarkable activity displayed by nano-sized
gold, higher resistance and stability of platinum are expected.
6.4 Limitations of the research and recommendations for future work
The limitations encountered during this project, and specific recommendations for
future investigations, either in the same or in collateral areas, are presented below:
Compare the characteristics of the ternary nanostructures developed in this research
with those obtained in nanoporous metals developed on Ag-Pt alloys. The original
goal of our investigation was to compare the characteristics of the ternary
nanostructures with the nanostructures formed on binary alloys with the same silver
content (Ag-Au and Ag-Pt); however, severe inhomogeneities experimentally found
in the Ag-Pt alloy forced us not to include the material in our research. Therefore, we
strongly recommend to continue the same line of research using Ag-Pt alloy, not only
to characterize the nanoporous structure that can be developed on this alloy and
compare it with those obtained on ternary nanostructures, but also to expand our
knowledge in an material that has not been extensively investigated. Moreover, it
would be also important to expand that characterization to nanoporous structures
215
formed on the Ag-Pt alloy but with different platinum contents (e.g., 5, 15 at. %). This
will also benefit parallel projects that been carried out in this research group.
As shown in this research, the major reduction in the ligament size occurred in the
alloy with 1 at.% Pt. Therefore, it would be important to evaluate noble-ternary alloys
with even smaller platinum contents to determine up to what extent the platinum
stabilizes the nanoporous structure and induces higher resistance towards
electrochemical coarsening. Moreover, this evaluation could be extended to assess
the catalytic response of nanoporous structures with platinum content lower than 1
at. %, in alkaline electrolyte, to further assess the synergistic effect between gold
and platinum and the electrocatalytic response of such structures.
It is highly recommended to evaluate the chemical composition profile across
individual ligaments in ternary alloys to: i) confirm the core-shell structure of the
ligaments, ii) determine the platinum content in the core and in the shell of the
ligaments. Several attempts were tried to do this analysis as part of this project;
however, the preparation of the sample has been the major limitation; nevertheless,
information like this will be really beneficial for the understanding of the distribution of
atoms within ligaments.
Further research is needed in terms of the role of individual platinum atoms in the
UPD of hydrogen. This clearly becomes an important area for further development,
especially to better understand the catalytic properties of these and other
nanomaterials. Low energy ion scattering (LEIS) and X-ray photoelectron
spectroscopy (XPS) could be critical tools to understand this phenomenon.
Set the necessary conditions to dealloy material under inert-atmosphere conditions
(e.g., using a glove box) and, more importantly, with the capability of being able to
transfer the resulting nanoporous structures to vacuum chambers to do surface
216
sensitive analysis such as LEIS or XPS. In our experimental work, hydrocarbon
contamination on the surface of the structures was observed, and even though we
were able to obtain robust results, producing cleaner surfaces will be highly
beneficial.
The catalytic/electrocatalytic response of these nanoporous metals should be further
investigated. For electrochemical reactions, the use of nanoporous rotating disc
electrodes is strongly recommended to do a more precise evaluation. Moreover, it is
also recommended to evaluate the catalytic abilities of these structures in reactions
such as CO oxidation (gas-phase reaction) or glucose oxidation (liquid-phase
reaction).
Improve the method to determine the amount of carbonate in solution during/after
the electrochemical reactions. Specifically, a more robust method (i.e., anaerobic) is
desirable to reduce, as much as possible, any potential carbonation that might affect
the results.
As an additional step to evaluate the role of ternary elements during dealloying, it is
recommended that their effect has to be assessed in a different system/alloy. It is
well known that nanoporous copper, from Cu-Mn alloys, suffers some practical
limitations such as disintegration of the layer, severe coarsening oxidation, etc.
Therefore, it would be interesting to assess the role of small contents of platinum in
Cu-Mn alloys and determine how much stability is gained in the resulting ternary
structure.
Continue the effort of modeling these ternary nanoporous structures. Even though
KMC simulations seem to underestimate the coarsening of the structure and with
that, the real characteristics of the nanoporous structures, alternative approaches
could be considered. For example, combining KMC simulation with molecular
217
dynamics (MD) and/or density function theory (DFT) could provide additional
information and an extra degree of accuracy by including important effects such as
the presence of the electrolyte. Undoubtedly, further research in this area would be
highly beneficial.
218
Appendix A. Supplementary Data
A.1 Potentiostatic dealloying: comparison between binary and ternary alloys
Most of the dealloying procedures during this research were carried out
potentiostatically at 0.55 V vs. MSE, and for a fixed charged density passed. Figure A.1
shows the dealloying current for the different alloys. As can be seen, the lower the platinum
content of the precursor, the longer the time that is required to remove a specific charge (5
C cm-2 in the case of the figure).
Figure A.1 Dealloying current of the binary and ternary alloys recorded at 0.55 V vs. MSE and 25 °C in 0.77 M HClO4. The charge density passed was 5 C cm-2 in all cases. Details about the alloys are shown in the figure.
219
A.2 Formation of surface oxides during dealloying
Depending on the dealloying potential, oxidation of gold could occur during the
process. Gold oxides would limit its surface diffusion kinetics, hindering the initial ligament
coarsening. After dealloying the Ag-Au alloy at 0.7 V vs. MSE, a negative potential sweep
was carried out as shown in Figure A.2.
Figure A.2 Negative polarization sweep (1 mV s-1) of freshly dealloyed Ag77:Au23 specimen (0.7 V for approximately 25 s at 25 °C and removing 5 C cm-2) in the dealloyed solution. Insert: linear current density axis plot of the same data
In the region from 0.7 V to 0.57 V, the current was anodic, undergoing a switch to
cathodic between 0.57 V to 0.49 V before changing sign again. This behaviour can be
interpreted as the oxidation of gold above 0.57 V with its reduction below this value. The
reduction of gold resulted in a large cathodic charge than the anodic current corresponding
to silver dissolution, as the gold oxide/hydroxide covered a significantly large surface area.
When all the gold has been converted, the specimen reverted to the normal dealloying
220
process until 0.3 V was reached. At this point, the dealloying current stopped, and the
cathodic current recorded was the reduction of the charge stored on the dealloyed layer
surface (similar to a capacitor). No indication of gold oxidation was observed at 0.55 V vs.
MSE.
A.3 Electrochemical Impedance spectroscopy (EIS) of dealloyed samples
Impedance spectroscopy has been used recurrently to probe the structure of the
dealloyed layer and the developed surface area. Bode plots of the impedance for a wide
range of frequencies are given in Figure A.3. The linear gradient of impedance versus
frequency below 10 Hz represents purely capacitance behaviour. At low frequencies, the
values of the phase angle are more negative than -87 °, which implies the absence of
Faradaic processes (pure capacitance being -90°). The tale observed at high frequencies is
characteristic of porous materials. Throughout the project, the surface area of the porous
layer was probed using frequencies between 1 and 0.1 Hz.
In the absence of Faradaic reactions, the capacitance of an electrode can be given by:
imZfC
2
1 (A.1)
where f is the frequency at which the impedance is measured (Hz), Zimis the imaginary
component of the impedance of the specimen ( cm2) and C is the specific capacitance (F
cm-2). The capacitance ratio between the value after and before dealloying can be
221
considered as proportional to the developed surface area of the sample (also known as the
roughness factor – Rf).
Figure A.3 Impedance measurements for all alloys studied in this investigation: (a) Ag77:Au23, (b) Ag77:Au22:Pt1, (c) Ag77:Au21:Pt2, (d) Ag77:Au20:Pt3. In all cases, the charge density passed was 5 C cm-2 and the dealloying potential was 0.55 V vs. MSE. Dealloying temperature: 25 °C.
222
A.4 Alternative method to determine the developed surface area in dealloyed
specimens
Besides the impedance spectroscopy measurements showed before, the developed
surface area of dealloyed specimens was obtained by recording voltammograms in the
double layer region of potentials at different scan rates, as shown in Figure A.4 for two of
the ternary structures studied in this project. Current measured at the selected potential (-
0.1 V), located in the middle of the polarizability range, was then plotted against the scan
rate (insert in Figure A.4). The double layer capacitance was then calculated from the slope
of the current density versus scan rate, assuming again a negligible faradaic contribution to
the overall current. The developed surface area was calculated by dividing the calculated
capacitance by the gold double layer capacitance, which was assumed to be 28 µF cm -2
(assumption that seems to be correct after comparing the obtained results with impedance
results and BET values).
223
Figure A.4 Voltammograms obtained from -0.24 to 0.05 V vs. MSE in 1 M HClO4 solution: (a) NPG, (b) Nanoporous structure formed on the alloy with the lowest platinum content. The insert in both cases shows the dependence of the double layer current at -0.1 V vs. scan rate. The scan rates used are shown in the figures.
A.5 Calculation of the mass of the dealloyed layer
The real surface area of dealloyed specimens was normalized by the mass of the
dealloyed layer to account for the real increase in surface area. The following sample of
calculations is just to describe the method and assumptions considered for that purpose.
To visualize the approach, we considered that the dealloying specimen as a rectangle,
in which the layer on the surface represents the dealloyed layer, as it is shown in Figure A.5.
224
The thickness of the dealloyed layer was determined by measuring the layer in
metallographic specimens, and confirmed by SEM images taken from all dealloyed
materials. As an example, Figure A.6 shows the thickness of the dealloyed layer on NPG
measured from a cross-sectional metallographic specimen (Figure A.6a) and from the
fracture surface of the as-dealloyed material (low magnification SEM image). In both cases,
the thickness of the layer for NPG was ca. 7.8 µm (see Table A.1)
Figure A.5 Representation of the dealloyed specimen, in which the dealloyed layer is identified with the inclined lines.
Figure A.6 (a) Thickness of the dealloyed layer in NPG measured from a cross-sectional metallographic specimen and (b) from a fracture surface using a low magnification SEM image. In both cases, different samples of Ag-Au alloy were dealloyed at 0.55 V vs. MSE at 25 °C and passing a total charge of 5 C cm-2. The metallographic specimen was polished to 0.05 µm using alumina powder; the fracture surface was obtained after manually breaking the dealloyed sample in air.
225
The experimental parameters/data for the specific case of NPG are shown in Table A.1:
Table A.1 Experimental data for the calculation of the mass of the dealloyed layer in NPG grown in 0.77 M HClO4 at 0.55 V vs. MSE and 25 °C.
Alloy Ag77:Au23 Faraday constant (F) 96 458 C mol-
2
Charge density passed (q) 5 C cm-2 Molecular weight of silver
(MWAg) 107 g mol-1
Thickness of the layer (T1) 7.8 µm Density of silver (dAg) 10.5 g cm-3
Approximate Shrinkage (Sh)
1.1 µm Fraction of silver ([Ag]) 0.77
Geometrical area of the sample (A)
0.38 cm2 Density of gold (dAu) 19.3 g cm-3
True area of the sample 342 cm2 Fraction of gold ([Au]) 0.23
The mass of the ‘dealloyed layer’ before dealloying is given by the following relation:
AuAgL dAudAgShTAMass 1
(A.2)
Substituting the values listed in Table A.1 and doing the necessary unit conversions,
the mass of the layer before dealloying was estimated to be 4.2 mg. The mass of silver
removed during the dealloying process can be calculated by the relation A.3:
AgAg MWAF
qMass (A.3)
The amount of silver removed by passing 5 C cm-2 was approximately 2.09 mg.
Therefore, the mass of the dealloyed layer (DL) was calculated by removing the mass of
silver from the mass of ‘layer’ before dealloying, as shown in A.4:
226
AgLDL MassMassMass (A.4)
For this particular case, the mass of the dealloyed layer was ca. 2.1 mg.
A.6 Calculation of the thickness of the dealloyed layer based on the retained
silver content in the layer
The thickness of the dealloyed layer can be also estimated by the composition of the
dealloyed layer (i.e., amount of silver retained in the layer). Considering the same
experimental data/parameters listed in Table A.1, the average composition of silver in NPG
(α = 0.45 at.% based on EDX results) and the molecular volume of silver (MVAg = 10.2 cm3
mol-1), the thickness of the layer can be estimated by:
AgF
MVqThickness
Ag
DL )( (A.5)
where represents the fraction of silver removed during the dealloying process and can be
estimated by:
1
1Ag
Au (A.6)
Substituting the respective values in Equation A.6, the fraction of silver removed was
0.76; therefore, the thickness of the layer (Equation A.5) was estimated to be 9.1 µm. As
227
shown in Table A.1, the experimentally determined thickness was 7.8 µm. Thus, the
difference in thickness is considered to be the shrinkage of the dealloyed layer (Sh), which
in this case was approximately 1.3 µm. This value of Sh agrees very well with the
experimentally estimated value listed in Table A.1.
A.7 Potentiostatic dealloying at different temperatures: comparison between
all alloys
As described along this thesis, some samples of each alloy were dealloyed
potentiostatically at 0.55 V vs. MSE at different electrolyte temperatures. Figure A.7 shows
the dealloying current for the different alloys and for the four different dealloying
temperatures used along this research.
228
Figure A.7 Dealloying current of all the alloys investigated: (a) Ag77:Au23; (b) Ag77:Au22:Pt1; (c) Ag77:Au21:Pt2; (d) Ag77:Au20:Pt3. In all cases, the current was recorded at 0.55 V vs. MSE in 0.77 M HClO4 at different electrolyte temperatures. The charge density passed was 5 C cm-2 in all cases. Details about the electrolyte temperatures are shown in the figure.
As can be seen in this figure, the current density increased with temperature; for
example, Figure A.7a shows the dealloying current for the Ag-Au alloy in which at 60 °C the
current density was higher than at other temperatures. The same is true for the other alloys;
however, it was noticed that higher values of current densities were obtained by increasing
the platinum content of the precursor. For example, Figure A.7d shows that the current
densities for the alloy with 3 at.% were the highest among all the samples (except for the
current density at 10 °C which was approximately the same for all alloys). Increasing the
229
electrolyte temperature increased the surface diffusivity of the alloy constituents (e.g., gold
and platinum). It is believed that by increasing temperature, platinum decorated more
efficiently step edges, which induced changes in the amount of silver retained, thickness of
the layer and even on the dealloying current.
A.8 Nitrogen adsorption/desorption isotherms at 77.35 K – BET Surface area
estimation
Samples of all nanoporous metals were used to measure the surface area by means
of the BET method. As can be seen in Figure A.8, the shape of these isotherms is somehow
atypical: some of them present behaviours similar to a Type IV adsorption, while some
others have similarities to the H1/H2 hysteresis loops. The main characteristics of a Type IV
adsorption is the non-uniform desorption isotherm relative to the adsorption isotherm and
the capillarity condensation during the adsorption mechanism. On the other hand, H2
hysteresis occurs because desorption in the sample does not happen under equilibrium
conditions; rather, desorption occurs via either a pore blocking or cavitation mechanism,
which means that the larger mesopores are connected to the micropores or narrow
mesopores and can only empty after these "neck" have emptied. Based on these isotherms,
it is possible that cavitation is the predominant desorption mechanism because of the tale
steep step down in the desorption branch around 0.4-0.6 P/P0 (see Figure A.8a and b). For
this kind of behaviour during the desorption mechanism, the pores must be more cylindrical
in shape, according with the physical adsorption theory of nanoporous materials. Therefore,
based on these behaviors, it can reasonably conclude that these samples have micropores
as well as mesopores.
230
Figure A.8 Nitrogen adsorption/desorption isotherms at 77.35 K for all the nanoporous structures. All nanoporous metals were grown in 0.77 M HClO4 at 0.55 V vs. MSE and 25 °C. Dealloying charge: 5 C cm-2. De-gas conditions: 100 °C for 60 min. Details about the alloys are shown in the figure.
Based on these characteristics, the NLDFT (non-local density functional theory) kernel
that was used for all the samples was the N2 at 77K on silica (slit/cylindrical pores). This
kernel is designed to model the micropores as "slit-shaped" and the mesopores as
"cylindrical shaped" which seems to be case in these samples. Moreover, the adsorption
branch kernel has to be considered because of the H2-like hysteresis loops. This NLDFT
kernel would give just an approximation of the pore size distribution since no model for
231
metal alloys was available; moreover, in principle it correctly takes into account that there is
a delay in condensation in the adsorption branch of the isotherm due to metastable fluids in
the pore. This is also the reason that, in all cases, NLDFT provides a higher degree of
accuracy than the BJH (Barrett, Joycer and Halenda) method, which is based on the Kelvin
equation and assumes equilibrium desorption conditions, which does not seem to be
present in these samples; in addition, BJH also does not take into account the delay in
condensation.
A.9 SEM images of nanoporous structures after two months in dealloying
electrolyte
As described in the Chapter 2, samples of all alloys were kept in 0.77 M HClO4
solution for two months (no potential applied) to determine the ligament size after that time,
and to estimate the resistance to coarsening of the different nanoporous structures. Figure
A.9 shows the SEM images of the different nanostructures after two months in the
dealloying electrolyte. As can be seen, the average ligament size in NPG was 30 nm;
whereas for the alloy with 1 at. % Pt the ligament size was approximately 9 nm. The
structure with the highest platinum content had an average ligament size of ca. 5 nm.
232
Figure A.9 SEM images of nanoporous structures dealloyed at 0.55 V vs. MSE and 25 °C and coarsened for 2 months in 0.77 M HClO4 solution: (a) Ag77:Au23, (b) Ag77:Au22:Pt1, (c) Ag77:Au21:Pt2, (d) Ag77:Au20:Pt3. In all cases 5 C cm-2 were passed. No potential was applied during the coarsening process.
A.10 SEM images of NPG after removing small charge densities
In our attempt to estimate how quickly the ligaments coarsen during the dealloying
process, Ag-Au alloy was dealloyed at the same potential (0.55 V vs. MSE) but removing
only 0.05 and 0.1 C cm-2. Normally, we removed charge densities higher than 2.5 C cm-2
(i.e., 5, 20, 40 C cm-2). As can be seen in Figure A.10a, the ligament size of NPG after
removing only 0.05 C cm-2 was ca. 7 nm, which is half of the size observed after removing 5
C cm-2. After removing 0.1 C cm-2 the ligament size was approximately 9 nm. Indeed, the
coarsening process in NPG is very fast and the ligaments grow very quickly in short periods
of time.
233
Figure A.10 SEM images of NPG dealloyed at 0.55 V vs. MSE and 25 °C: (a) and (b) after removing 0.05 C cm-2, (c) and (d) after removing 0.1 C cm-2.
A.11 Estimation of the availability of platinum to segregate to the surface of
the ligaments
To estimate if the amount of platinum available within the ligament was enough to
support the platinum coverage after surface segregation, the following theoretical calculation
was carried out:
Assuming that ligaments were cylinder with h height and with a radius of r, the volume
of a ligament can be calculated by:
hrVlig 2 (A.7)
234
The face-centered unit cell was considered for our calculations, with a total volume
given by:
3aV cellunit (A.8)
where a is the crystal lattice constant. Now, the total number of atoms in a ligament and the
number of only platinum atoms in the same ligament are given by the following relations:
3
2
4#a
hratomslig
(A.9)
DLlig Pta
hratomsPt
3
2
4#
(A.10)
where [PtDL] is the average platinum content in the dealloyed layer.
The surface of the cylinder (i.e., the surface of the ligament) is given by the relation
A.11:
hrSurflig 2 (A.11)
For the calculations, only the (111) plane was considered. The area of the (111) plane
is given by the following relation:
2
32
)111(
aA plane
(A.12)
235
The number of atoms on the surface of the ligaments is given by dividing Equation
A.11 by Equation A.12 and multiplying it by the number of atoms that are in the (111) plane
(2 atoms). Therefore, the following expression is obtained:
38#
2
a
hratoms ligSurf
(A.13)
The number of platinum atoms on the surface of the ligaments is given by multiplying
Equation A.13 by the concentration of platinum on the surface of the ligaments [Ptsurf]:
3
8#2
a
hrPtatomsPt surfligSurf
(A.14)
Comparing Equations A.10 and A.14, the following relation can be obtained:
a
rPtPt
ligDL
surf
2
3 (A.15)
For the observed surface segregation results to be theoretically possible, the relation
A.15 has to be true. Indeed, this relation is satisfied for all three ternary structures. As an
example, for the highest platinum content alloys, the term on the right was ca. 12% higher
than the term on the left, using the following values: [Ptsurf] = 30.36%; [PtDL] = 8 at.%; rlig =
2.15x10⁻⁹ m; a = 4.08x10⁻¹⁰ m.
236
A.12 Angle-resolved X-ray spectroscopy (XPS) analyses for the ternary alloys
before and after segregation of platinum
Figure A.11 shows the near-the-surface silver, gold and platinum composition,
obtained by XPS at different take-off angles, for the nanostructures developed on the alloys
with 1 and 3 at.% Pt. Evidently, the platinum content in the near-surface of the ligaments
(Figure A.11a, b) depended on the exposure temperature; for example, at 425 °C the
platinum composition was the highest in both nanostructures (ca. 12 and 24 at.% for the
nanostructure formed on the alloy with 1 and 3 at.% respectively for a take-off angle of 10 °);
however, at higher temperatures, the platinum composition decreased (specially in the case
of the nanostructure formed on the alloy with 1 at.%). The silver content in the near-surface
of the ligaments (Figure A.11c, d) was similar in both nanostructures, with the highest silver
contents at the highest annealing temperature, which is also an indication of the coarsening
of the structure. The gold concentration (Figure A.11e, f) consequently decreased by
increasing the annealing temperature to values around 30 at.%.
237
Figure A.11 XPS compositions with respect to the take-off angle for different nanoporous structures: (a) Pt4f for Ag77:Au22:Pt1; (b) Pt4f for Ag77:Au20:Pt3; (c) Ag3d for Ag77:Au22:Pt1; (d) Ag3d for Ag77:Au20:Pt3; (e) Au4f for Ag77:Au22:Pt1; (f) Au4f for Ag77:Au20:Pt3. The experimental conditions for different sets of data are the following: (◊) right after dealloying, (●) after exposure at 425 °C, (○) after exposure at 500 °C and (▲) after exposure to 600 °C. In the case of all high temperature conditions, laboratory air was used for an exposure time of 2 h.
All this data was used to generate the depth profiling across the first few nanometers
of the dealloyed layer, using the Maximum Entropy algorithm, to try to determine if the
segregation of platinum to the surface of the ligaments happened only on the outermost
surface or if there was any trend across the top part of the layer.
238
A.13 Depth profiling analyses based on angle resolved X-ray Spectroscopy
(XPS) for samples before and after induced-surface segregation of
platinum
To obtain the depth profiling analyses of samples before and after segregation of
platinum, AR Process software (version 5.59) was used to process the angle-dependent
XPS data (Appendix A.12). Some of the properties of the nanoporous metals, such as
relative density and approximate composition of the dealloyed layer, were estimated to be
able to obtain the depth profile for the different samples. It is important to mention that it is
well-documented that the roughness of these nanostructures could have a significant effect
on the outcome of the analysis; nevertheless, no correction for the surface roughness was
done at this stage.
Figure A.12 shows the depth profiling results obtained for the ternary alloy developed
on the alloy with 1 at.% Pt. As can be seen, the modeling was done for the first 3 nm of the
sample and the predicted platinum concentration on the surface of the structure changed
from ca. 3 at.% (in the as-dealloyed sample) to ca. 10 at.% Pt (after exposure to air at 425
°C). At higher temperatures, the concentration of platinum decreased significantly, to values
close to zero after exposure to 600 °C. These results are in good agreement with the results
obtained by under-potential-deposition (UPD) of hydrogen (see Figure 2.3, Chapter 2).
In some of the graphs shown in Figure A.12, there are trends that were not expected
at all. According with the prediction of the model, there was a significantly higher platinum
concentration underneath the surface than that on the surface of the ligaments (in the
sample annealed at 425 °C, a platinum concentration of approximately 20 at.% was
predicted at ca. 0.25 nm depth). In addition, in the as-dealloyed sample and in the sample
annealed at 425 °C, there was a sudden increase in the platinum concentration near the 3
239
nm depth. Similar observations were made for the predicted results in the structure formed
on the alloy with 3 at.% Pt. Based on all these facts, we were not able to conclude if the
enrichment of platinum was only in the outermost atom layer.
Figure A.12 Depth profile analysis for the lowest platinum content nanostructure (1 at.% Pt) generated from angle-resolved XPS and using the Maximum Entropy algorithm. Details about the elements and the experimental conditions are shown in the figures.
Figure A.13 shows the depth profiling results obtained for the ternary alloy developed
on the alloy with 3 at.% Pt. As can be seen, the modeling was also done for the first 3 nm of
240
the sample; the predicted platinum concentration on the surface of the structure changed
from ca. 10 at.% (in the as-dealloyed sample) to ca. 25 at.% Pt (after exposure to air at 425
°C). At 500 °C, the concentration of platinum dropped to 20 at.% and at 600 °C, it further
decreased to ca. 5 at.%. Once again, these results are in good agreement with the results
obtained by under-potential-deposition (UPD) of hydrogen (see Figure 2.3, Chapter 2).
Once again, based on the trends observed in these predicted results, we were able to
conclude if the enrichment of platinum was solely on the outermost surface of the layer. The
assessment of the effect of the huge roughness of these structures has to be further
investigated to determine its effect on the current results.
241
Figure A.13 Depth profile analysis for the lowest platinum content nanostructure (3 at.% Pt) generated from angle-resolved XPS and using the Maximum Entropy algorithm. Details about the elements and the experimental conditions are shown in the figures.
A.14 Under-potential-deposition (UPD) of hydrogen for samples before and
after surface segregation of platinum was induced
As discussed in detail in Chapter 3, exposure of as-dealloyed specimens to moderate
temperature in the presence of laboratory air will induce changes in the surface
composition, i.e., the fraction of platinum atoms will increase compare with the as-dealloyed
samples. Under-potential-deposition (UPD) of hydrogen was used primarily to assess the
242
platinum coverage on the surface of the ligaments. Figure A.14 shows the UPD of hydrogen
for samples before and after segregation.
Figure A.14 (a) CV profiles of the nanostructures formed on Ag-Au and Ag-Au-Pt alloys after dealloying at 0.55 V vs. MSE, 25 °C and passing a charge density of 5 C cm-2; (b) CV profiles for the nanostructure formed on the alloy with 3 at.% Pt after exposure of the as-dealloyed structure to different temperatures in the presence of laboratory air. In all cases, CV profiles were obtained in 1 M H2SO4 at 20 mV s-1 and 25 °C. The original platinum content is shown in (a) and the exposure temperature is shown in (b).
As can be seen in Figure A.14a, the CV profiles showed obvious adsorption and
desorption regions in the potential region between -0.63 V and -0.4 V vs. MSE for all the
243
nanostructures formed on ternary alloys. As expected, the current density in this region
increased by increasing the platinum content of the precursor; the binary alloy did not show
any sign of adsorption/desorption of hydrogen. In the region of potentials between -0.4 V
and 0 V, the double-layer region is observed. Figure A.14b shows two important
characteristics of as-annealed samples: i) adsorption and desorption regions increased with
the annealing temperature, with a maximum observed at 425 °C; ii) the double-layer region
of potentials decreased by increasing the annealing temperature, which is a sign of the
decrease in surface area by exposure to high temperatures.
A.15 Effect of scan rate and agitation speed during methanol electro-oxidation
reaction
The effect of different potential scan rates and agitation speed (by an external source,
i.e. magnetic stirrer) during the electrochemical oxidation of methanol in 5M KOH – 1 M
CH3OH solution is shown in Figure A.15.
As can be seen in Figure A.15a, b and c, the oxidation current was dependent on the
potential scan rate (); in fact, the peak current was linear with 0.5 for all the nanostructures,
which clearly indicated a diffusion controlled process for methanol oxidation in the bulk
solution boundary layer. The oxidation current associated with the half peak potential (i.e., -
0.4 V vs. Hg/HgO) is nearly linear with 0.5 for the alloys with 2 and 3 at.% Pt (Figure A.15c
and e), but independent of the scan rate in the case of the lower platinum content alloy at
rates higher than 3 mV s-1 (see Figure A.15a). In the case of the different agitation speeds
(i.e., between ca. 200 rpm and 970 rpm) it was observed that the peak current increased
with the agitation speed. For example, in the case of the ternary alloy with 1 at.% Pt (Figure
244
A.15b), the peak current increased from ca. 200 µA cmtrue (no agitation) to 550 µA cmtrue
at
800 rpm (at 970 rpm there were no further changes with respect to 800 rpm). These
changes in the peak current were entirely related to the diffusion limitation at the top surface
of the catalyst. No changes were found in the oxidation current below ca. -0.3 V. Similar
trends were observed for the other two ternary alloys (Figure A.15d and f).
Figure A.15 CV profiles for the electro-oxidation of CH3OH solution in 5 M KOH on nanoporous structures formed on ternary alloys: (a) effect of the scan rates on the structure formed on Ag77:Au22:Pt1; (b) effect of the external agitation speed on the structure formed on Ag77:Au22:Pt1; (c) effect of the scan rates on the structure formed on Ag77:Au21:Pt2; (d) effect of the external agitation speed on the structure formed on Ag77:Au21:Pt2; (e) effect of the scan rates on the structure formed on Ag77:Au20:Pt3; (f) effect of the external agitation speed on the structure formed on Ag77:Au20:Pt3. In all cases 5 C cm-2 were passed at 0.55 V vs. MSE and 25°C.
245
A.16 Methanol electro-oxidation on nanoporous metals obtained at different
dealloying conditions
It was expected that samples dealloyed under different conditions (e.g., temperature
and charge density passed) would have different catalytic response towards methanol
electro-oxidation in alkaline media. Figure A.16 shows the CV profiles for the dealloyed
Ag77:Au22:Pt1 (Figure A.16a) and Ag77:Au20:Pt3 (Figure A.16b) at different temperatures. As
can be seen in Figure A.16a, the voltammograms did not significantly change with respect
to the different dealloying temperatures: in all cases, there was a sharp increase in current
density at approximately -0.7 V that was associated with the characteristic methanol
oxidation on the surface. It was observed however, that for the structures dealloyed at 40°C
and 60°C, the peak potential shifted to ca. 0.33 V (structures dealloyed at 25 °C showed a
peak potential at ca. 0.22 V), which could be associated with the change in the platinum
content on the surface of the ligaments. The peak current during the forward scan did not
show any significant change between nanostructures; during the backward sweep, an
oxidation peak at ca. -0.30 V was observed.
In Figure A.16b, the CV profiles for the nanostructure formed on the alloy with 3 at.%
Pt are shown. As can be seen, by increasing the dealloying temperature, the peak current
significantly decreased and the peak potential shifted to more negative values (ca. -0.34 V).
CV profiles on the nanostructure formed on the alloy with 2 at.% Pt (not shown here)
showed also a decrease in the peak current with increasing dealloying temperature and an
intermediate value for the current density if compared with the other two ternary structures.
It is hypothesized that the relative ration of gold to platinum has an effect on these trends.
246
Figure A.16 CV profiles of the nanoporous structures formed on (a) the alloy with 1 at.% platinum and (b) the alloy with 3 at.% platinum. In all cases, dealloying was carried out in 0.77 M HClO4 at 0.55 V vs. MSE and at different temperatures. All CV profiles were obtained in 5 M KOH - 1 M CH3OH solution at 10 mV s-1 and 25 °C. Details about the dealloying temperatures are given in the figures. In all cases, the current was normalized by the true area of the electrodes.
The effect of the charge density on the CV profiles of these nanoporous metals is
exemplified here by the nanostructure formed on the alloy with 1 at.% Pt (Figure A.17) after
dealloying passing different charges. As observed, all voltammograms showed a sharp
increase in current around -0.6 or -0.7 V with the corresponding oxidation peaks during the
backward sweep; however, the highest current density was observed when the lowest
charge density was passed (i.e., 2.5 C cm-2); conversely, the sample in which 20 C cm-2
247
were removed showed the lowest current density. Initially, it was assumed that thicker layer
(i.e., higher charge densities) could give higher current densities; however, the
abovementioned trend suggested otherwise. In fact, these results also suggested that the
oxidation reaction might happen mostly in the vicinity of the top surface of the structure.
Moreover, it is recognized that the effects of mass transport limitation within the layer are
not negligible, even though they are smaller that might be assumed since the effective
diffusivity within the layer is lower than that for the bulk. In simple words, having very thick
DLs (e.g., 35 µm), did not seem to be beneficial to obtain higher oxidation currents. The
same behaviour was observed for the other ternary alloys (not shown here).
Figure A.17 Effect of the dealloying charge density in the electro-oxidation of methanol on as-dealloyed Ag77:Au22:Pt1. In all cases the nanoporous structure were dealloyed at 25 °C but passing different dealloying charges. All CV profiles were obtained at 10 mV s-1 and 25 °C. The different charge densities are shown in the figure.
248
A.17 Potentiostatic oxidation of methanol in alkaline solution
Figure A.18 shows the potentiostatic oxidation of methanol in alkaline electrolyte (5 M
KOH – 1 M CH3OH). All samples were dealloyed at 0.55 V vs. MSE at 25 °C and passing a
dealloying charge of 5 C cm-2. The potentiostatic experiment was run for 4000 s in a solution
that was de-aereated for at least 30 min with high-purity nitrogen gas (min. purity: 99.998%).
In all these experiments, the counter electrode (platinum wire) was kept in a separate
compartment to minimize the effect of secondary reaction that might affect our results.
Figure A.18 Current density observed during a prolonged oxidation of 1 M CH3OH in 5 M KOH solution at -0.35 V vs. Hg/HgO in the case of ternary alloys and at -0.05 V vs. Hg/HgO in the case of the binary alloy. In all cases, nanostructures were formed after dealloying the precursors at 0.55 V vs. MSE at 25 °C and with a charge density of 5 C cm-2. The label of the different nanostructures is shown in the figure.
As can be seen in Figure A.18, the alloy with the lowest platinum content has the
higher current density, which agrees with cyclic voltammograms done in the same solution.
The other two ternary alloys did not show any significant difference. It is important to notice
249
that the current in ternary alloys did not significantly decrease in time; whereas the binary
alloy did have an obvious decrease in current density.
A.18 Nuclear magnetic resonance (NMR) spectra: determination of formate
concentrations for the methanol oxidation reaction
After electro-oxidation of methanol in alkaline electrolyte, selected samples were
prepared to determine the concentration of formate produced during the reaction. No
formaldehyde was detected in any of the samples. All samples were analyzed in the nuclear
magnetic resonance (NMR) spectrometer. Figure A.19 shows some of the NMR spectra for
two samples with different concentration of formate and for the stock solution (5 M KOH – 1
M CH3OH). As can be observed in this figure, the formate peak was located at ca. 8.30 ppm
and the area under the peak changed with the amount of formate in solution. No significant
peak was observed in the case of the stock solution. The peak for water and methanol were
located at ca. 4.5 and 3.2 ppm respectively (not shown in Figure A.19)
In order to estimate the concentration of formate that was formed, aliquots were
prepare with different concentrations of formate. The area under the peak was correlated
with the formate concentrations to generate a calibration curve (Figure A.20). This
calibration curve was used to determine the concentration of formate produced during
methanol electro-oxidation on the different nanoporous structures.
250
Figure A.19 NMR spectra for samples prepared/obtained in 5 M KOH – 1 M CH3OH with different formate concentration. For all samples a scan at 90 ° pulse (16.1 µs) and 10 s relaxation delay were used with an acquisition time of 4.5 s and spectral window of 8012 Hz. All samples were diluted in D2O before analysis in NMR.
Figure A.20 Calibration curve for the concentration of formate in the 5 M KOH – 1 M CH3OH solution. Every point in this graph corresponds to the area under the peak located at ca. 8.30 ppm.
251
A.19 Electro-oxidation of ethanol in acidic media
Electro-oxidation of ethanol was analyzed mostly in alkaline electrolyte (i.e., 4 M
KOH); however, some preliminary runs in acidic media (i.e., 0.5 M HClO4) were performed
with the ternary alloy with the highest platinum content. As can be seen in Figure A.21, there
is an increase in current after -0.3 V vs. MSE and it continued increasing up to the positive
scan limit (0.3 V vs. MSE). According with the CV profiles in the supporting electrolyte (refer
to section 4.2 in Chapter 4), the double-layer region in this ternary alloy extended from -0.3
V to 0.1 V vs. MSE; at higher potentials, the current increased dramatically, which could be
a sign for the beginning of gold oxidation. Therefore, the increase in current observed at -
0.3 V could be ascribed to the oxidation of ethanol. The positive scan limit was fixed at 0.35
V to minimize the impact of surface oxides and evaluate the catalytic response of this
nanostructure in the region below the empirical critical potential (i.e., ca. 0.35 V in 0.77 M
HClO4). It was observed that in the forward scan, there was an oxidation peak at ca. 0 V; no
well-developed oxidation peaks were found in the backward sweep. It was also observed
that after completing multiple cycles, the current density decreased dramatically; for
instance, in the first cycle the peak current was 12 µA cmtrue but during the 10th cycle, the
peak current dropped to 7 µA cmtrue . It is possible that the formation of a “passive” layer
during the process is responsible for blocking the active surface and consequently the
decrease in current was observed.
252
Figure A.21 CV profiles of the highest platinum content alloy (3 at.% Pt) in 0.5 M HClO4 – 1 M C2H5OH solution. The number of cycles during the evaluation is shown in the figure. All CV profiles were obtained at 10 mV s-1 at 25 °C.
253
Appendix B. Simulation of Nanoporous Metals Formed by
Electrochemical Dealloying of Ag-Au-Pt Alloys
B.1 Introduction
The formation of porosity has been explored extensively in binary alloys by atomistic
computer simulation. Erlebacher [1,2], following the work done by Sieradzki, Forty and
others [3-8], developed a simulation code called MESOSIM to explore the kinetics and
thermodynamics of nanoporosity evolution in binary FCC alloys using the Kinetic Monte
Carlo (KMC) method. In KMC, the time evolution of an ensemble of atoms is tracked as
atoms diffuse and dissolve according to simple rate laws meant to mimic realistic surface
diffusion and/or electrochemical dissolution events. This model has proven to be very
success to predict the characteristics/properties of nanoporous metals; therefore, initial
steps were taken towards the implementation of a model (based on the original MESOSIM
code) to describe the dealloying of Ag-Au-Pt alloys and reproduce the principal
characteristics of the resulting nanostructures. This effort was carried out in collaboration
with Dr. Dorota Artymowicz, who had worked simulating the formation of nanoporous metals
by dealloying of Ag-Au alloys [9].
B.2 Modeling conditions and results
Some of the necessary assumptions to implement this model have been reported
elsewhere [1,9]; however, a summary is presented here:
1) Two types of site-coordination dependent transitions – dissolution and surface
diffusion – are possible in the system.
254
2) All atoms having at least one un-coordinated bond, which corresponds to three
vacancies among their 12 nearest neighboring sites, are capable of a transition.
3) Atoms of the less noble element, i.e. ‘silver’, can diffuse on the surface or dissolve,
while atoms of the more noble, i.e. ‘gold’ or ‘platinum’, can only diffuse.
4) Rate of dissolution and diffusion events of an individual atom are calculated as
follows:
(B.1)
and
(B.2)
where n is the number of nearest neighbors of the atom, Eb is the interatomic bond energy,
ɸ is the applied electrochemical overpotential, k is the Boltzmann constant and T is the
absolute temperature. Eb is adjusted for the different atom pairs (e.g., 0.15 eV for Ag-Au
pair) and its value was estimated based on the sublimation energy for the different metals
and on the interaction between the different atoms. The pre-exponential factor Cdiffusion is an
attempt frequency of the order of the Debye frequency (for silver, platinum and gold, Cdiffusion
is 1x10¹³, 3x10¹³ and 1x10¹⁴ s-1 respectively). The pre-exponential factor Cdissolution is set to
1x10⁴ s-1. This value is obtained after fitting experimental results of the dissolution of pure
silver (i.e., ~1 monolayer of silver atoms dissolve per second) [1]. As an initial
approximation, binary and ternary hypothetical alloys (i.e., Ag75:Au25 and Ag75:Au20:Pt5
respectively) were defined and the dealloying parameters were selected similarly to the
255
actual experimental conditions: 1100 mV vs. standard hydrogen electrode (SHE) as a
dealloying potential, and 300 s as a maximum dealloying time.
The dealloying cell has been defined to have 128 x 128 x 128 atoms. These values
represent the x, y and z positions along the cubic cell (Figure B.1). Additionally, it was set
that the dealloying front cannot pass a value of z = 8; in other words, atoms with z > 8 do
not take part in the process (i.e., they cannot be dissolved or diffused).
Figure B.1 Orientation of the simulation cell with respect to the orthogonal FCC cubic cell. The sides of the simulation cell are of {111} family and the edges are <110>. Red vertices of the simulation cell coincide with the dace centers of the orthogonal FCC cubic cell.
The main results obtained after simulating the formation of nanoporous metals from
binary and ternary alloys are shown in Figure B.2. Figure B.2a shows a comparison
between the dissolution current for the binary and for the ternary alloy. As shown, there was
no significant difference between the two alloys, which agrees with our experimental data,
even though experimentally the current steadily dropped; while in the simulations the current
dropped and then increased to reach a stable value that remained the same until the
sample has been dealloyed all the way through, i.e., after 100 s, the current densities start
256
decreasing in both alloys, which is associated to the event in which the dealloying front has
reached the z = 8 level. In terms of the dealloying charge (Figure B.2b), it was found that for
both alloys there was a steady increase in the charge in the first 100 s, but then it leveled off
in a value of ca. 18 mC cm-2 (after 100 s of dealloying). This behaviour was because at 100
s the dealloying front was reached; after that, the only available silver was that trapped
inside the ligaments. As discuss later on in this appendix, coarsening of these simulated
structures was minimum (which was not the case in real samples); therefore, the availability
of the retained silver was very limited and its contribution to the total charge was almost
negligible. For the thickness of the dealloyed layer (Figure B.2c), it was found that there was
not significant different between the binary and ternary alloy (ca. 28 nm for both alloys
according with the simulation). Based on our experimental results, ternary nanostructures
always had thicker layers than the binary, which was related to residual silver trapped in the
layers (see Chapter 2 and discussion below).
In terms of the increase in surface area, it was observed that the surface area was
higher in the ternary alloy than in the binary alloy (Figure B.2d), which is in agreement with
the general tendency found in our experiments. However, our experiments suggested that
the surface area in alloys with platinum was significantly higher than in alloys without
platinum; e.g., the surface area in the ternary alloy with the highest platinum content (i.e.,
Ag77:Au:20:Pt3) was almost three times higher than in the binary alloy, which is directly
associated with the significant difference in ligament size between binary and ternary alloys
(see Chapter 2). Figure B.3 shows that indeed, the structure simulated on the binary alloy
had slightly bigger ligaments than that in the ternary alloy; nevertheless, the difference is
minimal if compared with the experimentally determined values. Figure B.4 shows a cross-
sectional view of the nanoporous structures from which a clearest view of the small
difference between ligament sizes amongst structures can be seen.
257
Figure B.2 Comparison between dealloying of a binary (Ag75Au25) and ternary (Ag75Au20Pt5) alloys: (a) anodic current density, (b) charge density passed, (c) thickness of the dealloyed layer and (d) surface increase. These results were obtained by KMC simulation of the dealloying process carried out for a maximum time of 300 s at 1000 mV vs. SHE. Dealloying temperature: 25 °C. The dealloying process in the binary and ternary alloy stopped at 300 s and 200 s respectively.
0 100 200 3000
5
10
15
20
time [s]
passed c
harg
e [
mC
/cm
2]
0 100 200 3000
5
10
15
20
25
30
time [s]
deallo
yin
g d
epth
[nm
]
0 100 200 3000
5
10
15
20
25
time [s]
surf
ace incre
ase
0 100 200 30010
-3
10-2
10-1
100
time [s]
dis
solu
tion c
urr
ent
density [
mA
/cm
2]
binary
ternary
(a) (b)
(c) (d)
258
Figure B.3 Simulated structures of the nanoporous layer for Ag75:Au25 (a and c) and Ag75:Au20:Pt5 (b and d). In all cases, KMC simulations were used. The color code in these structures is as follows: gray atoms represent silver atoms, yellow atoms represent gold atoms that have not diffused; brown atoms represent gold atoms that diffused; green atoms represent platinum atoms that have not diffused and blue atoms represent platinum atoms that diffused. The green lines in (a) show the outline of the simulation cell and the red arrow is the cell’s side surface.
It is important to mention that, according with the simulations (Figure B.3 and Figure
B.4), the dealloying time did not have a significant effect in the coarsening of the structure,
especially in the binary alloy. However, based on our experiment observations, the
dealloying time has a significant effect in the binary alloy, whereas in ternary alloys that
effect was reduced.
259
Figure B.4 Cross-sectional view of the dealloyed simulated structures of the nanoporous layer for Ag75:Au25 (a and c) and Ag75:Au20:Pt5 (b and d). In all cases, KMC simulations were used. The color code in these structures is the same as described in Figure B.3.
In terms of the composition of the dealloyed layer, it was found that the binary alloy
should have more residual silver than the ternary alloy (Figure B.5). This result is opposed
to our experimental findings. As discussed in Chapter 2, ternary alloys trapped more silver
inside the ligaments than binary alloys. This was also confirmed by doing TEM – EDS
analysis on ultramicrotomed samples for the three ternary alloys. In all cases, it was
determined that more silver was left behind in ternary alloys due to the lower coarsening
kinetics (i.e., platinum slows down gold mobility and with that the coarsening of the
structure). The disagreement between simulated and experimental results was probably due
to the lack of coarsening in the simulated structures. One of the biggest disadvantages of
KMC is the impossibility of simulating the dealloying process in an electrolyte-like
environment; in fact, from the code point of view, the electrolyte had been removed and
replaced by the equivalent of vacuum. This of course has implications for the relaxation of
260
the metal surface (i.e., surface diffusivities of metals) [10-12], which will directly impact the
coarsening of the simulated structure. This lack of coarsening in the structures could explain
the small difference in ligament size between binary and ternary structures.
Figure B.5. Content of residual silver trapped in the dealloyed layer formed on the binary and ternary alloy (Ag75:Au25 and Ag75:Au20:Pt5 respectively) after simulating the dealloying process at 1000 mV vs. SHE and 25 °C. The dealloying process in the binary and ternary alloy stopped at 300 s and 200 s respectively.
In addition of the amount of retained silver in the nanoporous structures, information
about the surface atoms was obtained for the binary and ternary alloys. Figure B.6a shows
that in the ternary alloy gold represents the 75% on the surface atoms and platinum the
remaining 25%; whereas in the binary alloy most of the surface was covered with only gold.
Approximately 5% of the surface atoms were silver atoms that did not dissolved during the
electrochemical process. These maximum relative compositions were obtained after
approximately 100 s, before that a steady increase in the fraction of more-noble elements
was observed (i.e., silver was steadily removed in that time-frame). Figure B.6b shows that
the platinum-to-gold ratio increases to a value slightly higher than 30% after 200 s of
dealloying, which is not possible since the original ratio of platinum-to-gold was 0.25 and
0 100 200 3000
0.2
0.4
0.6
0.8
time [s]
[Ag]
in d
eallo
yed layer
ternary
binary
261
should remain the same during dealloying (more-noble elements do not dissolve during the
process). Moreover, the platinum-to-gold ratio also gave us an estimate of the fraction of
platinum atoms on the surface of the ligaments, which in our experimental results was ca. 7
% for the alloy with 3 at.% Pt. Even though in this case the “ternary alloy” had higher content
of platinum (5 at.%), the simulated values we obtained were very high and did not represent
the trend we observed experimentally.
Figure B.6 (a) Fraction of the more-noble elements in the binary (Ag75:Au25) and ternary alloy (Ag75:Au20:Pt5); (b) ratio of platinum and gold on the surface of the ligaments. Simulation conditions: dealloying potential - 1000 mV vs. SHE and 25 °C as a dealloying temperature. The dealloying process in the binary and ternary alloy stopped at 300 s and 200 s respectively.
0 100 200 3000.5
0.6
0.7
0.8
0.9
1
time [s]
fraction
[MN] ternary
[Au] bianry[Au] ternary
0 50 100 150 2000.1
0.15
0.2
0.25
time [s]
[Pt]
to [
Au]
ratio
262
After analyzing these preliminary results, it was obvious to us that we were not able to
properly model the coarsening of the structure, especially in the case of NPG, in which
coarsening has rather aggressive consequences in the ligament size. As described before,
while dealloying progresses, the size of pores and ligaments keeps increasing; at the same
time that ligaments grow in size, more original alloy is exposed to the electrolyte allowing
removal of silver from the already formed ligaments. That is the reason why the amount of
silver retained in NPG was always lower than that in the ternary alloys, in which coarsening
is significantly hindered (i.e., significantly smaller ligaments than the binary alloy). As a
consequence, the thickness of the layer was smaller in NPG and the developed surface
area was much higher in ternary alloys. In our attempt to improve the model, some of the
parameters in the model (e.g., bonding energy between atoms) were adjusted; however, no
significant improvement in the final outcome of the model was achieved.
This Monte Carlo model has been remarkably successful to reproduce/predict the
main dealloying characteristics; however, it is clear that the direct comparison between real
dealloyed structures and those formed by simulation (e.g., ligament size, coarsening) is not
yet possible. The simplifications that have been implemented to reduce its computational
cost limit its use to correlate specific characteristics of the nanoporous material. In addition,
it was recently reported that other phenomena could play a role during the coarsening
process. Kolluri and Demkowicz [13] argued that localized plasticity of ligaments is a
process that not only could explains coarsening, but also could explain the formation of
enclosed bubbles and reduction of the of the volume in NPG, which are not intuitive if
coarsening is only associated with surface gold diffusion. At this point however, we are not
suggesting that the outcome of the current model is solely because the abovementioned
processes are not being considered; but we believe that at this stage is important to
263
consider possible parallel processes that could participate in the coarsening of these
structures. Unfortunately, the MESOSIM code is limited to the surface diffusion process.
Although the comparison between simulated and real structures would be very
valuable for the fundamental understanding of the role of ternary noble-elements during the
dealloying process, the main goal of this research project was the experimental
characterization of ternary alloys, and working in this model required a significant amount of
time, which became a limiting factor for us. Therefore, we suggested to continue this effort
in the near future, but not necessarily as part of this project.
B.3 References
1. J. Erlebacher. (2004). An atomistic description of dealloying - Porosity evolution, the
critical potential, and rate-limiting behavior, J. Electrochem. Soc., 151, C614.
2. J. Erlebacher, M. J. Aziz, A. Karma, N. Dimitrov and K. Sieradzki. (2001). Evolution of
nanoporosity in dealloying, Nature, 410, 450.
3. H. W. Pickering. (1983). Characteristic Features of alloy polarization curves, Corros.
Sci., 23, 1107.
4. H. W. Pickering and C. Wagner. (1967). Electrolytic dissolution of binary alloys
containing a noble metal, J. Electrochem. Soc., 114, 698.
5. A. J. Forty and P. Durkin. (1980). A micro-morphological study of the dissolution of
silver-gold alloys in nitric acid, Philos. Mag. A, 42, 295.
6. A. J. Forty and G. Rowlands. (1981). A possible model for corrosion pitting and
tunnelling in noble-metal alloys, Philos. Mag. A, 43, 171.
7. A. J. Forty. (1979). Corrosion micro-morphology of noble-metal alloys and depletion
gilding, Nature, 282, 597.
264
8. K. Sieradzki, R. R. Corderman, K. Shukla and R. C. Newman. (1989). Computer-
simulations of corrosion - selective dissolution of binary-alloys, Philos. Mag. A, 59,
713.
9. D. M. Artymowicz, J. Erlebacher and R. C. Newman. (2009). Relationship between the
parting limit for de-alloying and a particular geometric high-density site percolation
threshold, Philos. Mag., 89, 1663.
10. J. M. Doña and J. González-Velasco. (1993). Mechanism of surface diffusion of gold
adatoms in contact with an electrolytic solution, J. Phys. Chem., 97, 4714.
11. M. P. Garcia, M. M. Gomez, R. C. Salvarezza and A. J. Arvia. (1993). Effect of the
solution composition and the applied potential on the kinetics of roughness relaxation
at gold electrodes in slightly acid electrolytes, J. Electroanal. Chem., 347, 237.
12. C. Alonso, R. C. Salvarezza, J. M. Vara, A. J. Arvia, L. Vazquez, A. Bartolome and A.
M. Baro. (1990). The evaluation of surface diffusion coefficient of gold and platinum
atoms at electrochemical interfaces from combined STM-SEM imaging and
electrochemical techniques, J. Electrochem. Soc., 137, 2161.
13. K. Kolluri and M. J. Demkowicz. (2011). Coarsening by network restructuring in model
nanoporous gold, Acta Mater., 59, 7645.
265
Appendix C. List of Publications and Presentations
C.1 Publications
Vega, A., and R. C. Newman. Electro-oxidation of ethanol on highly porous
nanostructures obtained by dealloying of binary and ternary noble-metal alloys, submitted
to Electrochimica Acta (May, 2014).
Vega, A., and R. C. Newman. Methanol electro-oxidation on nanoporous metals formed
by dealloying of Ag-Au-Pt alloys, submitted to the Journal of the Electrochemical Society
(May, 2014).
Vega, A., and R. C. Newman. Nanoporous metals: formation, characteristics, tunability
and prospects for catalytic activity, in Dekker Encyclopedia of Nanoscience and
Nanotechnology, 3rd Edition, S. E. Lyshevski, Editor, CRC Press: New York, 2014, pp.
3217-3229.
Vega, A., and R. C. Newman. Beneficial effects of adsorbate-induced surface
segregation of Pt in nanoporous metals fabricated by dealloying of Ag-Au-Pt alloys.
Journal of the Electrochemical Society, 161, pp. C11-C19, 2014.
Vega, A. and R. C. Newman. Nanoporous metals fabricated through electrochemical
dealloying of Ag-Au-Pt with systematic variation of Au:Pt ratio. Journal of the
Electrochemical Society, 161, pp. C1-C10, 2014.
Vega, A. and R. C. Newman. Fabrication of nanoporous metals by dealloying of ternary
alloys: evaluation of their electrocatalytic properties, Technical proceedings of the 2012
NSTI Nanotechnology Conference and Expo, NSTI-Nanotech, pp. 510-513, 2012.
266
C.2 Presentations
Vega, A., R.C. Newman*. (2014). Formation, characteristics and tunability of highly
porous nanomateriales obtained by dealloying of ternary noble-metal alloys. Paper
accepted for oral presentation at the 5th International Conference of Porous Media and its
Applications in Science, Engineering and Industry (ICPMV), Kona, HI, United States of
America, June 22-27.
Vega, A.*, R.C. Newman. (2014). Formation of nanoporous metals by dealloying of
ternary noble-metal alloys: characteristics, tunability and prospects for catalytic activity.
Paper accepted for oral presentation at the 15th Topical Meeting of the International
Society of Electrochemistry, Niagara Falls, ON, Canada, April 27-30.
Vega, A., R.C. Newman*. (2013). Surface chemistry and morphology of nanoporous
metals synthesis from Ag-Au-Pt precursors. Oral presentation delivered at the 14th
Topical Meeting of the International Society of Electrochemistry, Santiago de Queretaro,
QUE, Mexico, September 9-13.
Vega, A.*, R.C. Newman. (2013). Nanoporous metals from dealloying of ternary noble-
metal alloys: composition, morphology, stability and prospects for catalytic activity. Paper
presented as oral presentation at the 223rd ECS meeting, Toronto, ON, Canada, May 12-
16.
Vega, A., R. C. Newman*. (2013). Manipulating the morphology and surface chemistry of
nanoporous metals for potential (electro)catalytic applications. Oral presentation
delivered as an invited speaker at the 25th Canadian Materials Science Conference,
London, ON, Canada, May 7-10.
Vega, A.*, R. C. Newman. (2012). Fabrication and characterization of nanoporous metals
by electrochemical dealloying of AgAu(Pt) alloys. Paper presented as oral presentation at
267
the Student Corrosion Research Symposium held at University of Toronto, Toronto, ON,
Canada, June 25.
Vega, A.*, R. C. Newman. (2012). Fabrication of nanoporous metals by dealloying of
ternary alloys: evaluation of their electrocatalytic properties. Paper accepted for poster
presentation at the TechConnect World Conference and Expo 2012, Santa Clara, CA,
United States of America, June 18-21.
Vega, A.*, R. C. Newman. (2012). Fabrication of nanoporous metals by dealloying of
AgAu(Pt) alloys. Paper accepted for oral presentation at the 24th Canadian Materials
Science Conference, London, ON, Canada, June 5-8.
Vega, A.*, R.C. Newman. (2012). Assessment of the electrocatalytic activity of
nanoporous metals formed by dealloying of AgAu(Pt) alloys with systematic variation of
Au to Pt ratio. Paper accepted for oral presentation at the ECS Spring meeting, Seattle,
WA, United States of America, May 6-10.
Vega, A.*, R. C. Newman. (2012). Formation and electrocatalytic activity of nanoporous
metals formed by dealloying of AgAu(Pt) alloys with systematic variation of Au to Pt ratio.
Poster presented at the Spring Symposium of the ECS Canadian section, Montreal, QC,
Canada, April, 27.
Artymowicz, D., A. Vega, R. C. Newman*. (2012). Progress in modeling alloy corrosion –
Ternary alloys. Paper accepted for oral presentation at the NACE Conference, Utah,
United States of America, March 12-14.
Vega, A.*, R. C. Newman. (2011). Dealloying of AgAu(Pt) alloys and formation of
nanoporous metals. Paper presented as oral presentation at the Student Corrosion
Research Symposium held at McMaster University, Hamilton, ON, Canada, July 4.
Vega, A. A*, D. Artymowicz, R. C. Newman. (2010). Electro-oxidation of methanol by
nanoporous gold (NPG) formed by dealloying of binary and ternary alloys. Poster
268
presented at the Gordon Graduate Research Seminar on Aqueous Corrosion, London,
New Hampshire, United States of America, July 7-8.