Page 1
8/20/2019 Formation Evaluation Using Wireline Formation Tester Pressure Data - JPT 1978
http://slidepdf.com/reader/full/formation-evaluation-using-wireline-formation-tester-pressure-data-jpt-1978 1/8
Formation
valuation Using Wireline
Formation
Tester Pressure
ata
J. J. Smolen,
SPE-AIME, Schlumberger Well Services
L.
R. Litsey, Chevron U.S.A. Inc.
Introduction
One key to meeting our future energy requirements is
more efficient productionof new and remaining reserves.
To this end, information is needed on conditions down
hole, including accurate down-hole formation pressures.
The Schlumberger Repeat Formation TestetrM (RFT) is
an open-hole wireline device capable of providing such
pressure data with minimal demands for drilling-rig time.
The RFT may be set any number of times during a
single logging run. At each setting depth, a pretest is
made in which small samples offluid are withdrawn from
the formation. During this pretest, the fluid pressure in
the formation adjacent to the wellbore is monitored until
equilibrium formation pressure is reached. These RFT
pressure data are recorded at the surface on both analog
and high-resolution digital scales.
The pretest fluid samples are not saved. However,
after the pretests in a zone
of
interest, another larger fluid
sample can be taken optionally and retained, with the
possibility of retrieving two such fluid samples per trip in
the hole. In this paper, however, interest is directed to the
large number of pressure measurements that can be made
by setting the tool and going through the pretest cycle at
successively different levels.
Recent experience
of
Chevron U.S.A. Inc., in the
Rangely Field
of
Colorado is described to demonstrate
the quality
of
the pressure measurements and the reli
ability of tool operation. Chevron applies the pressure
information to the planning and monitoring
of
a sec-
0149-2136n9/0001-6822 OO.25
© 979 Societyof PetrolelJll Engineers of AIME
ondary-recovery waterflood project. Pressure data, in
conjunction with other data available during the drill
ing
of infill wells, were used to predict which flooded
zones would produce with a high water cut. By eliminat
ing these zones from production and by injecting into
essentially unflooded zones, the effectiveness of the
flood could be enhanced. The pressure measurements
have been used with open-hole and mud-log data to pre
dict the expected water cut. Significant pressure over
balance suppresses hydrocarbon shows on the mud
log. Pressure underbalance exaggerates hydrocarbon
shows. Both lead to erroneous water-cut predictions.
Knowledge of the pressures makes it possible
to
allow for
such errors .
Pressure profiles through the Weber sandstone reser
voir were determined in a number of wells in the Rangely
Field. Reservoir pressures were found to vary greatly and
to be distributed erratically both vertically and horizon
tally. This is attributed to the field s long history of
production and water injection and to the fact that many
of the permeable zones are discontinuous. Plotting these
pressure data on contour maps delineates areas requiring
increased flooding to maintain the effectiveness of the
waterflood program.
During the drawdown phase
of
the pretest, when fluid
is being extracted from the formation, the pressure be
havior is indicative of the minimum local permeability at
that depth. A simple technique is described for computa
tion of permeability from the pressure data, based on a
steady-state spherical flow model. Results are compared
This
paper
describes the Repeat Formation Tester
@
a tool that can make on one open-hole trip
an unlimited number
of
pressure determinations. Down-hole pressure data from the tool are
used to monitor
and
enhance the effectiveness
of
a waterflood in Rangeley Field CO.
atafrom
this tool also are used in a technique to evaluate permeability; results in U.S.
Gulf
Coast wells
are compared with those from sidewall cores.
JANUARY 1979
25
Page 2
8/20/2019 Formation Evaluation Using Wireline Formation Tester Pressure Data - JPT 1978
http://slidepdf.com/reader/full/formation-evaluation-using-wireline-formation-tester-pressure-data-jpt-1978 2/8
ANTI STICK
PAD
/
b
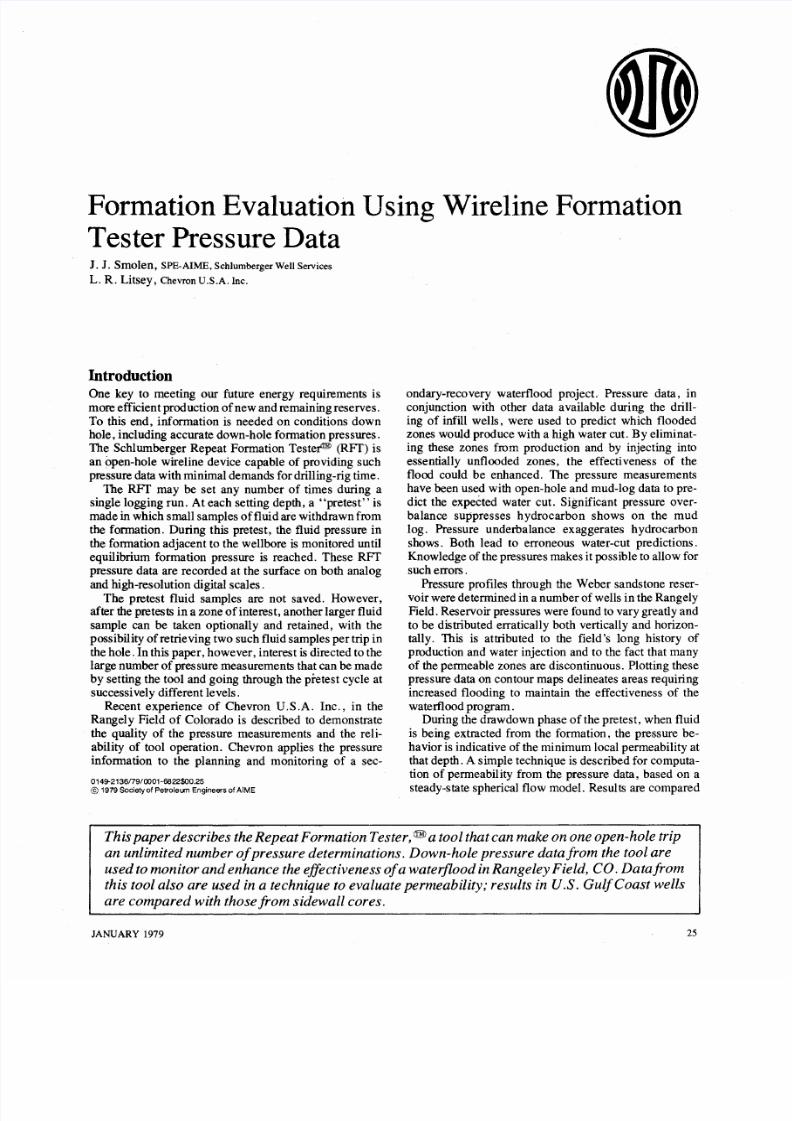
Fig. 1-Setting section of the Repeat Formation
Tester<fil
(RFT)
in retracted
and
set positions.
FLOW
LINE
EOUALIZING
VALVE
(to
mud
column)
SEAL VALVE
(to lower
sample chamber)
PACKER
;
r - - - ' i ~ F I L T E R PROBE
PRESSURE
GAGE
• CHAMBER I
CHAMBER 2
PRETEST
CHAMBER
SEAL VALVE
(to upper
sample chamber)
Fig. 2-Schematic of RFT sampling system.
26
FORMATION
PRESSURE
Fig. 3-Schematic of RFT analog-pressure recording.
with sidewall-core data gathered primarily from Gulf
Coast wells.
Tool Operation and Pressure Record
While the RFf can retrieve two fluid samples per trip in
the hole, the primary focus here
is
on its multiple-level
pressure-measuring ability. The testing section of the tool
is
illustrated in a photograph Fig. 1). The configuration
and pretest operation have been modified somewhat from
that reported earlier.
1
In Fig. la the tool
is
shown in its
retracted position; when set for a test, the tool is hydrau
lically actuated
to
the position in Fig. lb. Formation
fluids enter the tool through the probe, and the rubber
packer assures that the test is isolated hydraulically from
the well bore fluids. Integral with the probe is a slotted
filter element that is cleaned by the motion of a filter
probe piston during the setting process. Also indicated on
Fig. 1 are antis tick pads that hold the tool off the forma
tion and thereby eliminate any tendency to stick as a
resul t
of
differential pressure.
One of the original purposes of the pretest was to
assure a good retrieved sample by making a preliminary
test for hydraulic seal and sufficient permeability. This is
accomplished by monitoring the pressure with a digital
readout at the surface as small test samples
of
fluid are
withdrawn from the formation. However, the pretest
is
very useful in its own right as a pressure-measuring test.
The
RFf
pretest and sampling system
is
schematically
shown in Fig. 2. After setting the tool, the pretests are
activated automatically and sequentially. The low-flow
rate pretest using Chamber
1
withdraws 10 cm
3
of fluid
from the formation by movement
of
a piston in the pretest
chamber. This is followed immediately by the second
pretest which withdraws another 10 cm
3
at a higher flow
rate using Chamber 2). The rates of withdrawal for
different pretests vary slightly with the tool and down
hole conditions. However, where the fluid
is
produced
from the formation rapidly enough
to
fill the pretest
chambers
as
their volumes increase, the ratio of the flow
rates in the two pretest periods
is
about 1:2.5. The total
time to fill the two chambers is slightly more than 20 s.
Since the pretest withdraws only 20 cm
3
total, the fluid is
essentially all mud filtrate. In some cases, the high-flow
rate pretest may be deactivated to minimize the pressure
drawdown and the likelihood of the tool ingesting debris.
The pressure gauge is located in the flowline down
stream of the filter probe. During a pretest, the pressure
drop in the flowline
is
essentially. negligible and the
pressure indicated by the gauge is that at the formation
face in contact with the probe. A schematic of a typical
pressure profile
is
shown in Fig. 3. The pressure is
initially at hydrostatic mud) condition. When the packer
firs t engages the mud cake, the pressure ma y rise because
of packer or mud compression, followed by a decrease
due to the retraction of the filter-probe piston. When the
piston stops, the pressure builds up due to continued
compression of the packer but suddenly drops again at
the beginning of the pretest. At time t Fig. 3), the
piston in Chamber 1
is
fully withdrawn, and the first
pretest is completed.
It
is followed immediately by the
higher flow rate and, hence, larger pressure drop of the
second pretest. At time
t
2
the piston in the second
chamber is fully withdrawn, and the pressure builds up to
formation pressure.
JOURNAL OF PETROLEUM TECHNOLOGY
Page 3
8/20/2019 Formation Evaluation Using Wireline Formation Tester Pressure Data - JPT 1978
http://slidepdf.com/reader/full/formation-evaluation-using-wireline-formation-tester-pressure-data-jpt-1978 3/8
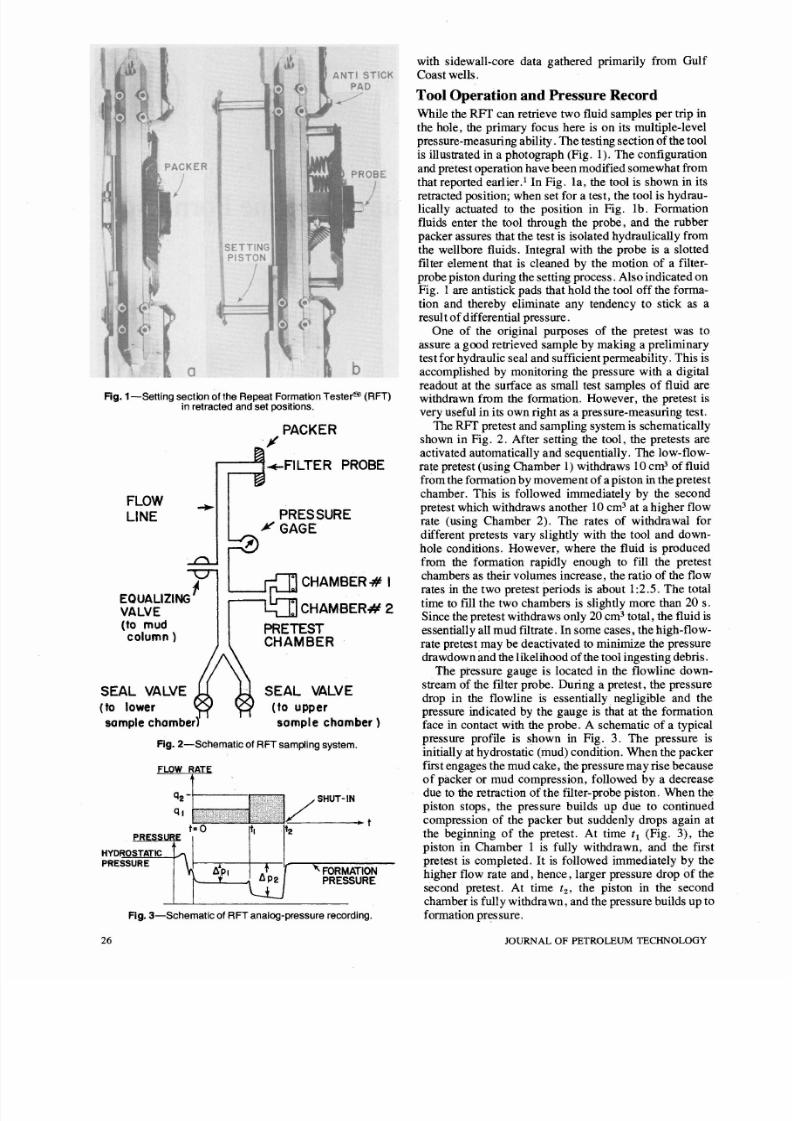
TABLE 1-REPEATFORMATION TESTER SPECiFiCATIONS
Pressure rating, psi
20,000
350
6
14
3
4
33
Temperature rating,
of
Minimum hole size, in.
Maximum hole size, in.
Basic make-up length (excluding options),
It
Formation-pressure readings per trip in hole
Sample chamber sizes, gal
Any number
1,2
3
/4
,6,
and 12
Pressure Measurement Specifications
Accuracy· Resolution
(psi)
Repeatability·
( )
No temperature correction
With temperature correction
Special at temperature
calibration
'Based on percent/ulf-scale, 10,OOO-psi gauge.
A typical recording is illustrated in Fig. 4. The left
track of the log
is
the analog pressure recording on a 0
to
10,000 psi (0 to 68.95 MPa) scale. This recording
is
an
excellent means of
evaluating quickly the integrity and
general character of the pretest and the producibility
of
a
formation. However, for any quantitative evaluation, a
four-scale digital recording in the right tracks offers high
resolution and accuracy. For example, hydrostatic pres
sure, indicated before the tool begins setting,
is
4,349 psi
(29.99 MPa). (See numbers beside curves at top
of
log.)
Near the bottom
ofthe
log, the pressure ultimately builds
up smoothly to a shut-in formation pressure of 3,850 psi
(26.55 MPa). The pressure during the first pretest is
drawn down to about 1,850 psi (12.76 MPa), while it is
drawn down
to
about 100 psi (0.69 MPa) during the
second pretest.
RFT specifications are summarized in Table 1.
ANALOG PRESSURE
DIGITAL
PRESSURE RECORDING,
psi
RECORDING, psi
0
10000
1
1000
T e ~ N o
,I 100
1 ) J )
0
0
I
r ~
1
~
HYDROSTATIC PRESSURE-
t
40901 1300
i O ~ ·
~ ~ ~
TOOL SETTING
6
Sec
I ~
•
I
1.
-=
r = ~
It
I · 0
'-
I
p ~
r il
'
J
I
t
EiS1
-, .
I
fCD
lJ
1=:::=
::;t::
F-
t
1 .12
I
:..r-.
'
':=
~
-1=
i
h
i
I
1'-
I
i
i
rl...
I
~
i
R
i
SHUT-IN PRESSURE
FIitOM PRETEST
i
l
-
Fig. Typica l RFT pretest pressure record, showing both
analog and digital pressure scales. Recording
is
made in camera
at surface.
JANUARY 1979
( )
0.98
0.29
1.0
1.0
0.05
0.05
0.18
1.0
0.05
Pressure Measurements in Rangely Field
Rangely Field (operated by Chevron) is an anticlinal
closure located in northwestern Colorado on an arch
between the Piceance and Uintah basins (Fig. 5). The
principal production
is
from the Permo-Penn Weber for
mation, which is composed of 600 to 900 ft(183
to
274
m)
of
interbedded sands, silts, and shales. This formation
interfingers across the structure
to
the south and southeast
into the arkosic Maroon formation. This reservoir com
prises a series
of
irre gular porous zones within the thicker
sand units. The porous sands are separated by imperme
able intervals
of
silt, shale, and tight, well-cemented
sand. In general, porosity within the reservoir averages
about 15 . Permeability ranges up to several hundred
millidarcies but averages between 5 and 50 md.
2
Well
to-well correlation of the producible sands
is
difficult
• PROOUCING WELLS
INJECTION WELLS
STUOY RE
Fig.
SB--Structure
of Rangely Field as mapped on top of
Weber formation.
27
Page 4
8/20/2019 Formation Evaluation Using Wireline Formation Tester Pressure Data - JPT 1978
http://slidepdf.com/reader/full/formation-evaluation-using-wireline-formation-tester-pressure-data-jpt-1978 4/8
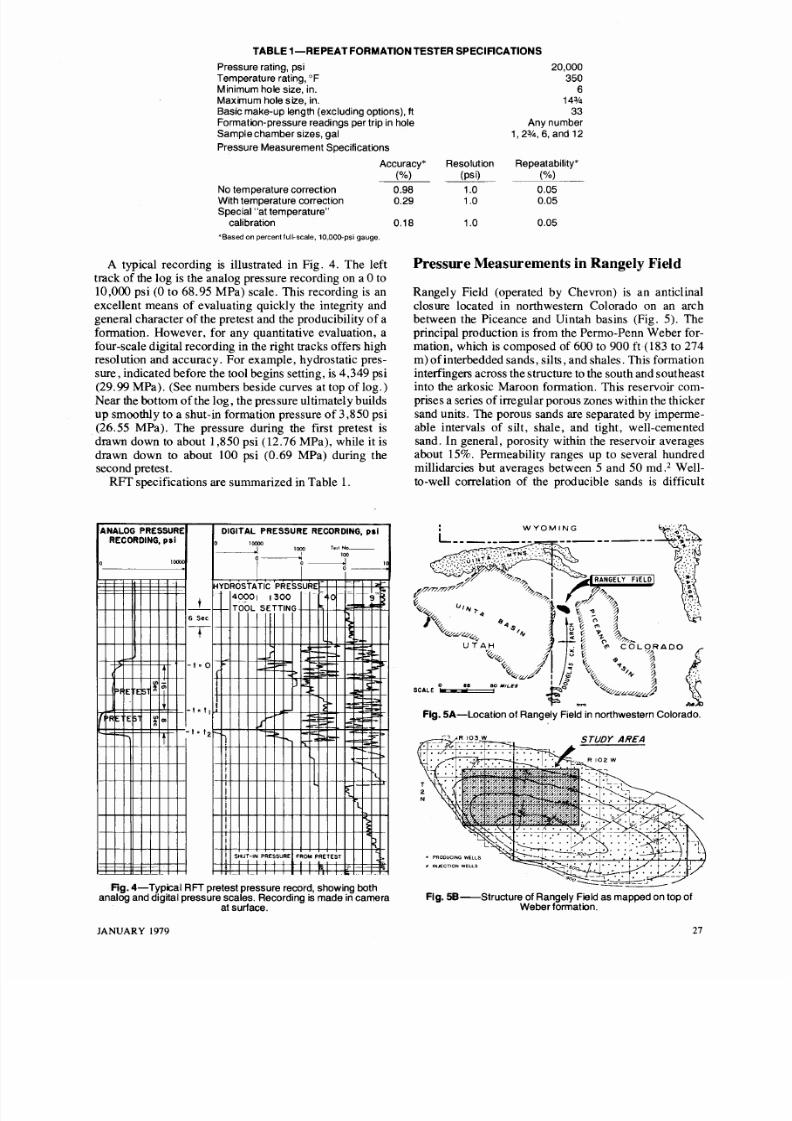
T BLE 2 RESULTS OF PRESSURE TESTS REPE TED T OR NE R THE
S ME DEPTHS N R NGLEY FIELD
Well
Number
4
8
Depth
5,767
5,768
6,055
6,055
6,063
6,064
6,165
6,165
6,166
6,135
6,135.5
6,276
6,276
Porosity, q
( )
17.0
18.0
15.5
15.5
16.0
16.0
15.5
15.5
14.0
15.5
15.0
17.0
17.0
9 6,520 14.5
6,520 14.5
6
6,551 14.5
6,551 14.5
8
~ 7 8
15
5,785 15
6,100 16.0
6,100 16.0
6,276 8.0
6,276 8.0
21
5,980 13.5
5,980 13.5
22 5,967.5 4
5,968 4
23 5,995 13
5,997 13
24 6,104.5 12
6,105 12
because of lateral heterogeneity. This is partly because
porous zones may not necessarily correspond to deposi
tional units. The field
is
now under waterflood.
The RFf has been used in 25 recent infill wells to
obtain pressures in the Weber sandstone reservoir. No
fluid samples were taken. The tool was set in zones
having porosities, as determined from the density log,
from
10
to 22 . In wells tested between July 1976 and
June 1977, 643 pressure measurements were attempted in
390 different porous intervals. Of these attempts, there
were 21 seal failures and 274 dry tests. Seven
of
the
21
seal failures occurred on the first two logging runs. The
dry
tests are attributed to setting the tool in tight streaks in
the formation, although it is possible that some dry tests
may have been caused by either plugging of the probe or
formation damage from drilling operations. Pressures
were obtained in 317 of the porous intervals, or about
80 of those tested. While the tool was stuck in one well
(apparently as a result of key seating of the cable), stick
ing
of
he tool i tself has not been a problem.
Duplication of the pressure measurements has been
excellent. Pressure tests have been repeated at or near the
same depth in 15 different porous zones. These results are
summarized in Table 2. In two-thirds of the tests, the
pressures repeat to within less than 5 psi (0.035 MPa). In
the remaining tests, the highly discrepant readings appear
to be caused by failure
of
the pressure to fully build up to
that of the formation when the pretest ended. This may be
caused by the tool probe being positioned in a low
permeability streak, which results in an abnormally long
buildup period.
28
Pressure
(psi)
1,619
1,618
2,625
2,625
2,627
2,629
2,535
2,533
2,535
2,909
2,908
2,809
2,810
3,236
3,147
1,436
1,437
2,876
2,864
3,018
3,020
3,060
2,810
2,913
2,909
2,035
2,037
3,010
2,953
892
870
Buildup
Time
(minutes)
0.5
3.5
2.0
2.5
2.0
1.0
2.0
2.0
1.5
3.0
3.5
1.0
1.0
3.9
8.3
0.9
0.8
1.0
1.3
1.3
3.1
3.0
11.4
2.0
1.8
1.8
1.9
0.9
4.6
4.6
4.0
Pressure
Difference
(psi)
o
2
2
89
12
2
250
4
2
57
22
Pressures have been obtained with pressure bombs run
after swab testing in 29 of the zones where RFf pressures
were measured.
RFf
pressures averaged about 75 psi
(0.52 MPa) higher than those measured with the pres
sure bomb after swabbing the well and allowing it to fill
up and stabilize, but pressure differences
as
high as 460
psi (3.172 MPa) were seen. The pressure differences
were less than 200 psi (1.379 MPa) in 22 cases and less
than 100 psi (0.69 MPa) in 14 cases. The values of stabi
lized pressures obtained after swabbing are subject to
some error because the buildup times generally were
less than 15 hours, and considerable extrapolation was
required in many cases.
stimation of Water
ut
Rangely Field has been under waterflood since 1958 and
has many wells that produce with a high water cut.
n
this
field, the RFf is run immediately following wireline
logging. The density log is used to select the porous test
intervals and the gamma ray curve
is
used to delineate the
cleaner zones in the porous interval. A porosity cutoff of
10
is
used in the Weber reservoir
to
define producible
reservoirs. Generally, pressure measurments have been
attempted in 15 to 20 zones in each well. Fig. 6 shows a
typical pressure profile and open-hole logs. For conve
nience, the Weber reservoir traditionally has been sub
divided into at least five zones, designated A through E
in Fig. 6.
In recent development drilling, a method was needed
to estimate oil and water cuts in the various porous sands
without testing to eliminate high-water-cut sands from
JOURNAL
OF
PETROLEUM TECHNOLOGY
Page 5
8/20/2019 Formation Evaluation Using Wireline Formation Tester Pressure Data - JPT 1978
http://slidepdf.com/reader/full/formation-evaluation-using-wireline-formation-tester-pressure-data-jpt-1978 5/8
the productive intervals. One method that has proven
useful is to combine RFf pressure data with information
provided by monitoring the drilling mud.
The mud log has been used extensively
to
detect and
evaluate potentially productive reservoirs in exploratory
wells by monitoring the drilling mud for hydrocarbons.
In some areas it also has been used for evaluating de
velopment wells. Gas-detection equipment monitors the
drilling fluid
to
detect the presence of hydrocarbon and to
measure the relative amount. The amount of hydrocar
bon entering the drilling mud while drilling through a
hydrocarbon-bearing reservoir
is
affected by several
factors. These are primarily formation pressure, mud
weight, saturation, porosity, and penetration rate. Poros
ity information is available from a porosity log, and
penetration rate and mud weight are recorded during
drilling operations, but until the advent of the RFf
formation pressures were not readily available.
Formation pressures obtained with the
RFf
are used to
determine the pressure overbalance (amount the hydro
static pressure in the mud column at time of drilling
exceeds the formation pressure). Mud-log gas shows will
be strongly suppressed in zones where the pressure over
balance is high, whereas they will be exaggerated in
zones where the overbalance is low or negative. The
pressure ovetbalance therefore is
used
to
qualify the
interpretation
of
mud-log shows when estimating oil and
water cuts. To date, these pressure overbalances have
been used in a qualitative sense only.
COMPENSATED
FORMATION DENSITY
LOG
P R E S S ~ E PROFILE
REPEAT FORMATION TESTER
GAMMA RAY
BULK DENSITY
RESERVOIR
PRESSURE
2.0
psi)
2000 3000
A
<==--I: j
1
f----- J-----t;r ---- ~
C
~ . 1 1 - - - - - - - ~ - - - - - - - - - - - - 18T
~
Fig. 6-Density log and pressure profile showing typical Weber
reservoir and Reservoir Zones A through E
JANUARY 1979
Fig. 7 shows a typical portion of the reservoir in which
five pressure tests were conducted in porous intervals.
The pressure overbalance is indicated by a bar at the
setting depth. The drilling penetration rates in Zones I
and IV were about equal. In Zone IV, the mud log shows
a strong 112-gas-unit anomaly with a pressure ovetbal
ance of 32 psi (2.21 MPa). Swab tests proved this zone
to be 100 oil productive. In Zone I, the mud log is more
pessimistic, with a maximum reading of only 63 gas
units, leading to an interpretationof significant expected
water cut. Overbalance pressure, however,
is
520 psi
(3.59 MPa), significantly larger than for Zone IV. Swab
tests showed this zone also to be 100 oil productive,
suggesting that pressure overbalance may have sup
pressed the mud-log reading. While Zone V was not
swab tested, the extreme pressure overbalance
of
2,073
psi (14.29 MPa) indicates a highly suppressed mud-log
show, and consequently, even in view of the indications
on the mud log in Fig. 7, the zone might be expected to
yield a low water cut.
Analysis of Pressure ProfIles
and
Maps
Besides estimating oil and water cuts, pressures from the
RFf used with wireline logs can provide information
about reservoir continuity and the effectiveness of the
waterflood program. When such pressures are plotted
as
profiles for well-to-well comparison (Fig. 8), one strik
ing feature that emerges is the great variation in pres
sures, both laterally and vertically. However, with
PRESSURE
OVERBALANCE
1000 2000
PSI
Fig. Typical mud-log gas curve with pressure overbalance
excess of hole pressure at time of drilling over formation
pressure) and open-hole logs.
29
Page 6
8/20/2019 Formation Evaluation Using Wireline Formation Tester Pressure Data - JPT 1978
http://slidepdf.com/reader/full/formation-evaluation-using-wireline-formation-tester-pressure-data-jpt-1978 6/8
WELL
II
WELL 2 WELL 4 WELL 8 WELL 5 WELL 4 WELL 24 WELL 2
WELL I
psi)
2000
2000 0 1000
2000
3000 2000 2000
2000
2000 2000
2000
O ~ - L - t T ~ O = = P ~ W ~ E ~ B ~ E ~ R = r ~ - - ~ ~ ~ - L - - - - L - ~ - L - - ~ - - r - ~ - - ~ - t ~ L - - - ~ ~ ~ - - - - ~ i - ~ - - ~ - - r - ~
100
200
300
500
600
ft.
®
®
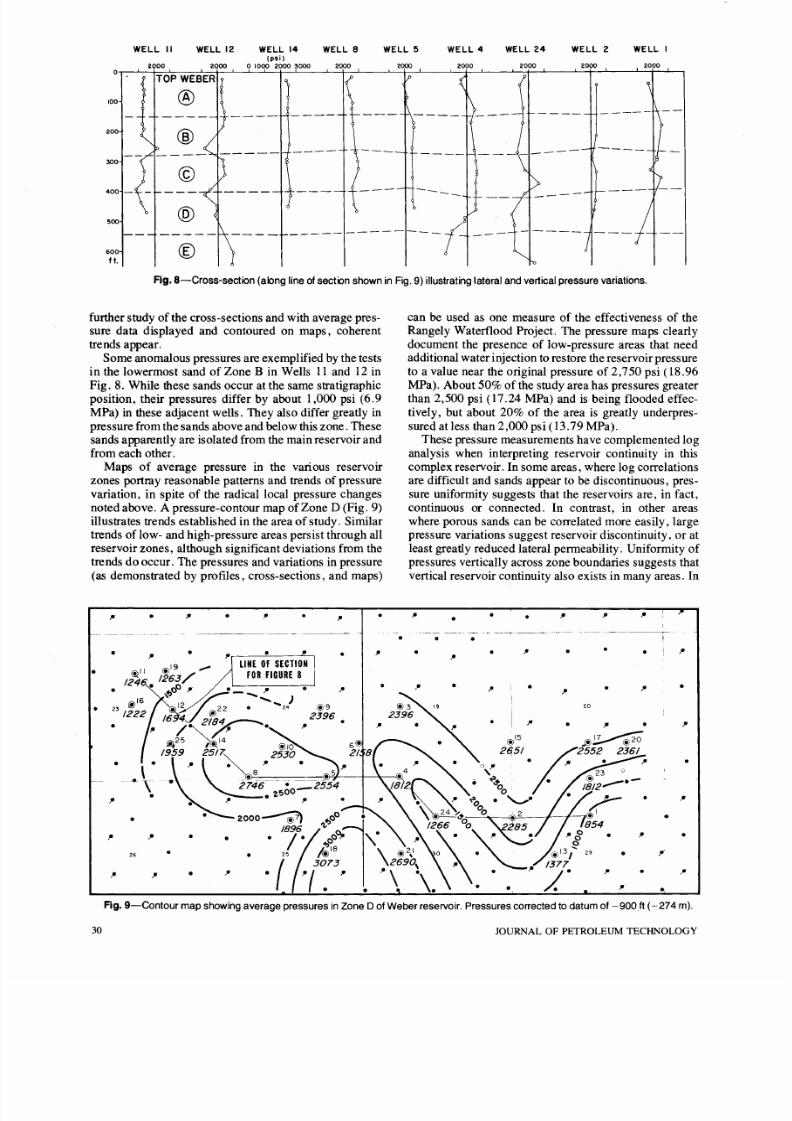
Fig.
8-Cross-section
(along line of section shown in Fig. 9) illustrating lateral and vertical pressure variations.
further study
of
the cross-sections and with average pres
sure data displayed and contoured on maps, coherent
trends appear.
Some anomalous pressures are exemplified
by the tests
in the lowermost sand
of
Zone B in Wells
11
and
12
in
Fig. 8. While these sands occur at the same stratigraphic
position, their pressures differ by about 1,000 psi (6.9
MPa) in these adjacent wells. They also differ greatly in
pressure from the sands above and below this zone. These
sands apparently are isolated from the main reservoir and
from each other.
Maps of average pressure in the various reservoir
zones portray reasonable patterns and trends of pressure
variation, in spite of the radical local pressure changes
noted above. A pressure-contour map of Zone D (Fig. 9)
illustrates trends established in the area of study. Similar
trends of low- and high-pressure areas persist through all
reservoir zones, although significant deviations from the
trends do occur. The pressures and variations
in
pressure
(as demonstrated by profIles, cross-sections, and maps)
•
•
.
,.
•
.
•
.
LINE OF SE TION
•
FOR FIGURE 8
•
•
•
•
•
•
•
•
•
2.
•
•
?
•
.
•
can be used as one measure
of
the effectiveness of the
Rangely Waterflood Project. The pressure maps clearly
document the presence
of
low-pressure areas that need
additional water injection to restore the reservoir pressure
to a value near the original pressure
of
2,750 psi (18.96
MPa). About 50
of
the study area has pressures greater
than 2,500 psi (17.24 MPa) and is being flooded effec
tively, but about 20 of the area is greatly underpres
sureq at less than 2,000 psi (13.79 MPa).
These pressure measurements have complemented log
analysis when interpreting reservoir continuity in this
complex reservoir. In some areas, where log correlations
are difficult and sands appear to be discontinuous, pres
sure uniformity suggests that the reservoirs are, in fact,
continuous or connected. In contrast, in other areas
where porous sands can be correlated more easily, large
pressure variations suggest reservoir discontinuity, or at
least greatly reduced lateral permeability. Uniformity of
pressures vertically across zone boundaries suggests that
vertical reservoir continuity also exists in many areas. In
.
•
•
•
.
,.
- -------.-
•
I
•
•
•
•
•
•
?
•
20
@15
236
•
0 :
•
.
•
854
,.
0
0
•
.
•
0
@13/
29
•
,
377
/..
•
?
.
Fig.
9-Contour
map showing average pressures
in
Zone 0 of Weber reservoir. Pressures corrected to datum of -900ft - 274m).
30
JOURNAL OF PETROLEUM TECHNOLOGY
Page 7
8/20/2019 Formation Evaluation Using Wireline Formation Tester Pressure Data - JPT 1978
http://slidepdf.com/reader/full/formation-evaluation-using-wireline-formation-tester-pressure-data-jpt-1978 7/8
summary, log correlation alone is not enough to predict
reservoir continuity with any degree
of
accuracy in this
type of depositional environment, where stratigraphic
changes occur in distances less than the well spacing.
Permeability Evaluation
The pressure differentials during the pretests (indicated
by
t::.Pl
and
t::.P2
in Fig. 3) are sensitive to the formation
permeability. Generally, the greater the pressure de
crease required to maintain the pretest flow rate, the
lower the permeability. For very low permeabilities, the
chambers are drawn to near-vacuum conditions since the
formation is not capable of producing at the required rate
and flow rate
is
reduced. I f the formation
is
isotropic and
the flow is spherical in character, the analog pressure
record may be used for a quick indication
of
permeability
(Fig. 10). (Compare the difference values between draw
down and final formation pressures.)
Quantitative evaluation of permeability is based on
steady-state spherical type flow into the probe. The per-
u
«
til
o
5
>
x
--
1
I
1
J
10.1
a::
::>
( /)
( /)
10.1
a::
a..
I
1
..
-10.1
I-a::
«::>
til /)
oa::
> 0..
,x
I
I
i
\
-
\
\
..
1
. I
I
ABOUT
I O O ~ d
a
I
I
L
I I I I
ABOUT IOmd
b
-
III
ABOUT I md
C
I
1I I I I I I I I I l l l i l
ABOUT.I md
d
I
I
I
T I G H T I
e
[
. 1
-
Fig. 10-Permeability estimates from pressure records
assuming isotropic formations.
JANUARY 1979
meability is given b
y
3
k
=
Fqf-t . . . . . . . . . . . . . . . . . . . . . . . . .
(la)
21T1 t::.p
which, in more convenient units, becomes
k = 3,300 qf t
t::.p
or, in metric units,
......................
(lb)
k = 22.75 qf t
t::.p
where the quantities in Eqs. 1a and 1b, and the units in
Eq. 1b, are
k = permeability, md
q = flow rate, cm
3
/s
r = probe radius = 0.21 in. (5.33 mm)
f-t = fluid viscosity (usually filtrate), cp
(mPa s)
t::.p
= drawdown from formation pressure, psi
(MPa)
F
= flow-shape factor =
1.00 for hemispherical flow,
0.75
for
'quasispherical borehole
corrected flow for 8-in. (20.3-cm)
wellbore,
0.50 for spherical flow.
The flow regimes associated with different values
of
the
flow-shape factor, F are summarized in Fig. 11. Eq. 1b
incorporates the value
F
= 0.75, based on computer
simulations. This approximates flow conditions for the
tool set in an 8-in. (20.3-cm) borehole (lowermost flow
F =
1 0
HEMISPHERICAL
FLOW
F
=.75
\
/\
F =.5
SPHERICAL
FLOW
BOREHOLE
CORRECTED
FLOW
Fig.
11-Aow
regimes and associated flow shape factors F.
31
Page 8
8/20/2019 Formation Evaluation Using Wireline Formation Tester Pressure Data - JPT 1978
http://slidepdf.com/reader/full/formation-evaluation-using-wireline-formation-tester-pressure-data-jpt-1978 8/8
,:
. .
+
+
100
ct {'
t
It'
·
+
....
.,) '
.
r
t
;
k ,·i
j
10
..
r
q
l , , / ~ ; i
i '
I
ii
l,,)'/
1 ,, /'
. Cor. Data Point
verOQe
t
Cor. Data
0.11 ,)'
0 1
1.0
10
100 1000
PRETEST
DRAWDOWN
PERMEABILITY md.)
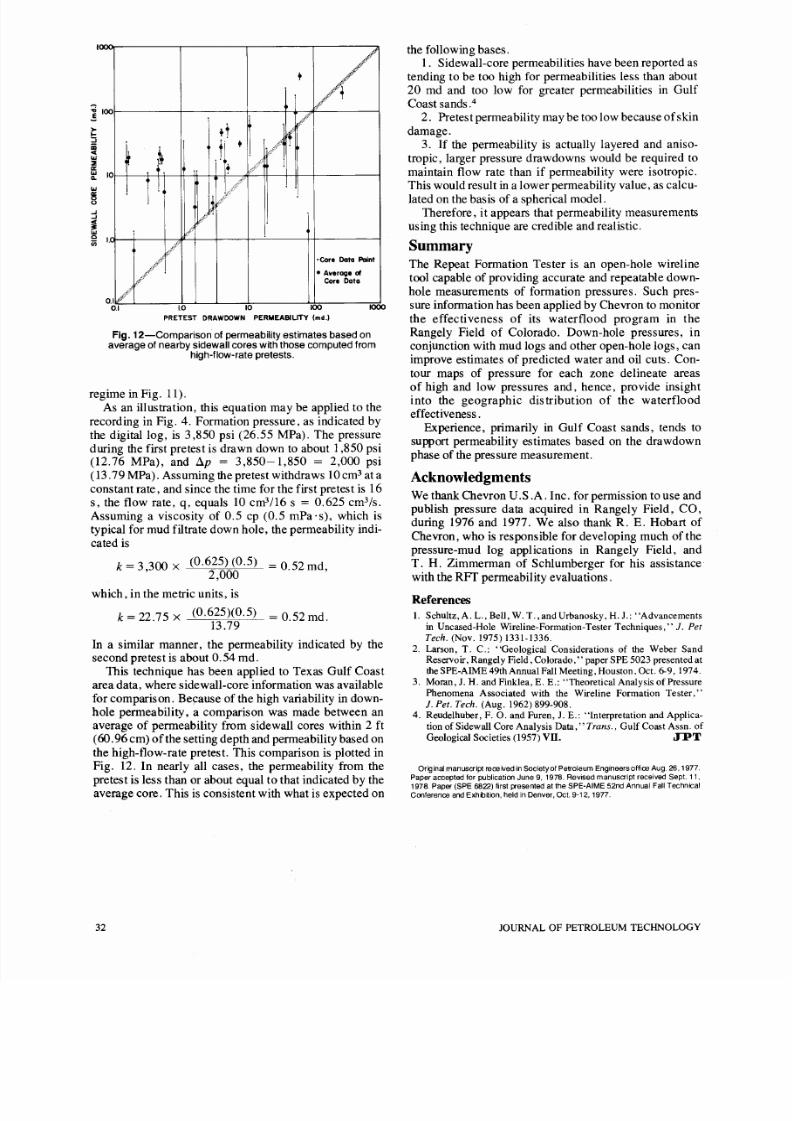
Fig. 12-Comparison of permeability estimates based on
average of nearby sidewall cores with those computed from
high-flow-rate pretests.
regime in Fig. 11).
As an illustration, this equation may be applied to the
recording in Fig. 4. Formation pressure, as indicated by
the digital log, is 3,850 psi (26.55 MPa). The pressure
during the first pretest
is
drawn down to about 1,850 psi
(12.76 MPa) , and ~ =
3,850-1,850
= 2,000 psi
(13.79 MPa). Assuming the pretest withdraws
m
3
at a
constant rate, and since the time for the first pretes t is 16
s,
the flow rate, q, equals 10 cm
3
/16 s = 0.625 cm
3
/s.
Assuming a viscosity of 0.5 cp (0.5 mPa
s),
which is
typical for mud filtrate down hole, the permeability indi
cated is
=
3 300
x
(0.625) (0.5) 0 52
d
, 2,000
=
m
which, in the metric units, is
= 22.75
x
(0.625)(0.5) = 0.52 md.
13.79
In a similar manner, the permeability indicated by the
second pretest is about 0.54 md.
This technique has been applied to Texas Gulf Coast
area data, where sidewall-core information was available
for comparison. Because of the high variability in down
hole permeability, a comparison was made between an
average
of
permeability from sidewall cores within 2 ft
(60.96 cm)
of
the setting depth and permeability based on
the high-flow-rate pretest. This comparison
is
plotted in
Fig. 12. In nearly all cases, the permeability from the
pretest is less than or about equal to that indicated by the
average core. This is consistent with what is expected on
32
the following bases .
1. Sidewall-core permeabilities have been reported
as
tending to be too high for permeabilities less than about
20
md
and too low for greater permeabilities in Gulf
Coast sands.
4
2. Pretest permeability may be too low becauseof skin
damage.
3.
f
the permeability
is
actually layered and aniso
tropic, larger pressure drawdowns would be required to
maintain flow rate than if permeability were isotropic .
This would result
in
a lower permeability value,
as
calcu
lated on the basis of a spherical model.
Therefore, it appears that permeability measurements
using this technique are credible and realistic.
Summary
The Repeat Formation Tester is an open-hole wireline
tool capable of providing accurate and repeatable down
hole measurements of formation pressures. Such pres
sure information has been applied by Chevron to monitor
the effectiveness of its waterflood program in the
Rangely Field of Colorado. Down-hole pressures, in
conjunction with mud logs and other open-hole logs, can
improve estimates of predicted water and oil cuts. Con
tour maps of pressure for each zone delineate areas
of high and low pressures and, hence, provide insight
into the geographic dis tribution
of
the waterflood
effectiveness.
Experience, primarily in Gulf Coast sands, tends to
support permeability estimates based on the drawdown
phase of the pressure measurement.
cknowledgments
We thank Chevron U.S.A. Inc. for permission touse and
publish pressure data acquired in Rangely Field, CO,
during 1976 and 1977. We also thank R. E. Hobart of
Chevron, who
is
responsible for developing much of the
pressure-mud log applications in Rangely Field, and
T.
H.
Zimmerman
of
Schlumberger for his assistance
with the RFT permeability evaluations.
References
I. Schultz, A. L. Bell, W.
T.,
and Urbanosky,
H.
J.: Advancements
in Uncased-Hole Wireline-Formation-Tester Techni ques, 1 Pet
Tech.
(Nov. 1975) 1331-1336.
2. Larson, T. C.: Geological Considerations of the Weber Sand
Reservoir, Rangely Field, Colorado, paper SPE 5023 presented at
the
SPE-AIME 49th Annual Fall Meeting, Houston, Oct. 6-9, 1974.
3. Moran, J. H. and Finklea, E. E.: Theoretical Analysis
of
Pressure
Phenomena Associated with the Wireline Formation Tester,
1 Pet. Tech. (Aug. 1962) 899-908.
4. Reudelhuber, F. O. and Furen, J. E.: Interpretation and Applica
tion of Sidewall Core Analysis Data,
Trans.
Gulf Coast Assn.
of
Geological Societies (1957) VII. PT
Orginal manuscript race iIIed in Society of Petroleum Engineers office Aug. 26, 1977.
Paper accepted for publication June 9, 1978. Revised manuscript received Sept. 11,
1978. Paper SPE 6822) first presented at the SPE-A IME 52nd Annual Fall Technical
Conference
and
Exhib.ion, held in Denver, Oct. 9-12, 1977.
JOURNAL OF PETROLEUM TECHNOLOGY