Page 1
Yilma et al., IJPSR, 2015; Vol. 6(5): 1877-1892. E-ISSN: 0975-8232; P-ISSN: 2320-5148
International Journal of Pharmaceutical Sciences and Research 1877
IJPSR (2015), Vol. 6, Issue 5 (Research Article)
Received on 03 September, 2014; received in revised form, 28 November, 2014; accepted, 27 January, 2015; published 01 May, 2015
FORMULATION AND OPTIMIZATION OF SUSTAINED RELEASE FLOATING MATRIX
TABLETS OF SALBUTAMOL SULPHATE USING XANTHAN GUM AND HYDROXYPROPYL
METHYLCELLULOSE POLYMER BLEND
Z. Yilma 1, 2
, A. Belete 2 and T. Gebre-Mariam
*2
Department of Pharmaceutics 1, School of Pharmacy, College of Health Sciences, Mekelle University,
P.O.Box 1871, Mekelle, Ethiopia.
Department of Pharmaceutics and Social Pharmacy 2, School of Pharmacy, College of Health Sciences,
Addis Ababa University, P.O. Box 1176, Addis Ababa, Ethiopia.
ABSTRACT: Oral salbutamol sulphate has site-specific absorption in the
stomach and upper part of the small intestine. Its bioavailability is about 40%
due to several factors including narrow absorption window and extensive
intestinal metabolism. The aim of this study was to formulate and optimize
sustained release floating tablets of salbutamol sulphate in order to improve
its bioavailability and reduce its dosing frequency. Accordingly, floating
tablets were prepared by wet granulation technique and drug release analysis
was performed by HPLC. The effects of polymer level, polymer type (XG or
HPMC), polymer ratio (XG/HPMC; 1:1, 1:3, 3:1) and NaHCO3 level on
floating lag time, floating duration, cumulative release within 1 hr, and
release rate were investigated. From preliminary studies, the polymer with
1:3 (XG:HPMC) ratio and NaHCO3 were selected as significant factors and
cumulative release at 1 hr and release rate were chosen as significant
responses, respectively. Hence, the effect of these factors were further
studied and optimized by central composite design. The most desirable
representative optimal point was obtained at 24.79% of XG/HPMC and 5%
of NaHCO3 having release rate of 28.49 hr-1/2
and cumulative release at 1 hr
of 24%. This formulation is expected to significantly improve bioavailability
of salbutamol while remaining buoyant and sustained release
INTRODUCTION: Salbutamol sulphate is one of
the widely used drugs in the treatment of
respiratory disorders like bronchial asthma, chronic
bronchitis and obstructive airway diseases1. The
relatively short acting injectable and aerosol dosage
forms of salbutamol sulphate are recommended for
instant relief in severe asthmatic attacks.
QUICK RESPONSE CODE
DOI: 10.13040/IJPSR.0975-8232.6(5).1877-92
Article can be accessed online on: www.ijpsr.com
DOI link: http://dx.doi.org/10.13040/IJPSR.0975-8232.6(5).1877-92
The recommended dose of aerosols in adults and
children is 2 – 3 inhalations every 4 – 6 hr 2 and for
conventional tablets, 2-6 mg (base) is administered
three to four times a day 3 which causes poor
patient compliance, multiple administration
associated side effects, and plasma drug level
fluctuation.
Salbutamol sulphate has oral bioavailability of only
~40% due to extensive metabolism via intestinal
sulphonation, first pass metabolism in the liver,
narrow absorption window (site-specific absorption
in stomach and upper part of small intestine 4 and
degradation in colon 5, 6
. Hence, development of
Keywords:
Floating tablet; Sustained release;
Salbutamol sulphate; Optimization;
Central composite design
Correspondence to Author:
Tsige Gebre-Mariam
Professor of Pharmaceutics
Department of Pharmaceutics and
Social Pharmacy, School of
Pharmacy, College of Health
Sciences, Addis Ababa University,
P.O. Box 1176, Addis Ababa,
Ethiopia.
E-mail: [email protected]
Page 2
Yilma et al., IJPSR, 2015; Vol. 6(5): 1877-1892. E-ISSN: 0975-8232; P-ISSN: 2320-5148
International Journal of Pharmaceutical Sciences and Research 1878
sustained release formulations which remain at the
absorption site for an extended period of time
would be beneficial to maximize the bioavailability
and reduce frequency of administration of this
drug. One feasible approach for achieving
prolonged and predictable drug delivery profile in
the GIT is to prepare Gastro Retentive Dosage
Forms (GRDFs) 7. Thus, the present work attempts
to develop and optimize sustained release floating
matrix tablets of salbutamol sulphate which release
the drug in the stomach and upper part of small
intestine.
MATERIALS AND METHODS:
Materials: Salbutamol sulphate (Supriya Life Science Ltd.,
India), Xanthan gum, Povidone K-30, and
Microcrystalline cellulose PH 101 (China
Associate Co. Ltd, China) supplied by Addis
Pharmaceutical Factory (APF); HPMC K 4000 cp
(China Associate Co. Ltd., China) donated by
Ethiopian Pharmaceutical Manufacturing Sh. Co.
(EPHARM). Sodium hexane-sulphonate (Merck,
India) provided by East African Pharmaceuticals
PLC; Sodium bicarbonate (UNI. CHEM., India),
methanol (BDH Ltd., England), and hydrochloric
acid (BDH Ltd., England) were all used as
received.
METHODS:
Preparation of Granules:
Granulation was performed as per the method
described by Shinde et al. 8 with minor
modifications. In this, all the ingredients (Table 1),
except the magnesium stearate, talc and PVP K-30,
were weighed and mixed by geometrical dilution.
Wet mass was formed by adding isopropanol
solution of PVP K-30 to the powder blend while
mixing thoroughly. The wet mass was screened
through a 1.6 mm mesh to form granules. The wet
granules were dried for 12 hr at 40 oC and passed
through a 1 mm mesh and then stored in air-tight
containers.
TABLE 1: SALBUTAMOL SULPHATE TABLET FORMULATIONS INVESTIGATED IN THE PRELIMINARY
STUDIES
* FX: formulations that contain xanthan gum only
FH: formulations that contain HPMC only
FXH: formulations that contain both xanthan gum and HPMC
FS: formulations that contain different concentrations of NaHCO3
Each tablet weighs 300 mg.
Characterization of granules:
Angle of repose:
Thirty grams of granule were made to flow through
stem less funnel, with an internal diameter of 10
mm at the bottom and 100 mm at the top, on to a
graph paper from a height of 10 cm. The height (h)
as well as the diameter (d) of the pile was
measured. Then the angle of repose () was
calculated from h and radius (r = d/2) using
Equation 1. The experiment was done in triplicate.
rh1tan Eq. 1
Density related properties:
Bulk and tapped density:
Thirty grams of granules were transferred into a
250 ml graduated cylinder and the volume of the
granules was read after tapping the granules three
times on a horizontal plane. Then, the mass (M) of
the granule was divided by the volume obtained,
the bulk volume (Vb), to obtain the bulk density
(ρb), Equation 2.
ρb = M/Vb Eq. 2
Ingre.↓Formln
→
FX1 FX2 FH1 FH2 FXH1 FXH2 FXH3 FXH4 FXH5 FXH6 FS1 FS2 FS3 FS4
Drug (%) 3.2 3.2 3.2 3.2 3.2 3.2 3.2 3.2 3.2 3.2 3.2 3.2 3.2 3.2
Xanthan
gum (%)
10 40 - - 5 2.5 7.5 20 10 30 40 40 - -
HPMC
K4M (%)
- - 10 40 5 7.5 2.5 20 30 10 - - 40 40
NaHCO3 (%) 10 10 10 10 10 10 10 10 10 10 5 20 5 20
MCC (%) 69.8 39.8 69.8 39.8 69.8 69.8 69.8 39.8 39.8 39.8 44.8 29.8 44.8 29.8
Mg stearate (%) 1 1 1 1 1 1 1 1 1 1 1 1 1 1
Talc (%) 1 1 1 1 1 1 1 1 1 1 1 1 1 1
PVP K-30 (%) 5 5 5 5 5 5 5 5 5 5 5 5 5 5
Page 3
Yilma et al., IJPSR, 2015; Vol. 6(5): 1877-1892. E-ISSN: 0975-8232; P-ISSN: 2320-5148
International Journal of Pharmaceutical Sciences and Research 1879
The granules were also tapped 250 times using Tap
Densitometer (ERWEKA, SVM 20, Germany) and
the mass (M) of the granules was divided by the
volume obtained, the tapped volume (Vt), to obtain
the tapped density (ρt), using Equation 3.
ρt = M/Vt Eq. 3
The experiments were done in triplicate and mean
and standard deviation were calculated.
Compressibility index and Hausner ratio:
The compressibility index (CI) and Hausner ratio
were calculated from bulk and tapped densities,
using Equations 4 and 5.
Compressibility Index (CI) = 100xt
bt
Eq. 4
b
tHratioHausner
)(
Eq. 5
Preparation of floating tablets:
Talc and magnesium stearate were added onto
previously prepared and dried granules and blended
for 3 min in a Turbula mixer (Willy A. Bachofen
AG, Turbula 2TF, Basel, Switzerland) at 49 rpm.
The blend was compressed into tablets, adjusting
the hardness to be between 60 N to 70 N, on
eccentric tablet machine (EK0 Korsch, 8410-68,
Berlin, Germany) which was fitted with 10 mm
diameter flat-faced punches. The tablets were kept
for 24 hrs at room temperature in glass containers
before their properties were evaluated.
Characterization of tablets:
Tablets were characterized with respect to the
following properties.
Drug content analysis:
Twenty tablets were weighed and finely powdered
and equivalent to about 50 mg of salbutamol were
transferred to a 2000-ml volumetric flask. Then
1200 ml of 1% acetic acid was added, shaked for
45 min by mechanical means, sonicated for the
next 10 min, cooled to room temperature and was
diluted with methanol to volume. It was then
filtered with a 0.45 µm nylon filter. About 25 μl of
this filtered solution was injected into the HPLC,
the chromatogram was recorded, and the response
for the major peak was measured. The quantity of
C13H21NO3 was calculated by comparing this peak
response with the major peak response similarly
obtained on chromatographing the standard
preparation previously diluted with a mixture of
water and methanol (6:4) and filtered 9. This was
done in triplicate for each batch and mean and
standard deviation were calculated
Tablet hardness:
The hardness of 10 tablets from each batch was
determined using a hardness tester (CALIVA,
THT2, England) and the average value was
obtained.
Tablet thickness:
The thickness of 10 tablets from each batch was
measured with a hardness tester (CALIVA, THT2,
England) putting the tablet with its side (in an
upright position).
Tablet friability:
The friability of the tablets was determined by
placing 10 tablets in a friability tester (ERWEKA,
TAR 20, Germany) and allowing them to rotate at
25 rpm for 4 min. The loss of tablet weight was
calculated as a percentage of the initial weight after
dedusting.
In vitro buoyancy studies:
The time the tablets took to emerge on the fluid
surface (floating lag time) and the time the tablets
constantly float on the fluid surface (floating
duration) in a USP type II apparatus, filled with
500 ml of 0.1N HCl solution (pH = 1.2) at 37 ± 0.5 oC were recorded by using stopwatch. Both of the
variables were determined in triplicate and mean
and standard deviation were calculated.
Matrix integrity:
Matrix integrity was observed throughout the in
vitro dissolution studies and whether or not the
swollen mass of the tablets remain intact was
checked 8.
Calibration curve and system suitability tests:
Stock solution of salbutamol sulphate reference
standard was prepared by transferring 12 mg of
salbutamol sulphate reference standard to a 100 ml
volumetric flask, adding 60 ml of 1% acetic acid,
sonicating it for 5 min, and diluting with methanol
to volume. From this stock solution, six different
Page 4
Yilma et al., IJPSR, 2015; Vol. 6(5): 1877-1892. E-ISSN: 0975-8232; P-ISSN: 2320-5148
International Journal of Pharmaceutical Sciences and Research 1880
volumes of the solution were transferred to 25 ml
volumetric flasks and diluted with a mixture of
water and methanol (6:4) to volume. The peak area
readings of these solutions were measured at 276
nm using HPLC (LC-20AD, Shimadzu, Japan).
The peak area versus concentration of solutions
were plotted to obtain the calibration curve. The
coefficients of determinations (R2) were 0.997.
To determine the system suitability, five replicate
injections of the standard preparation, required to
demonstrate adequate system precision, were made
before the injection of samples and the relative
standard deviation was calculated (≤ 2%) 9.
In vitro drug release studies:
The release rate of salbutamol sulphate from
floating tablets was determined using Dissolution
Testing Apparatus II (paddle method). The
dissolution test was performed in 500 ml of 0.1N
HCl at 37 ± 0.5 °C and 50 rpm. Samples of 5 ml
were withdrawn at predetermined time intervals
(0.5, 1, 2, 3, 4, 5, 6, 8, 10, and 12 hr) and the
samples were replaced with fresh dissolution
medium which was kept at 37±0.5oC. The samples
were diluted to 20 ml and filtered through 0.45 µm
nylon filter and were analyzed with HPLC (LC-
20AD, Shimadzu, Japan) at 276.0 nm 9.
About 100 μl of a portion of the solution under test,
previously passed through a 0.45 μm nylon filter,
was injected into the HPLC, the chromatogram was
recorded, and the response for the major peak was
measured. The quantity of salbutamol (C13H21NO3)
dissolved was calculated by comparing this peak
response with the major peak response similarly
obtained on chromatographing the standard
preparation 9.
HPLC conditions:
Assay of salbutamol sulphate using HPLC system
was conducted as described in the United States
Pharmacopoeia 9. The following chromatographic
conditions were employed:
Mobile phase: 1.13 g of sodium 1-hexanesulfonate
was dissolved in 1200 ml of water, 12 ml of glacial
acetic acid was added, and mixed. A filtered and
degassed mixture of this solution and methanol
(6:4) was prepared and used.
Standard preparation: About 12 mg of reference salbutamol sulphate,
accurately weighed was transferred to a 100 ml
volumetric flask. Then 60 ml of 1% acetic acid was
added, and sonicated for 5 min, and diluted with
methanol to volume, and mixed. About 125 µl to
1250 µl of this solution was pipetted into a 25 ml
volumetric flask, diluted with a mixture of water
and methanol (6:4) to volume, and used.
Chromatographic system: The liquid chromatography was equipped with a
276 nm detector and a 4.6 mm × 15 cm column
(MOS-1 Hypersil). The flow rate was about 1.5 ml
per min. The standard preparation was
chromatographed, and the peak responses were
recorded following a standard procedure (USP 30
NF 25, 2007), i.e., the column efficiency
determined from the analyte peak should not be
less than 800 theoretical plates; the tailing factor
for the analyte peak should not be more than 2.5;
and the relative standard deviation for replicate
injections should not be more than 2.0%.
Release profiles comparison:
Dissolution efficiency (DE) after 12 hr of release
test was used to compare the results of dissolution
tests of different formulations using Equation 6:
100)(12100
2
1
)t(ty
y.dt%DE
t
t Eq. 6
where y is the percentage of dissolved product at
any time t, y100 denotes 100% dissolution, and the
integral represents the area under dissolution curve
between time points t1 and t2 10
.
Kinetics and mechanism of drug release:
In order to assess and describe the release kinetics
and release mechanism of the drug from the tablets
under study, the drug release data were fitted to the
following release kinetic models: Zero order
release model, First order release kinetic model,
Higuchi square root model, Hixson-Crowell cube
root model, and Korsmeyer–Peppas model 11
and
the criteria for selecting the most appropriate model
was chosen on the basis of goodness of fit test 12
.
Experimental design: On the basis of the preliminary studies, sodium
bicarbonate (X1) and one of the XG/HPMC ratios
Page 5
Yilma et al., IJPSR, 2015; Vol. 6(5): 1877-1892. E-ISSN: 0975-8232; P-ISSN: 2320-5148
International Journal of Pharmaceutical Sciences and Research 1881
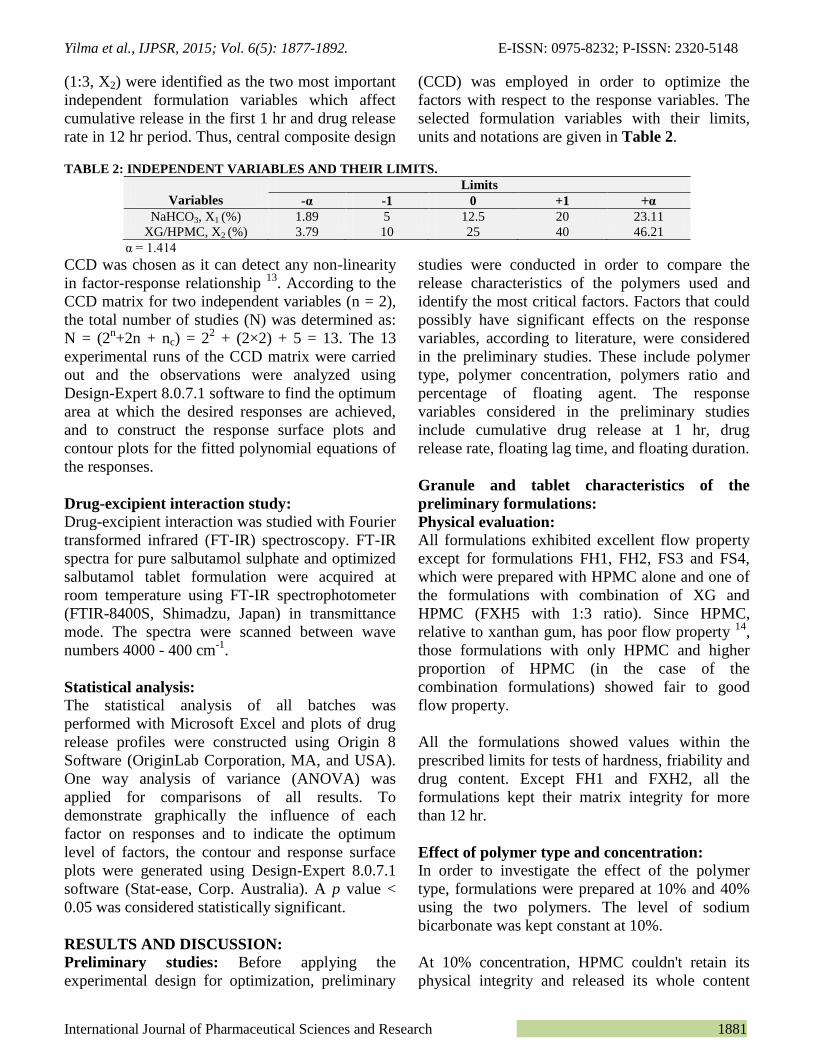
(1:3, X2) were identified as the two most important
independent formulation variables which affect
cumulative release in the first 1 hr and drug release
rate in 12 hr period. Thus, central composite design
(CCD) was employed in order to optimize the
factors with respect to the response variables. The
selected formulation variables with their limits,
units and notations are given in Table 2.
TABLE 2: INDEPENDENT VARIABLES AND THEIR LIMITS.
Variables
Limits
-α -1 0 +1 +α
NaHCO3, X1 (%) 1.89 5 12.5 20 23.11
XG/HPMC, X2 (%) 3.79 10 25 40 46.21
α = 1.414
CCD was chosen as it can detect any non-linearity
in factor-response relationship 13
. According to the
CCD matrix for two independent variables (n = 2),
the total number of studies (N) was determined as:
N = (2n+2n + nc) = 2
2 + (2×2) + 5 = 13. The 13
experimental runs of the CCD matrix were carried
out and the observations were analyzed using
Design-Expert 8.0.7.1 software to find the optimum
area at which the desired responses are achieved,
and to construct the response surface plots and
contour plots for the fitted polynomial equations of
the responses.
Drug-excipient interaction study: Drug-excipient interaction was studied with Fourier
transformed infrared (FT-IR) spectroscopy. FT-IR
spectra for pure salbutamol sulphate and optimized
salbutamol tablet formulation were acquired at
room temperature using FT-IR spectrophotometer
(FTIR-8400S, Shimadzu, Japan) in transmittance
mode. The spectra were scanned between wave
numbers 4000 - 400 cm-1
.
Statistical analysis: The statistical analysis of all batches was
performed with Microsoft Excel and plots of drug
release profiles were constructed using Origin 8
Software (OriginLab Corporation, MA, and USA).
One way analysis of variance (ANOVA) was
applied for comparisons of all results. To
demonstrate graphically the influence of each
factor on responses and to indicate the optimum
level of factors, the contour and response surface
plots were generated using Design-Expert 8.0.7.1
software (Stat-ease, Corp. Australia). A p value <
0.05 was considered statistically significant.
RESULTS AND DISCUSSION:
Preliminary studies: Before applying the
experimental design for optimization, preliminary
studies were conducted in order to compare the
release characteristics of the polymers used and
identify the most critical factors. Factors that could
possibly have significant effects on the response
variables, according to literature, were considered
in the preliminary studies. These include polymer
type, polymer concentration, polymers ratio and
percentage of floating agent. The response
variables considered in the preliminary studies
include cumulative drug release at 1 hr, drug
release rate, floating lag time, and floating duration.
Granule and tablet characteristics of the
preliminary formulations:
Physical evaluation:
All formulations exhibited excellent flow property
except for formulations FH1, FH2, FS3 and FS4,
which were prepared with HPMC alone and one of
the formulations with combination of XG and
HPMC (FXH5 with 1:3 ratio). Since HPMC,
relative to xanthan gum, has poor flow property 14
,
those formulations with only HPMC and higher
proportion of HPMC (in the case of the
combination formulations) showed fair to good
flow property.
All the formulations showed values within the
prescribed limits for tests of hardness, friability and
drug content. Except FH1 and FXH2, all the
formulations kept their matrix integrity for more
than 12 hr.
Effect of polymer type and concentration: In order to investigate the effect of the polymer
type, formulations were prepared at 10% and 40%
using the two polymers. The level of sodium
bicarbonate was kept constant at 10%.
At 10% concentration, HPMC couldn't retain its
physical integrity and released its whole content
Page 6
Yilma et al., IJPSR, 2015; Vol. 6(5): 1877-1892. E-ISSN: 0975-8232; P-ISSN: 2320-5148
International Journal of Pharmaceutical Sciences and Research 1882
within 1 hr, but XG retained its physical integrity
for over 12 hr. When the polymer changed from
HPMC to XG, the cumulative release in the first 1
hr was decreased from 100.35% to 25.90%. This is
due to the fact that xanthan gum has a rapid
hydration power than HPMC, which can prevent
initial burst release of soluble drugs 15
. The floating
lag time also changed from 1.2 ± 0.1 sec to 1.5 ±
0.1 sec. Moreover, only XG floated for more than
12 hr.
At 40% concentration, both HPMC and XG
retained their physical integrity for a period of 12
hr and there was no significant change (p > 0.05) in
cumulative release within the first 1 hr, but there
was a significant change (p < 0.05) in release rate
over 12 hr period when the polymer type changed
from HPMC to XG. The floating lag time changed
from 2.3 ± 0.42 sec to 4.8 ± 0.26 sec, but there was
no change in floating duration, i.e., both
formulations floated for more than 12 hr. Fig. 1
shows the effect of polymer type on cumulative
release within 12 hr period.
0 2 4 6 8 10 120
20
40
60
80
100
120
Cu
mu
lati
ve
rele
ase
(%)
Time (hr)
FH1
FX1
a
0 2 4 6 8 10 12
0
20
40
60
80
100
120
Cu
mu
lati
ve
rele
ase
(%)
Time (hr)
FH2
FX2
b
FIG. 1: EFFECT OF POLYMER TYPE (FH: HPMC AND FX: XG) AT 10% [a] AND 40% [b] ON CUMULATIVE RELEASE OF
SALBUTAMOL SULPHATE.
In the case of XG, when the concentration
increased from 10% to 40%, the cumulative release
in the first 1 hr and the release rate decreased
significantly (p < 0.05) (Fig. 2), and the floating lag
time increased significantly (p < 0.0001). As the
concentration increases the dosage form becomes
more dense and needs time to swell and float. In
the case of HPMC, the cumulative release in the
first 1 hr decreased significantly (p < 0.0001) and
the floating lag time changed significantly (p <
0.05) as the concentration increased from 10% to
40%. This observation was in agreement with those
reported elsewhere 16
.
An increase in the polymer concentration causes
increase in the viscosity of the gel and leads to
formation of gel layer with a longer diffusion path
causing a decrease in the diffusion of the drug and
therefore a reduction in the drug release rate 17
.
Within the range studied, the polymer
concentration didn’t show any significant
difference in floating duration (> 12 hr) in the case
of XG, but in the case of HPMC, it showed a great
difference when the concentration increased from
10% (it disintegrated after few min) to 40% (> 12
hr).
0 2 4 6 8 10 120
20
40
60
80
100
120
Cu
mu
lati
ve
rele
ase
(%)
Time (hr)
FH1
FH2
a
0 2 4 6 8 10 120
20
40
60
80
100
Cu
mu
lati
ve
rele
ase
(%)
Time (hr)
FX1
FX2
b
FIG. 2: EFFECT OF POLYMER CONCENTRATION: FH1 (10%) AND FH2 (40%) OF HPMC [a]; FX1 (10%) AND FX2 (40%) OF
XG [b] ON CUMULATIVE RELEASE OF SALBUTAMOL SULPHATE.
Page 7
Yilma et al., IJPSR, 2015; Vol. 6(5): 1877-1892. E-ISSN: 0975-8232; P-ISSN: 2320-5148
International Journal of Pharmaceutical Sciences and Research 1883
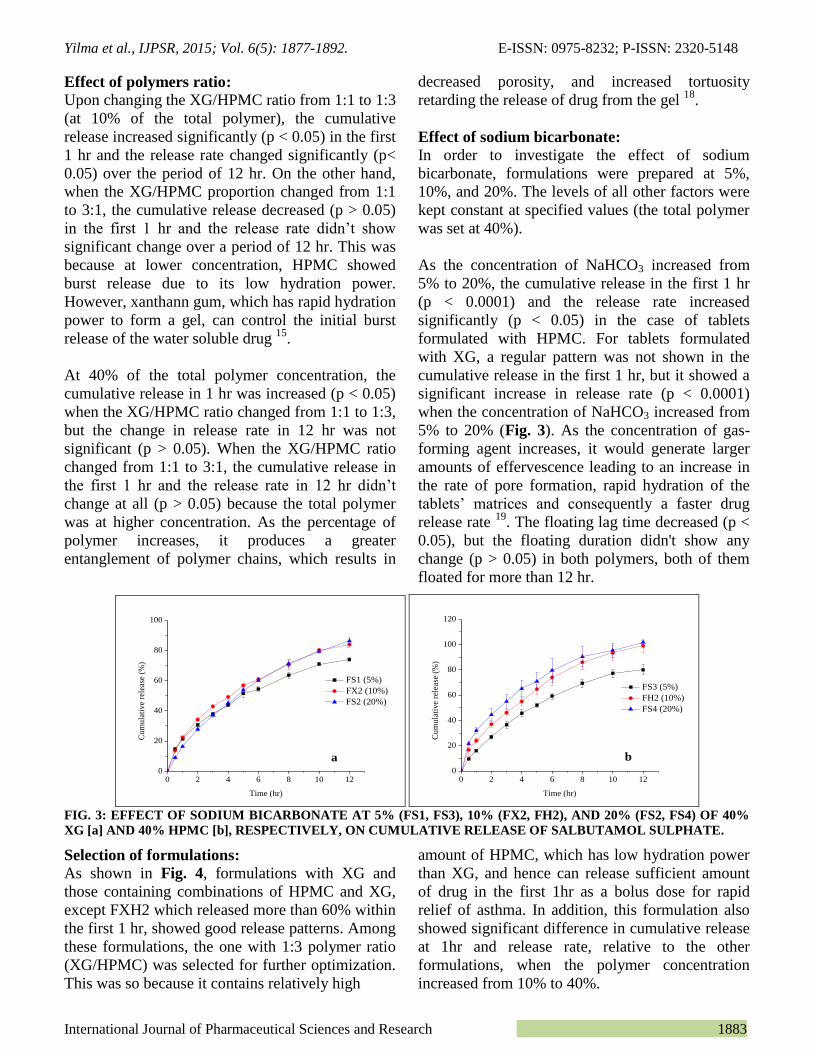
Effect of polymers ratio:
Upon changing the XG/HPMC ratio from 1:1 to 1:3
(at 10% of the total polymer), the cumulative
release increased significantly (p < 0.05) in the first
1 hr and the release rate changed significantly (p<
0.05) over the period of 12 hr. On the other hand,
when the XG/HPMC proportion changed from 1:1
to 3:1, the cumulative release decreased (p > 0.05)
in the first 1 hr and the release rate didn’t show
significant change over a period of 12 hr. This was
because at lower concentration, HPMC showed
burst release due to its low hydration power.
However, xanthann gum, which has rapid hydration
power to form a gel, can control the initial burst
release of the water soluble drug 15
.
At 40% of the total polymer concentration, the
cumulative release in 1 hr was increased (p < 0.05)
when the XG/HPMC ratio changed from 1:1 to 1:3,
but the change in release rate in 12 hr was not
significant (p > 0.05). When the XG/HPMC ratio
changed from 1:1 to 3:1, the cumulative release in
the first 1 hr and the release rate in 12 hr didn’t
change at all (p > 0.05) because the total polymer
was at higher concentration. As the percentage of
polymer increases, it produces a greater
entanglement of polymer chains, which results in
decreased porosity, and increased tortuosity
retarding the release of drug from the gel 18
.
Effect of sodium bicarbonate:
In order to investigate the effect of sodium
bicarbonate, formulations were prepared at 5%,
10%, and 20%. The levels of all other factors were
kept constant at specified values (the total polymer
was set at 40%).
As the concentration of NaHCO3 increased from
5% to 20%, the cumulative release in the first 1 hr
(p < 0.0001) and the release rate increased
significantly (p < 0.05) in the case of tablets
formulated with HPMC. For tablets formulated
with XG, a regular pattern was not shown in the
cumulative release in the first 1 hr, but it showed a
significant increase in release rate (p < 0.0001)
when the concentration of NaHCO3 increased from
5% to 20% (Fig. 3). As the concentration of gas-
forming agent increases, it would generate larger
amounts of effervescence leading to an increase in
the rate of pore formation, rapid hydration of the
tablets’ matrices and consequently a faster drug
release rate 19
. The floating lag time decreased (p <
0.05), but the floating duration didn't show any
change (p > 0.05) in both polymers, both of them
floated for more than 12 hr.
0 2 4 6 8 10 120
20
40
60
80
100
Cu
mu
lati
ve
rele
ase
(%)
Time (hr)
FS1 (5%)
FX2 (10%)
FS2 (20%)
a
0 2 4 6 8 10 120
20
40
60
80
100
120
Cu
mu
lati
ve
rele
ase
(%)
Time (hr)
FS3 (5%)
FH2 (10%)
FS4 (20%)
b
FIG. 3: EFFECT OF SODIUM BICARBONATE AT 5% (FS1, FS3), 10% (FX2, FH2), AND 20% (FS2, FS4) OF 40%
XG [a] AND 40% HPMC [b], RESPECTIVELY, ON CUMULATIVE RELEASE OF SALBUTAMOL SULPHATE.
Selection of formulations:
As shown in Fig. 4, formulations with XG and
those containing combinations of HPMC and XG,
except FXH2 which released more than 60% within
the first 1 hr, showed good release patterns. Among
these formulations, the one with 1:3 polymer ratio
(XG/HPMC) was selected for further optimization.
This was so because it contains relatively high
amount of HPMC, which has low hydration power
than XG, and hence can release sufficient amount
of drug in the first 1hr as a bolus dose for rapid
relief of asthma. In addition, this formulation also
showed significant difference in cumulative release
at 1hr and release rate, relative to the other
formulations, when the polymer concentration
increased from 10% to 40%.
Page 8
Yilma et al., IJPSR, 2015; Vol. 6(5): 1877-1892. E-ISSN: 0975-8232; P-ISSN: 2320-5148
International Journal of Pharmaceutical Sciences and Research 1884
0 2 4 6 8 10 120
20
40
60
80
100
Time (hr)
Cu
mu
lati
ve r
ele
ase
(%
) FXH3
FXH6
c
0 2 4 6 8 10 120
20
40
60
80
100
Cu
mu
lati
ve r
ele
ase
(%
)
Time (hr)
FX1
FX2
d
FIG. 4: EFFECT OF POLYMER CONCENTRATION ON CUMULATIVE RELEASE OF SALBUTAMOL
SULPHATE: XG/HPMC (1:1) AT 10% (FXH1) AND 40% (FXH4) [a], XG/HPMC (1:3) AT 10% (FXH2) AND 40%
(FXH5) [b], XG/HPMC (3:1) AT 10% (FXH3) AND 40% (FXH6) [c], XG AT 10% (FX1) AND 40% (FX2) [d].
Optimization:
As stated above, the formulation that contains 1:3
(XG/HPMC) ratio of the polymers was selected for
further study and optimization by CCD. Hence, the
percentage of XG/HPMC (1:3) and the percentage
of NaHCO3 were considered as the independent
variables and their effects on cumulative release in
the first 1 hr and drug release rate were considered.
On the basis of the preliminary studies, the range of
the factors was expanded within 10% to 40% for
the polymer (XG/HPMC; 1:3) and 5% to 20% for
NaHCO3. Accordingly, thirteen formulations were
formulated (Table 3) using CCD.
TABLE 3: COMPOSITIONS OF THE THIRTEEN FORMULATIONS.
Formulation code
Point type
Factors
XG/HPMC (%) NaHCO3 (%)
F1 factorial 10 (-1) 5 (-1)
F2 factorial 40 (+1) 5 (-1)
F3 factorial 10 (-1) 20 (+1)
F4 factorial 40 (+1) 20 (+1)
F5 axial 3.79 (-α) 12.5 (0)
F6 axial 46.21 (+α) 12.5 (0)
F7 axial 25 (0) 1.89 (-α)
F8 axial 25 (0) 23.11 (+α)
F9 center point 25 (0) 12.5 (0)
F10 center point 25 (0) 12.5 (0)
F11 center point 25 (0) 12.5 (0)
F12 center point 25 (0) 12.5 (0)
F13 center point 25 (0) 12.5 (0)
Granule characteristics:
The physical properties of the granules (bulk
density, tapped density, compressibility index,
Hausner ratio, and angle of repose) of all the 13
formulations were determined. The bulk density of
the formulations ranged from 0.28 to 0.34 and the
tapped density ranged from 0.29 to 0.38. The blend
indicated excellent to good flow properties for all
formulations with the angle of repose values
ranging from 29.26o
to 35.62o except for
formulation F9 (36.50o). The values of
compressibility index ranged between 5.46 and
9.43, while the Hausner’s ratios were between 1.06
and 1.10; indicating excellent flow properties.
Characteristics of tablets:
The tablets of the 13 different formulations were
evaluated for hardness, thickness, friability, and
drug content. The tablets mean thickness values
ranged from 3.25 mm to 3.66 mm. The hardness of
the tablets was between 61.33 to 73.33 N. The loss
in friability was in the range of 0.22 to 0.41% and
the percentage drug content of tablets was between
98.46% to 102.64%, which were within the limits
of < 1% and 90% to 110%, respectively. Except for
formulations F1, F3, and F5, which contain low
percentage of the polymers, ≤ 10%, all other
formulations kept their matrix integrity.
Page 9
Yilma et al., IJPSR, 2015; Vol. 6(5): 1877-1892. E-ISSN: 0975-8232; P-ISSN: 2320-5148
International Journal of Pharmaceutical Sciences and Research 1885
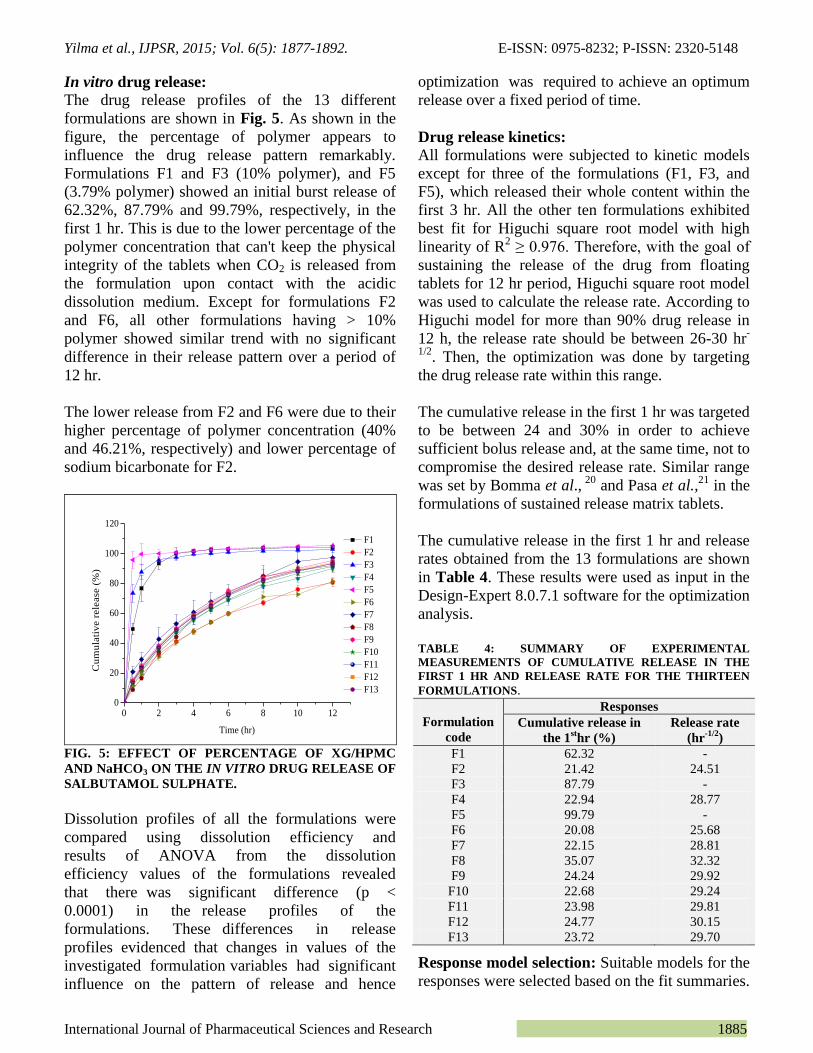
In vitro drug release:
The drug release profiles of the 13 different
formulations are shown in Fig. 5. As shown in the
figure, the percentage of polymer appears to
influence the drug release pattern remarkably.
Formulations F1 and F3 (10% polymer), and F5
(3.79% polymer) showed an initial burst release of
62.32%, 87.79% and 99.79%, respectively, in the
first 1 hr. This is due to the lower percentage of the
polymer concentration that can't keep the physical
integrity of the tablets when CO2 is released from
the formulation upon contact with the acidic
dissolution medium. Except for formulations F2
and F6, all other formulations having > 10%
polymer showed similar trend with no significant
difference in their release pattern over a period of
12 hr.
The lower release from F2 and F6 were due to their
higher percentage of polymer concentration (40%
and 46.21%, respectively) and lower percentage of
sodium bicarbonate for F2.
0 2 4 6 8 10 120
20
40
60
80
100
120
Cu
mu
lati
ve r
ele
ase
(%
)
Time (hr)
F1
F2
F3
F4
F5
F6
F7
F8
F9
F10
F11
F12
F13
FIG. 5: EFFECT OF PERCENTAGE OF XG/HPMC
AND NaHCO3 ON THE IN VITRO DRUG RELEASE OF
SALBUTAMOL SULPHATE.
Dissolution profiles of all the formulations were
compared using dissolution efficiency and
results of ANOVA from the dissolution
efficiency values of the formulations revealed
that there was significant difference (p <
0.0001) in the release profiles of the
formulations. These differences in release
profiles evidenced that changes in values of the
investigated formulation variables had significant
influence on the pattern of release and hence
optimization was required to achieve an optimum
release over a fixed period of time.
Drug release kinetics:
All formulations were subjected to kinetic models
except for three of the formulations (F1, F3, and
F5), which released their whole content within the
first 3 hr. All the other ten formulations exhibited
best fit for Higuchi square root model with high
linearity of R2 ≥ 0.976. Therefore, with the goal of
sustaining the release of the drug from floating
tablets for 12 hr period, Higuchi square root model
was used to calculate the release rate. According to
Higuchi model for more than 90% drug release in
12 h, the release rate should be between 26-30 hr-
1/2. Then, the optimization was done by targeting
the drug release rate within this range.
The cumulative release in the first 1 hr was targeted
to be between 24 and 30% in order to achieve
sufficient bolus release and, at the same time, not to
compromise the desired release rate. Similar range
was set by Bomma et al., 20
and Pasa et al.,21
in the
formulations of sustained release matrix tablets.
The cumulative release in the first 1 hr and release
rates obtained from the 13 formulations are shown
in Table 4. These results were used as input in the
Design-Expert 8.0.7.1 software for the optimization
analysis.
TABLE 4: SUMMARY OF EXPERIMENTAL
MEASUREMENTS OF CUMULATIVE RELEASE IN THE
FIRST 1 HR AND RELEASE RATE FOR THE THIRTEEN
FORMULATIONS.
Formulation
code
Responses
Cumulative release in
the 1sthr (%)
Release rate
(hr-1/2
)
F1 62.32 -
F2 21.42 24.51
F3 87.79 -
F4 22.94 28.77
F5 99.79 -
F6 20.08 25.68
F7 22.15 28.81
F8 35.07 32.32
F9 24.24 29.92
F10 22.68 29.24
F11 23.98 29.81
F12 24.77 30.15
F13 23.72 29.70
Response model selection: Suitable models for the
responses were selected based on the fit summaries.
Page 10
Yilma et al., IJPSR, 2015; Vol. 6(5): 1877-1892. E-ISSN: 0975-8232; P-ISSN: 2320-5148
International Journal of Pharmaceutical Sciences and Research 1886
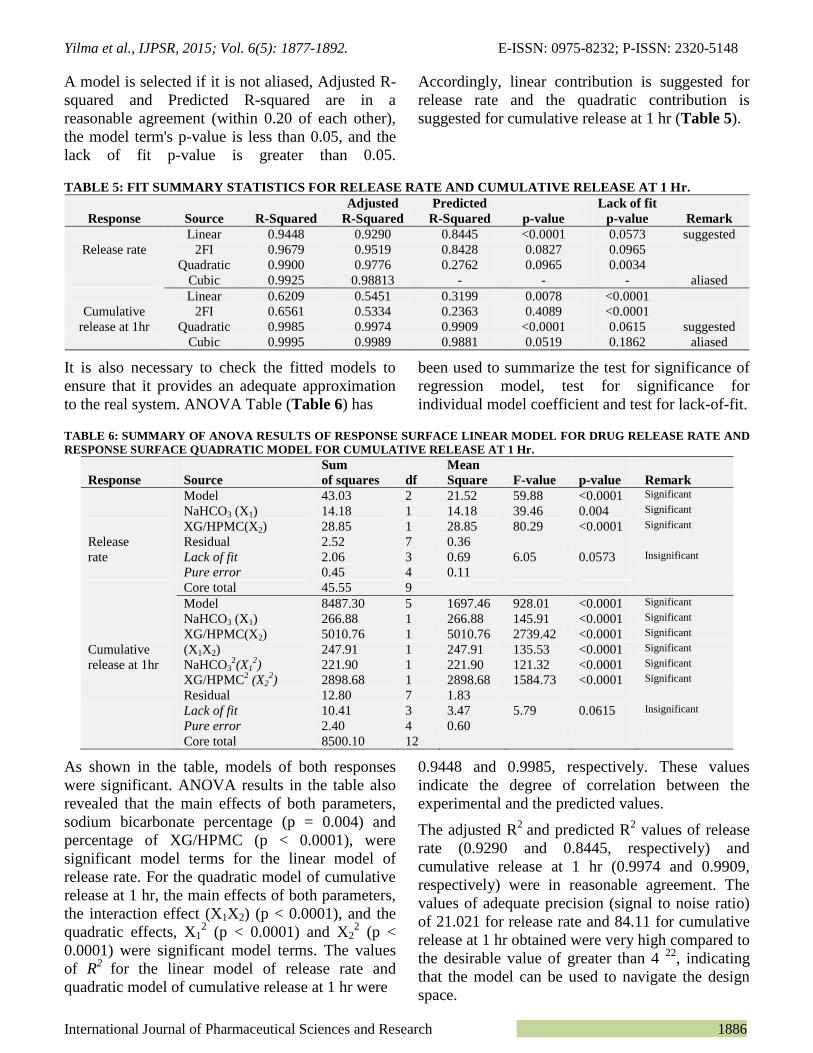
A model is selected if it is not aliased, Adjusted R-
squared and Predicted R-squared are in a
reasonable agreement (within 0.20 of each other),
the model term's p-value is less than 0.05, and the
lack of fit p-value is greater than 0.05.
Accordingly, linear contribution is suggested for
release rate and the quadratic contribution is
suggested for cumulative release at 1 hr (Table 5).
TABLE 5: FIT SUMMARY STATISTICS FOR RELEASE RATE AND CUMULATIVE RELEASE AT 1 Hr.
Response
Source
R-Squared
Adjusted
R-Squared
Predicted
R-Squared
p-value
Lack of fit
p-value
Remark
Release rate
Linear 0.9448 0.9290 0.8445 <0.0001 0.0573 suggested
2FI 0.9679 0.9519 0.8428 0.0827 0.0965
Quadratic 0.9900 0.9776 0.2762 0.0965 0.0034
Cubic 0.9925 0.98813 - - - aliased
Linear 0.6209 0.5451 0.3199 0.0078 <0.0001
Cumulative
release at 1hr
2FI 0.6561 0.5334 0.2363 0.4089 <0.0001
Quadratic 0.9985 0.9974 0.9909 <0.0001 0.0615 suggested
Cubic 0.9995 0.9989 0.9881 0.0519 0.1862 aliased
It is also necessary to check the fitted models to
ensure that it provides an adequate approximation
to the real system. ANOVA Table (Table 6) has
been used to summarize the test for significance of
regression model, test for significance for
individual model coefficient and test for lack-of-fit. TABLE 6: SUMMARY OF ANOVA RESULTS OF RESPONSE SURFACE LINEAR MODEL FOR DRUG RELEASE RATE AND
RESPONSE SURFACE QUADRATIC MODEL FOR CUMULATIVE RELEASE AT 1 Hr.
Response
Source
Sum
of squares
df
Mean
Square
F-value
p-value
Remark
Model 43.03 2 21.52 59.88 <0.0001 Significant
NaHCO3 (X1) 14.18 1 14.18 39.46 0.004 Significant
XG/HPMC(X2) 28.85 1 28.85 80.29 <0.0001 Significant
Release Residual 2.52 7 0.36
rate Lack of fit 2.06 3 0.69 6.05 0.0573 Insignificant
Pure error 0.45 4 0.11
Core total 45.55 9
Cumulative
release at 1hr
Model 8487.30 5 1697.46 928.01 <0.0001 Significant
NaHCO3 (X1) 266.88 1 266.88 145.91 <0.0001 Significant
XG/HPMC(X2) 5010.76 1 5010.76 2739.42 <0.0001 Significant
(X1X2) 247.91 1 247.91 135.53 <0.0001 Significant
NaHCO32(X1
2) 221.90 1 221.90 121.32 <0.0001 Significant
XG/HPMC2 (X2
2) 2898.68 1 2898.68 1584.73 <0.0001 Significant
Residual 12.80 7 1.83
Lack of fit 10.41 3 3.47 5.79 0.0615 Insignificant
Pure error 2.40 4 0.60
Core total 8500.10 12
As shown in the table, models of both responses
were significant. ANOVA results in the table also
revealed that the main effects of both parameters,
sodium bicarbonate percentage (p = 0.004) and
percentage of XG/HPMC (p < 0.0001), were
significant model terms for the linear model of
release rate. For the quadratic model of cumulative
release at 1 hr, the main effects of both parameters,
the interaction effect (X1X2) (p < 0.0001), and the
quadratic effects, X12 (p < 0.0001) and X2
2 (p <
0.0001) were significant model terms. The values
of R2
for the linear model of release rate and
quadratic model of cumulative release at 1 hr were
0.9448 and 0.9985, respectively. These values
indicate the degree of correlation between the
experimental and the predicted values.
The adjusted R2
and predicted R2 values of release
rate (0.9290 and 0.8445, respectively) and
cumulative release at 1 hr (0.9974 and 0.9909,
respectively) were in reasonable agreement. The
values of adequate precision (signal to noise ratio)
of 21.021 for release rate and 84.11 for cumulative
release at 1 hr obtained were very high compared to
the desirable value of greater than 4 22
, indicating
that the model can be used to navigate the design
space.
Page 11
Yilma et al., IJPSR, 2015; Vol. 6(5): 1877-1892. E-ISSN: 0975-8232; P-ISSN: 2320-5148
International Journal of Pharmaceutical Sciences and Research 1887
The normal probability plots of the residuals and
the plots of the residuals versus the predicted
response for cumulative release at 1 hr and release
rate were observed (Figures not shown) which
were considered as additional tests of model
adequacy checking tools 23
. Normal probability plot
of residuals showed that points or point clusters are
placed closely to the diagonal line implying that the
errors are distributed normally for both responses.
Plots of the residuals against predicted response
indicate that the points are randomly scattered, with
no obvious pattern or structure.
Since both of the response models were significant,
the adjusted and predicted R2 of both response
models were in good agreements, the adequate
precision were over 4 and the residuals were well
behaved; it is reasonable to conclude that the
selected models were fairly accurate and could be
used for further analysis. The final mathematical
regression models in terms of coded factors (Eq. 7
and Eq. 8) were developed.
211 3.19X1.54X 29.98)(Y rateRel. Eq. 7 2
2
2
121212 20.41X5.65X87.725.03X-5.78X23.88)(Y1hr rel. Cum. XX Eq. 8
As evidenced from (Eq. 7 and 8), both responses
are affected positively by the percentage of sodium
bicarbonate (X1) and negatively by the percentage
of the polymer (X2); however, the effect of the
polymer was stronger than that of sodium
bicarbonate on both of the responses. The second
order interaction effect negatively affects the
cumulative release at 1 hr. Quadratic effects (X12
and X22) were found to have positive relationship
with cumulative release at 1 hr. These phenomena
can be clearly seen in 2D contour and 3D response
surface plots in Fig and 7.
The series of parallel straight lines of the contour
plot and the non-twisted response surface (Fig. 6)
indicate that there was no interaction effect of the
two parameters on the release rate. The plots show
that the linear model components individually
affect the release rate, with comparatively a more
significant effect of XG/HPMC percentage. The
same is indicated in the ANOVA results (Table 6),
where XG/HPMC percentage showed more
significant effect (p < 0.0001) than the percentage
of sodium bicarbonate (p = 0.004) on the release
rate.
FIG. 6: CONTOUR (LEFT) AND RESPONSE SURFACE (RIGHT) PLOTS OF POLYMER PERCENTAGE
(XG/HPMC) AND THE PERCENTAGE OF SODIUM BICARBONATE ON DRUG RELEASE RATE.
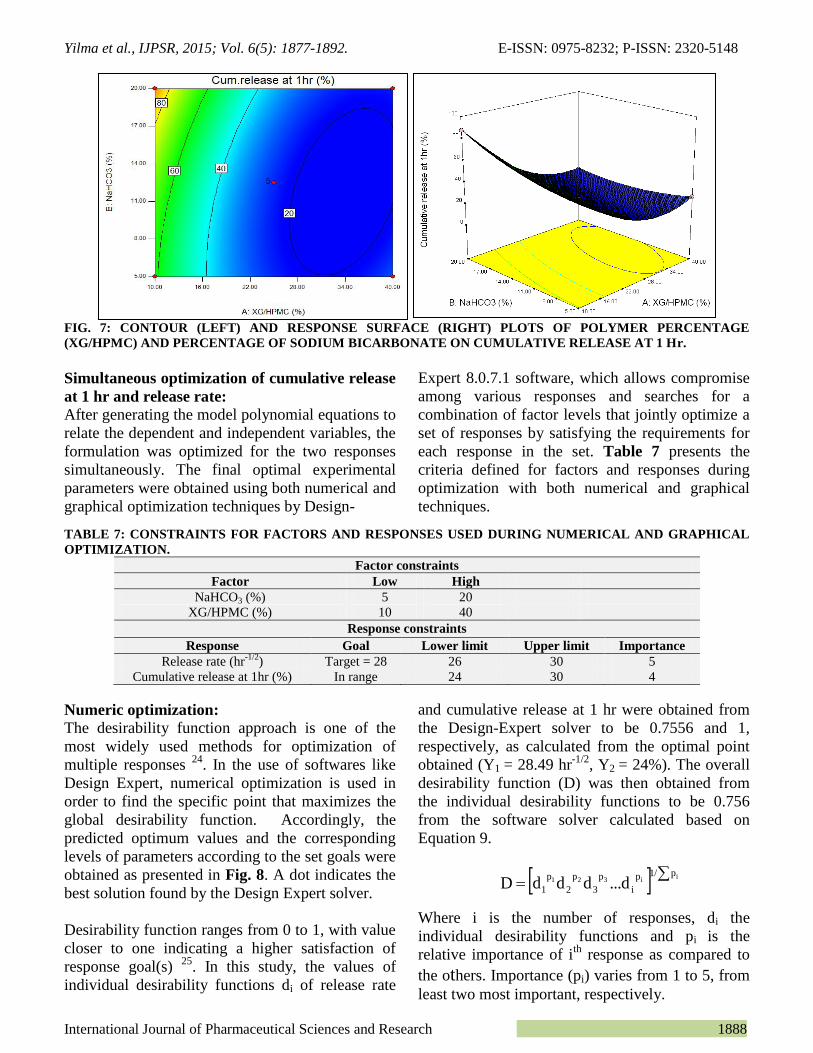
The combined effect of sodium bicarbonate
percentage and XG/HPMC percentage on
cumulative release at 1 hr is shown in Fig. 7. As
the elliptical contours and twisted response surface
of Fig. 7, and the ANOVA results in Table 6 (p <
0.0001) indicate, the interactive effect of the two
variables is significant.
Page 12
Yilma et al., IJPSR, 2015; Vol. 6(5): 1877-1892. E-ISSN: 0975-8232; P-ISSN: 2320-5148
International Journal of Pharmaceutical Sciences and Research 1888
FIG. 7: CONTOUR (LEFT) AND RESPONSE SURFACE (RIGHT) PLOTS OF POLYMER PERCENTAGE
(XG/HPMC) AND PERCENTAGE OF SODIUM BICARBONATE ON CUMULATIVE RELEASE AT 1 Hr.
Simultaneous optimization of cumulative release
at 1 hr and release rate:
After generating the model polynomial equations to
relate the dependent and independent variables, the
formulation was optimized for the two responses
simultaneously. The final optimal experimental
parameters were obtained using both numerical and
graphical optimization techniques by Design-
Expert 8.0.7.1 software, which allows compromise
among various responses and searches for a
combination of factor levels that jointly optimize a
set of responses by satisfying the requirements for
each response in the set. Table 7 presents the
criteria defined for factors and responses during
optimization with both numerical and graphical
techniques.
TABLE 7: CONSTRAINTS FOR FACTORS AND RESPONSES USED DURING NUMERICAL AND GRAPHICAL
OPTIMIZATION.
Factor constraints
Factor Low High
NaHCO3 (%) 5 20
XG/HPMC (%) 10 40
Response constraints
Response Goal Lower limit Upper limit Importance
Release rate (hr-1/2
) Target = 28 26 30 5
Cumulative release at 1hr (%) In range 24 30 4
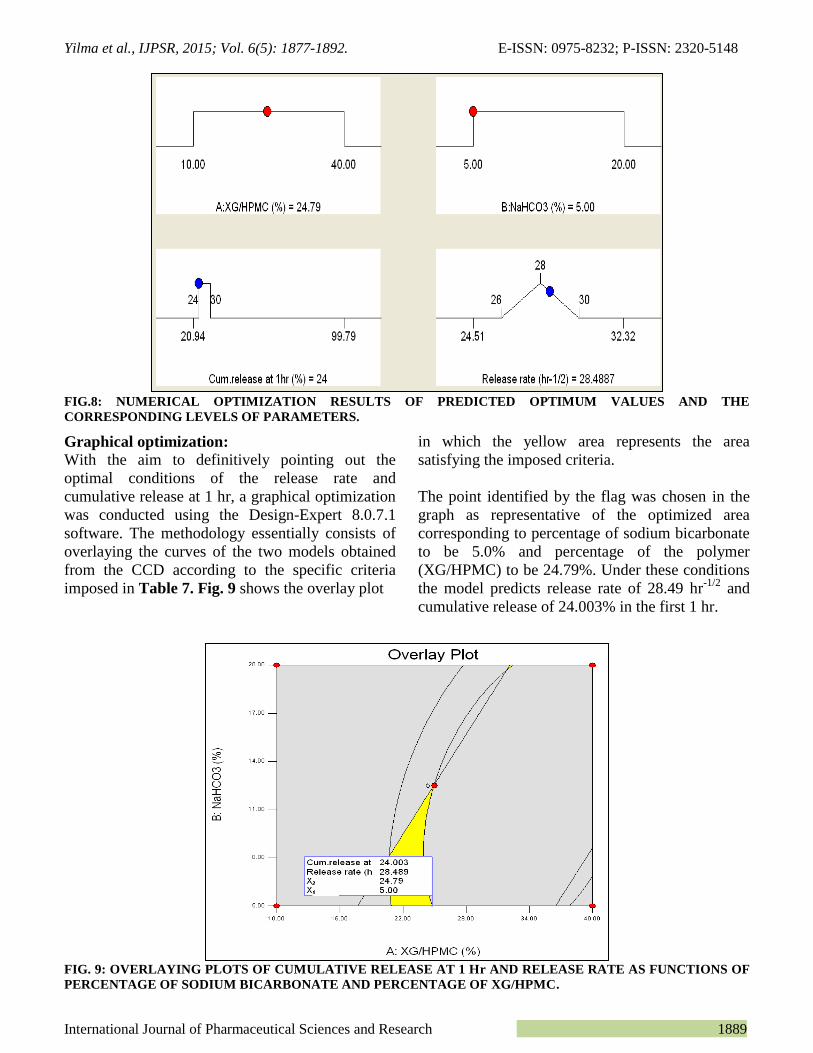
Numeric optimization:
The desirability function approach is one of the
most widely used methods for optimization of
multiple responses 24
. In the use of softwares like
Design Expert, numerical optimization is used in
order to find the specific point that maximizes the
global desirability function. Accordingly, the
predicted optimum values and the corresponding
levels of parameters according to the set goals were
obtained as presented in Fig. 8. A dot indicates the
best solution found by the Design Expert solver.
Desirability function ranges from 0 to 1, with value
closer to one indicating a higher satisfaction of
response goal(s) 25
. In this study, the values of
individual desirability functions di of release rate
and cumulative release at 1 hr were obtained from
the Design-Expert solver to be 0.7556 and 1,
respectively, as calculated from the optimal point
obtained (Y1 = 28.49 hr-1/2
, Y2 = 24%). The overall
desirability function (D) was then obtained from
the individual desirability functions to be 0.756
from the software solver calculated based on
Equation 9.
ii321
p1/p
i
p
3
p
2
p
1 ...ddddD Eq. 9
Where i is the number of responses, di the
individual desirability functions and pi is the
relative importance of ith
response as compared to
the others. Importance (pi) varies from 1 to 5, from
least two most important, respectively.
Page 13
Yilma et al., IJPSR, 2015; Vol. 6(5): 1877-1892. E-ISSN: 0975-8232; P-ISSN: 2320-5148
International Journal of Pharmaceutical Sciences and Research 1889
FIG.8: NUMERICAL OPTIMIZATION RESULTS OF PREDICTED OPTIMUM VALUES AND THE
CORRESPONDING LEVELS OF PARAMETERS.
Graphical optimization:
With the aim to definitively pointing out the
optimal conditions of the release rate and
cumulative release at 1 hr, a graphical optimization
was conducted using the Design-Expert 8.0.7.1
software. The methodology essentially consists of
overlaying the curves of the two models obtained
from the CCD according to the specific criteria
imposed in Table 7. Fig. 9 shows the overlay plot
in which the yellow area represents the area
satisfying the imposed criteria.
The point identified by the flag was chosen in the
graph as representative of the optimized area
corresponding to percentage of sodium bicarbonate
to be 5.0% and percentage of the polymer
(XG/HPMC) to be 24.79%. Under these conditions
the model predicts release rate of 28.49 hr-1/2
and
cumulative release of 24.003% in the first 1 hr.
FIG. 9: OVERLAYING PLOTS OF CUMULATIVE RELEASE AT 1 Hr AND RELEASE RATE AS FUNCTIONS OF
PERCENTAGE OF SODIUM BICARBONATE AND PERCENTAGE OF XG/HPMC.
Page 14
Yilma et al., IJPSR, 2015; Vol. 6(5): 1877-1892. E-ISSN: 0975-8232; P-ISSN: 2320-5148
International Journal of Pharmaceutical Sciences and Research 1890
Validation test:
To experimentally confirm the validity of obtained
optimal point, confirmatory studies were carried
out in triplicate at the optimal combinations of the
factors (X1 = 5%, X2 = 24.79). Table 8 provides the
predicted values, experimental results and the
percentage error values obtained at optimal levels
of the factors. As seen in the table, the values of
percentage errors had fallen within about 5% and
thus confirming that the experimental values of the
optimized formulations agreed well with the
predicted values 26
.
TABLE 8: RESPONSE VALUES OF PREDICTED, EXPERIMENTAL AND PERCENTAGE ERROR OBTAINED AT OPTIMAL
LEVELS OF THE FACTORS.
Response Predicted value Experimental value % Error
Release rate (Y1, hr-1/2) 28.49 29.08 2.03
Cumulative release at 1 hr (Y2, %) 24.00 25.45 5.69
Evaluation of the optimized floating salbutamol
sulphate tablets: The optimized formulation was
evaluated for its granule and tablet properties. The
results are presented in Table 9. Excellent granule
flow property and good tablet quality are obtained.
TABLE 9: GRANULE AND TABLET PROPERTIES OF THE OPTIMIZED SALBUTAMOL SULPHATE FORMULATION
Parameters Experimental values
Granule properties
Bulk density (g/cm3) 0.32 ± 0.01
Tapped density (g/cm3) 0.35 ± 0.00
Angle of repose (o) 28.45 ± 1.13
Carr’s Index (%) 8.41 ± 0.03
Hausner ratio
Flow rate (g/sec)
1.09 ± 0.03
2.02 ± 0.12
Tablet properties
Hardness (N) 65.3 3± 1.53
Thickness (mm) 3.65 ± 0.05
Friability (%) 0.35
Assay (%) 98.96 ± 0.00
Matrix integrity Intact
Floating lag time (sec) 2.21 ± 0.1
Floating duration (hr) > 12
The release profiles of the optimized formulation
were evaluated using three different batches as
presented in Fig. 10. ANOVA of the release
profiles based on DE values of the three batches,
65.06 ± 0.8, 65.71 ± 1.14 and 64.73 ± 0.66%,
revealed that there was no statistically significant
difference (p = 0.1871) in the release profiles of
the formulations.
0 2 4 6 8 10 120
20
40
60
80
100
Cum
ulat
ive
rele
ase
(%)
Time (hr)
Batch 1
Batch 2
Batch 3
FIG.10: RELEASE PROFILES OF THREE BATCHES OF
THE OPTIMIZED SUSTAINED RELEASE FLOATING
MATRIX TABLETS OF SALBUTAMOL SULPHATE.
The release profile curves presented in the figure
also support the ANOVA results of DE that the
release patterns are similar among the batches,
leading to the conclusion that the optimal
formulation obtained yields reproducible results.
The results also confirmed that formulation of
sustained release floating matrix tablet of
salbutamol sulphate that releases the drug for 12 hr
in a sustained manner in vitro was achieved.
The drug release mechanism from the optimized
formulation was evaluated using the Korsmeyer-
Peppas model at 60% release and the results
showed that n value ranges from 0.562 to 0.588
indicating drug release from the optimized
formulation follows non-Fickian diffusion release
mechanism.
Drug-excipient interaction study: Drug-
excipients interaction was studied using Fourier
Page 15
Yilma et al., IJPSR, 2015; Vol. 6(5): 1877-1892. E-ISSN: 0975-8232; P-ISSN: 2320-5148
International Journal of Pharmaceutical Sciences and Research 1891
transformed infrared (FT-IR) spectroscopy. Fig. 11
depicts the IR spectra of the overlap of pure
salbutamol sulphate and the optimized formulation.
As shown in the figure, the characteristic peaks of
salbutamol sulphate were observed: C-O stretching
vibrations of primary alcohol at 1112 cm-1
, C-O
vibrations of phenol at 1205 cm-1
, C-H bending
vibrations of tertiary carbon at 1338 cm-1
and C-H
stretching vibrations at 2952 cm-1
27
. These
characteristic peaks also appear in the spectrum of
the optimized formulation at the same wave
numbers indicating that there was no interaction
between the drug and formulation excipients.
FIG.11: OVERLAP OF FTIR SPECTRA OF PURE SALBUTAMOL AND THE OPTIMIZED TABLET.
CONCLUSION: Preliminary studies on floating
sustained release salbutamol sulphate matrix tablets
revealed that formulation variables like polymer
type, polymer ratio, polymer concentration, and
NaHCO3 concentration have significant effect on
release rate, cumulative release at 1 hr, and floating
lag time, but not on floating duration. Among
formulations developed in the preliminary study,
XG/HPMC polymer blend at 1:3ratio showed
relatively good release pattern and was optimized
using CCD approach. The optimized formulation
containing 24.79% of XG/HPMC (1:3) and 5% of
NaHCO3 was experimentally evaluated and showed
good agreement with the predicted response values.
In conclusion, this study has come up with an
optimum formulation for the preparation of floating
matrix tablet of salbutamol sulphate that could
remain buoyant in the gastric content and release
the drug over a period of 12 hr in a sustained
manner. From in vitro perspective, this optimized
formulation may improve the overall bioactivity of
oral salbutamol sulphate and patient compliance.
ACKNOWLEDGEMENTS: The authors would
like to thank Addis Pharmaceutical Factory PLC.
(APF) and Food, Medicine and Healthcare
Administration and Control Authority of Ethiopia
(EFMHACA) for providing access to their facilities
and School of Graduate Studies, Addis Ababa
University (AAU) for financing the study. ZY is
also grateful to Mekele University for sponsoring
his study at AAU.
REFERENCES:
1. Pathan A., Channawar M., Bakde B., Chandewar A.
Developmentand invitro evaluation of salbutamol sulphat
e mucoadhesive buccal patches.Int. J. Pharm. Pharmaceut.
Sci. 2011; 3:39 44.
2. Fishwick D., Bradshaw L., Macdonald C. Cumulative
single-dose design to assess the bronchodilator effects of
beta-2- agonists in individuals with asthma. Am. J. Resp.
Crit. Med. 2001; 163:474 – 477.
3. AHFS. American Hospital Formulary Service: Drug
Information 2008®. USA: American Society of Health-
System Pharmacists Inc; 2008, p. 1340 - 1352.
4. Swarbrick J. Encyclopedia of pharmaceutical technology,
3rd ed, Vol 1, USA: Pharmaceu Tech, Inc; 2007, p. 1253.
5. Mamidala R., Ramana V., Sandeep G., Lingam M., Gannu
R., Yamsani M. Factors influencing the design and
performance of oral sustained/controlled release dosage
forms. Int. J. Pharm. Sci. Nanotechnol. 2009; 2:583 -594.
6. Ravikumar K., Vinaya O., Santhikrishna U. Development
of floating matrix tablets of salbutamol sulphate and study
of drug release kinetics. Int. J. Res. Pharm. Biomed. Sci.
2012; 3:1346 - 1354.
7. Kavitha K. and Mehaboob Y. Microbaloon as a drug
delivery system: an emerging trend. Int. J. Res. Pharm.
Biomed. Sci. 2011; 2:44 - 51.
Page 16
Yilma et al., IJPSR, 2015; Vol. 6(5): 1877-1892. E-ISSN: 0975-8232; P-ISSN: 2320-5148
International Journal of Pharmaceutical Sciences and Research 1892
8. Shinde S., Magdum S., Waikar S., Mishra M., Chandak K.
Development and evaluation of floating tablets of
salbutamol sulphate, Int. J. Pharm. Res. Dev. 2010; 2:1 - 7.
9. USP 30/ NF 25. United States Pharmacopoeial
Convention, Inc. Rockville, Maryland; 2007.
10. Sadray S., Honary S., Ebrahimi P., Jafari P., Sezaee R.
Dissolution profile comparison: Model dependent and
model independent approaches. Int. J. Pharm. and Bio Sci.
2010; 2:1 - 10.
11. Shoaib M., Tazeen J., Merchant H., Yousuf R. Evaluation
of drug release kinetics from ibuprofen matrix tablets
using HPMC. Pak. J. Pharm. Sci. 2006; 19:119 - 124.
12. Akelesh T., Sapkal SB., Sivakumar R., Jothi R.,
Venkatnarayanan R. Formulation development of gastro
retentive floating tablet of acyclovir using natural gums.
Der Pharmacia Lettre 2011; 3:254 - 261.
13. Singh K., Gupta S., Singh A., Sinha S. Experimental
design and response surface modeling for optimization of
Rhodamine B removal from water by magnetic
nanocomposite. Chem. Eng. J. 2010; 165:151 - 160.
14. Talukdar M., Michoel A., Rombaut P., Kinget R.
Comparative study on xanthan gum and
hydroxypropylmethyl cellulose as matrices for controlled-
release drug delivery I. Compaction and in vitro drug
release behaviour. Int. J. Pharm. 1996; 129:233 - 241.
15. Tiwari S. Rajabi-Siahboomi A. Applications of
complementary polymers in HPMC hydrophilic extended
release matrices. Drug Deliver. Technol. 2009; 9:19 - 27.
16. Hu L., Li L., Yang X., Liu W., Yang J., Jia Y., Shang C.,
Xu H. Floating matrix dosage form for dextromethorphan
hydrobromide based on gas forming technique: In vitro
and in vivo evaluation in healthy volunteers, Eur. J.
Pharm. Sci. 2011; 42:99 - 105.
17. Rajukar M., Vaka T., Hygreevachary K., Venkateswarlu
E., Rakesh K. Design fabrication and characterization of
controlled released tablets of Trimetazidine di
hydrochloride. Der. Pharmacia Sinica. 2011; 2:59 - 66.
18. Maderuelo C., Zarzuelo A., Lanao JM. Critical factors in
the release of drugs from sustained release hydrophilic
matrices. J. Control. Rel. 2011; 154:2 - 19.
19. Tadros M. Controlled-release effervescent floating matrix
tablets of ciprofloxacin hydrochloride: Development,
optimization and in vitro–in vivo evaluation in healthy
human volunteers. Eur. J. Pharm. Biopharm. 2010; 74:332
- 339.
20. Bomma R., Naidu R., Yamsani M., Veerabrahma K.
Development and evaluation of gastroretentive norfloxacin
floating tablets. Acta Pharm. 2009; 59:211 - 221.
21. Pasa G., Mishra US. Tripathy NK. Sahoo SK., Mahapatra
AK. Formulation development and evaluation of
didanosine sustained release matrix tablets using HPMC
K15. Int. J. Pharm. 2012; 2:97 - 100.
22. Aziz H., Kamaruddin A., Abu-Bakar M. Process
optimization studies on solvent extraction with
naphthalene-2-boronic acid ion-pairing with trioctylmethyl
ammonium chloride in sugar purification using design of
studies. Separ. Purif. Technol. 2008; 60:190 - 197.
23. Kusic H., Jovic M., Kos N., Koprivanac N., Marin V. The
comparison of photooxidation processes for the
minimization of organic load of colored waste water
applying the response surface methodology. J. Hazard.
Mater. 2010; 183:189 - 202.
24. Takayama K., Fujikawa M., Obata Y., Morishita M.
Neural network based optimization of drug formulations.
Adv. Drug Deliver. 2003; 55:1217 - 1231.
25. Yang K., El-Haik B. Design for Six Sigma: a Roadmap for
Product Development. 2nd ed. New York: McGraw-Hill
Co. Inc; 2008, p. 611 - 642.
26. Mohajeri L., Aziz H., Isa M., Zahed M. A statistical
experiment design approach for optimizing biodegradation
of weathered crude oil in coastal sediments. Bioresource
Technol. 2010; 101:893 - 900.
27. Prasanthi N., Krishna C., Gupta M., Manikiran S., Rao N.
Design and development of sublingual fast dissolving
films for an antiasthmatic drug. Der. Pharmacia Lettre.
2011; 3:382 - 395.
All © 2013 are reserved by International Journal of Pharmaceutical Sciences and Research. This Journal licensed under a Creative Commons Attribution-NonCommercial-ShareAlike 3.0 Unported License.
This article can be downloaded to ANDROID OS based mobile. Scan QR Code using Code/Bar Scanner from your mobile. (Scanners are
available on Google Playstore)
How to cite this article:
Yilma Z, Belete A and Gebre-Mariam T: Formulation and Optimization of Sustained Release Floating Matrix Tablets of Salbutamol
Sulphate Using Xanthan Gum and Hydroxypropyl Methylcellulose Polymer Blend. Int J Pharm Sci Res 2015; 6(5): 1877-92.doi:
10.13040/IJPSR.0975-8232.6(5).1877-92.