+ All Categories
Home > Documents > Forskningsrapport, fd SP-Rapport...1.4 Paper process, PM 3 4 1.5 Paper process, PM 4 5 1.6...

Forskningsrapport, fd SP-Rapport...1.4 Paper process, PM 3 4 1.5 Paper process, PM 4 5 1.6...

Date post: 21-Jun-2020
Category:
Upload: others
View: 2 times
Download: 0 times
Share this document with a friend
99
BIOECONOMY Process integration by using membranes in a tissue plant Anders Uhlin, RISE Bioeconomy Åsa Sivard, ÅF Ehsan Moslehi, RISE Bioeconomy Maria Takman, ÅF RISE Bioeconomy Report No: 17 Åforsk report 20181130
Transcript

BIOECONOMY

Process integration by using membranes in a tissue plant

Anders Uhlin, RISE Bioeconomy Åsa Sivard, ÅF Ehsan Moslehi, RISE Bioeconomy Maria Takman, ÅF RISE Bioeconomy Report No: 17

Åforsk report 20181130

Process integration by using membranes in a tissue plant

Anders Uhlin, RISE Bioeconomy Åsa Sivard, ÅF Ehsan Moslehi, RISE Bioeconomy Maria Takman, ÅF

1

Content Content ....................................................................................................... 1 Summary ................................................................................................... 2 1 Sofidel Sweden AB Mill in Kisa............................................................. 3

1.1 Raw water treatment 3 1.2 Raw water quality 4 1.3 Cooling water system 4 1.4 Paper process, PM 3 4 1.5 Paper process, PM 4 5 1.6 Evaporated water in the paper process 5 1.7 Effluent treatment plant 6 1.8 Effluent treatment data 6 1.9 Raw water quality demand 8

2 Membrane filtration experiments ...................................................... 10 2.1 Sampling positions for membrane filtration tests 10 2.2 Membrane filtration tests 10

2.2.1 After spray water tank in PM3 system before the scrubber 11

2.2.2 After flotation in PM4 water system 12

2.2.3 After effluent treatment 13

2.3 Economic calculations – installation of membrane unit 15 3 Further studies ................................................................................... 16 4 Conclusion .......................................................................................... 17 5 References .......................................................................................... 18 APPENDIX 1 .............................................................................................. 19 Process flow diagram Sofidel .................................................................... 19 Appendix 2. .............................................................................................. 20 Master thesis - Ehsan Moslehi .................................................................. 20

2

Summary In this project, financed by Åforsk, ÅF and Sofidel, the possibilities to use membranes for reuse of water via process integration in a tissue mill was investigated. Water saving is an increasing interest even in the Norden European countries due to the climate change resulting in higher temperatures and longer periods of draught. In 2016 the river supplying the water to the Sofidel mill in Kisa had very low levels of water which could be a threat to the production of paper at the mill.

Several process streams from the mill were collected and evaluated with membranes for recirculation in the mill. One possible process integration identified in the project was to purify the outgoing water with membranes and replace some of the fresh water intake. To reach the COD and conductivity numbers required reverse osmosis membranes were used, in combination with pre-treatment of the process water. Pre-treatment utilizing centrifugation or chemicals in combination with a membrane process using reverse osmosis gave promising results. A cost estimation for the size of the required membrane equipment needed was made.

In addition to the waste water sample some other process streams were also evaluated, and the results show that membranes could function as kidneys in the process, removing some organic components from the process. The integration and use in the mill of the tested process streams could not be identified.

The experimental work in the project was carried out as a master thesis study and the thesis report is included as an appendix to this report (Appendix 2).

3

1 Sofidel Sweden AB Mill in Kisa Sofidel Sweden AB (Sofidel) develops and produces tissue. The company is owned by Sofidel Group, headquarters in Italy. White and colored tissue of surface weights in the range of 14-37 g/m2 is produced on two paper machines, PM3 and PM4. About 55 different product qualities are currently produced. Both paper machines use Crescent forming technique and have yankee cylinders in the drying position.

The mill is situated at Kisa river, about 3.5 km outside Kisa community in Östergötland. The river water is used as process water and the effluent streams are after treatment discharged to the same river.

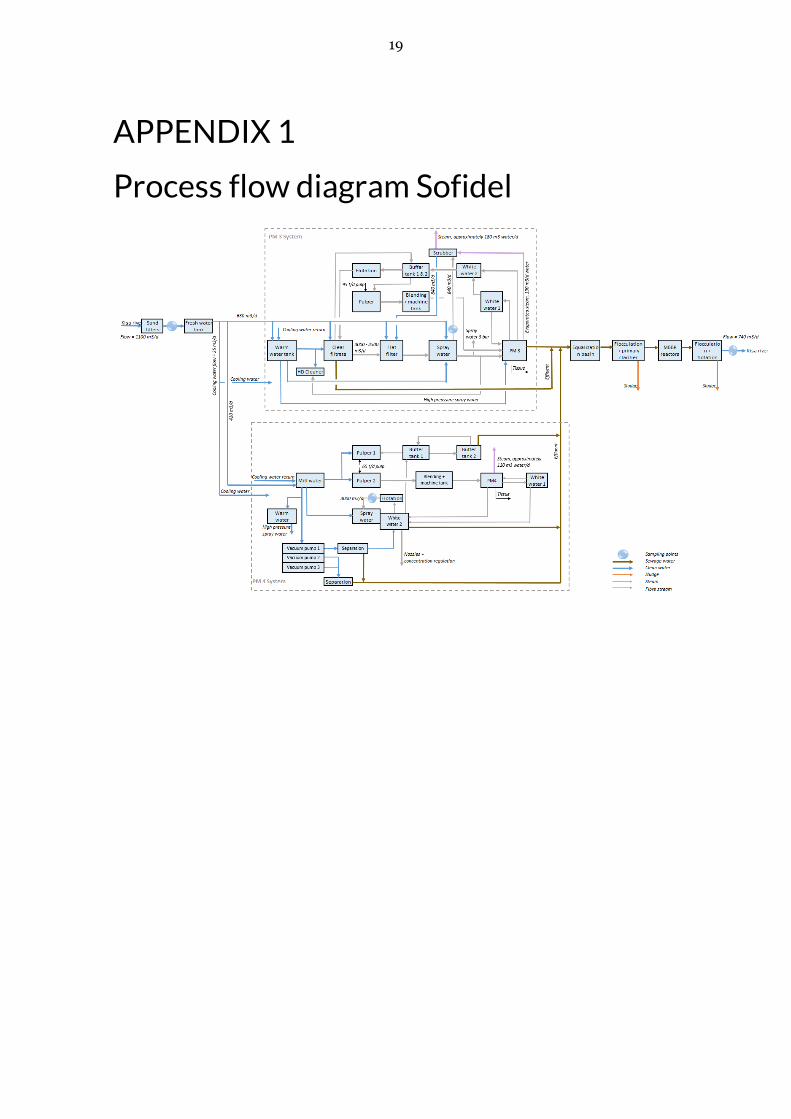
In appendix 1 a block diagram of the water process flow in the mill is presented.

1.1 Raw water treatment Raw water from the Kisa river is used as process water. The Kisa river flows from Lake Nedre Föllingen to Kisasjön, a distance of about 3 km. The main receiving water for the effluent is Motala Ström. The normal flow in the Kisa river is about 1.4 m3/s, but the last two years the summer period has been dry and the river flow has been reduced to about 0.4 m3/s.

Water from the raw water intake is treated in two pressurized sand filters. Polyaluminium chloride and sodium hypochlorite are dosed to the filters. The sand filters are rinsed after approximately 300-500 m3 flow with ca 10 m3 rinsing water. The rinsing water is discharged to the effluent sewer. The total amount of rinsing water used per day is approximately 20 m3. Via a fresh water tank the water is distributed to PM3 and PM4.

The average raw water intake to the mill is 1100 m3/d (based on data January 2017 to March 2018). Monthly average flows are shown in Figure 1.

Figure 1 Raw water intake to the Sofidel mill.

4

1.2 Raw water quality

Table 1 the average of a few grab sample data on river water and sand filtered water from September - November 2016 are presented. For suspended solids there is also some data from January 2018.

Table 1. River water data, Sofidel, average of three grab samples, September 2016

Inlet sand filters1) Outlet sand filters2)

COD mg/l 28 34

SS mg/l 0.9 1.63)

Total Nitrogen mg/l 0.8 0.9

Total Phosphorus mg/l 0.01 0.01

Conductivity µS/cm 130 168

pH 7.1 7.0

1) Average of three grab samples from September 2016. 2) Average of 19 grab samples from September - November 2016. 3) In two samples from January 2018 the SS values were 18 mg/l and 38 mg/l. These values are not included in the

average value.

When comparing the measured parameters in these positions, the sand filters do not seem to improve the water quality. All parameters are of the same level or even somewhat higher after the sand filters than before, but no certain conclusions can be drawn out of so few data.

1.3 Cooling water system Cooling water is taken from PM 3:s main water distribution pipe for use in different positions in the mill.

The cooling water amount is approximately 25 m3/d. It is distributed to different positions including lubrication systems and the press sections of the paper machines.

Return flow from the cooling water system is led to the Warm water tank in PM3 water system and to the Mill water tank in PM4 water system.

1.4 Paper process, PM 3 PM 3 is a tissue machine with Crescent former technique and a Yankee cylinder for paper drying. The heat in the drying cylinders is from biofuel-produced steam.

From the fresh water tank, the water is led to a warm water tank, a clear filtrate tank, a flat filter, a spray water tank, and thereafter to PM3. From PM3 one water stream is treated in a flotation unit and led back to the clear filtrate tank. There are effluent streams from the clear filtrate tank and from PM3 to the effluent treatment.

Fibre containing white water is treated in a flotation unit.

5

On the roof there is a scrubber for treatment of evaporated steam. There have been frequent problems with scaling in this scrubber and it is not always in operation. During the fall of 2018 it was decided that the scrubber will be taken out of operation permanently.

The main fresh water consuming processes/positions are:

• Warm water tank for further distribution to * High pressure spray water (25 bar) to paper machine * HD Cleaner * Spray water tank

• Clear filtrate tank • Flat filter • Buffer tank 1

1.5 Paper process, PM 4 PM 4 is also a tissue machine with Crescent former technique and a Yankee cylinder for paper drying.

From the fresh water tank, water is led to a mill water tank, from which it is distributed to PM4 via pulper 1 and 2, and to a spray water tank. From PM4 and from the spray water tank, water is led to a white water tank, from which water to nozzles and concentration regulation is taken. Fiber containing water from the white water tank is treated in a flotation unit and then led back to the spray water tank. An effluent stream origin from the white water tank is led to the effluent treatment.

For PM 4 there is no scrubber system.

The main fresh water consuming processes/positions are:

• Mill water tank for further distribution to * Pulper 2 * White water Flume 1 * Spray water tank

• Warm water tank for further distribution to HP spray water • Direct to spray water • Vacuum pumps 1, 2 and 3

1.6 Evaporated water in the paper process The average pulp dryness is 88 %. The average dryness of produced paper is 94 %. Based on the production of 2016, this causes an extra volume of approximately 10.4 m3 water/day to the system, since the volume of water that is entering the mill in the pulp is greater than the water leaving the mill in the paper.

According to the yearly environmental report from 2016 the evaporation from the paper machines is approximately 2 m3/ton produced tissue, corresponding to approximately 300 m3/d based on the production of 2016.

6

1.7 Effluent treatment plant Effluent streams from different parts of the plant are gathered in an equalization basin (R1). Ferric sulphate and polymer are dosed to the water and there is a flocculation chamber and a primary clarifier (R3) for withdrawal of primary sludge.

Primary clarified water is pumped to biological treatment in two MBBR reactors. Nitrogen, phosphorus and defoaming agent is dosed before the first reactor. Additional defoaming agent can be dosed to the second MBBR unit.

To the biologically treated water Ferric sulphate and polymer are dosed. Formed flocs are separated in a flotation unit with a flocculation chamber. Treated water is discharged to the Kisa river.

Biological and chemical sludge from the flotation unit is mixed with primary sludge in a sludge tank and dewatered. Reject water from the sludge dewatering is returned to the effluent treatment process ahead of the equalization basin R1.

1.8 Effluent treatment data The yearly average flow from the effluent treatment plant 2015-2017 is shown in Table 2 and monthly average flow values in Figure 2. Effluent flow measurements from Sofidel 2015-2017.

.

Table 2. Sofidel Kisa, Average flow from effluent treatment plant

2015 2016 2017

Average flow m3/d 653 584 741

Figure 2. Effluent flow measurements from Sofidel 2015-2017.

7

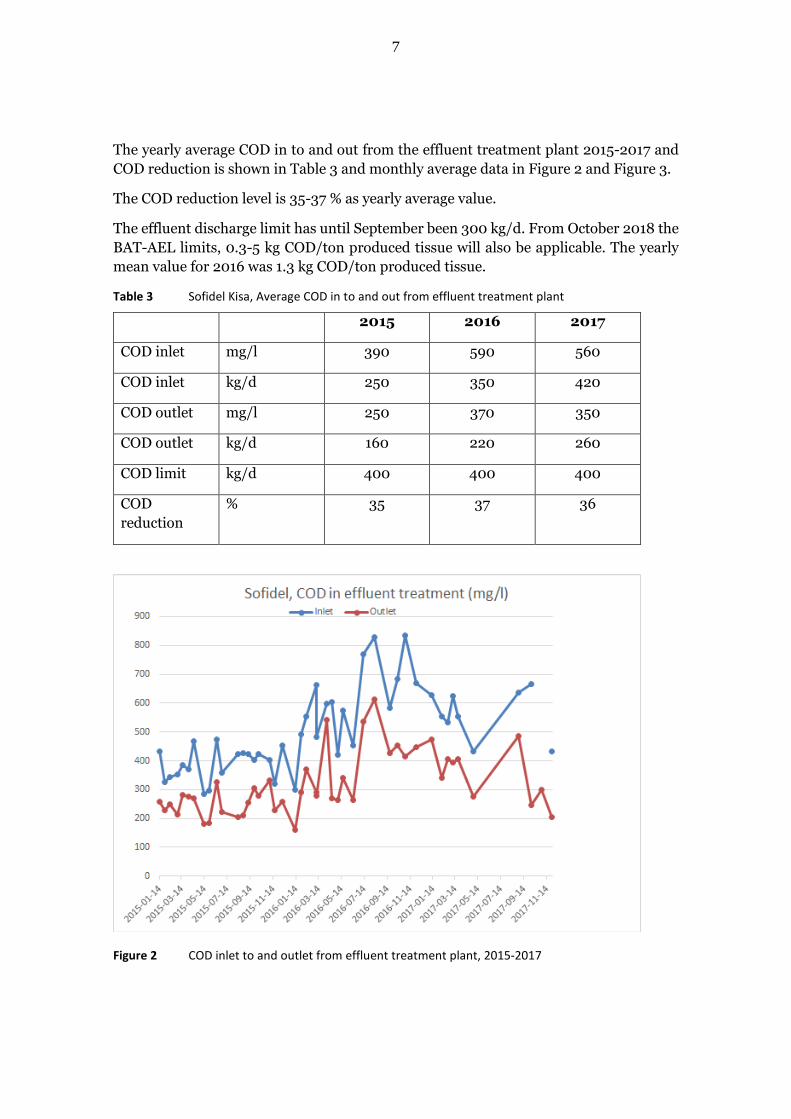
The yearly average COD in to and out from the effluent treatment plant 2015-2017 and COD reduction is shown in Table 3 and monthly average data in Figure 2 and Figure 3.

The COD reduction level is 35-37 % as yearly average value.

The effluent discharge limit has until September been 300 kg/d. From October 2018 the BAT-AEL limits, 0.3-5 kg COD/ton produced tissue will also be applicable. The yearly mean value for 2016 was 1.3 kg COD/ton produced tissue.

Table 3 Sofidel Kisa, Average COD in to and out from effluent treatment plant

2015 2016 2017

COD inlet mg/l 390 590 560

COD inlet kg/d 250 350 420

COD outlet mg/l 250 370 350

COD outlet kg/d 160 220 260

COD limit kg/d 400 400 400

COD reduction

% 35 37 36

Figure 2 COD inlet to and outlet from effluent treatment plant, 2015-2017

8

Figure 3 COD reduction in the effluent treatment plant, 2015-2017

1.9 Raw water quality demand To examine raw water and treated process water quality several parameters could be measured. Among these parameters are color, total hardness, iron content, manganese content, and residual aluminum. Some normal data for good raw water quality and standard values for fine paper are shown in Table . It must be noted that the quality according to this specification is much better than the fresh water intake used today in the mill. Most of the parameters in the table have not been measured at Sofidel for many years.

9

Table 4 Normal fresh water data according to Würtzell, 2001, and standard Fresh Water Specification, according to Sofidel and to TAPPI demand for Fine paper

Parameter Unit Fresh Water specification,

Sofidel

TAPPI process water

demand Fine

paper

Normal data for

good raw water

quality1)

Color mg Pt/l clear 5 <10

Total hardness2) °dH (German)3)

<83)

Total hardness as CaCO3 mg/l <1434) 100

Total dissolved solids mg/l <150 200

Free carbonic acid mg/l <10

Free carbon dioxide mg/l 10

Free chloride content (Cl2)

mg/l <20

Iron content (Fe) mg/l <0.2 0.1 0.05-0.2

Manganese content (Mn)

mg/l <0.1 0.05

Copper content (Cu) mg/l <0.1

KMnO4 mg/l <12 <125)

CODCr5) mg/l < 7.56) < 7.56)

SÄ GF/A mg/l <27)

Nitrates (NO3-) mg/l <20

Conductivity µS/cm <600

pH 6.5-7.5 6-8

Turbidity NTU <5 1.38)

Sulphates (SO42-) mg/l <30

1) Würtzell, 2001 2) Very soft water 0-2 °dH, Soft water 2-5 °dH, Average hardness 5-10°dH, Hard water 10-21 °dH and Very hard water >21 °dH 3) 1 °dH (German) corresponds to 7.2 mg/l Ca or 17.85 mg/l CaCO3 4) ÅF calculation 5) KMnO4: Very low concentration ≤4 mg/l, Low conc. 4-8 mg/l, Average conc. 8-12 mg/l, High conc. 12-16 mg/l and Very high conc. >16

mg/l 6) Calculated from KMnO4 (Dow, 2018), CODCr [mg/l] = 1/1.6 KMnO4 [mg/l] Varies for different waters 7) Normally the minimum possible analyzing value is said to be 5 mg/l 8) Based on transformation, 1 mg/l SiO2 units = 0.13 NTU

10

2 Membrane filtration experiments In this section a summary of the conducted membrane filtration experiments in the project is presented. In the master thesis report from this project all details regarding the membrane filtration trials are given. The full version of the master thesis report can be found in Appendix 2.

2.1 Sampling positions for membrane filtration tests

Water samples for membrane filtration tests were taken in four positions:

• After raw water sand filters • After spray water tank in PM 3 system, before scrubber • After flotation in PM 4 system • At the outlet of the waste water treatment (two different sampling days)

2.2 Membrane filtration tests In this study a laboratory scale filtration unit from Alfa Laval called M20 was used. It is a suitable filtration unit for screening and very easy to operate. In the unit several membranes can be tested simultaneously in order to determine which membrane is the most suitable.

The pores in the membrane allow penetration of smaller particles and water from one side of the membrane to the other side, whereas most particles are retained. The clean water produced is called permeate and is characterized by a drastically lower concentration of contaminants in comparison to the reject stream (retentate)

Figure 5. Principle for mebrane filtration. (figure from R. Singh, 2015)

The main focus in the project was to test ultrafiltration and reverse osmosis membranes. The ultrafiltration membranes reject large dissolved organic molecules but will not reject ions and inorganic molecules. Reverse osmosis membranes reject much smaller molecules but has higher operating pressure making them costlier to operate.

The flow through the membrane, called the flux, is determined as filtrated amount of permeate per m2 of filtration area and hour. This is an important design parameter to estimate the size of a membrane installation. Another important parameter is the level of fouling in the membrane. The level of fouling is measured by testing the flux of pure

11

water before and after a test run. If components in the treated water clog the membranes during filtration and the clogging components can not be removed with a cleaning step the application of membranes is not feasible. Different cleaning agents can be used for regeneration of the membranes but there are limitations of the properties of the cleaning solution (pH, temperature, concentration) depending on what type of membrane is used. When testing the osmosis membrane before the actual trials, the flux recovery was low and it was discovered that even after filtrating a dilute saline solution (2000 ppm NaCl) only 60% flux recovery was measured. The saline solution is specified in the membrane filtration data sheet for testing the membrane performance. It is possible that the osmosis membrane requires more conditioning before use-

2.2.1 After spray water tank in PM3 system before the scrubber

A water sample was taken from the PM3 system on the 21 of March for membrane testing. The sample was taken before the scrubber, and the purpose to try membrane filtration was problems with clogging in the scrubber equipment which is therefore not always in operation. The sampling position is shown in Figure 4. If this water stream was treated further it could have enabled a decrease in fresh water usage, even though the volume of potentially saved water probably would be small. In October 2018, however, it was decided to take the scrubber out of service. Therefore, this alternative will not be further evaluated.

Figure 4. Sampling point, PM3 system - spray water before scrubber

The purpose of the scrubber was to heat water in the spray water tank, and in that way save energy. The function was as follows:

The produced paper, from PM3, is dried with steam in a dryer hood. The hot air, with a temperature around 110 ⁰C, from the dryer hood was led to the roof to the scrubber. Water from the spray water tank was led to the roof and sprayed on the hot air from the dryer hood. The water was then, after passing the scrubber, led to a flat filter, and then to the scrubber again, and was thus circulating.

Both ultrafiltration (UFX 10) and reverse osmosis membranes (RO 90+RO 98) were evaluated for this process stream.

12

Table 2 Membrane test on spray water to scrubber, PM3 Water system

Membrane used UFX10 RO90 RO98

Flux recovery* % 89 65 60

Permeate flux 120 min l/m2,h 90 70 70

COD reduction % 38 74 70

COD in permeate mg/l 348 132 153

*Flux recovery of a dilute saline solution (used for membrane specification datasheet) was 60% for the RO90 membrane

The COD levels in the permeate are rather high and the permeate stream should not be suitable for the purpose to replace the water in positions where sand filtered water (raw water intake) is used. The raw water has a reported COD levels of around 40 mg/l.

A cleaner spray water could theoretically reduce the needed fresh water supply to the flat filter and to the spray water tank, but these fresh water flows are already low, so there is not an important water saving measure. On the other hand, clogging problems in spray water nozzles and other runnability problems might be reduced by employing membranes in this position. If the membranes remove the compounds that caused problems with the scrubber substantial energy savings could be gained by being able to operate the scrubber again.

2.2.2 After flotation in PM4 water system A water sample was taken from the PM4 water system on the 21st of March for membrane testing. See sampling position in Figure 5.

Figure 5 Sampling point, PM4 system, after flotation

Fibre containing white water from the wet end of PM 4 is led to White water tank 2. All water from a spray water tank ahead of this tank is also led to White water tank 2. A third flow to the white water tank 2 is outlet water from vacuum pump 1 after separation and sound silence equipment. One stream from White water tank 2 is pumped to Buffer tank 1. One stream is pumped to lubrication spray equipment to moister the machine felt and

13

for concentration regulation. Overflow from the white water tank is led to a sewer and to effluent treatment. One stream is pumped to a flotation unit. Separated fibres is used in a mixing tank. Water from the flotation process is led back to the spray water tank ahead of the white water tank 2.

One purpose to try membrane filtration in this position was to minimize the needed fresh water addition to the spray water basin ahead of the white water tank 2. This fresh water flow is very low, so the water saving potential in this position is fairly low. Further treatment after the flotation unit will, however, give a clearer white water which might improve the paper quality and possibly reduce the fresh water consumption.

On the PM4 process stream two membrane types were tested: one ultrafiltration membrane (UFX 10) and one reverse osmosis membrane. The results are shown in table 9 below.

Table 3 Membrane test on spray water to scrubber, PM4 Water system

Membrane used UFX10 RO90

Flux recovery * % 88 60

Permeate flux 120 min l/m2,h 85 70

COD reduction % 30 73

COD after membrane filtration1)

mg/l 455 160

*Flux recovery of a dilute saline solution (used for membrane specification datasheet) was 60% for the RO90 membrane

As for the PM3 process water the COD levels remain too high to replace the raw water intake. However, the decreased COD concentration could still possibly improve paper quality and runnability in PM4.

2.2.3 After effluent treatment Water samples were collected after the effluent treatment for membrane testing on the 25th of January and the 14th of February. The sampling position can be seen in Figure 8.

The purpose of this sampling position was to investigate possibilities to return the water to the raw water intake and thus close the system and use less water from the Kisa river. Depending on the reached water quality from the membrane filtration, the water could also be returned to other positions in the process.

14

Figure 6 Sampling point after the effluent treatment

Water from this position was tested in two steps. Several different membranes were tested on this process stream; both microfiltration (MF), ultrafiltration (UF) and reverse osmosis (RO) membranes. The membranes were also tested using cascade filtration where first a coarser membrane was used as a pre-filtration step when producing pure water in the reverse osmosis filtration. The microfiltration membrane was FS40PP, the ultrafiltration membrane was a UFX10 membrane and the reverse osmosis membranes were RO90, RO 98 and RO 99.

The different combinations of pre-treatment and RO are listed below. The reduction rates presented in Table 4 are for combined process water treatment including the pre-treatment.

Table 4 Membrane test on effluent sampled after the effluent treatment. Several different pre-treatments were tested. MF= microfiltration, UF = ultrafiltration, Screen = filtration through a 70µm mesh, centrifuge = centrifugation at 5000g.

Experiment 1 2 3 4 5 6 7

Pre-treatment MF MF Screen + UF

Screen + UF

Centrifuge Centrifuge Chemical

Membrane used RO90 RO98 RO90 RO98 RO90 RO98 RO90

Flux recovery* % 74 54 65 47 72 73 72

Permeate flux 120 min l/m2,h 58 75 75 90 75 110 63

COD reduction % 75 50 60 54 74 45 75

COD after membrane filtration

mg/l 60 120 69 80 42 80 40

*Flux recovery of a dilute saline solution (used for membrane specification datasheet) was 60% for the RO90 membrane

For some treatment combinations the COD levels in the RO permeate are relatively close to the normal levels of the raw water intake at Sofidel. It could be possible to recirculate the membrane filtrated water to replace the fresh water intake. A more detailed analysis of the composition of the water is required, including metal ion determination, in order to know if this is possible.

A possible way to improve the water quality of the effluent might be to optimize the biological and chemical effluent treatment process. This might also be needed in the future to meet new EU BAT discharge levels.

15

2.3 Economic calculations – installation of

membrane unit The main components of the cost of membrane treatment are capital cost, membrane replacement, energy usage, labour, cleaning, and maintenance. The capital cost is the sum of membrane units cost and the non-membrane units. The non-membrane cost includes all mechanical and electrical items, control equipment, piping and associated civil engineering costs. The non-membrane costs are not covered in the following calculation.

The economic calculations will include the fixed capital cost (FCI) and total capital investment (TCI) for the membrane filtration of the incoming wastewater. To determine the FCI and TCI, the purchase cost for all equipment needs to be calculated. All other costs that add to the needed investment are estimated by standard factors on the purchase cost.

The cost for membrane investment and operating energy required are based on inquiries from AlfaLaval Nakskov A/S in Denmark.

To determine the cost of the membrane, the most important defining factor is the surface area required. Based on all the fulfilled experiments an average flux was considered for both UF and RO membranes as 138 and 92 L/m2.h respectively. As previously mentioned, the aim of the project was to reduce freshwater consumption by 100 m3. The surface area required for the filtration can then be calculated as:

𝑈𝑈𝑈𝑈 ∶ 100 𝑚𝑚3

𝑑𝑑𝑑𝑑𝑑𝑑∗

1 𝑑𝑑𝑑𝑑𝑑𝑑24 ℎ

∗𝑚𝑚2.ℎ138 𝐿𝐿

∗1000 𝐿𝐿

1 𝑚𝑚3 = 30 𝑚𝑚2

𝑅𝑅𝑅𝑅: 100 𝑚𝑚3

𝑑𝑑𝑑𝑑𝑑𝑑∗

1 𝑑𝑑𝑑𝑑𝑑𝑑24 ℎ

∗𝑚𝑚2.ℎ92 𝐿𝐿

∗1000 𝐿𝐿

1 𝑚𝑚3 = 45 𝑚𝑚2

Due to the technical uncertainties and the fact that the feed will not fully pass the membrane, 30% is added to the required surface area, making it 40 and 60 m2 for ultrafiltration and reverse osmosis respectively.

Based on contact with AlfaLaval, prices and energy consumptions for 8.0” spiral wound plug flow plants were estimated, which are summarized in Table 5. It should be noted that the cost refers to DAP (Delivery at point) at AlfaLaval Nakskov and does not include shipping and freight costs.

16

Table 5- Cost estimations for membranes.

Membrane Type Surface Area

(m2)

Price

(kEur)

Energy Consumption

(kW/m3 permeate)

Ultrafiltration 40 195 1-4

Reverse Osmosis 60 500 8-12

3 Further studies In order to further evaluate the possibilities to use membrane filtration and reduce fresh water consumption at the mill pilot plant scale tests are recommended.

Based on this study the most promising position for testing is after the effluent treatment plant. Some pre-treatment will be needed ahead of the membranes. For evaluation of the test results a more detailed chemical characterisation as compared with this study, for inlet and outlet water to the test unit and also on inlet water to the mill would be valuable.

17

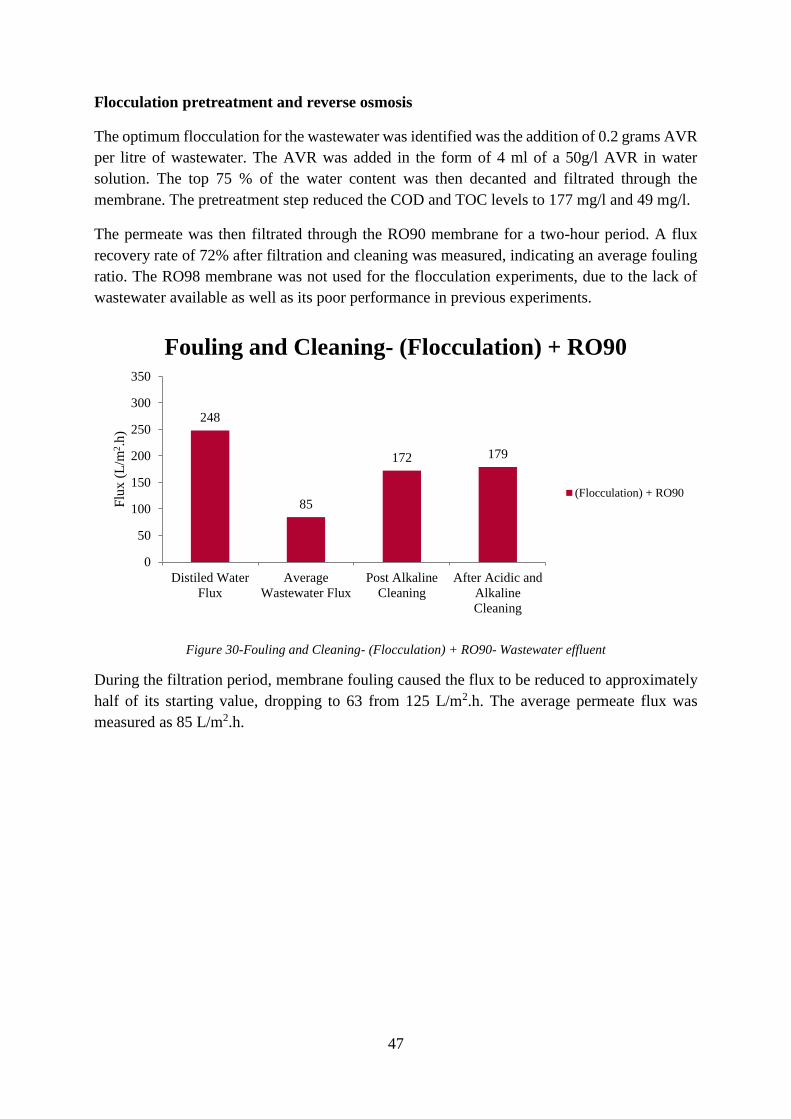
4 Conclusion The aim of this study was to discuss the technical feasibility when using membranes to reduce the water consumption within a tissue mill in Kisa. The main focus of the experiment was on filtering and recirculating the wastewater effluent to replace part of the freshwater intake. Additional experiments were also performed on process waters in the tissue production process.

The experiments showed that a pre-treatment step coupled with reverse osmosis could be used for the tertiary water circuit, i.e. the water from the effluent treatment. The high water flux and shear rates require a membrane module that can embody high surface areas; therefore a spiral wound module should be utilized. Spiral wound modules are more prone to fouling, though, which means the pre-treatment technique has to work efficiently in reducing contaminants which may cause fouling.

Several different pre-treatment steps and different reverse osmosis membranes were tested in lab-scale. It was concluded that centrifugation, flocculation, and membrane filtration are all feasible pre-treatment techniques; each with their own merits and faults. Flocculation can be assumed as the most appropriate method, given the better performance.

The RO90 membrane proved far more efficient than other membranes, both in terms of separation and flux recovery, but experienced a lower average flux. This can be attributed to the polyester support on TFC, and its corresponding properties such as low wettability. UFX10 and RO98 did not provide sufficient separation and RO98 also exhibited high fouling levels. The cleaning procedure was typically comprised of both alkaline and acidic cleaning. The flux recoveries were used to compare the fouling levels. The alkaline cleaning step was far more effective, indicating the wastewater contaminants are biological in nature.

The experiments also showed that ultrafiltration and reverse osmosis can be used as kidneys for the paper machine, depending on what water quality is needed for a specific application.

A cost estimation was made for the membrane equipment required to produce 100m3 of purified water. The cost is reasonable for the installation of membranes, but it has to be stressed that no cost was taken into account for the pre-treatment of the water before the membrane filtration purification and no installation cost for the process integration at the mill was made.

18

5 References Dow, 2018. What is the relation between Permanganate Value, Chemical Oxygen Demand and Dissolved Organic Carbon? Retrieved from: https://dowac.custhelp.com/app/answers/detail/a_id/4219 2018-10-25

Würtzell, Paul, 2001. Kartering av inkommande vatten till Korsnäsverken. Examensarbete, Kemiingenjörsutbildningen, KTH.

R. Singh, "Chapter 2 - Water and Membrane Treatment," in Membrane Technology and Engineering for Water Purification (Second Edition), R. Singh, Ed. Oxford: Butterworth-Heinemann, 2015, pp. 81-178.

19

APPENDIX 1

Process flow diagram Sofidel

20

APPENDIX 2.

Master thesis - Ehsan Moslehi

INOM EXAMENSARBETE KEMITEKNIK,AVANCERAD NIVÅ, 30 HP

, STOCKHOLM SVERIGE 2018

Integrating membrane filtration for water reuse in tissue mill

Examiner: Mikael Lindström Supervisors: Anders Uhlin, Sverker Danielsson RISE Bioeconomy

EHSAN MOSLEHI

KTHSKOLAN FÖR KEMI, BIOTEKNOLOGI OCH HÄLSA

i

Abstract

Water is an essential and indispensable component is the pulp- and paper production industry.

The increase in energy costs, stricter environmental regulations and water resource shortages

have caused a reduction of the water footprint in the industry as well as an increase in water

recycling and water circuit closure. Reducing water usage requires an understanding of where

contaminants originate, as well as which streams are critical to the process and how they impact

mill operation. The recirculation of water can cause contaminant accumulation; therefore mills

employ technologies for water treatment in the internal water cycles, the so-called ‘kidneys’.

Application of membrane technology is one such option which can improve the recycled water

quality and reduce contaminant buildup.

The present study was carried out on a lab-scale for the treatment of a tissue mill effluent using

membrane separation. A combination of pretreatment methods and various membranes were

compared with regards to separation, flux and fouling. The AlfaLaval M20 device was to treat

wastewater samples sent from the mill, where the permeate was recirculated to the feed tank.

COD and TOC levels are compared with regards to determining the separation efficiency. The

permeate flux was measured over the two-hour filtration period, as well as flux recovery to

determine fouling levels. Additionally, some economic aspects of the process are discussed.

This study suggests the potential application of a combination of flocculation or centrifugation

pretreatment, with reverse osmosis membranes for recycling water to replace freshwater intake.

The results also indicate the possibility of using ultrafiltration as kidneys to decrease

contamination buildup for further water loop closure.

Keywords: Membrane separation; Paper industry; Paper mill effluent; Water reuse ;

Reverse Osmosis

ii

Acknowledgments

This project has been performed at RISE Bioeconomy as the Master’s thesis for the Chemical

Engineering for Energy and Environment program at the KTH Royal Institute of Technology.

The project was a collaboration between ÅF and the Sofidel AB tissue plant in Kisa.

I would first like to thank my thesis advisor Anders Uhlin at RISE. The door of Anders’s office

was always open whenever I ran into trouble or had a question about my research and writing.

He consistently allowed this project to be my own work, but steered me in the right the direction

whenever he thought I needed it. I have been extremely lucky to have a supervisor who cared

so much about my work, and who responded to my questions and queries so promptly.

I would also like to thank Sverker Danielsson at RISE for giving me the opportunity to perform

my thesis here at RISE Bioeconomy, as well as for his professional guidance and support during

this project.

I wish to acknowledge the help provided by Åsa Sivard at ÅF for sharing her years of

experience with me, as well as providing me with her practical and valuable input.

I would also like to thank my examiner, Mikael Lindström at KTH for his valuable and

constructive suggestions during the planning and development of this research work.

Completing this work would have been all the more difficult were it not for the support and

friendship of those who provided a much-needed form of escape from my studies, they also

deserve thanks for helping me keep things in perspective. So, Shayan, Alex, Dhinesh, Aida and

Björk, Skål and Thank you!

Finally, To my parents and my sister, Thank you for providing me with unfailing support and

continuous encouragement throughout my years of study. This dissertation stands as a testament

to your unconditional love and encouragement.

Ehsan Moslehi

iii

Table of Contents

Introduction .................................................................................................................... 1

Aim and Goals ................................................................................................................. 2

Theory .............................................................................................................................. 3

Membranes ................................................................................................................... 3

Membrane Materials ..................................................................................................... 6

Membrane Modules ...................................................................................................... 8

Fouling .......................................................................................................................... 9

Membrane Cleaning.................................................................................................... 10

Pretreatments for Membrane Treatment ..................................................................... 10

Literature review .......................................................................................................... 11

Water in pulp and paper industry................................................................................ 11

Paper Production ......................................................................................................... 12

Water used in pulp and paper production ................................................................... 13

Water recirculation ..................................................................................................... 15

Pulp and Paper Wastewater Treatment ....................................................................... 17

Membrane technology implementation on water circuits .......................................... 19

Industrial case studies ................................................................................................. 22

Methodology .................................................................................................................. 24

Device ......................................................................................................................... 24

Membrane Assembly .................................................................................................. 26

Membranes ................................................................................................................. 27

Water Samples ............................................................................................................ 29

Experimental Procedure .............................................................................................. 30

Pre-cleaning ................................................................................................................. 30

Filtration ...................................................................................................................... 30

Post Cleaning .............................................................................................................. 31

Cleaning efficiency ..................................................................................................... 31

iv

Chemical Analysis……… ……………………………………………………………...32

COD measurement ....................................................................................................... 32

TOC measurement ....................................................................................................... 32

Conductivity ................................................................................................................ 33

Turbidity ...................................................................................................................... 33

Results………………………………………………………………………... ............ 35

Wastewater ................................................................................................................. 35

UF Experiments .......................................................................................................... 36

Pretreatment Methods ................................................................................................. 39

Microfiltration pretreatment and reverse osmosis ...................................................... 39

Screen and ultrafiltration pretreatment and reverse osmosis ...................................... 43

Centrifugation pretreatment and reverse osmosis....................................................... 45

Flocculation pretreatment and reverse osmosis .......................................................... 47

Spraywater PM-3 ........................................................................................................ 49

Process water PM-4 .................................................................................................... 51

Discussion ...................................................................................................................... 53

Membrane Comparison .............................................................................................. 53

Pretreatment Method Comparison .............................................................................. 54

Economic Calculations ................................................................................................. 55

References ...................................................................................................................... 60

Appendix .................................................................................................................... A-F

1

Introduction

Water is a critical component in the pulp and paper production due to its role in transporting

raw materials and removing contaminants, as well as providing the necessary environment for

the formation of the hydrogen-bonding network between fibres and fillers, which is the essence

of the paper production mechanism [1]. Water scarcity and stricter environmental regulations,

as well as economic reasons, have led to the need for decreasing the water consumption in

paper mills as well as limiting the wastewater discharge to the environment.

Paper production typically requires an immense amount of freshwater intake, due to the high

quality of water required for some applications, in addition to the high evaporation levels within

the process. However, varying qualities of water are needed based on their application, meaning

water with relatively low purity can be used in less demanding applications. This has led to a

high amount of water recirculation within the mill. This can be extremely problematic as it can

lead to the accumulation of contaminants; which may decrease the quality of the finished

product. Therefore, additional treatment technologies may be required to enhance the process

water quality. Biological treatments, as well as physicochemical treatment techniques such as

sedimentation, coagulation and precipitation, chemical oxidation and membrane filtration, are

commonly applied for this purpose.

Membrane technology plays a vital role in water and energy sustainability and is applied in

several industries today. Examples include brackish and seawater desalination via reverse

osmosis, water, and wastewater treatment via membrane bioreactors (MBR) as well as

membrane-based fuel cells and lithium-ion batteries. Membrane technology is considered a

sustainable solution due to lower environmental impacts, fewer space requirements, ease of

operation, flexibility and adaptability. However, the process is still deemed expensive. In recent

years, advancements in membrane material selection have led to more opportunities for

membrane technologies to be utilized water and energy sustainability [2].

Membrane filtration can be utilized at various points within the pulp and paper water treatment

systems to decrease contamination levels. The most widely applied technologies include nano-

filtration, reverse osmosis or membrane bioreactors. However, the limitation connected with

the application of the membrane technologies is the flux decline due to the membrane fouling,

which also decreases the membrane lifespan. Another disadvantage is the very high cost of this

treatment caused by the high energy input required [3].

2

Aim and Goals

The purpose of the project is to evaluate the possibilities for using membrane technology to

reduce freshwater intake in a tissue use in the Sofidel mill in Kisa. The Kisa River has been

experiencing drought and a lack of year-round water supply, which has caused many problems

for the Sofidel AB tissue mill.

The work includes an evaluation of possible installation points as well as laboratory scale

membrane filtration of the more interesting streams. The goal has been defined to reduce

freshwater intake by 10%, which is equivalent to approximately 100 m3 per day. Preliminary

studies from the mill have found the incoming freshwater has a COD of approximately 30 mg/l.

3

Theory

Membranes

Membranes are defined as perm-selective barriers between two homogeneous phases, where

the semi-permeable barrier selectively passes desired components and prevents the passage of

contaminants. The separation occurs due to the differences in chemical properties, namely size

and shape of the substances. Membrane separation is a continuous steady-state operation and is

composed of three main streams: feed, product (permeate) and reject (retentate) [3].

Membranes are typically produced from polymer or inorganic materials which embody

numerous microscopic pores. The small pores in the membrane allow penetration of smaller

particles and water from one side of a membrane to the other side, whereas most particles are

retained. The clean water produced is then called permeate, which is characterized by a

drastically lower concentration of contaminants in comparison to the reject stream (retentate)

[4].

Figure 1- Schematic of a basic membrane process [3]

The efficiency of the separation process depends on the membrane’s selectivity and flux;

mechanical, chemical and thermal stability of membrane materials, fouling during operation,

and the operating conditions [3]. The membrane’s performance is a trade-off between

membrane selectivity and membrane productivity. Membrane selectivity, (α =A/B), is defined

as the ratio of permeability of components through the membrane, where A is the water

permeability coefficient and B is the solute permeability coefficient [3].

An important advantage of membrane separation is that selectivity can be modified based on

the application of the purified water. Membrane processes used today for wastewater recycling

can be classified into pressure-driven processes and electrically-driven processes. Pressure-

driven processes include microfiltration (MF), ultrafiltration (UF), nanofiltration (NF) and

reverse osmosis (RO). Electrically-driven processes include electrodialysis and electro

deionization.

4

MF and UF are commonly applied to remove suspended or colloidal particles via sieving

mechanisms based on the size of the membrane pores [3]. NF and RO membrane processes are

mostly used in applications which require the removal of dissolved contaminants, as in the case

of softening or desalination [3]. Basic characteristics of these processes are summarized in

Table 1.

Table 1- Classification of typical membrane separation processes for water purification [3]

Process Nominal pore size Driving force

Average

Permeability

(L/m2.h bar)

Micro-filtration 0.05-10 µm 1-3 bar 500

Ultra-filtration 0.001-0.05 µm 2-5 bar 150

Nano-filtration <2.0 nm 5-15 bar <20

Reverse Osmosis ~ 0.5 nm 15-75 bar <5

Micro-filtration (MF) refers to membranes with pore sizes ranging from 0.05-10 µm and is the

membrane with the largest pores. The molecular weight cut-off (MWCO) is greater than

1000,000 Daltons and the feed water operating pressure is approximately 1-3 bars. The major

separation mechanism in MF is physical sieving. MF is applied to filter suspended particles,

large colloids, bacteria, and organics. The separation can also be used as a pretreatment step for

NF and RO processes to reduce fouling potential. MF is also commonly applied to reduce

chemical addition in wastewater treatment steps, such as chlorination [5, 6].

UF removes all microbiological species removed by MF, as well as humic materials such as

lignin and xylan. Ultrafiltration has a pore size of approximately 0.001 to 0.05 microns, an

MWCO of approximately 10,000 to 100,000 Daltons and operates at a pressure of

approximately 2-5 bars [1, 3].

Nano-filtration membranes have a nominal pore size of less than 2 nm and an MWCO of 1,000

to 100,000 Daltons. The smaller pore sizes lead to higher operating pressures, ranging from 5-

15 bars, and thus require higher energy input [6]. Applying nano-filtration (NF) allows for the

removal of metal ions such as barium, iron, and manganese, which lead to a high consumption

of bleaching chemicals. NF is also an efficient means for removing sulphate ions [1, 3]. NF

membranes remove alkalinity and hardness as well, therefore the permeate stream may be

corrosive [6]. Sodium chloride rejection when applying NF varies from 0-50 % depending on

the feed concentration. NF is desirable for applications where moderate salt removal is

acceptable, with the advantage of lower power consumption and costs [7].

Reverse osmosis utilizes membranes with a nominal pore size of less than 0.5 nm, which

effectively removes nearly all inorganic contaminants and most dissolved non-ions from the

water. The units operate at pressures as high as 75 bars. Reverse osmosis is used for desalination

to produce fresh water from seawater and brackish water [8].

5

‘Figure 2 summarizes the extent of particle removal of the aforementioned pressure-driven

membranes.

Figure 2- Separated particles in for pressure-driven membrane processes [1]

6

Membrane Materials

Membranes can be composed of a large number of materials, based on processing requirements,

thermal and chemical stability and fouling tendency. Membrane surface chemistry and other

properties such as roughness, charge, and hydrophilicity effect performance and fouling.

Interfacial tension and adsorption rates are also crucial parameters since the solid membrane

phase is in contact with a fluid phase. Synthetic organic polymers are the most widely used

material for membranes [3].

Membrane fouling, insufficient separation, low lifetimes and resistance to certain chemicals are

the most well-known problems related to polymeric membranes [9]. Fouling is the most major

issue in membrane configurations as it can adversely affect efficiency, permeability and

membrane lifetime. A solution to this problem is to make membranes more hydrophilic. This

can be achieved by

1- Modification of polymers before fabrication to enhance hydrophilicity

2- Blending with hydrophilic agents

3- Coating of hydrophilic polymers on the membrane surface

These resolutions will decrease fouling but may have negative effects such as narrowing or

even blocking of the pores and even reduced lifespans due to additional coating layers [2].

Polymer and ceramic compounds are both be applied to fabricate MF and UF membranes.

Ceramics provide higher chemical stability and mechanical strength, ease of cleaning as well

as longer and reliable lifespans. However, higher prices, lower mechanical strength, and

difficulties for large-scale production have prevented widespread application of ceramic

membranes; Therefore, polymeric membranes dominate the market[8]. Common commercial

polymers used for MF and UF membranes are poly-ether sulfone (PES), polyvinylidene

fluoride (PVDF), polyethylene (PE), polypropylene (PP) and polytetrafluoroethylene (PTFE)

[2].

Polymeric membranes are commercially used for reverse osmosis desalination, due to low-cost

production, ease of handling, and high performance in terms of selectivity and permeability[8].

Thin Film Composite (TFC) membranes now dominate the RO/NF market. They are stable over

a greater pH range as well as operating with higher intrinsic water permeability due to their

extremely thin (~100 nm) PA-selective layers[2].

Thin film composite polyamide membranes

Dense membranes provide higher selectivity but lower flux, whereas porous membranes have

low selectivity but a higher flux. Increasing the flux in a dense membrane can be achieved by

reducing the thickness to the extent where it is still defect-free and possesses adequate

mechanical strength. This can be achieved by the implementation of Thin Film Composites

(TFCs)[9]. These membranes consist of a selective thin skin layer which is supported by a

porous substrate. The active outer layer is deposited as a thin film on a porous layer and consists

of a cross-linked polyamide layer. The layer is extremely thin (0.1 mm or less) which leads to

higher membrane permeability and selectivity, also due to the high cross-linking of polymers

7

[10]. These membranes have high temperature and pH resistance but are not able to tolerate

oxidizing environments [7].

Polysulfone

Polysulfone membranes have been widely used for UF and MF operations due to their enhanced

temperature and pH resistance. These membranes are commonly used in food and dairy

applications [7].

Figure 3-Polysulfone repeating unit [11]

Polypropylene

Polypropylene is also used in particular for support layers in membranes for waterproofing the

top layer. Polypropylene is a good candidate for industrial applications such due to its

outstanding properties such as high melting temperature, chemical resistance and good

mechanical properties [7].

Figure 4- Polypropylene repeating unit [11]

Fluoropolymer

A fluoropolymer is a fluorocarbon-based polymer with multiple carbon-fluorine bonds. The

polymers are best characterized with their high resistance to solvents, acids, and bases, owing

their stability to the multiple carbon-fluorine bonds within the chemical composition. The high

electronegativity difference between carbon and fluorine (4.0 for F vs. 2.5 for carbon) makes

the bond significant polar [7].

Figure 5- Fluoropolymer repeating unit [11]

8

Membrane Modules

The membranes are installed in a proper device, referred to as modules. The core objective of

a module is to provide maximum membrane surface area in a relatively smaller volume, as to

facilitate the highest feasible permeate flux [12]. Membrane modules must also meet

requirements regarding production cost, packing density, energy consumption and fouling

control. Membrane surface areas typically range from hundreds to thousands of square meters

to meet the flux and separation requirements set by the industry. Efficient economic modules

with high surface areas are designed based on the membrane application [13].

Spiral wound

Spiral-wound membrane modules were originally developed for industrial reverse osmosis

applications, namely water desalination. The design consists of a feed flow channel spacer, the

membrane and a porous membrane support, which forms an envelope, which is wound around

a perforated central collection tube and inserted into an outer tubular pressure shell [12] [13].

The feed flows axially down the module across the membrane envelope. The permeate spirals

toward the centre and exits through the collection tube. The module operates in cross-current

flow[12]. Small spiral wound modules include only one envelope, which limits the total

membrane surface area to about 1-2 m2. Higher surface areas would result in pressure drop in

the permeate channel. Industrial spiral wound modules are 1 meters long and have a diameter

of 10-60 cm, providing 3-60 m2 of surface area [13]. The spiral-wound module provides a high

surface area per unit volume, which means the module is cost-effective. However, the module

is prone to fouling and feed channels may be easily clogged. A pretreatment step to remove

particles and fibres must be implemented for longer lifetimes and better separation.

Due to the demanding setting in the pulp and paper industry, specific module configurations

with high shear forces are utilized to prevent flux decline. The high shear results in higher levels

of fouling and lower membrane lifespan. Spiral wound modules, coupled with physical and

chemical pretreatment, have also been used in the paper industry [1].

Figure 6- Spiral Membrane Configuration [13]

9

Fouling

Fouling is defined as the deposition and accumulation of rejected contaminants from the feed

stream on the membrane surface, which inevitably leads to water flux reduction. Fouling can

also be viewed as the reduction of the active membrane surface area, which then leads to a

reduction in flux to below the membrane capacity before operation [14, 15].

In MF and UF processes, fouling can be high enough to reduce the process flux to less than 5%

of the original water flux. Several parameters affect the fouling rate such as the concentration

and composition of the water and its foulants, membrane type, module and material, pore-size

distribution, surface characteristics [14].

Figure 7- Fouling mechanisms (a) Pore Narrowing, (b) Pore Plugging, and (c) gel/cake formation [15]

Foulants have been categorized into four groups: organic precipitates (macromolecules,

biological substances, etc.); colloids; inorganic precipitates (metal hydroxides, calcium salts,

etc.) and particulates [14]. Organic fouling occurs when the feed wastewater contains natural

organic matter, which causes a gel/cake formation on the membrane surface.[15]

Particles present in the feed cause blockage of the module channels and form a cake layer on

the membrane surface. Colloidal particles can create fouling layers and macromolecules cause

gel or cake formation on the membrane. Biological fouling can also cause bacteria growth on

the membrane surface and excretion of the extracellular polymers. Chemical reactions may also

take place on the membrane surface which leads to scaling, concentration increase and pH

changes, which lead to precipitation of salts and hydroxides. The major ions that lead to scaling

are calcium, magnesium, barium, bicarbonate, and sulphate. [14].

Fouling types and causes vary from location to location and so does the energy and maintenance

costs. This means that process optimization for plants should be performed on a plant by plant

basis. The only constant is that membrane fouling is the most common reason for process and

operation problems, such as reduced flux and salt rejection and increased trans-membrane

pressure .Membrane fouling is still the principal limitation of membrane performance. In

addition to process optimization, techniques such as pretreatment, chemical cleaning, hydraulic

cleaning have been used to reduce or prevent fouling [15].

10

Membrane Cleaning

The purpose of membrane cleaning is to restore the flux which has decreased due to fouling.

The four possible membrane cleaning procedures are chemical, electrical, mechanical and

hydraulic cleaning. The main focus of this thesis is chemical cleaning.

Chemical cleaning involves the mass transfer of chemicals to the fouling layer and the reaction

products back to the bulk liquid phase, which removes the fouling layer into the solution.

Chemical cleaning is conducted in conjunction with maintenance washes while the membrane

is online. Clean-in-place (CIP) washes are conducted by adding the chemicals to the feed tank

while the membrane is offline.

The cleaning agent should be able to dissolve the foulants, avoid and prevent new fouling as

well as not cause any damage to the membrane. The cleaning agent must also be chemically

stable during cleaning and easy to rinse away after the cleaning procedure. Safety concerns and

costs are also important factors when choosing cleaning agents [16].

There are a variety of different chemicals that may be used for membrane cleaning, and each is

targeted to remove a specific form of fouling. Selection of the appropriate cleaning agent is

highly dependent on the fouling composition. Inorganic foulants are typically removed by

acidic cleaning agents, while organic foulants are removed by surfactants, alkaline cleaning

agents, and oxidizing cleaning agents. Chemical cleaning may also use a strong chlorine

solution to control biofouling. There are a number of formulated cleaning agents available, such

as Ultrasil 10, a mixture of alkalis, phosphates, sequestering agents and wetting agents, which

are used in this projects experiment section. Sodium hydroxide can also be used for cleaning of

membranes with organic and microbial fouling. The effectiveness of sodium hydroxide as a

cleaning agent can be increased by adding sodium hypochlorite, which enlarges the pores of

the membrane [17]. Due to the various kinds of foulants present in wastewaters, a combination

of different chemicals is added in series to address the multiple types of fouling. Chemical

cleaning options are limited for membranes which cannot tolerate oxidants or extreme pH levels

[18].

Pretreatments for Membrane Treatment

In cases of industrial water reuse, generally, reverse osmosis (RO) processes are utilized to

remove the dissolved ions. The most important goal in RO process design is to minimize

membrane fouling, as RO membranes are very sensitive to foulants. As well as selecting a

suitable low-fouling membrane, designing a state of the art pretreatment plant considerably

reduces fouling [19].

The selection and design of the pretreatment process depend heavily on the feed water

characteristics. Different water compositions require different types and extents of pretreatment

as to ensure higher membrane efficiency and lifetime[20]. Reverse osmosis membranes are

quite sensitive to fouling which typically necessitates an extensive pretreatment process, which

may include coagulation, sedimentation, flotation or low-pressure membrane systems such as

microfiltration and ultrafiltration[19].

11

Literature review

Water in pulp and paper industry

Water is a vital component in the pulp and paper industry as it is utilized to transport raw

materials, wash and clean process equipment, remove contaminants, and generate the necessary

environment for the formation of the hydrogen-bonding network between fibres and fillers,

which is the paper formation mechanism [1]. Water is also used in the wire and press sections,

pumps as well as cooling and heating purposes [21]. In theory, paper production may require

several hundred cubic meters of water per kg of water produced. This number is much lower in

practice due to the recirculation and reuse of water [22]. Modern paper machines consume

between 5 to 100 m3 of water for producing each ton of paper, depending on characteristics of

the substrate, type of produced paper and the extent of water reuse [23]. High volumes of water

are lost in the evaporation step during production, between 0.5 and 2 m3/ton, which results in

an immense freshwater demand [23].

Water consumption is higher in tissue production compared to many other grades like newsprint

or fine paper and typically ranges from 8 to 100 m3/ton [24]. Tissue products have higher

standards regarding brightness, texture, and odour, which lead to a higher intake of freshwater.

Recycled water can still be used to replace freshwater and be applied for specific purposes, such

as dilution waters in pulping and stock preparation, and shower and washing waters in the

machine area [23].

As water is a finite environmental resource, conservation and sustainable water resource

management are of utmost importance. The current trend in the papermaking industry is toward

closed-loop water circuits and reducing the discharge of liquid effluents into the environment.

Regulations have been implemented to control the extent of suspended solids, oxygen-

consuming wastes, and chemicals toxins released into marine life [15,24]. Harder regulations

concerning the acceptable amounts of wastewater and the toxicity of pulp and paper mill

effluents have also been imposed in recent years [23]. Water scarcity and extreme weather

conditions are other major driving forces for reducing the water footprint, as the decline of

water resources is becoming a growing concern in different parts of the world. Economic

reasons may also play a role and encourage mills to invest in technologies which reduce water

consumption [1]. A high level of water consumption will result in more energy consumption

and will also generate more wastewater, requiring more expensive treatment plants [23].

The aforementioned trends have led to a reduction in the freshwater use of in the paper industry

and an increase in water reuse recycling. The industry has reduced the water footprint by almost

tenfold in the past decades[24]. According to an analysis from Frost & Sullivan, the global

market for water and wastewater treatment within the pulp and paper industry will grow from

$983.9 million in 2012 to $1.569 billion in 2020 [23]. Several solutions, such as process

modification and integration, water recirculation and water recycling have been implemented

to decrease freshwater use in the mills [24].

12

Paper Production

The paper production process follows four prominent process steps. These process steps include

pulp production, stock preparation, paper machine, and coating and finishing.

Primary fibres, obtained from wood and annual plants, and secondary fibres, produced from

recovered paper are introduced to the pulping process, which may be mechanical or chemical

pulping or a combination of the two. Mechanically produced pulps are essentially wood where

the bark has been removed. Chemical pulps are composed primarily of cellulose and the less

desirable constituents of the wood have been removed by the chemical treatment processes.

Mechanical pulping is the de-fiberisation of timber via mechanical equipment such as grinding

stones or rotating disks. The wood and fiber are pretreated with water during the screening

operation. Water is also lost in the process in rejects as well as through evaporation. Chemical

pulping is commonly performed via the Kraft process due to higher pulp strengths in the product

as well as higher chemical recoveries and reduced water pollutions.

The next step is named stock preparation, where various chemicals and pulps are added to the

pulp based on the desired characteristics and grade of the finished paper. Sizing agents are

introduced to increase the paper resistance to water and fillers, such as calcium carbonate, are

added to increase the paper density. The stock is diluted from 4% to 0.5% then cleaned and

screened as to eliminate dirt particles [21].

The mixed stock is then pumped by the fan pump to the paper machine, where the slurry of

highly diluted fibre suspension is distributed evenly across a moving screen, the wire. The

formed sheet is then dewatered mainly under gravitational forces. The formed sheet is then

mechanically pressed which further decreases the water content. The paper web then passes a

rotating heated iron cylinder where the remaining water content is evaporated. The head-box in

the paper machine assures uniform distribution of flow across the paper machine. The fibrous

mat is then wound into a reel of paper on the paper machine [26].

For the production of paper requiring high quality and high brightness, as well as a longer shelf

life and a superior surface on which to print, a coating layer can be added to the base paper

produced on the paper machine [26].

Figure 8- Paper production process steps

Wood/ Recycled Paper Pulp Production Stock Preparation

Final Product Coating/ Finishing Paper Machine

Pulp

Machine Stock

Paper/Board

13

Water types used in pulp and paper production

Freshwater

Surface water or groundwater is the prominent source of freshwater, depending on local

conditions and availability. The majority of the freshwater is consumed in high- and low-

pressure showers, trim squirts, vacuum pumps and additive preparation and dilution. To reduce

the freshwater intake, water is reused and recirculated several times. For instance, the

freshwater used for cooling in condensers is collected and can be reused as fresh warm water

for the paper machine [21].

Approximately 40% of the entire freshwater intake, amounting to 1.0-2.5 m3 per ton of paper

produced, dependent on the degree of water circuit closure, is consumed in the high- and low-

pressure showers in the wire and press section. The consumed sealing water in the liquid-ring

vacuum pumps is as low as 0.5 m3 per ton of paper produced, provided the sealing water circuit

is installed with a cooling tower. Without a sealing water circuit, the consumption may be as

high as 4-5 m3 per ton of paper produced. Pumps also consume around 0.15 m3/h of freshwater

and 0.2 m3/h is used in refiners [21].

Generally freshwater does not possess the required water quality composition to be used

directly in the paper production process and hence requires treatment. The treatment should

effectively remove solids, colour, dissolved solids and organic substances as well as decrease

hardness and disinfect the water. The choice of water treatment method depends on the inlet

water quality, water volume, and space available. Predominantly mechanical or chemical-

mechanical treatment technologies are applied for freshwater treatment. Filtration is by far the

most commonly utilized method and is often coupled with other treatment methods such as

chemical coagulation, flocculation, and subsequent sedimentation [21].

Process Water

The installation and optimum design of water circuits are of the utmost importance in pulp and

paper mills as it directly influences freshwater intake as well as product quality. Using

freshwater for every water stream would raise water consumption to 100 m3 per ton of paper

produced. The designed water circuit should provide the required amount and quality of water

for every stream. Therefore the water can be recycled and reused several times through different

loops. There are various possibilities for water recirculation based on the raw material and the

grade of paper produced [21].

Process water is produced in the thickening and dewatering stages of the paper production

process by the separation of the liquid phase from solid phase via disk filters, screw and double

wire presses and drum thickeners. Membranes and ozone treatment can also be utilized to

provide further treatment to achieve better water qualities [21].

14

Process water has replaced freshwater in some process steps and is now mainly used for

pulping, consistency control, showers, foam destruction, sealing water of liquid-ring vacuum

pumps, or additive preparation [21].

Wastewater

Wastewater in the pulp and paper industry primarily consists of the excess process water, which

can be discharged due to the input of freshwater. The wastewater mainly consists of organics

that have been added to the process as additives or raw materials, which are commonly non-

toxic and biologically degradable [21].

The wastewater may also consist of inorganics, for instance, salts such as calcium and sulphate,

which may cause deposit formation when calcium carbonate is precipitated. The deposits tend

to accumulate in the sludge and reduce the active biomass share and will also cause problems

if they are recirculated back into production [21].

Sulphate levels in wastewater are another major concern in paper mills, which originate from

recovered papers or the aluminium sulphate used for resin sizing. Process waters become

increasingly concentrated when attempting to close water loops and sulphate concentrations as

high as 600 ppm are to be expected. Moreover, high sulphate concentrations under anoxic

conditions, may cause sulphate reduction and lead to sulphide formation. The hydrogen

sulphide produced causes corrosion as well as odour problems [21].

15

Water recirculation

The increasing closure of water circuits has led to a demand for increased waters qualities within

the process. The clarified water must be of high quality and free of all suspended solids,

especially in cases such as the showers in the high-pressure range and sealing water, where it

is to replace freshwater. A wide variety of methods are employed, including biological

treatment, softening, membrane technology, and ozonisation. These so-called kidney

technologies aim at obtaining effluent-free paper production [21].

Closing the loop and water recirculation leads to the accumulation of unwanted substances

known as “detrimental substances”. Detrimental substances are dissolved or colloid-soluble

anionic oligomers or polymers and non-ionic hydrocolloids, which can have a negative effect

on paper production and on product properties. These substances can have negative effects on

the paper drying, drainage, sizing, etc. processes as well as on the products optical and strength

properties. The quantity of these contaminants is commonly regulated using a sum parameter

named chemical oxygen demand (COD), which measures the volume of oxidizable substances

in a water sample. A list of common detrimental substances is presented in Table 2 [21].

Table 2- Composition and origin of detrimental substances[21]

Chemical compound Origin

Sodium Silicate Bleaching, de-inking, recovered paper

Polysolphate Filer dispersing agent

Polyacrylate Filer dispersing agent

Starch Coated broke, recovered paper

Humic Acids Freshwater

Lignin Pulp

Volatile Fatty Acids Anaerobic processes

Chloride Chemical additives

Calcium Recovered paper, fillers

Sulphides Anaerobic processes, Sulphate

Exopolymer Saccharides High C/N ratio

The water quality required for every stream depends on the application. Lower water purities

can be applied to less demanding situations. Therefore, water effluents can be purified and

recirculated for use in pulp and paper mills [1]. Reducing water usage requires an understanding

of where damaging chemicals originate, as well as which streams are critical to the process and

how they impact mill operation [24]. Control of microorganisms, appropriate piping and

storage, and material selection are needed to keep the surfaces clean and reduce the fouling

potential and washing requirements [25].

There are three categories of water circuits within the paper production process: primary,

secondary and tertiary water circuits. The primary circuit is by far the largest of the three and

consists of white water, which originates from the wire section. The objective is to dilute the

main stock flow after the machine chest in the approach flow system to a consistency of

approximately 0.7–1.5%. The circulating flow rate depends on the retention of the wire section

and the consistency in the head-box [21].

16

The secondary circuit originates from the forming section or the press section. The stream is

then filtered, where the recovered fibres are recirculated to stock preparation. The permeate is

then sent to a buffer tank and it can then be used for pulping, consistency control, foam

destruction, and showers. The water can be further purified with membrane filtration and be

used for more sensitive applications such as sealing waters and high-pressure showers [21].

The tertiary circuit is only installed when a part of the treated wastewater is recirculated. The

recirculated wastewater can be applied for miscellaneous applications depending on the water

quality attained. Biological and calcium scaling are common operational problems faced when

adding a tertiary circuit [21].

The circuit water treatment needs to provide clarified water and reduce the contaminants, such

as insoluble and colloidal components as well as dissolved substances, from the water stream.

Sedimentation, flotation, and filtration, or a combination of these methods, are typically

employed in circuit water treatment [21].

Sedimentation is the simplest most conventional method for fibre recovery; however, the

technology has experienced a decrease in market share due to high hydraulic retention times

and low density of the sediment. Flotation units use air bubbles to float undissolved substances

to the surface of a suspension, where they are scooped off by a skimming device. The flotation

devices may experience a sharp variation in inflow loadings which lead to inadequate

performance [21].

Biological processes are the state of the art technology in wastewater treatment plants and are

suitable for the treatment of biologically degradable substances and sulphates as well as a

pretreatment step for nanofiltration and reverse osmosis. Aerobic and anaerobic designs have

both proven effective. Thermophilic water treatment has the benefit of eliminating the need for

process water cooling and reheating for water recycling [21].

Filtration technologies are currently widely applied in circuit water treatment due to their ability

in effectively separating solid particles and producing high-quality clarified water. However,

high investment and maintenance costs are limiting factors in the implementation of this

technology [21]. Membrane technologies can also be implemented for water reuse and

circulation due to its ability to remove suspended solids, microorganisms, colloidal COD and

even salts. [21].

17

Pulp and Paper Wastewater Treatment

Pulp and Paper wastewater characteristics depend significantly on the process stage from which

they originate [1]. The chemical composition will also differ in every mill and every day,

however, the effluents are usually highly concentrated. Wastewater effluent from Kraft pulp

process contains high organic matter concentrations as well as phenolic compounds with high

molecular weights and other toxic substances which cause significant damages to aquatic

environments, such as a reduction in phytoplankton and fish populations and eutrophication.

Typical values for the chemical composition of the paper manufacturing process wastewater

are exhibited in Table 3 [23].

Table 3-Typical chemical composition of paper mill wastewater [23]

Chemical Concentration (mg/l)

COD 480-4450

Chlorides 80-980

Sulphates 240

Phosphates 155-470

Volatile fatty acids 950

Acetic acid 200

Propionic acid 98

Butyric acid 36

Polyphenols 48

Total dissolved solids 395-2500

Cellulose 1200

Wastewater treatment in pulp and paper mills typically involves a pretreatment mechanical

treatment for solid removal, followed by a biological treatment step. The treatment plants

consist mainly of activated sludge processes or aerated lagoons, which reduce the biochemical

oxygen demand (BOD) levels by 90 to 95% and the chemical oxygen demand (COD) by 40 to

60% [27]. Despite the relatively high removal rates, more advanced treatments may be required

to enable the water effluent to be reused in the process as the biologically treated water may

still contain significant amounts of fibres, micro-organisms, organics, suspended solids and

colour [17]. Furthermore, inorganic compounds cannot be effectively removed via biological

treatment[28]. Therefore, the water discharge from this process is not sufficiently clean for

reuse in the production of higher grade papers but can be used in packaging paper production

[17].

Mechanical Pretreatment

The principal methods used for solid separation in wastewater treatment plants in the pulp and

paper mills include screening, settling, clarification, and flotation. Screens can be installed to

remove coarse, bulky, and fibrous components from the effluents. The choice of method

depends on the characteristics of the solid matter and quality requirements on the treated

water[21].

18

Biological Treatment

Biological wastewater treatment utilizes microorganisms to degrade the contaminants dissolved

in the wastewater effluent. The treatment is most effective when the contaminants are soluble

in water and nontoxic. Both anaerobic and aerobic treatments can be used and multistage

processes which operate as aerobic–aerobic or anaerobic-aerobic are far more reliable. Cascade

systems, which allow a graduation of the loading conditions, can also be used [21]. The

activated sludge formed in the biological reactors undergoes secondary clarification to

separation and thickening of the biomass.

Anaerobic treatment uses microorganisms which metabolize only in the absence of oxygen for

the treatment of effluents from recovered paper production mills. Anaerobic processes are

characterized by their small amount of sludge produced as well as low energy requirements and

concurrent biogas production. The biogas can be used as an energy source in the generation

process steam, heat, and electricity. Fully biological degradation of the effluents is not yet

feasible and water discharges commonly undergo a pretreatment and posttreatment step [21].

Aerobic treatment uses microorganisms which require oxygen for their metabolic activities.

Oxygen is introduced to the effluent in the form of air by aeration equipment. The bacteria then

use dissolved oxygen to convert organic components into carbon dioxide and biomass. The

process efficiency depends on whether there is an adequate amount of nutrients in relation to

the amount of biomass, a certain temperature and pH regime, and the absence of toxic

substances. Aerobic treatment is characterized by their high sludge production, high energy

demands, and larger space requirements. Effluent aeration also increases the plant operating

cost. On the other hand, the treatment is stable and effective in degrading biological

contaminants and removes 90-98% of BOD [21].

19

Membrane technology implementation on water circuits

Full circuit closure is not necessarily the optimum choice and the degree of closure relies

heavily on both economic and ecological parameters [21]. Despite the aforementioned

advantages, closed-loop water circuits may lead to pollutant accumulation in the process water.

There exists a breakpoint in the accumulation of contaminants, which limits the closure of the

water circuits. Therefore, contaminants must be removed to reduce the adverse complications

such as corrosion, clogging of the equipment, scaling and slime formation in the process or the

final product [24]. The closed water system also causes risks such as operational problems,

reduced product quality, and increased complexity of the papermaking process[29]. These

effects can be managed by treatment of a side flow of water via evaporation or membrane

filtration [4]. Membrane technology offers the flexibility to remove a wide range of interfering

substances from effluent or circulation waters, which enables paper mills to reduce water

consumption [22].

Another issue for pressure-driven membrane processes is the concentrate stream. The reject

stream often contains an unwanted by-product of water treatment and requires further treatment.

The stream may be reused, decontaminated or directly discharged into a water source [9].

Furthermore, streams in pulp and paper mills have large volumetric flows, as high as cubic

meters per second. Therefore, the membranes are required to exhibit high permeability and a

stable flux[1]. The high capacity of filtration present challenges as to whether membranes are

economically feasible [24].

Currently, membrane technology can be implemented in several stages of the papermaking

process including fresh water treatment, internal circulation water treatment; coating color

treatment and downstream treatment of biological treatment system [22]. Membrane processes

can be applied to ensure a high freshwater quality for certain papermaking systems. An

ultrafiltration step can be implemented to prevent the intake of solids and colloids from surface

waters, and reverse osmosis may be installed when deionized water is required [22].

Ultrafiltration can also be utilized for internal water circulation, and the soil-free permeates can

replace freshwater for applications such as spray nozzles and utilities. The internal circulation

would reduce the water consumption and maintenance costs substantially since the water would

otherwise have to go through an extensive treatment process to be disposed of [22].

Figure 9 exhibits the current most common installation positions of membrane technology in

the paper-making process: Fresh water treatment; internal circulation water treatment;

treatment of coating colour effluents; wastewater treatment by means of a membrane bioreactor

MBR; tertiary wastewater treatment downstream of a biological effluent treatment system (NF

or RO) [24].

20

Wastewater

Freshwater

Freshwater treatment

Stock preparation

Paper Machine

Save-all flotation

Wastewater Treatment

Coating colour

effluent Primary Circuit

Secondary Circuit

Membrane

bio-reactors

Tertiary

Circuit

Figure 9- Simplified schematic of water circuits and possible membrane implementation sites

21

Treatment of membrane retentate

The treatment of the retentate from a membrane process depends on the composition and

application. A retentate which contains valuable products, such as colour coatings, can be

recirculated back to the production process, and a retentate which is a waste stream needs to be

treated before it is discharged to the environment [30]. When the produced concentrate is a

waste stream, it can be incinerated or circulated to the wastewater treatment plant. Waste

streams can be evaporated to lower the retentate water content, and then incinerated in the

boiler. In most cases, where the retentate cannot be reused it is sent to the wastewater treatment

plant to be biologically degraded to be discharged to the waterway [30].

22

Industrial case studies

Membrane technologies with high shear modules, such as tubular modules and conventional

spiral-wound modules, have been implemented in several mills to purify and recirculate paper

mill water [1]. The first recorded experiments with membranes in the pulp and paper industry

involved filtration of white water from the paper machine for reuse purposes and bleach plant

effluents for colour removal [30].

The membrane process was first commercialized in 1972 in Wisconsin (USA) where a reverse

osmosis system was installed to treat the paper mill circulation water. Mills in Canada and

Norway installed plate and frame RO systems in the 1980’s, to concentrate sulphite liquor.

LINPAC paper recycling plant is composed of a two-stage tubular UF system and VSEP

(Vibratory Shear Enhanced Processing) to annihilate impurities for water reuse. The process

was used to treat the overflow for dissolved air flotation (DAF) at an operating pressure of 10.2

atm. A recovery rate of 72% and a concentrated reject with total solids of over 20% was

reported [15].

Membrane filtration can also be used to enhance the efficiency of a wastewater treatment plant.

For example, the Eltmann newsprint mill in Papierfabrik Palm uses spiral wound NF to improve

the quality of activated sludge process effluent. This technology is coupled with a pretreatment

step of sand filtration was able to reduce COD levels by 89%[15]. The NF plant permeate is

190 m3 per hour at a recovery rate of 84% and a flux of 10-30 L/m2.h [17].

A pulp mill in New Brunswick, Canada implemented a membrane process in lieu of a

conventional wastewater treatment plant due to limited space available. A reverse osmosis (RO)

plant was installed to purify wastewater streams which would then be recirculated into the

beaching process. The process was successful in reducing concentrations of phenols and

guaiacols, as well as the compounds responsible for endocrine disruption in fish. A moving bed

reactor (MBR) was added in conjunction with the RO plant, as to reduce the BOD levels. The

process led to a 40% reduction in water consumption [15].

Four German mills are currently operating with integrated closed circuit water treatment,

producing no effluents. This has been achieved via the installation of different process water

treatment plants as ‘kidneys’. One of these mills is located in Cologne and produces 410,000

tons per year brown packing paper made from recovered paper. An anaerobic water treatment

unit is installed followed by two aerobic units in the second stage. COD levels have been

decreased by 80% and organic substances (in terms of fatty acids) are reduced in an effective

manner [29].

Another recent utilization of the zero-effluent process was implemented in a mill outside

Dusseldorf. The decision to close the mill’s water system was stimulated by the high effluent

fee of 1.50 Euro/m3 for the use of the town’s treatment plant. The limited mill area also limited

the addition of an in-house wastewater treatment plant. Membrane technologies were not as

advanced at the time and were not implemented. Instead, a process called IC (internal

circulation) reactor was developed. The process water is first clarified by micro-flotation and

23

then is fed into a pre-acidification tank after cooling in order to reduce the temperature to 38 oC. The anaerobic degradation takes place in the IC tower reactor. The biogas generated is then

desulphurised in an alkali washer to avoid corrosion and odor problems [29].

Nano-filtration membrane plants have been added to mills to purify the discharge effluent of

the biological processes. The wastewater treatment process consisted of settling tanks, a sand

filter, a back-washable screen-filter and a 5µm bag filter. The membranes were installed to

remove color, organic carbon and dissolved solids. The high efficiency of the treatment plant

meant spiral wounds membranes could be utilized despite common challenges with fouling

[22].

The Papeterie du Rhin’s paper mill in France utilizes a membrane bioreactor with UF

membranes to treat their wastewater effluents. The discharge is pretreated with drum screens

and then sent to an equalization basin. The process removes 95% of COD and above 99% of

BOD levels, and the permeate is partly recycled as process water [30].

The Artic Paper Munkedals uses UF tubular membranes to treat their white water. The water is

pretreated with sedimentation to remove the suspended solids. The ultra-filtered water is used

in the showers in the wire section [30].

24

Methodology and Apparatus

The following section will cover how the AlfaLaval M20 device works and the experimental

procedure which was designed to test the efficiency of the membrane treatment. Characteristics

of the used membranes and water samples are also discussed, as well as the chemical analyses

used to determine the water quality.

Device

The Alfa Laval Labstak M20 is a crossflow membrane filtration unit. The device is designed to

provide rapid and precise evaluations on a laboratory scale, which are ideal for gathering data

for scaling up and process development. This wheeled unit is comprised of a membrane module,

high-pressure pump, tank, heat exchanger, valves, gauges, and hydraulic hand pump. A

selection of various flat-sheet membranes, ranging from reverse osmosis, nanofiltration,

ultrafiltration, and microfiltration can be used within the module. As an option, the unit can be

fitted with a spiral element for testing in continuation of preceding flat sheet membrane

screening [31].

Figure 10- Alfa Laval M20 Device[32]

The machine encompasses a number of membrane filter sheets, and support and spacer frames,

which are compressed into a vertical frame. The plates are circular and are designed to establish

a serial connection between the membrane sheets contained in the membrane/plate stack.

The membrane sheets developed by AlfaLaval are polymeric membranes reinforced by a non-

woven support material. The membrane sheets are mounted to both sides of a support plate so

that the smooth polymeric layer is in contact with the inflowing liquid. The membrane support

plate is composed of two perforated halves forming an inside cavity, which allows for the

collection of the permeate flow passing through the membrane. The permeate flow is directed

towards a tubular outlet pipe located at the plate periphery and can be collected via attachment

of a silicone rubber hose.

25

The spacer plates have a set of radial crossflow channel beads, starting at the centre and ending

at a number of holes located adjacent to the plate periphery. When stacked together, the

membranes and plates form a series connected crossflow pattern over the membranes through

the channel beads and periphery holes.

The device is also attached to a multi-tube heat exchanger fitted with a 0-100 bar pressure

gauge, which indicates the inlet crossflow pressure. An adjustable spring-loaded pressure

regulator is also attached with a 0-100 bar pressure gauge, which is used for control and

measurement of the outlet crossflow pressure. A separate hand-lever operated hydraulic unit

with incorporated oil reservoir is also connected to the M20 device which is attached to a

pressure gauge.

The device can be fitted with a range of flat sheet membranes for microfiltration, ultrafiltration,

nano-filtration and reverse osmosis. The external steel body of the device is composed of AISI

Type 304 Stainless Steel and the interior is made of Stainless Steel 316L. The support and

spacer plates are made of polysulphone [31].

Figure 11- Flowchart of Alfa Laval M20 Device[32]

26

Membrane Assembly

The membrane sheet has a paper support size on the back and a membrane layer side, which

can be identified via light, with the membrane layer side appearing glossy and the paper side as

dull. Two membrane sheets are mounted on a support plate with two lock rings. The support

plates should be stacked carefully to avoid scratching the membrane layer of the sheet.

Mounting the membranes starts by first putting the spacer plate on the flange. The side with an

indentation in centre should always face upwards, and the side with the flat centre should face

downwards. Afterwards, the support plate with membrane sheets is placed in the module. The

permeate outlet connection should face towards the tank. The next spacer plate is then pressed

in the module above the support plate. All the plates should be in parallel and pushed up against

the thin metal piece. In theory, up to 20 different membranes can be tested at the same time

with the M20 device[31].

27

Membranes

The membranes used in this project were polymeric flat-sheet membranes from Alfa Laval with

various molecular-weights cut-offs (MWCOs) and flux properties. The FS40PP membrane is

made of fluoropolymers and has an MWCO value of 100,000. The ETNA01 and

ETNA10 membrane are made of composite fluoro-polymer with 1,000 and 10,000 MWCO

values, respectively.

The UFX10pHt membrane is characterized by being resistant to high pH values and

temperatures and is made of polysulphone. The membrane is also permanently hydrophilic and

has an MWCO value of 10,000. A summary of the used micro-filtration and ultra-filtration

membranes and their respective properties are exhibited below in Table 4- MF and UF

membrane properties:

Table 4- MF and UF membrane properties[32]

Membrane

Type

Support

Material Characteristics

MWCO

value

FS40PP Polypropylene Fluoro Polymer 100,000

UFX10pHt Polypropylene Polysulphone

Permanently Hydrophilic 10,000

ETNA10PP Polypropylene Composite Fluoro Polymer 10,000

ETNA01PP Polypropylene Composite Fluoro Polymer 1,000

The flat sheet membranes for reverse osmosis are made of thin-film composite based on a

unique construction on either polypropylene (PP) or polyester (PE) support material which

provides optimum cleaning conditions. The RO membranes are categorized based on their

sodium chloride rejections. The RO90 membrane is cast on a polyester support, with sodium

chloride rejections of above 90%. The RO98pHt membrane, which has a sodium chloride

rejection of above 98%, is cast on polypropylene support and is tolerant to high pH and

temperature [32].

Table 5-Reverse Osmosis membrane properties[32]

Membrane

Type

Support

Material Characteristics Rejection

RO90 Polyester Thin Film Composite ≥ 90%*

RO98pHt Polypropylene Polysophune- Permanently

Hydrophilic ≥ 98%*

*Measured on 2000 ppm NaCl at 16 bars and 25 oC

The recommended operation limits and cleaning procedure of the membranes are summarized

in the tables below:

28

Table 6- Recommended Operation limits for membranes [32]

Membrane Type pH Range Operating Pressure (bar) Operating Temperature (oC)

FS40PP 1-11 1-10 5-60

UFX10pHt 1-13 1-10 5-75

ETNA10PP 1-11 1-10 5-60

ETNA01PP 1-11 1-10 5-60

RO90 3-10 15-42 5-50

RO98pHt 2-11 15-42 5-60

Table 7- Recommended cleaning parameters for membranes [32]

Membrane Type pH Range Operating Pressure (bar) Operating Temperature (oC)

FS40PP 1-11.5 1-5 5-65

UFX10pHt 1-13 1-5 5-75

ETNA10PP 1-11.5 1-5 5-65

ETNA01PP 1-11.5 1-5 5-65

RO90 1.5-11.5 1-5 30-50

RO98pHt 1.5-12.5 1-5 30-60

29

Water Samples

Three points for membrane installation within the process were identified based on meetings

and discussions with the Sofidel plant employees. The first sample point is the wastewater

effluent discharge. This stream is an accumulation of the process waters recirculated in the

process, which has undergone a treatment mechanism, comprised of pre-flocculation, biological

treatment, post-flocculation, and flotation. Based on the data from the plant’s environmental

report, the wastewater flow was an average of 741 m3/day with an average COD of 359 mg/l in

the previous year.

The second sample point is the spray water for the paper machine referred to as “PM3”. The

stream is the effluent from the spray-water tank which is sent to the scrubber. The water

consumption for this paper machine is approximately 600 m3/day.

The third sample point is the flotation discharge within the paper machine called “PM4”. The

fibre-rich water stream has undergone a flotation process and is intended to be circulated back

to the spray-water tank. Polymers are also introduced to the flotation tank and sludge is

discharged. The water consumption for this paper machine is approximately 400 m3/day.

The water samples were refrigerated at a temperature of 4 oC as to limit the biological and chemical

reactions which could occur within the wastewater over time. Furthermore, the wastewater never

went below freezing temperature. The itinerary of the received wastewater and process water is

summarized in Table 8:

Table 8- Water and Process water characteristics (Average)

Date Arrived Volume

(L)

COD

(mg/l)

TOC

(mg/l)

SS

(mg/l)

Wastewater Effluent Sample 1 25-Jan 50 323 92 16

Wastewater Effluent Sample 2 14-Feb 100 213 65 18

Spray water PM3 21-Mar 50 631 214 6

Spray water PM4 21-Mar 50 739 268 14

30

Experimental Procedure

Pre-cleaning

The first step after assembling a new membrane is pre-cleaning. The goal of the pre-cleaning

procedure is to remove preservatives and chemicals which are left from the membrane

preparation, as well as any other contaminants added during assembly. The pre-cleaning usually

increases the flux and changes the pore surfaces due to adsorption of the cleaning chemicals,

which opens the membrane pores.

The cleaning agent is poured into the feed tank and cleaning takes place under recirculating

conditions, meaning that the permeate is circulated back to the feed tank. The cleaning agent,

Ultrasil 10, contains sodium hydroxide (NaOH) and Ethylene-di-amine-tetra-acetic acid (EDTA)

with a 2:3 ratio. A volume of 25 ml Ultrasil 10 solution was used in every batch, increasing pH

levels to almost 11.5

Operating parameters influence the membrane performance during membrane filtration and

cleaning. The temperature used for cleaning should be at least moderately high since the solubility

of the cleaning agent as well as the organic foulants increases at higher temperatures. The

transmembrane pressure during pre-cleaning should be kept as low as possible. Cleaning with

high concentrations shortens the membrane lifetime and is also disadvantageous from an

economic perspective as it leads to higher costs. All of the aforementioned parameters should

be implemented while considering the limitations of the membrane and the cleaning agent.

When the pre-cleaning is finished, the distilled water flux is measured after 30 minutes of

recirculation. The distilled water flux measured after pre-cleaning is used as a reference to

determine the degree of the membrane fouling and the efficiency of the membrane cleaning.

Membrane Filtration

The wastewater discharge and process waters are filtrated in the Alfa Laval M20 device. The

filtration is conducted in recirculation mode, meaning the permeates are circulated back to the

feed tank for the two-hour period. Since the feed solution is not altered, the feed quality remains

constant. A water sample of approximately 100 ml is taken at the start of the experiment from

the feed tank and another sample is taken from the permeate at the end of the filtration period.

Since there is a volume of dead water within the system, the wastewater contamination levels

may differ slightly from the feed, due to dilution.

The filtration tests were carried out under turbulent conditions with a polymeric MF, UF and

RO flat-sheet modules, with a membrane area of 1960 mm2. Since two membranes were

assembled in every experiment, the total surface area is 3920 mm2. It should be noted that in

every experiment four spacer plates were placed below the support plate, as well as four above

it.

31

All MF and UF experiments were conducted at a pressure of approximately 2 bars whilst

reverse osmosis experiments were performed under 35 bars of pressure, based on prior

experiments conducted with the device at RISE. Flux measurement was conducted every 15

minutes at the same temperature, 15 oC for MF and UF and 25 oC for reverse osmosis

respectively. This was done to eliminate the effect which pressure and temperature have on flux

and so fouling calculations would be reasonable.

Post Cleaning

The final step of the membrane filtration is the post-cleaning process, which is carried out in

the same manner as the pre-cleaning. However, in this case, two different cleaning agents, one

alkaline and one acidic were used. The alkaline cleaning agent was Ultrasil 10 and the acidic was

Nitric Acid. A volume of 25 ml Ultrasil 10 solution and 7g of 35% solution of nitric acid was used

in every batch, changing pH levels to almost 11.5 and 2.0, respectively.

Cleaning efficiency

The standard method to calculate the cleaning efficiency is by comparing the pure water flux

of a new membrane and that of the same membrane when it has been fouled and then cleaned.

The efficiency can be determined via flux recovery, defined as the flux ratio after cleaning and

before wastewater treatment. The decline in the distilled water flux after filtration of wastewater

and membrane cleaning is an indication of irreversible fouling.

Measurements of the pure water flux can be used to determine the cleaning efficiency, denoted as

fouling ratio and flux recovery, defined below.

𝐹𝑜𝑢𝑙𝑖𝑛𝑔 𝑟𝑎𝑡𝑖𝑜 = 1 −𝐽𝑓

𝐽0

𝐹𝑙𝑢𝑥 𝑟𝑒𝑐𝑜𝑣𝑒𝑟𝑦 =𝐽𝑐

𝐽0

Where J is the measured flux and the subscript 0 is for initial, f for final and c is for after

cleaning procedure. A drawback of the method is that the flux measurements are heavily

dependent on pressure and temperature. Furthermore, a decrease in flux only suggests that

fouling occurs, but does not give any information about the fouling type and how to eliminate it. To

avoid the first problem, flux measurements were carried out at the same temperature and pressure

so the comparison would be more logical.

A better method to measure fouling would be to measure flux over several filtration and cleaning

steps, and then compare the average permeate flux. This measurement was only conducted once,

due to the limitation of the amount of the available wastewater [18].

32

Chemical Analysis

During the experiments, samples of the feed and permeate were withdrawn. The permeate sample

was collected at the end of a two-hour filtration process. All the samples were checked for their

chemical oxygen demand (COD), total organic carbon (TOC), conductivity and several other

relevant parameters. In several experiments, permeate samples were collected during the

experiment as well. The wastewater samples were analysed without any pre-filtration. The samples

were diluted, when necessary, with distilled water.

COD measurement

Chemical oxygen demand (COD) is an indirect measurement of organic compounds in a

wastewater sample. The value is critical in wastewater for determining the amount of waste in

the water and is an indicator of how much oxygen will be required to treat the incoming waste

streams. COD contrasts with biochemical oxygen demand (BOD), which relies on the use of

microorganisms to break down the organic material in the sample by aerobic respiration over

the course of a set incubation period (typically five days). In a COD analysis, hazardous wastes

of mercury, hexavalent chromium, sulfuric acid, silver, and acids are generated, which require

special disposal.

COD measures organic matter with a chemical oxidant which should be strong enough to react

with virtually all organic material in the sample. Currently, most COD tests use potassium

dichromate as the oxidant, a hexavalent chromium salt which can oxidize 95-100% of the

organic material. During the oxidation, the sample is heated with an excess amount of

dichromate, which converts organic matter to carbon dioxide and water while dichromate is

reduced to Cr3+. The amount of oxygen that is chemically equivalent to the dichromate

consumed is defined as the sample COD. A spectrophotometer is used to determine this value.

Colorimetric analysis principle states that the two chromium ions absorb in the visible range

but at different wavelengths. The dichromate ion is visible at 420nm, and the Cr3+ ion around

600 – 620nm. A spectrophotometer sends the correct wavelength through the sample cell to a

detector which measures transmittance [33].

TOC measurement

Total organic carbon (TOC) is the organic carbon content in a compound and is often used as

an indicator of water quality. The measurement of TOC is a quick online method which is

recognized as a suitable alternative method compared to BOD and COD.

The principal behind TOC measurement is that a water sample is acidified to pH= 2-3, to remove

the inorganic carbon (as well as CO2 and ions of carbonic acid). The organic carbon components

are then oxidized to form carbon dioxide. The oxidation is typically performed by high-

temperature digestion, where all organic matter is incinerated at 650 oC, supported by a catalyst.

The total carbon concentration value is then measured in mg/L via non-dispersive infrared

detector (NDIR), where the CO2 is detected at a specific wavelength. The NDIR generates a

non-linear signal, proportional to the CO2 concentration, which is plotted against the sample

analysis time. The peak area is then compared to calibration data of samples with various

33

concentrations. TOC value obtained as the difference between Total Carbon and Total

Inorganic Carbon [34].

Conductivity

Conductivity is a measurement of the total concentration of ions in a solution, which determines

the capacity the solution has for conducting an electric current. This parameter is a general

indicator of water quality and is widely used in various industries, such as process control in

food and pharmaceutical industries as well as wastewater treatment.

Conductivity is generally expressed in S/cm (or mS/ cm). The scale for aqueous solutions starts

at a conductivity of 0.05 µS/cm at 25 °C for ultrapure water. Tap water or surface water

typically has conductivity within the range of 100 - 1000 µS/cm. The conductivity of a solution

increases with temperature as temperature affects dissolution and ion mobility. Conductivity is

measured using a device called conductivity meter, which applies an electrical field between

two electrodes and measures the electrical resistance of the solution.

Turbidity

Turbidity is an optical property of a water sample, which measures the scattering effect that

suspended solids have on light. Primary contributors to turbidity include clay, silt, organic and

inorganic substances, soluble coloured organic compounds and biological organisms. The

measurement is qualitative and cannot be expressed as micrograms per litre of suspended solids.

Turbidity is measured in nephelometric turbidity units (NTU) which depend on passing specific

light of a specific wavelength through the sample. Visible turbidity is found at levels higher

than 5 NTU.

To measure turbidity, a clear index-marked cell with the turbidity standard is rinsed, cleaned,

dried. The water sample is then shaken and poured into the sample cell whilst the cell exterior

is dried with a lint-free cloth. The turbidity can then be read via the turbid-meter. The instrument

is calibrated beforehand within the appropriate measurement range [35].

34

Pretreatment Methods

Membrane Filtration

The same experimental procedure as the one in the previous section was performed when

conducting membrane pretreatment experiments.

Centrifugation

Centrifugation is an energy-intensive process which sediments all suspended solids. The

centrifugal acceleration causes the heavier particles to move outward in the radial direction,

causing them to settle in the bottom of the tube. The centrifugation is performed at 5000 rpm

for a duration of 5 minutes on a lab scale of 200ml at a time. The device used was the CR15

Centrifuge by Braun Biotech International. The water was then decanted and used for

membrane filtration.

Flocculation

Flocculation is a widely applied treatment technique in water and wastewater purification. A

one-litre sample of the wastewater is placed into a beaker and the flocculant chemical is added

during rapid stirring of the sample. After one minute the stirring rate is slowed down to

approximate 90 rpm and the sample is flocculated during slow stirring. The flocculation is

stopped after 10 minutes and the formed flocs are allowed to settle for one hour. After the

sedimentation of the sample, the upper water layer is decanted off and analysed. Two different

flocculants, AVR and PAC, were used at different dosing levels to find the optimum scenario,

which both decreases contamination levels and produces the least sludge. The results for the

preliminary round of the study are in Appendix B.

35

Results

In this section, the results obtained from the membrane filtration are presented. First, the results

for the mill wastewater and then the process water are presented. The results will then be

discussed further in the discussion part.

Wastewater

The first round of experiments was carried out on the wastewater effluent of the plant. Various

membranes and pretreatment methods were tested to determine the feasibility and up-scalability

the process. The ideal scenario would provide sufficient separation; high permeate flux and low

or reversible fouling. As previously mentioned, the goal presented for the project would be to

achieve water quality sufficient to be re-used as the freshwater intake or be used as process

water within the paper production chain.

The experiment was carried out in two steps. In the first step, different UF membranes were

compared to determine the most suitable membrane. The optimum conditions were defined

with respect to average operating flux, separation efficiency and fouling rate. It should be noted

that if the membranes exhibited a high fouling tendency in small-scale flat sheet membranes,

the fouling rate would be more severe in large-scale spiral wound modules.

The second round focused on reverse osmosis membranes. Reverse osmosis membranes are

extremely prone to fouling; therefore various pretreatment steps were combined with reverse

osmosis membranes were utilized to determine the appropriate method. Microfiltration,

ultrafiltration, centrifugation, and flocculation were compared as pretreatment steps, prior to

the reverse osmosis membrane filtration.

As previously mentioned an ideal scenario would provide efficient separation, high average

flux, and low fouling levels. For every round of experiments, three graphs will be presented.

The first one, titled fouling and cleaning, will be a column chart which will show permeate flux

at four different stages. The first column shows the flux of distilled water after the membrane

has gone through the pre-cleaning process, the second column shows the average permeate flux

during the two-hour filtration period. The third and fourth columns indicate the flux of distilled

water after alkaline and acidic cleaning has been performed. This can be a measure of how

irreversible the fouling is on the membrane surface. The second graph will show the permeate

flux over the two-hour filtration period and the third graph will be a general scheme of the

process and the COD and TOC separation. Removal rates of conductivity, turbidity, and total

nitrogen can be found in the Appendix E. In the graphs, technologies used as pretreatment

steps are written in parentheses.

36

UF Experiments

AlfaLaval produces several UF membranes which can be applied in the process. Among the

available ones, three different membranes were chosen for this study. The membranes differ

based on their molecular weight cut-offs (MWCO), materials and support layers. Table 4

provided a summary of the characteristics of the ultrafiltration membranes.

The pressure difference in all ultrafiltration experiments was measured at 0.6 bars, with a 1.6

bar pressure in the feed and 2.2 bars at the permeate. It can be observed that the ETNA10

membrane displayed the highest measured flux recovery after filtration and chemical cleaning,

with a 95% flux recovery, followed by UFX10 and ETNA01 membrane, each with 86 and 43%

respectively. Furthermore, the ETNA10 had the highest average wastewater flux during

filtration with 86 L/m2.h, followed by UFX10 and ETNA01, each with 68 and 55 L/m2.h

respectively.

Figure 12- UF membrane Fouling and Cleaning Flux

As expected, all membranes exhibited a decreasing trend within their permeate flux over the

filtration period. The UFX10pHt membrane flux stayed practically constant throughout the

second hour of wastewater filtration, after a 20% decrease within the first hour. Other

membranes had higher flux reduction rates, which is an indication of higher levels of fouling

during the filtration.

147

68

127 129

201

55 6286

187

86

114

178

0

50

100

150

200

250

300

350

Distiled Water Flux Average

Wastewater Flux

Post Alkaline

Cleaning

After Acidic and

Alkaline Cleaning

Flu

x (

L/m

2.h

)

Fouling and Cleaning- Ultrafiltration Membranes

UFX10

ETNA01

ETNA10

37

Figure 13- UF permeate flux during filtration

The ETNA01 membrane exhibited the best results in terms of separation, reducing the COD

and TOC value by 22 and 26% respectively. This result was expected due to the ETNA01

membranes having the lowest MWCO and therefore smaller pore size, which allow for less

contaminant to pass through. Figure 14 summarizes the TOC and COD removal rates of the

studied membranes.

Figure 14- Separation Efficiency for UF membranes

To sum up, the UFX10pHt membrane provided the overall best results with respect to average

operating flux, separation efficiency and fouling rate. The low removal rates observed with

ETNA10 and high fouling rates of ETNA01 made them inappropriate choices for this

wastewater. The data used for comparison of the UF membrane experiments are summarized

in Table 9. Therefore, the UFX10pHt membrane was used in the follow-up experiments

performed as the most appropriate ultrafiltration membrane.

0

50

100

150

200

0 15 30 45 60 75 90 105 120

Flu

x (

L/m

2.h

)

Time (min)

Flux over Time - Ultrafiltation Membranes

UFX10

ETNA01

ETNA10

COD: 311 mg/l

TOC: 91 mg/l

COD: 214 mg/l

TOC: 67 mg/l UFX10

COD: 312 mg/l

TOC: 94 mg/l COD: 211 mg/l

TOC: 65 mg/l ETNA01

COD: 314 mg/l

TOC: 95 mg/l COD: 235 mg/l

TOC: 63 mg/l ETNA10

38

Table 9- Summary of UF membranes results on wastewater effluent

Characteristic UFX10pHt ETNA01 ETNA10

Average Permeate Flux(L/m2.h) 68 54 86

Flux recovery after cleaning (%) 86 43 95

COD removal (%) 31 32 25

TOC removal (%) 26 30 34

The experiments also concluded that ultrafiltration by itself is not an appropriate separation

method, as it does not provide the permeate COD levels required to replace the freshwater

intake. Membranes with lower MWCOs such as nano-filtration or reverse osmosis are therefore

required to achieve the water quality required.

39

Pretreatment Methods for Wastewater Effluent

Due to the high fouling tendencies of reverse osmosis membranes, a pretreatment method is

required to reduce the fouling rate to keep the membrane lifetime at an acceptable rate. Several

methods, including membranes, screens, centrifuges, and flocculation were investigated. The

pre-treated water was then filtered via different reverse osmosis membranes under the same

operating conditions. An optimum scenario would be one where the pretreatment method is

upscaleable whilst simultaneously decreasing fouling rates in the RO membrane. Investment

and operating costs, energy usage and separation efficiency are also important factors which

need to be taken into consideration.

It should also be noted that the wastewater used for the MF pretreatment was collected at the

plant on a different date than the wastewater used in the other experiments. The first batch of

wastewater had higher contamination levels, the data has been shown in Table 8. The removal

rates have hence been reported as percentages as well as mg/l for better comparison.

Microfiltration pretreatment and reverse osmosis

Microfiltration membranes were applied as a pretreatment step to investigate their performance.

The FS40PP membrane was utilized for this purpose due to previous experience and

experiments conducted at RISE with the M20 device. The characteristics of the FS40PP

membrane were presented in Table 4. A pressure difference of 0.8 bars was observed, with 1.4

bar at the feed and 2.2 bars at the permeate outlet. The water flux reduced from 122 to 69 L/m2.h

after filtration and chemical cleaning was performed on the membrane. This indicates a high

fouling rate and also demonstrates that the fouling is irreversible. Furthermore, the acidic

cleaning did not have any effect on recovering the flux. Figure 15 displays the flux

measurements during the experimental procedure.

Figure 15- FS40PP membrane Fouling and Cleaning Flux- Wastewater effluent with no pretreatment

122

5569 69

0

50

100

150

200

250

300

350

Distiled Water Flux Average Wastewater

Flux

Post Alkaline Cleaning After Acidic and

Alkaline Cleaning

Flu

x (

L/m

2.h

)

Fouling and Cleaning- FS40PP membrane

40

To further investigate the fouling conditions in the FS40PP membranes, the used and dried

membrane was put under a microscope to examine the pores. As can be seen in the photos, the

membrane has experienced irreversible fouling and pore closures.

Figure 16- FS40PP membrane after filtration and cleaning

The flux measurement over time exhibits a steadily decreasing trend as expected, however, the

flux remains almost constant in the last hour of the experiment. The average permeate flux is

55 L/m2.h, decreasing from 70 to 50 L/m2.h during the two-hour filtration period.

Figure 17- FS40PP membrane - Flux over time - Wastewater effluent with no pretreatment

The membrane is used as a pretreatment step for a reverse osmosis membrane and the separation

efficiency is not regarded as the most important factor. Regardless, the membrane decreases

COD and TOC levels by 15 and 12% respectively. The most important thing, however, is the

decrease of suspended solids to almost zero, which subsequently will reduce fouling in the

reverse osmosis membranes in the next step.

Figure 18- Separation Efficiency for MF pretreatment- Wastewater effluent with no pretreatment

0

50

100

150

200

0 15 30 45 60 75 90 105 120

Flu

x (

L/m

2.h

)

Time (min)

Flux over Time - FS40PP Membranes

FS40PP

COD: 301 mg/l

TOC: 84 mg/l COD: 257 mg/l

TOC: 74 mg/l FS40PP

41

The MF membrane permeate was collected and filtered through the reverse osmosis membrane

afterward. Two different RO membranes were studied and their characteristics were exhibited

in Table 2. The operating pressure was kept at approximately 35 bars and 25 oC and all flux

measurements were conducted under the same exact conditions.

The RO90 membrane demonstrated more reversible fouling than the RO98 and the original flux

was recovered by 77% by the RO90 membrane, compared to 54% in the RO98. Furthermore,

acidic cleaning did not have a noteworthy effect on recovering the flux.

Figure 19- MF pretreatment + RO - Fouling and Cleaning- Wastewater effluent

The RO90 membrane exhibited a decreasing flux over the course of the experiments, decreasing

from 129 to 58 L/m2.h. The RO98 experiences an unexplained sudden flux increase after the

first hour but experiences a decreasing trend at all other times. The RO98 had a higher average

wastewater flux than the RO90. The permeate flux over time is exhibited in Figure 20.

217

84

167 160

186

92 95 101

0

50

100

150

200

250

300

350

Distiled Water

Flux

Average

Wastewater Flux

Post Alkaline

Cleaning

After Acidic and

Alkaline Cleaning

Flu

x (

L/m

2.h

)

Fouling and Cleaning- MF pretreatment +RO

(FS40)+RO90

(FS40)+RO98

42

Figure 20-Flux over time - MF pretreatment +RO - Wastewater effluent

The RO90 membrane was far more effective in reducing contamination levels, decreasing both

COD and TOC levels by 75%. Whereas the RO98 membrane proved far less effective,

decreasing COD and TOC values by 50 and 39 % respectively. Despite the information

provided by the manufacturers manual that the RO98 should provide a more efficient

separation, this was not the case with this wastewater. The reason for this could be the

membrane active-layer polymers, namely the polysulphone, or the hydrophilic nature of the RO98

membrane, which will be explained more in detail in the discussion section.

Figure 21- Separation Efficiency for RO membranes with MF pretreatment - Wastewater effluent

0

50

100

150

200

0 15 30 45 60 75 90 105 120

Flu

x (

L/m

2.h

)

Time (min)

Flux over time - MF pretreatment +RO

(FS40)+RO90

(FS40)+RO98

COD: 301 mg/l

TOC: 84 mg/l FS40PP RO90

COD: 257 mg/l

TOC: 74 mg/l COD: 60 mg/l

TOC: 19 mg/l

COD: 301 mg/l

TOC: 84 mg/l FS40PP RO90

COD: 257 mg/l

TOC: 74 mg/l COD: 120 mg/l

TOC: 45 mg/l

43

Screen and ultrafiltration pretreatment in combination with reverse osmosis

The next pretreatment method used was a combination of a screen and an ultrafiltration

membrane. The nylon mesh screen had a pore size of 70 µm and was designed to remove

suspended solids. However, when filtering the wastewater through the screen, it was observed

that the screen clogged up extremely fast, which would be problematic at higher scales. Further

analysis also showed that suspended solid levels had only dropped by half, being reduced from

16 to 8 mg/l. Figure 22 shows the suspended solids clogging up the screen. However, the screen

clogging was reversible and the screen could be used for filtration again after physical cleaning

using water. Therefore, an additional pretreatment step, ultrafiltration with UFX10, was utilized

to further reduce contaminants.

Figure 22- Screen clogging on the Wastewater effluent

Applying the screen before the UFX10 did not seem to have much effect, compared to when

the screen was not used, as the same flux recovery was observed as previous experiments. The

average wastewater flux did increase, however, which may be an indication of lower fouling

levels. Furthermore, the membrane experienced a much lower flux decline during filtration.

The screen decreased the COD levels from 229 to 219 mg/l and the UFX10 membrane further

decreased them to 169 mg/l. The graphs for the fouling and cleaning, permeate flux over time

and separation can be found in Appendix A.

The results demonstrated a similar trend to the previous experiments. As can be seen in Figure

23, the RO90 membrane exhibited higher flux recoveries as opposed to the RO98, with 64 and

47 % respectively. Furthermore, acidic cleaning did not have a noteworthy effect on recovering

the flux in neither scenario.

The RO98 membrane displayed higher permeate flux levels than the RO90 but was unable to

perform separation efficiently. The RO90 also experienced a lower flux drop within the two-

hour filtration period. The results of these experiments are shown in Figure 23 and Figure 24.

44

Figure 23- Fouling and Cleaning- (Screen + UFX) +RO90- Wastewater effluent

Figure 24- Flux over time Screen and UFX10 pretreatment + Reverse Osmosis membranes- Wastewater effluent

In concurrent with previous results, the RO90 proved to be more efficient in reducing the

contamination levels than the RO98. The RO90 membranes decreased COD and TOC levels

by 60 and 48 %, whereas the RO98 decreased them by 54 and 46 % respectively.

Figure 25-Separation Efficiency for RO membranes with Screen and UF pretreatment- Wastewater effluent

252

104

159 164

321

123152 152

0

50

100

150

200

250

300

350

Distiled Water

Flux

Average

Wastewater

Flux

Post Alkaline

Cleaning

After Acidic and

Alkaline

Cleaning

Flu

x (

L/m

2.h

)Fouling and Cleaning- (Screen+UFX)+RO

(SCREEN+UFX)+RO90

(SCREEN+UFX)+RO98

0

50

100

150

200

0 15 30 45 60 75 90 105 120

Flu

x (

L/m

2.h

)

Time(min)

Flux over time - (Screen+UFX)+RO

(SCREEN+UFX)+RO90

(SCREEN+UFX)+RO98

COD: 196 mg/l

TOC: 58 mg/l

Screen + UFX RO90 COD: 171 mg/l

TOC: 45 mg/l COD: 69 mg/l

TOC: 24 mg/l

COD: 196 mg/l

TOC: 58 mg/l

Screen + UFX RO98 COD: 173 mg/l

TOC: 46 mg/l COD: 80 mg/l

TOC: 26 mg/l

45

Centrifugation pretreatment and reverse osmosis

Centrifugation was the next pretreatment step that was applied to examine its effects to counter

fouling and increase flux recoveries. The contaminants settled as a brown and black sluggish

compound. The water was then decanted and the suspended solids appeared to have plummeted

down from 16 mg/l to less than 1 mg/l. Figure 26 illustrates the water settling after the

centrifugation has taken place. The pretreatment step did not significantly reduce COD and

TOC levels, by only 5 and 2 % respectively but removed all suspended solids.

Figure 26- Centrifuged sample

The centrifuged and decanted wastewater was then filtered through both RO membranes to

compare flux, fouling, and separation. As previously seen in earlier experiments, the RO90

membrane exhibited better results in terms of separation and flux recovery. Both membranes

had a flux recovery of approximately 73 %. The results are summarized in Figure 27.

Figure 27- Fouling and Cleaning- Centrifuge pretreatment +RO- Wastewater effluent

290

98

193209

319

143

210233

0

50

100

150

200

250

300

350

Distiled Water

Flux

Average

Wastewater

Flux

Post Alkaline

Cleaning

After Acidic and

Alkaline

Cleaning

Flu

x (

L/m

2.h

)

Fouling and Cleaning- Centrifuge

pretreatment+RO

(CENTRIFUGE)+RO90

(CENTRIFUGE)+RO98

46

Both membranes exhibited a decreasing flux during their experiments, with the RO98 having a

much higher average permeate flux than the RO90. The permeate flow versus time is illustrated

in Figure 28.

Figure 28-Flux over time - Centrifuge pretreatment + RO- Wastewater effluent

The RO90 exhibits the best results, reducing COD and TOC levels by 74 and 63 % respectively,

while the RO98 removes less contamination, reducing the levels only by 45 and 17 %,

respectively.

Figure 29-Separation Efficiency for RO membranes with centrifuge pretreatment- Wastewater effluent

0

50

100

150

200

0 15 30 45 60 75 90 105 120

Flu

x (

L/m

2.h

)

Time(min)

Flux over time - Centrifuge pretreatment+RO

(CENTRIFUGE)+RO90

(CENTRIFUGE)+RO98

COD: 196 mg/l

TOC: 58 mg/l Centrifuge RO90

COD: 186 mg/l

TOC: 57 mg/l COD: 42 mg/l

TOC: 18 mg/l

COD: 196 mg/l

TOC: 58 mg/l Centrifuge RO98

COD: 186 mg/l

TOC: 57 mg/l COD: 80 mg/l

TOC: 35 mg/l

47

Flocculation pretreatment and reverse osmosis

The optimum flocculation for the wastewater was identified was the addition of 0.2 grams AVR

per litre of wastewater. The AVR was added in the form of 4 ml of a 50g/l AVR in water

solution. The top 75 % of the water content was then decanted and filtrated through the

membrane. The pretreatment step reduced the COD and TOC levels to 177 mg/l and 49 mg/l.

The permeate was then filtrated through the RO90 membrane for a two-hour period. A flux

recovery rate of 72% after filtration and cleaning was measured, indicating an average fouling

ratio. The RO98 membrane was not used for the flocculation experiments, due to the lack of

wastewater available as well as its poor performance in previous experiments.

Figure 30-Fouling and Cleaning- (Flocculation) + RO90- Wastewater effluent

During the filtration period, membrane fouling caused the flux to be reduced to approximately

half of its starting value, dropping to 63 from 125 L/m2.h. The average permeate flux was

measured as 85 L/m2.h.

248

85

172 179

0

50

100

150

200

250

300

350

Distiled Water

Flux

Average

Wastewater Flux

Post Alkaline

Cleaning

After Acidic and

Alkaline

Cleaning

Flu

x (

L/m

2.h

)

Fouling and Cleaning- (Flocculation) + RO90

(Flocculation) + RO90

48

Figure 31- Flux over time (Flocculation) + RO90- Wastewater effluent

The RO90 membrane further decreased the COD and TOC levels by 75 and 64 % respectively.

Figure 32-Separation Efficiency for RO membranes with flocculation pretreatment on Wastewater effluent

0

50

100

150

200

0 15 30 45 60 75 90 105 120

Flu

x (

L/m

2.h

)

Time(min)

Flux over time (Flocculation) + RO90

(Flocculation) + RO90

COD: 199 mg/l

TOC: 59 mg/l Flocculation RO90

COD: 177 mg/l

TOC: 49 mg/l COD: 40 mg/l

TOC: 17 mg/l

49

Spray water PM-3

The process water used as spray-water in the paper machine, called PM-3, was also examined

as a possible point for membrane installation in the tissue mill. The stream used is the spray-

water tank effluent which is fed to the scrubber, which has had problems in recent years causing

the scrubber to be shut down. The water was analysed and filtrated through four different UF

and RO membranes with the same experimental procedure as before, except acidic cleaning

was not performed. Due to the inefficient results attained from the ETNA01, only the results

for UFX, RO90, and RO98 will be reported in this section.

The PM-3 process water contained fibres of various sizes, which may have caused pore

clogging and fouling during the filtration. Microscopic pictures of the membrane are provided

in Figure 33

Figure 33- Microscopic pictures of RO90 membranes with Process water PM-3

The UFX10 membrane had the highest flux recovery rate with 89%, followed by RO90 and

RO98 with 65 and 60 % respectively, which is concurrent with the results obtained in other

experiments. The results for flux measurements are summarized in Figure 34.

Figure 34- Fouling and Cleaning- PM-3 Process water-

172

94

153

241

77

147

212

81

134

0

50

100

150

200

250

300

350

Pre water circulation Wastewater Flux Post alkaline cirucaltion

Flu

x (

L/m

2.h

)

Fouling and Cleaning- PM-3

UFX10

RO90

RO98

50

Figure 35 shows the permeate flux over the course of the filtration period. The UFX10 has the

highest average flux and the least flux decline over the course of the experiment. The RO98 has

a higher average flux than the RO90 but have similar flux declines during the filtration process.

It should be noted that flux measurement for the UFX membranes was done at different

operating conditions than the reverse osmosis membranes.

Figure 35- Flux over time- PM-3 Process water

In terms of separation, the RO90 was the most effective membrane with reducing COD and

TOC levels by 77 and 75 %, while the RO98 removed 74 and 70 %. As expected, the UFX

membrane was not as effective as the osmosis membrane, decreasing the levels by 38 and 41

%, respectively.

Figure 36- Separation efficiency for membranes with PM-3 process water

0

50

100

150

200

0 15 30 45 60 75 90 105 120

Flu

x (

L/m

2.h

)

Time(min)

Flux over time- PM-3

UFX10

RO90

RO98

COD: 560 mg/l

TOC: 196 mg/l

COD: 348 mg/l

TOC: 117 mg/l UFX10

COD: 566 mg/l

TOC: 186 mg/l COD: 132 mg/l

TOC: 47 mg/l RO90

COD: 581 mg/l

TOC: 189 mg/l COD: 153 mg/l

TOC: 57 mg/l RO98

51

Process water PM-4

The next process water stream investigated is related to the paper-machine PM-4. The stream

has passed a flotation tank and it will then be fed to the spray-water tank. Polymers are also

introduced to the flotation tank and sludge is discharged. The sample water was chemically

analysed and filtrated through UF and RO membranes under the same experimental procedure

described as before, except acidic cleaning was not performed.

The UFX10 membrane exhibited superior results in terms of flux recovery, with almost 88%

while the RO90 showed 60% flux recovery. The values for flux measurements are presented in

Figure 37Figure 37- Fouling and Cleaning- PM-4.

Figure 37- Fouling and Cleaning- PM-4

Figure 38 shows the permeate flux during the two-hour filtration period. Both membranes have

a similar average flux over the course of the experiment. The RO90 has a higher flux decline

than the UFX10. It should be noted that flux measurement for the UFX membranes was done

at different operating conditions than the reverse osmosis membranes.

145

92

131

274

94

164

0

50

100

150

200

250

300

350

Pre water circulation Wastewater Flux Post alkaline cirucaltion

Flu

x(L

/m2.h

)

Fouling and Cleaning- PM-4

UFX10

RO90

52

Figure 38- Flux over time- PM-4

The RO90 membrane was able to remove 73 % of the COD, while the UFX could only remove

30 %, respectively.

Figure 39- Separation efficiency for membranes with PM-4 process water

0

50

100

150

200

0 15 30 45 60 75 90 105 120

Flu

x(L

/m2.h

)

Time (min)

Flux over time- PM-4

UFX10

RO90

COD: 646 mg/l

COD: 455 mg/l

UFX10

COD: 591 mg/l COD: 160 mg/l RO90

53

Discussion

Tertiary Circuit

In the result section, the data gathered from various pretreatment methods coupled with reverse

osmosis filtration data was presented. The goal of the project is to replace a portion of the

freshwater intake from the Kisa River with the membrane permeate. According to Sofidel AB,

the freshwater intake from the Kisa River has an average COD of 30 mg/l, which was defined

as the goal of the project.

Microfiltration, screen, and ultrafiltration, centrifuge and flocculation were performed and

compared with each other as pretreatment steps. The pre-treated samples were then filtrated

using two different reverse osmosis membranes, RO90 and RO98. A discussion and comparison

of the aforementioned technologies are presented below.

Membrane Comparison

Among the reverse osmosis membranes, the RO90 membrane provided much better results in

terms of separation than the RO98. This can be attributed to the RO98 membrane’s chemical

composition, given that the RO98 membrane has a polypropylene support, compared with the

polyester support in the RO90. The polypropylene support is by far more durable and resistant

towards chemical, pH and a wide range of solvents, but faces problems due to it’s the

hydrophilic characteristics. The wettability of the propylene surface is low and adhesion does

not occur efficiently between the selective and supporting layer. These explanations are based

on the fact that the experimental procedure was consistent throughout and all other parameters,

such as surface area, temperature, operating pressure and transmembrane pressure were kept

constant throughout the process, and no other characteristic dissimilarity was observed [7].

The RO90 membrane exhibited lower fluxes during filtration in all experiments. The results

from various other experiments performed in the literature [10, 27, 36, 37] indicate that the

polyester supports typically present in thin-film composite (TFC) reverse osmosis membranes

do not fully wet when exposed to water, causing a decrease in permeate flux.

The time-interval flux measurements indicated varying degrees of decline in flux levels over

the course of the experiment. This can be attributed to the level of fouling within the membrane.

The nature of the fouling and whether or not it is irreversible can be determined via comparing

the flux of distilled water before the filtration and after the filtration and chemical cleaning step

has taken place.

The more precise method to determine fouling levels and their nature would be to compare the

average permeate flux during several filtration steps. This was performed once with the RO90

membranes and it was observed that the decline in distilled water flux was much less severe

when wastewater samples were filtered (see Appendix C). This was not performed in all cases,

however, due to time limitations and cost of transporting wastewater to the laboratory.

54

Chemical cleaning was performed to decrease the fouling levels and recover the flux as close

to the original flux as possible. As previously discussed in the literature review section, mixtures

of alkaline substances and surfactants are commonly used to remove biological contaminants,

whereas acidic substances are utilized to remove the organic pollutants. The nature of the

contaminants in the studied wastewater was identified as biological, which is also apparent in

the higher efficiency of the alkaline cleaning step on the membrane flux recovery compared to

the acidic cleaning step. A numerical comparison between the membranes based on results from

the experiments is presented in Table 10.

Table 10- Comparison of the reverse osmosis membranes for wastewater effluent treatment

Pretreatment Method RO90 RO98

Average Flux (L/m2.h)

Microfiltration 84 92

Screen and UF 104 123

Centrifuge 98 143

Flocculation 85 NA

Flux Recovery (%)

Microfiltration 74 54

Screen and UF 65 47

Centrifuge 73 73

Flocculation 72 NA

COD Separation

(%)

Microfiltration 75 50

Screen and UF 46 36

Centrifuge 74 45

Flocculation 75 NA

Pretreatment Method Comparison

Due to the nature of the reverse osmosis process and the fouling tendencies observed in

membranes, a pretreatment step was required to reduce contamination levels, specifically to

annihilate the suspended solids. Given that the wastewater effluent had already passed an

extensive biological treatment process, the remaining contaminants are troublesome to remove.

Various methods were found in literature studies and tested in the laboratory, including

membrane filtrations, centrifugation, and flocculation.

The microfiltration membranes proved to exhibit high fouling tendencies when used as a

pretreatment step. The fouling can be categorized as irreversible since chemical cleaning was

not sufficient in removing contaminants, and a very low flux recovery rate was observed. The

high fouling levels observed at laboratory scale question the process’s up-scalability.

Furthermore, the low average permeate flux in the membrane meant that the process would

require a higher investment cost. Despite the disadvantages, the pretreatment provided superior

separation compared to other pretreatments. The permeate of the microfiltration membrane also

displayed lower fouling and contamination levels when used in the reverse osmosis process.

55

The screen was also not suitable for removing the suspended solids. As well as the problems

mentioned before when upscaling that process, the filtered water was still contaminated. This

shows that there are suspended solids within the wastewater which are smaller than 70 µm since

that was the mesh pore size. The high variations in the size of the suspended solids may be a

reason for the complications. After contact with the mill, it was revealed to us that a company

had previously opted to utilize several types of screens to treat the same wastewater at a pilot

scale, and had largely been unsuccessful as well.

The ultrafiltration membranes performed better in terms of fouling levels and exhibited much

higher flux recoveries. Chemical cleaning steps showed that fouling seemed to be more

reversible in nature, increasing the processability of the technology. The average permeate flux

was also higher in ultrafiltration compared to microfiltration, as was the contamination

separation rate. However, the permeate exhibited lower flux recovery ratios in the reverse

osmosis step. These issues can lead to concerns regarding fouling and low membrane lifetime

higher scales.

Centrifuges were also applied as a pretreatment step due to their ability in removing suspended

solids. The technology is energy intensive in nature and may seem excessive. However, since

the designed technology would only be required only at certain points of the year, the solution

may be reasonable. The process was performed at lab scale and attaining similar results at

higher scales may be in question. The effluent of the centrifuge performed better than other

technologies in the reverse osmosis membrane in terms of flux recoveries and separations, also

displaying a higher average permeate flux.

Flocculation was another pretreatment step that was utilized due to its availability within the

mill as well as its ability to remove suspended solids. The technology is adaptable to various

conditions and requires far less operating costs and is easily up-scalable. The effluent performed

well, almost as good as the centrifuge, in terms of flux recoveries and contaminant separation.

Table 11- Comparison of various pretreatment methods (Average value for RO90 and RO98 membranes)

Microfiltration

Screen and

UF Centrifuge Flocculation

RO90

Average Flux

(L/m2.h) 88 114 121 85

Flux Recovery

(%) 64 56 73 72

COD Separation

(%) 63 41 60 75

RO98

Average Flux

(L/m2.h) 92 123 143 -

Flux Recovery

(%) 54 47 73 -

COD Separation

(%) 50 36 45 NA

Primary Circuit

56

Ultrafiltration and reverse osmosis membranes were used on process waters in the paper

machine, without any pretreatment. The goal in this round of experiments was to use membrane

filtration as a kidney, to purify water to avoid contamination buildup within the process. The

water permeate can then circulated for various applications, such as the scrubber. The retentate

from the membrane can also be directed towards the wastewater treatment plant. Given that the

mill did not provide any information on what quality requirements are expected, no further

discussion can be made on the results. Table 12 summarizes the results from the process water

membrane filtration

Table 12- Comparison of the reverse osmosis membranes for wastewater effluent treatment

Pretreatment Method UFX10 RO90 RO98

Average Flux (L/m2.h) PM-3 94 77 81

PM-4 92 94 -

Flux Recovery (%) PM-3 89 64 63

PM-4 90 60 -

COD Separation

(%)

PM-3 38 77 74

PM-4 28 77 -

Other Experiments

Several follow-up experiments were performed to examine other aspects of the membrane

filtration process. An experiment was performed to determine the effect of several rounds of

cleaning and wastewater filtration. The experiment showed that despite the high decline in

distilled water flux, the average permeate flux did not decrease as drastically. A similar

experiment was performed using saltwater, which provided similar results. This proves that the

methodology of calculating flux recovery for determining fouling levels may not be entirely

valid in reverse osmosis membranes.

Another experiment was performed to see the trend of contaminants in the permeate evolve

over time. COD and TOC levels had a decreasing trend over the course of the filtration period.

This can be due to the fact that the feed sample has been diluted since a permeate sample has

been taken, or can indicate the accumulation of fouling on the membrane surface.

57

Economic Calculations

Membrane technology offers several advantages over conventional water and wastewater

treatment processes including better standards, reduced environmental impact of effluents,

reduced land requirements and the potential for mobile treatment units. Despite the merits, the

use of membranes is currently limited by the high capital and operating costs with which they

are associated. The main components of the cost of membrane treatment are capital cost,

membrane replacement, energy usage, labour, cleaning, and maintenance. The capital cost is

the sum of membrane units cost and the non-membrane units. The non-membrane cost includes

all mechanical and electrical items, control equipment, piping and associated civil engineering

costs[38]. This thesis will not cover the non-membrane cost.

The economic calculations will include the fixed capital cost (FCI) and total capital investment

(TCI) for the membrane filtration of the incoming wastewater. To determine the FCI and TCI,

the purchase cost for all equipment needs to be calculated. All other costs that add to the needed

investment are determined by using factors of the purchase cost.

The economic calculations in this section will only cover the cost of membrane purchase and

installation and will not cover the pretreatment method. The cost for pumps and %ages applied

for different equipment are based on guidelines provided by ÅF. The cost for membrane

investment and operating energy required are also based on inquiries made from AlfaLaval

Nakskov A/S in Denmark.

To determine the cost of the membrane, the most important defining factor is the surface area

required. Based on all the experiments conducted, an average flux was considered for both UF

and RO membranes as 138 and 92 L/m2.h respectively. As previously mentioned, the aim of

the project was to reduce freshwater consumption by 100 m3. The surface area required for the

filtration can then be calculated as:

𝑈𝐹 ∶ 100 𝑚3

𝑑𝑎𝑦∗

1 𝑑𝑎𝑦

24 ℎ∗

𝑚2. ℎ

138 𝐿∗

1000 𝐿

1 𝑚3= 30 𝑚2

𝑅𝑂: 100 𝑚3

𝑑𝑎𝑦∗

1 𝑑𝑎𝑦

24 ℎ∗

𝑚2. ℎ

92 𝐿∗

1000 𝐿

1 𝑚3= 45 𝑚2

Due to the technical uncertainties and the fact that the feed will not fully pass the membrane,

30% is added to the required surface area, making it 40 and 60 m2 for ultrafiltration and reverse

osmosis respectively.

Based on contacts and emails with AlfaLaval, prices and energy consumptions for 8.0” spiral

wound plug flow plants were estimated, which are summarized in Table 13. It should be noted

that the cost refers to DAP (Delivery at point) at AlfaLaval Nakskov and does not include

shipping and freight costs.

58

Table 13- Cost estimations for membranes

Membrane Type Surface Area

(m2)

Price

(kEur)

Energy

Consumption

(kW/m3 permeate)

Ultrafiltration 40 195 1-4

Reverse Osmosis 30 250 8-12

59

Conclusion

The aim of this study was to discuss the technical feasibility when using membranes to reduce

the water consumption within a tissue mill in Kisa. The main focus of the experiment was on

filtering and recirculating the wastewater effluent to replace part of the freshwater intake.

Additional experiments were also performed on process waters in the tissue-production process.

The experiments showed that a pretreatment step coupled with reverse osmosis could be used

for the tertiary water circuit. The high water flux and shear rates require a membrane module

that can embody high surface areas, therefore a spiral wound module should be utilized. Spiral

wound modules are more prone to fouling, which means the pretreatment technique has to work

efficiently in reducing contaminants which may cause fouling.

Several different pretreatment steps and different reverse osmosis membranes were tested on a

lab-scale. It was concluded that centrifugation, flocculation, and membrane pretreatment are all

feasible scenarios, each with their own merits and faults, which have examined in the discussion

section. Flocculation can be assumed as the most appropriate method, given the better

performance.

The RO90 membrane proved far more efficient than other membranes, both in terms of

separation and flux recovery, but experienced a lower average flux. This can be attributed to

the polyester support on TFC, and its respective properties such as low wettability. UFX10 and

RO98 did not provide sufficient separation and RO98 also exhibited high fouling levels The

cleaning procedure was typically comprised of both alkaline and acidic cleaning. The flux

recoveries were used to compare the fouling levels. The alkaline cleaning step was also far more

effective, indicating the wastewater contaminants are biological in nature.

The experiments also showed that ultrafiltration and reverse osmosis can be used as kidneys for

the paper machine, depending on what quality of water is needed for which specific application.

60

Future Work

Further experiments are required to determine the optimum operating conditions of the

membranes used in the project.

The author would recommend using more variety of different process waters, namely

the effluent of the flocculation tank.

Additional experiments need to be conducted to determine the optimum cleaning

process and operation.

To determine long-term effects of fouling, longer trials with cleaning steps in between

are required.

The use of the system as a continuous device, as opposed to the batch recirculation mode

in these experiments.

61

References

[1] A. Basile, A. Cassano, and K. Rastogi Navin, Membrane Technologies for Water

Treatment and Reuse in the Pulp and Paper Industries. Elsevier, 2015, pp. 1-1.

[2] N. L. Le and S. P. Nunes, "Materials and membrane technologies for water and energy

sustainability," Sustainable Materials and Technologies, vol. 7, pp. 1-28, 2016/04/01/

2016.

[3] R. Singh, "Chapter 2 - Water and Membrane Treatment," in Membrane Technology and

Engineering for Water Purification (Second Edition), R. Singh, Ed. Oxford:

Butterworth-Heinemann, 2015, pp. 81-178.

[4] P. Bajpai, "Chapter 7 - Emerging Technologies for Wastewater Treatment," in Pulp and

Paper Industry: Elsevier, 2017, pp. 93-179.

[5] H. Shon, S. Vigneswaran, J. Kandasamy, and J. Cho, "Membrane technology for

organic removal in wastewater," 2002.

[6] U. o. N. S. Wales. (2018, June 6th). Chapter 19 Membrane Filtration [Course

homework CEIC 8341 Membrane Processes].

[7] Jørgen Wagner, Membrane Filtration Handbook Practical Tips and Hints. 2001.

[8] A. Sagle and B. Freeman, "Fundamentals of membranes for water treatment," The future

of desalination in Texas, vol. 2, no. 363, p. 137, 2004.

[9] S. S. Madaeni, N. Ghaemi, and H. Rajabi, "1 - Advances in polymeric membranes for

water treatment," in Advances in Membrane Technologies for Water Treatment, A.

Basile, A. Cassano, and N. K. Rastogi, Eds. Oxford: Woodhead Publishing, 2015, pp.

3-41.

[10] B. Khorshidi, T. Thundat, B. Fleck, and M. Sadrzadeh, "Thin film composite polyamide

membranes: parametric study on the influence of synthesis conditions," RSC Advances,

vol. 5, no. 68, pp. 54985-54997, 2015.

[11] Polymer Database, Accessed 6-Jun 2018. Available: polymerdatabase.com

[12] M. G. Marco Mazzotti, Federico Milella, Paolo Gabrielli, "MEMBRANE

SEPARATIONS: RATE CONTROLLED SEPARATION PROCESSES."

[13] "Membrane Separation Processes, 3. Membrane Preparation and Membrane Module

Constructions," in Ullmann's Encyclopedia of Industrial Chemistry.

[14] R. Field and J. J. Wu, Fundamentals of Crossflow Microfiltration. Elsevier Inc., 2013.

[15] S. R. Holman and K. N. Ohlinger, "An evaluation of fouling potential and methods to

control fouling in microfiltration membranes for secondary wastewater effluent,"

Proceedings of the Water Environment Federation, vol. 2007, no. 11, pp. 6417-6444,

2007.

[16] J. M. Arnal, B. Garcia-Fayos, and M. a. Sancho, "Membrane cleaning," in Expanding

issues in desalination: InTech, 2011.

[17] M. Mänttäri and M. Nyström, "Membrane filtration for tertiary treatment of biologically

treated effluents from the pulp and paper industry," vol. 55, ed, 2007, pp. 99-107.

[18] J. Bucht, "Fouling and Cleaning During Treatment of Thermomechanical Pulp Mill

Process Water," 2015.

[19] K. Gaid, "A large review of the pre treatment," in Expanding Issues in Desalination:

InTech, 2011.

[20] R. Field, "Fundamentals of fouling," Membranes for water treatment, vol. 4, pp. 1-23,

2010.

[21] H. Jung and D. Pauly, "Water in the pulp and paper industry," 2011.

62

[22] B. Simstich, "Membrane technology for the future treatment of paper mill effluents:

chances and challenges of further system closure," Water Science and Technology, vol.

62, no. 9, pp. 2190-2197, 2010.

[23] R. Toczyłowska-Mamińska, "Limits and perspectives of pulp and paper industry

wastewater treatment – A review," Renewable and Sustainable Energy Reviews, vol.

78, pp. 764-772, 2017.

[24] P. Bajpai, "Chapter 5 - Reduction of Water Consumption in Pulp and Paper Mills," in

Pulp and Paper Industry: Elsevier, 2017, pp. 55-69.

[25] P. Bajpai, "Chapter 4 - Water Usage in the Pulp and Paper Processes," in Pulp and Paper

Industry: Elsevier, 2017, pp. 37-53.

[26] P. Bajpai, Environmentally friendly production of pulp and paper. John Wiley & Sons,

2011.

[27] R. Saranya, G. Arthanareeswaran, and D. D. Dionysiou, "Treatment of paper mill

effluent using Polyethersulfone/functionalised multiwalled carbon nanotubes based

nanocomposite membranes.(Report)," Chemical Engineering Journal, vol. 236, p. 369,

2014.

[28] Z. B. Gönder, S. Arayici, and H. Barlas, "Advanced treatment of pulp and paper mill

wastewater by nanofiltration process: Effects of operating conditions on membrane

fouling," Separation and Purification Technology, vol. 76, no. 3, pp. 292-302, 2011.

[29] U. Hamm and S. Schabel, "Effluent-free papermaking: industrial experiences and latest

developments in the German paper industry," Effluent-free papermaking: industrial

experiences and latest developments in the German paper industry, vol. 55, no. 6, pp.

205-211, 2007.

[30] M. Mänttäri, M. Kallioinen, A. Pihlajamäki, and M. Nyström, "Industrial membrane

processes in the treatment of process waters and liquors," Water Science and

Technology, vol. 62, no. 7, pp. 1653-1660, 2010.

[31] AlfaLaval, "LabStack M20 Manual for users," ed.

[32] A. Laval. (9 June 2018). TestUnit M20. Available:

https://www.alfalaval.com/products/separation/membranes/standalone-pilot-

plants/testunit-m20/

[33] R. R. Himebaugh and M. J. Smith, "Semi-Micro Tube Method for Chemical Oxygen

Demand," Analytical Chemistry, vol. 51, no. 7, pp. 1085-1087, 1979.

[34] D. Florescu, A. M. Iordache, D. Costinel, E. Horj, R. E. Ionete, and M. Culea,

"Validation procedure for assessing the total organic carbon in water samples."

[35] F. Wilde and J. Gibs, "Turbidity," US Geological Survey TWRI Book, vol. 9, 1998.

[36] M. Pizzichini, C. Russo, and C. D. Meo, "Purification of pulp and paper wastewater,

with membrane technology, for water reuse in a closed loop," Desalination, vol. 178,

no. 1, pp. 351-359, 2005.

[37] S. K. Shukla, V. Kumar, and M. Bansal, "Treatment of combined bleaching effluent by

membrane filtration technology for system closure in paper industry," Desalination and

water treatment, vol. 13, no. 1-3, pp. 464-470, 2010.

[38] G. Owen, M. Bandi, J. Howell, and S. Churchouse, "Economic assessment of membrane

processes for water and waste water treatment," Journal of membrane science, vol. 102,

pp. 77-91, 1995.

A

Appendix A - Screen and UFX Pretreatment

The graphs for the fouling, cleaning and permeate flux over time for the screen and UFX

pretreatment method are exhibited below. It should be noted that the screen decreased the COD

levels from 229 to 219 mg/l

202

138

171 174

0

50

100

150

200

250

300

350

Distiled Water

Flux

Average

Wastewater Flux

Post Alkaline

Cleaning

After Acidic and

Alkaline Cleaning

Flu

x (

L/m

2.h

)

Fouling and Cleaning- (SCREEN)+UFX

(SCREEN)+UFX

0

50

100

150

200

0 15 30 45 60 75 90 105 120

Flu

x (

L/m

2.h

)

Time (min)

(Screen)+UFX

(SCREEN)+UFX

B

Appendix B- Flocculation experiments

Below is the of the top 3/4th of the flocculated water decanted, when varying amounts of AVR

and PAC addition, as well as the amount of sludge produced in the beaker. It should be noted

that an optimum scenario would provide sufficient COD removal as well as low sludge

production. The optimum scenario was picked as adding 4 ml of AVR for every litre of the

process water.

199

187185 185

170

167

2

8 810

15

0

5

10

15

20

25

30

35

150

155

160

165

170

175

180

185

190

195

200

0 1 2 3 4 5 6 7 8 9

Slu

dge

(mm

)

CO

D (

mg/l

)

AVR added (ml)

COD

Sludge

199

181183

15710

14

33

0

5

10

15

20

25

30

35

150

155

160

165

170

175

180

185

190

195

200

0 0.2 0.4 0.6 0.8 1 1.2

Slu

dge

(mm

)

CO

D (

mg/l

)

AVR added (ml)

COD

Sludge

C

Appendix C - Repeated Experiments

On one occasion, three rounds of filtration were performed as to determine the flux recovery

and the average permeate flux decline. It was revealed that despite the high decline in distilled

water flux, the average permeate flux did not decrease as drastically. The average flux was 128,

127 and 124 L/m2.h in the three sets of experiments, while the water flux decreased from 348

to 211 and 183 L/m2.h. This experiment was only performed once due to limitations in both

time and available samples. The permeate flux is plotted during the three rounds of filtration in

the below figure, as well as the distilled water flux. The sample used was already filtrated via a

microfiltration membrane beforehand.

0

50

100

150

200

250

300

350

0 120 240 360

Flux

(L/m2.h)

Time(min)

Series1

Series2

Series3

Distilled Water Flux

D

Appendix D- COD over time

On some experiments, the COD of the permeate was measured three times during the filtration

as to see the effect of fouling. One sample was taken at the beginning of the experiment, one

after an hour had passed and one at the end of the two-hour filtration period. In all membranes,

the COD had a decreasing trend over the course of the experiments. As it can be observed the

UFX membrane experienced the least decline, and it also experienced the least fouling and

highest flux recovery.

The samples used were during the Screen and Ultrafiltration pretreatment step.

0

20

40

60

80

100

120

140

160

180

0 1 2

CO

D (

mg

/l)

Time (hr)

COD vs Time

UFX

RO90

RO98

E

Appendix E- Conductivity and Total Nitrogen measurements

The conductivity and TN measurements for some experiments are presented below:

UF Experiments

(MF)+ RO Experiments

(Screen) + UF

(Screen + UF) + RO

Cond: 0.71 mS/cm

TN: 5.6 mg/l

Cond: 0.58 mS/cm

TN: 4.2 mg/l UFX10

Cond: 0.75 mS/cm

TN: 6 mg/l

Cond: 0.56 mS/cm

TN: 4.1 mg/l

ETNA01

Cond: 0.75 mS/cm

TN: 6 mg/l

Cond: 0.63 mS/cm

TN: 4.1 mg/l

ETNA10

Cond: 0.66 mS/cm

TN: 5.2 mg/l Cond: 0.18 mS/cm

TN: 1.4 mg/l RO90

Cond: 0.66 mS/cm

TN: 5.2 mg/l Cond: 0.37 mS/cm

TN: 1.8 mg/l RO98

Cond: 0.71 mS/cm

Cond: 0.58 mS/cm

UFX10

Cond: 0.57 mS/cm

Cond: 0.31 mS/cm

RO90

Cond: 0.55 mS/cm

Cond: 0.34 mS/cm

RO98

F

Process water PM-3, no pretreatment

Total Nitrogen for all process waters was zero.

Process water PM-3, no pretreatment

Total Nitrogen for all process waters was zero.

Cond: 0.85 mS/cm Cond: 0.70 mS/cm UFX10

Cond:0.77 mS/cm Cond:0.22 mS/cm RO90

Cond:0.77 mS/cm Cond:0.26 mS/cm RO98

Cond: 2.00 mS/cm Cond: 1.74 mS/cm UFX10

Cond: 1.82 mS/cm Cond: 0.70 mS/cm RO90

www.kth.se

Through our international collaboration programmes with academia, industry, and the public

sector, we ensure the competitiveness of the Swedish business community on an international

level and contribute to a sustainable society. Our 2,200 employees support and promote all

manner of innovative processes, and our roughly 100 testbeds and demonstration facilities are

instrumental in developing the future-proofing of products, technologies, and services. RISE

Research Institutes of Sweden is fully owned by the Swedish state.

I internationell samverkan med akademi, näringsliv och offentlig sektor bidrar vi till ett

konkurrenskraftigt näringsliv och ett hållbart samhälle. RISE 2 200 medarbetare driver och stöder

alla typer av innovationsprocesser. Vi erbjuder ett 100-tal test- och demonstrationsmiljöer för

framtidssäkra produkter, tekniker och tjänster. RISE Research Institutes of Sweden ägs av

svenska staten.

RISE Research Institutes of Sweden / RISE Innventia AB

Box 5604, 114 86 STOCKHOLM, Sweden

Telephone: + 46-8-676 70 00

E-mail: [email protected], Internet: www.ri.se

RISE Bioeconomy Report:

17


Recommended