107
Forum of Regulators Forum of Regulators Forum of Regulators Forum of Regulators (Assessment of reasons for financial viability of utilities) November, 2010
Forum of RegulatorsForum of RegulatorsForum of RegulatorsForum of Regulators
(Assessment of reasons for financial viability of utilities)
November, 2010
Assessment of reasons for financial viability of utilities
-2-
CONTENTS
1 HARYANA ................................................................................................................................ 9
1.1 Introduction ......................................................................................................................... 9
1.2 Key Findings ....................................................................................................................... 9
1.3 Approach followed for approving various components ..................................................... 10
2 KARNATAKA......................................................................................................................... 19
2.1 Introduction ....................................................................................................................... 19
2.2 Key Findings ..................................................................................................................... 19
2.3 Approach followed for approving various components ..................................................... 20
3 MADHYA PRADESH.............................................................................................................. 32
3.1 Introduction ....................................................................................................................... 32
3.2 Key Findings ..................................................................................................................... 32
3.3 Approach followed for approving various components ..................................................... 33
2. ORISSA .................................................................................................................................. 43
3.4 Introduction ....................................................................................................................... 43
3.5 Key Findings ..................................................................................................................... 43
3.6 Approach followed for approving various components ..................................................... 43
4 MAHARASHTRA.................................................................................................................... 51
4.1 Introduction ....................................................................................................................... 51
4.2 Approach followed for approving various components ..................................................... 51
4.3 Key Findings ..................................................................................................................... 60
5 PUNJAB ................................................................................................................................. 62

Assessment of reasons for financial viability of utilities
-3-
5.1 Introduction ....................................................................................................................... 62
5.2 Key Findings ..................................................................................................................... 62
5.3 Approach followed for approving various components ..................................................... 63
6 RAJASTHAN.......................................................................................................................... 74
6.1 Introduction ....................................................................................................................... 74
6.2 Key Findings ..................................................................................................................... 74
6.3 Approach followed for approving various components ..................................................... 75
7 TAMIL NADU.......................................................................................................................... 84
7.1 Introduction ....................................................................................................................... 84
7.2 Key Findings ..................................................................................................................... 84
7.3 Approach followed for approving various components ..................................................... 85
8 UTTAR PRADESH ................................................................................................................. 89
8.1 Introduction ....................................................................................................................... 89
8.2 Key Findings ..................................................................................................................... 89
8.3 Approach followed for approving various components ..................................................... 90
9 WEST BENGAL ..................................................................................................................... 98
9.1 Introduction ....................................................................................................................... 98
9.2 Key Findings ..................................................................................................................... 98
9.3 Approach followed for approving various components ..................................................... 99

Assessment of reasons for financial viability of utilities
-4-
LIST OF TABLES
Table 1: Approved and Actual Sales in Haryana ........................................................................................ 10
Table 2: Power Purchase Quantum............................................................................................................ 13
Table 3: Power Purchase Cost ................................................................................................................... 13
Table 4: Power Purchase Cost per Unit...................................................................................................... 13
Table 5: Employee Cost.............................................................................................................................. 14
Table 6: Repair & Maintenance Cost .......................................................................................................... 14
Table 7: Summary of O&M expenses ......................................................................................................... 15
Table 8: Capital Expenditure....................................................................................................................... 15
Table 9: Approved and Actual Depreciation ............................................................................................... 16
Table 10: Interest Charges (including interest on working capital requirement)......................................... 16
Table 11: Reasonable Rate of Return ........................................................................................................ 17
Table 12: Government of Haryana Subsidy................................................................................................ 17
Table 13: Regulatory Gap ........................................................................................................................... 18
Table 14: Untreated Revenue Deficit .......................................................................................................... 18
Table 15: Accumulated Financial Losses ................................................................................................... 18
Table 1: Financial Impact (Rs Crore) .......................................................................................................... 20
Table 2: DISCOMs Energy Sales (MUs)..................................................................................................... 21
Table 3: Total State Utilities Energy Sales (MUs)....................................................................................... 22
Table 4: Distribution Loss Discom-wise (%) ............................................................................................... 22
Table 5: Consolidated Distribution Loss Targets (%) ................................................................................. 23
Table 6: Power Purchase Quantum............................................................................................................ 24
Table 7: Discom Wise Power Purchase Cost (Rs Crore) ........................................................................... 24

Assessment of reasons for financial viability of utilities
-5-
Table 8: Operation & Maintenance Costs for each DISCOMs................................................................... 26
Table 9: Consolidated Operation & Maintenance Costs............................................................................. 27
Table 10: Consolidated Depreciation (Rs Crore) ........................................................................................ 27
Table 11: Interest & Finance Charges ........................................................................................................ 28
Table 12: Consolidated Interest & Finance Charges (Rs Crores) .............................................................. 29
Table 13: Approved and Received Subsidy................................................................................................ 30
Table 14: Tariff Revision ............................................................................................................................. 31
Table 15: Lag time between Finalisation of Accounts & Issuance of True-up Order.................................. 31
Table 1: Sales ............................................................................................................................................. 34
Table 2: Power Purchase Quantum............................................................................................................ 37
Table 3: Power Purchase Cost ................................................................................................................... 37
Table 4: Per Unit Power Purchase Cost ..................................................................................................... 37
Table 5: Summary of O&M expenses ......................................................................................................... 37
Table 6: Depreciation Approved and Trued Up .......................................................................................... 39
Table 7: Interest Charges............................................................................................................................ 40
Table 8: Impact on the Total Revenue Gap of DISCOMs due to disallowance of Carrying Cost............... 41
Table 1: Disallowance on account of T&D Loss ......................................................................................... 46
Table 2: Power Purchase Quantum............................................................................................................ 47
Table 3: Power Purchase Cost ................................................................................................................... 47
Table 4: Administrative & General Expenses ............................................................................................. 48
Table 5: Operation and Maintenance Cost ................................................................................................. 48
Table 6: Regulatory Asset Amortization...................................................................................................... 49
Table 7: Impact on the Total Revenue Gap of DISCOMs due to disallowance of Carrying Cost............... 50
Table 1: Distribution Loss Targets Proposed, Approved, Actual and Trued-up ......................................... 53

Assessment of reasons for financial viability of utilities
-6-
Table 2: Power Purchase Quantum............................................................................................................ 54
Table 3: Power Purchase Cost ................................................................................................................... 54
Table 4: Per Unit Power Purchase Cost ..................................................................................................... 54
Table 5: Employee Expenses ..................................................................................................................... 55
Table 6: Repair and Maintenance Expenses .............................................................................................. 56
Table 7: Administrative and General Expenses.......................................................................................... 56
Table 8: Capitalization................................................................................................................................. 57
Table 9: Depreciation .................................................................................................................................. 57
Table 10: Interest Charges.......................................................................................................................... 58
Table 11: Return on Equity ......................................................................................................................... 59
Table 1: Expenses disallowed on account of higher T&D loss during the year.......................................... 65
Table 2: Power Purchase Cost ................................................................................................................... 66
Table 3: Per Unit Power Purchase Cost ..................................................................................................... 67
Table 4: Employee Cost.............................................................................................................................. 68
Table 5: Repair & Maintenance Cost .......................................................................................................... 68
Table 6: Administrative and General Expenses.......................................................................................... 69
Table 7: Summary of O&M expenses ......................................................................................................... 69
Table 8: Capital Expenditure....................................................................................................................... 69
Table 9: Depreciation Approved and Trued Up .......................................................................................... 70
Table 10: Subsidy ....................................................................................................................................... 71
Table 11: Interest Charges.......................................................................................................................... 71
Table 12: Interest on Working Capital......................................................................................................... 72
Table 1: Power Purchase Quantum............................................................................................................ 78
Table 2: Power Purchase Cost ................................................................................................................... 78
Assessment of reasons for financial viability of utilities
-7-
Table 3: Per Unit Power Purchase Cost ..................................................................................................... 78
Table 4: Operation and Maintenance Expenses......................................................................................... 79
Table 4: Capitalization for DISCOMs in Rajasthan..................................................................................... 80
Table 5: Depreciation .................................................................................................................................. 80
Table 6: Interest Charges............................................................................................................................ 81
Table 1: Proposed and Approved Sales ..................................................................................................... 85
Table 2: Proposed and Approved T&D loss................................................................................................ 86
Table 3: Proposed and Approved Power Purchase Quantum.................................................................... 86
Table 4: Proposed and Approved Power Purchase Cost ........................................................................... 86
Table 5: Proposed and Approved Power Purchase Cost per unit .............................................................. 87
Table 6: Proposed and Approved ARR for TNEB....................................................................................... 87
Table 7: Revenue Gap at Existing and New Tariff for TNEB...................................................................... 87
Table 8: Regulatory Asset........................................................................................................................... 88
Table 1: Financial Impact ............................................................................................................................ 89
Table 2: Proposed, Approved and Actual Sales ......................................................................................... 90
Table 3: Financial Impact due to over-estimation of Sales ......................................................................... 90
Table 4: Long-term T&D Loss Targets for UPPCL ..................................................................................... 91
Table 5: Distribution Loss Targets & Achievement by DISCOMS .............................................................. 91
Table 6: Power Purchase Quantum............................................................................................................ 92
Table 7: Power Purchase Cost ................................................................................................................... 92
Table 8: Power Purchase Cost Per Unit ..................................................................................................... 93
Table 9: Operation & Maintenance Costs (in Rs Crores) ........................................................................... 93
Table 10: Proposed and Approved Capital Expenditure............................................................................. 94
Table 11: Approved and actual Depreciation.............................................................................................. 94
Assessment of reasons for financial viability of utilities
-8-
Table 12: Interest Charges (in Rs Crores) .................................................................................................. 95
Table 13: Subsidy ....................................................................................................................................... 96
Table 14: Average Tariff Increase............................................................................................................... 96
Table 15: Coverage of Revenue Requirement from Tariff.......................................................................... 96
Table 16: Treatment of Revenue Deficit Treatment.................................................................................... 97
Table 1: Energy Sales for WBSEDCL....................................................................................................... 100
Table 2: Losses for WBSEDCL................................................................................................................. 100
Table 3: Power Purchase Quantum.......................................................................................................... 101
Table 4: Power Purchase Cost ................................................................................................................. 101
Table 5: Power Purchase Cost per Unit.................................................................................................... 102
Table 6: Financial impact of disapproval of power purchase cost ............................................................ 102
Table 7: Employee Cost............................................................................................................................ 103
Table 8: Summary of O&M expenses (including employee cost) ............................................................. 103
Table 9: Interest on Working Capital Borrowings ..................................................................................... 105
Table 10: Total Interest and Finance Charges.......................................................................................... 105
Table 11: Reasonable Rate of Return ...................................................................................................... 106
Table 12: Regulatory Asset....................................................................................................................... 106

Assessment of reasons for financial viability of utilities
-9-
1 HARYANA
1.1 Introduction
Haryana Electricity Regulatory Commission was established on 17th August 1998 as an independent
statutory body corporate as per the provision of the Haryana Electricity Reform Act, 1997. Haryana was
the second State in India to initiate the process of Reform & Restructuring of the Power sector in India.
The erstwhile Haryana State Electricity Board (HSEB) was unbundled into two corporate bodies namely
Haryana Power Generation Company Limited (HPGCL) for the Generation of Power and Haryana Vidyut
Prasaran Nigam Limited (HVPNL) for the Transmission & Distribution of power within the state of
Haryana. Subsequently, the activity of distribution and retail supply of power was entrusted w.e.f. 1st July
1999, to Uttar Haryana Bijli Vitran Nigam Limited (UHBVNL) for north circles and Dakshin Haryana Bijli
Vitran Nigam Limited (DHBVNL) for south circles of Haryana.
1.2 Key Findings
The increase in the financial losses of Haryana can be attributed to following factors:
• Lack of true-up mechanism for various cost parameters of the ARR (except for power purchase
cost which is passed by the way of Fuel Surcharge Adjustment (FSA) to the consumers)
• Disallowance of interest cost on the short-term borrowings for meeting the revenue deficit of prior
period and carrying cost for time lag involved in recovery of FSA
• Lack of appropriate mechanism for recovery of revenue deficit
• No revision of retail supply tariff leading to increase in gap between average cost of supply per
unit and average realization per unit
• No return has been provided to the Discoms as capital employed is negative for both the
DISCOMs
• Table below summarises the net impact of all these factors in terms of financial numbers. All
these factors are discussed in detail in later section.
Particulars (Rs. Crs) FY07 FY08 FY09 Accumulated
Losses1 up to FY09
UHBVN 301.56 499.98 1218.38 2778.32
1 Source: Balance Sheet of the Utilities (Accumulated losses are consolidated losses since the inception of the utilities in 1999)

Assessment of reasons for financial viability of utilities
-10-
Particulars (Rs. Crs) FY07 FY08 FY09 Accumulated
Losses1 up to FY09
DHBVN 113.22 281.38 265.27 1260.98
Total 414.78 781.36 1483.65 4039.30
1.3 Approach followed for approving various components
In this section we bring forth the approach adopted by the Commission for approving various components
which have bearing on the financial viability of the distribution utilities.
1.3.1 Sales
Haryana being predominantly an agricultural State has a significant share of unmetered agricultural
consumption which is billed on flat rate basis. Therefore, the estimate for consumption by agriculture
category is important while determining the total sales for the DISCOMs.
The sales estimate for all metered categories has been based on the average Annual Load Factor (ALF).
However, considering Haryana has remained an energy deficit State, the Commission has adjusted the
consumer wise sales estimate based on the ALF (excluding agriculture) to the extent of volume of power
available (net of losses) from various sources.
The Commission projects the consumption of metered agriculture tube-well consumers on the basis of
the average ALF. For Unmetered Agriculture Category, the Commission has estimated the energy
consumption based on the pattern of the consumption of metered agriculture pump sets. Though
Commission had directed the distribution licensee to submit credible data to correctly estimate the
consumption of unmetered agricultural consumers, the licensee had failed to submit sufficient field data of
segregated agricultural feeders and install MDI meters to record energy flow to agriculture pump sets.
The table below shows the total sales approved by the Commission and actual2 sales from FY06 to FY10.
Table 1: Approved and Actual Sales in Haryana
Particulars FY06 FY07 FY08 FY09 FY10
Proposed Sales (MUs) 15331 17028 18026 19492 21710
Approved Sales (MUs) 13738 15857 17992 21038 20395
Actual Sales (MUs) 15232 16639 18287 19294 22644
Variation (Approved – Actual) -1494 -782 -295 1744* -2249
2 Actual refers to the actual figures as per the annual accounts of both the Discoms i.e. DHBVN and UHBVN
Assessment of reasons for financial viability of utilities
-11-
* True-up orders for UHBVN & DHBVN are not available. Hence, the reason for approved sales being higher than the actual sales
for FY 09 is not available. However, the Commission had considered additional availability of power from 600MW new generating
station.
It can be observed that the sales figure has been underestimated as against the projections made by the
DISCOMs during the period FY 06 to FY 10 excluding FY 09. Though the increase in sale would lead to
increase in revenue, approval of lower sales decreases the approved power purchase quantum resulting
in a lower power purchase cost. This impact has been considered in the total actual power purchase cost
of the utilities in the subsequent section (1.3.3).
1.3.2 Distribution Loss
The Commission had been assessing the performance of the DISCOMs based on the few parameters i.e.
Distribution loss, power supply-quantum and quality including power regulatory measure, damage rate of
distribution transformers and fatal and non fatal accidents. The Commission had done a detailed analysis
for all these parameters. A performance report on these parameters is submitted by the DISCOMs each
year along with their ARR petition.
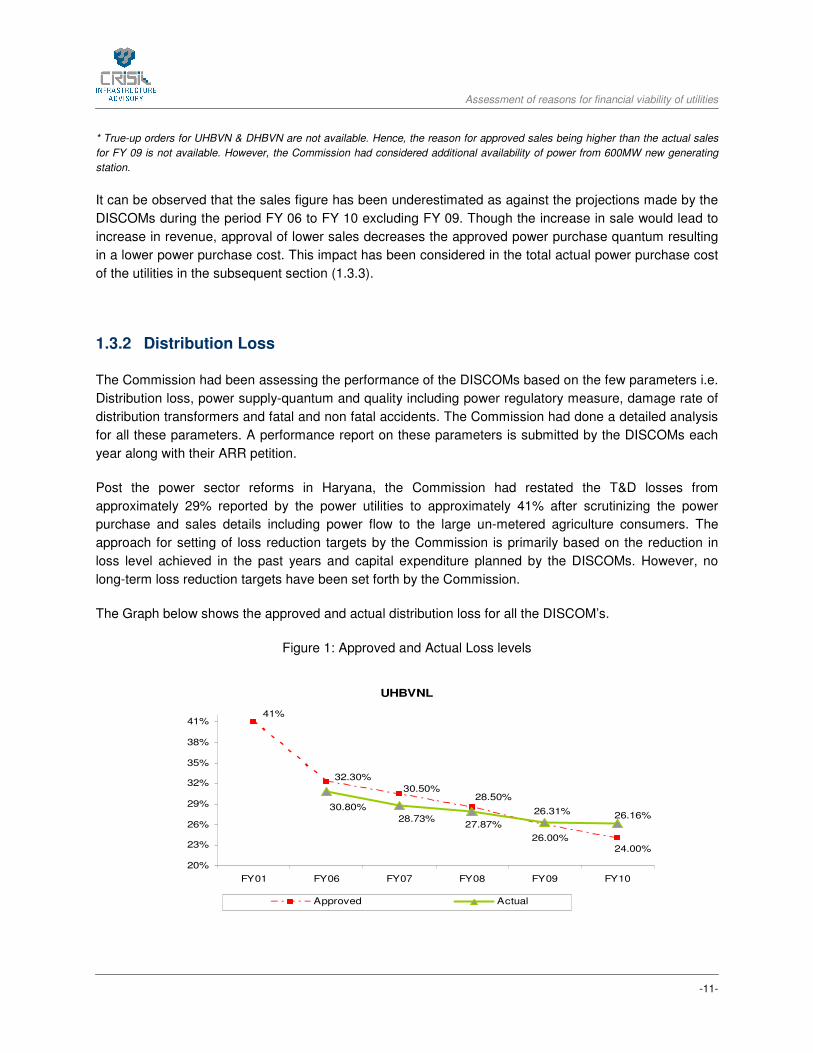
Post the power sector reforms in Haryana, the Commission had restated the T&D losses from
approximately 29% reported by the power utilities to approximately 41% after scrutinizing the power
purchase and sales details including power flow to the large un-metered agriculture consumers. The
approach for setting of loss reduction targets by the Commission is primarily based on the reduction in
loss level achieved in the past years and capital expenditure planned by the DISCOMs. However, no
long-term loss reduction targets have been set forth by the Commission.
The Graph below shows the approved and actual distribution loss for all the DISCOM’s.
Figure 1: Approved and Actual Loss levels
UHBVNL
41%
26.00%24.00%
28.50%30.50%
32.30%
26.16%30.80%
28.73%27.87%
26.31%
20%
23%
26%
29%
32%
35%
38%
41%
FY01 FY06 FY07 FY08 FY09 FY10
Approved Actual

Assessment of reasons for financial viability of utilities
-12-
DHBVNL
26.74%
24.80%
24.00%
28.50%
30.50%32.30%
41%
26.00%
28.37%
22.40%
24.28%
20%
23%
26%
29%
32%
35%
38%
41%
FY01 FY06 FY07 FY08 FY09 FY10
Approved Actual
Note: Actual losses are as per statistical report on UHBVN and DHBVN websites
Since no true-up has been carried out by the Commission for FY 06 to FY 10, the actual losses cannot be
ascertained. The Commission in its Tariff Orders have mentioned that the Commission’s estimate of sales
to the agriculture consumers is lower than the sales estimated by the utilities. This is primarily due to
distribution losses which are restated as excess units allocated to the agricultural consumers.
1.3.3 Power Purchase Cost
The State of Haryana has been a energy deficit state and thus the power procurement has not been
demand driven but based on the estimates of power availability from various sources including owned
generation, share from CGS, joint ventures, IPPs and other sources like bilateral, banking, UI, etc. The
availability from short-term sources (including UI) has been approved based on the projections and
agreements entered by the utilities.
Earlier HVPNL (Transmission Company) on behalf of the DISCOMs was responsible for the power
purchase from various sources up to the period June, 2005. The available power was then allocated
among the two DISCOMs based on their estimated sales and T&D losses for the respective years.
However, post June 2005, the rights and obligation relating to procurement and bulk supply trading of
power was transferred from HVPNL to HPGCL which was further transferred to the distribution licensee
w.e.f. April, 2008 as per Government of Haryana notification in equal ratio.
As per the Commission Orders up to FY 09, the DISCOMs were required to pay for the power purchase
cost as per the Bulk Supply Tariff (BST) approved by the Commission during the period FY06 to FY09.
However, for FY10 the power purchases from central sources have been considered at an average rate
of power purchase in FY09, while purchase from HPGCL was approved as per the generation tariff order.
The power purchase rate from short term bilateral agreements have been approved as proposed by the
DISCOMS. The table below shows the approved and actual power purchase cost for the two DISCOMs:
Assessment of reasons for financial viability of utilities
-13-
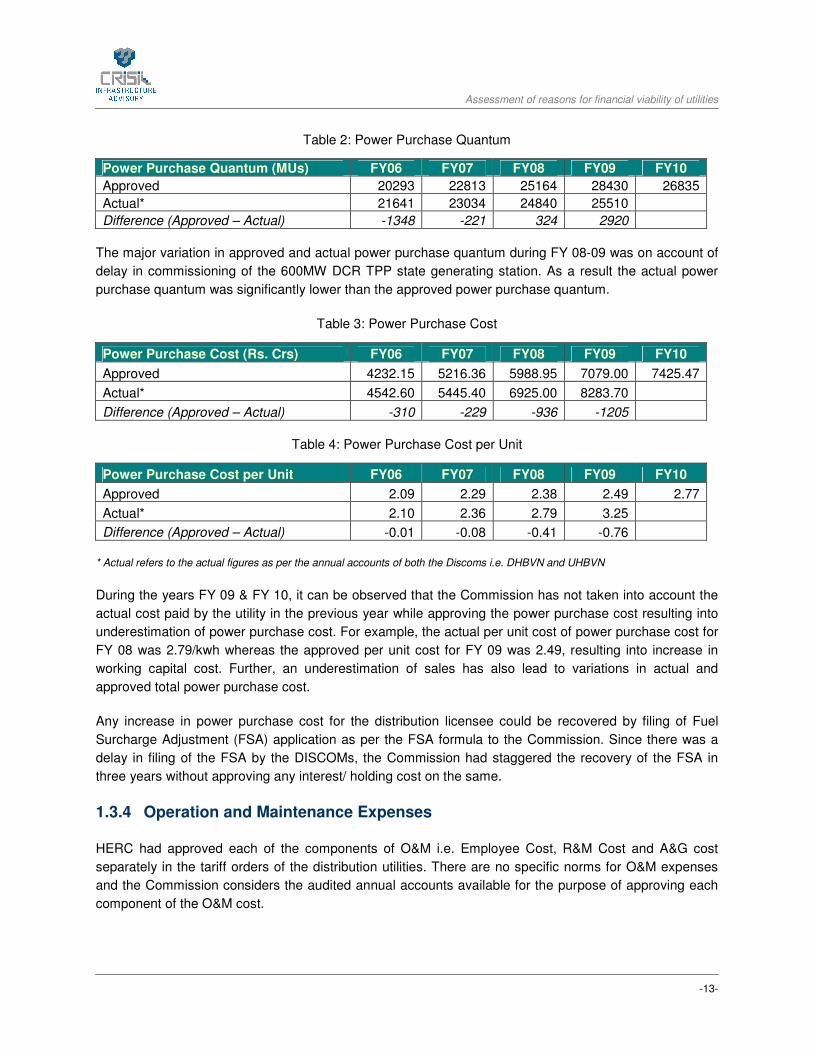
Table 2: Power Purchase Quantum
Power Purchase Quantum (MUs) FY06 FY07 FY08 FY09 FY10
Approved 20293 22813 25164 28430 26835
Actual* 21641 23034 24840 25510
Difference (Approved – Actual) -1348 -221 324 2920
The major variation in approved and actual power purchase quantum during FY 08-09 was on account of
delay in commissioning of the 600MW DCR TPP state generating station. As a result the actual power
purchase quantum was significantly lower than the approved power purchase quantum.
Table 3: Power Purchase Cost
Power Purchase Cost (Rs. Crs) FY06 FY07 FY08 FY09 FY10
Approved 4232.15 5216.36 5988.95 7079.00 7425.47
Actual* 4542.60 5445.40 6925.00 8283.70
Difference (Approved – Actual) -310 -229 -936 -1205
Table 4: Power Purchase Cost per Unit
Power Purchase Cost per Unit FY06 FY07 FY08 FY09 FY10
Approved 2.09 2.29 2.38 2.49 2.77
Actual* 2.10 2.36 2.79 3.25
Difference (Approved – Actual) -0.01 -0.08 -0.41 -0.76
* Actual refers to the actual figures as per the annual accounts of both the Discoms i.e. DHBVN and UHBVN
During the years FY 09 & FY 10, it can be observed that the Commission has not taken into account the
actual cost paid by the utility in the previous year while approving the power purchase cost resulting into
underestimation of power purchase cost. For example, the actual per unit cost of power purchase cost for
FY 08 was 2.79/kwh whereas the approved per unit cost for FY 09 was 2.49, resulting into increase in
working capital cost. Further, an underestimation of sales has also lead to variations in actual and
approved total power purchase cost.
Any increase in power purchase cost for the distribution licensee could be recovered by filing of Fuel
Surcharge Adjustment (FSA) application as per the FSA formula to the Commission. Since there was a
delay in filing of the FSA by the DISCOMs, the Commission had staggered the recovery of the FSA in
three years without approving any interest/ holding cost on the same.
1.3.4 Operation and Maintenance Expenses
HERC had approved each of the components of O&M i.e. Employee Cost, R&M Cost and A&G cost
separately in the tariff orders of the distribution utilities. There are no specific norms for O&M expenses
and the Commission considers the audited annual accounts available for the purpose of approving each
component of the O&M cost.
Assessment of reasons for financial viability of utilities
-14-
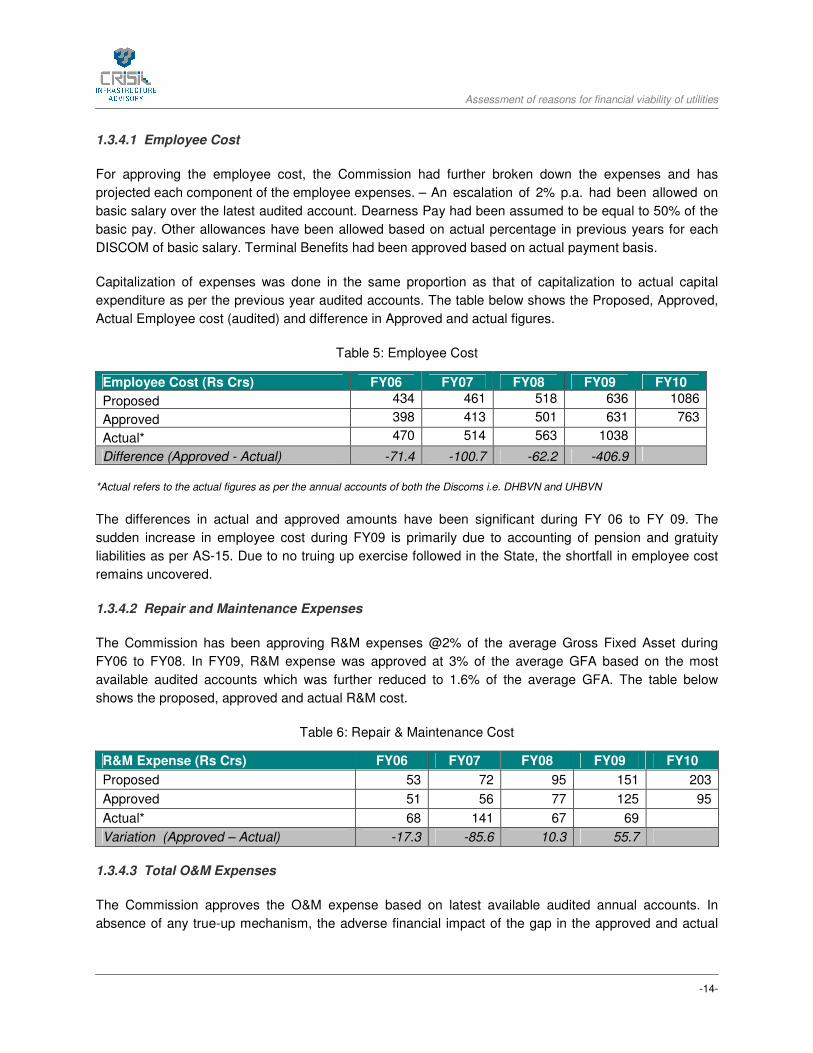
1.3.4.1 Employee Cost
For approving the employee cost, the Commission had further broken down the expenses and has
projected each component of the employee expenses. – An escalation of 2% p.a. had been allowed on
basic salary over the latest audited account. Dearness Pay had been assumed to be equal to 50% of the
basic pay. Other allowances have been allowed based on actual percentage in previous years for each
DISCOM of basic salary. Terminal Benefits had been approved based on actual payment basis.
Capitalization of expenses was done in the same proportion as that of capitalization to actual capital
expenditure as per the previous year audited accounts. The table below shows the Proposed, Approved,
Actual Employee cost (audited) and difference in Approved and actual figures.
Table 5: Employee Cost
Employee Cost (Rs Crs) FY06 FY07 FY08 FY09 FY10
Proposed 434 461 518 636 1086
Approved 398 413 501 631 763
Actual* 470 514 563 1038
Difference (Approved - Actual) -71.4 -100.7 -62.2 -406.9
*Actual refers to the actual figures as per the annual accounts of both the Discoms i.e. DHBVN and UHBVN
The differences in actual and approved amounts have been significant during FY 06 to FY 09. The
sudden increase in employee cost during FY09 is primarily due to accounting of pension and gratuity
liabilities as per AS-15. Due to no truing up exercise followed in the State, the shortfall in employee cost
remains uncovered.
1.3.4.2 Repair and Maintenance Expenses
The Commission has been approving R&M expenses @2% of the average Gross Fixed Asset during
FY06 to FY08. In FY09, R&M expense was approved at 3% of the average GFA based on the most
available audited accounts which was further reduced to 1.6% of the average GFA. The table below
shows the proposed, approved and actual R&M cost.
Table 6: Repair & Maintenance Cost
R&M Expense (Rs Crs) FY06 FY07 FY08 FY09 FY10
Proposed 53 72 95 151 203
Approved 51 56 77 125 95
Actual* 68 141 67 69
Variation (Approved – Actual) -17.3 -85.6 10.3 55.7
1.3.4.3 Total O&M Expenses
The Commission approves the O&M expense based on latest available audited annual accounts. In
absence of any true-up mechanism, the adverse financial impact of the gap in the approved and actual
Assessment of reasons for financial viability of utilities
-15-
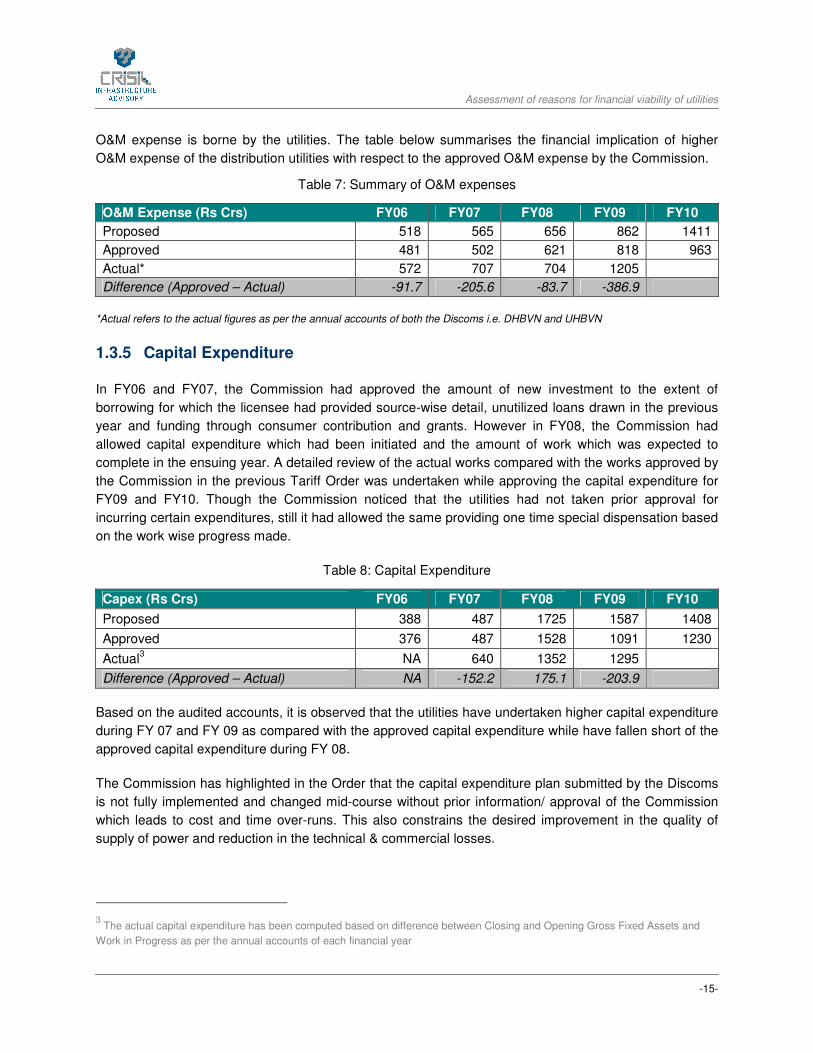
O&M expense is borne by the utilities. The table below summarises the financial implication of higher
O&M expense of the distribution utilities with respect to the approved O&M expense by the Commission.
Table 7: Summary of O&M expenses
O&M Expense (Rs Crs) FY06 FY07 FY08 FY09 FY10
Proposed 518 565 656 862 1411
Approved 481 502 621 818 963
Actual* 572 707 704 1205
Difference (Approved – Actual) -91.7 -205.6 -83.7 -386.9
*Actual refers to the actual figures as per the annual accounts of both the Discoms i.e. DHBVN and UHBVN
1.3.5 Capital Expenditure
In FY06 and FY07, the Commission had approved the amount of new investment to the extent of
borrowing for which the licensee had provided source-wise detail, unutilized loans drawn in the previous
year and funding through consumer contribution and grants. However in FY08, the Commission had
allowed capital expenditure which had been initiated and the amount of work which was expected to
complete in the ensuing year. A detailed review of the actual works compared with the works approved by
the Commission in the previous Tariff Order was undertaken while approving the capital expenditure for
FY09 and FY10. Though the Commission noticed that the utilities had not taken prior approval for
incurring certain expenditures, still it had allowed the same providing one time special dispensation based
on the work wise progress made.
Table 8: Capital Expenditure
Capex (Rs Crs) FY06 FY07 FY08 FY09 FY10
Proposed 388 487 1725 1587 1408
Approved 376 487 1528 1091 1230
Actual3 NA 640 1352 1295
Difference (Approved – Actual) NA -152.2 175.1 -203.9
Based on the audited accounts, it is observed that the utilities have undertaken higher capital expenditure
during FY 07 and FY 09 as compared with the approved capital expenditure while have fallen short of the
approved capital expenditure during FY 08.
The Commission has highlighted in the Order that the capital expenditure plan submitted by the Discoms
is not fully implemented and changed mid-course without prior information/ approval of the Commission
which leads to cost and time over-runs. This also constrains the desired improvement in the quality of
supply of power and reduction in the technical & commercial losses.
3 The actual capital expenditure has been computed based on difference between Closing and Opening Gross Fixed Assets and
Work in Progress as per the annual accounts of each financial year
Assessment of reasons for financial viability of utilities
-16-
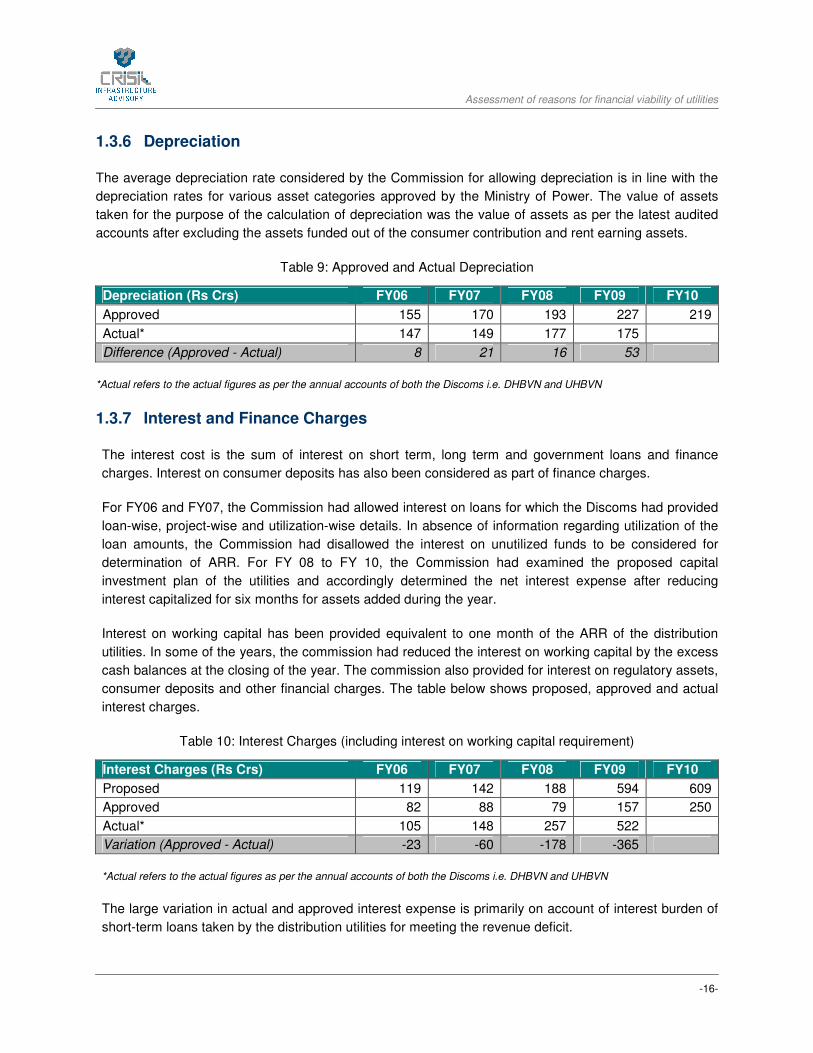
1.3.6 Depreciation
The average depreciation rate considered by the Commission for allowing depreciation is in line with the
depreciation rates for various asset categories approved by the Ministry of Power. The value of assets
taken for the purpose of the calculation of depreciation was the value of assets as per the latest audited
accounts after excluding the assets funded out of the consumer contribution and rent earning assets.
Table 9: Approved and Actual Depreciation
Depreciation (Rs Crs) FY06 FY07 FY08 FY09 FY10
Approved 155 170 193 227 219
Actual* 147 149 177 175
Difference (Approved - Actual) 8 21 16 53
*Actual refers to the actual figures as per the annual accounts of both the Discoms i.e. DHBVN and UHBVN
1.3.7 Interest and Finance Charges
The interest cost is the sum of interest on short term, long term and government loans and finance
charges. Interest on consumer deposits has also been considered as part of finance charges.
For FY06 and FY07, the Commission had allowed interest on loans for which the Discoms had provided
loan-wise, project-wise and utilization-wise details. In absence of information regarding utilization of the
loan amounts, the Commission had disallowed the interest on unutilized funds to be considered for
determination of ARR. For FY 08 to FY 10, the Commission had examined the proposed capital
investment plan of the utilities and accordingly determined the net interest expense after reducing
interest capitalized for six months for assets added during the year.
Interest on working capital has been provided equivalent to one month of the ARR of the distribution
utilities. In some of the years, the commission had reduced the interest on working capital by the excess
cash balances at the closing of the year. The commission also provided for interest on regulatory assets,
consumer deposits and other financial charges. The table below shows proposed, approved and actual
interest charges.
Table 10: Interest Charges (including interest on working capital requirement)
Interest Charges (Rs Crs) FY06 FY07 FY08 FY09 FY10
Proposed 119 142 188 594 609
Approved 82 88 79 157 250
Actual* 105 148 257 522
Variation (Approved - Actual) -23 -60 -178 -365
*Actual refers to the actual figures as per the annual accounts of both the Discoms i.e. DHBVN and UHBVN
The large variation in actual and approved interest expense is primarily on account of interest burden of
short-term loans taken by the distribution utilities for meeting the revenue deficit.
Assessment of reasons for financial viability of utilities
-17-
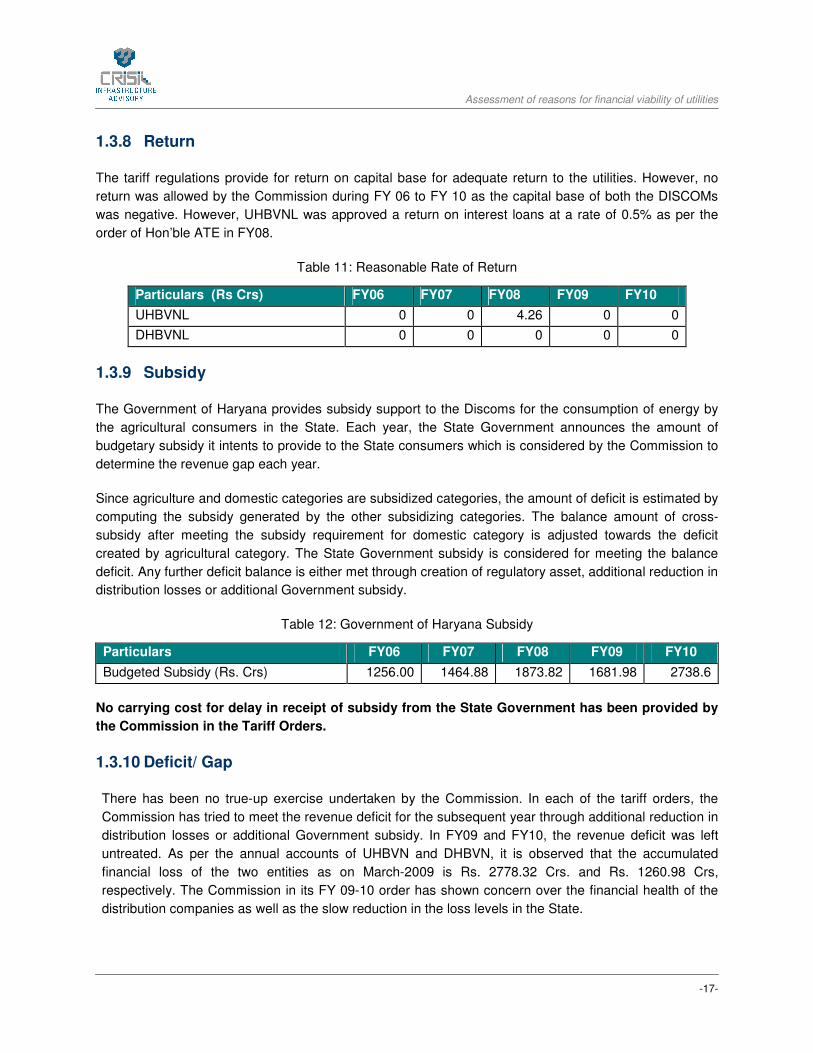
1.3.8 Return
The tariff regulations provide for return on capital base for adequate return to the utilities. However, no
return was allowed by the Commission during FY 06 to FY 10 as the capital base of both the DISCOMs
was negative. However, UHBVNL was approved a return on interest loans at a rate of 0.5% as per the
order of Hon’ble ATE in FY08.
Table 11: Reasonable Rate of Return
Particulars (Rs Crs) FY06 FY07 FY08 FY09 FY10
UHBVNL 0 0 4.26 0 0
DHBVNL 0 0 0 0 0
1.3.9 Subsidy
The Government of Haryana provides subsidy support to the Discoms for the consumption of energy by
the agricultural consumers in the State. Each year, the State Government announces the amount of
budgetary subsidy it intents to provide to the State consumers which is considered by the Commission to
determine the revenue gap each year.
Since agriculture and domestic categories are subsidized categories, the amount of deficit is estimated by
computing the subsidy generated by the other subsidizing categories. The balance amount of cross-
subsidy after meeting the subsidy requirement for domestic category is adjusted towards the deficit
created by agricultural category. The State Government subsidy is considered for meeting the balance
deficit. Any further deficit balance is either met through creation of regulatory asset, additional reduction in
distribution losses or additional Government subsidy.
Table 12: Government of Haryana Subsidy
Particulars FY06 FY07 FY08 FY09 FY10
Budgeted Subsidy (Rs. Crs) 1256.00 1464.88 1873.82 1681.98 2738.6
No carrying cost for delay in receipt of subsidy from the State Government has been provided by
the Commission in the Tariff Orders.
1.3.10 Deficit/ Gap
There has been no true-up exercise undertaken by the Commission. In each of the tariff orders, the
Commission has tried to meet the revenue deficit for the subsequent year through additional reduction in
distribution losses or additional Government subsidy. In FY09 and FY10, the revenue deficit was left
untreated. As per the annual accounts of UHBVN and DHBVN, it is observed that the accumulated
financial loss of the two entities as on March-2009 is Rs. 2778.32 Crs. and Rs. 1260.98 Crs,
respectively. The Commission in its FY 09-10 order has shown concern over the financial health of the
distribution companies as well as the slow reduction in the loss levels in the State.

Assessment of reasons for financial viability of utilities
-18-
1.3.11 Regulatory Asset
The Commission has created regulatory assets in FY 09-10 as three quarters of the financial year was
over and the Discoms had not submitted tariff proposal to bridge the revenue gap. The regulatory asset
created also included the uncovered gap of FY 08-09 which was also not treated due to lack of any tariff
proposal from the Discoms.
Table 13: Regulatory Gap
Particulars UHBVN DHBVN Total
Regulatory Gap for FY 09-10 (Rs. Crs) 587.02 136.52 723.54
In the Tariff Order for FY 09-10, the Commission has permitted a carrying cost on the borrowings utilized
for bridging the approved regulatory gap.
1.3.12 Tariff Increase
The Commission has not increased retail tariff in the state of Haryana from the period FY 05-06 to FY 09-
10.
1.3.13 Tariff Reflective of Approved ARR
The Commission has addressed the revenue deficit each year by considering additional revenue resulting
from further reduction in loss level, additional Government subsidy, and regulatory asset. However, in FY
08-09, the Commission had not been able to address the revenue deficit fully and therefore had left the
same untreated. Interest cost against the revenue deficit left untreated was not approved by the
Commission due to lack of adequate information submitted by the DISCOMs.
Table 14: Untreated Revenue Deficit
Particulars UHBVN DHBVN Total
Untreated Revenue Deficit for FY 09-10 (Rs. Crs) 311.88 32.05 343.94
1.3.14 Issuance of True-up Order
The Commission has not undertaken any true-up exercise for past years. However, the net financial
impact on the Discoms as per the annual accounts is summarized in table below:
Table 15: Accumulated Financial Losses
Particulars UHBVN DHBVN Total
Accumulated Financial Losses4 as per FY 08-
09 annual accounts (Rs. Crs) 2778.32 1260.98 4039.30
4 Accumulated losses are consolidated losses as per the annual accounts of UHBVN & DHBVN since the inception of the utilities
Assessment of reasons for financial viability of utilities
-19-
2 KARNATAKA
2.1 Introduction
The Government of Karnataka (GoK) initiated reform process in the power sector through a General
Policy Statement issued during January 1997 followed by a detailed policy statement in 2001. The
Karnataka Electricity Reforms Act (KERA) was enacted which came into effect from 1st June, 1999 under
which the Karnataka Electricity Regulatory Commission (KERC) was established with effect from 15th
November, 1999.
Erstwhile Karnataka Electricity Board (KEB) was unbundled and corporatised into a Transmission &
Distribution Company called Karnataka Power Transmission Corporation Ltd (KPTCL) and a Generating
company called Visvesvaraya Vidyuth Nigam Ltd (VVNL), on 1st April, 2000. Thereafter, KPTCL was
further unbundled into 5 independent companies effective from 1st June 2002, with one transmission
company namely KPTCL and four distribution Companies namely Bangalore Electricity Supply Company
Ltd (BESCOM), Mangalore Electricity Supply Company Ltd (MESCOM), Hubli Electricity Supply Company
Ltd (HESCOM) and Gulbarga Electricity Supply Company Ltd (GESCOM). KPTCL retained the functions
of power purchase, transmission and bulk supply to the four DISCOMs while the DISCOMs were made
responsible for distribution & retail supply of electricity to the consumers.
Later in 2005, another DISCOM was carved out of one of the existing DISCOM i.e. MESCOM. Further in
line with the provisions of the Electricity Act 2003, the responsibility for bulk power purchase and supply in
Karnataka was transferred to the distribution companies with effect from June 2005.
2.2 Key Findings
The increase in financial losses of Karnataka distribution companies can be attributed to following factors:
• Disallowance of power purchase cost on account of under-achievement in distribution loss targets
specified for the distribution companies for FY 2005-06 & FY 2006-07. The Commission has
stated in the APR for FY 2007-08 & FY 2008-09 that any under-achievement in distribution loss
target during the MYT Control Period would be dwelt with at the time of true-up at the end of the
control period.
• Disallowance in O&M expense in the true-up for FY 2005-06 & FY 2006-07 on account of bonus
issuance and free/subsidised electricity for employees. The Commission had approved a higher
O&M expense in FY 06-07 as against the claimed O&M expense. This was primarily due to pay
revision arrears amounting to Rs 67.92 Crore approved over and above the actual O&M expense
Assessment of reasons for financial viability of utilities
-20-
as per the Appellate Tribunal for Electricity (ATE) Order. For the MYT Control Period, O&M
expense over and above the approved normative amount was disallowed by the Commission.
• Disallowance in interest and finance expense on account of interest on belated payment of power
purchase cost. The DISCOMs did not claim for any interest on working capital requirement for FY
07-08 & FY 08-09. Since the Commission had approved interest & finance expenses including
interest on working capital considering normative working capital, the approved interest and
finance charges were higher than the DISCOMs claim.
• Shortfall and delay in subsidy receipt from the Government of Karnataka.
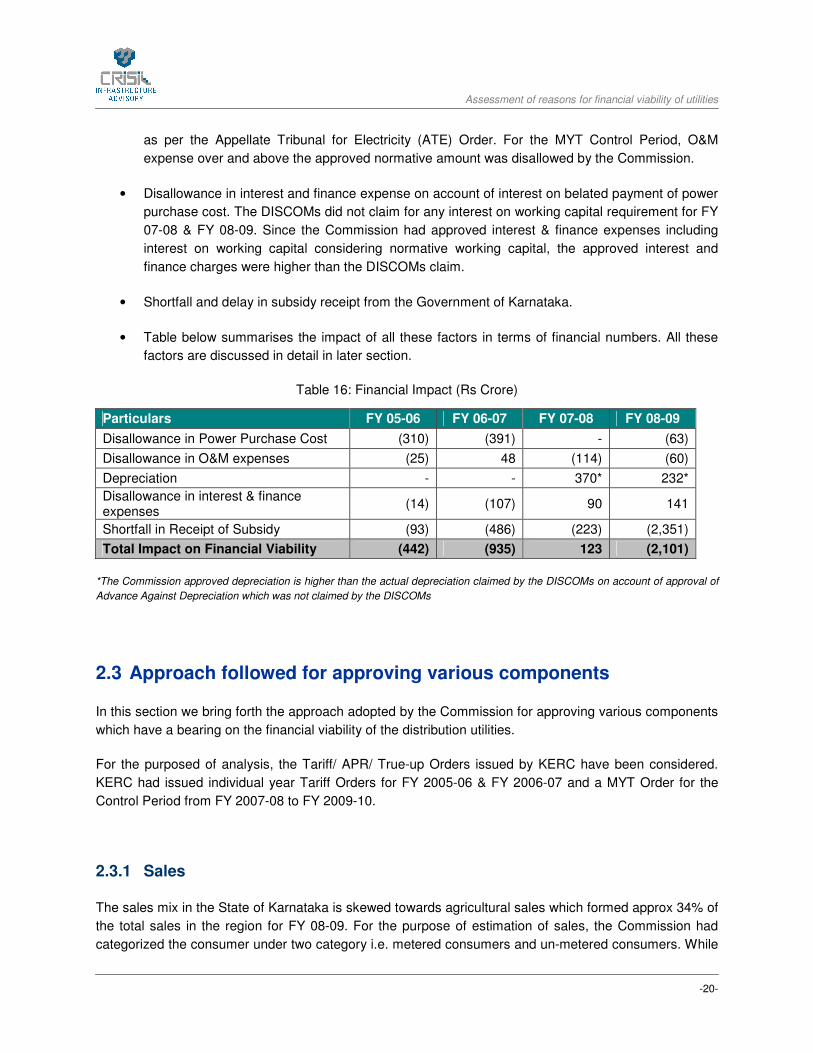
• Table below summarises the impact of all these factors in terms of financial numbers. All these
factors are discussed in detail in later section.
Table 16: Financial Impact (Rs Crore)
Particulars FY 05-06 FY 06-07 FY 07-08 FY 08-09
Disallowance in Power Purchase Cost (310) (391) - (63)
Disallowance in O&M expenses (25) 48 (114) (60)
Depreciation - - 370* 232*
Disallowance in interest & finance expenses
(14) (107) 90 141
Shortfall in Receipt of Subsidy (93) (486) (223) (2,351)
Total Impact on Financial Viability (442) (935) 123 (2,101)
*The Commission approved depreciation is higher than the actual depreciation claimed by the DISCOMs on account of approval of
Advance Against Depreciation which was not claimed by the DISCOMs
2.3 Approach followed for approving various components
In this section we bring forth the approach adopted by the Commission for approving various components
which have a bearing on the financial viability of the distribution utilities.
For the purposed of analysis, the Tariff/ APR/ True-up Orders issued by KERC have been considered.
KERC had issued individual year Tariff Orders for FY 2005-06 & FY 2006-07 and a MYT Order for the
Control Period from FY 2007-08 to FY 2009-10.
2.3.1 Sales
The sales mix in the State of Karnataka is skewed towards agricultural sales which formed approx 34% of
the total sales in the region for FY 08-09. For the purpose of estimation of sales, the Commission had
categorized the consumer under two category i.e. metered consumers and un-metered consumers. While
Assessment of reasons for financial viability of utilities
-21-
the metered category consists of Domestic, LT and HT Commercial, LT and HT Industry, LT and HT
Water Supply, HT Irrigation and HT Residential consumers, the unmetered category comprised of
consumers categorized under of Bhagya Jyothi, Kutir Jyoti, LT Irrigation Pump sets and LT Street Lights.
The Commission has been estimating the sales to various metered categories of consumers based on
the CAGR for short-term (2 years) to medium-term (5 years). However, for estimation of the sales to un-
metered category of consumers, the Commission has considered the number of installation and their
trends in average consumption level of past years. In the MYT Tariff Order i.e. during FY 2007-08 to FY
2009-10, the Commission had approved the un-metered sale based on the CAGR for growth of
installations & energy consumption. The sales was further adjusted for number of factors like population,
Government policies, number of hours of supply, target set, TERI report and sales proposed by the
DISCOMs.
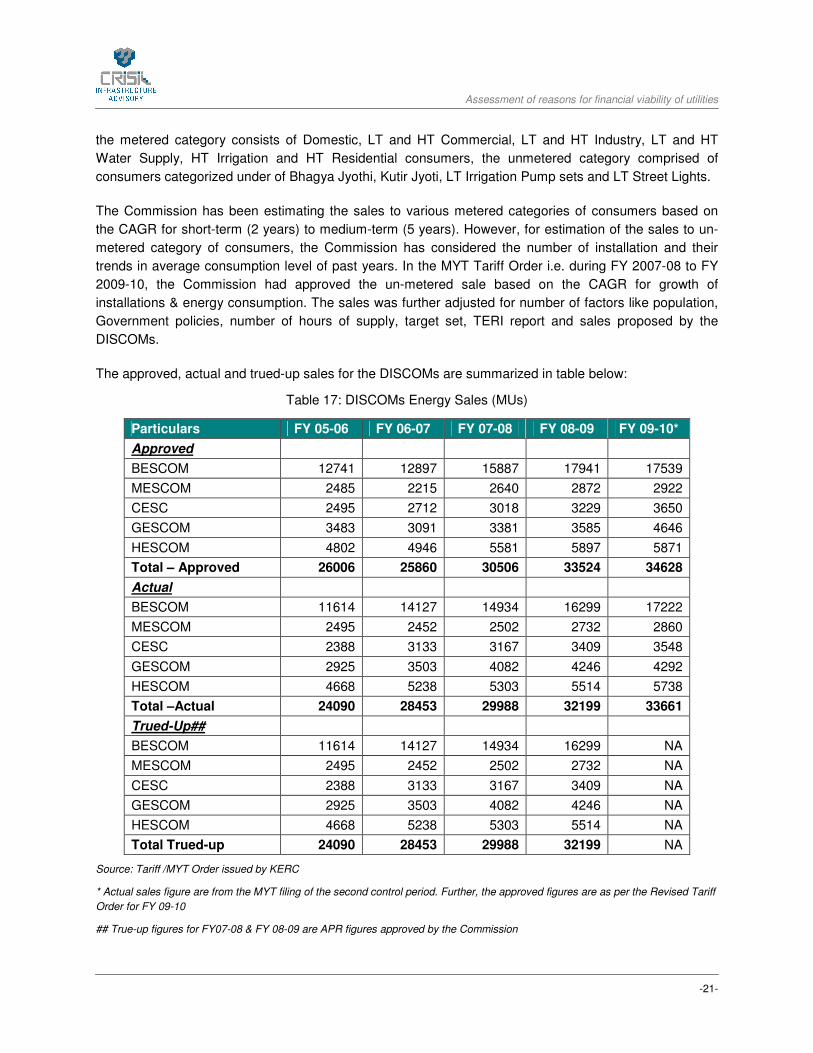
The approved, actual and trued-up sales for the DISCOMs are summarized in table below:
Table 17: DISCOMs Energy Sales (MUs)
Particulars FY 05-06 FY 06-07 FY 07-08 FY 08-09 FY 09-10*
Approved
BESCOM 12741 12897 15887 17941 17539
MESCOM 2485 2215 2640 2872 2922
CESC 2495 2712 3018 3229 3650
GESCOM 3483 3091 3381 3585 4646
HESCOM 4802 4946 5581 5897 5871
Total – Approved 26006 25860 30506 33524 34628
Actual
BESCOM 11614 14127 14934 16299 17222
MESCOM 2495 2452 2502 2732 2860
CESC 2388 3133 3167 3409 3548
GESCOM 2925 3503 4082 4246 4292
HESCOM 4668 5238 5303 5514 5738
Total –Actual 24090 28453 29988 32199 33661
Trued-Up##
BESCOM 11614 14127 14934 16299 NA
MESCOM 2495 2452 2502 2732 NA
CESC 2388 3133 3167 3409 NA
GESCOM 2925 3503 4082 4246 NA
HESCOM 4668 5238 5303 5514 NA
Total Trued-up 24090 28453 29988 32199 NA
Source: Tariff /MYT Order issued by KERC
* Actual sales figure are from the MYT filing of the second control period. Further, the approved figures are as per the Revised Tariff
Order for FY 09-10
## True-up figures for FY07-08 & FY 08-09 are APR figures approved by the Commission
Assessment of reasons for financial viability of utilities
-22-
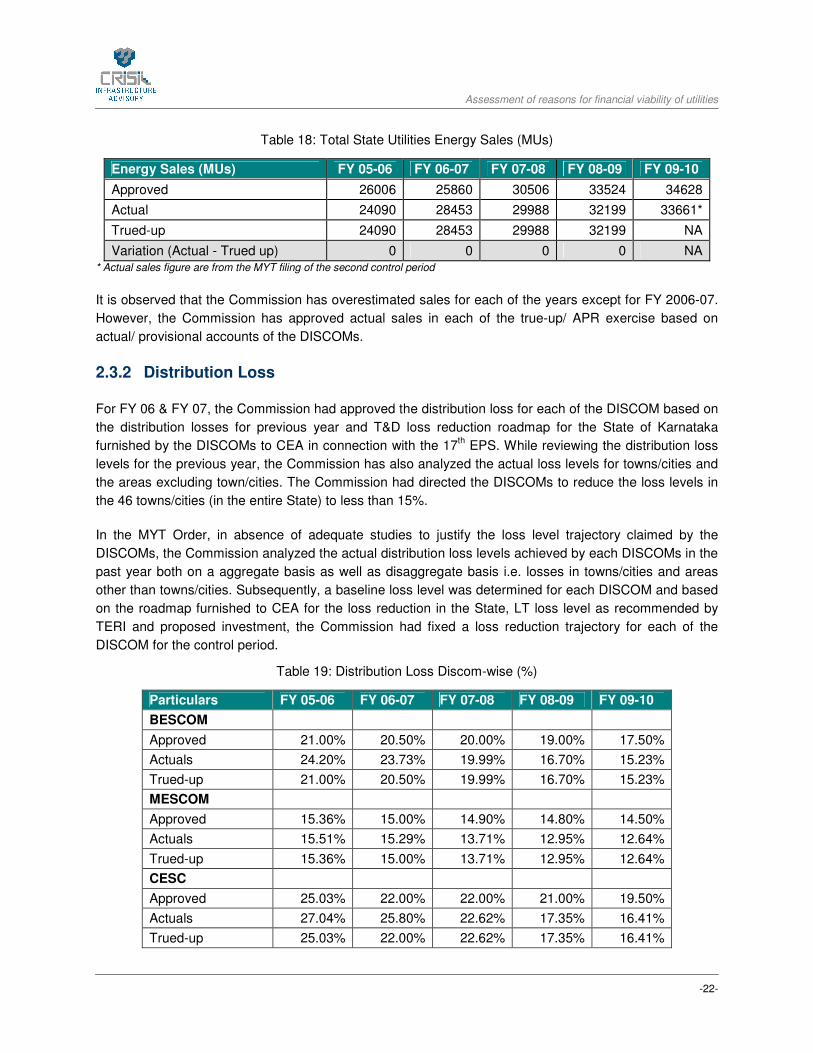
Table 18: Total State Utilities Energy Sales (MUs)
Energy Sales (MUs) FY 05-06 FY 06-07 FY 07-08 FY 08-09 FY 09-10
Approved 26006 25860 30506 33524 34628
Actual 24090 28453 29988 32199 33661*
Trued-up 24090 28453 29988 32199 NA
Variation (Actual - Trued up) 0 0 0 0 NA * Actual sales figure are from the MYT filing of the second control period
It is observed that the Commission has overestimated sales for each of the years except for FY 2006-07.
However, the Commission has approved actual sales in each of the true-up/ APR exercise based on
actual/ provisional accounts of the DISCOMs.
2.3.2 Distribution Loss
For FY 06 & FY 07, the Commission had approved the distribution loss for each of the DISCOM based on
the distribution losses for previous year and T&D loss reduction roadmap for the State of Karnataka
furnished by the DISCOMs to CEA in connection with the 17th EPS. While reviewing the distribution loss
levels for the previous year, the Commission has also analyzed the actual loss levels for towns/cities and
the areas excluding town/cities. The Commission had directed the DISCOMs to reduce the loss levels in
the 46 towns/cities (in the entire State) to less than 15%.
In the MYT Order, in absence of adequate studies to justify the loss level trajectory claimed by the
DISCOMs, the Commission analyzed the actual distribution loss levels achieved by each DISCOMs in the
past year both on a aggregate basis as well as disaggregate basis i.e. losses in towns/cities and areas
other than towns/cities. Subsequently, a baseline loss level was determined for each DISCOM and based
on the roadmap furnished to CEA for the loss reduction in the State, LT loss level as recommended by
TERI and proposed investment, the Commission had fixed a loss reduction trajectory for each of the
DISCOM for the control period.
Table 19: Distribution Loss Discom-wise (%)
Particulars FY 05-06 FY 06-07 FY 07-08 FY 08-09 FY 09-10
BESCOM
Approved 21.00% 20.50% 20.00% 19.00% 17.50%
Actuals 24.20% 23.73% 19.99% 16.70% 15.23%
Trued-up 21.00% 20.50% 19.99% 16.70% 15.23%
MESCOM
Approved 15.36% 15.00% 14.90% 14.80% 14.50%
Actuals 15.51% 15.29% 13.71% 12.95% 12.64%
Trued-up 15.36% 15.00% 13.71% 12.95% 12.64%
CESC
Approved 25.03% 22.00% 22.00% 21.00% 19.50%
Actuals 27.04% 25.80% 22.62% 17.35% 16.41%
Trued-up 25.03% 22.00% 22.62% 17.35% 16.41%

Assessment of reasons for financial viability of utilities
-23-
Particulars FY 05-06 FY 06-07 FY 07-08 FY 08-09 FY 09-10
GESCOM
Approved 27.04% 27.05% 27.05% 26.50% 25.00%
Actuals 39.10% 35.52% 26.03% 26.01% 25.53%
Trued-up 27.04% 27.05% 26.03% 26.01% 25.53%
HESCOM
Approved 26.37% 25.00% 25.00% 24.00% 22.50%
Actuals 28.19% 27.82% 25.06% 25.15% 24.38%
Trued-up 26.37% 25.00% 25.06% 25.15% 24.38%
In the true-up exercise for FY 05-06 and FY 06-07, the Commission has retained the distribution loss
target as approved in the tariff orders. Therefore, power purchase quantum and cost on account of higher
than approved distribution loss level was borne by the DISCOMs which is detailed out in the subsequent
power purchase section.
During the MYT Control period i.e. FY 07-08 onwards, any incentive/ penalty for the over/under
achievement in distribution losses by the DISCOMs have not been accounted for in the respective year.
The Commission has viewed that the incentive/ penalty applicable to each DISCOM would be adjusted at
the end of the Control Period at the time of true-up for FY 2009-10. As per the Regulations on MYT
Distribution Tariff, 2006:
“In case the actual distribution loss exceeds the normative loss level approved by the Commission, such
excess loss shall be to the account of the Distribution Licensee.
In case the actual distribution loss is less than the approved loss level, such savings shall be shared
between the distribution licensee and the consumers in the ratio of 70:30 during the first Control Period and
in the ratio as may be decided by the Commission in the subsequent Control periods.”
Consolidated approved, actual and trued-up distribution loss for the DISCOMs of Karnataka is
summarized in the table below:
Table 20: Consolidated Distribution Loss Targets (%)
Particulars FY 05-06 FY 06-07 FY 07-08 FY 08-09 FY 09-10
Approved 22.80% 21.96% 21.59% 20.64% 19.15%
Actual 26.67% 25.77% 21.61% 19.37% 18.28%
Trued-up 22.75% 21.95% 21.61%* 19.37%* NA
Disallowance (Trued-up – Actual) (3.92%) (3.81%) NA NA NA * True-up figures for FY07-08 & FY 08-09 are as per APR Order
2.3.3 Power Purchase
The major sources of power purchase for the Karnataka DISCOMs are State Generating Stations, KPCL,
Central Generating Stations, Independent power producers (IPP), bilateral arrangements and others. In
line with the terms of Section 39(1) of EA 2003, the GoK vide Order dated 10.05.2005 had notified the
Assessment of reasons for financial viability of utilities
-24-
transfer of the existing PPAs of KPTCL to the DISCOMs in proportion of the energy consumption during
FY 2004-05. The renewable energy projects were assigned to the DISCOMs based on the geographical
location of the projects. The GoK had also considered the consumer mix of each DISCOM at the time of
allocation of PPAs. Therefore, considering the favourable consumer mix of BESCOM and MESCOM,
costlier energy was allocated to these DISCOMs.
The power purchase cost has been the highest cost incidence component in the overall ARR of the
DISCOMs. For approval of the power purchase cost, the Commission has applied the merit order
dispatch to approve the source-wise availability and cost. However, the Commission has included power
available from the must run generating stations and energy from renewable sources.
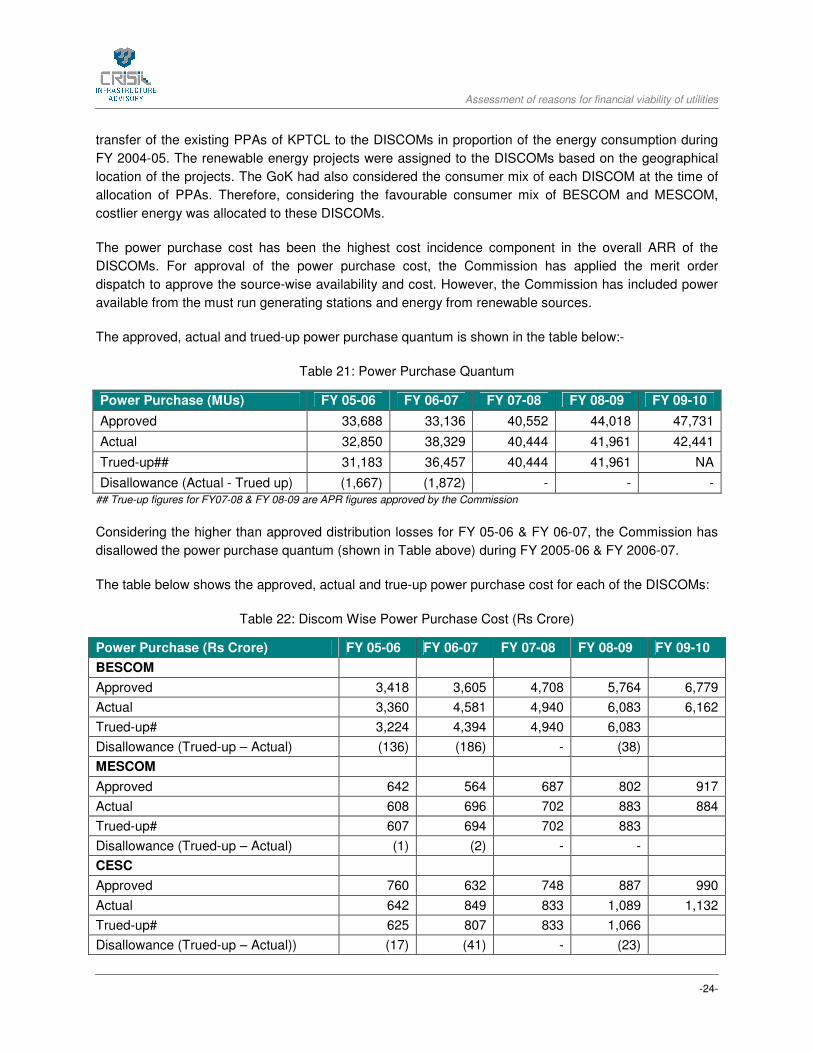
The approved, actual and trued-up power purchase quantum is shown in the table below:-
Table 21: Power Purchase Quantum
Power Purchase (MUs) FY 05-06 FY 06-07 FY 07-08 FY 08-09 FY 09-10
Approved 33,688 33,136 40,552 44,018 47,731
Actual 32,850 38,329 40,444 41,961 42,441
Trued-up## 31,183 36,457 40,444 41,961 NA
Disallowance (Actual - Trued up) (1,667) (1,872) - - -
## True-up figures for FY07-08 & FY 08-09 are APR figures approved by the Commission
Considering the higher than approved distribution losses for FY 05-06 & FY 06-07, the Commission has
disallowed the power purchase quantum (shown in Table above) during FY 2005-06 & FY 2006-07.
The table below shows the approved, actual and true-up power purchase cost for each of the DISCOMs:
Table 22: Discom Wise Power Purchase Cost (Rs Crore)
Power Purchase (Rs Crore) FY 05-06 FY 06-07 FY 07-08 FY 08-09 FY 09-10
BESCOM
Approved 3,418 3,605 4,708 5,764 6,779
Actual 3,360 4,581 4,940 6,083 6,162
Trued-up# 3,224 4,394 4,940 6,083
Disallowance (Trued-up – Actual) (136) (186) - (38)
MESCOM
Approved 642 564 687 802 917
Actual 608 696 702 883 884
Trued-up# 607 694 702 883
Disallowance (Trued-up – Actual) (1) (2) - -
CESC
Approved 760 632 748 887 990
Actual 642 849 833 1,089 1,132
Trued-up# 625 807 833 1,066
Disallowance (Trued-up – Actual)) (17) (41) - (23)

Assessment of reasons for financial viability of utilities
-25-
Power Purchase (Rs Crore) FY 05-06 FY 06-07 FY 07-08 FY 08-09 FY 09-10
GESCOM
Approved 1,009 708 889 1,085 1,166
Actual 885 958 1,157 1,137 1,276
Trued-up# 738 847 1,157 1,135
Disallowance (Trued-up – Actual)) (146) (111) - (2)
HESCOM
Approved 1,440 1,117 1,381 1,638 1,792
Actual 1,237 1,314 1,394 1,897 1,783
Trued-up# 1,206 1,264 1,394 1,897
Disallowance ((Trued-up – Actual)) (30) (49) - -
Consolidated
Approved 7,269 6,626 8,414 10,175 11,642
Actual 6,731 8,398 9,025 11,089 11,238
Trued-up# 6,400 8,007 9,025 11,026
Variation (Trued-up – Actual)) (331) (391) - (63) # True-up figures for FY07-08 & FY 08-09 are APR figures approved by the Commission
The Commission has disallowed power purchase quantum on account of under achievement of
distribution loss targets set in the Tariff Orders for FY 2005-06 & FY 2006-07. Therefore, corresponding
power purchase cost w.r.t. disallowed power purchase quantum has been reduced from the actual power
purchase cost based on the average power purchase cost per unit. The disallowance in power purchase
cost of Rs 63 Crores for FY 2008-09 is on account of payment to the suppliers over and above the PPA
agreed rate of power purchase.
2.3.4 Operation and Maintenance Expenses
Historically, O&M expense was approved by the Commission based on the historical trend as well as the
inflationary growth rates over actual past expenses. But with the implementation of Multi Year Tariff
(MYT) Regulations in FY 07-08, the operation & maintenance expenses have been estimated considering
the norms provided in the MYT Regulations.
For the MYT Control Period, the Commission had considered the weighted average rate of CPI and WPI
to compute the average inflation rate. Since CPI (Industrial Workers) represents the inflationary pressure
for increase for employee expenses and WPI represents the inflationary increase for A&G and R&M
expenses, the Commission had considered 70% weightage for CPI and 30% weightage for WPI. Based
on the actual CPI and WPI for FY 07, the inflation factor was computed at 5.37%. Further, in addition to
the increase in O&M expense on account of inflation, the Commission had also considered an increase in
O&M expenses due to the growth in business (based on increase in consumer numbers) and a reduction
on account of gains due to efficiency factor.
Assessment of reasons for financial viability of utilities
-26-
The Commission approved the following formula for approval of O&M expenses. The same is used for
projecting the O&M expenses for the control period.
O&M Cost t = O&M Cost t-1 * [1 + (WII + CGI – X)]
Where,
‘O&M Cost t’ is the normative O&M cost aproved by the Commission for the financial year t,
‘WII’ is the weighted inflation index of CPI and WPI based on the contribtion of employee cost,
R&M and A&G towards the total O&M cost
‘CGI’ is the Consumer growth index, which is linked to increase (CAGR) in no of consumers
‘X’ is the efficiency factor
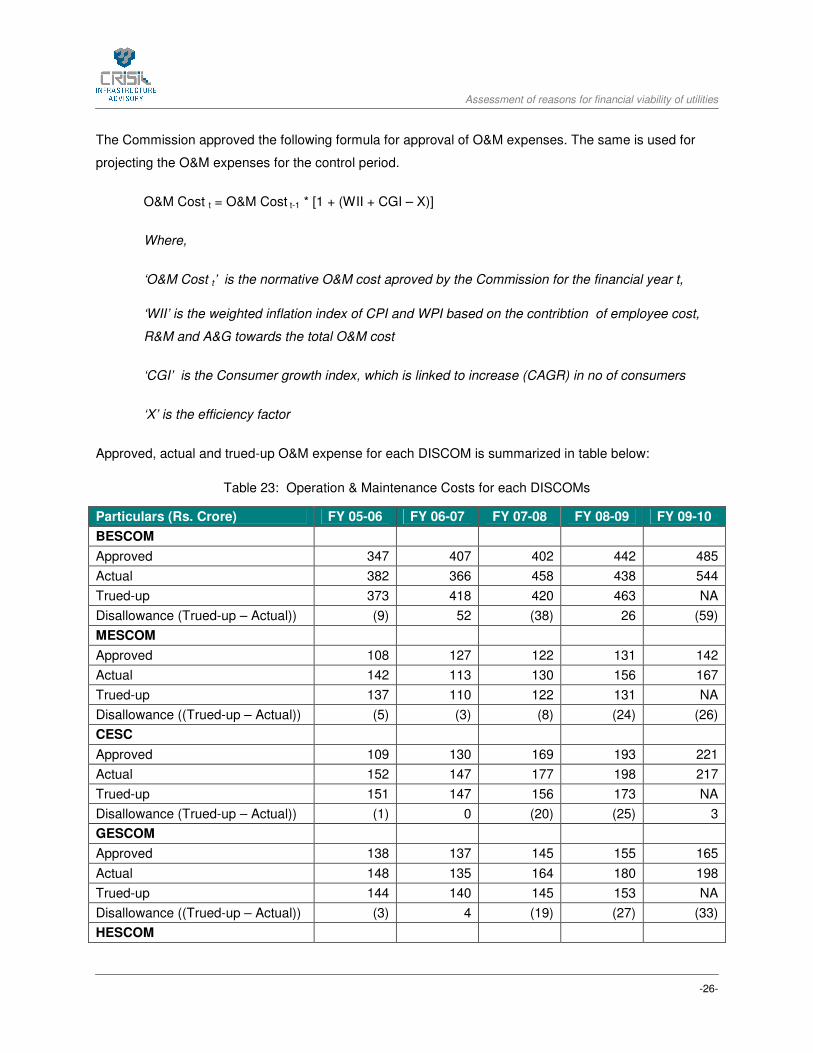
Approved, actual and trued-up O&M expense for each DISCOM is summarized in table below:
Table 23: Operation & Maintenance Costs for each DISCOMs
Particulars (Rs. Crore) FY 05-06 FY 06-07 FY 07-08 FY 08-09 FY 09-10
BESCOM
Approved 347 407 402 442 485
Actual 382 366 458 438 544
Trued-up 373 418 420 463 NA
Disallowance (Trued-up – Actual)) (9) 52 (38) 26 (59)
MESCOM
Approved 108 127 122 131 142
Actual 142 113 130 156 167
Trued-up 137 110 122 131 NA
Disallowance ((Trued-up – Actual)) (5) (3) (8) (24) (26)
CESC
Approved 109 130 169 193 221
Actual 152 147 177 198 217
Trued-up 151 147 156 173 NA
Disallowance (Trued-up – Actual)) (1) 0 (20) (25) 3
GESCOM
Approved 138 137 145 155 165
Actual 148 135 164 180 198
Trued-up 144 140 145 153 NA
Disallowance ((Trued-up – Actual)) (3) 4 (19) (27) (33)
HESCOM

Assessment of reasons for financial viability of utilities
-27-
Particulars (Rs. Crore) FY 05-06 FY 06-07 FY 07-08 FY 08-09 FY 09-10
Approved 207 257 232 247 262
Actual 264 218 266 267 290
Trued-up 258 212 238 257 NA
Disallowance ((Trued-up – Actual)) (6) (6) (27) (9) (28)
The consolidated disallowance on account of O&M expenses for the DISCOMs is shown in the table
below:
Table 24: Consolidated Operation & Maintenance Costs
Particulars (Rs. Crore) FY 05-06 FY 06-07 FY 07-08 FY 08-09 FY 09-10
Approved 909 1056 1069 1167 1275
Actual 1087 979 1195 1239 1418
Trued-up 1063 1027 1081 1179 NA
Disallowance (Trued-up – Actual) (25) 48 (114) (60) NA
Disallowance in O&M expense in the true-up for FY 2005-06 & FY 2006-07 is primarily on account of
bonus issuance and free/subsidised electricity for employees. However, the trued-up O&M expense is
higher than the approved figure for FY 06-07. The same is primarily due to inclusion of Rs 67.92 Crore on
account of pay revision arrears as per the Appellate Tribunal for Electricity Order.
For the 1st control period the O&M expenses were approved based on the normative estimation formulae
and disallowance over and above the normative amount was done by the Commission in the APR Order.
2.3.5 Depreciation
The depreciation for the initial FY 2005-06 & FY 2006-07 was true-up as per actual and hence there is no
financial impact on account of the same. In the MYT Order as well as the APR for the Control period, the
approved and trued-up depreciation figures are higher than the actual on account of advance against
depreciation which has been included along with the approval for depreciation. The consolidated
approved, actual and trued-up depreciation figures are summarized in table below:
Table 25: Consolidated Depreciation (Rs Crore)
Particulars (Rs. Crore) FY 05-06 FY 06-07 FY 07-08 FY 08-09 FY 09-10
Approved 344 160 446 525 611
Actual 296 236 160 202 354
Trued-up 296 236 530 434 NA
Disallowance (Trued-up – Actual) - - 370 232 NA
The higher approval for Rs 370 Crore and Rs 232 Crores for FY 07-08 & FY 08-09, respectively in the
true-up is primarily on account of approval of advance against depreciation by the Commission.

Assessment of reasons for financial viability of utilities
-28-
1.1.1. Interest and Finance Charges
The interest and finance charges comprised of interest on capital loans, interest on consumer security
deposit, interest on belated power purchase payments, interest on working capital and other interest &
finance charges. In the Tariff Order for FY 05-06 and FY 06-07, the Commission had approved the
interest for unsecured loans as part of total interest cost approved for each DISCOMs. However, under
the MYT framework, the Commission computed the requirement of working capital based on the following
norms:
� One month’s O&M Expenses
� Stores, Materials and supplies as 1% of the opening GFA and
� Two months of receivable (based on the approved ARR of previous year)
Interest on capital loans were approved after undertaking a scheme-wise analysis for FY 05-06 & FY 06-
07. Interest cost on new loans was disallowed by the Commission as the same would be considered in
the ARR of subsequent year based on the capitalized assets and actual investments. Moreover, interest
on payment of power purchase bills for past period was also disallowed. For the control period i.e. from
FY 07-08 to FY 09-10, the Commission had allowed interest on new loans on the proposed capital
investment as per the normative debt of 70% in accordance with the Order of the Hon’ble ATE. Interest
on existing loan was approved based on the outstanding amount as per the audited balance sheet of the
DISCOMs.
Apart from the capital and working capital loans, the Commission had allowed interest on consumer
deposits and other financial charges. The growth in the amount of consumer deposit for the ensuing
years was estimated based on the CAGR of past three years.
The DISCOM-wise approved, actual and trued-up interest and finance charges are summarized in table
below:
Table 26: Interest & Finance Charges
Particulars (Rs. Crore) FY 05-06 FY 06-07 FY 07-08 FY 08-09 FY 09-10
BESCOM
Approved 66 125 294 377 442
Actuals 103 137 172 123 187
Trued-up 100 119 269 287 NA
Variation (3) (18) 97 164 NA
MESCOM
Approved 17 41 54 67 81
Actuals 32 42 45 49 85
Trued-up 28 28 53 61 NA
Variation (3) (14) 8 12 NA
CESC
Assessment of reasons for financial viability of utilities
-29-
Particulars (Rs. Crore) FY 05-06 FY 06-07 FY 07-08 FY 08-09 FY 09-10
Approved 17 24 67 87 111
Actuals 26 40 52 67 93
Trued-up 23 31 54 54 NA
Variation (2) (8) 2 (13) NA
GESCOM
Approved 34 20 91 144 185
Actuals 19 66 103 93 132
Trued-up 19 37 83 90 NA
Variation 0 (29) (20) (3) NA
HESCOM
Approved 43 57 167 218 253
Actuals 75 130 160 194 267
Trued-up 70 92 164 175 NA
Variation (5) (38) 4 (19) NA
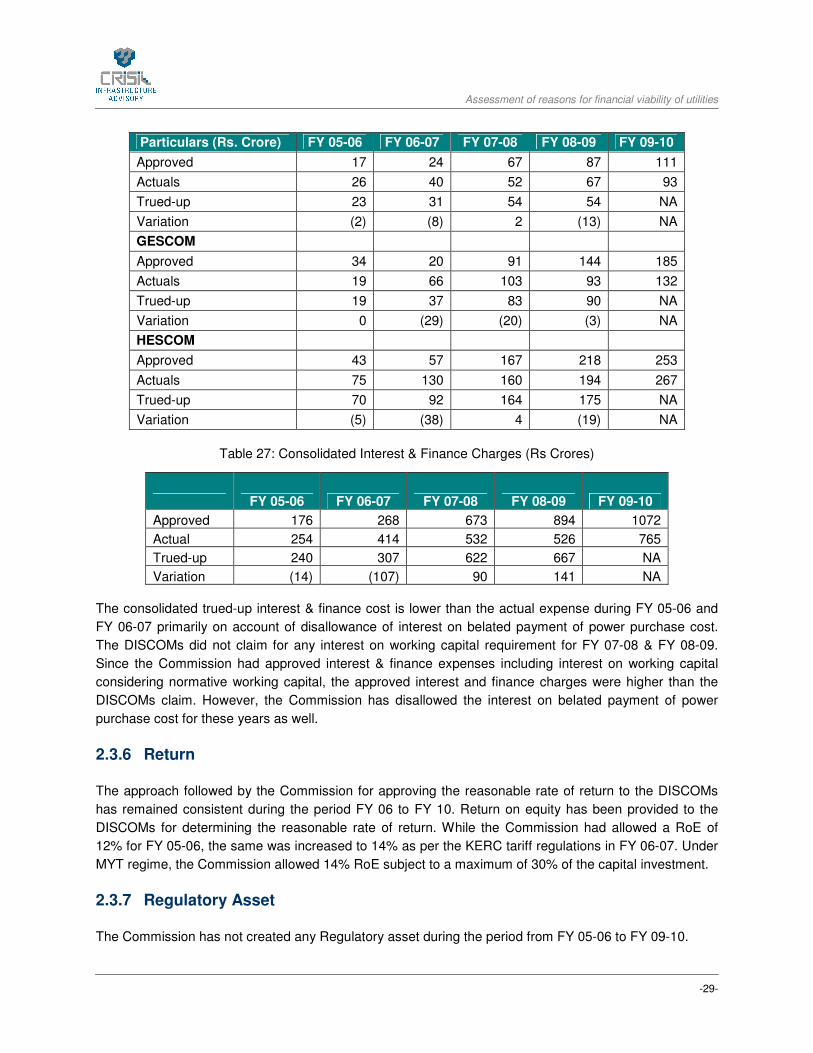
Table 27: Consolidated Interest & Finance Charges (Rs Crores)
FY 05-06 FY 06-07 FY 07-08 FY 08-09 FY 09-10
Approved 176 268 673 894 1072
Actual 254 414 532 526 765
Trued-up 240 307 622 667 NA
Variation (14) (107) 90 141 NA
The consolidated trued-up interest & finance cost is lower than the actual expense during FY 05-06 and
FY 06-07 primarily on account of disallowance of interest on belated payment of power purchase cost.
The DISCOMs did not claim for any interest on working capital requirement for FY 07-08 & FY 08-09.
Since the Commission had approved interest & finance expenses including interest on working capital
considering normative working capital, the approved interest and finance charges were higher than the
DISCOMs claim. However, the Commission has disallowed the interest on belated payment of power
purchase cost for these years as well.
2.3.6 Return
The approach followed by the Commission for approving the reasonable rate of return to the DISCOMs
has remained consistent during the period FY 06 to FY 10. Return on equity has been provided to the
DISCOMs for determining the reasonable rate of return. While the Commission had allowed a RoE of
12% for FY 05-06, the same was increased to 14% as per the KERC tariff regulations in FY 06-07. Under
MYT regime, the Commission allowed 14% RoE subject to a maximum of 30% of the capital investment.
2.3.7 Regulatory Asset
The Commission has not created any Regulatory asset during the period from FY 05-06 to FY 09-10.

Assessment of reasons for financial viability of utilities
-30-
2.3.8 Subsidy
The Commission computes the subsidy requirement of each DISCOM in the Tariff/ APR Order and has
directed the GoK to release the respective subsidy amount in advance on quarterly basis. The major
subsidized categories are the Bhagya Jyoti / Kutir Jyoti and IP sets consumers. Each year the subsidy
amount requirement is estimated by the Commission and the ESCOM’s are directed to take up the
collection of subsidy amount from the GoK. The GoK commits the amount of subsidy that would be
released each year for each of the utilities. The approved subsidy amount and release of subsidy by the
GoK accounted in the audited/provisional accounts is shown in the table below.
Table 28: Approved and Received Subsidy
Particulars (Rs. Crore) FY 05-06 FY 06-07 FY 07-08 FY 08-09
Subsidy Approved
BESCOM 0 361
MESCOM 0 195
CESC 204 348
GESCOM 342 253
HESCOM 773 624
Total 1319 1781
Subsidy Received
BESCOM - -
MESCOM - -
CESC 182 286
GESCOM 383 369
HESCOM 661 640
Total 1,225 1,295
Surplus/ (Shortfall) in subsidy receipt
(93) (486) (224)* (2351)*
* Additional subsidy requirement as approved by the Commission in the APR for FY 07-08 & FY 08-09
It is observed that the release of subsidy is not equal to the amount of subsidy estimated by the
Commission. Also, the Commission in the true-up for FY 05-06 & FY 06-07 has considered the GoK
committed subsidy at the time of issuance of the Tariff Orders for the respective years in spite of a lower
subsidy realization by the individual DISCOM. For FY 07-08 & FY 08-09, the Commission in the APR
exercise has considered the revenue deficit to be funded from additional subsidy from GoK. Therefore,
delay and shortfall in receipt of subsidy amount from the Government would impact the financial health of
the DISCOMs.
2.3.9 Tariff Increase
The Commission reduced the tariffs in the State for FY 2006-07 in view of the surplus available after
considering the GoK committed subsidy amount. In the MYT Order, the Commission approved differential
tariff for the DISCOMs. The retail tariffs for FY 07-08 were further reduced considering the GoK
committed subsidy. In absence of issuance of an Order, the tariff for FY 08-09 remained unchanged

Assessment of reasons for financial viability of utilities
-31-
followed by an increase in FY 09-10. The tariff revision in Karnataka during FY 06-07 to FY 09-10 is
summarized in table below:
Table 29: Tariff Revision
Tariff FY 06-07 FY 07-08 FY 08-095 FY 09-10
BESCOM Reduction of tariff by
15 to 20 Paise -5.59% No Change 8.74%
MESCOM Reduction of tariff by
15 to 20 Paise -4.23% No Change 6.12%
CESC Reduction of tariff by
15 to 20 Paise -4.03% No Change 5.87%
GESCOM Reduction of tariff by
15 to 20 Paise No Increase/
Decrease No Change 6.52%
HESCOM Reduction of tariff by
15 to 20 Paise -3.79% No Change 6.13%
2.3.10 Issuance of True up Order
The table below summarises the time lag between finalization of accounts and True up order.
Table 30: Lag time between Finalisation of Accounts & Issuance of True-up Order
Particulars FY 05-06 FY 06-07 FY 07-08 FY 08-09
Issuance of Tariff Order 27-Sep-05 16-Oct-06 22-Jan-08 MYT Order
Finalisation of Annual Accounts for the Year (A) 30-Sep-05 30-Sep-06 30-Sep-07 30-Sep-08
Issuance of True-up/APR Order (B) 22-Jan-08 21-Feb-08 25-Nov-09 25-Nov-09
Time lag between Finalisation of Accounts and True-up Order (A-B) days
844 509 787 421
The Commission had provided for the carrying cost of revenue gap/surplus that was estimated in the true-
up exercise undertaken for FY 02-03 to FY 05-06. Since there was a surplus of Rs 701.45 Crores the
amount was deducted in the MYT Order. Similarly, carrying cost on the surplus amount post the truing up
exercise was considered by the Commission. The revenue gap estimated from the ARR of each of the
years FY 2007-08 & FY 2008-09 has been considered to be met through the Government subsidy as the
same is primarily on account of consumption of energy by BJ/KJ & IP Set consumer. The Commission
has directed the GoK to release the additional subsidy amount in maximum of twelve monthly instalments
and also directed the DISCOMs to take up the matter with GoK for release of additional subsidy.
5 The MYT Order for FY 2007-08 to FY 2009-10 was issued on 22
nd January, 2008. Therefore, the tariff approved in the MYT Order
remained applicable for FY 08-09 as well.

Assessment of reasons for financial viability of utilities
-32-
3 MADHYA PRADESH
3.1 Introduction
In the state of Madhya Pradesh, Madhya Pradesh Electricity Regulatory Commission is responsible for
the issue of tariff orders. The Government of Madhya Pradesh (GoMP) on 31st May, 2005 restructured the
functions and undertakings of Generation, Transmission and Distribution and Retail supply of electricity
earlier being carried out by the Madhya Pradesh Electricity Board (MPSEB) to five companies i.e. 3
DISCOMs, one Generating and one Transmission company each. With effect from 1st June, 2005, the
O&M agreement between MPSEB and the five companies came to an end and thereafter the three
DISCOMS started functioning independently as distribution Licensees in their respective areas of
License. Madhya Pradesh Power Generating Company Ltd (MPPGCL)was made responsible for
generation and Madhya Pradesh Power Transmission MPPTCL was to provide transmission services for
conveyance of electricity from generation stations of MP Power Generating Company Limited (MPPGCL)
and other generating stations and also interconnection points of Power Grid Corporation of India Limited
(PGCIL) and other Transmission Licensees to the interconnection points of the long-term users in the
State and also undertake the functions of the State Transmission Utility (STU), State Load Despatch
Centre and System Operators as provided in the Electricity Act, 2003. The Distribution function was
given to three Distribution Companies viz:
• Madhya Pradesh Poorva Kshetra Vidyut Vitaran Company (East),
• Madhya Pradesh Paschim Kshetra Vidyut Vitaran Company (West) and
• Madhya Pradesh Madhya Kshetra Vidyut Vitaran Company (Central)
3.2 Key Findings
The increase in financial losses of DISCOMs can be attributed to following factors:
• The Commission disallows power purchase quantum of DISCOMs on account of high T&D loss.
The Commission disallows sales while truing up which in turn results in lower estimation of Power
purchase requirement. The disallowance of sales is mainly done for unmetered agriculture
category.
• disallowance of the interest cost due to licensee’s failure to provide information related to loan
mapping with particular assets submitted by the DISCOMs.
Table below summarises the impact of all these factors in terms of financial numbers
S.No. Attribute Financial loss (FY 07-08) in
Rs Crs

Assessment of reasons for financial viability of utilities
-33-
1 Disallowance of Power purchase 1290.93
2 Disallowance of Interest and finance charges 152.59
3 Disallowance on account of depreciation 84.62
Total 1528.14
Note: In addition to the disallowance of Rs.1528.14 Crore mentioned in the table above, there is an additional burden
on account of carrying cost on the uncovered gap. The carrying cost impact of the same has been computed to the
tune of Rs. 49.08 Crore (as detailed in para 1.3.13 “Issuance of True up Order & its impact on working capital”).
3.3 Approach followed for approving various components
In this section we bring forth the approach adopted by the Commission for approving various components
which have bearing on the financial viability of the distribution utility.
Note: Proposed refers to figures proposed by the utilities, Approved refers to figures approved by Commission, Actual refers to
actual figures as per audited accounts of DISCOMs, and Trued up refers to figures as per True Up orders by Commission.
Note: Tariff order for FY 05-06 was for the period of 10 months due to the unbundling activity being carried out and therefore the
numbers are for 10 months and not 12 months. Also the approach followed for FY 05-06 is different for the year post FY 05-06 due
to delay in the finalization of Terms and Conditions of Tariff, 2005... The section below details down the approach followed years
post FY 05-06.
3.3.1 Sales
For metered categories the Commission arrived at sales by taking the sales forecast of the DISCOMs and
trend in past sales. The sales forecasted by DISCOMs are based on the CAGR of 5 years sales,
connected loads and number of consumers.
For Unmetered domestic category, the Commission arrived at sales differently for different years. E.g. for
the year FY 07-08 domestic category were billed on the basis of 77 units per consumer per month in
urban areas, and 38 units per consumer per month in rural areas. For FY 08-09,the Commission
approved the sales to unmetered domestic category on the assumption of 30 units per consumer per
month instead of 38 units per consumer per month for rural customers. For FY 09-10 the Commission
accepted the sales projection by board and approved the proposed sales and directed that the sales for
unmetered domestic category would be computed as per norms set up during true up. The norms were
� Un-metered consumers in domestic category to billed on the basis of 77 units per consumer
per month in urban areas, and 38 units per consumer per month in rural areas;
� Un-metered agriculture consumers in rural areas as notified by GoMP under the Electricity
Act, 2003 to be billed on the basis of 100 units per HP of sanctioned load per month for
permanent connections and 130 units per HP of sanctioned load per month for temporary
connections.
� Un-metered agriculture consumers in urban areas to be billed on the basis of 130 units per
HP of sanctioned load per month for permanent connections and 150 units per HP of
sanctioned load per month for temporary connections.
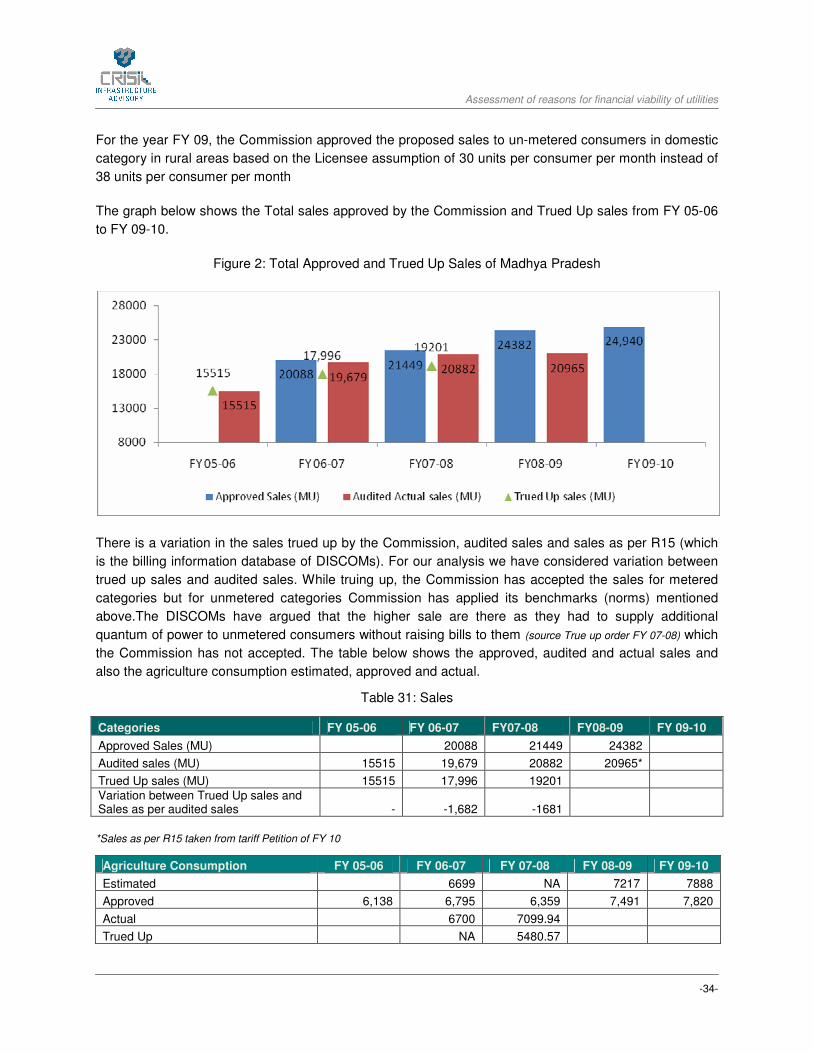
Assessment of reasons for financial viability of utilities
-34-
For the year FY 09, the Commission approved the proposed sales to un-metered consumers in domestic
category in rural areas based on the Licensee assumption of 30 units per consumer per month instead of
38 units per consumer per month
The graph below shows the Total sales approved by the Commission and Trued Up sales from FY 05-06
to FY 09-10.
Figure 2: Total Approved and Trued Up Sales of Madhya Pradesh
There is a variation in the sales trued up by the Commission, audited sales and sales as per R15 (which
is the billing information database of DISCOMs). For our analysis we have considered variation between
trued up sales and audited sales. While truing up, the Commission has accepted the sales for metered
categories but for unmetered categories Commission has applied its benchmarks (norms) mentioned
above.The DISCOMs have argued that the higher sale are there as they had to supply additional
quantum of power to unmetered consumers without raising bills to them (source True up order FY 07-08) which
the Commission has not accepted. The table below shows the approved, audited and actual sales and
also the agriculture consumption estimated, approved and actual.
Table 31: Sales
Categories FY 05-06 FY 06-07 FY07-08 FY08-09 FY 09-10
Approved Sales (MU) 20088 21449 24382
Audited sales (MU) 15515 19,679 20882 20965*
Trued Up sales (MU) 15515 17,996 19201
Variation between Trued Up sales and Sales as per audited sales - -1,682 -1681
*Sales as per R15 taken from tariff Petition of FY 10
Agriculture Consumption FY 05-06 FY 06-07 FY 07-08 FY 08-09 FY 09-10
Estimated 6699 NA 7217 7888
Approved 6,138 6,795 6,359 7,491 7,820
Actual 6700 7099.94
Trued Up NA 5480.57
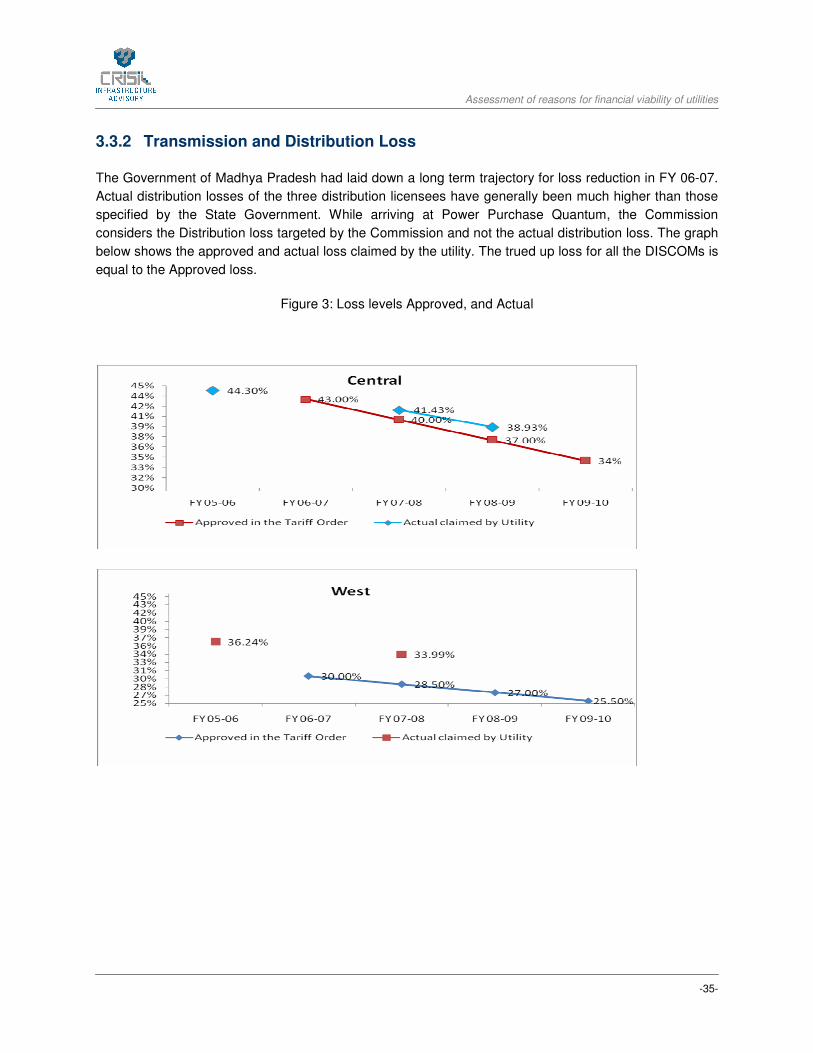
Assessment of reasons for financial viability of utilities
-35-
3.3.2 Transmission and Distribution Loss
The Government of Madhya Pradesh had laid down a long term trajectory for loss reduction in FY 06-07.
Actual distribution losses of the three distribution licensees have generally been much higher than those
specified by the State Government. While arriving at Power Purchase Quantum, the Commission
considers the Distribution loss targeted by the Commission and not the actual distribution loss. The graph
below shows the approved and actual loss claimed by the utility. The trued up loss for all the DISCOMs is
equal to the Approved loss.
Figure 3: Loss levels Approved, and Actual
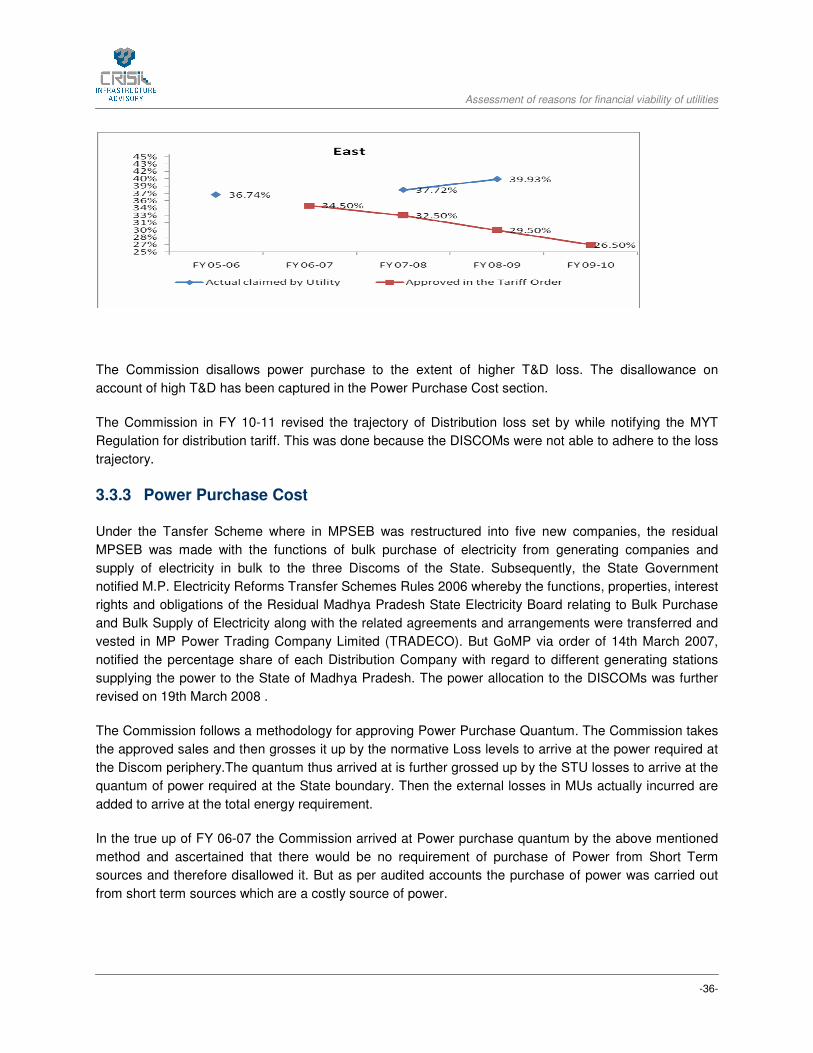
Assessment of reasons for financial viability of utilities
-36-
The Commission disallows power purchase to the extent of higher T&D loss. The disallowance on
account of high T&D has been captured in the Power Purchase Cost section.
The Commission in FY 10-11 revised the trajectory of Distribution loss set by while notifying the MYT
Regulation for distribution tariff. This was done because the DISCOMs were not able to adhere to the loss
trajectory.
3.3.3 Power Purchase Cost
Under the Tansfer Scheme where in MPSEB was restructured into five new companies, the residual
MPSEB was made with the functions of bulk purchase of electricity from generating companies and
supply of electricity in bulk to the three Discoms of the State. Subsequently, the State Government
notified M.P. Electricity Reforms Transfer Schemes Rules 2006 whereby the functions, properties, interest
rights and obligations of the Residual Madhya Pradesh State Electricity Board relating to Bulk Purchase
and Bulk Supply of Electricity along with the related agreements and arrangements were transferred and
vested in MP Power Trading Company Limited (TRADECO). But GoMP via order of 14th March 2007,
notified the percentage share of each Distribution Company with regard to different generating stations
supplying the power to the State of Madhya Pradesh. The power allocation to the DISCOMs was further
revised on 19th March 2008 .
The Commission follows a methodology for approving Power Purchase Quantum. The Commission takes
the approved sales and then grosses it up by the normative Loss levels to arrive at the power required at
the Discom periphery.The quantum thus arrived at is further grossed up by the STU losses to arrive at the
quantum of power required at the State boundary. Then the external losses in MUs actually incurred are
added to arrive at the total energy requirement.
In the true up of FY 06-07 the Commission arrived at Power purchase quantum by the above mentioned
method and ascertained that there would be no requirement of purchase of Power from Short Term
sources and therefore disallowed it. But as per audited accounts the purchase of power was carried out
from short term sources which are a costly source of power.
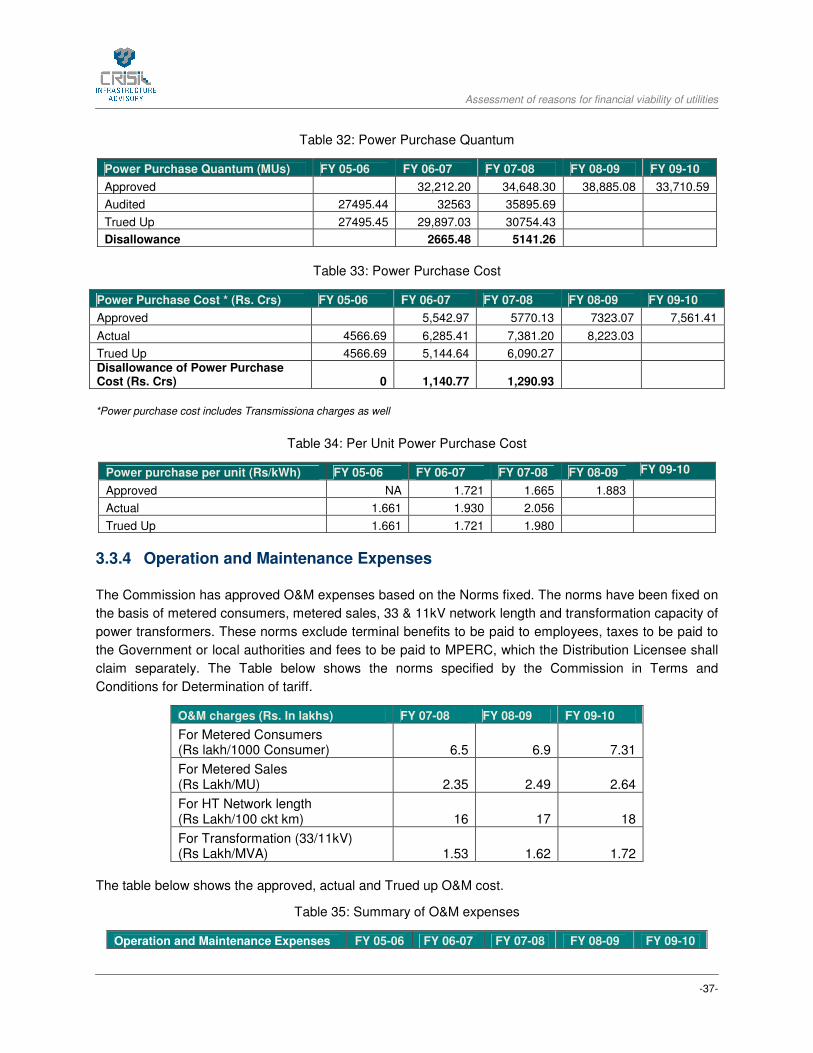
Assessment of reasons for financial viability of utilities
-37-
Table 32: Power Purchase Quantum
Power Purchase Quantum (MUs) FY 05-06 FY 06-07 FY 07-08 FY 08-09 FY 09-10
Approved 32,212.20 34,648.30 38,885.08 33,710.59
Audited 27495.44 32563 35895.69
Trued Up 27495.45 29,897.03 30754.43
Disallowance 2665.48 5141.26
Table 33: Power Purchase Cost
Power Purchase Cost * (Rs. Crs) FY 05-06 FY 06-07 FY 07-08 FY 08-09 FY 09-10
Approved 5,542.97 5770.13 7323.07 7,561.41
Actual 4566.69 6,285.41 7,381.20 8,223.03
Trued Up 4566.69 5,144.64 6,090.27 Disallowance of Power Purchase Cost (Rs. Crs) 0 1,140.77 1,290.93
*Power purchase cost includes Transmissiona charges as well
Table 34: Per Unit Power Purchase Cost
Power purchase per unit (Rs/kWh) FY 05-06 FY 06-07 FY 07-08 FY 08-09 FY 09-10
Approved NA 1.721 1.665 1.883
Actual 1.661 1.930 2.056
Trued Up 1.661 1.721 1.980
3.3.4 Operation and Maintenance Expenses
The Commission has approved O&M expenses based on the Norms fixed. The norms have been fixed on
the basis of metered consumers, metered sales, 33 & 11kV network length and transformation capacity of
power transformers. These norms exclude terminal benefits to be paid to employees, taxes to be paid to
the Government or local authorities and fees to be paid to MPERC, which the Distribution Licensee shall
claim separately. The Table below shows the norms specified by the Commission in Terms and
Conditions for Determination of tariff.
O&M charges (Rs. In lakhs) FY 07-08 FY 08-09 FY 09-10
For Metered Consumers (Rs lakh/1000 Consumer) 6.5 6.9 7.31
For Metered Sales (Rs Lakh/MU) 2.35 2.49 2.64
For HT Network length (Rs Lakh/100 ckt km) 16 17 18
For Transformation (33/11kV) (Rs Lakh/MVA) 1.53 1.62 1.72
The table below shows the approved, actual and Trued up O&M cost.
Table 35: Summary of O&M expenses
Operation and Maintenance Expenses FY 05-06 FY 06-07 FY 07-08 FY 08-09 FY 09-10

Assessment of reasons for financial viability of utilities
-38-
Approved 1130.42 1154.41 1243 1,479.23
Actual 789.65 1,059.63 1255.48 1,468.75
Trued-up 636.12 829.16 970.5
(There is wide difference in the O&M expenses approved and Trued up because as per Commission the norms prescribed for O&M
expenditure while framing the Regulations on terms and conditions of tariff for Generation, Transmission and Distribution
Companies might have been understated for the Generation and Transmission Companies and overstated for the Distribution
Companies. This was mainly because of paucity of data post unbundling for setting norms.)
The Commission True’s up O&M expenses on the basis of Norms approved taking into account the actual
additions during the year. Eg the Commission approved normative O&M expenses for FY 09-10 on the
basis of determinants viz sales, network length as per that of FY 08-09 but at the time of true up the
Commission would carry out true up on the basis of actual additions during the year.
For all the years the actual O&M cost has been greater than trued up O&M cost mainly on account of
Terminal Benefits. The disallowance on this was made on two counts. One on the issue of terminal
benefits of erstwhile MPSEB. The Commission had observed that the actual payments made for pension
and terminal benefits to all pensioners/retirees of erstwhile MPSEB have already been allowed to
MPPTCL. Second for the prospective pensioners working in the companies who retire after the date of
transfer, the Commission disallowed terminal benefits on the grounds that they are mere provision and no
funds were transferred to terminal benefit trust by these Companies. The other disallowance is on
account of insurance charges which is also a provision and no payment has been made against it. The
DISCOMs had also asked for expenses incurred by them for meeting the expenses of the erstwhile
MPSEB, the Commission disallowed it on grounds that as the MPSEB has already been disintegrated
therefore it is not a legitimate expense.
3.3.5 Capital Expenditure
The Commission has specified the “Guidelines for Capital Expenditure by the Licensees in MP”. The
Guidelines require the Licensees to submit to the Commission a five-year Business Plan containing
physical and financial details of all investment schemes planned over the five-year horizon. The
Commission had also mentioned in case the licensee deviates from the approved Business plan
DISCOMs would have to file details of all such schemes which were not approved under the business
plan.
In the tariff order of FY 09-10, the Commission has analysed that the financial progress vis-à-vis the
investment plan for FY 07-08 and FY 08-09 combined has been 45% for East Discom, 21% by Central
Discom and 92% for West DISCOM.
3.3.6 Depreciation
The Commission has not been approving depreciation as has been projected by the DISCOMs mainly on
the grounds that projections of asset addition made by the Licensee are inflated and not in conformity
with the past trend on assets. The Commission mentions that it will true up the allowed amount when the
audited balance sheet of the year comes. The table below provide details of Approved, Audited and
Trued up Depreciation.
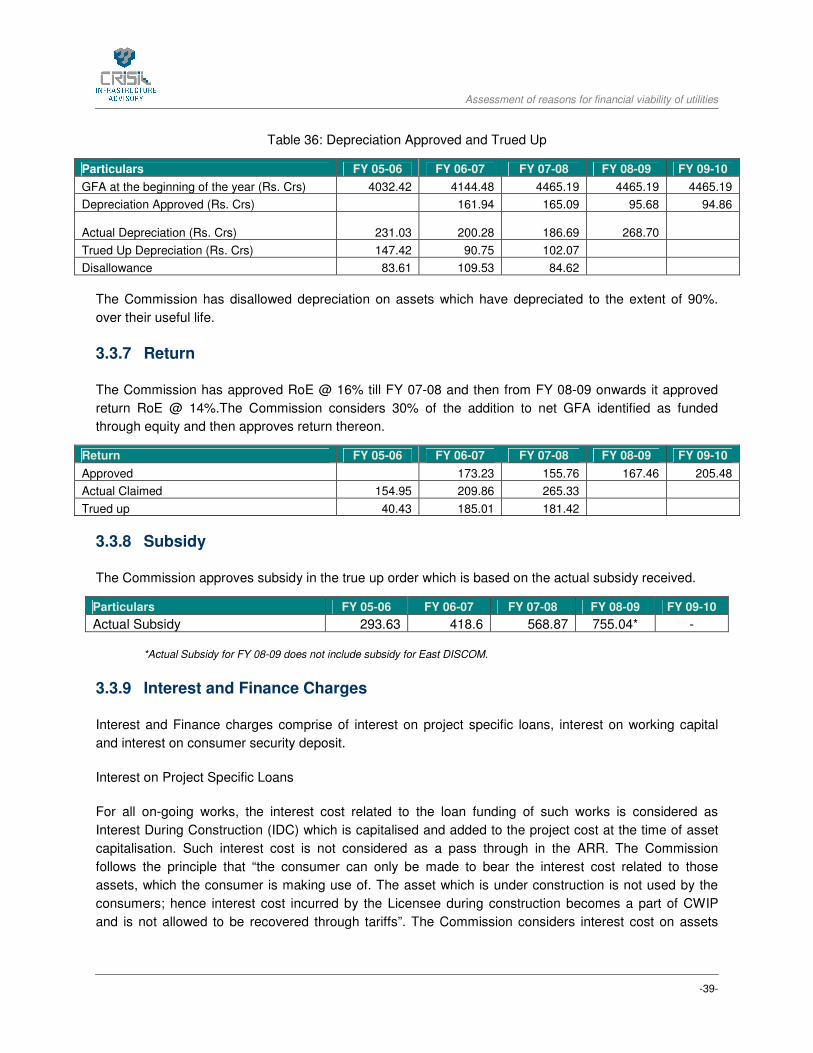
Assessment of reasons for financial viability of utilities
-39-
Table 36: Depreciation Approved and Trued Up
Particulars FY 05-06 FY 06-07 FY 07-08 FY 08-09 FY 09-10
GFA at the beginning of the year (Rs. Crs) 4032.42 4144.48 4465.19 4465.19 4465.19
Depreciation Approved (Rs. Crs) 161.94 165.09 95.68 94.86
Actual Depreciation (Rs. Crs) 231.03 200.28 186.69
268.70
Trued Up Depreciation (Rs. Crs) 147.42 90.75 102.07
Disallowance 83.61 109.53 84.62
The Commission has disallowed depreciation on assets which have depreciated to the extent of 90%.
over their useful life.
3.3.7 Return
The Commission has approved RoE @ 16% till FY 07-08 and then from FY 08-09 onwards it approved
return RoE @ 14%.The Commission considers 30% of the addition to net GFA identified as funded
through equity and then approves return thereon.
Return FY 05-06 FY 06-07 FY 07-08 FY 08-09 FY 09-10
Approved 173.23 155.76 167.46 205.48
Actual Claimed 154.95 209.86 265.33
Trued up 40.43 185.01 181.42
3.3.8 Subsidy
The Commission approves subsidy in the true up order which is based on the actual subsidy received.
Particulars FY 05-06 FY 06-07 FY 07-08 FY 08-09 FY 09-10
Actual Subsidy 293.63 418.6 568.87 755.04* -
*Actual Subsidy for FY 08-09 does not include subsidy for East DISCOM.
3.3.9 Interest and Finance Charges
Interest and Finance charges comprise of interest on project specific loans, interest on working capital
and interest on consumer security deposit.
Interest on Project Specific Loans
For all on-going works, the interest cost related to the loan funding of such works is considered as
Interest During Construction (IDC) which is capitalised and added to the project cost at the time of asset
capitalisation. Such interest cost is not considered as a pass through in the ARR. The Commission
follows the principle that “the consumer can only be made to bear the interest cost related to those
assets, which the consumer is making use of. The asset which is under construction is not used by the
consumers; hence interest cost incurred by the Licensee during construction becomes a part of CWIP
and is not allowed to be recovered through tariffs”. The Commission considers interest cost on assets
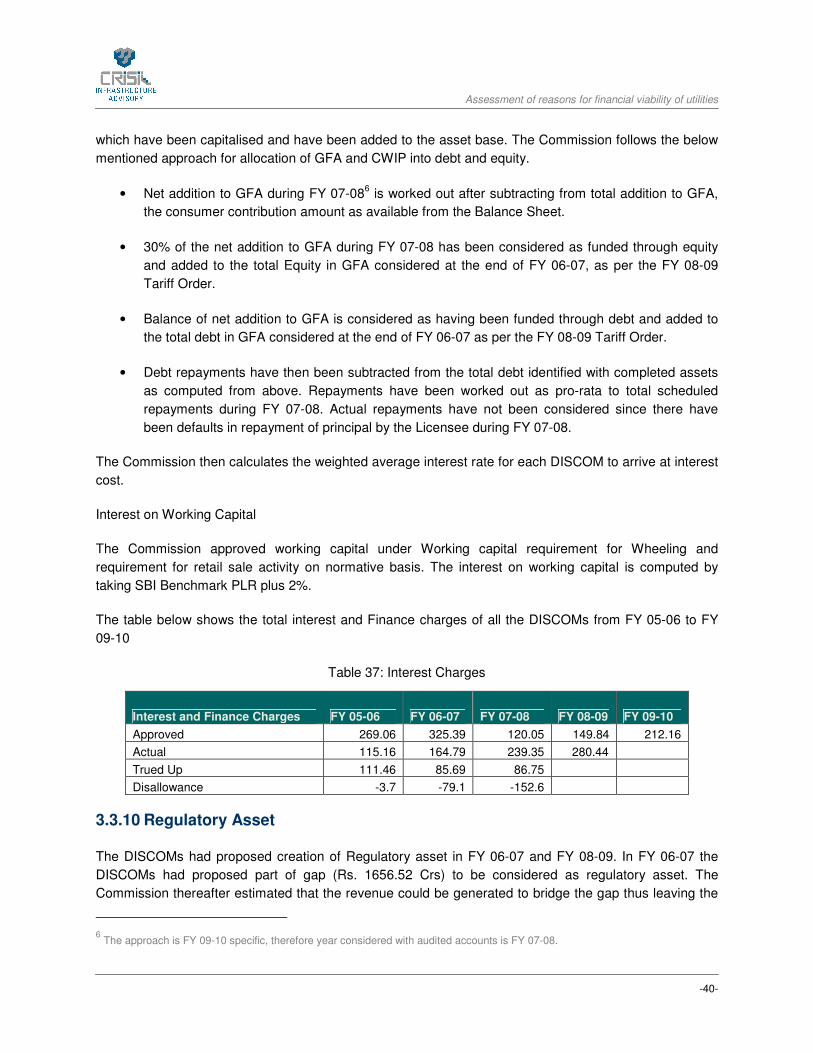
Assessment of reasons for financial viability of utilities
-40-
which have been capitalised and have been added to the asset base. The Commission follows the below
mentioned approach for allocation of GFA and CWIP into debt and equity.
• Net addition to GFA during FY 07-086 is worked out after subtracting from total addition to GFA,
the consumer contribution amount as available from the Balance Sheet.
• 30% of the net addition to GFA during FY 07-08 has been considered as funded through equity
and added to the total Equity in GFA considered at the end of FY 06-07, as per the FY 08-09
Tariff Order.
• Balance of net addition to GFA is considered as having been funded through debt and added to
the total debt in GFA considered at the end of FY 06-07 as per the FY 08-09 Tariff Order.
• Debt repayments have then been subtracted from the total debt identified with completed assets
as computed from above. Repayments have been worked out as pro-rata to total scheduled
repayments during FY 07-08. Actual repayments have not been considered since there have
been defaults in repayment of principal by the Licensee during FY 07-08.
The Commission then calculates the weighted average interest rate for each DISCOM to arrive at interest
cost.
Interest on Working Capital
The Commission approved working capital under Working capital requirement for Wheeling and
requirement for retail sale activity on normative basis. The interest on working capital is computed by
taking SBI Benchmark PLR plus 2%.
The table below shows the total interest and Finance charges of all the DISCOMs from FY 05-06 to FY
09-10
Table 37: Interest Charges
Interest and Finance Charges FY 05-06 FY 06-07 FY 07-08 FY 08-09 FY 09-10
Approved 269.06 325.39 120.05 149.84 212.16
Actual 115.16 164.79 239.35 280.44
Trued Up 111.46 85.69 86.75
Disallowance -3.7 -79.1 -152.6
3.3.10 Regulatory Asset
The DISCOMs had proposed creation of Regulatory asset in FY 06-07 and FY 08-09. In FY 06-07 the
DISCOMs had proposed part of gap (Rs. 1656.52 Crs) to be considered as regulatory asset. The
Commission thereafter estimated that the revenue could be generated to bridge the gap thus leaving the
6 The approach is FY 09-10 specific, therefore year considered with audited accounts is FY 07-08.
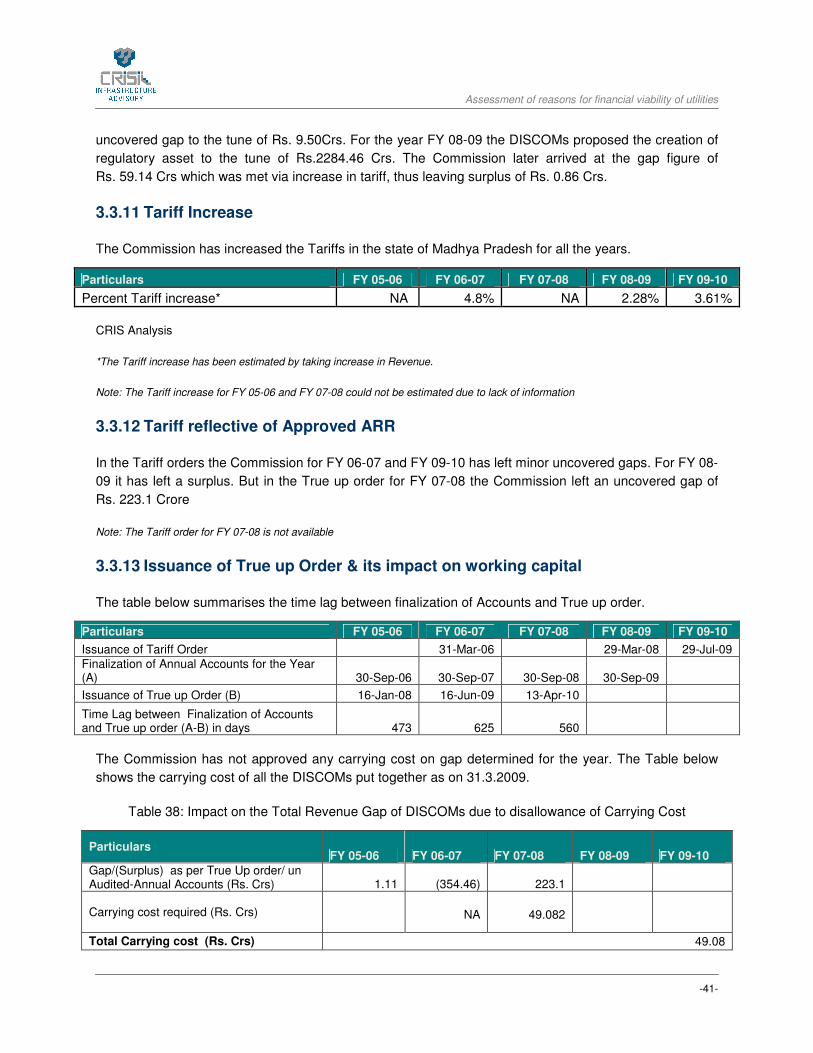
Assessment of reasons for financial viability of utilities
-41-
uncovered gap to the tune of Rs. 9.50Crs. For the year FY 08-09 the DISCOMs proposed the creation of
regulatory asset to the tune of Rs.2284.46 Crs. The Commission later arrived at the gap figure of
Rs. 59.14 Crs which was met via increase in tariff, thus leaving surplus of Rs. 0.86 Crs.
3.3.11 Tariff Increase
The Commission has increased the Tariffs in the state of Madhya Pradesh for all the years.
Particulars FY 05-06 FY 06-07 FY 07-08 FY 08-09 FY 09-10
Percent Tariff increase* NA 4.8% NA 2.28% 3.61%
CRIS Analysis
*The Tariff increase has been estimated by taking increase in Revenue.
Note: The Tariff increase for FY 05-06 and FY 07-08 could not be estimated due to lack of information
3.3.12 Tariff reflective of Approved ARR
In the Tariff orders the Commission for FY 06-07 and FY 09-10 has left minor uncovered gaps. For FY 08-
09 it has left a surplus. But in the True up order for FY 07-08 the Commission left an uncovered gap of
Rs. 223.1 Crore
Note: The Tariff order for FY 07-08 is not available
3.3.13 Issuance of True up Order & its impact on working capital
The table below summarises the time lag between finalization of Accounts and True up order.
Particulars FY 05-06 FY 06-07 FY 07-08 FY 08-09 FY 09-10
Issuance of Tariff Order 31-Mar-06 29-Mar-08 29-Jul-09
Finalization of Annual Accounts for the Year (A) 30-Sep-06 30-Sep-07 30-Sep-08 30-Sep-09
Issuance of True up Order (B) 16-Jan-08 16-Jun-09 13-Apr-10
Time Lag between Finalization of Accounts and True up order (A-B) in days 473 625 560
The Commission has not approved any carrying cost on gap determined for the year. The Table below
shows the carrying cost of all the DISCOMs put together as on 31.3.2009.
Table 38: Impact on the Total Revenue Gap of DISCOMs due to disallowance of Carrying Cost
Particulars FY 05-06 FY 06-07 FY 07-08 FY 08-09 FY 09-10
Gap/(Surplus) as per True Up order/ un Audited-Annual Accounts (Rs. Crs) 1.11 (354.46) 223.1
Carrying cost required (Rs. Crs) NA 49.082
Total Carrying cost (Rs. Crs) 49.08
Assessment of reasons for financial viability of utilities
-42-
CRIS Analysis
The carrying cost summarised in the Table 8 has been calculated by CRIS by applying interest rate of
11% on the accumulated gap each year upto Mar 31, 2009.
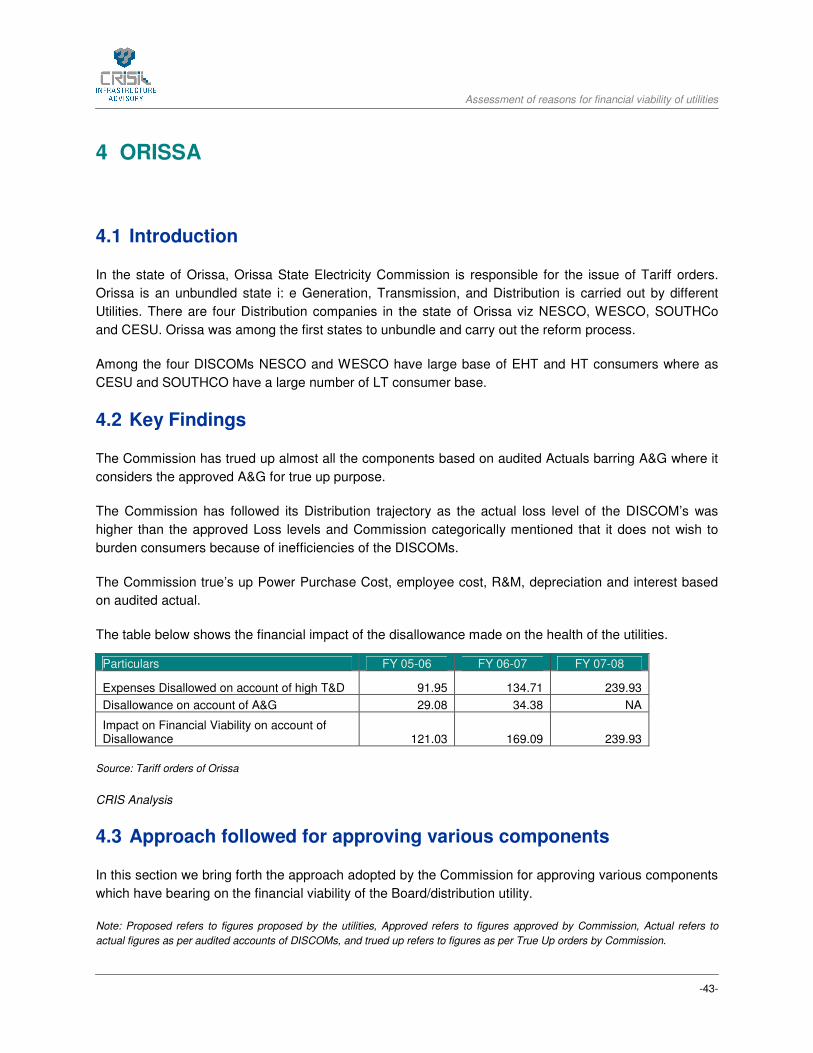
Assessment of reasons for financial viability of utilities
-43-
4 ORISSA
4.1 Introduction
In the state of Orissa, Orissa State Electricity Commission is responsible for the issue of Tariff orders.
Orissa is an unbundled state i: e Generation, Transmission, and Distribution is carried out by different
Utilities. There are four Distribution companies in the state of Orissa viz NESCO, WESCO, SOUTHCo
and CESU. Orissa was among the first states to unbundle and carry out the reform process.
Among the four DISCOMs NESCO and WESCO have large base of EHT and HT consumers where as
CESU and SOUTHCO have a large number of LT consumer base.
4.2 Key Findings
The Commission has trued up almost all the components based on audited Actuals barring A&G where it
considers the approved A&G for true up purpose.
The Commission has followed its Distribution trajectory as the actual loss level of the DISCOM’s was
higher than the approved Loss levels and Commission categorically mentioned that it does not wish to
burden consumers because of inefficiencies of the DISCOMs.
The Commission true’s up Power Purchase Cost, employee cost, R&M, depreciation and interest based
on audited actual.
The table below shows the financial impact of the disallowance made on the health of the utilities.
Particulars FY 05-06 FY 06-07 FY 07-08
Expenses Disallowed on account of high T&D 91.95 134.71 239.93
Disallowance on account of A&G 29.08 34.38 NA
Impact on Financial Viability on account of Disallowance 121.03 169.09 239.93
Source: Tariff orders of Orissa
CRIS Analysis
4.3 Approach followed for approving various components
In this section we bring forth the approach adopted by the Commission for approving various components
which have bearing on the financial viability of the Board/distribution utility.
Note: Proposed refers to figures proposed by the utilities, Approved refers to figures approved by Commission, Actual refers to
actual figures as per audited accounts of DISCOMs, and trued up refers to figures as per True Up orders by Commission.
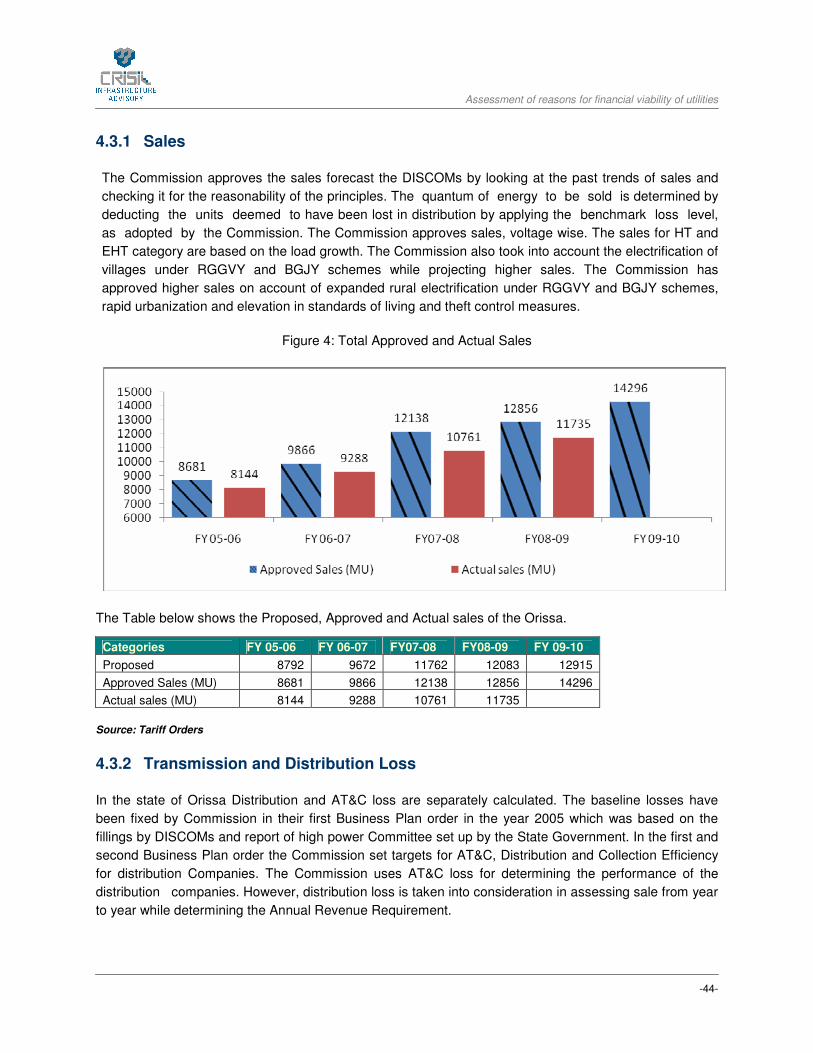
Assessment of reasons for financial viability of utilities
-44-
4.3.1 Sales
The Commission approves the sales forecast the DISCOMs by looking at the past trends of sales and
checking it for the reasonability of the principles. The quantum of energy to be sold is determined by
deducting the units deemed to have been lost in distribution by applying the benchmark loss level,
as adopted by the Commission. The Commission approves sales, voltage wise. The sales for HT and
EHT category are based on the load growth. The Commission also took into account the electrification of
villages under RGGVY and BGJY schemes while projecting higher sales. The Commission has
approved higher sales on account of expanded rural electrification under RGGVY and BGJY schemes,
rapid urbanization and elevation in standards of living and theft control measures.
Figure 4: Total Approved and Actual Sales
The Table below shows the Proposed, Approved and Actual sales of the Orissa.
Categories FY 05-06 FY 06-07 FY07-08 FY08-09 FY 09-10
Proposed 8792 9672 11762 12083 12915
Approved Sales (MU) 8681 9866 12138 12856 14296
Actual sales (MU) 8144 9288 10761 11735
Source: Tariff Orders
4.3.2 Transmission and Distribution Loss
In the state of Orissa Distribution and AT&C loss are separately calculated. The baseline losses have
been fixed by Commission in their first Business Plan order in the year 2005 which was based on the
fillings by DISCOMs and report of high power Committee set up by the State Government. In the first and
second Business Plan order the Commission set targets for AT&C, Distribution and Collection Efficiency
for distribution Companies. The Commission uses AT&C loss for determining the performance of the
distribution companies. However, distribution loss is taken into consideration in assessing sale from year
to year while determining the Annual Revenue Requirement.

Assessment of reasons for financial viability of utilities
-45-
In the tariff order of FY 06-07 and FY 07-08 the Commission revised the trajectory set for Distribution and
AT&C loss in the Business plan.
The graph below shows the T&D approved and Actual. The Commission has considered the approved
T&D as trued up T&D.
Figure 5: Distribution loss Approved and Actual

Assessment of reasons for financial viability of utilities
-46-
The table below shows the AT&C approved as per Business plan, Approved as per ARR order and
Actual.
CESU FY 05-06 FY 06-07 FY 07-08 FY 08-09 FY 09-10
Approved 45.00% 40.40% 35.00% 32.84% 27.80%
Approved in business plan 45.00% 40.40% 35.60%
Actual 49.20% 47.60% 45.90% 45.23%
NESCO FY 05-06 FY 06-07 FY 07-08 FY 08-09 FY 09-10
Approved 39.60% 35.60% 30.40% 29.20% 24.50%
Approved in business plan 39.60% 36.10% 33.30%
Actual 43.20% 40.70% 35.90% 39.48%
WESCO FY 05-06 FY 06-07 FY 07-08 FY 08-09 FY 09-10
Approved 36.50% 37.70% 28.00% 27.50% 24.00%
Approved in business plan 36.50% 32.32% 28.00%
Actual 41.70% 40.00% 40.70% 37.63%
SOUTHCO FY 05-06 FY 06-07 FY 07-08 FY 08-09 FY 09-10
Approved 41.80% 37.70% 34.60% 34.60% 29.40%
Approved in business plan 41.80% 37.70% 34.20%
Actual 43.90% 46.60% 48.70% 50.80%
ALL OF ORISSA FY 05-06 FY 06-07 FY 07-08 FY 08-09 FY 09-10
Approved 40.50% 37.90% 31.40% 30.40% 26.00%
Approved in business plan 40.50% 36.40% 32.40%
Actual 44.70% 43.30% 41.90% 41.89%
The Financial impact of the Disallowance of T&D has an impact on the financial viability of the
DISCOMs.The table below shows the financial impact of disallownce of T&D loss.
Table 39: Disallowance on account of T&D Loss
Particulars FY 05-06 FY 06-07 FY 07-08 FY 08-09 FY 09-10
Quantum Disallowed (MU) 730.75 871.21 1768.58
T&D Approved 34.18% 32.81% 27.11% 27.00% 24.45%
T&D Actual Claimed 39.60% 38.57% 37.50% 37.50%
Trued Up T&D 34.18% 32.81% 27.11%
Variation in T&D Trued Up and Actual T&D Claimed -5.42% -5.76% -10.39%
Expenses Disallowed (Rs. Crore) 91.95 105.29 239.93
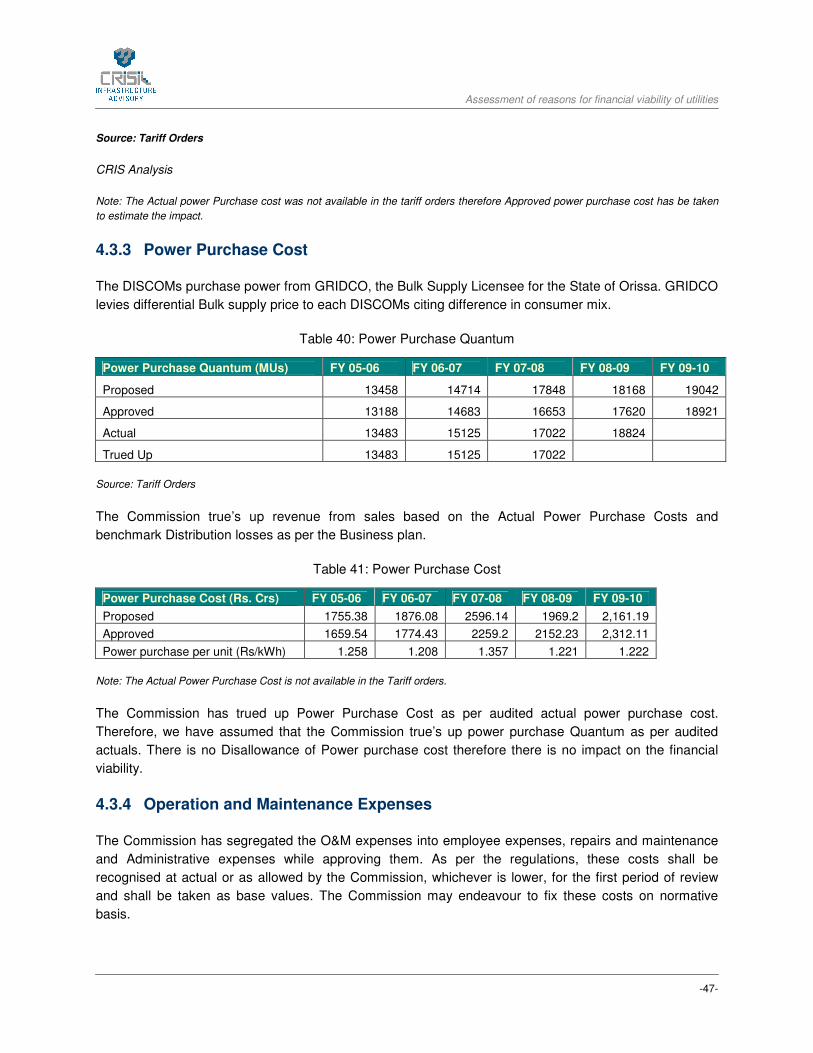
Assessment of reasons for financial viability of utilities
-47-
Source: Tariff Orders
CRIS Analysis
Note: The Actual power Purchase cost was not available in the tariff orders therefore Approved power purchase cost has be taken
to estimate the impact.
4.3.3 Power Purchase Cost
The DISCOMs purchase power from GRIDCO, the Bulk Supply Licensee for the State of Orissa. GRIDCO
levies differential Bulk supply price to each DISCOMs citing difference in consumer mix.
Table 40: Power Purchase Quantum
Power Purchase Quantum (MUs) FY 05-06 FY 06-07 FY 07-08 FY 08-09 FY 09-10
Proposed 13458 14714 17848 18168 19042
Approved 13188 14683 16653 17620 18921
Actual 13483 15125 17022 18824
Trued Up 13483 15125 17022
Source: Tariff Orders
The Commission true’s up revenue from sales based on the Actual Power Purchase Costs and
benchmark Distribution losses as per the Business plan.
Table 41: Power Purchase Cost
Power Purchase Cost (Rs. Crs) FY 05-06 FY 06-07 FY 07-08 FY 08-09 FY 09-10
Proposed 1755.38 1876.08 2596.14 1969.2 2,161.19
Approved 1659.54 1774.43 2259.2 2152.23 2,312.11
Power purchase per unit (Rs/kWh) 1.258 1.208 1.357 1.221 1.222
Note: The Actual Power Purchase Cost is not available in the Tariff orders.
The Commission has trued up Power Purchase Cost as per audited actual power purchase cost.
Therefore, we have assumed that the Commission true’s up power purchase Quantum as per audited
actuals. There is no Disallowance of Power purchase cost therefore there is no impact on the financial
viability.
4.3.4 Operation and Maintenance Expenses
The Commission has segregated the O&M expenses into employee expenses, repairs and maintenance
and Administrative expenses while approving them. As per the regulations, these costs shall be
recognised at actual or as allowed by the Commission, whichever is lower, for the first period of review
and shall be taken as base values. The Commission may endeavour to fix these costs on normative
basis.

Assessment of reasons for financial viability of utilities
-48-
These approved base values may be indexed to pre-determined indices viz. Consumer Price Index,
Wholesale Price Index or a combination of both the indices for the subsequent years. For example, the
base value of O&M can be indexed to CPI and WPI.
The Commission has approved employee expenses by escalating base year values of basic pay and
dearness allowance for annual salary increments and inflation. For all the years, the Commission has
allowed escalation of 3% over the basic pay towards normal annual increment on year to year basis in
respect of all DISCOMs. The Commission for all the years approved terminal benefits of WESCO,
NESCO and SOUTHCO based upon the rate of contribution given by actuary, the terminal benefits of
CESCO were based on cash outflow basis. The approval was subject to final determination by the
independent actuary which was to be appointed by the Commission.
For repair and maintenance expenses the Commission considers latest audited accounts as base figures
and applies 5.4% on the opening gross block of assets to approve Repair and maintenance accounts.
The Commission while truing up has approved Employee Cost and repair and maintenance cost based
on the audited figures but in case of Administrative and General Expenses the Commission true’s up the
A&G based on the Approved figures.
4.3.4.1.1 Administration and General Expenses
The Commission approved administration costs for the DISCOMs by considering latest tax audited figure
of A&G as base and escalated it for a specified rate. The escalation rate of 7% has been considered
consistently throughout the DISCOMs for all the years.
The DISCOMs have incurred expenditure more than what was being approved in the ARR. The
Commission observed that A&G expenses are a controllable cost and the DISCOMs would not be
allowed more than the approvals in the truing up exercise.
The Table below shows the A&G cost proposed, approved and actual.
Table 42: Administrative & General Expenses
Administrative & General Expense (Rs. Crs) FY 05-06 FY 06-07 FY 07-08 FY 08-09 FY 09-10
Proposed 55.63 81.65 78.73 114.41 152.41
Approved 41.11 51.06 56.42 74.6 82.17
Actual 70.19 84.63
Trued Up 41.11 50.25
Disallowance -29.08 -33.57
Source: Tariff Orders
The table below shows the Operation and maintenance Cost Proposed, Approved Audited and
Disallowance.
Table 43: Operation and Maintenance Cost
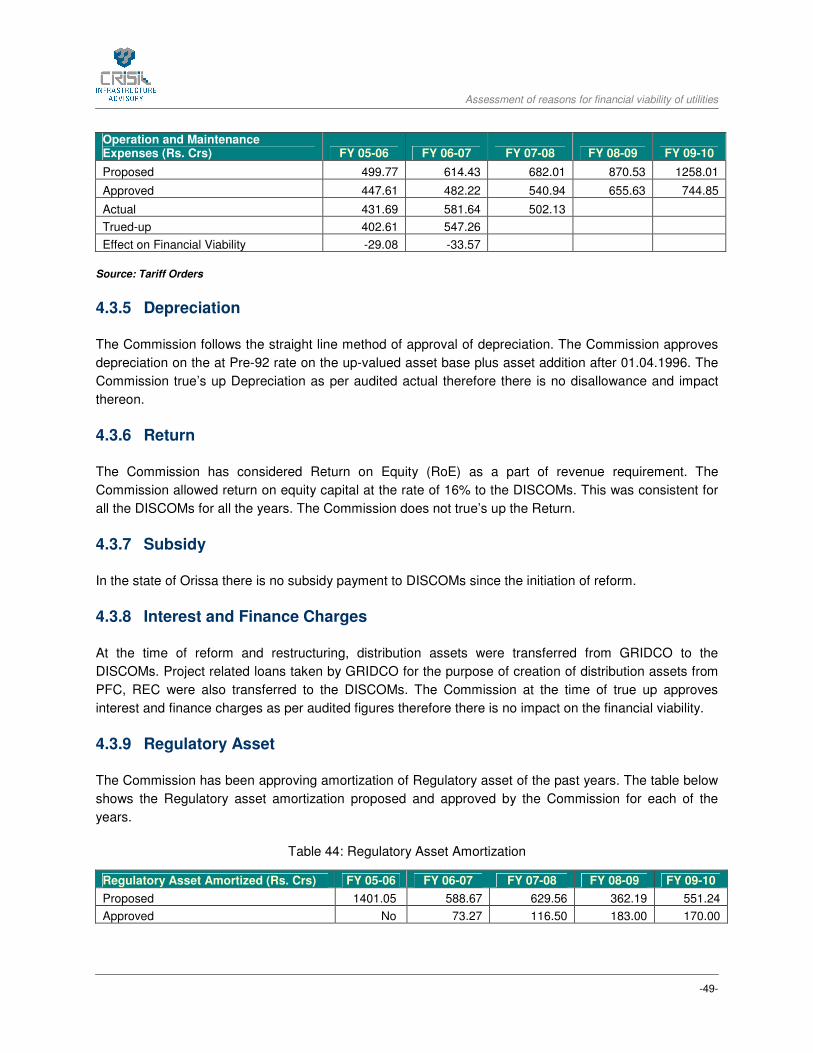
Assessment of reasons for financial viability of utilities
-49-
Operation and Maintenance Expenses (Rs. Crs) FY 05-06 FY 06-07 FY 07-08 FY 08-09 FY 09-10
Proposed 499.77 614.43 682.01 870.53 1258.01
Approved 447.61 482.22 540.94 655.63 744.85
Actual 431.69 581.64 502.13
Trued-up 402.61 547.26
Effect on Financial Viability -29.08 -33.57
Source: Tariff Orders
4.3.5 Depreciation
The Commission follows the straight line method of approval of depreciation. The Commission approves
depreciation on the at Pre-92 rate on the up-valued asset base plus asset addition after 01.04.1996. The
Commission true’s up Depreciation as per audited actual therefore there is no disallowance and impact
thereon.
4.3.6 Return
The Commission has considered Return on Equity (RoE) as a part of revenue requirement. The
Commission allowed return on equity capital at the rate of 16% to the DISCOMs. This was consistent for
all the DISCOMs for all the years. The Commission does not true’s up the Return.
4.3.7 Subsidy
In the state of Orissa there is no subsidy payment to DISCOMs since the initiation of reform.
4.3.8 Interest and Finance Charges
At the time of reform and restructuring, distribution assets were transferred from GRIDCO to the
DISCOMs. Project related loans taken by GRIDCO for the purpose of creation of distribution assets from
PFC, REC were also transferred to the DISCOMs. The Commission at the time of true up approves
interest and finance charges as per audited figures therefore there is no impact on the financial viability.
4.3.9 Regulatory Asset
The Commission has been approving amortization of Regulatory asset of the past years. The table below
shows the Regulatory asset amortization proposed and approved by the Commission for each of the
years.
Table 44: Regulatory Asset Amortization
Regulatory Asset Amortized (Rs. Crs) FY 05-06 FY 06-07 FY 07-08 FY 08-09 FY 09-10
Proposed 1401.05 588.67 629.56 362.19 551.24
Approved No 73.27 116.50 183.00 170.00
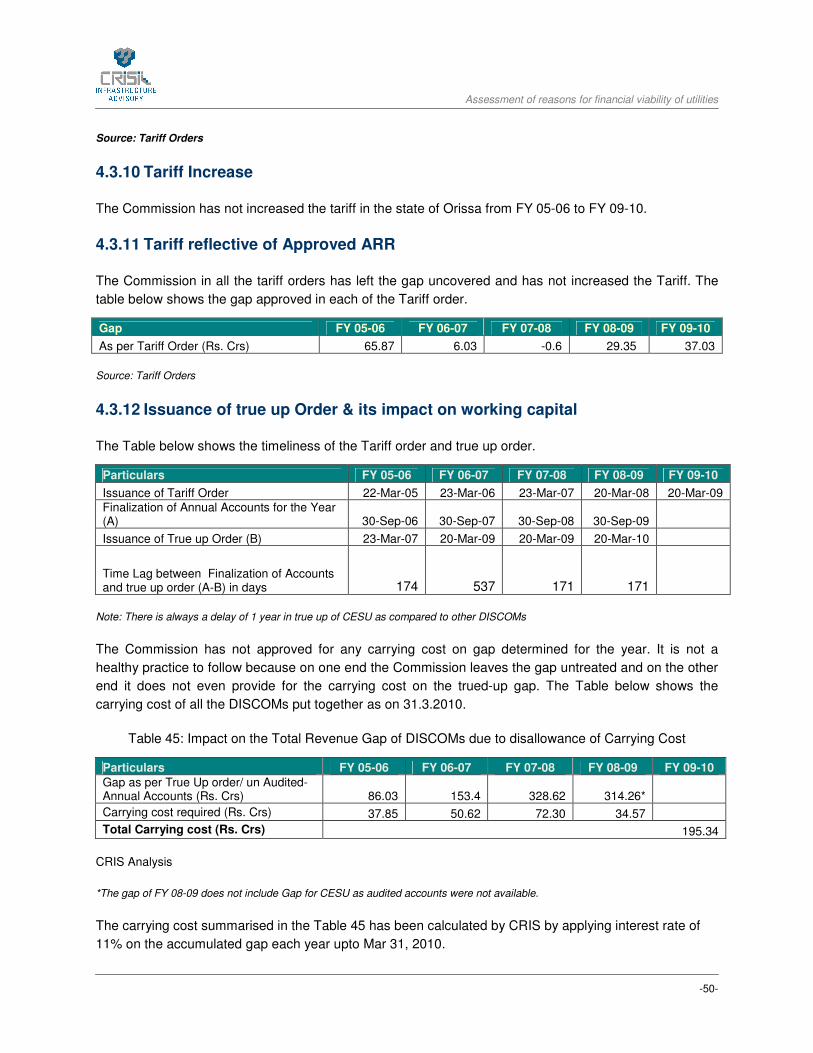
Assessment of reasons for financial viability of utilities
-50-
Source: Tariff Orders
4.3.10 Tariff Increase
The Commission has not increased the tariff in the state of Orissa from FY 05-06 to FY 09-10.
4.3.11 Tariff reflective of Approved ARR
The Commission in all the tariff orders has left the gap uncovered and has not increased the Tariff. The
table below shows the gap approved in each of the Tariff order.
Gap FY 05-06 FY 06-07 FY 07-08 FY 08-09 FY 09-10
As per Tariff Order (Rs. Crs) 65.87 6.03 -0.6 29.35 37.03
Source: Tariff Orders
4.3.12 Issuance of true up Order & its impact on working capital
The Table below shows the timeliness of the Tariff order and true up order.
Particulars FY 05-06 FY 06-07 FY 07-08 FY 08-09 FY 09-10
Issuance of Tariff Order 22-Mar-05 23-Mar-06 23-Mar-07 20-Mar-08 20-Mar-09
Finalization of Annual Accounts for the Year (A) 30-Sep-06 30-Sep-07 30-Sep-08 30-Sep-09
Issuance of True up Order (B) 23-Mar-07 20-Mar-09 20-Mar-09 20-Mar-10
Time Lag between Finalization of Accounts and true up order (A-B) in days 174 537 171 171
Note: There is always a delay of 1 year in true up of CESU as compared to other DISCOMs
The Commission has not approved for any carrying cost on gap determined for the year. It is not a
healthy practice to follow because on one end the Commission leaves the gap untreated and on the other
end it does not even provide for the carrying cost on the trued-up gap. The Table below shows the
carrying cost of all the DISCOMs put together as on 31.3.2010.
Table 45: Impact on the Total Revenue Gap of DISCOMs due to disallowance of Carrying Cost
Particulars FY 05-06 FY 06-07 FY 07-08 FY 08-09 FY 09-10
Gap as per True Up order/ un Audited-Annual Accounts (Rs. Crs) 86.03 153.4 328.62 314.26*
Carrying cost required (Rs. Crs) 37.85 50.62 72.30 34.57
Total Carrying cost (Rs. Crs) 195.34
CRIS Analysis
*The gap of FY 08-09 does not include Gap for CESU as audited accounts were not available.
The carrying cost summarised in the Table 45 has been calculated by CRIS by applying interest rate of
11% on the accumulated gap each year upto Mar 31, 2010.
Assessment of reasons for financial viability of utilities
-51-
5 MAHARASHTRA
5.1 Introduction
Maharashtra Electricity Regulatory Commission (MERC) was set up in August 1999 under the Regulatory
Commissions Act, 1998. The erstwhile Maharashtra State Electricity Board (MSEB) was unbundled in
June 2005, into the 4 companies as a result of the provisional transfer scheme notified under the
Electricity Act 2003 on 6th June 2005:
1. MSEB Holding Company Ltd.
2. Maharashtra State Power Generation Company Ltd.,
3. Maharashtra State Electricity Transmission Company Ltd. (MSETCL) and
4. Maharashtra State Electricity Distribution Company Ltd.
The state of Maharashtra presently has four Distribution companies namely, Maharashtra State Electricity
Distribution Company Limited (MSEDCL), Tata Power Company Limited Distribution Business (TPC-D),
Reliance Energy Ltd. Distribution Business’ (REL-D) and Brihan-Mumbai Electric Supply & Transport
Undertaking (BEST). MSEDCL is in the business of distribution and supply of electricity in the State,
except the Mumbai license area. This report analyses MSEDCL’s performance over the FY 05-06 to FY
09-10.
5.2 Approach followed for approving various components
In this section we bring forth the approach adopted by the Commission for approving various components
which have bearing on the financial viability of the distribution utility.
Note: Proposed refers to figures proposed by the utilities, Approved refers to figures approved by Commission in the Tariff/ APR
Order, Actual refers to actual figures as per audited accounts of MSEDCL, and Trued up refers to figures as per True Up Orders
issued by the Commission.
5.2.1 Sales
The sales mix of MSEDCL is favourable considering the maximum sales being contributed by industrial
consumers i.e. 44% followed by agriculture consumption (25%) and domestic (18%). Graph below
provides the percentage share of energy consumption of different consumer categories in FY 08-09.
Share of Consumer categories in Approved Sales for FY09
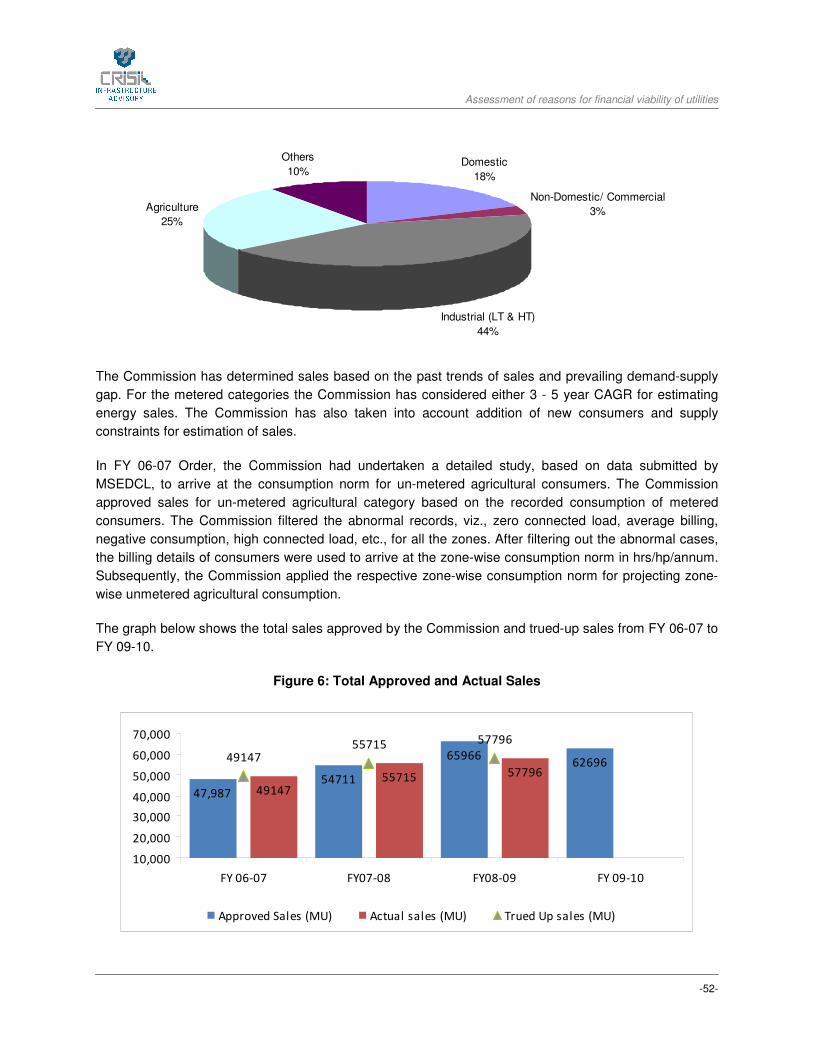
Assessment of reasons for financial viability of utilities
-52-
Domestic
18%
Non-Domestic/ Commercial
3%
Industrial (LT & HT)
44%
Agriculture
25%
Others
10%
The Commission has determined sales based on the past trends of sales and prevailing demand-supply
gap. For the metered categories the Commission has considered either 3 - 5 year CAGR for estimating
energy sales. The Commission has also taken into account addition of new consumers and supply
constraints for estimation of sales.
In FY 06-07 Order, the Commission had undertaken a detailed study, based on data submitted by
MSEDCL, to arrive at the consumption norm for un-metered agricultural consumers. The Commission
approved sales for un-metered agricultural category based on the recorded consumption of metered
consumers. The Commission filtered the abnormal records, viz., zero connected load, average billing,
negative consumption, high connected load, etc., for all the zones. After filtering out the abnormal cases,
the billing details of consumers were used to arrive at the zone-wise consumption norm in hrs/hp/annum.
Subsequently, the Commission applied the respective zone-wise consumption norm for projecting zone-
wise unmetered agricultural consumption.
The graph below shows the total sales approved by the Commission and trued-up sales from FY 06-07 to
FY 09-10.
Figure 6: Total Approved and Actual Sales
47,98754711
6596662696
4914755715 57796
4914755715 57796
10,000
20,000
30,000
40,000
50,000
60,000
70,000
FY 06-07 FY07-08 FY08-09 FY 09-10
Approved Sales (MU) Actual sales (MU) Trued Up sales (MU)

Assessment of reasons for financial viability of utilities
-53-
Sales (MUs) FY 06-07 FY07-08 FY08-09 FY 09-10
Approved 47987 54711 63776 62696
Actual 49147 55715 57796 NA
Trued Up 49147 55715 57796 NA
Variation (Trued-up – Actual) 0 0 0 NA
Source: Tariff Orders & Trued-up Orders for respective years
The Commission has approved the actual sales claimed by MSEDCL in the true-up orders. Therefore,
there are no disallowances in actual sales. The large variation in approved and actual sales in FY 08-09
is primarily on account of additional sales estimated by MSEDCL on account of the projected additional
energy availability in FY 08-09.
5.2.2 Distribution Loss
The Commission has approved the distribution loss for MSEDCL by considering sales to unmetered
agricultural consumer on the revised agricultural consumption norm of 1318 hrs/hp/annum, sales to
agriculture metered category and sales to non-agricultural consumers. The Commission had approved a
loss reduction target of 2% for FY 06-07.
For MYT Control period, the Commission approved the base-line distribution loss for MSEDCL based on
the actual distribution loss for FY 06-07. The Commission had assessed the distribution losses for FY 06-
07 based on the energy audit data from Apr 06 to Jan 07. Subsequently, based on the performance of
MSEDCL and analysis of circle-wise distribution losses, the Commission approved a loss reduction target
of 4% each year during the MYT Control period. Further, the Commission directed MSEDCL to target
divisions with higher losses and attempt to reduce the losses on priority basis in such divisions.
The table below summarizes the proposed, approved, actual and trued-up distribution loss for MSEDCL:
Table 46: Distribution Loss Targets Proposed, Approved, Actual and Trued-up
Loss Target (%) FY 06-07 FY 07-08 FY 08-09 FY 09-10
Proposed 27.00% 30.97% 28.97% 26.97%
Approved 34.97% 26.20% 22.20% 18.20%
Actual 30.50% 24.09% 21.98% NA
Trued-up 30.20% 24.15% 22.24% NA
Variation (Trued-up – Actual) -0.30% 0.06% -0.28% NA
*provisional distribution loss level as per APR Order for FY 08-09
In the true-up/ APR Order the Commission has considered the actual intra-state transmission losses to
approve the trued-up distribution loss for MSEDCL. Also, any variation in power purchase quantum,
information on energy receipt at the periphery from SLDC, etc. has been adjusted to arrive at the trued-up
distribution losses. As seen from the above Table, MSEDCL has been able to achieve the loss reduction

Assessment of reasons for financial viability of utilities
-54-
targets set by the Commission, and has even earned incentive in FY 08, due to achievement of
distribution losses lower than the target loss level.
5.2.3 Power Purchase Cost
MSEDCL has three primary sources of firm power i.e. Maharashtra State Power Generation Company
Limited (MSPGCL), Central Generating Stations (CGS) and Ratnagiri Gas and Power Private Limited
(RGPPL). In addition, MSEDCL purchases power from trading companies, energy exchange, renewable
energy sources and surplus power from captive plants.
The Commission also introduced the concept of costly power and non-costly power in FY07 and FY08,
such that the average hours of load shedding were determined by allocating only non-costly power to all
categories. The costly power (costing above Rs. 4 per kWh) was then allocated to consumer categories
and regions, and an Additional Supply Charge (ASC) was collected from the consumers in proportion to
the relief from load shedding made possible due to the costly power purchase. The Commission
considered power costing Rs. 4 per kWh and above as costly power, for determination of the ASC
payable by the consumers benefiting from reduction in load shedding. However, the Commission
abandoned its approach of segregating the power purchase quantum as costly and non-costly power in
2nd year of MYT period i.e. FY 08-09, since, MSEDCL was not actually purchasing costly power while at
the same time recovering the ASC from the consumers, as a result of which, excess ASC recovered from
consumers had to be refunded.
The tables below provide a comparison of the approved, actual and trued-up power purchase quantum,
cost and per unit cost of power:
Table 47: Power Purchase Quantum
Power Purchase Quantum (MUs) FY 06-07 FY 07-08 FY 08-09 FY 09-10
Approved 75,207 85123 90206 84641
Actual 74,310 78,734 79,871 NA
Trued Up 74,310 78,734 79,871 NA
Variation (Trued up – Actual) 0 0 0 NA
Table 48: Power Purchase Cost
Power Purchase Cost (Rs. Crore) FY 06-07 FY 07-08 FY 08-09 FY 09-10
Approved 13,632 16899 21189 19,898.16
Actual 14925 15537 19793 NA
Trued Up 14925 15518 19793 NA
Variation (Trued up – Actual) 0 -19 0 NA
Table 49: Per Unit Power Purchase Cost
Power purchase per unit (Rs/kWh) FY 06-07 FY 07-08 FY 08-09 FY 09-10
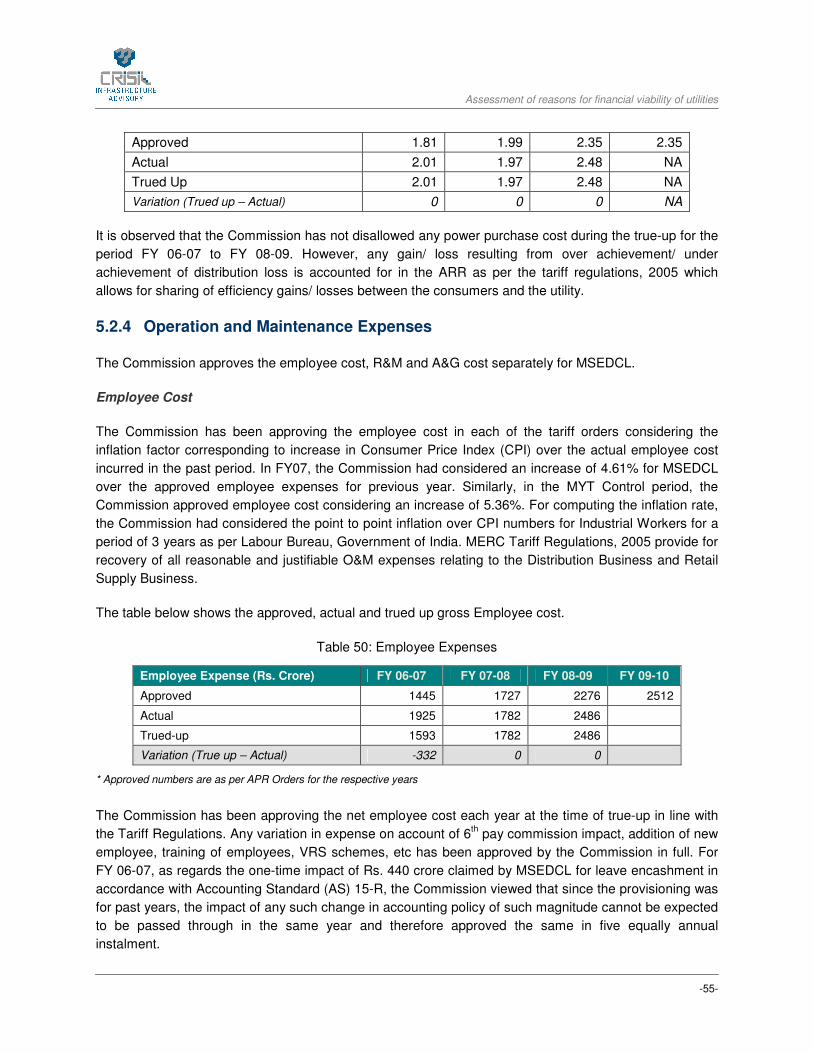
Assessment of reasons for financial viability of utilities
-55-
Approved 1.81 1.99 2.35 2.35
Actual 2.01 1.97 2.48 NA
Trued Up 2.01 1.97 2.48 NA
Variation (Trued up – Actual) 0 0 0 NA
It is observed that the Commission has not disallowed any power purchase cost during the true-up for the
period FY 06-07 to FY 08-09. However, any gain/ loss resulting from over achievement/ under
achievement of distribution loss is accounted for in the ARR as per the tariff regulations, 2005 which
allows for sharing of efficiency gains/ losses between the consumers and the utility.
5.2.4 Operation and Maintenance Expenses
The Commission approves the employee cost, R&M and A&G cost separately for MSEDCL.
Employee Cost
The Commission has been approving the employee cost in each of the tariff orders considering the
inflation factor corresponding to increase in Consumer Price Index (CPI) over the actual employee cost
incurred in the past period. In FY07, the Commission had considered an increase of 4.61% for MSEDCL
over the approved employee expenses for previous year. Similarly, in the MYT Control period, the
Commission approved employee cost considering an increase of 5.36%. For computing the inflation rate,
the Commission had considered the point to point inflation over CPI numbers for Industrial Workers for a
period of 3 years as per Labour Bureau, Government of India. MERC Tariff Regulations, 2005 provide for
recovery of all reasonable and justifiable O&M expenses relating to the Distribution Business and Retail
Supply Business.
The table below shows the approved, actual and trued up gross Employee cost.
Table 50: Employee Expenses
Employee Expense (Rs. Crore) FY 06-07 FY 07-08 FY 08-09 FY 09-10
Approved 1445 1727 2276 2512
Actual 1925 1782 2486
Trued-up 1593 1782 2486
Variation (True up – Actual) -332 0 0
* Approved numbers are as per APR Orders for the respective years
The Commission has been approving the net employee cost each year at the time of true-up in line with
the Tariff Regulations. Any variation in expense on account of 6th pay commission impact, addition of new
employee, training of employees, VRS schemes, etc has been approved by the Commission in full. For
FY 06-07, as regards the one-time impact of Rs. 440 crore claimed by MSEDCL for leave encashment in
accordance with Accounting Standard (AS) 15-R, the Commission viewed that since the provisioning was
for past years, the impact of any such change in accounting policy of such magnitude cannot be expected
to be passed through in the same year and therefore approved the same in five equally annual
instalment.

Assessment of reasons for financial viability of utilities
-56-
Repair and Maintenance Expenses
The Commission had considered average R&M expenditure as a percentage of opening GFA i.e.3.48%
for past five years for approving the R&M expense for MSEDCL for FY 06-07. For the MYT Control
Period, the Commission had considered an increase of 5.39% p.a. (based on the increase in WPI) over
the approved gross R&M expense for FY 06-07 on account of inflation. The Commission further revised
its estimates in the APR Order for FY 07-08, FY 08-09 & FY 09-10 considering the actual R&M expense
for FY 06-07 and revised estimates of MSEDCL for respective years.
Table 51: Repair and Maintenance Expenses
R&M Expenses(Rs. Crore) FY 06-07 FY 07-08 FY 08-09 FY 09-10
Approved 341 436 456 482
Actual 416 526 599 NA
Trued-up 416 436 458 NA
Financial Impact 0 (90) (141) NA
* Approved numbers are as approved by the Commission in the respective year APR Orders
The Commission had approved the total R&M expense during FY 06-07 as the higher expense was on
account of the replacement of underground cables (which was a cheaper option than shifting of
underground cables) due to widening of roads in Maharashtra. However, for FY 07-08 & FY 08-09, the
Commission has disallowed higher than approved R&M cost (as per APR Order) considering that the
revised approved R&M expense was adequate and there were no extraordinary occurrence resulting in
additional R&M expense. However, any gain/ loss due to higher/ lower than approved R&M expense is
accounted for in the ARR as per the tariff regulations, 2005 which allows for sharing of efficiency gains/
losses between the consumers and the utility.
Administrative and General Expenses
The Commission had approved a year-on-year (YoY) increase of 4.2% over the A&G expense of FY 05-
06. For the MYT control period, the Commission had approved A&G cost for MSEDCL considering an
increase of approx 5.38% on account of inflation over the approved level of gross A&G expenses for FY
06-07. The escalation has been computed based on the increase in Wholesale Price Index (WPI) and
Consumer Price Index (CPI) for past 3 years. The Commission has considered a weightage of 60:40 for
WPI and CPI, based on the expected relationship with the cost drivers. The MERC Tariff Regulations,
2005 do not provide for any methodology for computation of A&G expense.
Table 52: Administrative and General Expenses
A&G Expense (Rs. Crore) FY 06-07 FY 07-08 FY 08-09 FY 09-10
Approved 108 156 181 213
Actual 148 219 318 NA
Trued-up 148 189 232 NA
Variation (Trued-up – Actual) 0 -30 -85 NA * Approved numbers are as approved by the Commission in the respective year APR Orders
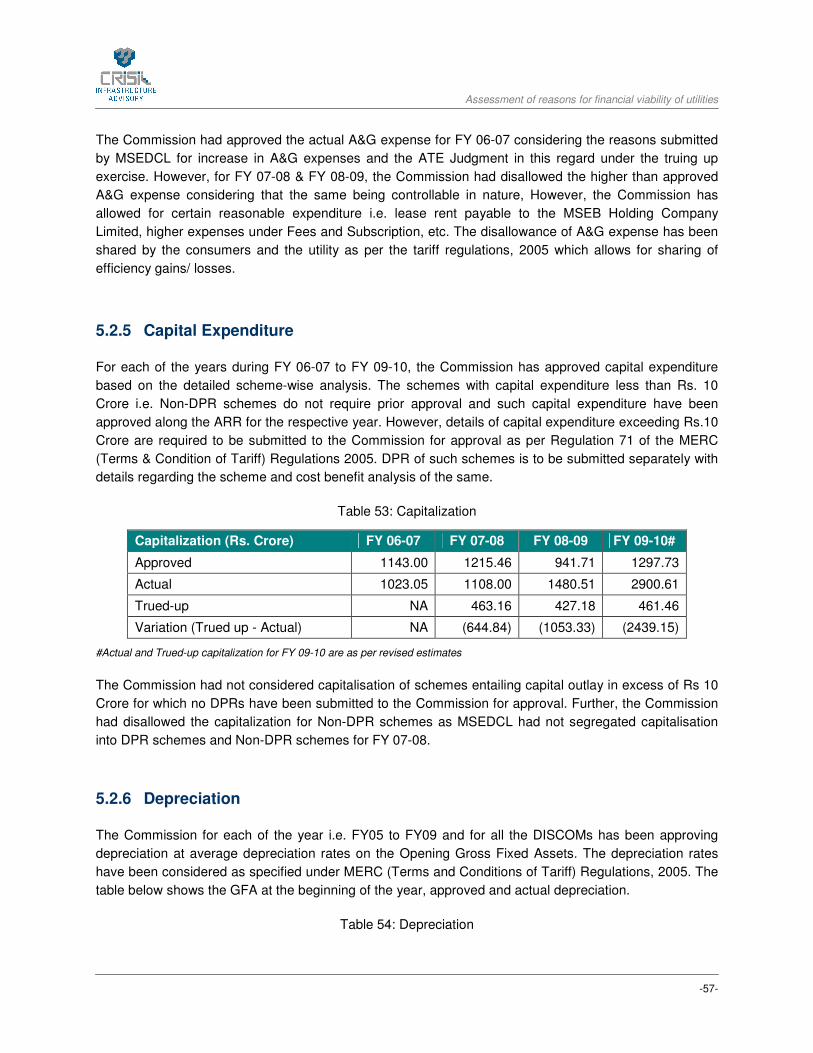
Assessment of reasons for financial viability of utilities
-57-
The Commission had approved the actual A&G expense for FY 06-07 considering the reasons submitted
by MSEDCL for increase in A&G expenses and the ATE Judgment in this regard under the truing up
exercise. However, for FY 07-08 & FY 08-09, the Commission had disallowed the higher than approved
A&G expense considering that the same being controllable in nature, However, the Commission has
allowed for certain reasonable expenditure i.e. lease rent payable to the MSEB Holding Company
Limited, higher expenses under Fees and Subscription, etc. The disallowance of A&G expense has been
shared by the consumers and the utility as per the tariff regulations, 2005 which allows for sharing of
efficiency gains/ losses.
5.2.5 Capital Expenditure
For each of the years during FY 06-07 to FY 09-10, the Commission has approved capital expenditure
based on the detailed scheme-wise analysis. The schemes with capital expenditure less than Rs. 10
Crore i.e. Non-DPR schemes do not require prior approval and such capital expenditure have been
approved along the ARR for the respective year. However, details of capital expenditure exceeding Rs.10
Crore are required to be submitted to the Commission for approval as per Regulation 71 of the MERC
(Terms & Condition of Tariff) Regulations 2005. DPR of such schemes is to be submitted separately with
details regarding the scheme and cost benefit analysis of the same.
Table 53: Capitalization
Capitalization (Rs. Crore) FY 06-07 FY 07-08 FY 08-09 FY 09-10#
Approved 1143.00 1215.46 941.71 1297.73
Actual 1023.05 1108.00 1480.51 2900.61
Trued-up NA 463.16 427.18 461.46
Variation (Trued up - Actual) NA (644.84) (1053.33) (2439.15)
#Actual and Trued-up capitalization for FY 09-10 are as per revised estimates
The Commission had not considered capitalisation of schemes entailing capital outlay in excess of Rs 10
Crore for which no DPRs have been submitted to the Commission for approval. Further, the Commission
had disallowed the capitalization for Non-DPR schemes as MSEDCL had not segregated capitalisation
into DPR schemes and Non-DPR schemes for FY 07-08.
5.2.6 Depreciation
The Commission for each of the year i.e. FY05 to FY09 and for all the DISCOMs has been approving
depreciation at average depreciation rates on the Opening Gross Fixed Assets. The depreciation rates
have been considered as specified under MERC (Terms and Conditions of Tariff) Regulations, 2005. The
table below shows the GFA at the beginning of the year, approved and actual depreciation.
Table 54: Depreciation

Assessment of reasons for financial viability of utilities
-58-
Particulars (Rs. Crore) FY 06-07 FY 07-08 FY 08-09 FY 09-10
Approved 352 383.53 400.1 436.13
Actual 368.65 408.05 465.85
Trued Up 365.55 382.26 408.12
Variation (Trued-up – Actual) -3.1 -25.79 -57.73
* Approved, Actual and True-up numbers are from APR Orders for the respective years
The disallowance in depreciation is primarily on account of disallowance in asset capitalization by the
Commission.
5.2.7 Interest and Finance Charges
The Commission has approved interest charges of MSEDCL in two parts:
• Interest on long term loans,
• Interest on Working Capital, consumer security deposit and finance charges on borrowings made
by the MSEDCL.
Interest cost on capex loans for MSEDCL during FY 06-07 has been considered based on the loan
drawal schedule and outstanding loans. The Commission applied average interest rate as submitted in
the petition on the average loan balance in absence of information regarding interest rates for individual
loans submitted by MSEDCL. For the MYT period the Commission had considered interest cost of 10.5%
p.a. for the new loans to be drawn over the Control Period as the weighted average interest cost of
existing loans during FY 06-07 as projected by MSEDCL has been around 10.3%.
The Commission has approved the normative working capital requirement for MSEDCL, in each of the
Tariff Orders issued from FY 06-07 to FY 09-10. The Commission has considered Prime Lending Rate
(PLR) of State Bank of India at the time of filing tariff petition for approving the interest cost on working
capital requirement as per the regulations.
Table 55: Interest Charges
Interest Cost (Rs. Crore) FY 06-07 FY 07-08 FY 08-09 FY 09-10
Approved 256.00 488.77 617.62 537.06
Actual 499.46 443.54 721.89 NA
Trued Up 336.35 432.54 578.97 NA
Disallowance (Trued up – Actual) (163.11) (11.00) (142.92) NA
* Approved, Actual and True-up numbers are from APR Orders issued by the Commission for respective years
The disallowance in interest cost is primarily on account of short-term loans taken by MSEDCL. The
interest cost on the short-term loans has not been considered by the Commission in the True-up Orders,
as MERC Tariff Regulations do not permit allowance of any other short-term interest over and above

Assessment of reasons for financial viability of utilities
-59-
normative working capital interest, which worked out to be negative in case of MSEDCL. Also, the
Commission had reduced the actual interest expense to the extent of disallowance in capitalization of
assets in the true-up for the respective years.
5.2.8 Return
The Commission had approved Return on Equity (RoE) for each of the years between FY 06-07 to FY 08-
09 for all the DISCOMs. The Commission had considered the RoE @ 16% of the equity, in accordance
with the Commission’s Tariff Regulations,2005 on the opening equity and 50% of the projected levels of
assets capitalized (considering a normative debt to equity of 70:30) during each year of the Control
Period or as approved by the Commission.
Table 56: Return on Equity
Operation and Maintenance Expenses FY 06-07 FY 07-08 FY 08-09 FY 09-10
Approved 390.88 554.89 509.94 533.83
Actual 518.08 545.18 550.40
Trued-up 518.08 499.36 503.51
* Approved, Actual and True-up numbers are from APR Orders issued by the Commission for respective years
5.2.9 Subsidy
Subsidy provided to each category of consumer has not been provided in the tariff orders. However, the
Commission in the APR Order for FY 07-08 & tariff determination for FY 08-09 has mentioned about the
receipt of approximately Rs. 1706 Crore from the State Government of the total subsidy amount of Rs
1829 Crore for FY 07-08.
5.2.10 Regulatory Asset
The Commission has not made any regulatory asset during the period for FY 05-06 to FY 09-10.
5.2.11 Tariff Increase
The Commission has increased Tariff every year from FY 07-08 to FY 09-10. The table below
summarises the tariff increase in percentage from FY 07-08 to FY 09-10.
Particulars FY 06-07 FY 07-08 FY 08-09 FY 09-10
Percent Tariff increase 8.4% 5.6% 6.8% 4.2%
5.2.12 Tariff reflective of Approved ARR
The Commission in all the tariff orders has approved tariff which are reflective of the average cost of
supply. Therefore, no revenue gap has been left uncovered for MSEDCL. There has been adequate tariff
increase to cover the revenue gap of the respective year. For FY 06-07, the Commission had also
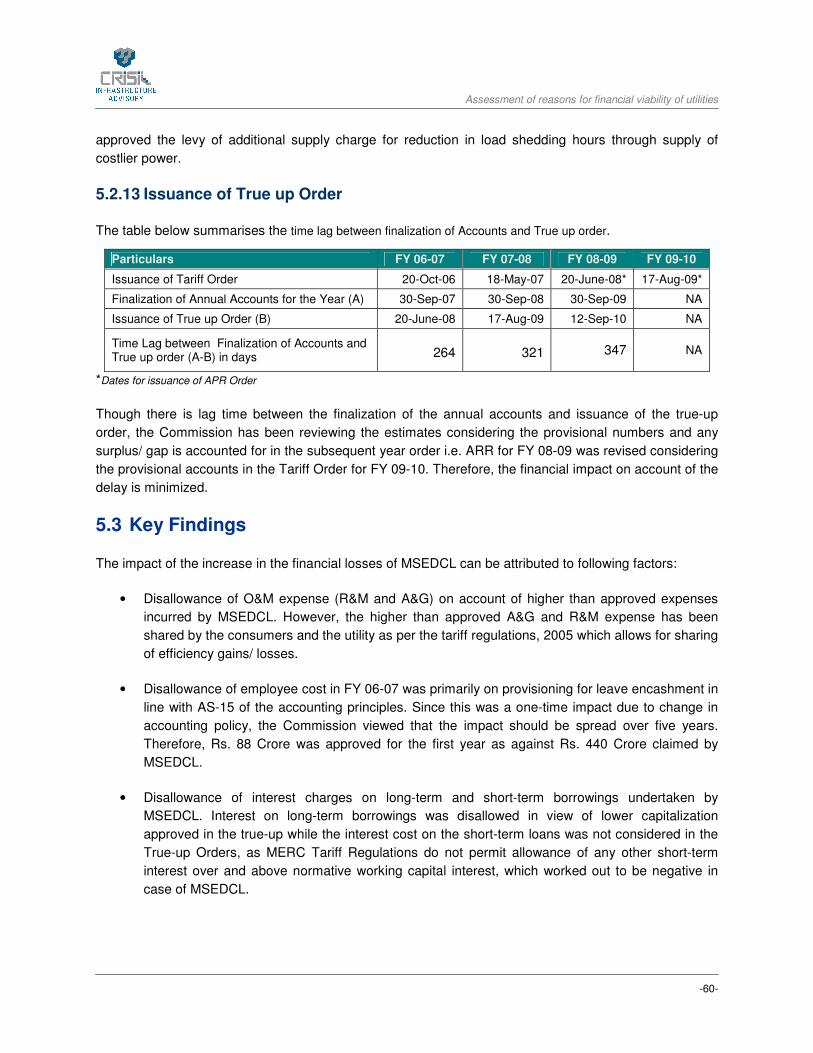
Assessment of reasons for financial viability of utilities
-60-
approved the levy of additional supply charge for reduction in load shedding hours through supply of
costlier power.
5.2.13 Issuance of True up Order
The table below summarises the time lag between finalization of Accounts and True up order.
Particulars FY 06-07 FY 07-08 FY 08-09 FY 09-10
Issuance of Tariff Order 20-Oct-06 18-May-07 20-June-08* 17-Aug-09*
Finalization of Annual Accounts for the Year (A) 30-Sep-07 30-Sep-08 30-Sep-09 NA
Issuance of True up Order (B) 20-June-08 17-Aug-09 12-Sep-10 NA
Time Lag between Finalization of Accounts and True up order (A-B) in days 264 321 347 NA
*Dates for issuance of APR Order
Though there is lag time between the finalization of the annual accounts and issuance of the true-up
order, the Commission has been reviewing the estimates considering the provisional numbers and any
surplus/ gap is accounted for in the subsequent year order i.e. ARR for FY 08-09 was revised considering
the provisional accounts in the Tariff Order for FY 09-10. Therefore, the financial impact on account of the
delay is minimized.
5.3 Key Findings
The impact of the increase in the financial losses of MSEDCL can be attributed to following factors:
• Disallowance of O&M expense (R&M and A&G) on account of higher than approved expenses
incurred by MSEDCL. However, the higher than approved A&G and R&M expense has been
shared by the consumers and the utility as per the tariff regulations, 2005 which allows for sharing
of efficiency gains/ losses.
• Disallowance of employee cost in FY 06-07 was primarily on provisioning for leave encashment in
line with AS-15 of the accounting principles. Since this was a one-time impact due to change in
accounting policy, the Commission viewed that the impact should be spread over five years.
Therefore, Rs. 88 Crore was approved for the first year as against Rs. 440 Crore claimed by
MSEDCL.
• Disallowance of interest charges on long-term and short-term borrowings undertaken by
MSEDCL. Interest on long-term borrowings was disallowed in view of lower capitalization
approved in the true-up while the interest cost on the short-term loans was not considered in the
True-up Orders, as MERC Tariff Regulations do not permit allowance of any other short-term
interest over and above normative working capital interest, which worked out to be negative in
case of MSEDCL.
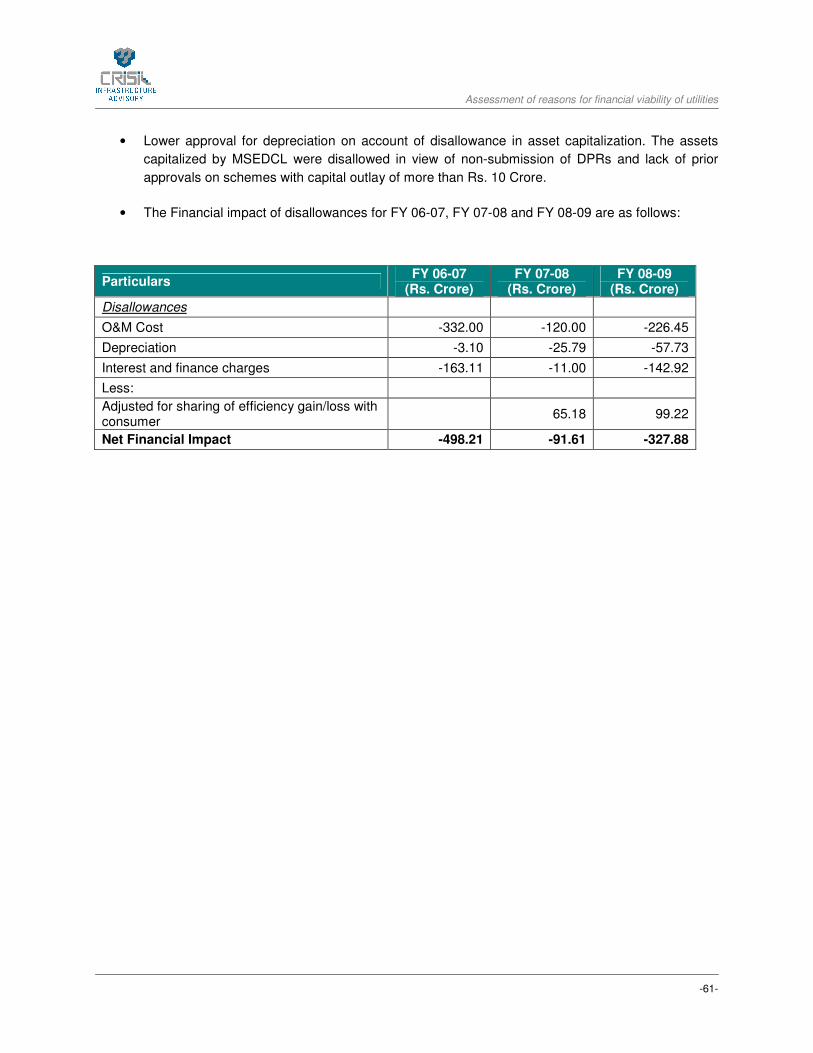
Assessment of reasons for financial viability of utilities
-61-
• Lower approval for depreciation on account of disallowance in asset capitalization. The assets
capitalized by MSEDCL were disallowed in view of non-submission of DPRs and lack of prior
approvals on schemes with capital outlay of more than Rs. 10 Crore.
• The Financial impact of disallowances for FY 06-07, FY 07-08 and FY 08-09 are as follows:
Particulars FY 06-07
(Rs. Crore) FY 07-08
(Rs. Crore) FY 08-09
(Rs. Crore)
Disallowances
O&M Cost -332.00 -120.00 -226.45
Depreciation -3.10 -25.79 -57.73
Interest and finance charges -163.11 -11.00 -142.92
Less:
Adjusted for sharing of efficiency gain/loss with consumer
65.18 99.22
Net Financial Impact -498.21 -91.61 -327.88
Assessment of reasons for financial viability of utilities
-62-
6 PUNJAB
6.1 Introduction
In the state of Punjab, Punjab State Electricity Regulatory Commission in exercise of powers vested in it
under the Electricity Act, 2003 (Act) passes the Annual Tariff Order. Prior to the restructuring, Punjab
State Electricity Board was the entity responsible for Generation, Transmission and Distribution. The
Government of Punjab vide notification dated 16.4.2010 unbundled PSEB into two companies, viz Punjab
State Power Corporation Ltd. (POWERCOM) and Punjab State Transmission Corporation Ltd.
(TRANSCO). The erstwhile PSEB as on 31.3.2009 had total generating capacity of 6841 MW from all
sources. The main problem of Power utility in Punjab like that of other utilities of India is growing losses
which is mainly on account of growing gap between the revenue earned and expenditure incurred. The
result is the dwindling Financial Viability of the utility in the Long run.
6.2 Key Findings
The increase in financial losses of PSEB can be attributed to following factors:
• Disallowance of sales due to variation in estimation of Agriculture consumption by PSEB and
Commission.
• Disallowance of sales due to Commission approving T&D loss of 19.50% as compared to actual
T&D loss of 22.21% claimed by PSEB in its ARR petition for FY 2010-11 ( as per the True Up
order of FY 2008-09).
• Disallowance of employee cost by Commission on pretext of high employee cost of PSEB.
Commission has capped the employee cost till FY 05-06 and for future years allowed increase by
WPI only.The Board has taken steps like freezing of recruitments against retirement/death cases
since 1999.
• Disallowance of interest and finance charge on the pretext of high interest rates. Also
disallowance of short term loans taken by PSEB for employee cost.
• Table below summarises the impact of al these factors in terms of financial numbers. All these
factors are discussed in detail in later section.

Assessment of reasons for financial viability of utilities
-63-
S.No. Attribute Financial loss (FY 08-09) in Rs Crs
1 Disallowance of sales 333.01
2 Disallowance of T&D loss 435.99
3 Disallowance in employee cost 433.85
4 Disallowance of Interest and finance charges 378.6
Total 1581.45
Source: CRIS analysis
6.3 Approach followed for approving various components
In this section we bring forth the approach adopted by the Commission for approving various components
which have bearing on the financial viability of the Board/distribution utility.
Note: Proposed refers to figures proposed by the utilities, Approved refers to figures approved by Commission, Actual refers to
actual figures as per audited accounts of DISCOMs, and Trued up refers to figures as per True Up orders by Commission.
6.3.1 Sales
For the Metered categories the Commission has consistently considered past three years CAGR of actual
sales to approve current years sales, the same approach has been followed by the PSEB for projecting
the sales.
For Unmetered Agriculture Category the Commission had carried out various studies to accurately access
sales, but no study has been completely accepted to arrive at unmetered agricultural sale year on year.
The graph below shows the Total sales approved by the Commission and Trued Up sales from FY 05-06
to FY 09-10.
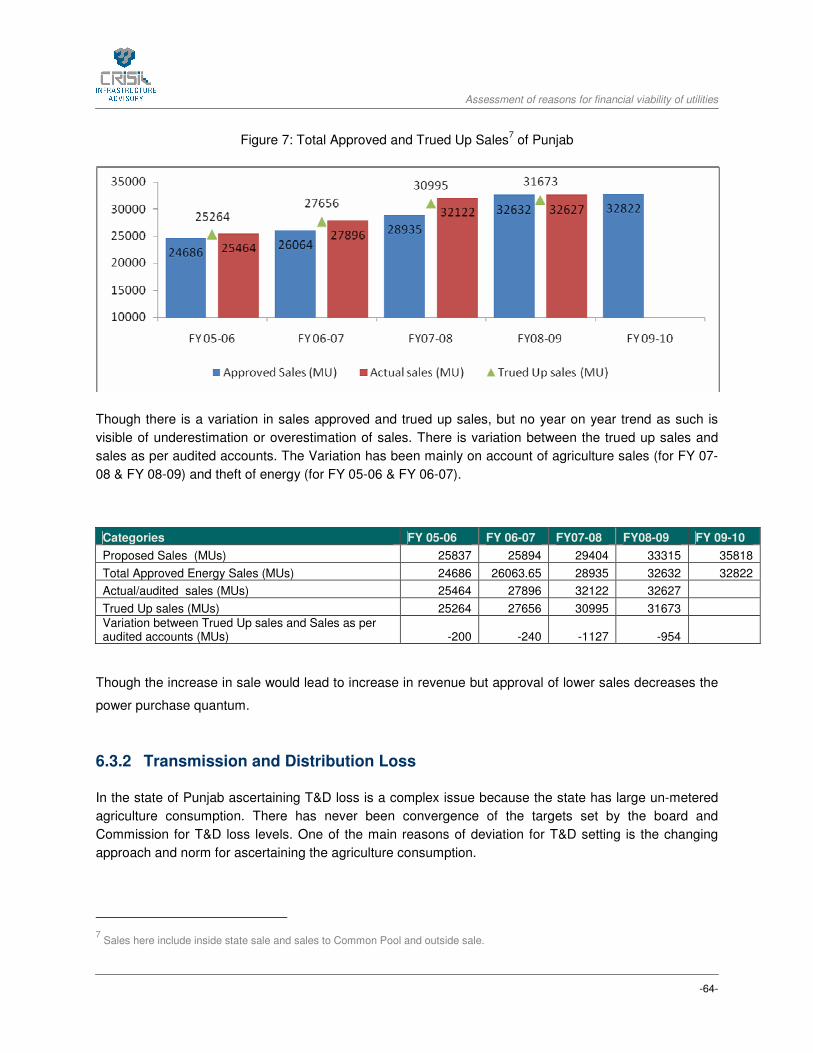
Assessment of reasons for financial viability of utilities
-64-
Figure 7: Total Approved and Trued Up Sales7 of Punjab
Though there is a variation in sales approved and trued up sales, but no year on year trend as such is
visible of underestimation or overestimation of sales. There is variation between the trued up sales and
sales as per audited accounts. The Variation has been mainly on account of agriculture sales (for FY 07-
08 & FY 08-09) and theft of energy (for FY 05-06 & FY 06-07).
Categories FY 05-06 FY 06-07 FY07-08 FY08-09 FY 09-10
Proposed Sales (MUs) 25837 25894 29404 33315 35818
Total Approved Energy Sales (MUs) 24686 26063.65 28935 32632 32822
Actual/audited sales (MUs) 25464 27896 32122 32627
Trued Up sales (MUs) 25264 27656 30995 31673
Variation between Trued Up sales and Sales as per audited accounts (MUs) -200 -240 -1127 -954
Though the increase in sale would lead to increase in revenue but approval of lower sales decreases the
power purchase quantum.
6.3.2 Transmission and Distribution Loss
In the state of Punjab ascertaining T&D loss is a complex issue because the state has large un-metered
agriculture consumption. There has never been convergence of the targets set by the board and
Commission for T&D loss levels. One of the main reasons of deviation for T&D setting is the changing
approach and norm for ascertaining the agriculture consumption.
7 Sales here include inside state sale and sales to Common Pool and outside sale.
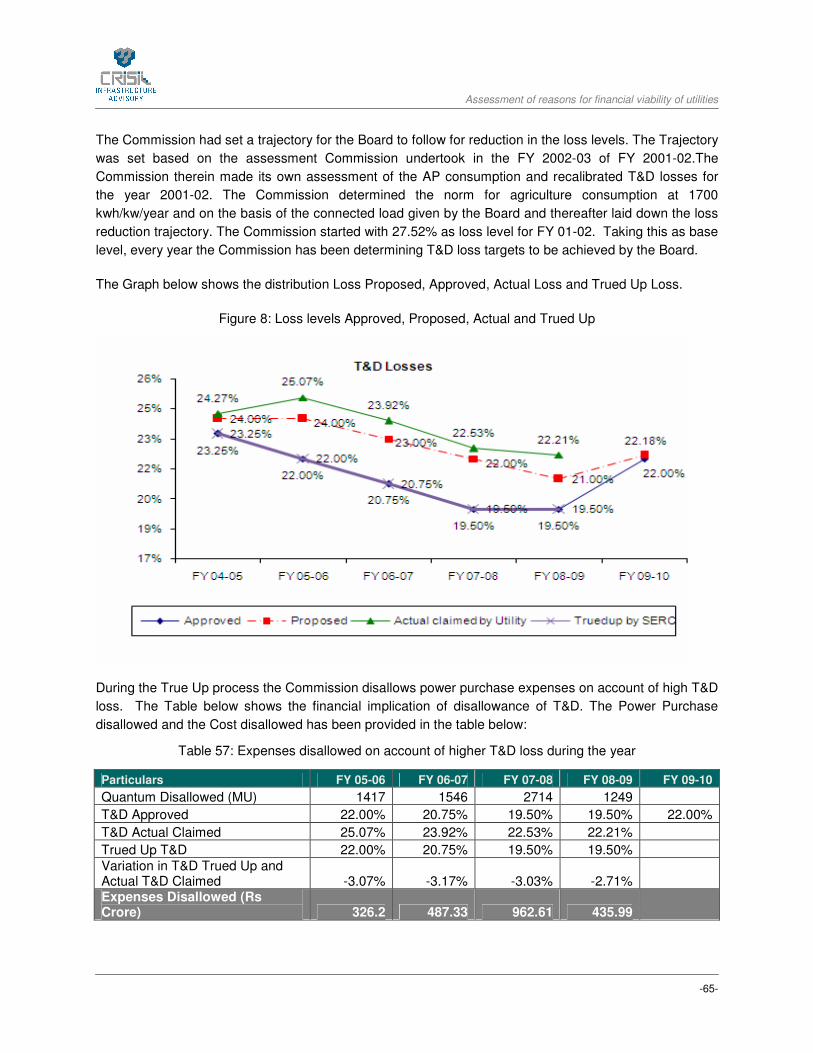
Assessment of reasons for financial viability of utilities
-65-
The Commission had set a trajectory for the Board to follow for reduction in the loss levels. The Trajectory
was set based on the assessment Commission undertook in the FY 2002-03 of FY 2001-02.The
Commission therein made its own assessment of the AP consumption and recalibrated T&D losses for
the year 2001-02. The Commission determined the norm for agriculture consumption at 1700
kwh/kw/year and on the basis of the connected load given by the Board and thereafter laid down the loss
reduction trajectory. The Commission started with 27.52% as loss level for FY 01-02. Taking this as base
level, every year the Commission has been determining T&D loss targets to be achieved by the Board.
The Graph below shows the distribution Loss Proposed, Approved, Actual Loss and Trued Up Loss.
Figure 8: Loss levels Approved, Proposed, Actual and Trued Up
During the True Up process the Commission disallows power purchase expenses on account of high T&D
loss. The Table below shows the financial implication of disallowance of T&D. The Power Purchase
disallowed and the Cost disallowed has been provided in the table below:
Table 57: Expenses disallowed on account of higher T&D loss during the year
Particulars FY 05-06 FY 06-07 FY 07-08 FY 08-09 FY 09-10
Quantum Disallowed (MU) 1417 1546 2714 1249
T&D Approved 22.00% 20.75% 19.50% 19.50% 22.00%
T&D Actual Claimed 25.07% 23.92% 22.53% 22.21%
Trued Up T&D 22.00% 20.75% 19.50% 19.50%
Variation in T&D Trued Up and Actual T&D Claimed -3.07% -3.17% -3.03% -2.71%
Expenses Disallowed (Rs Crore) 326.2 487.33 962.61 435.99

Assessment of reasons for financial viability of utilities
-66-
6.3.3 Power Purchase Cost
PSEB purchases power from Bhakra Beas Management Board (BBMB), Central Generating Stations of
NTPC, NHPC, NJPC and NPC, Power Trading Corporation and through Bilateral Purchases from other
States.
The Power Purchased from Traders and through UI is approved by Commission by taking into account
the approved gross purchase of power for the year and the power available from central generating
stations and other sources. The rate approved for such power is based on the actual average purchase
rate of traded power in the previous year.
However, this was not followed consistently by the Commission over FY 05-06 to FY 09-10.The
Commission, for some years accepted the Board’s projection of UI rates. The Commission, in its later
tariff Orders decided that the cost of power purchased from traders in excess of the approved quantum of
will be admissible only at an average rate of realization which was fixed by commission and which was
lower than the average rate at which approved UI power was allowed.
Note: Commission has not issued any Regulations on short term and medium term power purchase by the PSEB. Since no new
capacity has been added, PSEB is purchasing more and more power in short term market to meet its obligation of supply. Going
forward, the Commission may ask PSEB to submit procurement/business plan for short term and medium term power procurement
and disallowed cost only in case of non – achievement of plan/targets.
The Financial implication of increase in the Power Cost of PSEB can be attributed to the following factors:
• Reduction of sales to agriculture consumers by Commission at the time of approving and Truing
up of the Quantum .This means that the Commission does not approve the sale projected by the
PSEB to Agriculture.
• Increase in sales to metered categories of Consumers which leads to purchase of power over
and above the level approved.
• T&D loss approved and Trued up by Commission lower than the actual T&D loss of the Board,
which then leads to increase in Power Purchase quantum.
Though the Commission True’s up the Power Purchase quantum and Cost in the true up exercise but the
True up process takes place after a lag of two years. During the lag period the utility has to foot the power
purchase bill from its own coffers which has an adverse effect on it financial situation.
Table 58: Power Purchase Cost
Power Purchase Cost (Rs. Crore) FY 05-06 FY 06-07 FY 07-08 FY 08-09 FY 09-10
Approved 2259.66 2813.34 3410.01 4186.33 4746.59
Actual 2404.92 4327.01 6020.37 5184.05
Trued Up 2404.92 4327.01 6020.37 5184.05
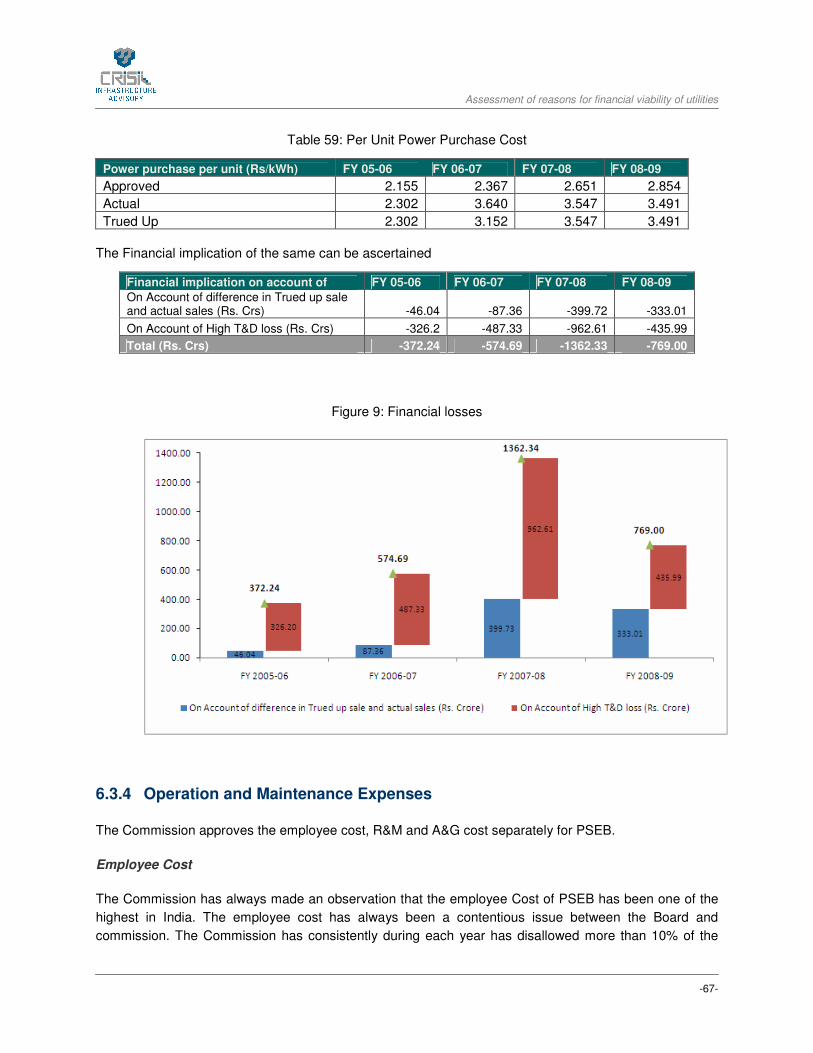
Assessment of reasons for financial viability of utilities
-67-
Table 59: Per Unit Power Purchase Cost
Power purchase per unit (Rs/kWh) FY 05-06 FY 06-07 FY 07-08 FY 08-09
Approved 2.155 2.367 2.651 2.854
Actual 2.302 3.640 3.547 3.491
Trued Up 2.302 3.152 3.547 3.491
The Financial implication of the same can be ascertained
Financial implication on account of FY 05-06 FY 06-07 FY 07-08 FY 08-09
On Account of difference in Trued up sale and actual sales (Rs. Crs) -46.04 -87.36 -399.72 -333.01
On Account of High T&D loss (Rs. Crs) -326.2 -487.33 -962.61 -435.99
Total (Rs. Crs) -372.24 -574.69 -1362.33 -769.00
Figure 9: Financial losses
6.3.4 Operation and Maintenance Expenses
The Commission approves the employee cost, R&M and A&G cost separately for PSEB.
Employee Cost
The Commission has always made an observation that the employee Cost of PSEB has been one of the
highest in India. The employee cost has always been a contentious issue between the Board and
commission. The Commission has consistently during each year has disallowed more than 10% of the
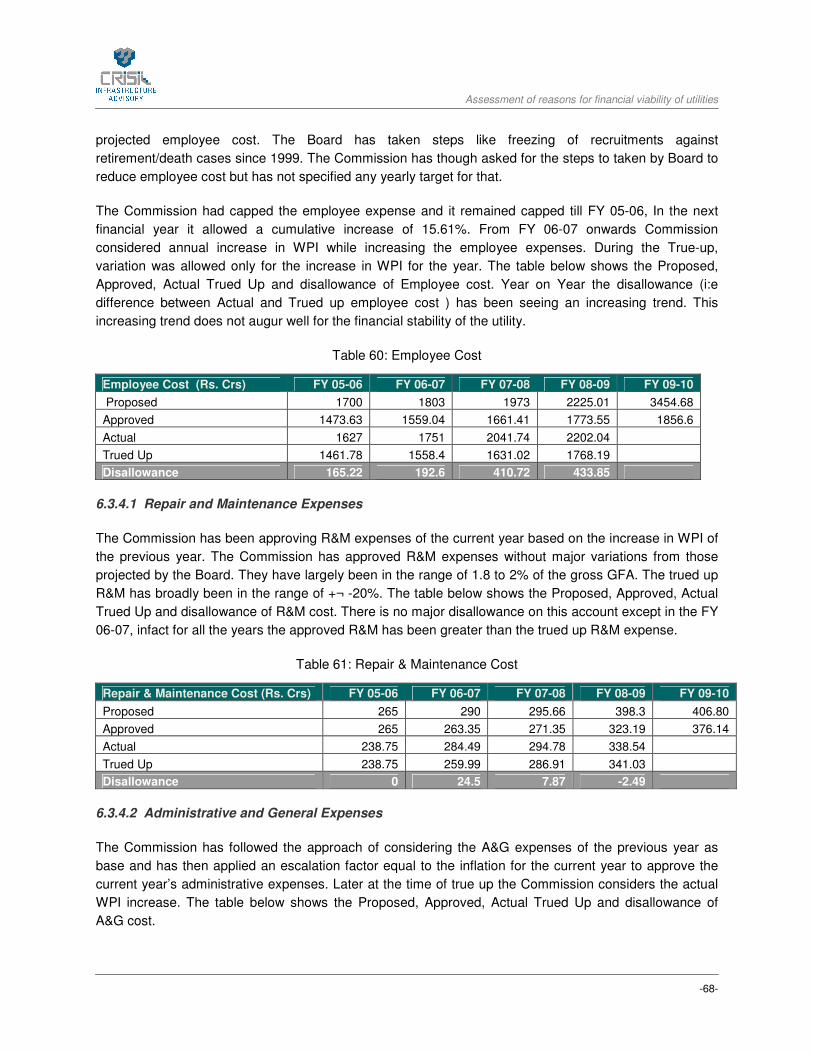
Assessment of reasons for financial viability of utilities
-68-
projected employee cost. The Board has taken steps like freezing of recruitments against
retirement/death cases since 1999. The Commission has though asked for the steps to taken by Board to
reduce employee cost but has not specified any yearly target for that.
The Commission had capped the employee expense and it remained capped till FY 05-06, In the next
financial year it allowed a cumulative increase of 15.61%. From FY 06-07 onwards Commission
considered annual increase in WPI while increasing the employee expenses. During the True-up,
variation was allowed only for the increase in WPI for the year. The table below shows the Proposed,
Approved, Actual Trued Up and disallowance of Employee cost. Year on Year the disallowance (i:e
difference between Actual and Trued up employee cost ) has been seeing an increasing trend. This
increasing trend does not augur well for the financial stability of the utility.
Table 60: Employee Cost
Employee Cost (Rs. Crs) FY 05-06 FY 06-07 FY 07-08 FY 08-09 FY 09-10
Proposed 1700 1803 1973 2225.01 3454.68
Approved 1473.63 1559.04 1661.41 1773.55 1856.6
Actual 1627 1751 2041.74 2202.04
Trued Up 1461.78 1558.4 1631.02 1768.19
Disallowance 165.22 192.6 410.72 433.85
6.3.4.1 Repair and Maintenance Expenses
The Commission has been approving R&M expenses of the current year based on the increase in WPI of
the previous year. The Commission has approved R&M expenses without major variations from those
projected by the Board. They have largely been in the range of 1.8 to 2% of the gross GFA. The trued up
R&M has broadly been in the range of +¬ -20%. The table below shows the Proposed, Approved, Actual
Trued Up and disallowance of R&M cost. There is no major disallowance on this account except in the FY
06-07, infact for all the years the approved R&M has been greater than the trued up R&M expense.
Table 61: Repair & Maintenance Cost
Repair & Maintenance Cost (Rs. Crs) FY 05-06 FY 06-07 FY 07-08 FY 08-09 FY 09-10
Proposed 265 290 295.66 398.3 406.80
Approved 265 263.35 271.35 323.19 376.14
Actual 238.75 284.49 294.78 338.54
Trued Up 238.75 259.99 286.91 341.03
Disallowance 0 24.5 7.87 -2.49
6.3.4.2 Administrative and General Expenses
The Commission has followed the approach of considering the A&G expenses of the previous year as
base and has then applied an escalation factor equal to the inflation for the current year to approve the
current year’s administrative expenses. Later at the time of true up the Commission considers the actual
WPI increase. The table below shows the Proposed, Approved, Actual Trued Up and disallowance of
A&G cost.

Assessment of reasons for financial viability of utilities
-69-
Table 62: Administrative and General Expenses
Administrative & General Expense (Rs. Crs) FY 05-06 FY 06-07 FY 07-08 FY 08-09 FY 09-10
Proposed 55 58 87.41 90.34 76.00
Approved 50.31 57.84 62.41 79.29 76.00
Actual 58.01 59.2 69.92 70.96
Trued Up 54.91 59.81 66 70.96
Disallowance 3.1 -0.61 3.92 0
The table below summarises the financial implication of Disallowance/over allowance of each of the O&M
components.
Table 63: Summary of O&M expenses
Operation and Maintenance Expenses (Rs. Crs) FY 05-06 FY 06-07 FY 07-08 FY 08-09 FY 09-10
Proposed 2020 2151 2356.07 2713.65 3937.48
Approved 1788.94 1880.23 1995.17 2176.03 2308.54
Actual 1923.76 2094.69 2406.44 2611.54
Trued-up 1755.44 1878.2 1983.93 2180.18
Effect on Financial Viability -168.32 -216.49 -422.51 -431.36
6.3.5 Capital Expenditure
The Commission takes cognizance of the actual expenditure for the previous year to approve the current
years Capital Expenditure. The Table Below shows the Capital expenditure Proposed, Approved and
Actual. The Commission could have been more benevolent in approving Capital expenditure considering
that the Commission has not wavered from the stringent T&D trajectory set by it.
Table 64: Capital Expenditure
Capital Expenditure (Rs. Crs) FY 05-06 FY 06-07 FY 07-08 FY 08-09 FY 09-10
Proposed 1956 2509 3778.85 2684.26 5016.4
Approved 1200 1500 2500 2000 2000
Actual 1371.85 1924.51
6.3.6 Depreciation
The Commission approves depreciation function wise, by applying function wise depreciation rates to the
assets. The table below provides details about the Depreciation Approved, Actual and Trued up
depreciation.

Assessment of reasons for financial viability of utilities
-70-
Table 65: Depreciation Approved and Trued Up
Particulars FY 05-06 FY 06-07 FY 07-08 FY 08-09 FY 09-10
GFA at the beginning of the year (Rs. Crs) 13901.35 14695 16072.98 18256.81 18338.79
Depreciation Approved (Rs. Crs) 621.77 649 696.82 783.34 826.02
Actual Depreciation (Rs. Crs) 583.86 605 665.15 721.73
Trued Up Depreciation (Rs. Crs) 583.86 605 664.89 721.5
Disallowance 0 0 0.26 0.23
6.3.7 Return
Till FY 05-06 the Commission approved Return based on the net fixed assets at the beginning of the
year. The net fixed assets were calculated by adjusting gross opening fixed asset for accumulated
depreciation and consumer contribution. The Commission allowed return at the rate of 3% on Net fixed
assets. From FY 06-07 onwards the Commission approved Return based on Equity. The Commission
allowed return @ 14% on equity. The Commission has noted that though PSEB is running in losses but
denial of ROE to a loss making utility will further push it into losses rather than retrieving it from that
situation. The RoE for all the years has remained at Rs.412.46 Crs, this is mainly because the equity
component has not increased and all the capital expenditure is being done out of Loans and consumer
contribution.
There has been convergence in return proposed, approved and Trued up.
6.3.8 Subsidy
The government of Punjab subsidizes AP consumers, Scheduled Castes DS consumers and Non-SC
BPL DS consumers. As per the terms and conditions of determination of tariff issued by PSERC in 2005,
“If the State Government requires the grant of any subsidy to any consumer or class of consumers in the
tariff determined by the Commission, the State Government shall, notwithstanding any direction which
may be given under Section 108 of the Act, pay, in advance and in such manner as may be specified, the
amount to compensate the person affected by the grant of subsidy in the manner the Commission may
direct, as a condition for the licensee or any other person concerned to implement the subsidy provided
for by the State Government.”
The Commission before ascertaining the tariffs in the Tariff Order seeks government stand on the amount
of subsidy it will grant based on the agriculture consumption and the free units to SC category.
Commission then works out the total revenue from the consumer tariffs considering the subsidy of State
Govt. The Government of Punjab provides subsidy to the Board in the following manner:
• Adjustment from interest due from the Board on Government loans
• Adjustment of Electricity Duty
• Cash Subsidy
Though Commission decided that the Government will make payment of subsidy in equal quarterly
instalments, in advance, at the beginning of each quarter but the same does not happen and therefore,
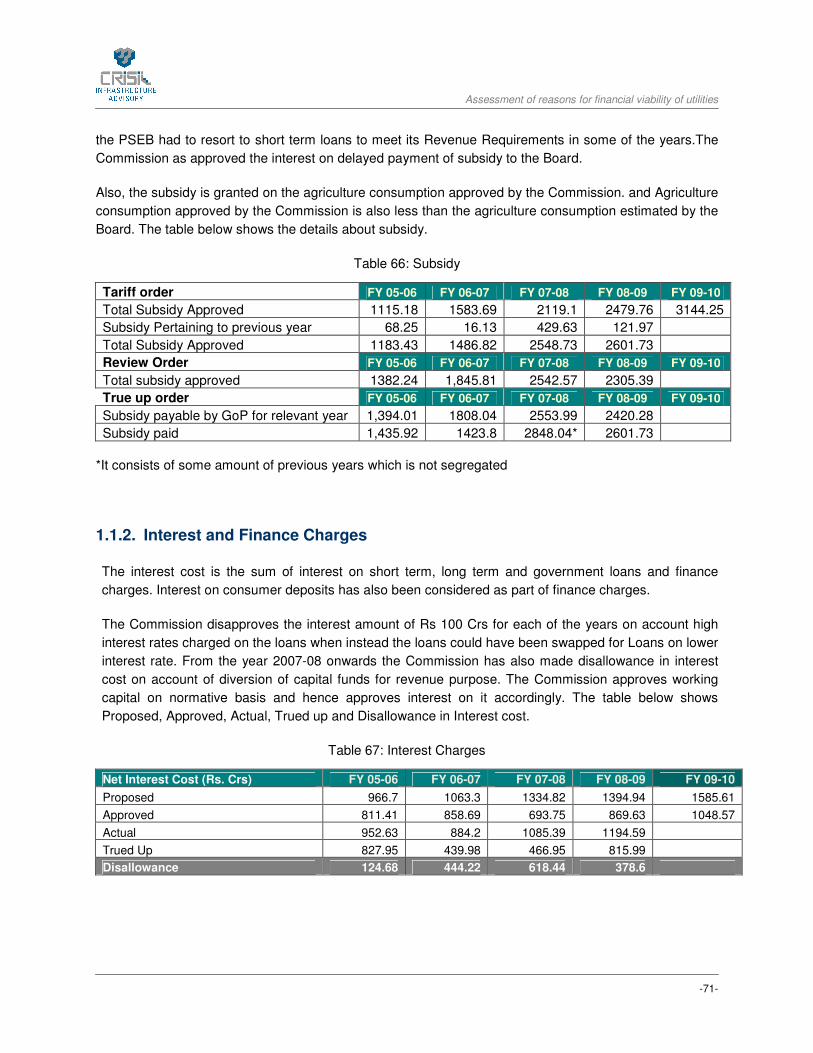
Assessment of reasons for financial viability of utilities
-71-
the PSEB had to resort to short term loans to meet its Revenue Requirements in some of the years.The
Commission as approved the interest on delayed payment of subsidy to the Board.
Also, the subsidy is granted on the agriculture consumption approved by the Commission. and Agriculture
consumption approved by the Commission is also less than the agriculture consumption estimated by the
Board. The table below shows the details about subsidy.
Table 66: Subsidy
Tariff order FY 05-06 FY 06-07 FY 07-08 FY 08-09 FY 09-10
Total Subsidy Approved 1115.18 1583.69 2119.1 2479.76 3144.25
Subsidy Pertaining to previous year 68.25 16.13 429.63 121.97
Total Subsidy Approved 1183.43 1486.82 2548.73 2601.73
Review Order FY 05-06 FY 06-07 FY 07-08 FY 08-09 FY 09-10
Total subsidy approved 1382.24 1,845.81 2542.57 2305.39
True up order FY 05-06 FY 06-07 FY 07-08 FY 08-09 FY 09-10
Subsidy payable by GoP for relevant year 1,394.01 1808.04 2553.99 2420.28
Subsidy paid 1,435.92 1423.8 2848.04* 2601.73
*It consists of some amount of previous years which is not segregated
1.1.2. Interest and Finance Charges
The interest cost is the sum of interest on short term, long term and government loans and finance
charges. Interest on consumer deposits has also been considered as part of finance charges.
The Commission disapproves the interest amount of Rs 100 Crs for each of the years on account high
interest rates charged on the loans when instead the loans could have been swapped for Loans on lower
interest rate. From the year 2007-08 onwards the Commission has also made disallowance in interest
cost on account of diversion of capital funds for revenue purpose. The Commission approves working
capital on normative basis and hence approves interest on it accordingly. The table below shows
Proposed, Approved, Actual, Trued up and Disallowance in Interest cost.
Table 67: Interest Charges
Net Interest Cost (Rs. Crs) FY 05-06 FY 06-07 FY 07-08 FY 08-09 FY 09-10
Proposed 966.7 1063.3 1334.82 1394.94 1585.61
Approved 811.41 858.69 693.75 869.63 1048.57
Actual 952.63 884.2 1085.39 1194.59
Trued Up 827.95 439.98 466.95 815.99
Disallowance 124.68 444.22 618.44 378.6
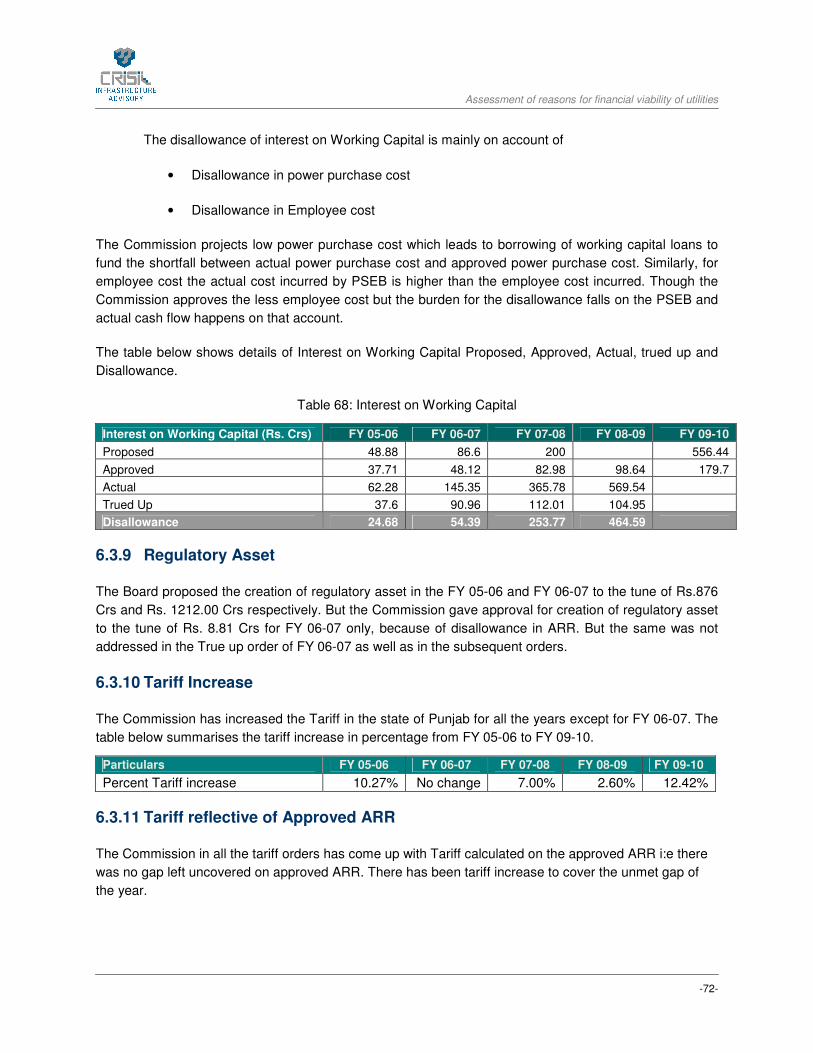
Assessment of reasons for financial viability of utilities
-72-
The disallowance of interest on Working Capital is mainly on account of
• Disallowance in power purchase cost
• Disallowance in Employee cost
The Commission projects low power purchase cost which leads to borrowing of working capital loans to
fund the shortfall between actual power purchase cost and approved power purchase cost. Similarly, for
employee cost the actual cost incurred by PSEB is higher than the employee cost incurred. Though the
Commission approves the less employee cost but the burden for the disallowance falls on the PSEB and
actual cash flow happens on that account.
The table below shows details of Interest on Working Capital Proposed, Approved, Actual, trued up and
Disallowance.
Table 68: Interest on Working Capital
Interest on Working Capital (Rs. Crs) FY 05-06 FY 06-07 FY 07-08 FY 08-09 FY 09-10
Proposed 48.88 86.6 200 556.44
Approved 37.71 48.12 82.98 98.64 179.7
Actual 62.28 145.35 365.78 569.54
Trued Up 37.6 90.96 112.01 104.95
Disallowance 24.68 54.39 253.77 464.59
6.3.9 Regulatory Asset
The Board proposed the creation of regulatory asset in the FY 05-06 and FY 06-07 to the tune of Rs.876
Crs and Rs. 1212.00 Crs respectively. But the Commission gave approval for creation of regulatory asset
to the tune of Rs. 8.81 Crs for FY 06-07 only, because of disallowance in ARR. But the same was not
addressed in the True up order of FY 06-07 as well as in the subsequent orders.
6.3.10 Tariff Increase
The Commission has increased the Tariff in the state of Punjab for all the years except for FY 06-07. The
table below summarises the tariff increase in percentage from FY 05-06 to FY 09-10.
Particulars FY 05-06 FY 06-07 FY 07-08 FY 08-09 FY 09-10
Percent Tariff increase 10.27% No change 7.00% 2.60% 12.42%
6.3.11 Tariff reflective of Approved ARR
The Commission in all the tariff orders has come up with Tariff calculated on the approved ARR i:e there
was no gap left uncovered on approved ARR. There has been tariff increase to cover the unmet gap of
the year.
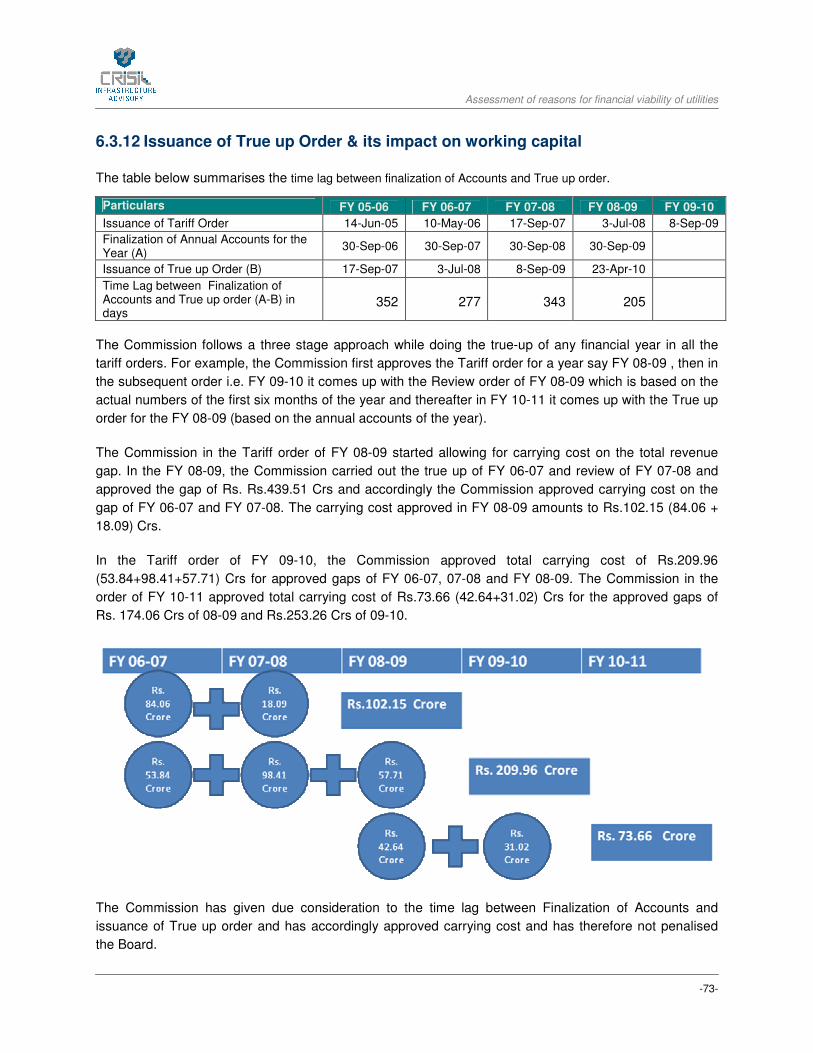
Assessment of reasons for financial viability of utilities
-73-
6.3.12 Issuance of True up Order & its impact on working capital
The table below summarises the time lag between finalization of Accounts and True up order.
Particulars FY 05-06 FY 06-07 FY 07-08 FY 08-09 FY 09-10
Issuance of Tariff Order 14-Jun-05 10-May-06 17-Sep-07 3-Jul-08 8-Sep-09
Finalization of Annual Accounts for the Year (A)
30-Sep-06 30-Sep-07 30-Sep-08 30-Sep-09
Issuance of True up Order (B) 17-Sep-07 3-Jul-08 8-Sep-09 23-Apr-10
Time Lag between Finalization of Accounts and True up order (A-B) in days
352 277 343 205
The Commission follows a three stage approach while doing the true-up of any financial year in all the
tariff orders. For example, the Commission first approves the Tariff order for a year say FY 08-09 , then in
the subsequent order i.e. FY 09-10 it comes up with the Review order of FY 08-09 which is based on the
actual numbers of the first six months of the year and thereafter in FY 10-11 it comes up with the True up
order for the FY 08-09 (based on the annual accounts of the year).
The Commission in the Tariff order of FY 08-09 started allowing for carrying cost on the total revenue
gap. In the FY 08-09, the Commission carried out the true up of FY 06-07 and review of FY 07-08 and
approved the gap of Rs. Rs.439.51 Crs and accordingly the Commission approved carrying cost on the
gap of FY 06-07 and FY 07-08. The carrying cost approved in FY 08-09 amounts to Rs.102.15 (84.06 +
18.09) Crs.
In the Tariff order of FY 09-10, the Commission approved total carrying cost of Rs.209.96
(53.84+98.41+57.71) Crs for approved gaps of FY 06-07, 07-08 and FY 08-09. The Commission in the
order of FY 10-11 approved total carrying cost of Rs.73.66 (42.64+31.02) Crs for the approved gaps of
Rs. 174.06 Crs of 08-09 and Rs.253.26 Crs of 09-10.
The Commission has given due consideration to the time lag between Finalization of Accounts and
issuance of True up order and has accordingly approved carrying cost and has therefore not penalised
the Board.
Assessment of reasons for financial viability of utilities
-74-
7 RAJASTHAN
7.1 Introduction
In the state of Rajasthan, Rajasthan Electricity Regulatory Commission was established under Rajasthan
Power Sector Reform Act, 1999 and Electricity Act, 2003 is responsible for the determination of tariffs for
generation, transmission, distribution and wheeling of electricity, in wholesale, bulk or retail. Rajasthan is
an unbundled state, i.e. the function of distribution, generation and transmission is carried out by separate
companies. In the state there is one generation, one transmission are three distribution companies or
(Vitran Nigams) formed under the Companies Act, 1956 by Govt. of Rajasthan. The three DISCOMs
operating in the state are:
• Ajmer Vidyut Vitran Nigam Ltd. (AVVNL)
• Jaipur Vidyut Vitran Nigam Ltd. (JVVNL)
• Jodhpur Vidyut Vitran Nigam Ltd. (JdVVNL)
The deficit levels of all the three Discoms put together has reached to Rs. 15,540 Crs as determined by
the Commission in the MYT Order for FY 2009-2014. The main reason for the accumulating deficit is the
non-revision of retail tariffs for the past six years.
7.2 Key Findings
The increase in the financial losses of Rajasthan can be attributed to following factors:
• The State has not witnessed a tariff revision since FY 2004-05. This has lead to widening of gap
between average per unit realisation and average per unit cost.
• Increase in short term loans as gap between approved and actual power purchase cost is
increasing due to delay in True Up orders.
• Disallowance of interest on short term borrowing for meeting gap in ARR.
• Table below summarises the impact of all these factors in terms of financial numbers for FY 08-
09. All these factors are discussed in detail in later section.
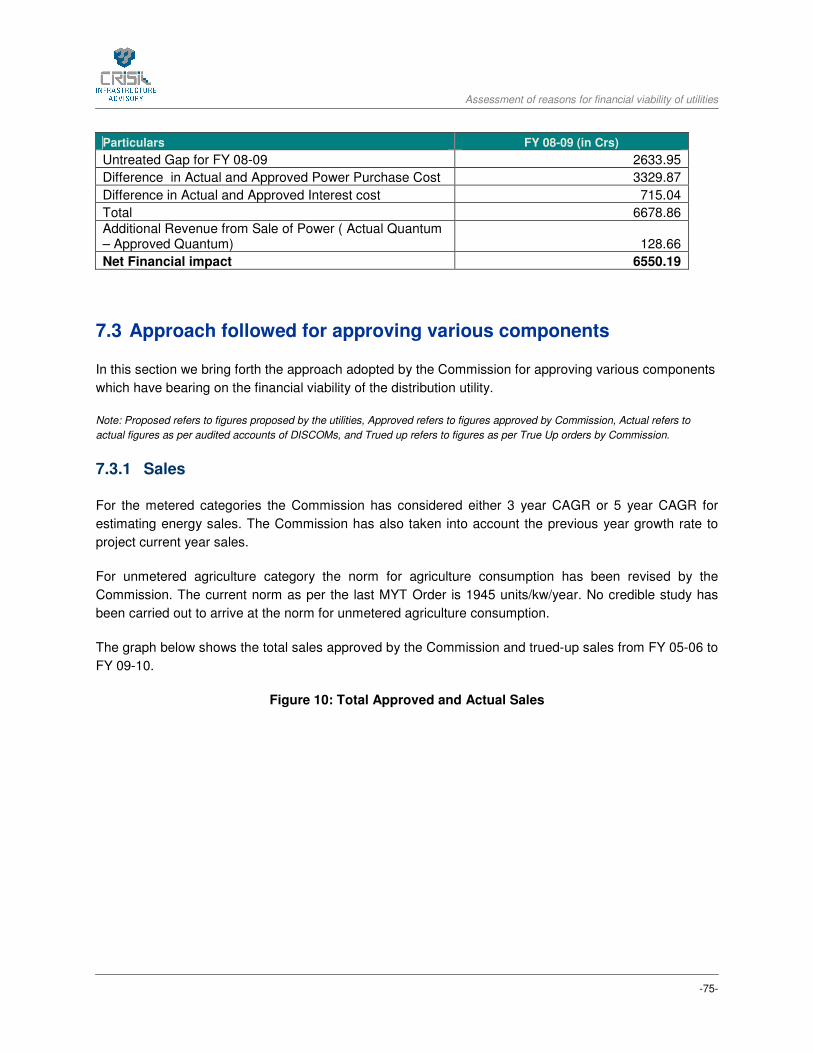
Assessment of reasons for financial viability of utilities
-75-
Particulars FY 08-09 (in Crs)
Untreated Gap for FY 08-09 2633.95
Difference in Actual and Approved Power Purchase Cost 3329.87
Difference in Actual and Approved Interest cost 715.04
Total 6678.86
Additional Revenue from Sale of Power ( Actual Quantum – Approved Quantum) 128.66
Net Financial impact 6550.19
7.3 Approach followed for approving various components
In this section we bring forth the approach adopted by the Commission for approving various components
which have bearing on the financial viability of the distribution utility.
Note: Proposed refers to figures proposed by the utilities, Approved refers to figures approved by Commission, Actual refers to
actual figures as per audited accounts of DISCOMs, and Trued up refers to figures as per True Up orders by Commission.
7.3.1 Sales
For the metered categories the Commission has considered either 3 year CAGR or 5 year CAGR for
estimating energy sales. The Commission has also taken into account the previous year growth rate to
project current year sales.
For unmetered agriculture category the norm for agriculture consumption has been revised by the
Commission. The current norm as per the last MYT Order is 1945 units/kw/year. No credible study has
been carried out to arrive at the norm for unmetered agriculture consumption.
The graph below shows the total sales approved by the Commission and trued-up sales from FY 05-06 to
FY 09-10.
Figure 10: Total Approved and Actual Sales
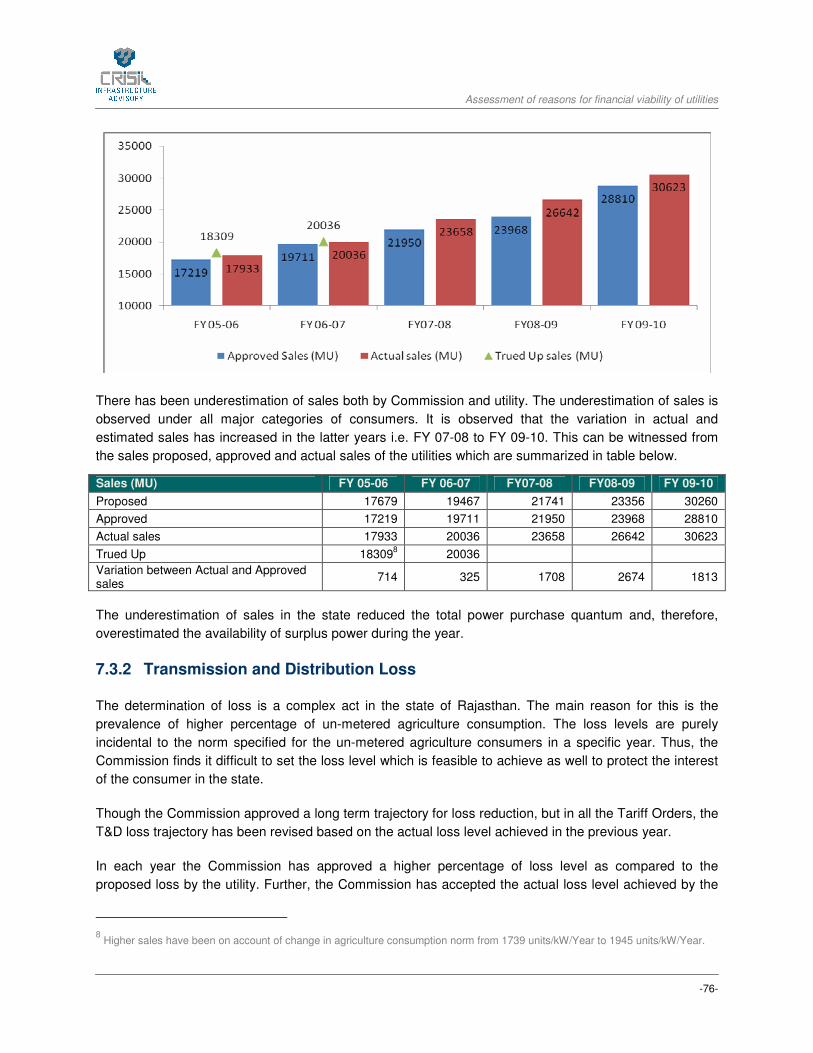
Assessment of reasons for financial viability of utilities
-76-
There has been underestimation of sales both by Commission and utility. The underestimation of sales is
observed under all major categories of consumers. It is observed that the variation in actual and
estimated sales has increased in the latter years i.e. FY 07-08 to FY 09-10. This can be witnessed from
the sales proposed, approved and actual sales of the utilities which are summarized in table below.
Sales (MU) FY 05-06 FY 06-07 FY07-08 FY08-09 FY 09-10
Proposed 17679 19467 21741 23356 30260
Approved 17219 19711 21950 23968 28810
Actual sales 17933 20036 23658 26642 30623
Trued Up 183098 20036
Variation between Actual and Approved sales
714 325 1708 2674 1813
The underestimation of sales in the state reduced the total power purchase quantum and, therefore,
overestimated the availability of surplus power during the year.
7.3.2 Transmission and Distribution Loss
The determination of loss is a complex act in the state of Rajasthan. The main reason for this is the
prevalence of higher percentage of un-metered agriculture consumption. The loss levels are purely
incidental to the norm specified for the un-metered agriculture consumers in a specific year. Thus, the
Commission finds it difficult to set the loss level which is feasible to achieve as well to protect the interest
of the consumer in the state.
Though the Commission approved a long term trajectory for loss reduction, but in all the Tariff Orders, the
T&D loss trajectory has been revised based on the actual loss level achieved in the previous year.
In each year the Commission has approved a higher percentage of loss level as compared to the
proposed loss by the utility. Further, the Commission has accepted the actual loss level achieved by the
8 Higher sales have been on account of change in agriculture consumption norm from 1739 units/kW/Year to 1945 units/kW/Year.
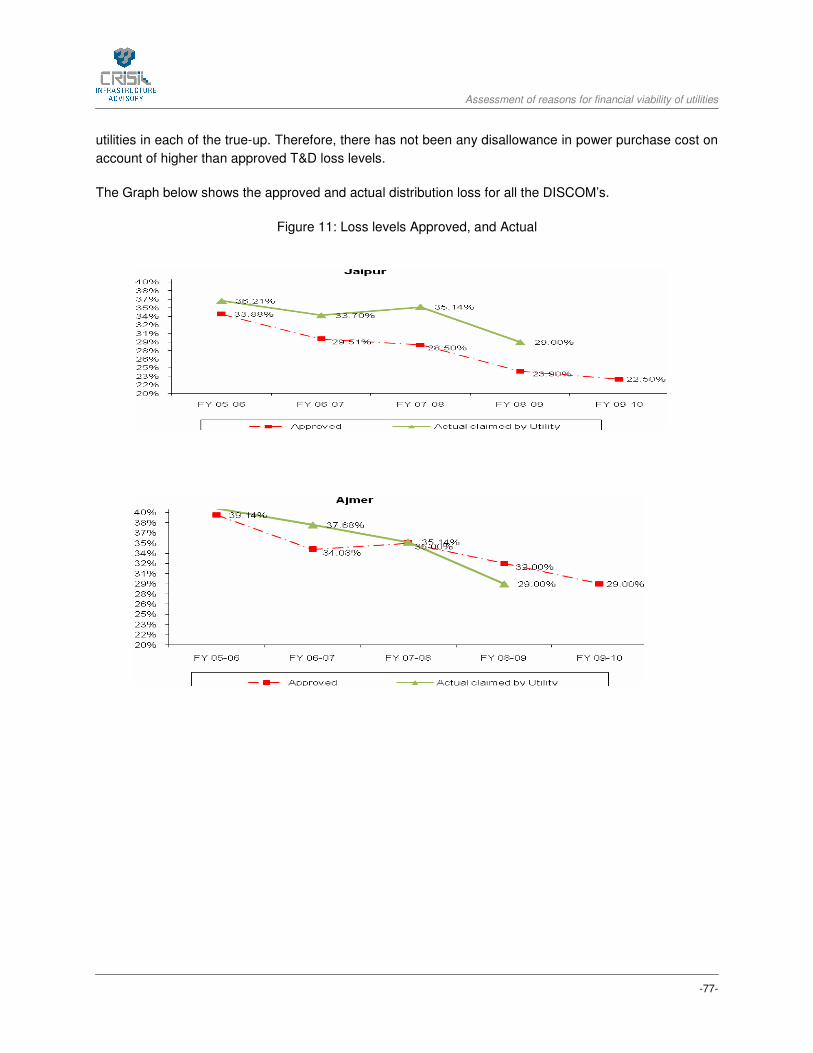
Assessment of reasons for financial viability of utilities
-77-
utilities in each of the true-up. Therefore, there has not been any disallowance in power purchase cost on
account of higher than approved T&D loss levels.
The Graph below shows the approved and actual distribution loss for all the DISCOM’s.
Figure 11: Loss levels Approved, and Actual
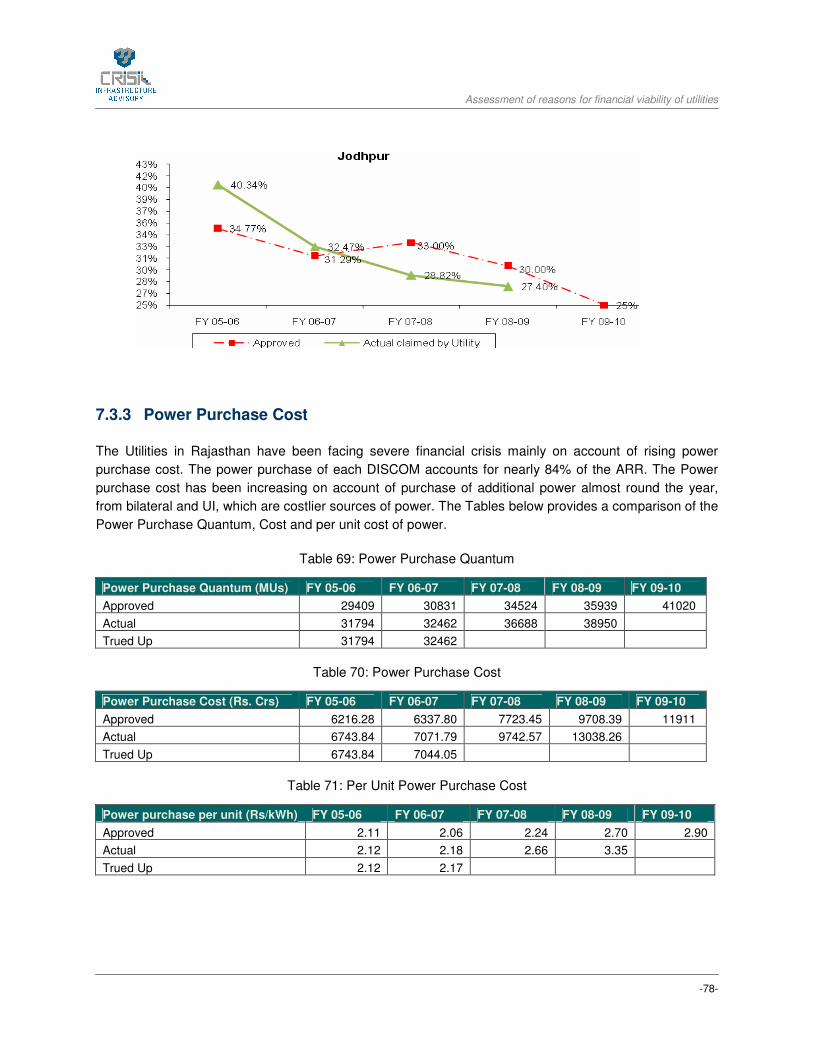
Assessment of reasons for financial viability of utilities
-78-
7.3.3 Power Purchase Cost
The Utilities in Rajasthan have been facing severe financial crisis mainly on account of rising power
purchase cost. The power purchase of each DISCOM accounts for nearly 84% of the ARR. The Power
purchase cost has been increasing on account of purchase of additional power almost round the year,
from bilateral and UI, which are costlier sources of power. The Tables below provides a comparison of the
Power Purchase Quantum, Cost and per unit cost of power.
Table 69: Power Purchase Quantum
Power Purchase Quantum (MUs) FY 05-06 FY 06-07 FY 07-08 FY 08-09 FY 09-10
Approved 29409 30831 34524 35939 41020
Actual 31794 32462 36688 38950
Trued Up 31794 32462
Table 70: Power Purchase Cost
Power Purchase Cost (Rs. Crs) FY 05-06 FY 06-07 FY 07-08 FY 08-09 FY 09-10
Approved 6216.28 6337.80 7723.45 9708.39 11911
Actual 6743.84 7071.79 9742.57 13038.26
Trued Up 6743.84 7044.05
Table 71: Per Unit Power Purchase Cost
Power purchase per unit (Rs/kWh) FY 05-06 FY 06-07 FY 07-08 FY 08-09 FY 09-10
Approved 2.11 2.06 2.24 2.70 2.90
Actual 2.12 2.18 2.66 3.35
Trued Up 2.12 2.17

Assessment of reasons for financial viability of utilities
-79-
7.3.4 Operation and Maintenance Expenses
The Commission in the earlier orders had approved the employee cost, repair & maintenance cost and
administrative cost separately but the approach was changed to approval of consolidated O&M expenses
from FY 06-07 to FY 08-09. Further, the Commission shifted to a normative approach for approving each
component of the O&M expense from FY 09-10 onwards i.e. MYT Order for FY 2009-14. The major
variation between the approved and actual O&M costs was primarily on account of employee cost which
has been detailed below.
Employee Cost
The Commission has followed different methodology for approving employee cost in each of the tariff
orders. In one year it has used increase in WPI, while in another employee cost per unit of sale norm (set
as per Terms and Conditions for determination of tariff) was utilized to arrive at Employee cost. A
considerable increase has been witnessed in the actual employee cost from FY 07-08 onwards. This is
primarily on account of provisioning of actuarial liabilities such as gratuity and the pension pertaining to
the past years. The accounting of gratuity and pension liabilities has been done by the Discoms in order
to comply with A.S.-15 which provides that the liability as per actuarial valuation should be provided for
every year in the profit and loss account.
The table below shows the approved, actual and trued up O&M cost.
Table 72: Operation and Maintenance Expenses
Operation and Maintenance Expenses FY 05-06 FY 06-07 FY 07-08 FY 08-09 FY 09-10
Approved 519.95 545.81 596.08 638.2 1007
Actual 511.76 557.76 896.35 1773.31
Trued-up 511.76 557.76
7.3.5 Capital Expenditure/Capitalization
The Commission has time and again directed the utilities to submit investment proposals for the approval
of investment plan. Due to lack of submission of detailed capital expenditure plan including cost benefit
analysis submitted by the utilities, the Commission has not been able to approve adequate capital
expenditure required for system strengthening and reduction of loss levels.
For the second control period which began with FY 09-10 onwards the Commission considered 5%
increase on the average capitalisation over the last three years. The table below shows the approved and
actual capitalization. As compared to the approved capitalization, actual capitalization has been showing
an increasing trend. It is important that the capital expenditure planning is done adequately after
undertaking system studies which would enable the utilities to reduce the loss levels.
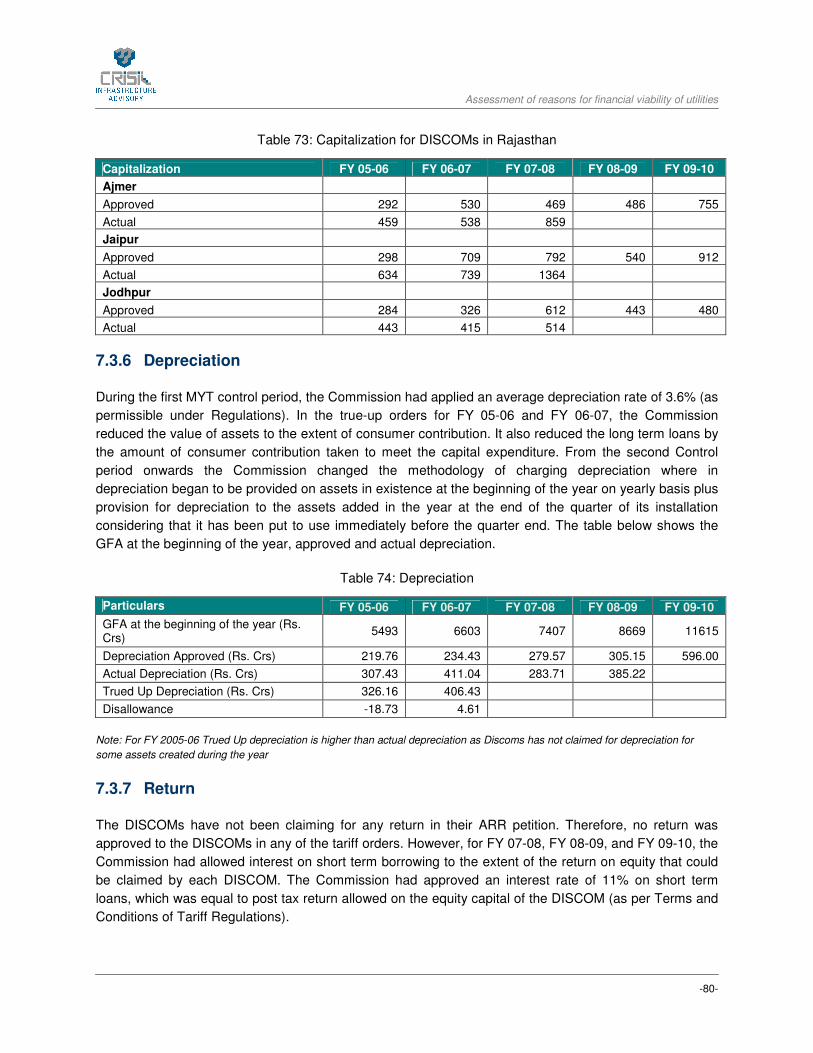
Assessment of reasons for financial viability of utilities
-80-
Table 73: Capitalization for DISCOMs in Rajasthan
Capitalization FY 05-06 FY 06-07 FY 07-08 FY 08-09 FY 09-10
Ajmer
Approved 292 530 469 486 755
Actual 459 538 859
Jaipur
Approved 298 709 792 540 912
Actual 634 739 1364
Jodhpur
Approved 284 326 612 443 480
Actual 443 415 514
7.3.6 Depreciation
During the first MYT control period, the Commission had applied an average depreciation rate of 3.6% (as
permissible under Regulations). In the true-up orders for FY 05-06 and FY 06-07, the Commission
reduced the value of assets to the extent of consumer contribution. It also reduced the long term loans by
the amount of consumer contribution taken to meet the capital expenditure. From the second Control
period onwards the Commission changed the methodology of charging depreciation where in
depreciation began to be provided on assets in existence at the beginning of the year on yearly basis plus
provision for depreciation to the assets added in the year at the end of the quarter of its installation
considering that it has been put to use immediately before the quarter end. The table below shows the
GFA at the beginning of the year, approved and actual depreciation.
Table 74: Depreciation
Particulars FY 05-06 FY 06-07 FY 07-08 FY 08-09 FY 09-10
GFA at the beginning of the year (Rs. Crs)
5493 6603 7407 8669 11615
Depreciation Approved (Rs. Crs) 219.76 234.43 279.57 305.15 596.00
Actual Depreciation (Rs. Crs) 307.43 411.04 283.71 385.22
Trued Up Depreciation (Rs. Crs) 326.16 406.43
Disallowance -18.73 4.61
Note: For FY 2005-06 Trued Up depreciation is higher than actual depreciation as Discoms has not claimed for depreciation for
some assets created during the year
7.3.7 Return
The DISCOMs have not been claiming for any return in their ARR petition. Therefore, no return was
approved to the DISCOMs in any of the tariff orders. However, for FY 07-08, FY 08-09, and FY 09-10, the
Commission had allowed interest on short term borrowing to the extent of the return on equity that could
be claimed by each DISCOM. The Commission had approved an interest rate of 11% on short term
loans, which was equal to post tax return allowed on the equity capital of the DISCOM (as per Terms and
Conditions of Tariff Regulations).

Assessment of reasons for financial viability of utilities
-81-
7.3.8 Subsidy
In the state of Rajasthan the agricultural sales account for approximately 33% of the total sales which
comprise of metered as well as unmetered consumers. The agriculture tariffs in the state of Rajasthan are
lower than the average cost of supply and are further subsidized by the Government. Apart from the
agricultural (metered and unmetered) category, the Government also provides subsidy to specific
domestic consumers. Therefore, the Government subsidy has an important role to play.
The Government subsidy in FY 05-06 was Rs. 908 Cr which increased to Rs. 1375 Cr. in FY 09-10 for all
the three DISCOMs. However, the same is insufficient to meet the revenue deficit due to the reason that
the retail tariffs in the state are lower than the average cost of supply and the cross-subsidy generated is
negligible. Further, the Government is not paying the subsidy in advance to the DISCOms as well as the
there is a short-fall in the total subsidy payment due for the year. The details of the subsidy due and
subsidy received each year is not provided in the tariff/ true-up orders, which has a huge impact on the
present total revenue gap of the DISCOMs. Therefore, the financial impact of the late receipt or
shortfall in receipt of subsidy cannot be determined for the utilities.
7.3.9 Interest and Finance Charges
Interest charges of the DISCOMs mainly comprise of interest on long term loans, interest and finance
charges on short-term borrowings made by the Nigam and interest on working capital. The DISCOM does
not segregate working capital loans from short term loans and hence proposes for combined approval of
both. The Commission on the other hand disallows interest on short term borrowings and approve interest
on working capital on normative basis. Short term loans undertaken by the DISCOMs to meet the
revenue deficit have been increasing year on year due to increase in various cost parameters and no
corresponding tariff increase. However, the Commission has approved interest on short term borrowing to
the extent of the return on equity that could be claimed by each Discom; the same is inadequate to cover
the interest burden on account of loans taken for meeting the accumulated revenue gap. The table below
shows the interest and finance charges proposed, approved and actual.
Table 75: Interest Charges
Net Interest Cost FY 05-06 FY 06-07 FY 07-08 FY 08-09 FY 09-10
Approved 572.05 425.96 703.92 836.73 740.00
Actual 560.5 710.18 948.38 1551.77
Trued Up 247.71 357.36
Disallowance 312.79 352.82
7.3.10 Deficit /Gap
After FY 04-05, there has been no revision of retail tariff in the State of Rajasthan. The Discoms have not
filed any tariff petition towards meeting the revenue gap and therefore the Commission has left the
revenue deficit untreated in each of the tariff orders. As per the tariff order for second MYT control period,
the uncovered revenue deficit of DISCOMs stood at Rs. 15,540 Cr. as on 31.3.09. Deficit of FY 09-10
would further increase the accumulated deficit to Rs.17, 014 Crs. Though, the Government of Rajasthan
has owned the deficit upto FY 08-09 of the three DISCOMs and promised to liquidate the same over a

Assessment of reasons for financial viability of utilities
-82-
period of 23 years, the recovery of the interest burden arising out of the revenue gap would not be paid.
This would have adverse financial impact on the DISCOMs unless the same is approved by the
Commission and is recovered in the tariff.
7.3.11 Regulatory Asset
The Commission has not made any regulatory asset during the period for FY 05-06 to FY 09-10.
7.3.12 Tariff Increase
The Commission has not increased Tariff in the state of Rajasthan from FY 05-06 to FY 09-10.
7.3.13 Tariff reflective of Approved ARR
The Commission in all the tariff orders has left the gap uncovered i:e there exists a gap between the
Revenue realised and approved ARR by the Commission. The table below shows the untreated Gap of
Rajasthan DISCOMs and gap as a percentage of ARR.
Table 7: Untreated Gap as a percentage of approved ARR by the Commission
Revenue Gap/(Surplus) FY 05-06 FY 06-07 FY 07-08 FY 08-09 FY 09-10
Total Gap (Rs. Cr) 1201 638 1329 2633.95 3859
ARR (Rs. Cr) 7347 7332 9189 11397 13933
Gap as a percentage of ARR 16.3% 8.7% 14.5% 23.11% 27.7%
7.3.14 Issuance of True up Order
The table below summarises the time lag between finalization of Accounts and True up order.
Particulars FY 05-06 FY 06-07 FY 07-08 FY 08-09 FY 09-10
Issuance of Tariff Order 22-Sep-05 21-Jul-06 31-Mar-07 31-Mar-07 21-Dec-09
Finalization of Annual Accounts for the Year (A)
30-Sep-06 30-Sep-07 30-Sep-08 30-Sep-09
Issuance of True up Order (B) 11-Sep-08 11-Sep-08 21-Dec-09*
Time Lag between Finalization of Accounts and True up order (A-B) in days
712 347 447
*The True up of FY 07-08 was carried for Jaipur and Jodhpur only.
The Commission has not approved for any carrying cost on gap determined for the year. It is not a
healthy practice to follow because on one end the Commission leaves the gap untreated and on the other
end it does not even provide for the carrying cost on the trued-up gap. The Table below shows the
carrying cost of all the DISCOMs put together as on 31.3.2009.
Table 8: Impact on the Total Revenue Gap of DISCOMs due to disallowance of Carrying Cost

Assessment of reasons for financial viability of utilities
-83-
Particulars FY 05-06 FY 06-07 FY 07-08 FY 08-09 FY 09-10
Gap as per True Up order/ un Audited-Annual Accounts (Rs. Crs)
1945.89 2281.76 3046.91* 7580.46** 3859***
Carrying cost required (Rs. Crs) 1070.00 941.00 838.00 1042.00 424.00
Total Carrying cost (Rs. Crs) 4316.00
*Gap of FY 07-08 for Ajmer has been computed by CRIS based on audited Annual Accounts, for other two DISCOMs it is based on True up order.
** Gap of FY 08-09 for all the DISCOMs has been calculated based on the unaudited Annual accounts.
*** Computed by Commission in the Tariff Order
The carrying cost summarised in the Table 8 has been calculated by CRIS by applying interest rate of
11% on the accumulated gap each year upto Mar 31, 2010.

Assessment of reasons for financial viability of utilities
-84-
8 TAMIL NADU
8.1 Introduction
In the state of Tamil Nadu, Tamil Nadu Electricity Regulatory Commission in exercise of powers vested in
it under the Electricity Act, 2003 (Act) passes the Annual Tariff Order. TNEB was formed as a statutory
body by the Government of Tamil Nadu (GOTN) on 01-07-1957 under the Electricity (Supply) Act 1948.
The Board is primarily responsible for generation, transmission, distribution and supply of electricity in the
State of Tamil Nadu.
Tamil Nadu Electricity Regulatory Commission (TNERC) has issued second tariff order in 2010 after the
first tariff order in 2003. Inspite of manifold increase in the input costs there was no tariff revision for the
past seven years and there has been revenue deficit since 2003-04. Since no Tariff Orders have been
issued by TNERC post 2003, there are no true-up orders available.
8.2 Key Findings
The increase in the financial losses of Tamil Nadu can be attributed to following factors:
• Non revision of tariff for the past seven years. The accumulated revenue deficit upto FY 2008-09
was Rs 16774.47 crore (as per unaudited accounts). The estimated revenue gap for FY 2009-10
is not available.
• There is no major capacity addition by TNEB since last 10 years. Major reasons for losses are
shortage of power, exponential growth of demand and power purchase from the market at high
price. TNEB is buying around 20 million units on day-ahead basis to meet the growing demand at
spot market prices.
• Free electricity for the agricultural consumers. Government subsidy required to support
agricultural consumption was Rs 5828 crore in FY 2009-10 against which the Government had
released only Rs 267 crore.
Particulars (Rs. Cr) FY 07-08 FY 08-09
Accumulated Losses as per annual accounts 9642.539 16774.47
10
Addition in Loss during the Year 7131.94
Source: As per the Tariff Order issued by the Commission
9 As per audited annual accounts of TNEB. Accumulated losses are consolidated losses upto FY 2007-08
10 As per un-audited annual accounts of TNEB. Accumulated losses are consolidated losses upto FY 2008-09
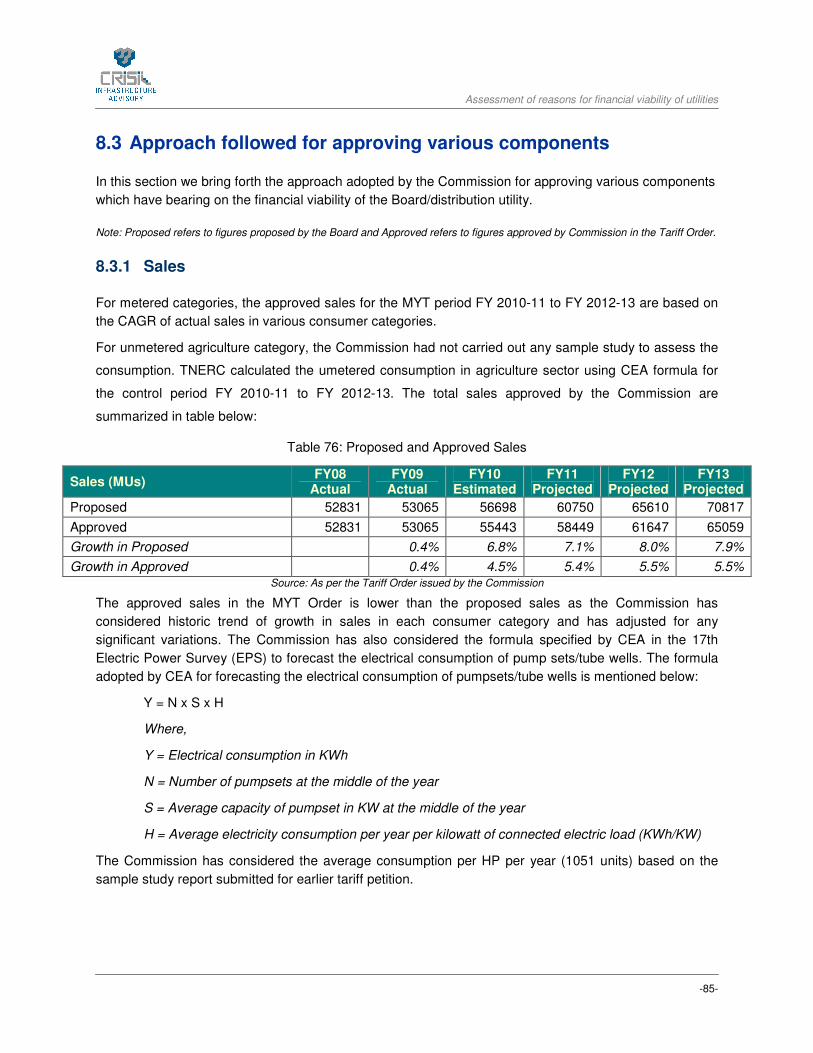
Assessment of reasons for financial viability of utilities
-85-
8.3 Approach followed for approving various components
In this section we bring forth the approach adopted by the Commission for approving various components
which have bearing on the financial viability of the Board/distribution utility.
Note: Proposed refers to figures proposed by the Board and Approved refers to figures approved by Commission in the Tariff Order.
8.3.1 Sales
For metered categories, the approved sales for the MYT period FY 2010-11 to FY 2012-13 are based on
the CAGR of actual sales in various consumer categories.
For unmetered agriculture category, the Commission had not carried out any sample study to assess the
consumption. TNERC calculated the umetered consumption in agriculture sector using CEA formula for
the control period FY 2010-11 to FY 2012-13. The total sales approved by the Commission are
summarized in table below:
Table 76: Proposed and Approved Sales
Sales (MUs) FY08
Actual FY09
Actual FY10
Estimated FY11
Projected FY12
Projected FY13
Projected
Proposed 52831 53065 56698 60750 65610 70817
Approved 52831 53065 55443 58449 61647 65059
Growth in Proposed 0.4% 6.8% 7.1% 8.0% 7.9%
Growth in Approved 0.4% 4.5% 5.4% 5.5% 5.5% Source: As per the Tariff Order issued by the Commission
The approved sales in the MYT Order is lower than the proposed sales as the Commission has
considered historic trend of growth in sales in each consumer category and has adjusted for any
significant variations. The Commission has also considered the formula specified by CEA in the 17th
Electric Power Survey (EPS) to forecast the electrical consumption of pump sets/tube wells. The formula
adopted by CEA for forecasting the electrical consumption of pumpsets/tube wells is mentioned below:
Y = N x S x H
Where,
Y = Electrical consumption in KWh
N = Number of pumpsets at the middle of the year
S = Average capacity of pumpset in KW at the middle of the year
H = Average electricity consumption per year per kilowatt of connected electric load (KWh/KW)
The Commission has considered the average consumption per HP per year (1051 units) based on the
sample study report submitted for earlier tariff petition.

Assessment of reasons for financial viability of utilities
-86-
8.3.2 Transmission and Distribution Loss
In the state of Tamil Nadu ascertaining T&D loss is a complex issue because the state has large un-
metered agriculture consumption. TNEB in the MYT Petition for FY 10-11 to FY 12-13 has proposed T&D
loss of 18% in view of the increase in load and expansion of HT/ LT network.
The Commission had set a trajectory for the Board for reduction in the loss levels. TNERC had set target
of loss reduction of 0.4% per year for the MYT control period of FY 2010-11 to FY 2012-13 from the 18%
T&D loss in FY 2009-10.
Table 77: Proposed and Approved T&D loss
Particulars FY 09-10
Estimated FY 10-11 Projected
FY 11-12 Projected
FY 12-13 Projected
T&D loss Proposed 18% 18% 18% 18%
T&D loss Approved 18% 17.6% 17.2% 16.8% Source: As per the Tariff Order issued by the Commission
TNEB is maintaining T&D loss level at 18% since 2003-04. The Commission has adjusted the FY 09-10
T&D losses after adjusting the sales of the unmetered agricultural consumers as per the norm.
8.3.3 Power Purchase Cost
TNEB purchases power from Central Generating Stations of NTPC and NPC, IPPs and other sources. It
also has own generating stations. The proposed and approved power purchase quantum and cost is
summarized below:
Table 78: Proposed and Approved Power Purchase Quantum
Power Purchase Quantum (MUs) FY11 FY12 FY13
Proposed 74085 80012 86362
Approved 70933 74453 78196 Source: As per the Tariff Order issued by the Commission
Table 79: Proposed and Approved Power Purchase Cost
Power Purchase Cost (Rs. Crs) FY11 FY12 FY13
Proposed* 21251.24 21139.42 23269.65
Approved# 23987.32 23517.70 22150.97 Source: As per the Tariff Order issued by the Commission
* Includes power purchase cost from external sources and fuel cost (variable only) for own generating stations
# includes power purchase cost from external sources, transmission charges and cost of generation (fixed and variable) from own
generating stations
The approved total power purchase cost is higher than the proposed power purchase cost as the
generation cost and transmission cost have been segregated from the total cost elements of TNEB and
approved separately. Therefore, for the purpose of computing the total approved power purchase cost,
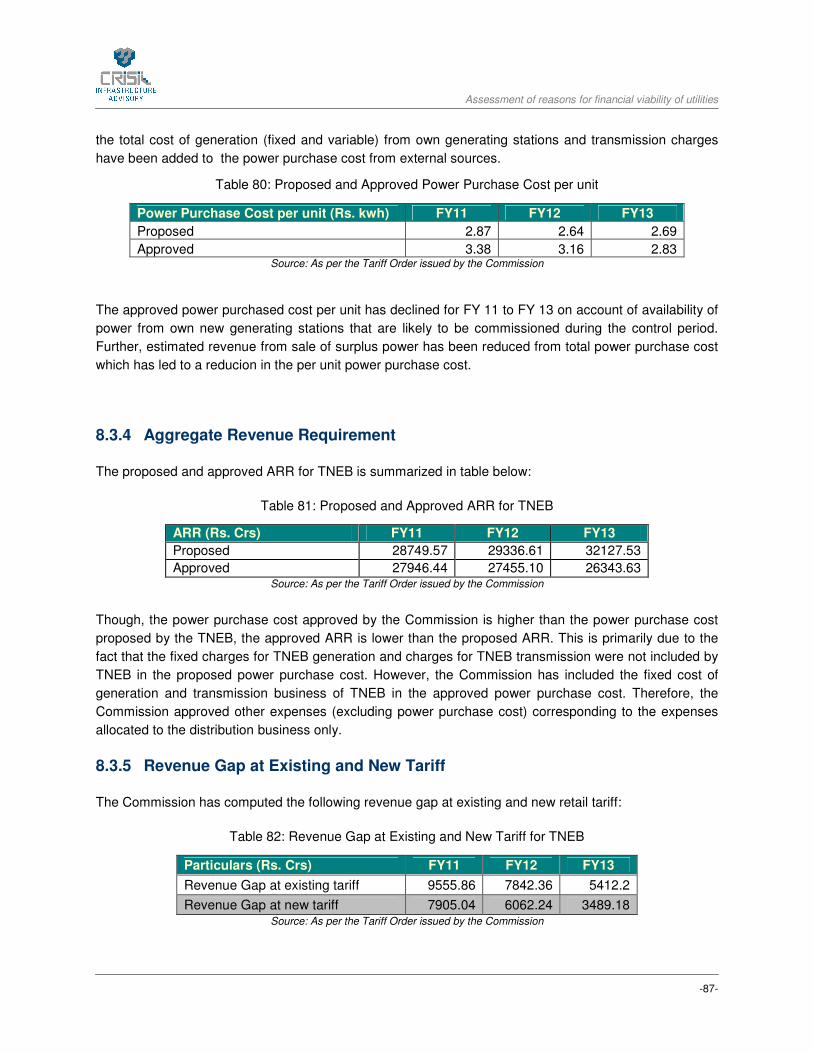
Assessment of reasons for financial viability of utilities
-87-
the total cost of generation (fixed and variable) from own generating stations and transmission charges
have been added to the power purchase cost from external sources.
Table 80: Proposed and Approved Power Purchase Cost per unit
Power Purchase Cost per unit (Rs. kwh) FY11 FY12 FY13
Proposed 2.87 2.64 2.69
Approved 3.38 3.16 2.83 Source: As per the Tariff Order issued by the Commission
The approved power purchased cost per unit has declined for FY 11 to FY 13 on account of availability of
power from own new generating stations that are likely to be commissioned during the control period.
Further, estimated revenue from sale of surplus power has been reduced from total power purchase cost
which has led to a reducion in the per unit power purchase cost.
8.3.4 Aggregate Revenue Requirement
The proposed and approved ARR for TNEB is summarized in table below:
Table 81: Proposed and Approved ARR for TNEB
ARR (Rs. Crs) FY11 FY12 FY13
Proposed 28749.57 29336.61 32127.53
Approved 27946.44 27455.10 26343.63 Source: As per the Tariff Order issued by the Commission
Though, the power purchase cost approved by the Commission is higher than the power purchase cost
proposed by the TNEB, the approved ARR is lower than the proposed ARR. This is primarily due to the
fact that the fixed charges for TNEB generation and charges for TNEB transmission were not included by
TNEB in the proposed power purchase cost. However, the Commission has included the fixed cost of
generation and transmission business of TNEB in the approved power purchase cost. Therefore, the
Commission approved other expenses (excluding power purchase cost) corresponding to the expenses
allocated to the distribution business only.
8.3.5 Revenue Gap at Existing and New Tariff
The Commission has computed the following revenue gap at existing and new retail tariff:
Table 82: Revenue Gap at Existing and New Tariff for TNEB
Particulars (Rs. Crs) FY11 FY12 FY13
Revenue Gap at existing tariff 9555.86 7842.36 5412.2
Revenue Gap at new tariff 7905.04 6062.24 3489.18 Source: As per the Tariff Order issued by the Commission
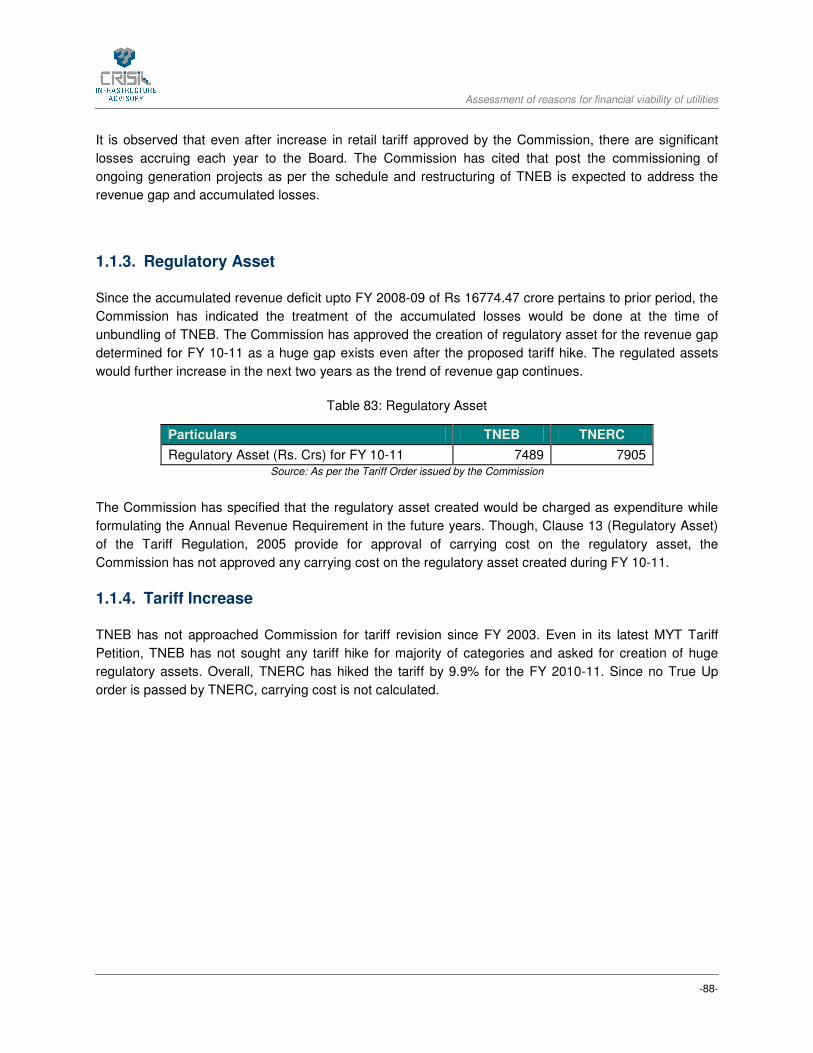
Assessment of reasons for financial viability of utilities
-88-
It is observed that even after increase in retail tariff approved by the Commission, there are significant
losses accruing each year to the Board. The Commission has cited that post the commissioning of
ongoing generation projects as per the schedule and restructuring of TNEB is expected to address the
revenue gap and accumulated losses.
1.1.3. Regulatory Asset
Since the accumulated revenue deficit upto FY 2008-09 of Rs 16774.47 crore pertains to prior period, the
Commission has indicated the treatment of the accumulated losses would be done at the time of
unbundling of TNEB. The Commission has approved the creation of regulatory asset for the revenue gap
determined for FY 10-11 as a huge gap exists even after the proposed tariff hike. The regulated assets
would further increase in the next two years as the trend of revenue gap continues.
Table 83: Regulatory Asset
Particulars TNEB TNERC
Regulatory Asset (Rs. Crs) for FY 10-11 7489 7905 Source: As per the Tariff Order issued by the Commission
The Commission has specified that the regulatory asset created would be charged as expenditure while
formulating the Annual Revenue Requirement in the future years. Though, Clause 13 (Regulatory Asset)
of the Tariff Regulation, 2005 provide for approval of carrying cost on the regulatory asset, the
Commission has not approved any carrying cost on the regulatory asset created during FY 10-11.
1.1.4. Tariff Increase
TNEB has not approached Commission for tariff revision since FY 2003. Even in its latest MYT Tariff
Petition, TNEB has not sought any tariff hike for majority of categories and asked for creation of huge
regulatory assets. Overall, TNERC has hiked the tariff by 9.9% for the FY 2010-11. Since no True Up
order is passed by TNERC, carrying cost is not calculated.
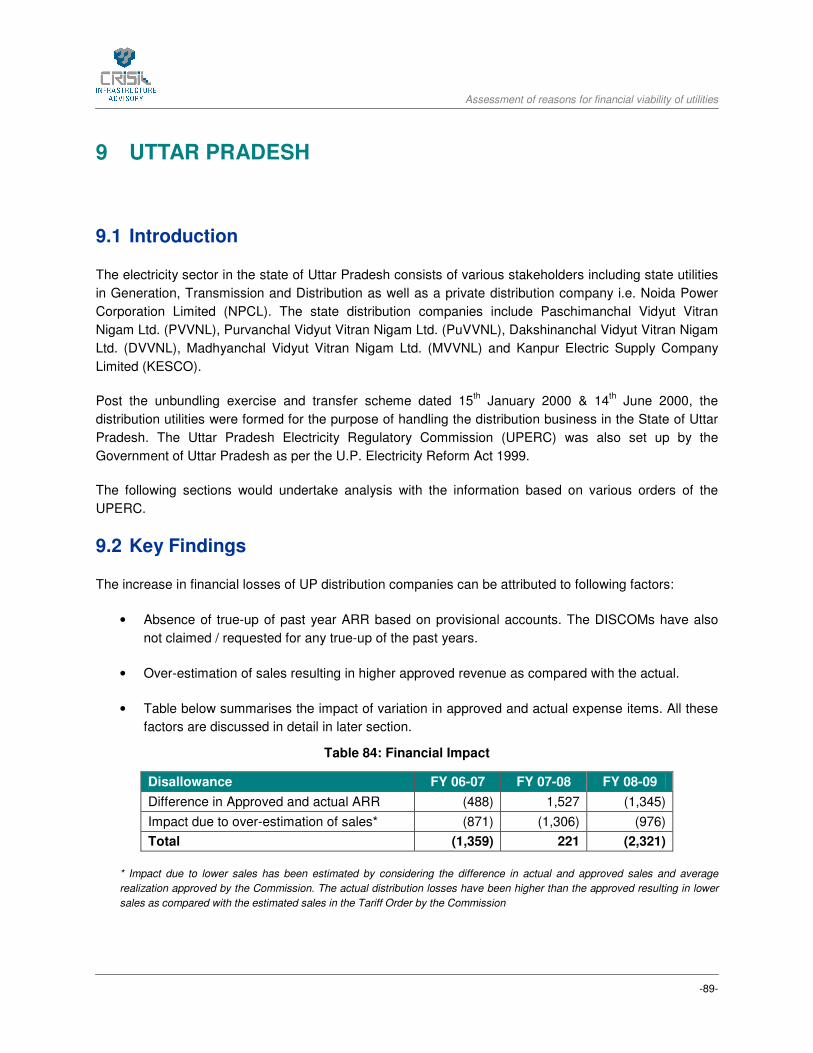
Assessment of reasons for financial viability of utilities
-89-
9 UTTAR PRADESH
9.1 Introduction
The electricity sector in the state of Uttar Pradesh consists of various stakeholders including state utilities
in Generation, Transmission and Distribution as well as a private distribution company i.e. Noida Power
Corporation Limited (NPCL). The state distribution companies include Paschimanchal Vidyut Vitran
Nigam Ltd. (PVVNL), Purvanchal Vidyut Vitran Nigam Ltd. (PuVVNL), Dakshinanchal Vidyut Vitran Nigam
Ltd. (DVVNL), Madhyanchal Vidyut Vitran Nigam Ltd. (MVVNL) and Kanpur Electric Supply Company
Limited (KESCO).
Post the unbundling exercise and transfer scheme dated 15th January 2000 & 14
th June 2000, the
distribution utilities were formed for the purpose of handling the distribution business in the State of Uttar
Pradesh. The Uttar Pradesh Electricity Regulatory Commission (UPERC) was also set up by the
Government of Uttar Pradesh as per the U.P. Electricity Reform Act 1999.
The following sections would undertake analysis with the information based on various orders of the
UPERC.
9.2 Key Findings
The increase in financial losses of UP distribution companies can be attributed to following factors:
• Absence of true-up of past year ARR based on provisional accounts. The DISCOMs have also
not claimed / requested for any true-up of the past years.
• Over-estimation of sales resulting in higher approved revenue as compared with the actual.
• Table below summarises the impact of variation in approved and actual expense items. All these
factors are discussed in detail in later section.
Table 84: Financial Impact
Disallowance FY 06-07 FY 07-08 FY 08-09
Difference in Approved and actual ARR (488) 1,527 (1,345)
Impact due to over-estimation of sales* (871) (1,306) (976)
Total (1,359) 221 (2,321)
* Impact due to lower sales has been estimated by considering the difference in actual and approved sales and average
realization approved by the Commission. The actual distribution losses have been higher than the approved resulting in lower
sales as compared with the estimated sales in the Tariff Order by the Commission
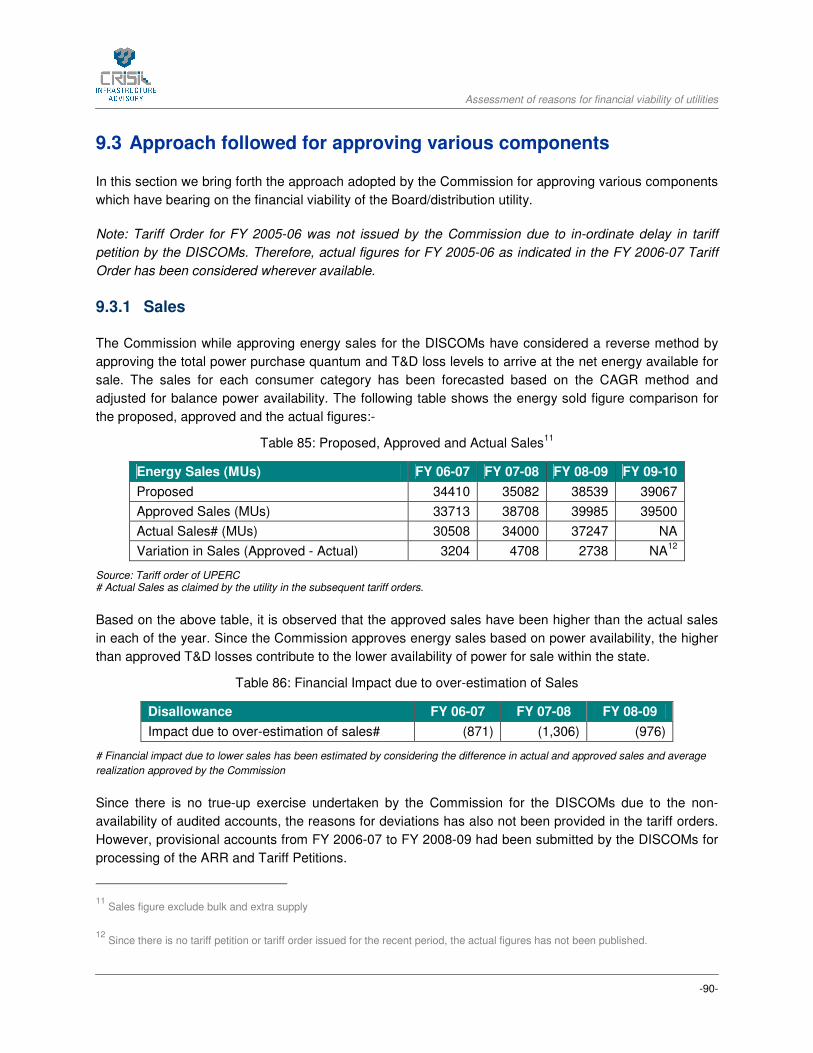
Assessment of reasons for financial viability of utilities
-90-
9.3 Approach followed for approving various components
In this section we bring forth the approach adopted by the Commission for approving various components
which have bearing on the financial viability of the Board/distribution utility.
Note: Tariff Order for FY 2005-06 was not issued by the Commission due to in-ordinate delay in tariff
petition by the DISCOMs. Therefore, actual figures for FY 2005-06 as indicated in the FY 2006-07 Tariff
Order has been considered wherever available.
9.3.1 Sales
The Commission while approving energy sales for the DISCOMs have considered a reverse method by
approving the total power purchase quantum and T&D loss levels to arrive at the net energy available for
sale. The sales for each consumer category has been forecasted based on the CAGR method and
adjusted for balance power availability. The following table shows the energy sold figure comparison for
the proposed, approved and the actual figures:-
Table 85: Proposed, Approved and Actual Sales11
Energy Sales (MUs) FY 06-07 FY 07-08 FY 08-09 FY 09-10
Proposed 34410 35082 38539 39067
Approved Sales (MUs) 33713 38708 39985 39500
Actual Sales# (MUs) 30508 34000 37247 NA
Variation in Sales (Approved - Actual) 3204 4708 2738 NA12
Source: Tariff order of UPERC # Actual Sales as claimed by the utility in the subsequent tariff orders.
Based on the above table, it is observed that the approved sales have been higher than the actual sales
in each of the year. Since the Commission approves energy sales based on power availability, the higher
than approved T&D losses contribute to the lower availability of power for sale within the state.
Table 86: Financial Impact due to over-estimation of Sales
Disallowance FY 06-07 FY 07-08 FY 08-09
Impact due to over-estimation of sales# (871) (1,306) (976)
# Financial impact due to lower sales has been estimated by considering the difference in actual and approved sales and average
realization approved by the Commission
Since there is no true-up exercise undertaken by the Commission for the DISCOMs due to the non-
availability of audited accounts, the reasons for deviations has also not been provided in the tariff orders.
However, provisional accounts from FY 2006-07 to FY 2008-09 had been submitted by the DISCOMs for
processing of the ARR and Tariff Petitions.
11 Sales figure exclude bulk and extra supply
12 Since there is no tariff petition or tariff order issued for the recent period, the actual figures has not been published.

Assessment of reasons for financial viability of utilities
-91-
9.3.2 Transmission and Distribution Loss
The Commission in the tariff order for FY2001-02 had in consultation with UPPCL, specified a long-term
trajectory for T&D loss level and collection efficiency to be achieved by UPPCL. The prescribed targets
envisaged that the UPPCL achieved a T&D loss of 23.90% at the end FY 2005-06. The T&D loss targets
that were prescribed are summarized in the table below:
Table 87: Long-term T&D Loss Targets for UPPCL
Particulars FY 01-02 FY 02-03 FY 03-04 FY 04-05 FY 05-06
T&D Loss (%) 36.40% 33.40% 30.40% 27.40% 23.90%
Reduction (%) 3.00% 3.00% 3.00% 3.50%
It was observed that the UPPCL/ distribution utilities were not able to achieve the targets. The T&D loss
reported by the UPPCL for FY 2004-05 (in the Tariff Petition for the FY 2006-07) was 34.60% as against
the target of 27.40%. Therefore, the Commission approved a loss level of 27.40% for FY 2006-07 (similar
to the loss levels specified for FY 2004-05) in view of the under-achievement in the past years.
A comparison of the approved and actual loss level is summarised in the table below:-
Table 88: Distribution Loss Targets & Achievement by DISCOMS
Distribution Loss FY 05-06 13
FY 06-07 FY 07-08# FY 08-09 FY 09-10
DVVNL
Approved NA 29.10% 25.40% 25.35% 24.00%
Actual 35.70% 30.00% 27.50% 25.66% 24.70%
Variation (Approved – Actual) NA -0.90% - 2.10% - 0.31% - 0.70%
MVVNL
Approved NA 22.40% 18.40% 18.36% 18.00%
Actual 28.60% 28.00% 25.40% 21.57% 20.02%
Variation (Approved – Actual) NA - 5.60% - 7.00% - 3.21% - 2.02%
PVVNL
Approved NA 29.10% 25.40% 25.41% 24.00%
Actual 36.50% 30.00% 27.30% 25.97% 24.31%
Variation (Approved – Actual) NA - 0.90% - 1.90% - 0.56% - 0.31%
PuVVNL
Approved NA 26.70% 22.80% 22.79% 22.50%
Actual 33.00% 33.00% 30.00% 26.12% 24.49%
Variation (Approved – Actual) NA - 6.30% - 7.20% - 3.33% - 1.99%
Source:Tariff Orders issued by UPERC
#Actual distribution loss for FY 2007-08 is as estimated by the DISCOMs in the petition
13 Approved figures not included due to non-issuance of order in FY 2005-06

Assessment of reasons for financial viability of utilities
-92-
Due to the under-achievement of targeted loss level by the DISCOMs, the actual sales are lower than the
approved sales as detalied in the energy sales segment. Therefore, the financial impact of the actual
revenue being lower than the approved revenue is borne by the DISCOMs in absence of truing up.
9.3.3 Power Purchase Cost
UPPCL on behalf of the DISCOMs is responsible for the power purchase from various sources. The
Commission has repeatedly directed UPPCL to allocate all existing Power Purchase Agreements (PPAs)
to the DISCOMs. The major sources of power purchase for UPPCL are CGS (NTPC, NHPC), State
Generating Stations (UPRVUNL and UPJVNL) and other plants including Cogeneration plants (obligatory
purchase), Independent power producers (IPP), bilateral and banking arrangements with other States.
The Commission has approved the power purchase cost for UPPCL by following the merit order
principles. The DISCOMs are required to pay to UPPCL for the power purchase cost as per the Bulk
Supply Tariff (BST) computed by the Commission.
The constituent sources of power purchase are shown in the pie chart below
Figure 12: Constitution of Power Purchase from various sources for FY 09-10.
Other Sources
2%
Co-generation
3%
IPP/JV
9%
Central
Generating
Station
48%
State Generating
Station
38%
As can be observed from the above pie chart, Central Generating Stations contribute to the maximum
power availability for the DISCOMs followed by the State Generating Stations. The approved and actual
power purchase quantum and cost is summarized in table below:
Table 89: Power Purchase Quantum
Power Purchase (MUs) FY 05-06 FY 06-07 FY 07-08 FY 08-09 FY 09-10
Approved NA 50603 56428 58328 56441
Actual 45732 NA 55002 56375 NA
Variation (Approved - Actual) NA NA 1426 1953 NA
Table 90: Power Purchase Cost
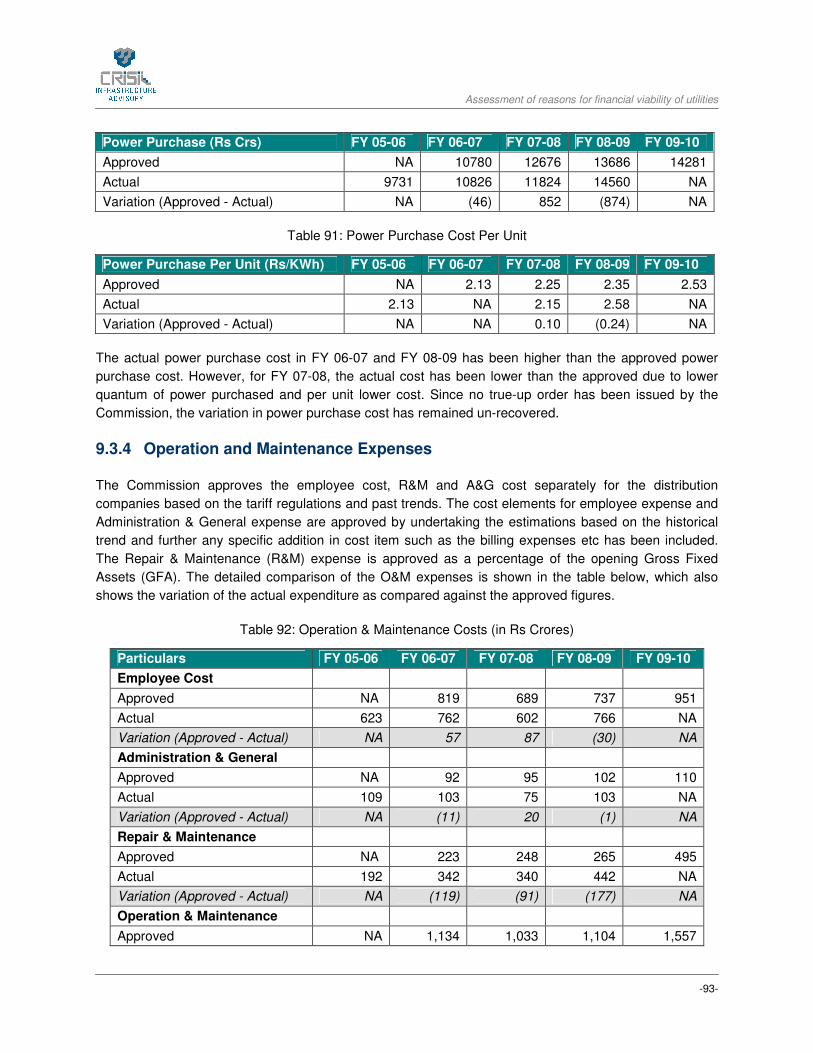
Assessment of reasons for financial viability of utilities
-93-
Power Purchase (Rs Crs) FY 05-06 FY 06-07 FY 07-08 FY 08-09 FY 09-10
Approved NA 10780 12676 13686 14281
Actual 9731 10826 11824 14560 NA
Variation (Approved - Actual) NA (46) 852 (874) NA
Table 91: Power Purchase Cost Per Unit
Power Purchase Per Unit (Rs/KWh) FY 05-06 FY 06-07 FY 07-08 FY 08-09 FY 09-10
Approved NA 2.13 2.25 2.35 2.53
Actual 2.13 NA 2.15 2.58 NA
Variation (Approved - Actual) NA NA 0.10 (0.24) NA
The actual power purchase cost in FY 06-07 and FY 08-09 has been higher than the approved power
purchase cost. However, for FY 07-08, the actual cost has been lower than the approved due to lower
quantum of power purchased and per unit lower cost. Since no true-up order has been issued by the
Commission, the variation in power purchase cost has remained un-recovered.
9.3.4 Operation and Maintenance Expenses
The Commission approves the employee cost, R&M and A&G cost separately for the distribution
companies based on the tariff regulations and past trends. The cost elements for employee expense and
Administration & General expense are approved by undertaking the estimations based on the historical
trend and further any specific addition in cost item such as the billing expenses etc has been included.
The Repair & Maintenance (R&M) expense is approved as a percentage of the opening Gross Fixed
Assets (GFA). The detailed comparison of the O&M expenses is shown in the table below, which also
shows the variation of the actual expenditure as compared against the approved figures.
Table 92: Operation & Maintenance Costs (in Rs Crores)
Particulars FY 05-06 FY 06-07 FY 07-08 FY 08-09 FY 09-10
Employee Cost
Approved NA 819 689 737 951
Actual 623 762 602 766 NA
Variation (Approved - Actual) NA 57 87 (30) NA
Administration & General
Approved NA 92 95 102 110
Actual 109 103 75 103 NA
Variation (Approved - Actual) NA (11) 20 (1) NA
Repair & Maintenance
Approved NA 223 248 265 495
Actual 192 342 340 442 NA
Variation (Approved - Actual) NA (119) (91) (177) NA
Operation & Maintenance
Approved NA 1,134 1,033 1,104 1,557

Assessment of reasons for financial viability of utilities
-94-
Particulars FY 05-06 FY 06-07 FY 07-08 FY 08-09 FY 09-10
Actual 924 1,207 1,017 1,311 NA
Variation (Approved - Actual) NA (73) 16 (207) NA
The actual O&M expense is higher than the approved O&M expense in each of the year excluding FY 07-
08. The financial impact of the actual cost being higher than the approved is borne by the utilities in
absence of any true-up.
9.3.5 Capital Expenditure
The Commission in the tariff approval process has approved capital expenditure based on the investment
plan submitted by the distribution utilities. The scheme wise investment plan is scrutinised by the
Commission. Based on the past actual and approved capital expenditure, the Commission has observed
that the DISCOMs had undertaken significantly lesser amount of capital expenditure as compared with
the approved. In view of the same, the Commission had approved a lower amount towards capital
expenditure as against the proposed. The table below summarizes the proposed and approved capital
expenditure:
Table 93: Proposed and Approved Capital Expenditure
Capital Expenditure FY 05-06 FY 06-07 FY 07-08 FY 08-09 FY 09-10
Proposed 719 3557 2926 4796 4274
Approved 219 1005 1110 1751 2812
Variation (Approved- Proposed) 500 2552 1815 3046 1462
%age Departure 70% 72% 62% 64% 34%
9.3.6 Depreciation
In absence of a detailed asset register, the Commission had continued with the methodology adopted in
the previous tariff orders and had applied a weighted average depreciation rate of 7.84% for the
distribution function. The depreciation rate has been applied on the opening GFA of the respective
financial year and on the additional capitalisation of assets on a pro-rata basis during the year. The
approved and actual depreciation is summarized in table below.
Table 94: Approved and actual Depreciation
Depreciation (Rs. Crore) FY 05-06 FY 06-07 FY 07-08 FY 08-09 FY 09-10
GFA at the beginning of the Year 7663 8815 11372 12657 10368
Approved 601 691 942 1062 900
Actual 601 633 646 861 NA
Variation (Approved- Proposed) (0) 58 296 201 NA
.
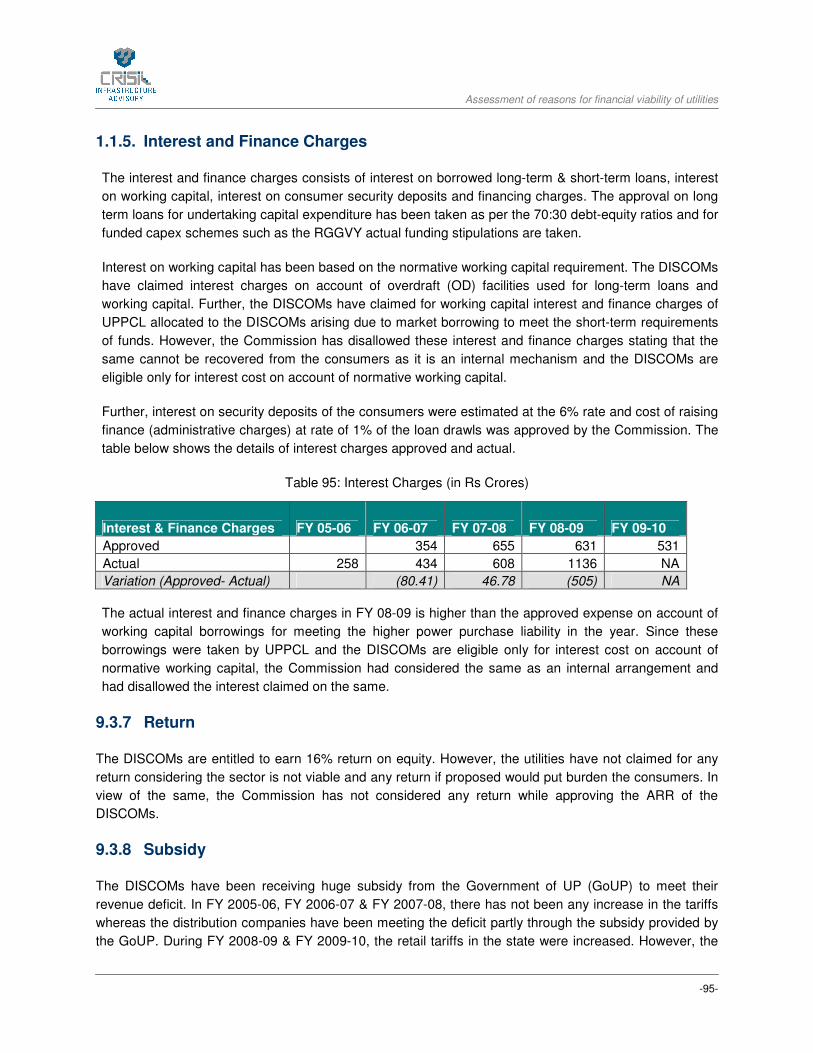
Assessment of reasons for financial viability of utilities
-95-
1.1.5. Interest and Finance Charges
The interest and finance charges consists of interest on borrowed long-term & short-term loans, interest
on working capital, interest on consumer security deposits and financing charges. The approval on long
term loans for undertaking capital expenditure has been taken as per the 70:30 debt-equity ratios and for
funded capex schemes such as the RGGVY actual funding stipulations are taken.
Interest on working capital has been based on the normative working capital requirement. The DISCOMs
have claimed interest charges on account of overdraft (OD) facilities used for long-term loans and
working capital. Further, the DISCOMs have claimed for working capital interest and finance charges of
UPPCL allocated to the DISCOMs arising due to market borrowing to meet the short-term requirements
of funds. However, the Commission has disallowed these interest and finance charges stating that the
same cannot be recovered from the consumers as it is an internal mechanism and the DISCOMs are
eligible only for interest cost on account of normative working capital.
Further, interest on security deposits of the consumers were estimated at the 6% rate and cost of raising
finance (administrative charges) at rate of 1% of the loan drawls was approved by the Commission. The
table below shows the details of interest charges approved and actual.
Table 95: Interest Charges (in Rs Crores)
Interest & Finance Charges FY 05-06 FY 06-07 FY 07-08 FY 08-09 FY 09-10
Approved 354 655 631 531
Actual 258 434 608 1136 NA
Variation (Approved- Actual) (80.41) 46.78 (505) NA
The actual interest and finance charges in FY 08-09 is higher than the approved expense on account of
working capital borrowings for meeting the higher power purchase liability in the year. Since these
borrowings were taken by UPPCL and the DISCOMs are eligible only for interest cost on account of
normative working capital, the Commission had considered the same as an internal arrangement and
had disallowed the interest claimed on the same.
9.3.7 Return
The DISCOMs are entitled to earn 16% return on equity. However, the utilities have not claimed for any
return considering the sector is not viable and any return if proposed would put burden the consumers. In
view of the same, the Commission has not considered any return while approving the ARR of the
DISCOMs.
9.3.8 Subsidy
The DISCOMs have been receiving huge subsidy from the Government of UP (GoUP) to meet their
revenue deficit. In FY 2005-06, FY 2006-07 & FY 2007-08, there has not been any increase in the tariffs
whereas the distribution companies have been meeting the deficit partly through the subsidy provided by
the GoUP. During FY 2008-09 & FY 2009-10, the retail tariffs in the state were increased. However, the
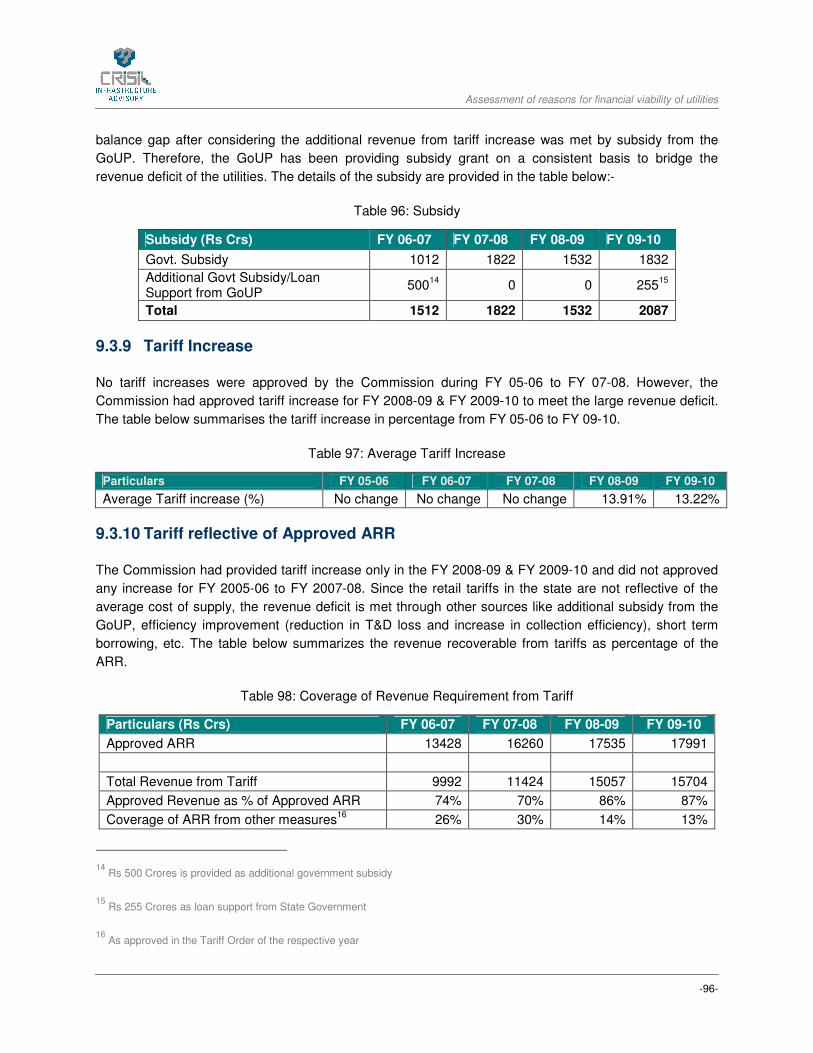
Assessment of reasons for financial viability of utilities
-96-
balance gap after considering the additional revenue from tariff increase was met by subsidy from the
GoUP. Therefore, the GoUP has been providing subsidy grant on a consistent basis to bridge the
revenue deficit of the utilities. The details of the subsidy are provided in the table below:-
Table 96: Subsidy
Subsidy (Rs Crs) FY 06-07 FY 07-08 FY 08-09 FY 09-10
Govt. Subsidy 1012 1822 1532 1832
Additional Govt Subsidy/Loan Support from GoUP
50014
0 0 25515
Total 1512 1822 1532 2087
9.3.9 Tariff Increase
No tariff increases were approved by the Commission during FY 05-06 to FY 07-08. However, the
Commission had approved tariff increase for FY 2008-09 & FY 2009-10 to meet the large revenue deficit.
The table below summarises the tariff increase in percentage from FY 05-06 to FY 09-10.
Table 97: Average Tariff Increase
Particulars FY 05-06 FY 06-07 FY 07-08 FY 08-09 FY 09-10
Average Tariff increase (%) No change No change No change 13.91% 13.22%
9.3.10 Tariff reflective of Approved ARR
The Commission had provided tariff increase only in the FY 2008-09 & FY 2009-10 and did not approved
any increase for FY 2005-06 to FY 2007-08. Since the retail tariffs in the state are not reflective of the
average cost of supply, the revenue deficit is met through other sources like additional subsidy from the
GoUP, efficiency improvement (reduction in T&D loss and increase in collection efficiency), short term
borrowing, etc. The table below summarizes the revenue recoverable from tariffs as percentage of the
ARR.
Table 98: Coverage of Revenue Requirement from Tariff
Particulars (Rs Crs) FY 06-07 FY 07-08 FY 08-09 FY 09-10
Approved ARR 13428 16260 17535 17991
Total Revenue from Tariff 9992 11424 15057 15704
Approved Revenue as % of Approved ARR 74% 70% 86% 87%
Coverage of ARR from other measures16
26% 30% 14% 13%
14 Rs 500 Crores is provided as additional government subsidy
15 Rs 255 Crores as loan support from State Government
16 As approved in the Tariff Order of the respective year
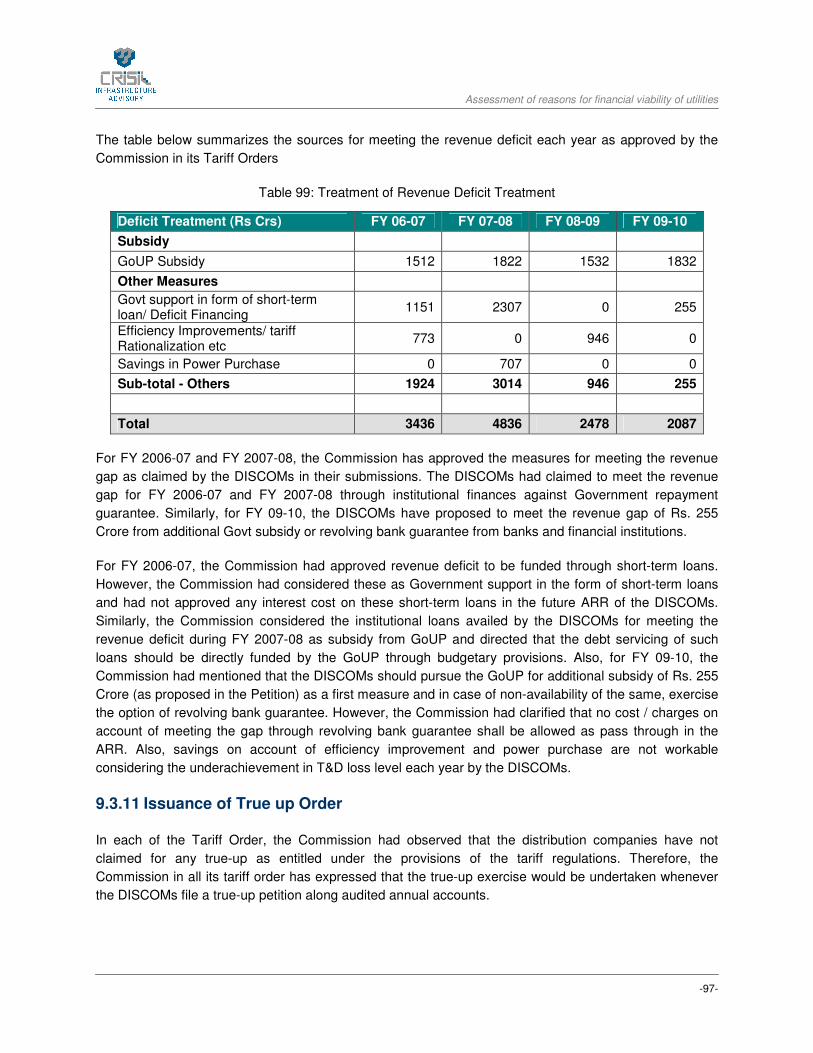
Assessment of reasons for financial viability of utilities
-97-
The table below summarizes the sources for meeting the revenue deficit each year as approved by the
Commission in its Tariff Orders
Table 99: Treatment of Revenue Deficit Treatment
Deficit Treatment (Rs Crs) FY 06-07 FY 07-08 FY 08-09 FY 09-10
Subsidy
GoUP Subsidy 1512 1822 1532 1832
Other Measures
Govt support in form of short-term loan/ Deficit Financing
1151 2307 0 255
Efficiency Improvements/ tariff Rationalization etc
773 0 946 0
Savings in Power Purchase 0 707 0 0
Sub-total - Others 1924 3014 946 255
Total 3436 4836 2478 2087
For FY 2006-07 and FY 2007-08, the Commission has approved the measures for meeting the revenue
gap as claimed by the DISCOMs in their submissions. The DISCOMs had claimed to meet the revenue
gap for FY 2006-07 and FY 2007-08 through institutional finances against Government repayment
guarantee. Similarly, for FY 09-10, the DISCOMs have proposed to meet the revenue gap of Rs. 255
Crore from additional Govt subsidy or revolving bank guarantee from banks and financial institutions.
For FY 2006-07, the Commission had approved revenue deficit to be funded through short-term loans.
However, the Commission had considered these as Government support in the form of short-term loans
and had not approved any interest cost on these short-term loans in the future ARR of the DISCOMs.
Similarly, the Commission considered the institutional loans availed by the DISCOMs for meeting the
revenue deficit during FY 2007-08 as subsidy from GoUP and directed that the debt servicing of such
loans should be directly funded by the GoUP through budgetary provisions. Also, for FY 09-10, the
Commission had mentioned that the DISCOMs should pursue the GoUP for additional subsidy of Rs. 255
Crore (as proposed in the Petition) as a first measure and in case of non-availability of the same, exercise
the option of revolving bank guarantee. However, the Commission had clarified that no cost / charges on
account of meeting the gap through revolving bank guarantee shall be allowed as pass through in the
ARR. Also, savings on account of efficiency improvement and power purchase are not workable
considering the underachievement in T&D loss level each year by the DISCOMs.
9.3.11 Issuance of True up Order
In each of the Tariff Order, the Commission had observed that the distribution companies have not
claimed for any true-up as entitled under the provisions of the tariff regulations. Therefore, the
Commission in all its tariff order has expressed that the true-up exercise would be undertaken whenever
the DISCOMs file a true-up petition along audited annual accounts.

Assessment of reasons for financial viability of utilities
-98-
10 WEST BENGAL
10.1 Introduction
In the state of West Bengal, West Bengal Electricity Regulatory Commission in exercise of powers vested
in it under the Electricity Act, 2003 (Act) passes the Annual Tariff Order. Prior to the restructuring, West
Bengal State Electricity Board was the entity responsible for Generation, Transmission and Distribution.
The Government of West Bengal vide notification dated 25.01.2007 unbundled WBSEB into two
companies, viz West Bengal State Electricity Transmission Company Ltd. (WBSETCL) and West Bengal
State Electricity Distribution Company Ltd. (WBSEDCL).
10.2 Key Findings
The impact of the increase in the financial losses of WBSEDCL can be attributed to following factors:
• For the APR for FY 06-07, FY 07-08 and FY 08-09, the Commission disallowed actual cost over
and above the approved cost for all the controllable parameters (as defined in the tariff
regulations).
• The Commission has disallowed power purchase cost on account of non-achievement of target
T&D loss levels approved by the Commission in the respective year.
• The Financial impact of disallowances for FY 06-07, FY 07-08 and FY 08-09 are as follows:
S.No. Particular (Rs. Crore) FY 06-07 FY 07-08 FY 08-09 FY 09-10
1 Disallowance -378.30 -276.05 -232.29 -342.64*
* APR for FY 09-10 is not available; therefore the disallowance is only on account of FPPCA Order

Assessment of reasons for financial viability of utilities
-99-
10.3 Approach followed for approving various components
In this section we bring forth the approach adopted by the Commission for approving various components
which have bearing on the financial viability of the distribution utilities.
The approved, proposed, actual and trued-up cost for FY 05-06 (wherever available) and FY 06-07 are
for WBSEB as a whole.
The proposed and approved figures are as per the Tariff Order or MYT Order. Actual and trued-up fixed
components are as per the Annual Performance Review Order of the respective year while the
disallowance in power purchase cost is as per the Fuel & Power Purchase Cost Adjustment (FPPCA)
orders.
10.3.1 Sales
WBSEDCL has a favourable sales mix. Agriculture consumption in the state is small and contributes to
only 10% of the consumption while the industrial (HT) consumption is high and contributes more than
45% of the total energy consumption. Graph below provides the percentage share of energy consumption
of different consumer categories in FY 2007-08.
Percent share of consumer categories in approved sales for FY 08
2007-08
Agriculture 11%
Small Indutrial 10%
Domestic; 33%
Industrial (HT) and
Others; 46%
Non-Domestic/
Commercial; 7%
Domestic Non-Domestic/ Commercial Small Indutrial
Industrial (HT) and Others Agriculture Others
For each of the year, the Commission has approved sales as proposed by WBSEDCL except for FY 06,
where the Commission had approved normative sales based on the approved T&D loss of 24%. This
normative sale was used by the Commission to approve average cost of supply for FY 06.
The details of approach followed by WBSEDCL for projecting sales have not been provided in the tariff
order. The Commission has stated that projected sales for FY 05, FY 07 and FY 08, which were an

Assessment of reasons for financial viability of utilities
-100-
increase of 6%, 9.66% and 10.63% over previous years’ approved sales, were reasonable and hence
approved by the Commission.
For FY 09 the Commission has not approved category-wise sales to own consumer in the tariff order.
Table 100: Energy Sales for WBSEDCL
Particulars FY06* FY07* FY08 FY09 FY10
Proposed Sales (MUs) 9951 11217 12896 14980 17025
Approved Sales (MUs) 11844 11217 12896 14980 17025
Actual# NA 11724 13086 14185 15691
Trued-up# NA 11724 13086 14185 15691
Variation (Trued up – Actual) Nil Nil Nil Nil
* The sales was approved for West Bengal State Electricity Board # Actual and Trued-up sales are as per FPPCA Order
It can be observed that Commission has disallowed sales in FY 06 only when it considered T&D loss on
normative basis. There have not been any large deviations in the approved and actual sales. For FY 08-
09 and FY 09-10 (under MYT Control Period) the approved sales were higher than the actual sales. While
undertaking annual performance review for FY 06-07, FY 07-08 and FY 08-09 the Commission has
approved sales as per the audited accounts, without any disapproval.
10.3.2 Distribution Loss
The Commission had approved T&D loss for WBSEB for FY 05 as per the reduction trajectory set by the
Commission in tariff order for FY03. The Commission for approving baseline T&D loss in FY 03 took into
consideration T&D loss as proposed by WBSEB for supply to own consumers (excluding bulk supply).
The observations of the Hon’ble Supreme Court in the judgment and order dated 10th March 2002 in the
case of WBERC vs. CESC, according to which the utility has to share a portion of T&D loss.
For FY 06 and FY 07 the Commission approved a reduction of 1% over the approved T&D loss of
previous year irrespective of the actual T&D loss and stated that T&D loss excess to that approved will
have to be borne by the licensee. For FY 08 after division of WBSEB into WBSETCL & WBSEDCL the
DISCOMs proposed combined loss of 24.7% with transmission loss of 4%, hence the Commission
approved Distribution loss of 19.50%.
For FY 09 the Commission approved Distribution loss as per the norms specified in the Tariff Regulations,
2007.
The approved, actual and trued-up losses for WBSEDCL are summarized in table below:
Table 101: Losses for WBSEDCL
T&D Loss FY06* FY07* FY08 FY09 FY10
Approved 24% 23% 19.50% 18.75% 18.25%
Actual# NA NA 26.48% 24.91% 26.32%
APR NA 23% 19.50% 18.75% 18.25%

Assessment of reasons for financial viability of utilities
-101-
* Losses for West Bengal State Electricity Board as a whole
# CRIS Analysis (Actual losses have been computed based on the power purchased units disallowed in the FPPCA Order)
For the purpose of true-up of the power purchase cost, the Commission has considered T&D losses as
approved in the Tariff Order of the respective year. Therefore any underachievement in the T&D loss has
been to the account of WBSEDCL. Excess power purchase on account of under-achievement of T&D
loss reduction targets has been disapproved. The financial impact of this disapproval of power purchase
cost has been discussed in the subsequent section 1.3.3.
10.3.3 Power Purchase Cost
WBSEDCL purchases energy from different sources like Central Generating stations, West Bengal Power
Development Corporation Ltd, West Bengal Renewable Energy Development Authority (WBREDA) and
other DISCOMs in the state like DPL, DPSC and CESC.
Power purchase requirement of WBSEDCL is mostly met with energy production of WBPDCL, quantum
and tariff of which has been approved separately by the Commission. WBSEDCL also has some hydel
generating stations the quantum and cost for which are approved in the same tariff order. WBERC allows
recovery of increase in the fuel cost through FPPCA and takes into account while passing next year tariff
order. The decrease in per unit power purchase cost for FY 09 and FY 10 is due to sourcing of power
from new power plants at cheaper rates. WBSEDCL is a major power seller in the short term market
contributing around 5% of total transaction.
The table below shows the proposed, approved, actual and true-up power purchase cost for the
DISCOMs:
Table 102: Power Purchase Quantum
Power Purchase Quantum (MUs) FY06 FY07 FY08 FY09 FY10
Proposed 18758 18490 23152 23732 27867
Approved 18758 18286 23704 23732 27867
Actual* NA 19935 20761 23500 26524
Trued-up* NA 18107 19619 22422 24972
Disallowance (Trued-Up– Actual) NA -1829 -1142 -1077 -1552
Table 103: Power Purchase Cost
Power Purchase Cost (Rs. Crs) FY06 FY07 FY08 FY09 FY10
Proposed 3397 3460 4201 5098 5830
Approved 3510 3378 4652 4520 4995
Actual* 3837 4177 4578 5856
Trued-up* 3485 3947 4369 5513
Disallowance (Trued-Up – Actual) -352 -230 -210 -343
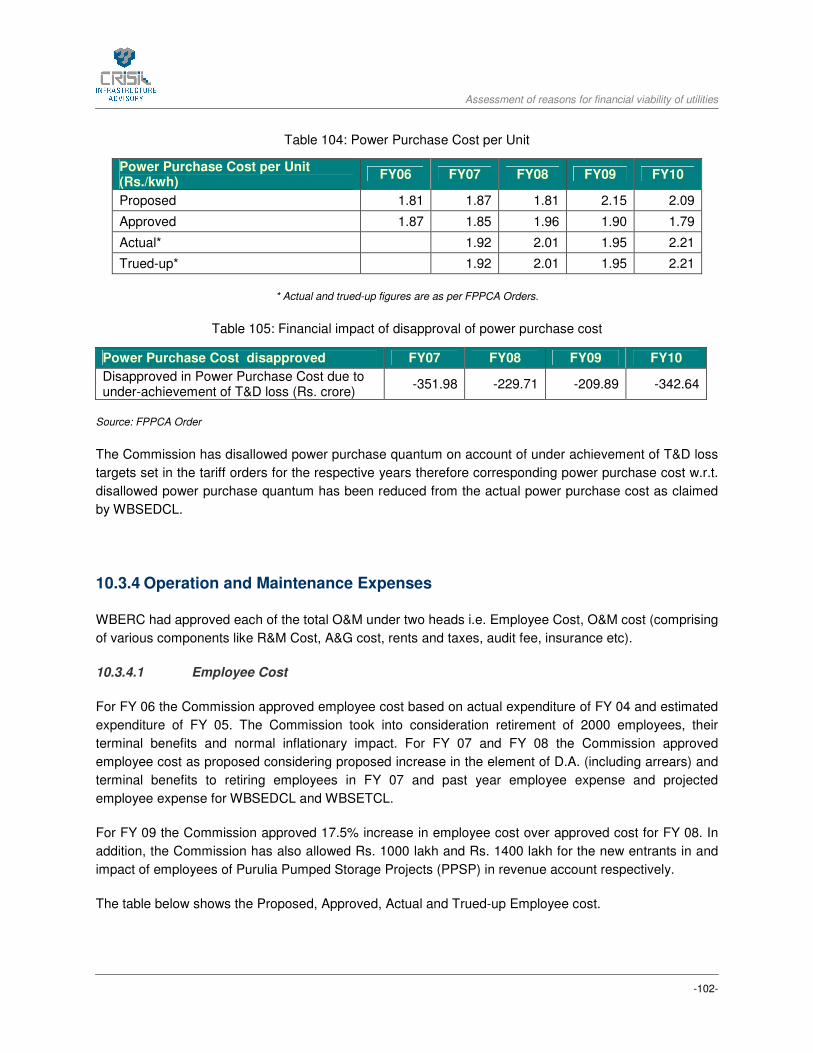
Assessment of reasons for financial viability of utilities
-102-
Table 104: Power Purchase Cost per Unit
Power Purchase Cost per Unit (Rs./kwh)
FY06 FY07 FY08 FY09 FY10
Proposed 1.81 1.87 1.81 2.15 2.09
Approved 1.87 1.85 1.96 1.90 1.79
Actual* 1.92 2.01 1.95 2.21
Trued-up* 1.92 2.01 1.95 2.21
* Actual and trued-up figures are as per FPPCA Orders.
Table 105: Financial impact of disapproval of power purchase cost
Power Purchase Cost disapproved FY07 FY08 FY09 FY10
Disapproved in Power Purchase Cost due to under-achievement of T&D loss (Rs. crore)
-351.98 -229.71 -209.89 -342.64
Source: FPPCA Order
The Commission has disallowed power purchase quantum on account of under achievement of T&D loss
targets set in the tariff orders for the respective years therefore corresponding power purchase cost w.r.t.
disallowed power purchase quantum has been reduced from the actual power purchase cost as claimed
by WBSEDCL.
10.3.4 Operation and Maintenance Expenses
WBERC had approved each of the total O&M under two heads i.e. Employee Cost, O&M cost (comprising
of various components like R&M Cost, A&G cost, rents and taxes, audit fee, insurance etc).
10.3.4.1 Employee Cost
For FY 06 the Commission approved employee cost based on actual expenditure of FY 04 and estimated
expenditure of FY 05. The Commission took into consideration retirement of 2000 employees, their
terminal benefits and normal inflationary impact. For FY 07 and FY 08 the Commission approved
employee cost as proposed considering proposed increase in the element of D.A. (including arrears) and
terminal benefits to retiring employees in FY 07 and past year employee expense and projected
employee expense for WBSEDCL and WBSETCL.
For FY 09 the Commission approved 17.5% increase in employee cost over approved cost for FY 08. In
addition, the Commission has also allowed Rs. 1000 lakh and Rs. 1400 lakh for the new entrants in and
impact of employees of Purulia Pumped Storage Projects (PPSP) in revenue account respectively.
The table below shows the Proposed, Approved, Actual and Trued-up Employee cost.
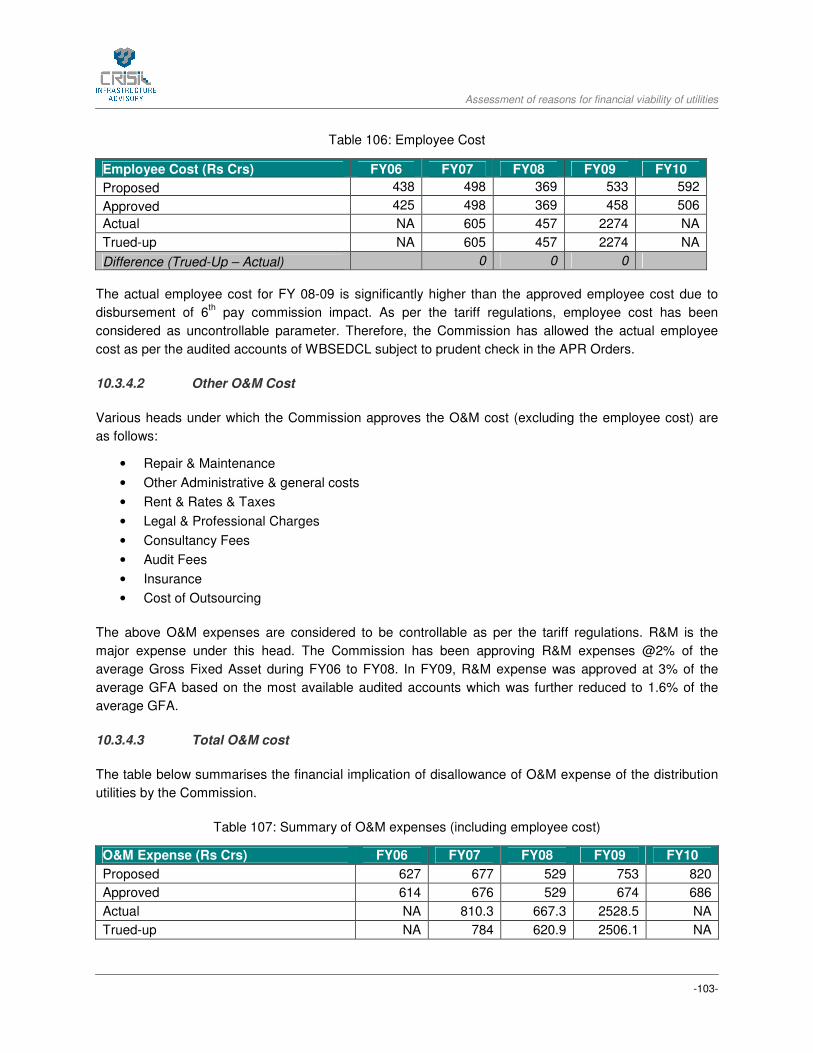
Assessment of reasons for financial viability of utilities
-103-
Table 106: Employee Cost
Employee Cost (Rs Crs) FY06 FY07 FY08 FY09 FY10
Proposed 438 498 369 533 592
Approved 425 498 369 458 506
Actual NA 605 457 2274 NA
Trued-up NA 605 457 2274 NA
Difference (Trued-Up – Actual) 0 0 0
The actual employee cost for FY 08-09 is significantly higher than the approved employee cost due to
disbursement of 6th pay commission impact. As per the tariff regulations, employee cost has been
considered as uncontrollable parameter. Therefore, the Commission has allowed the actual employee
cost as per the audited accounts of WBSEDCL subject to prudent check in the APR Orders.
10.3.4.2 Other O&M Cost
Various heads under which the Commission approves the O&M cost (excluding the employee cost) are
as follows:
• Repair & Maintenance
• Other Administrative & general costs
• Rent & Rates & Taxes
• Legal & Professional Charges
• Consultancy Fees
• Audit Fees
• Insurance
• Cost of Outsourcing
The above O&M expenses are considered to be controllable as per the tariff regulations. R&M is the
major expense under this head. The Commission has been approving R&M expenses @2% of the
average Gross Fixed Asset during FY06 to FY08. In FY09, R&M expense was approved at 3% of the
average GFA based on the most available audited accounts which was further reduced to 1.6% of the
average GFA.
10.3.4.3 Total O&M cost
The table below summarises the financial implication of disallowance of O&M expense of the distribution
utilities by the Commission.
Table 107: Summary of O&M expenses (including employee cost)
O&M Expense (Rs Crs) FY06 FY07 FY08 FY09 FY10
Proposed 627 677 529 753 820
Approved 614 676 529 674 686
Actual NA 810.3 667.3 2528.5 NA
Trued-up NA 784 620.9 2506.1 NA

Assessment of reasons for financial viability of utilities
-104-
O&M Expense (Rs Crs) FY06 FY07 FY08 FY09 FY10
Difference (Trued-Up – Actual) -26.3 -46.3 -22.4
Since the Commission considers employee cost as an uncontrollable cost, the disallowance in total O&M
cost in the APR for FY 06-07, FY 07-08 and FY 08-09 are only on account of R&M and A&G expenses.
10.3.5 Capital Expenditure
Capital expenditure plan for WBSEDCL for FY 05 to FY 09 has not been approved by the Commission. A
detailed approach on approval of capital expenditure by the Commission has not been provided in the
orders. The Commission, for FY 05, had disapproved capital cost towards an abnormal cost overrun in
Teesta Canal project.
Asset Capitalization
For all the years, the Commission has approved the asset capitalization as proposed by WBSEDCL
10.3.6 Depreciation
FY 06, the Commission approved depreciation as proposed by WBSEDCL as the Commission was yet to
issue regulations in this regard. The depreciation was calculated by WBSEDCL as per the provisions of
Notification issued by the Central Government under the Provisions of Electricity (Supply) Act, 1948.
Similarly for first MYT control period (FY 07) the Commission approved depreciation as proposed by
WBSEDCL which was estimated as per the Commission’s Terms & Conditions of Tariff Regulations,
2005.
For the second MYT control period also the Commission approved depreciation as proposed by
WBSEDCL since the same was calculated on the basis of tariff regulations. Due to non-availability of data
on Purulia Pumped Storage Project (PPSP) which was transferred to WBSEDCL, the Commission had
reduced the proposed depreciation by 5% as per the regulation 2.8.1.4.3 of the Tariff Regulations.
The Commission for none of the years has approved opening and closing gross fixed assets for
WBSEDCL.
1.1.6. Interest and Finance Charges
For FY 06, the Commission disallowed interest cost on bonds issued for securitization scheme for power
purchase while for State Government loans, the Commission considered interest rate of 8.5% on
opening balance and fresh borrowings proposed. For FY 07 – FY 09, the Commission approved interest
cost as proposed by WBSEDCL. The Commission, however, disallowed other financing charges relating
to fees and expenses for restructuring of loans and interest on capital liabilities. The other finance
charges consisting of guarantee commission and bank charges are admitted as per the proposal by
WBSEDCL
As per the WBERC (Terms and Conditions of Tariff) Regulations, 2007, interest on working capital is
considered as uncontrollable expense. The Commission approved working capital requirement on

Assessment of reasons for financial viability of utilities
-105-
normative basis @ 18% on estimated annual sales revenue reduced by the amount of depreciation,
deferred revenue expenditure and return of the generating company / licensee. Applicable rate of rate of
interest on working capital assessed on normative basis is equal to the short-term PLR of SBI or at the
actual rate of borrowing whichever is less.
Since WBSEDCL has not drawn any working capital loans during past years, the Commission did not
approve any interest cost on working capital and agreed to consider the same during the APR, subject to
utilization of borrowings by WBSEDCL in the respective years.
Table 108: Interest on Working Capital Borrowings
Particulars (Rs. Crore) FY 06-07 FY 07-08 FY 08-09
Approved 40.72 70.60 0.00
Actual 0.00 0.00 0.00
Trued-up 0.00 0.00 0.00
Table 109: Total Interest and Finance Charges
Total Interest and Finance Charges (Rs. Crore)
FY 06-07 FY 07-08 FY 08-09
Approved 320.94 423.16 468.05
Actual 329.97 370.19 466.92
Trued-up 329.97 370.19 466.92
Disallowance 0.00 0.00 0.00
The Commission has considered interest on working capital as uncontrollable expense. In the Tariff
Orders for FY 06-07 and FY 07-08, the Commission had approved working capital on normative basis.
However, in the APR Orders, the Commission had disallowed interest on working capital as no
borrowings were undertaken by WBSEDCL for working capital requirement during each year. In the MYT
Order for FY 08-09 to FY 10-11, the Commission did not approve any interest towards working capital
requirement considering that the WBSEDCL had not undertaken any working capital borrowings in FY
08-09.
10.3.7 Return
The approach of the Commission for approving return has not been consistent. For FY 06 the
Commission approved return as per the Tariff Regulation, 2003. According to the regulation the return is
to be allowed at SBI PLR plus 3% i.e. 13.25% on equity capital. For FY 07, the Commission has allowed
Return on Equity at 14% on closing equity of FY 05 (equity fund was from the State Government) as the
Commission noted that no addition to the equity capital will be considered for WBSEDCL till the time the
amount of accumulated loss for the previous years were completely negated by the infusion of funds from
WBSEDCL’s own or outside sources. For FY 08 and FY 09 the Commission approved return on equity at
14% on average equity for the respective year.
The table below illustrates the return approved by the Commission in each of the Tariff Order and the
return as percentage of the total ARR for all the four DISCOMs.

Assessment of reasons for financial viability of utilities
-106-
Table 110: Reasonable Rate of Return
Particulars (Rs Crs) FY06 FY07 FY08 FY09 FY10
Approved 179 189 300 323 364
Actual 203 311 332
Trued-up 203 311 332
Disallowance (Trued-up- Actual) 0 0 0
10.3.8 Subsidy
The Government of West Bengal did not provide any subsidy support to the Discoms during FY 05
through FY 09.
1.1.7. Regulatory Asset
The Commission had determined an amount of Rs. 127.24 Crore as revenue deficit in the APR of
WBSEDCL for FY 07-08 which was to be recovered in the subsequent ARR i.e. FY 09-10. However, the
Commission had created a regulatory asset for the same amount in order to contain the tariff hike at a
reasonable level. In the FY 10-11 Order, the Commission approved the regulatory asset of Rs. 127.24
Crore to be passed to the consumers in the FY 10-11 ARR but created a new regulatory asset of Rs.
1569.33 Crore on account of power cost variation as approved in the FPPCA Order dated 30 June, 2010.
Table 111: Regulatory Asset
Particulars Amount
Regulatory Asset for FY 09-10 (Rs. Crs) 127.24
Regulatory Asset for FY 10-11 (Rs. Crs) 1569.33
The Commission has not mentioned about any carrying cost on the regulatory asset being created during
FY 09-10 & FY 10-11 in its Tariff Order. However, as per the Tariff Regulations approval of reasonable
cost of financing the same would be approved by the Commission.
1.1.8. Tariff Increase
The Commission has increased retail tariff in the state of West Bengal annually to recover the increased
annual revenue requirement of WBSEDCL.
1.1.9. Issuance of True-up Order
The table below summarises the time lag between finalization of Accounts and True up order.
Particulars FY 06-07 FY 07-08 FY 08-09
Issuance of Tariff Order 13-Feb-07 01-Aug-07 30-Sep-08
Finalization of Annual Accounts for the Year (A) 30-Sep-07 30-Sep-08 30-Sep-09
Issuance of APR Order (B) 26-Sep-08 26-May-09 26-July-10
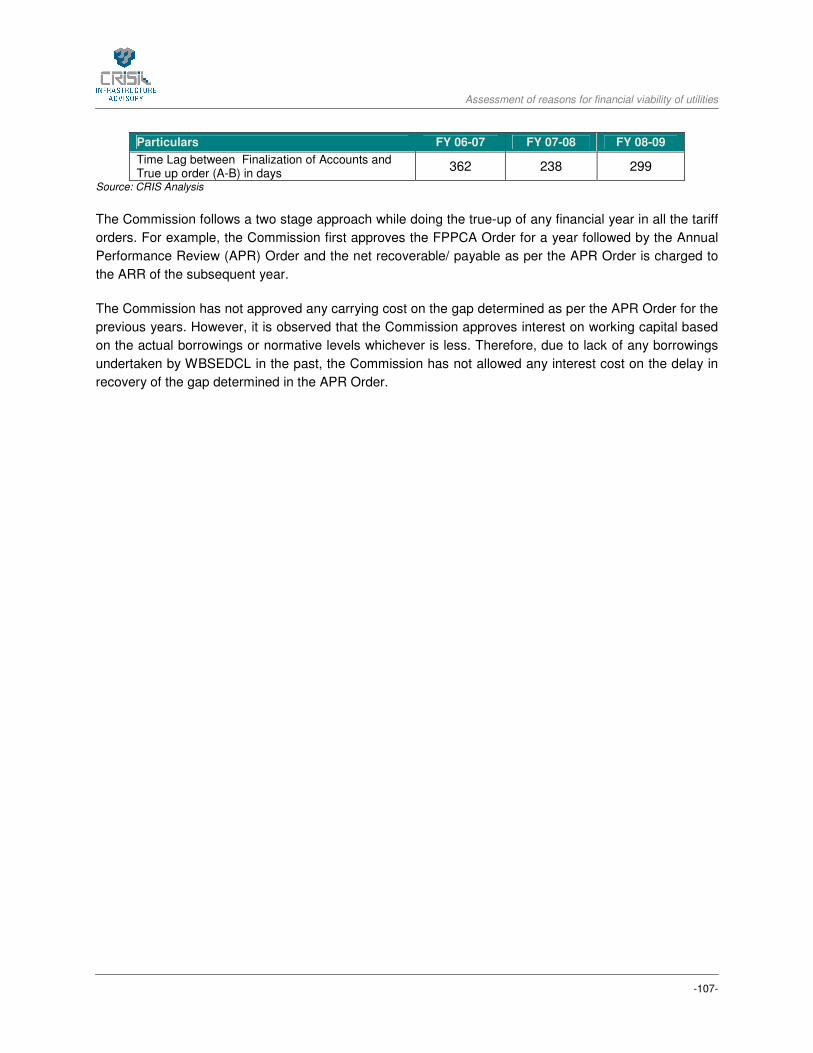
Assessment of reasons for financial viability of utilities
-107-
Particulars FY 06-07 FY 07-08 FY 08-09
Time Lag between Finalization of Accounts and True up order (A-B) in days
362 238 299
Source: CRIS Analysis
The Commission follows a two stage approach while doing the true-up of any financial year in all the tariff
orders. For example, the Commission first approves the FPPCA Order for a year followed by the Annual
Performance Review (APR) Order and the net recoverable/ payable as per the APR Order is charged to
the ARR of the subsequent year.
The Commission has not approved any carrying cost on the gap determined as per the APR Order for the
previous years. However, it is observed that the Commission approves interest on working capital based
on the actual borrowings or normative levels whichever is less. Therefore, due to lack of any borrowings
undertaken by WBSEDCL in the past, the Commission has not allowed any interest cost on the delay in
recovery of the gap determined in the APR Order.


